ACAPS - Ebola Needs Analysis Project Sierra Leone Multi-sector Needs Assessment Report · ENAP...
70
ENAP Sierra Leone Assessment, April 2015 ACAPS - Ebola Needs Analysis Project Sierra Leone Multi-sector Needs Assessment Report April 2015 Photos: UNMEER/Martine Perret
Transcript of ACAPS - Ebola Needs Analysis Project Sierra Leone Multi-sector Needs Assessment Report · ENAP...
ENAP Sierra Leone Assessment, April 2015
ACAPS - Ebola Needs Analysis Project
Sierra Leone Multi-sector Needs Assessment Report
April 2015
Photos: UNMEER/Martine Perret
ENAP Sierra Leone Assessment, April 2015
2
Table of contents
Table of contents ...................................................................................................... 2
Acronyms .................................................................................................................. 3
Acknowledgement ..................................................................................................... 3
Executive summary ................................................................................................... 4
Evolution of the crisis ................................................................................................ 9
Methodology ............................................................................................................. 9
How to read the charts ............................................................................................ 14
Health ..................................................................................................................... 18
Food security .......................................................................................................... 24
Livelihoods .............................................................................................................. 30
Education ................................................................................................................ 36
Protection: Stigma and discrimination ..................................................................... 40
Prioritisation of needs across sectors ...................................................................... 44
Annexes .................................................................................................................. 45
Annex 1: Key informant profile ................................................................................ 45
Annex 2: Questionnaire .......................................................................................... 48
Annex 3: Survey estimation of critical needs ........................................................... 61
ENAP Sierra Leone Assessment, April 2015
3
Acronyms
ACAPS Assessment Capacity Project
DERC District Ebola Response Centre
DFID Department for International Development
CILSS Permanent Interstate Committee for Drought Control in the Sahel
SLDHS Sierra Leone Demographic and Health Study
ENAP Ebola Needs Analysis Project
EVD Ebola Virus Disease
FAO Food and Agriculture Organisation
FEWSNET Famine Early Warning System Network
FSL Food Security and Livelihoods
HCWs Healthcare Workers
HHs Households
IFRC International Federation of Red Cross and Red Crescent Societies
GADM Global Administrative Areas (Boundaries without limits)
GAUL Global Administrative Unit Layers
INGO International Non-Governmental Organisation
IPC Infection Prevention Control
KI (s) Key Informant(s)
KII (s) Key Informant Interview(s)
MoEd Ministry of Education, Science and Technology
MoFED Ministry of Finance and Economic Development
MoHS Ministry of Health and Sanitation
MoIC Ministry of Information and Communication
MoLGRD Ministry of Local Government and Rural Development
MoSWGCA Ministry of Social Welfare, Gender and Children’s Affairs
MSF Médecins Sans Frontières
NERC National Ebola Response Centre
NFIs Non-Food Items
NGO Non-Governmental Organisation
SMAC Social Mobilisation Action Community
UN United Nations
UNMEER United Nations Mission for Ebola Emergency Response
WFP World Food Programme
WHO World Health Organisation
Acknowledgement
We highly appreciate the support of all the people and organisations that contributed to this report from the planning to
the disseminations stage. These include: The NERC and DERC staff in the districts visited. All the Key Informants (KIs)
that participated in this process. The DALAN team and research associates and all the technical groups and individuals
that provided feedback and made contributions to the final report. We also thank DFID for the financial support provided,
not only to this initiative but to the overall ENAP project.
ENAP Sierra Leone Assessment, April 2015
4
Executive summary
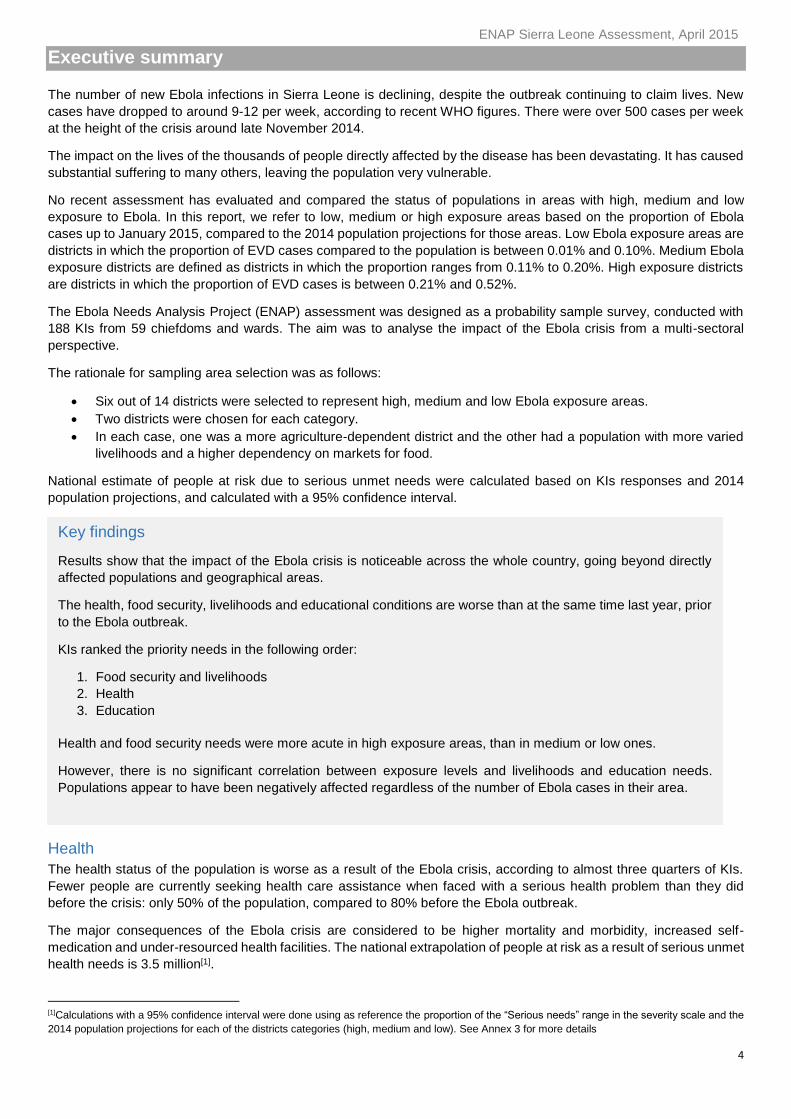
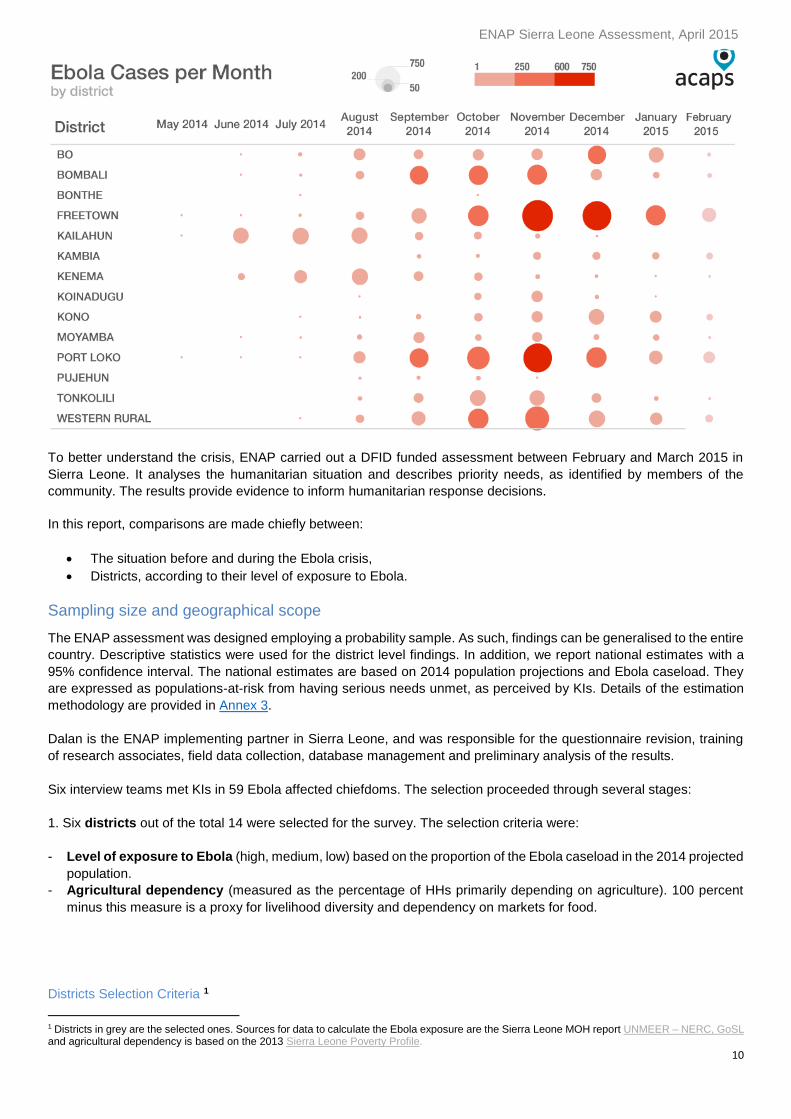
The number of new Ebola infections in Sierra Leone is declining, despite the outbreak continuing to claim lives. New
cases have dropped to around 9-12 per week, according to recent WHO figures. There were over 500 cases per week
at the height of the crisis around late November 2014.
The impact on the lives of the thousands of people directly affected by the disease has been devastating. It has caused
substantial suffering to many others, leaving the population very vulnerable.
No recent assessment has evaluated and compared the status of populations in areas with high, medium and low
exposure to Ebola. In this report, we refer to low, medium or high exposure areas based on the proportion of Ebola
cases up to January 2015, compared to the 2014 population projections for those areas. Low Ebola exposure areas are
districts in which the proportion of EVD cases compared to the population is between 0.01% and 0.10%. Medium Ebola
exposure districts are defined as districts in which the proportion ranges from 0.11% to 0.20%. High exposure districts
are districts in which the proportion of EVD cases is between 0.21% and 0.52%.
The Ebola Needs Analysis Project (ENAP) assessment was designed as a probability sample survey, conducted with
188 KIs from 59 chiefdoms and wards. The aim was to analyse the impact of the Ebola crisis from a multi-sectoral
perspective.
The rationale for sampling area selection was as follows:
Six out of 14 districts were selected to represent high, medium and low Ebola exposure areas.
Two districts were chosen for each category.
In each case, one was a more agriculture-dependent district and the other had a population with more varied
livelihoods and a higher dependency on markets for food.
National estimate of people at risk due to serious unmet needs were calculated based on KIs responses and 2014
population projections, and calculated with a 95% confidence interval.
Health
The health status of the population is worse as a result of the Ebola crisis, according to almost three quarters of KIs.
Fewer people are currently seeking health care assistance when faced with a serious health problem than they did
before the crisis: only 50% of the population, compared to 80% before the Ebola outbreak.
The major consequences of the Ebola crisis are considered to be higher mortality and morbidity, increased self-
medication and under-resourced health facilities. The national extrapolation of people at risk as a result of serious unmet
health needs is 3.5 million[1].
[1]Calculations with a 95% confidence interval were done using as reference the proportion of the “Serious needs” range in the severity scale and the
2014 population projections for each of the districts categories (high, medium and low). See Annex 3 for more details
Key findings
Results show that the impact of the Ebola crisis is noticeable across the whole country, going beyond directly
affected populations and geographical areas.
The health, food security, livelihoods and educational conditions are worse than at the same time last year, prior
to the Ebola outbreak.
KIs ranked the priority needs in the following order:
1. Food security and livelihoods
2. Health
3. Education
Health and food security needs were more acute in high exposure areas, than in medium or low ones.
However, there is no significant correlation between exposure levels and livelihoods and education needs.
Populations appear to have been negatively affected regardless of the number of Ebola cases in their area.
ENAP Sierra Leone Assessment, April 2015
5
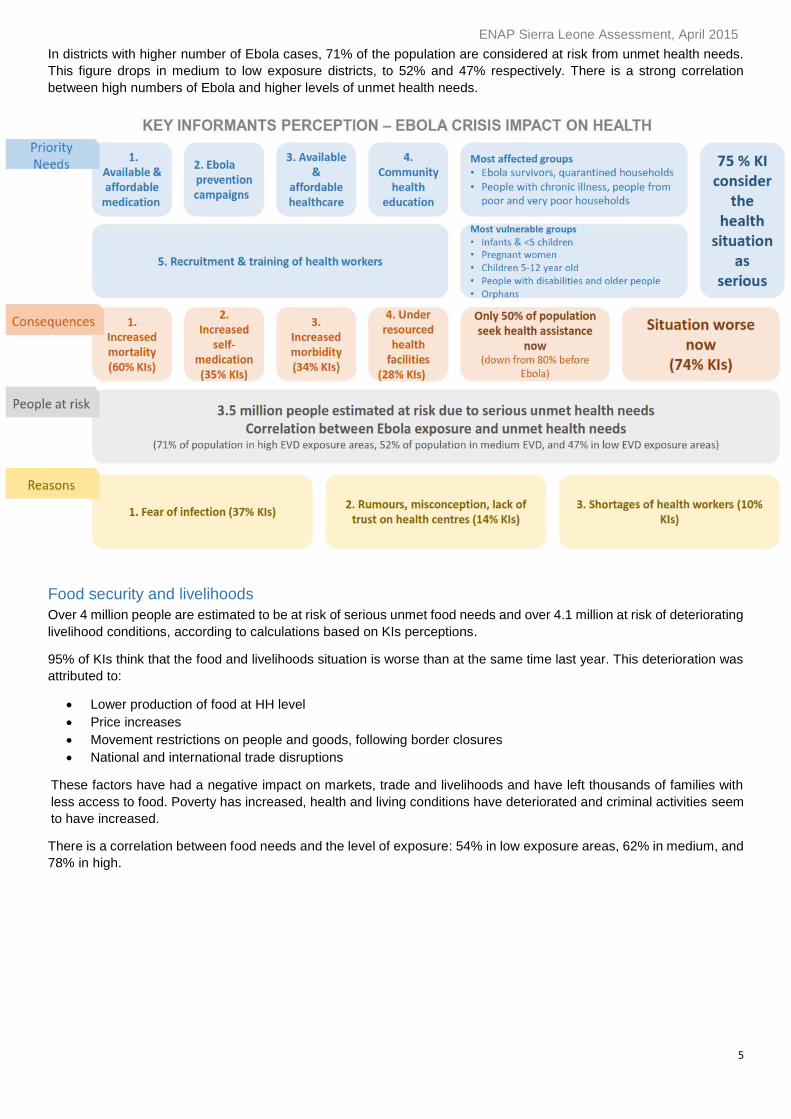
In districts with higher number of Ebola cases, 71% of the population are considered at risk from unmet health needs.
This figure drops in medium to low exposure districts, to 52% and 47% respectively. There is a strong correlation
between high numbers of Ebola and higher levels of unmet health needs.
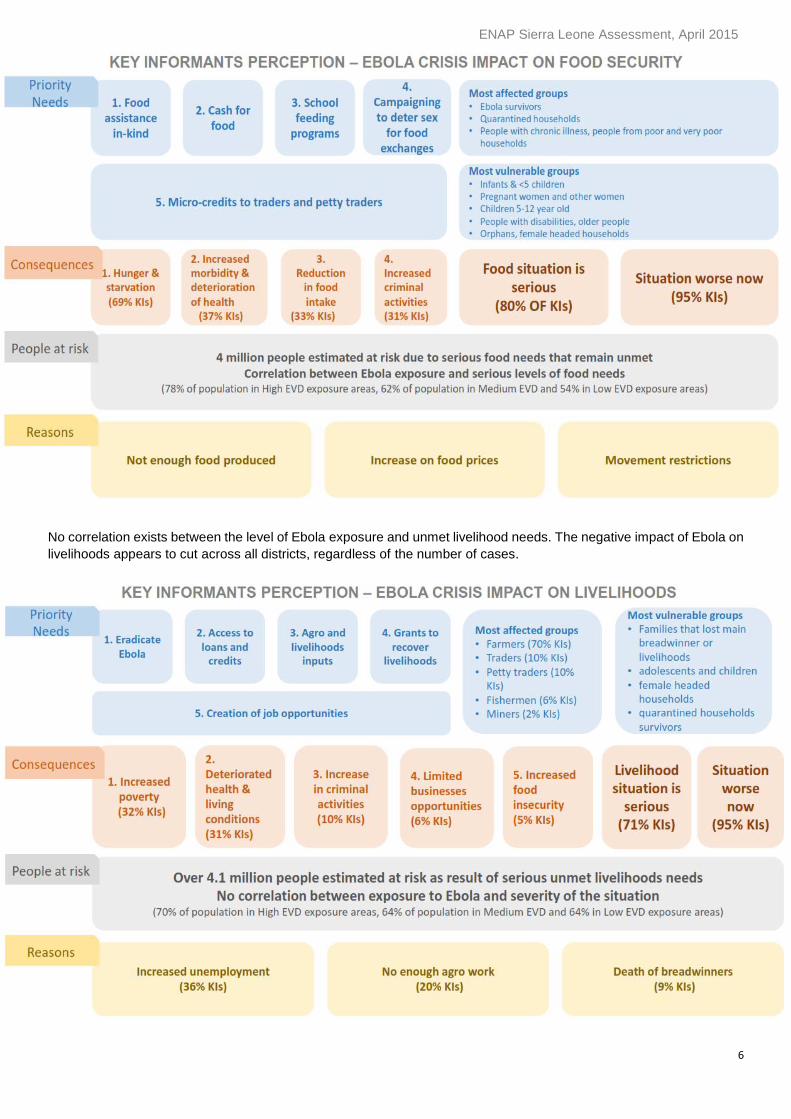
Food security and livelihoods
Over 4 million people are estimated to be at risk of serious unmet food needs and over 4.1 million at risk of deteriorating
livelihood conditions, according to calculations based on KIs perceptions.
95% of KIs think that the food and livelihoods situation is worse than at the same time last year. This deterioration was
attributed to:
Lower production of food at HH level
Price increases
Movement restrictions on people and goods, following border closures
National and international trade disruptions
These factors have had a negative impact on markets, trade and livelihoods and have left thousands of families with
less access to food. Poverty has increased, health and living conditions have deteriorated and criminal activities seem
to have increased.
There is a correlation between food needs and the level of exposure: 54% in low exposure areas, 62% in medium, and
78% in high.
ENAP Sierra Leone Assessment, April 2015
6
No correlation exists between the level of Ebola exposure and unmet livelihood needs. The negative impact of Ebola on
livelihoods appears to cut across all districts, regardless of the number of cases.
ENAP Sierra Leone Assessment, April 2015
7
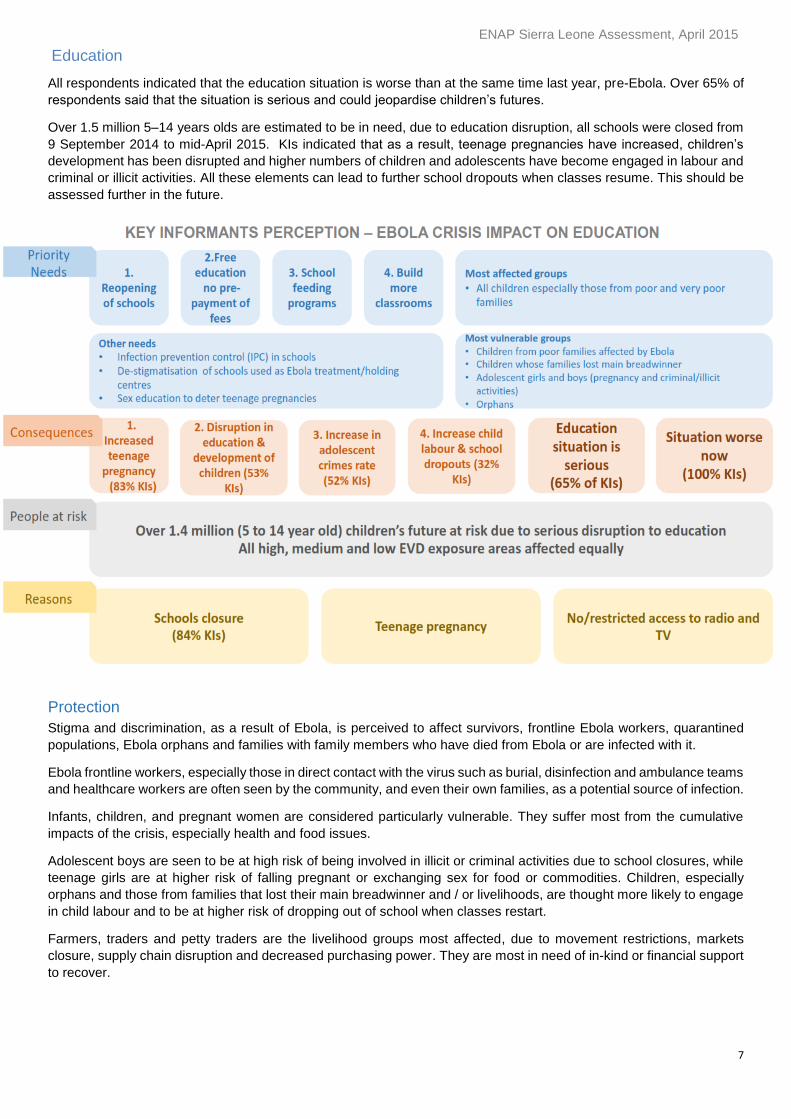
Education
All respondents indicated that the education situation is worse than at the same time last year, pre-Ebola. Over 65% of
respondents said that the situation is serious and could jeopardise children’s futures.
Over 1.5 million 5–14 years olds are estimated to be in need, due to education disruption, all schools were closed from
9 September 2014 to mid-April 2015. KIs indicated that as a result, teenage pregnancies have increased, children’s
development has been disrupted and higher numbers of children and adolescents have become engaged in labour and
criminal or illicit activities. All these elements can lead to further school dropouts when classes resume. This should be
assessed further in the future.
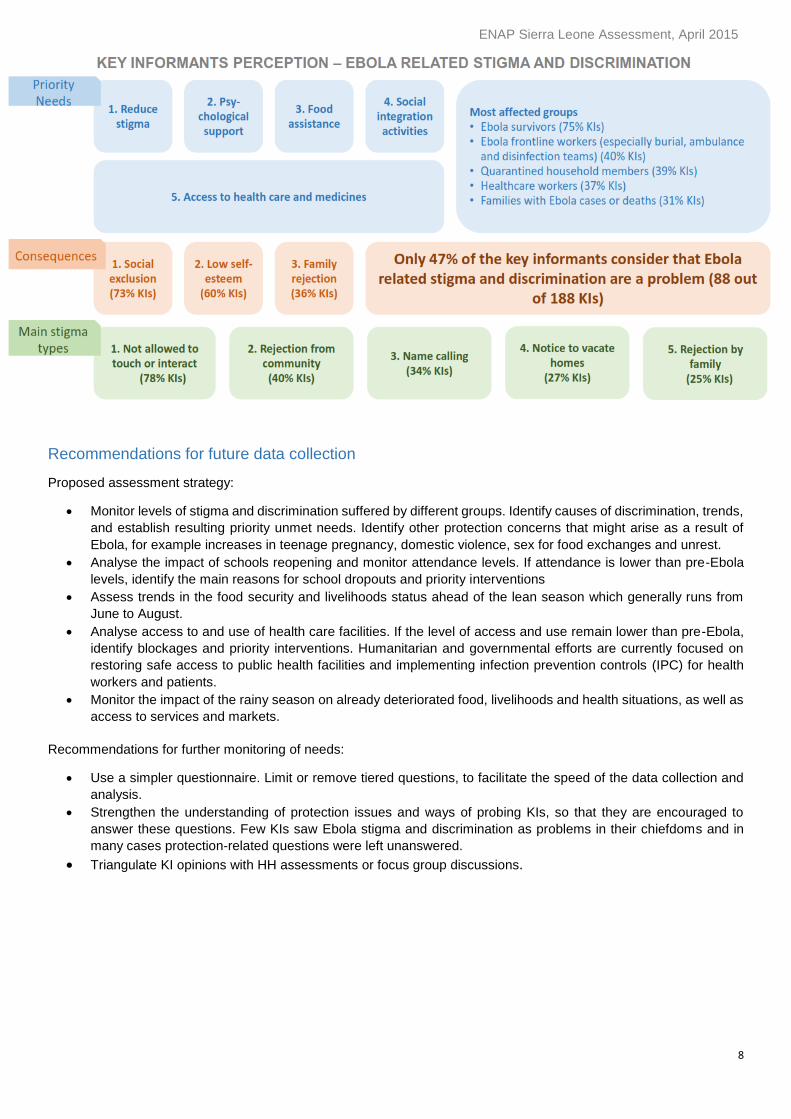
Protection
Stigma and discrimination, as a result of Ebola, is perceived to affect survivors, frontline Ebola workers, quarantined
populations, Ebola orphans and families with family members who have died from Ebola or are infected with it.
Ebola frontline workers, especially those in direct contact with the virus such as burial, disinfection and ambulance teams
and healthcare workers are often seen by the community, and even their own families, as a potential source of infection.
Infants, children, and pregnant women are considered particularly vulnerable. They suffer most from the cumulative
impacts of the crisis, especially health and food issues.
Adolescent boys are seen to be at high risk of being involved in illicit or criminal activities due to school closures, while
teenage girls are at higher risk of falling pregnant or exchanging sex for food or commodities. Children, especially
orphans and those from families that lost their main breadwinner and / or livelihoods, are thought more likely to engage
in child labour and to be at higher risk of dropping out of school when classes restart.
Farmers, traders and petty traders are the livelihood groups most affected, due to movement restrictions, markets
closure, supply chain disruption and decreased purchasing power. They are most in need of in-kind or financial support
to recover.
ENAP Sierra Leone Assessment, April 2015
8
Recommendations for future data collection
Proposed assessment strategy:
Monitor levels of stigma and discrimination suffered by different groups. Identify causes of discrimination, trends,
and establish resulting priority unmet needs. Identify other protection concerns that might arise as a result of
Ebola, for example increases in teenage pregnancy, domestic violence, sex for food exchanges and unrest.
Analyse the impact of schools reopening and monitor attendance levels. If attendance is lower than pre-Ebola
levels, identify the main reasons for school dropouts and priority interventions
Assess trends in the food security and livelihoods status ahead of the lean season which generally runs from
June to August.
Analyse access to and use of health care facilities. If the level of access and use remain lower than pre-Ebola,
identify blockages and priority interventions. Humanitarian and governmental efforts are currently focused on
restoring safe access to public health facilities and implementing infection prevention controls (IPC) for health
workers and patients.
Monitor the impact of the rainy season on already deteriorated food, livelihoods and health situations, as well as
access to services and markets.
Recommendations for further monitoring of needs:
Use a simpler questionnaire. Limit or remove tiered questions, to facilitate the speed of the data collection and
analysis.
Strengthen the understanding of protection issues and ways of probing KIs, so that they are encouraged to
answer these questions. Few KIs saw Ebola stigma and discrimination as problems in their chiefdoms and in
many cases protection-related questions were left unanswered.
Triangulate KI opinions with HH assessments or focus group discussions.
ENAP Sierra Leone Assessment, April 2015
9
Evolution of the crisis
The first Ebola case is believed to have been a two-year-old boy from southeastern Guinea, who died on 6 December
2013. On 22 March 2014, Guinea informed WHO of the outbreak, with 22 cases reported. On 30 March, Liberia reported
its first two Ebola cases. On 26 May, the epidemic spread to Sierra Leone. On 17 June, the virus reached Liberia’s
capital, Monrovia. By 23 June, with more than 350 deaths, the West African outbreak was the worst on record. On 25
July, Nigeria confirmed its first case.
Liberia declared a state of emergency on 6 August, and Sierra Leone did so the following day. On 8 August, WHO
declared Ebola a public health emergency of international concern. On 13 August, Guinea declared the outbreak a
“health emergency”. Quarantines and curfews began to be imposed.
By 26 August 2014, over 3,000 cases had been reported in West Africa.
International action began to accelerate in mid-September, and the UN set up a special mission to lead the global
response. Entire populations of the countries affected by the outbreak have suffered. The limited resources of an already
under-resourced health system have been diverted towards stopping the spread of Ebola and reducing availability of
treatments for other conditions, leading to an increase in mortality from other diseases.
Fear and mistrust of the national and international health system and authorities have contributed to increased Ebola
exposure. Rumours that foreign aid workers and disinfection teams are propagating the disease have resulted in threats,
attacks, and security issues. Schools have been closed in Liberia and Sierra Leone and in some parts of Guinea, leaving
children without access to education.
As of mid-December 2014, there were 18,603 reported Ebola cases and almost 6,915 deaths in the three most
affected countries, Guinea, Sierra Leone and Liberia.
Since late January 2015, Ebola activities have been scaling down in Liberia and Sierra Leone as the number of newly
reported cases has been decreasing. Some Ebola treatment centres have been decommissioned and repurposed, as
have other resources that were instrumental in the Ebola response.
In February, measles outbreaks were declared in Sierra Leone, Liberia and Guinea. Pre-Ebola routine vaccination
campaigns had limited success and were deprioritised during the Ebola crisis, raising concerns of a bigger outbreak.
In late March, junior secondary schools reopened in Sierra Leone, after months of closure. The remaining schools
reopened mid-April. The Ebola crisis has left a total of 12,023 Ebola orphans across the country, the majority of them
in Port Loko with 3,410 cases, according to UNICEF.
As of 23 April, Sierra Leone reported 12,294 cumulative Ebola cases, including 3,885 deaths.
Methodology
Background to the assessment
The crisis response has primarily focused on the medical and epidemiological containment of the outbreak. Despite
primarily being a health crisis, Ebola is having a significant wider humanitarian impact on the lives of affected population.
If these impacts are not effectively addressed, Ebola affected countries could experience multiple crises simultaneously.
ENAP Sierra Leone Assessment, April 2015
10
To better understand the crisis, ENAP carried out a DFID funded assessment between February and March 2015 in
Sierra Leone. It analyses the humanitarian situation and describes priority needs, as identified by members of the
community. The results provide evidence to inform humanitarian response decisions.
In this report, comparisons are made chiefly between:
The situation before and during the Ebola crisis,
Districts, according to their level of exposure to Ebola.
Sampling size and geographical scope
The ENAP assessment was designed employing a probability sample. As such, findings can be generalised to the entire
country. Descriptive statistics were used for the district level findings. In addition, we report national estimates with a
95% confidence interval. The national estimates are based on 2014 population projections and Ebola caseload. They
are expressed as populations-at-risk from having serious needs unmet, as perceived by KIs. Details of the estimation
methodology are provided in Annex 3.
Dalan is the ENAP implementing partner in Sierra Leone, and was responsible for the questionnaire revision, training
of research associates, field data collection, database management and preliminary analysis of the results.
Six interview teams met KIs in 59 Ebola affected chiefdoms. The selection proceeded through several stages:
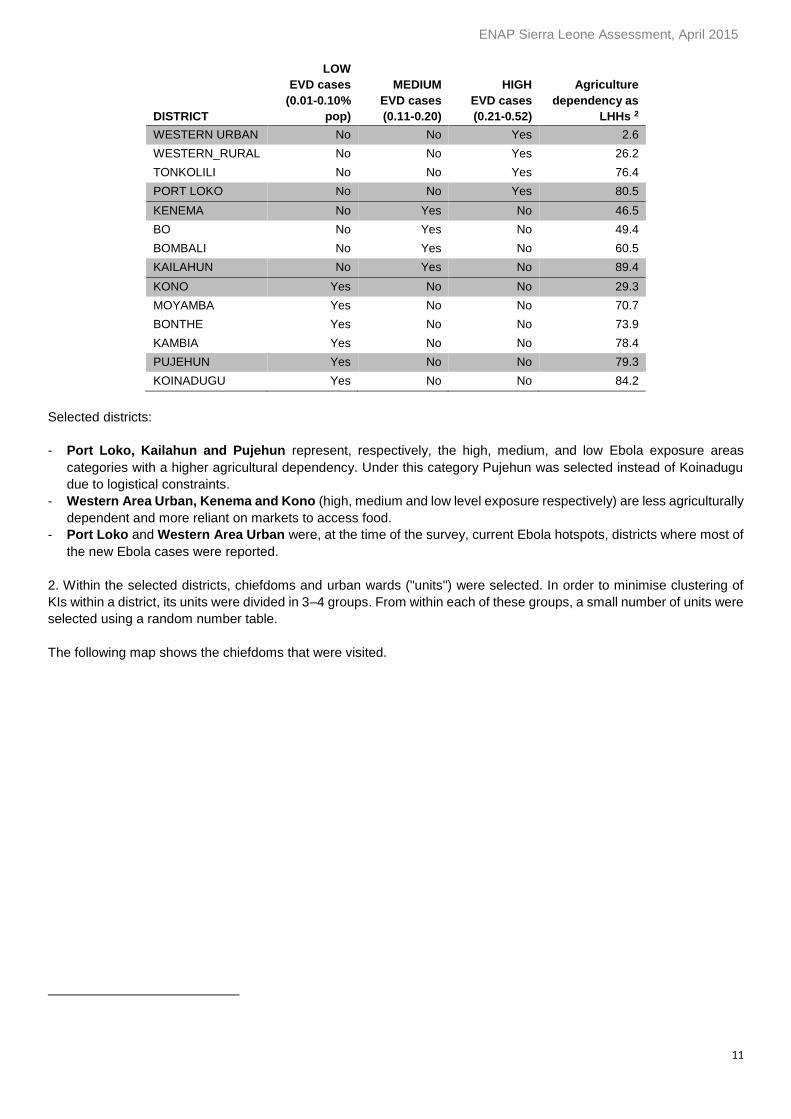
1. Six districts out of the total 14 were selected for the survey. The selection criteria were:
- Level of exposure to Ebola (high, medium, low) based on the proportion of the Ebola caseload in the 2014 projected
population.
- Agricultural dependency (measured as the percentage of HHs primarily depending on agriculture). 100 percent
minus this measure is a proxy for livelihood diversity and dependency on markets for food.
Districts Selection Criteria 1
1 Districts in grey are the selected ones. Sources for data to calculate the Ebola exposure are the Sierra Leone MOH report UNMEER – NERC, GoSL and agricultural dependency is based on the 2013 Sierra Leone Poverty Profile.
ENAP Sierra Leone Assessment, April 2015
11
DISTRICT
LOW
EVD cases
(0.01-0.10%
pop)
MEDIUM
EVD cases
(0.11-0.20)
HIGH
EVD cases
(0.21-0.52)
Agriculture
dependency as
LHHs 2
WESTERN URBAN No No Yes 2.6
WESTERN_RURAL No No Yes 26.2
TONKOLILI No No Yes 76.4
PORT LOKO No No Yes 80.5
KENEMA No Yes No 46.5
BO No Yes No 49.4
BOMBALI No Yes No 60.5
KAILAHUN No Yes No 89.4
KONO Yes No No 29.3
MOYAMBA Yes No No 70.7
BONTHE Yes No No 73.9
KAMBIA Yes No No 78.4
PUJEHUN Yes No No 79.3
KOINADUGU Yes No No 84.2
Selected districts:
- Port Loko, Kailahun and Pujehun represent, respectively, the high, medium, and low Ebola exposure areas
categories with a higher agricultural dependency. Under this category Pujehun was selected instead of Koinadugu
due to logistical constraints.
- Western Area Urban, Kenema and Kono (high, medium and low level exposure respectively) are less agriculturally
dependent and more reliant on markets to access food.
- Port Loko and Western Area Urban were, at the time of the survey, current Ebola hotspots, districts where most of
the new Ebola cases were reported.
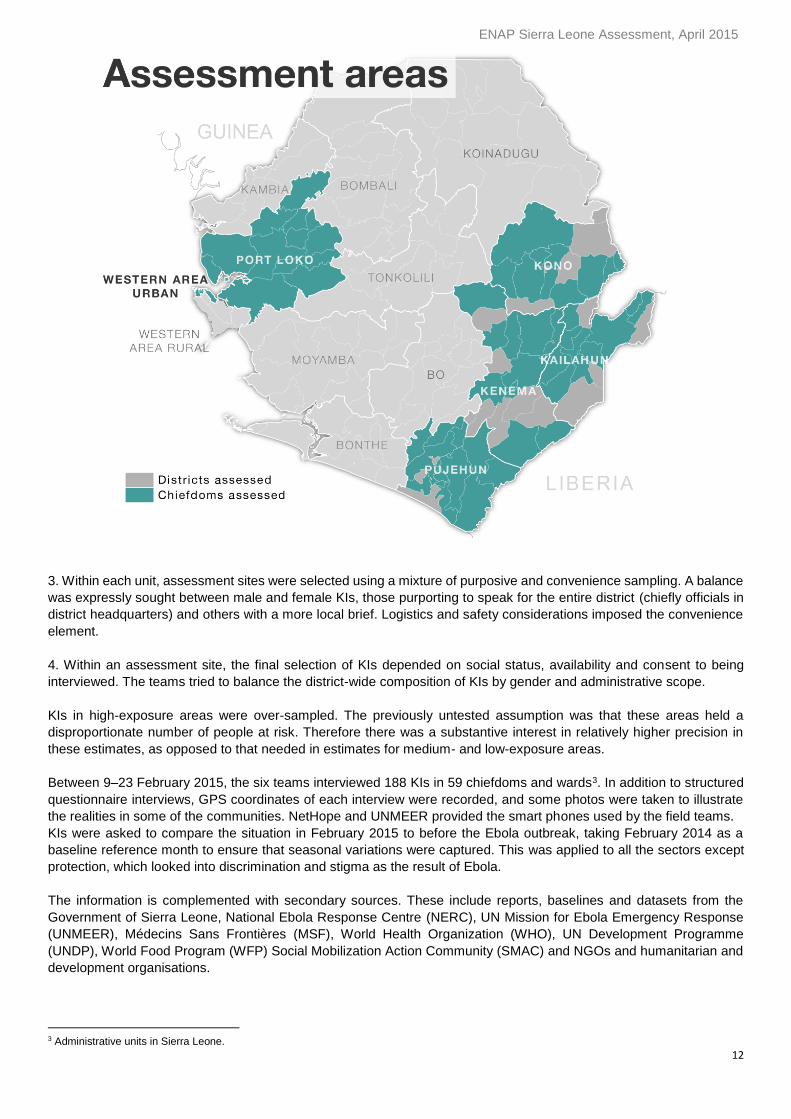
2. Within the selected districts, chiefdoms and urban wards ("units") were selected. In order to minimise clustering of
KIs within a district, its units were divided in 3–4 groups. From within each of these groups, a small number of units were
selected using a random number table.
The following map shows the chiefdoms that were visited.
ENAP Sierra Leone Assessment, April 2015
12
3. Within each unit, assessment sites were selected using a mixture of purposive and convenience sampling. A balance
was expressly sought between male and female KIs, those purporting to speak for the entire district (chiefly officials in
district headquarters) and others with a more local brief. Logistics and safety considerations imposed the convenience
element.
4. Within an assessment site, the final selection of KIs depended on social status, availability and consent to being
interviewed. The teams tried to balance the district-wide composition of KIs by gender and administrative scope.
KIs in high-exposure areas were over-sampled. The previously untested assumption was that these areas held a
disproportionate number of people at risk. Therefore there was a substantive interest in relatively higher precision in
these estimates, as opposed to that needed in estimates for medium- and low-exposure areas.
Between 9–23 February 2015, the six teams interviewed 188 KIs in 59 chiefdoms and wards3. In addition to structured
questionnaire interviews, GPS coordinates of each interview were recorded, and some photos were taken to illustrate
the realities in some of the communities. NetHope and UNMEER provided the smart phones used by the field teams.
KIs were asked to compare the situation in February 2015 to before the Ebola outbreak, taking February 2014 as a
baseline reference month to ensure that seasonal variations were captured. This was applied to all the sectors except
protection, which looked into discrimination and stigma as the result of Ebola.
The information is complemented with secondary sources. These include reports, baselines and datasets from the
Government of Sierra Leone, National Ebola Response Centre (NERC), UN Mission for Ebola Emergency Response
(UNMEER), Médecins Sans Frontières (MSF), World Health Organization (WHO), UN Development Programme
(UNDP), World Food Program (WFP) Social Mobilization Action Community (SMAC) and NGOs and humanitarian and
development organisations.
3 Administrative units in Sierra Leone.
ENAP Sierra Leone Assessment, April 2015
13
Key informants
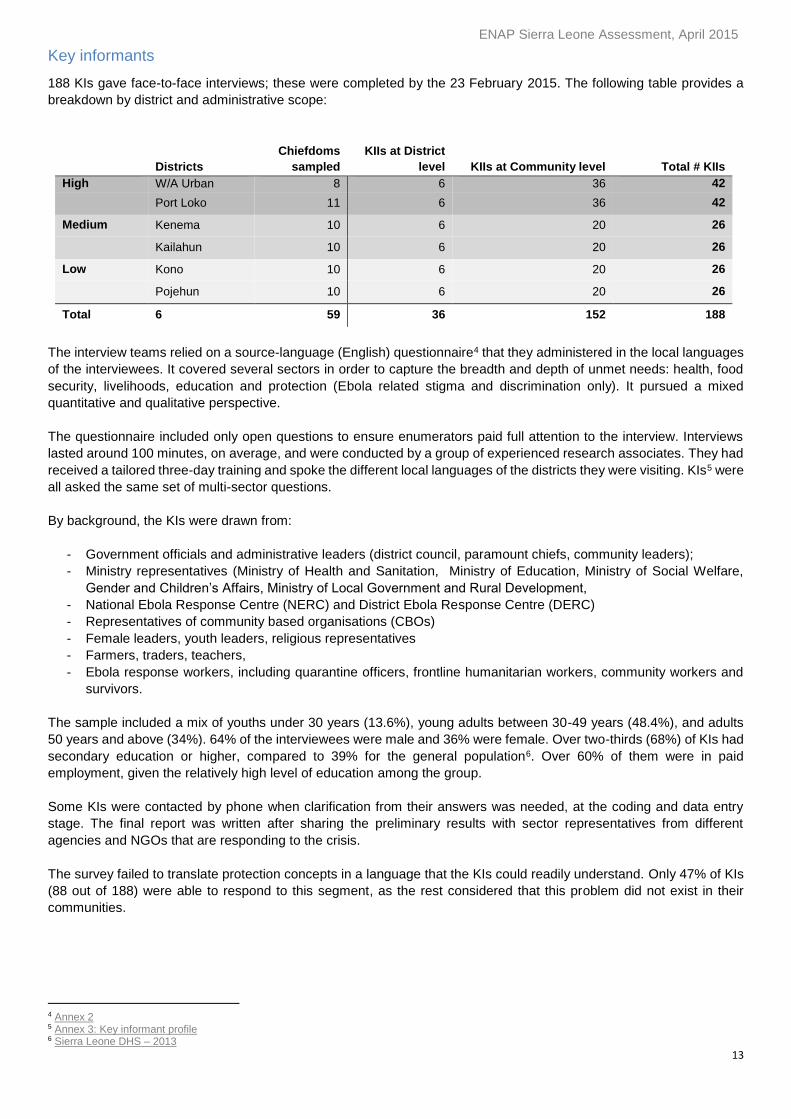
188 KIs gave face-to-face interviews; these were completed by the 23 February 2015. The following table provides a
breakdown by district and administrative scope:
Districts
Chiefdoms
sampled
KIIs at District
level KIIs at Community level Total # KIIs
High W/A Urban 8 6 36 42
Port Loko 11 6 36 42
Medium Kenema 10 6 20 26
Kailahun 10 6 20 26
Low Kono 10 6 20 26
Pojehun 10 6 20 26
Total 6 59 36 152 188
The interview teams relied on a source-language (English) questionnaire4 that they administered in the local languages
of the interviewees. It covered several sectors in order to capture the breadth and depth of unmet needs: health, food
security, livelihoods, education and protection (Ebola related stigma and discrimination only). It pursued a mixed
quantitative and qualitative perspective.
The questionnaire included only open questions to ensure enumerators paid full attention to the interview. Interviews
lasted around 100 minutes, on average, and were conducted by a group of experienced research associates. They had
received a tailored three-day training and spoke the different local languages of the districts they were visiting. KIs5 were
all asked the same set of multi-sector questions.
By background, the KIs were drawn from:
- Government officials and administrative leaders (district council, paramount chiefs, community leaders);
- Ministry representatives (Ministry of Health and Sanitation, Ministry of Education, Ministry of Social Welfare,
Gender and Children’s Affairs, Ministry of Local Government and Rural Development,
- National Ebola Response Centre (NERC) and District Ebola Response Centre (DERC)
- Representatives of community based organisations (CBOs)
- Female leaders, youth leaders, religious representatives
- Farmers, traders, teachers,
- Ebola response workers, including quarantine officers, frontline humanitarian workers, community workers and
survivors.
The sample included a mix of youths under 30 years (13.6%), young adults between 30-49 years (48.4%), and adults
50 years and above (34%). 64% of the interviewees were male and 36% were female. Over two-thirds (68%) of KIs had
secondary education or higher, compared to 39% for the general population6. Over 60% of them were in paid
employment, given the relatively high level of education among the group.
Some KIs were contacted by phone when clarification from their answers was needed, at the coding and data entry
stage. The final report was written after sharing the preliminary results with sector representatives from different
agencies and NGOs that are responding to the crisis.
The survey failed to translate protection concepts in a language that the KIs could readily understand. Only 47% of KIs
(88 out of 188) were able to respond to this segment, as the rest considered that this problem did not exist in their
communities.
4 Annex 2 5 Annex 3: Key informant profile 6 Sierra Leone DHS – 2013
ENAP Sierra Leone Assessment, April 2015
14
Limitations of the survey methodology
Due to an ongoing audit on the use of Ebola funds at the time of the field data collection, potential KIs were more
reluctant to provide information. Apparently many feared that this assessment was connected to the investigation. As a
result, the interviewers later had to call a number of the KIs over the phone to fill data gaps or to clarify the answers
provided.
The questionnaire contained a number of questions that formed complex, mutually dependent sequences. These
challenged the flow of the interviews as well as data management and analysis. The recommendation for next time is
to keep questions more self-contained and less enmeshed with preceding responses.
Some of the qualitative information is included in the report for its strong illustrative value, but its representative character
cannot be assessed.
Timeframe
Month Activities
February Planning, training, field data collection (9–23 February), development of
the database and data entry
March Data entry, analysis, discussions with humanitarian organisations on
preliminary key findings, report drafting
April Preliminary findings dissemination, final report writing, statistical
computation
How to read the charts
This section offers some tips as to how to read and interpret charts in an appropriate way, to fully understand the
findings. In addition to maps, three main types of charts are used to visualise the findings:
1. Heat-maps to summarise priority or preference results, main consequences and reasons.
2. Horizontal stacked bar charts to summarise severity ratings.
3. Bump charts to summarise before and after changes; comparing February 2014 to February 2015.
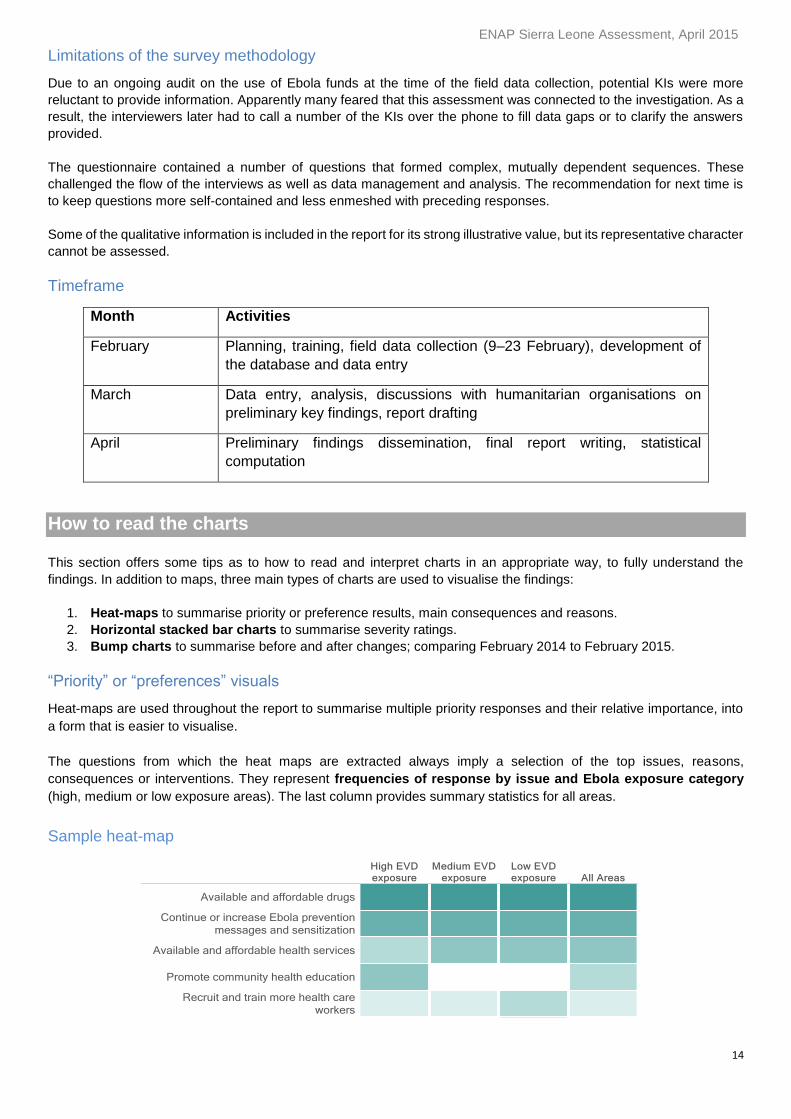
“Priority” or “preferences” visuals
Heat-maps are used throughout the report to summarise multiple priority responses and their relative importance, into
a form that is easier to visualise.
The questions from which the heat maps are extracted always imply a selection of the top issues, reasons,
consequences or interventions. They represent frequencies of response by issue and Ebola exposure category
(high, medium or low exposure areas). The last column provides summary statistics for all areas.
Sample heat-map
ENAP Sierra Leone Assessment, April 2015
15
Levels of preference are presented for four or five sub-headings and frequencies of responses are colour coded in
descending order, based on the summary statistic for all areas. The darker the colour, the more frequently the response
was mentioned.
In the above heatmap, results can be interpreted as follows:
Available and affordable drugs were the most preferred interventions across all visited areas.
Available and affordable and health services were the third most frequently requested intervention, except in
high exposure areas where promotion of community health education was the third most frequent response.
In the heatmap, cells with no colour indicate that this option was not included among the top five ranked reasons
in that particular district.
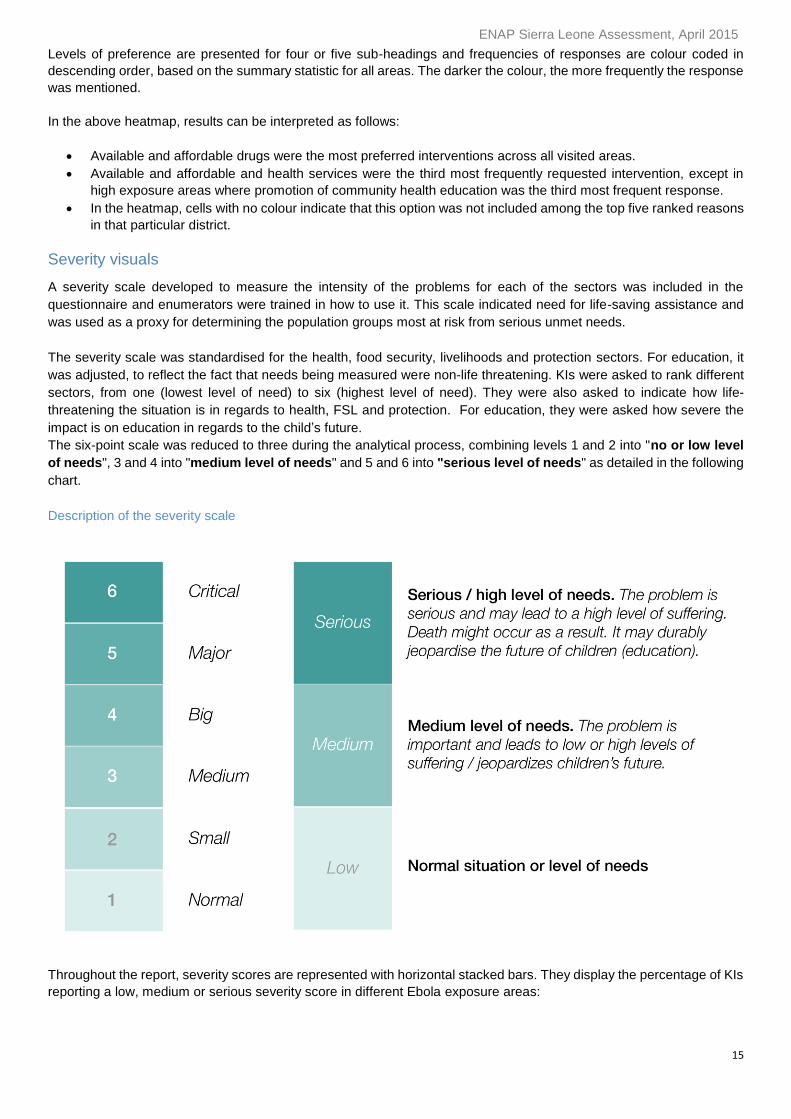
Severity visuals
A severity scale developed to measure the intensity of the problems for each of the sectors was included in the
questionnaire and enumerators were trained in how to use it. This scale indicated need for life-saving assistance and
was used as a proxy for determining the population groups most at risk from serious unmet needs.
The severity scale was standardised for the health, food security, livelihoods and protection sectors. For education, it
was adjusted, to reflect the fact that needs being measured were non-life threatening. KIs were asked to rank different
sectors, from one (lowest level of need) to six (highest level of need). They were also asked to indicate how life-
threatening the situation is in regards to health, FSL and protection. For education, they were asked how severe the
impact is on education in regards to the child’s future.
The six-point scale was reduced to three during the analytical process, combining levels 1 and 2 into "no or low level
of needs", 3 and 4 into "medium level of needs" and 5 and 6 into "serious level of needs" as detailed in the following
chart.
Description of the severity scale
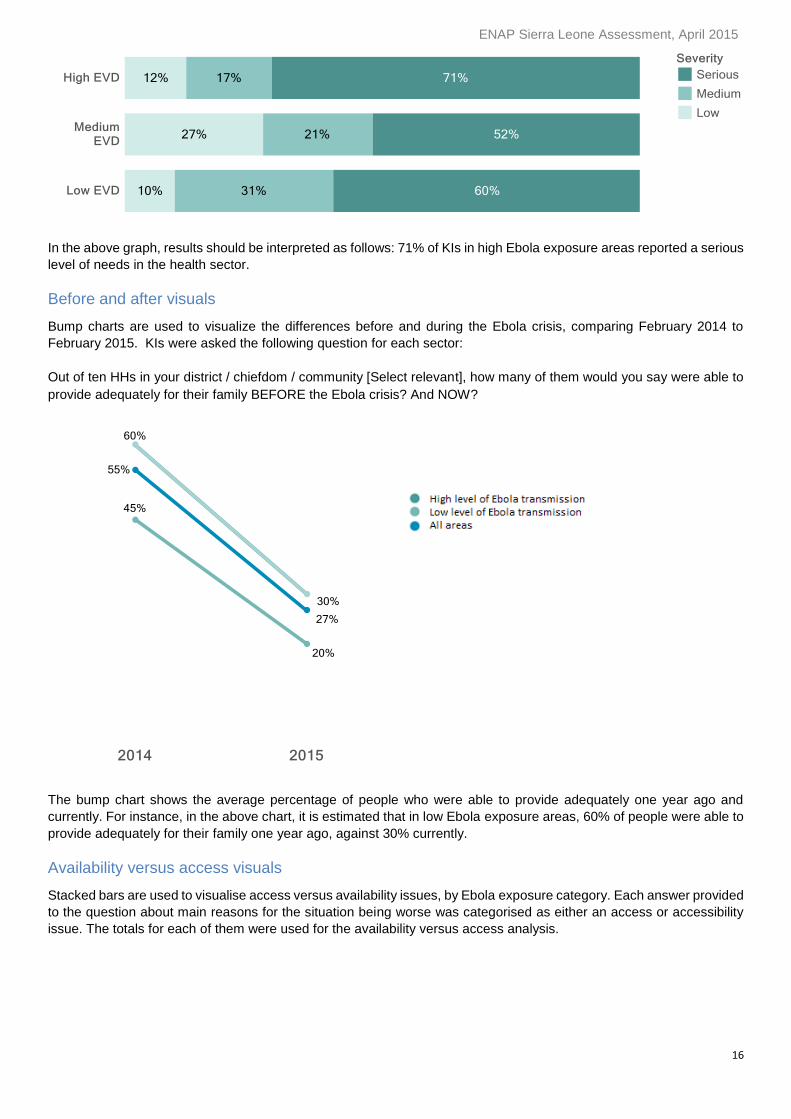
Throughout the report, severity scores are represented with horizontal stacked bars. They display the percentage of KIs
reporting a low, medium or serious severity score in different Ebola exposure areas:
ENAP Sierra Leone Assessment, April 2015
16
In the above graph, results should be interpreted as follows: 71% of KIs in high Ebola exposure areas reported a serious
level of needs in the health sector.
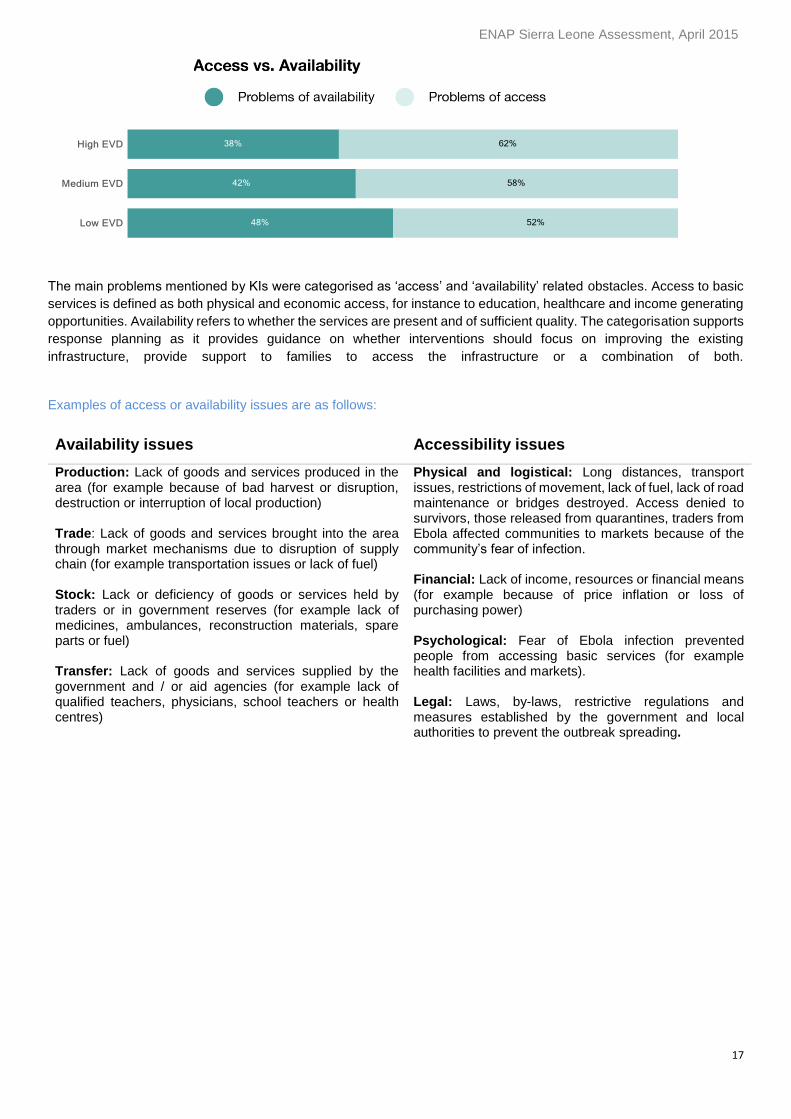
Before and after visuals
Bump charts are used to visualize the differences before and during the Ebola crisis, comparing February 2014 to
February 2015. KIs were asked the following question for each sector:
Out of ten HHs in your district / chiefdom / community [Select relevant], how many of them would you say were able to
provide adequately for their family BEFORE the Ebola crisis? And NOW?
The bump chart shows the average percentage of people who were able to provide adequately one year ago and
currently. For instance, in the above chart, it is estimated that in low Ebola exposure areas, 60% of people were able to
provide adequately for their family one year ago, against 30% currently.
Availability versus access visuals
Stacked bars are used to visualise access versus availability issues, by Ebola exposure category. Each answer provided
to the question about main reasons for the situation being worse was categorised as either an access or accessibility
issue. The totals for each of them were used for the availability versus access analysis.
ENAP Sierra Leone Assessment, April 2015
17
The main problems mentioned by KIs were categorised as ‘access’ and ‘availability’ related obstacles. Access to basic
services is defined as both physical and economic access, for instance to education, healthcare and income generating
opportunities. Availability refers to whether the services are present and of sufficient quality. The categorisation supports
response planning as it provides guidance on whether interventions should focus on improving the existing
infrastructure, provide support to families to access the infrastructure or a combination of both.
Examples of access or availability issues are as follows:
Availability issues Accessibility issues
Production: Lack of goods and services produced in the area (for example because of bad harvest or disruption, destruction or interruption of local production) Trade: Lack of goods and services brought into the area through market mechanisms due to disruption of supply chain (for example transportation issues or lack of fuel) Stock: Lack or deficiency of goods or services held by traders or in government reserves (for example lack of medicines, ambulances, reconstruction materials, spare parts or fuel) Transfer: Lack of goods and services supplied by the government and / or aid agencies (for example lack of qualified teachers, physicians, school teachers or health centres)
Physical and logistical: Long distances, transport issues, restrictions of movement, lack of fuel, lack of road maintenance or bridges destroyed. Access denied to survivors, those released from quarantines, traders from Ebola affected communities to markets because of the community’s fear of infection. Financial: Lack of income, resources or financial means (for example because of price inflation or loss of purchasing power)
Psychological: Fear of Ebola infection prevented people from accessing basic services (for example health facilities and markets). Legal: Laws, by-laws, restrictive regulations and measures established by the government and local authorities to prevent the outbreak spreading.
ENAP Sierra Leone Assessment, April 2015
18
Health
Perspectives on health before and during the Ebola crisis
The health system in Sierra Leone is chronically underfinanced and understaffed.
In 2006, there were 0.2 physicians per 10,000 people, compared to an average of two per 10,000 in Africa and 32 per
10,000 in Europe. The number of nurses and midwives was two per 10,000 between 2002–08, compared to an average
of 11 and 79, in Africa and Europe respectively (WHO, 2010; 2009). A health workforce of 23 per 10,000 people is
required to achieve WHO recommendation of 80% coverage of minimal standards for maternal and child health (WHO,
2010).
The situation has since worsened. On 18 March 2015, a reported 302 health workers were infected with Ebola and 221
had died, out of the total of about 1,100 health workers in Sierra Leone (WHO, 18/03/2015).
Between 2000 and 2009 there was an average of four hospital beds per 10,000 population, compared to an average of
ten in Africa and 63 in Europe (WHO, 2010; 2009).
In 2007, the government only covered 31% of total health expenditure (WHO, 2010). A lack of money and distance to
health facilities were among the main reported barriers to accessing healthcare (SLDHS, 2013).
The large number of Ebola cases has overwhelmed the weak and under-resourced health systems. Scarce resources
have been diverted to the response, and health facilities have been temporarily closed or have reduced operations.
Key findings
Over 3.5 million people are estimated to be at risk due to serious unmet health needs in Sierra Leone.
The severity and magnitude of health problems correlates with Ebola exposure levels. High exposure
districts present acute needs and a higher proportion of population at risk.
74% of KIs believe that the health situation is worse than a year ago.
The main reasons for deteriorating health conditions are: fear of infection, rumours and misconceptions,
a lack of trust in health facilities, and a shortage of health workers.
Health seeking behaviour has dropped significantly. Only 50% of the population now seek healthcare
assistance when facing a serious health problem, compared to 80% pre-Ebola.
The main consequences of the reduced access to health facilities and services are: increased mortality,
self-medication, morbidity and inadequate or under-resourced health services. This was reported across
all districts, regardless of exposure level.
The most affected groups identified are: Ebola survivors, quarantined HHs, people with chronic illnesses,
people with disability and poor HHs.
The most vulnerable groups are: children under 12 years’ old, pregnant women, women, older people
and people with disabilities.
The priority interventions across all districts are:
1. Available and affordable drugs and health services.
2. Ebola prevention campaigns.
3. Health education in communities.
4. Training and recruitment of health workers.
5. Mobile clinics.
Cash assistance for health.
Infection prevention control in health centres.
Over 3.5 million people are at risk due to serious unmet health needs in Sierra Leone.
The severity and magnitude of health problems correlates with Ebola exposure levels. High exposure
districts present acute needs and a higher proportion of population at risk.
74% of KIs believe that the health situation is worse than a year ago.
The main reasons for deteriorating health conditions are: fear of infection, rumours and misconceptions,
a lack of trust in health facilities, and a shortage of health workers.
Health seeking behaviour has dropped significantly. Only 50% of the population now seek healthcare
assistance when facing a serious health problem, compared to 80% pre-Ebola.
The main consequences of the reduced access to health facilities and services are: increased mortality,
self-medication, morbidity and inadequate or under-resourced health services. This was reported across
all districts, regardless of exposure level.
The most affected groups identified are: Ebola survivors, quarantined HHs, people with chronic illnesses,
people with disability and poor HHs.
The most vulnerable groups are: children under 12 years’ old, pregnant women, women, older people
and people with disabilities.
Available and affordable drugs and health services.
Ebola prevention campaigns.
ENAP Sierra Leone Assessment, April 2015
19
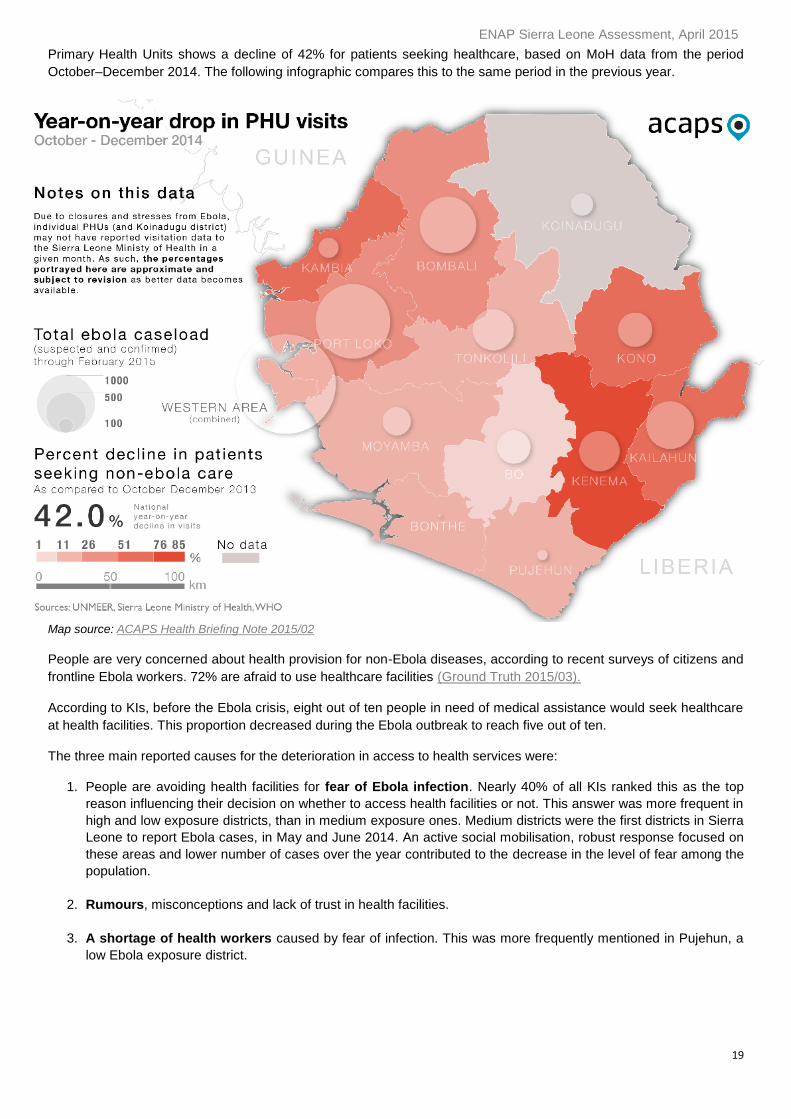
Primary Health Units shows a decline of 42% for patients seeking healthcare, based on MoH data from the period
October–December 2014. The following infographic compares this to the same period in the previous year.
Map source: ACAPS Health Briefing Note 2015/02
People are very concerned about health provision for non-Ebola diseases, according to recent surveys of citizens and
frontline Ebola workers. 72% are afraid to use healthcare facilities (Ground Truth 2015/03).
According to KIs, before the Ebola crisis, eight out of ten people in need of medical assistance would seek healthcare
at health facilities. This proportion decreased during the Ebola outbreak to reach five out of ten.
The three main reported causes for the deterioration in access to health services were:
1. People are avoiding health facilities for fear of Ebola infection. Nearly 40% of all KIs ranked this as the top
reason influencing their decision on whether to access health facilities or not. This answer was more frequent in
high and low exposure districts, than in medium exposure ones. Medium districts were the first districts in Sierra
Leone to report Ebola cases, in May and June 2014. An active social mobilisation, robust response focused on
these areas and lower number of cases over the year contributed to the decrease in the level of fear among the
population.
2. Rumours, misconceptions and lack of trust in health facilities.
3. A shortage of health workers caused by fear of infection. This was more frequently mentioned in Pujehun, a
low Ebola exposure district.
ENAP Sierra Leone Assessment, April 2015
20
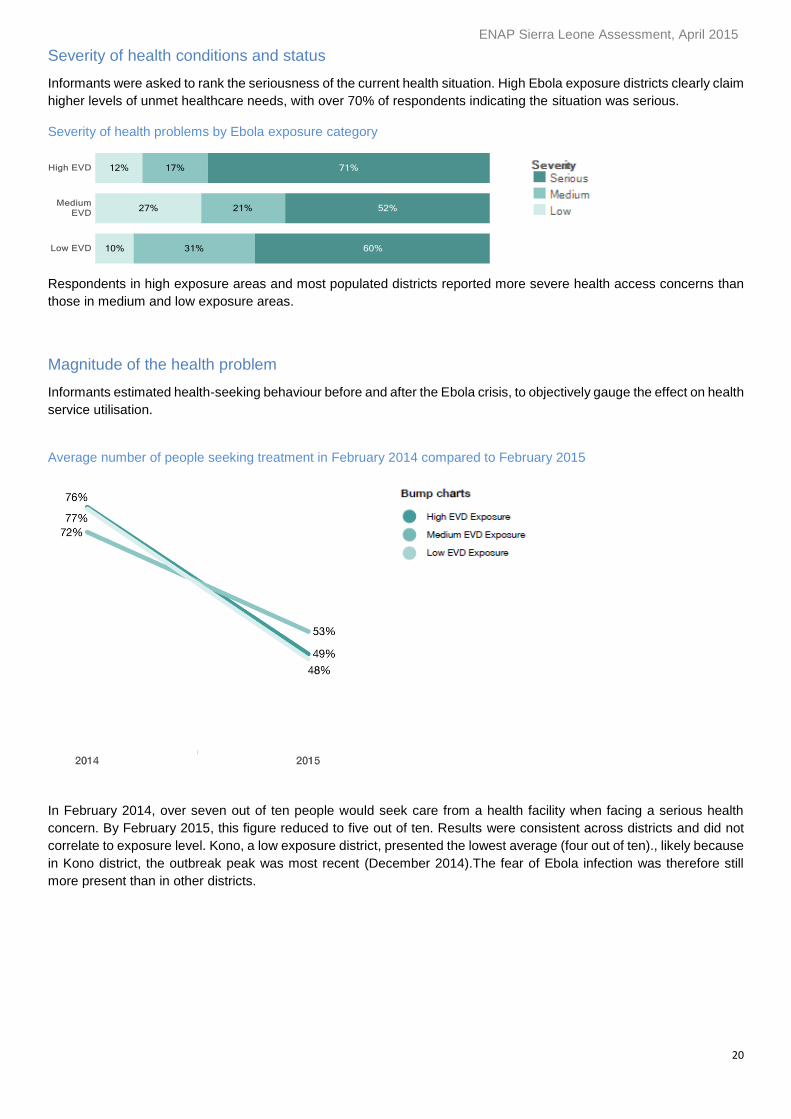
Severity of health conditions and status
Informants were asked to rank the seriousness of the current health situation. High Ebola exposure districts clearly claim
higher levels of unmet healthcare needs, with over 70% of respondents indicating the situation was serious.
Severity of health problems by Ebola exposure category
Respondents in high exposure areas and most populated districts reported more severe health access concerns than
those in medium and low exposure areas.
Magnitude of the health problem
Informants estimated health-seeking behaviour before and after the Ebola crisis, to objectively gauge the effect on health
service utilisation.
Average number of people seeking treatment in February 2014 compared to February 2015
In February 2014, over seven out of ten people would seek care from a health facility when facing a serious health
concern. By February 2015, this figure reduced to five out of ten. Results were consistent across districts and did not
correlate to exposure level. Kono, a low exposure district, presented the lowest average (four out of ten)., likely because
in Kono district, the outbreak peak was most recent (December 2014).The fear of Ebola infection was therefore still
more present than in other districts.
ENAP Sierra Leone Assessment, April 2015
21
Estimated number of people at risk for the health sector
The national estimate of population at risk due to serious unmet health needs is over 3.5 million people7.
The breakdown by level of exposure is as follows:
High exposure districts: 1.5 million people (71% of their total population)
Medium exposure districts: 1 million people (52% of their total population)
Low exposure districts: 1 million people (47% of their total population)
As expected, there is a correlation between the levels of health needs that remain unmet and the level of exposure to Ebola. Districts with higher exposure indicated more acute needs.
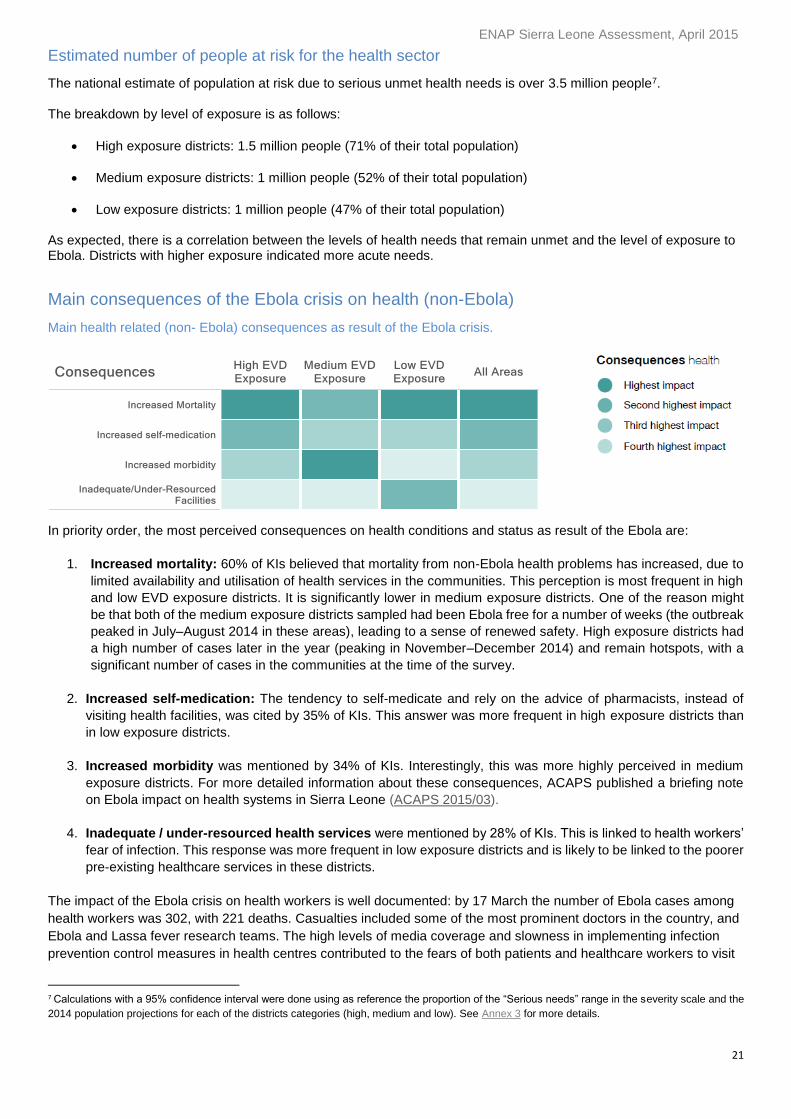
Main consequences of the Ebola crisis on health (non-Ebola)
Main health related (non- Ebola) consequences as result of the Ebola crisis.
In priority order, the most perceived consequences on health conditions and status as result of the Ebola are:
1. Increased mortality: 60% of KIs believed that mortality from non-Ebola health problems has increased, due to
limited availability and utilisation of health services in the communities. This perception is most frequent in high
and low EVD exposure districts. It is significantly lower in medium exposure districts. One of the reason might
be that both of the medium exposure districts sampled had been Ebola free for a number of weeks (the outbreak
peaked in July–August 2014 in these areas), leading to a sense of renewed safety. High exposure districts had
a high number of cases later in the year (peaking in November–December 2014) and remain hotspots, with a
significant number of cases in the communities at the time of the survey.
2. Increased self-medication: The tendency to self-medicate and rely on the advice of pharmacists, instead of
visiting health facilities, was cited by 35% of KIs. This answer was more frequent in high exposure districts than
in low exposure districts.
3. Increased morbidity was mentioned by 34% of KIs. Interestingly, this was more highly perceived in medium
exposure districts. For more detailed information about these consequences, ACAPS published a briefing note
on Ebola impact on health systems in Sierra Leone (ACAPS 2015/03).
4. Inadequate / under-resourced health services were mentioned by 28% of KIs. This is linked to health workers’
fear of infection. This response was more frequent in low exposure districts and is likely to be linked to the poorer
pre-existing healthcare services in these districts.
The impact of the Ebola crisis on health workers is well documented: by 17 March the number of Ebola cases among
health workers was 302, with 221 deaths. Casualties included some of the most prominent doctors in the country, and
Ebola and Lassa fever research teams. The high levels of media coverage and slowness in implementing infection
prevention control measures in health centres contributed to the fears of both patients and healthcare workers to visit
7 Calculations with a 95% confidence interval were done using as reference the proportion of the “Serious needs” range in the severity scale and the
2014 population projections for each of the districts categories (high, medium and low). See Annex 3 for more details.
ENAP Sierra Leone Assessment, April 2015
22
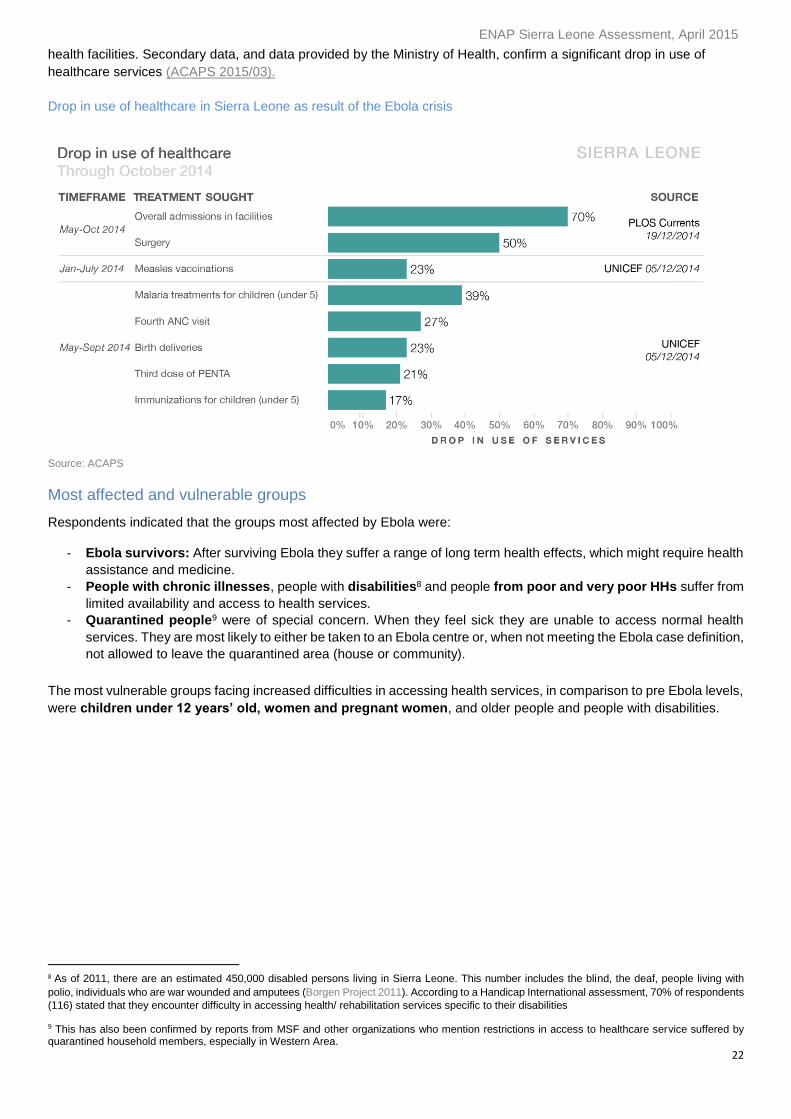
health facilities. Secondary data, and data provided by the Ministry of Health, confirm a significant drop in use of
healthcare services (ACAPS 2015/03).
Drop in use of healthcare in Sierra Leone as result of the Ebola crisis
Source: ACAPS
Most affected and vulnerable groups
Respondents indicated that the groups most affected by Ebola were:
- Ebola survivors: After surviving Ebola they suffer a range of long term health effects, which might require health
assistance and medicine.
- People with chronic illnesses, people with disabilities8 and people from poor and very poor HHs suffer from
limited availability and access to health services.
- Quarantined people9 were of special concern. When they feel sick they are unable to access normal health
services. They are most likely to either be taken to an Ebola centre or, when not meeting the Ebola case definition,
not allowed to leave the quarantined area (house or community).
The most vulnerable groups facing increased difficulties in accessing health services, in comparison to pre Ebola levels,
were children under 12 years’ old, women and pregnant women, and older people and people with disabilities.
8 As of 2011, there are an estimated 450,000 disabled persons living in Sierra Leone. This number includes the blind, the deaf, people living with
polio, individuals who are war wounded and amputees (Borgen Project 2011). According to a Handicap International assessment, 70% of respondents
(116) stated that they encounter difficulty in accessing health/ rehabilitation services specific to their disabilities
9 This has also been confirmed by reports from MSF and other organizations who mention restrictions in access to healthcare service suffered by quarantined household members, especially in Western Area.
ENAP Sierra Leone Assessment, April 2015
23
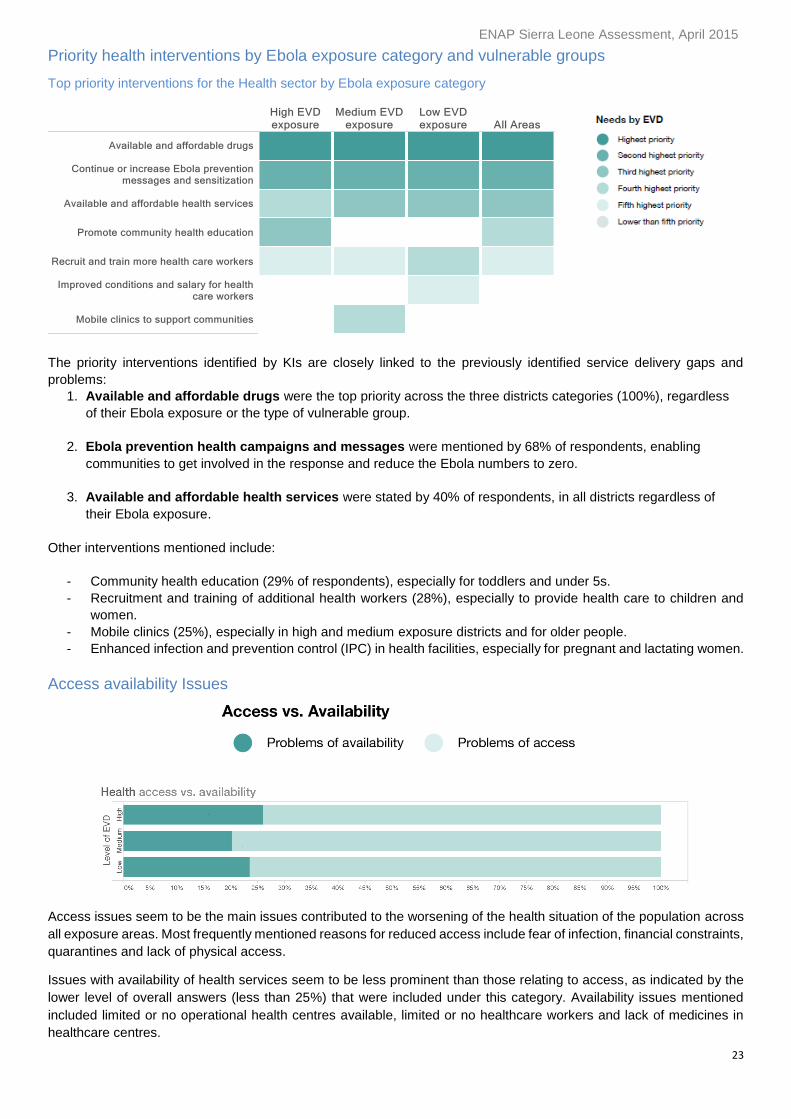
Priority health interventions by Ebola exposure category and vulnerable groups
Top priority interventions for the Health sector by Ebola exposure category
The priority interventions identified by KIs are closely linked to the previously identified service delivery gaps and
problems:
1. Available and affordable drugs were the top priority across the three districts categories (100%), regardless
of their Ebola exposure or the type of vulnerable group.
2. Ebola prevention health campaigns and messages were mentioned by 68% of respondents, enabling
communities to get involved in the response and reduce the Ebola numbers to zero.
3. Available and affordable health services were stated by 40% of respondents, in all districts regardless of
their Ebola exposure.
Other interventions mentioned include:
- Community health education (29% of respondents), especially for toddlers and under 5s.
- Recruitment and training of additional health workers (28%), especially to provide health care to children and
women.
- Mobile clinics (25%), especially in high and medium exposure districts and for older people.
- Enhanced infection and prevention control (IPC) in health facilities, especially for pregnant and lactating women.
Access availability Issues
Access issues seem to be the main issues contributed to the worsening of the health situation of the population across
all exposure areas. Most frequently mentioned reasons for reduced access include fear of infection, financial constraints,
quarantines and lack of physical access.
Issues with availability of health services seem to be less prominent than those relating to access, as indicated by the
lower level of overall answers (less than 25%) that were included under this category. Availability issues mentioned
included limited or no operational health centres available, limited or no healthcare workers and lack of medicines in
healthcare centres.
ENAP Sierra Leone Assessment, April 2015
24
Food security
Perspectives on food security before and during the Ebola crisis
Context and background
Even before Ebola, food insecurity seemed to be a major development problem across the country, undermining
people’s health and productivity. A 2011 comprehensive analysis of food security and vulnerability indicated that 45%
of HHs (over 2.5 million people) were classified as food-insecure during the lean season from June to October (WFP
CFSVA 2011).
Most livelihoods in Sierra Leone are agriculture-based and the state of food insecurity varies according to the agricultural
production cycle, according to a WFP baseline study in 2010. August is the peak of the lean (hunger) season in
agricultural dependent areas. In urban areas, hunger increases also in January. Most urban workers rely on commercial
trade, which generally slows down in January or by the end of the month before wages are paid. Producing food does
not guarantee sufficient access to it. 65% of HHs that cultivate rice do not produce enough to feed their family, and only
5.5% of rice cultivators relied on their own production for the full year (WFP 2010).
HHs relying on petty trade and food crop production have the highest incidence of food insecurity. Those relying on
cash crop farming seem to fare better with regard to food variety, although many have borderline food consumption
(WFP 2010).
Key findings
Over 4 million people are estimated to be at risk due to serious unmet food needs, according to
calculations based on KIs perceptions.
Results suggest a correlation between high Ebola exposure and high food needs. 78% (1.6 million
people) are considered at risk from unmet food needs in high exposure areas, 63% (1.2 million people)
in medium and 54% (1.2 million people) in low exposure areas.
93% of informants described the food situation as worse, compared to the same period last year. The
already vulnerable food security status of the population deteriorated further, due to the Ebola crisis and
public health emergency measures to curb the spread of the virus (movement restrictions, curfews,
quarantines and border closures).
Inadequate food production (disruption in planting and harvest cycles), movement restrictions and
increased food prices are the main reasons for the deterioration of the food security status across all
districts. Markets and supply chain disruptions were also mentioned.
The main reported consequences included hunger and starvation, increased health problems and
reduced food consumption. These consequences were noted in all areas but were more acute in high
exposure districts.
One third of respondents linked food shortages with increased criminal activities, especially in medium
and low exposure districts.
The main priority interventions expressed by KIs, regardless of exposure, were:
1. Direct food assistance (in-kind food, cash for food and school feeding programs for children).
2. Indirect food assistance (agricultural and livelihoods inputs to enable families to restore their food
production, income and purchasing power).
3. Access to credit for petty traders, restoration of market activities and informal trading and abolition of
curfews and trade opening hours limitations.
Campaigning to deter sex for food exchanges was mentioned by KIs across all districts.
ENAP Sierra Leone Assessment, April 2015
25
Ebola impact
Ebola has brought an additional burden of expenditure and impacted food security for many HHs. Food security is
improving, thanks to the recent harvest and lower incidences of Ebola, according to the most recent WFP survey (mVAM,
February 2015). The same report indicates a modest increase in local and imported rice prices, except in Port Loko
where rice prices dropped as result of new rice arriving in the market (WFP 2015/02).
Trade resumed in February when all three Ebola affected countries opened their land borders. Markets and trade were
showing signs of recovery, but high staple food prices and low wages are hampering food access in Northern Sierra
Leone (WFP 2015/02). On 30 March 2015, Guinea closed its borders with Sierra Leone again as part of its 45-day plan
to eradicate Ebola. This unexpected closure is likely to impact recently restored supply chains.
According to Cadre Harmonise’s (CILSS) current analysis of the situation in Sierra Leone, there are almost 800,000
people in Crisis (IPC Phase 3) and 1.3 million people already under Stress (IPC Phase 2) to ensure adequate diet and
essential non-food expenditure without engaging in irreversible coping strategies. Projections for the upcoming months
indicate that 1.1 million people will be in food security Crisis (IPC Phase 3) and 1.7 million people under Stress (IPC
Phase 2) at the peak of the lean season (CILSS 2015/03).
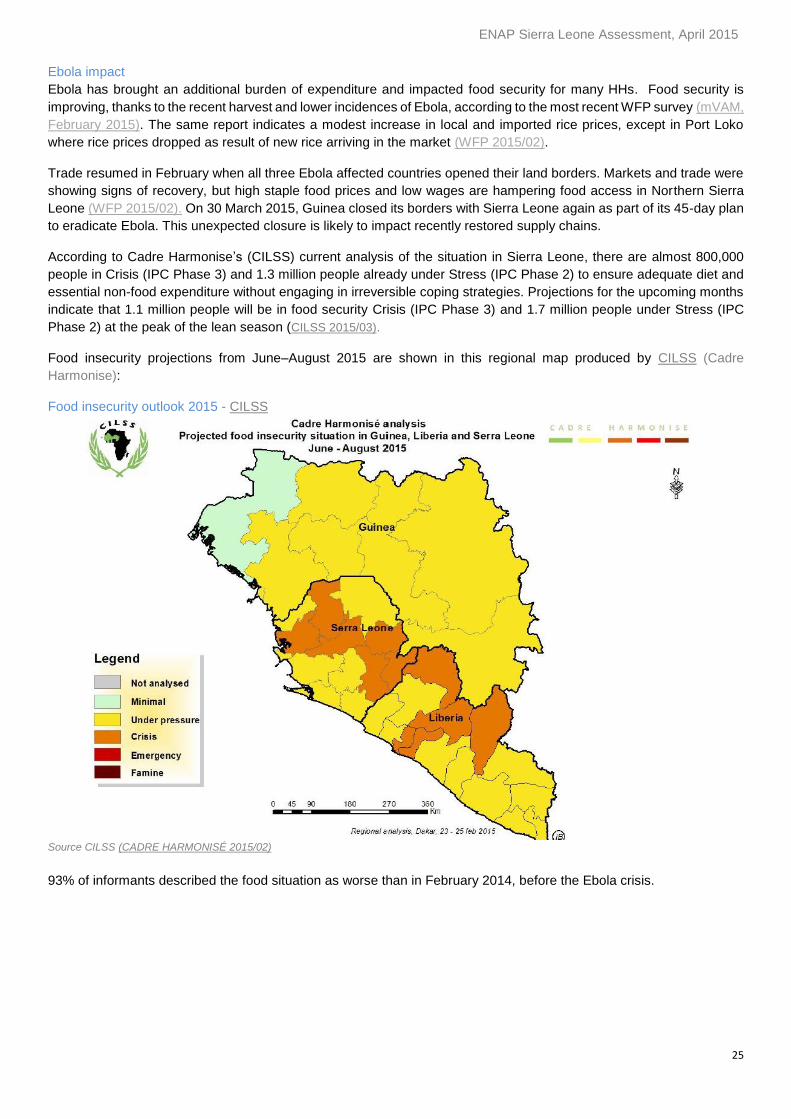
Food insecurity projections from June–August 2015 are shown in this regional map produced by CILSS (Cadre
Harmonise):
Food insecurity outlook 2015 - CILSS
Source CILSS (CADRE HARMONISÉ 2015/02)
93% of informants described the food situation as worse than in February 2014, before the Ebola crisis.
ENAP Sierra Leone Assessment, April 2015
26
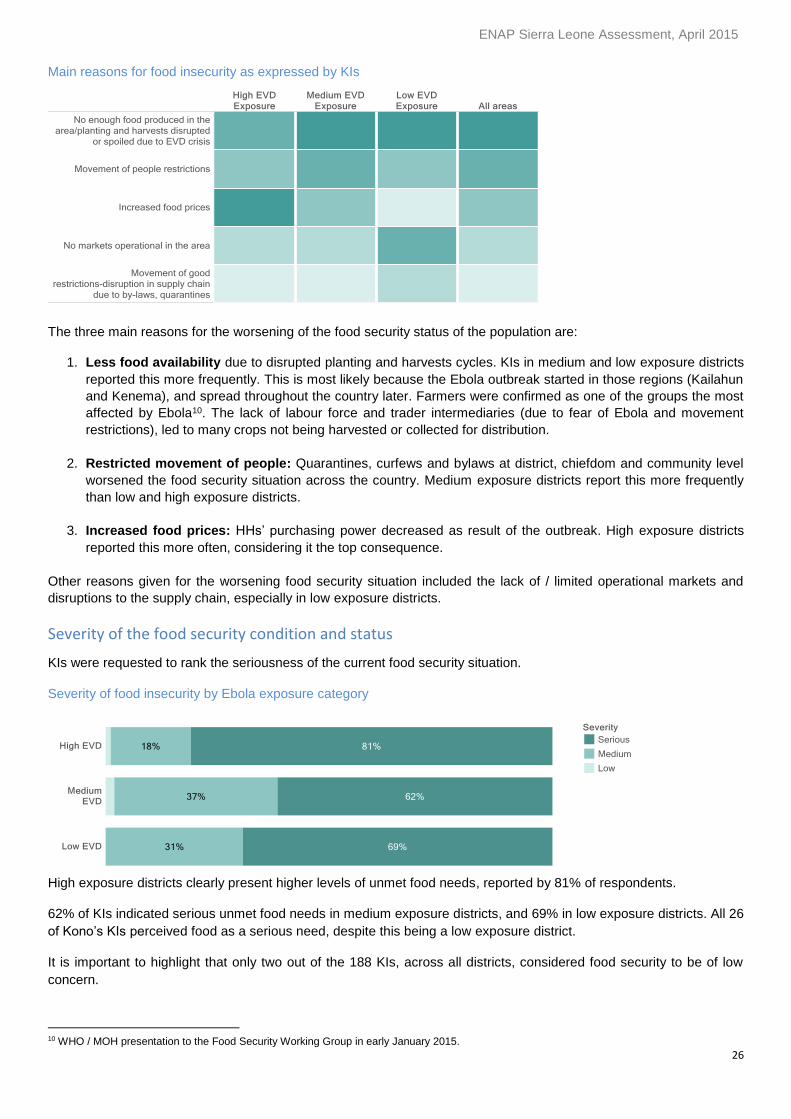
Main reasons for food insecurity as expressed by KIs
The three main reasons for the worsening of the food security status of the population are:
1. Less food availability due to disrupted planting and harvests cycles. KIs in medium and low exposure districts
reported this more frequently. This is most likely because the Ebola outbreak started in those regions (Kailahun
and Kenema), and spread throughout the country later. Farmers were confirmed as one of the groups the most
affected by Ebola10. The lack of labour force and trader intermediaries (due to fear of Ebola and movement
restrictions), led to many crops not being harvested or collected for distribution.
2. Restricted movement of people: Quarantines, curfews and bylaws at district, chiefdom and community level
worsened the food security situation across the country. Medium exposure districts report this more frequently
than low and high exposure districts.
3. Increased food prices: HHs’ purchasing power decreased as result of the outbreak. High exposure districts
reported this more often, considering it the top consequence.
Other reasons given for the worsening food security situation included the lack of / limited operational markets and
disruptions to the supply chain, especially in low exposure districts.
Severity of the food security condition and status
KIs were requested to rank the seriousness of the current food security situation.
Severity of food insecurity by Ebola exposure category
High exposure districts clearly present higher levels of unmet food needs, reported by 81% of respondents.
62% of KIs indicated serious unmet food needs in medium exposure districts, and 69% in low exposure districts. All 26
of Kono’s KIs perceived food as a serious need, despite this being a low exposure district.
It is important to highlight that only two out of the 188 KIs, across all districts, considered food security to be of low
concern.
10 WHO / MOH presentation to the Food Security Working Group in early January 2015.

ENAP Sierra Leone Assessment, April 2015
27
Magnitude of the food problem
KIs were asked to compare current food consumption patterns with the situation last year. In February 2015, the overall
number of HHs having good food all year round dropped by half compared to numbers from February 2014.
Pujehun (low exposure district) reported the most significant decrease.
There was no significant change reported in the number of HHs with enough food, but not always good food,
from before the crisis. However Kenema and Kailahun, both medium exposure, show a higher number of HHs affected
by changes in food consumption.
HHs with limited food access and availability before the outbreak suffered the most severe change. The number
of families without enough food to eat increased from 50% before the crisis, to over 70%. The number of families that
reportedly never had enough food, not even the cheapest, increased slightly from before the crisis (3-5% increase).
Lack of food is seen as a problem across all districts especially in Port Loko (high exposure and agricultural dependent),
in Kailahun11 (medium exposure and agricultural dependent) and Pujehun and Kono (both low exposure with different
levels of agricultural dependency).
Average number of people accessing food in February 2015 compared to February 2014, by category
11 According to a FewsNet report from January 2015, there was a 8% drop in rice production in Kailahun compared to the previous year. This area is estimated to have the most significant declines in rice productions (FEWSNET, 2015/01).
ENAP Sierra Leone Assessment, April 2015
28
Estimated number of people at risk in the food security sector
The national estimate of population at risk due to serious unmet food security needs is over four million people12.
The breakdown by level of exposure is as follows:
- High exposure districts: 1.6 million people (76% of their total population).
- Medium exposure districts: 1.2 million people (63% of their total population).
- Low exposure districts: 1.2 million people (54% of their total population).
High-exposure areas appear to be experiencing higher levels of unmet food security needs. There is a correlation
between exposure to EVD and the level of food needs that remain unmet.
Based on KI’s perceptions, the estimated population at risk of lack of food is significantly higher than results from current
situation and estimated projections from CILSS. Results of the ENAP assessment are based on key informants’
perceptions and reflect the fact that food is one of the most serious concerns across all respondents across all districts.
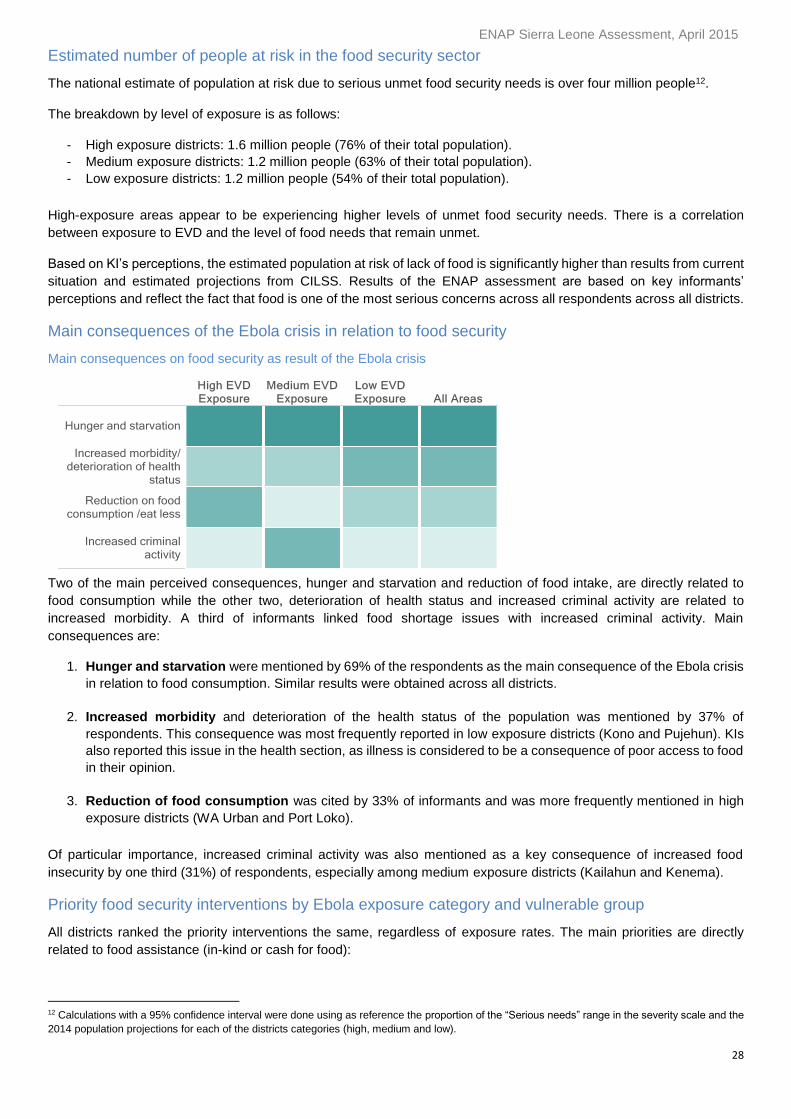
Main consequences of the Ebola crisis in relation to food security
Main consequences on food security as result of the Ebola crisis
Two of the main perceived consequences, hunger and starvation and reduction of food intake, are directly related to
food consumption while the other two, deterioration of health status and increased criminal activity are related to
increased morbidity. A third of informants linked food shortage issues with increased criminal activity. Main
consequences are:
1. Hunger and starvation were mentioned by 69% of the respondents as the main consequence of the Ebola crisis
in relation to food consumption. Similar results were obtained across all districts.
2. Increased morbidity and deterioration of the health status of the population was mentioned by 37% of
respondents. This consequence was most frequently reported in low exposure districts (Kono and Pujehun). KIs
also reported this issue in the health section, as illness is considered to be a consequence of poor access to food
in their opinion.
3. Reduction of food consumption was cited by 33% of informants and was more frequently mentioned in high
exposure districts (WA Urban and Port Loko).
Of particular importance, increased criminal activity was also mentioned as a key consequence of increased food
insecurity by one third (31%) of respondents, especially among medium exposure districts (Kailahun and Kenema).
Priority food security interventions by Ebola exposure category and vulnerable group
All districts ranked the priority interventions the same, regardless of exposure rates. The main priorities are directly
related to food assistance (in-kind or cash for food):
12 Calculations with a 95% confidence interval were done using as reference the proportion of the “Serious needs” range in the severity scale and the
2014 population projections for each of the districts categories (high, medium and low).
ENAP Sierra Leone Assessment, April 2015
29
1. Food assistance to HHs (in-kind) was mentioned as the priority need, and more frequently requested in high and
medium exposure areas. Respondents felt this assistance to be especially needed for vulnerable groups who are
most at risk of hunger and starvation such as children, the under 5s, women and older people. Food assistance to
Ebola survivors and to HHs that had lost their main breadwinner was also mentioned. Ebola survivors often have
special dietary needs to support their full recovery. Food support to quarantined HHs was frequently mentioned. This
need is corroborated by interviews with organisations working in quarantine areas and quarantine officers. They
mention food assistance as one of the basic requirements to ensure effective quarantines in the country.
2. Financial assistance to buy food for the family. Advantages to this approach include a positive knock on effect for
local markets and labour opportunities. It was also considered to benefit adults, as they are the main breadwinners
of the HH.
3. School feeding programs for children: This intervention was more frequently requested in medium exposure
districts (food programs also appear as the third priority need under the education section).
Other requested priority interventions were campaigning to deter sex for food exchanges13, agricultural and livelihood
inputs to support families in restoring food production and income generating activities. This activity was seen as
particularly important to allow HHs to purchase food and essential items in the markets.
Credit support and micro-credits for traders and petty traders were also requested. Access to credit has been restricted
for many HHs and traders as a result of the crisis. This is also reported by WFP, the Red Cross and other NGOs
(OXFAM, Red Cross). Many local community savings and loans groups have limited or suspended their activities. These
interventions were also identified as a priority in the livelihood section of the survey. Many KIs considered that if market
and petty trade activities are fully restored, this will have a beneficial impact on the HH food security.
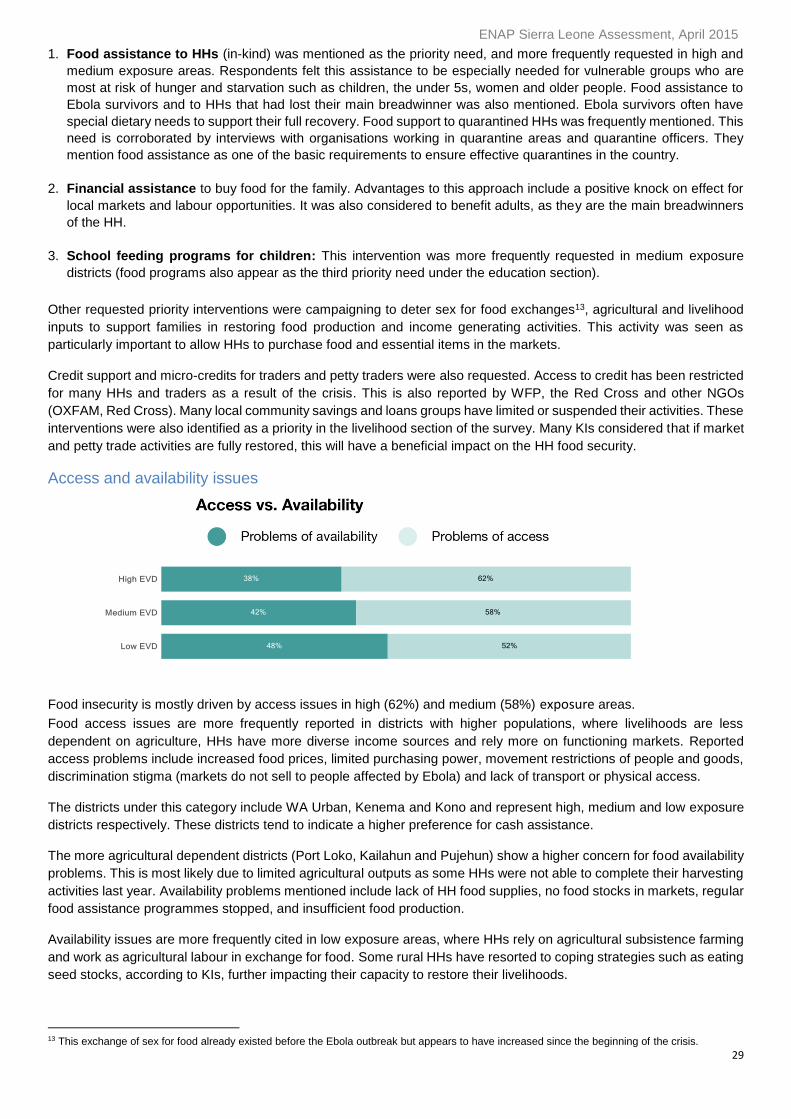
Access and availability issues
Food insecurity is mostly driven by access issues in high (62%) and medium (58%) exposure areas.
Food access issues are more frequently reported in districts with higher populations, where livelihoods are less
dependent on agriculture, HHs have more diverse income sources and rely more on functioning markets. Reported
access problems include increased food prices, limited purchasing power, movement restrictions of people and goods,
discrimination stigma (markets do not sell to people affected by Ebola) and lack of transport or physical access.
The districts under this category include WA Urban, Kenema and Kono and represent high, medium and low exposure
districts respectively. These districts tend to indicate a higher preference for cash assistance.
The more agricultural dependent districts (Port Loko, Kailahun and Pujehun) show a higher concern for food availability
problems. This is most likely due to limited agricultural outputs as some HHs were not able to complete their harvesting
activities last year. Availability problems mentioned include lack of HH food supplies, no food stocks in markets, regular
food assistance programmes stopped, and insufficient food production.
Availability issues are more frequently cited in low exposure areas, where HHs rely on agricultural subsistence farming
and work as agricultural labour in exchange for food. Some rural HHs have resorted to coping strategies such as eating
seed stocks, according to KIs, further impacting their capacity to restore their livelihoods.
13 This exchange of sex for food already existed before the Ebola outbreak but appears to have increased since the beginning of the crisis.
ENAP Sierra Leone Assessment, April 2015
30
Livelihoods
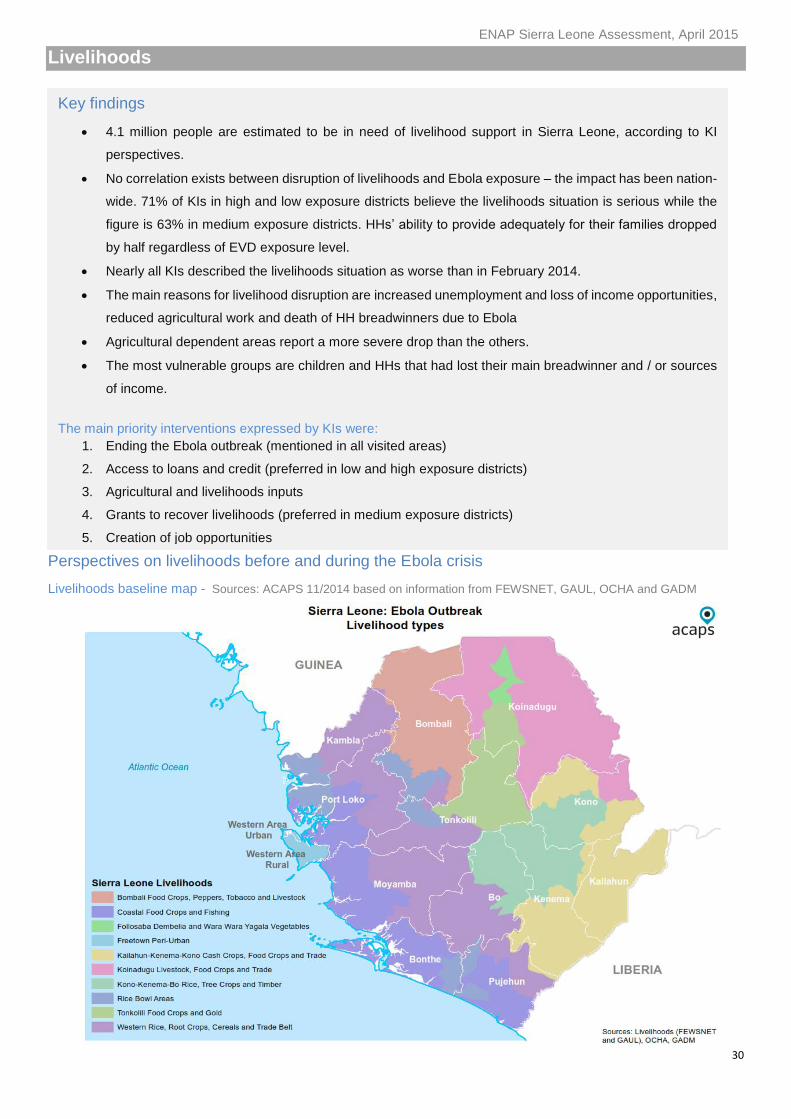
Perspectives on livelihoods before and during the Ebola crisis
Livelihoods baseline map - Sources: ACAPS 11/2014 based on information from FEWSNET, GAUL, OCHA and GADM
Key findings
4.1 million people are estimated to be in need of livelihood support in Sierra Leone, according to KI
perspectives.
No correlation exists between disruption of livelihoods and Ebola exposure – the impact has been nation-
wide. 71% of KIs in high and low exposure districts believe the livelihoods situation is serious while the
figure is 63% in medium exposure districts. HHs’ ability to provide adequately for their families dropped
by half regardless of EVD exposure level.
Nearly all KIs described the livelihoods situation as worse than in February 2014.
The main reasons for livelihood disruption are increased unemployment and loss of income opportunities,
reduced agricultural work and death of HH breadwinners due to Ebola
Agricultural dependent areas report a more severe drop than the others.
The most vulnerable groups are children and HHs that had lost their main breadwinner and / or sources
of income.
The main priority interventions expressed by KIs were:
1. Ending the Ebola outbreak (mentioned in all visited areas)
2. Access to loans and credit (preferred in low and high exposure districts)
3. Agricultural and livelihoods inputs
4. Grants to recover livelihoods (preferred in medium exposure districts)
5. Creation of job opportunities
ENAP Sierra Leone Assessment, April 2015
31
Traditionally, most HHs relied on more than one income source (WFP 2010). The majority of the population is engaged
in farming, including food crops, cash crops and livestock. Agriculture is the main occupation for about 52.4%
households in Sierra Leone. In rural areas, this percentage rises to 78.3%, both men and women participate in farming
activities (WFP 2010). Male household heads were more likely to have agriculture as their primary occupation, 55.5%
versus 44.1% respectively (World Bank, 06/2013). Western Area, Kono, Kenema, and Bo districts are the only
exceptions. Trade, business and fishing are the main sources of income in Western Area. Mining is an important source
of income in Kenema and Port Loko districts, in addition to agriculture and petty trade.
In urban areas, the most important livelihoods include salaried employment (health workers, teachers and other trained
professions), commercial trade activities, and petty trade. In rural areas, the vast majority of households are involved
in food crops and cash crops.
At the national level, women were involved in all of the major livelihoods identified, especially in trade and commercial
activities (51% and 36% respectively) (WFP 2010).
Before the Ebola crisis, on average only over 55% of all HHs in Sierra Leone were able to provide adequately for their
families. Western Area Urban, Port Loko and Pujehun are the districts most likely to be able to provide for their families.
Impact of the Ebola crisis on livelihoods
The Ebola crisis has had a significant impact on the livelihoods, especially employment and income generating
opportunities. Markets have been closed, transport of people and goods have been restricted through quarantine
measures, agricultural and trading activities are suspended and international borders are closed.
Many HHs lost their sources of income as result of businesses reducing their activities, and mining and road works
stopping, due to the outbreak. Several international companies temporarily ceased their activities. There were increased
limitations to working hours due to curfews and movement restrictions. Private sector reports mention reductions in
wages and working hours, especially from July to December. Informal income generating opportunities also decreased.
Wages: Wage rates dropped in February for the second month in a row, according to WFP, particularly in the south and
Port Loko (19%), current Ebola hotspots. This is due to the end of the rice harvest and subsequent decline in demand
for agricultural labour. Some Ebola affected areas such as Kenema have seen a rebound in palm oil prices and labour
markets and a decline in negative coping strategies. This may signal an economic recovery which could bolster food
security (WFP 2015/02). Wages improved notably in Kenema standing at 12,000 Sierra Leonean Leone/day (WFP
2015/02).
Prices: As wage rates fell and food prices rose, commodities became less affordable. The steepest decrease was 6%
in Kambia and Port Loko. The lowest terms of trade are observed in Kailahun and Kono, where a day’s wage is
equivalent to ten cups of local rice, compared to 11 to 12 cups in other parts of the country (WFP 2015/02).
Long-term impact: HHs are suffering the Ebola impact more than governmental and business establishments,
according to a UNDP report. Working conditions have worsened, especially for women (UNDP 2014/12).
The livelihood situation described by the KIs differs according to their main income source: market or agricultural work.
During the survey, 95% of informants described the livelihoods situation as worse than in February 2014. The main
reasons given for this were:
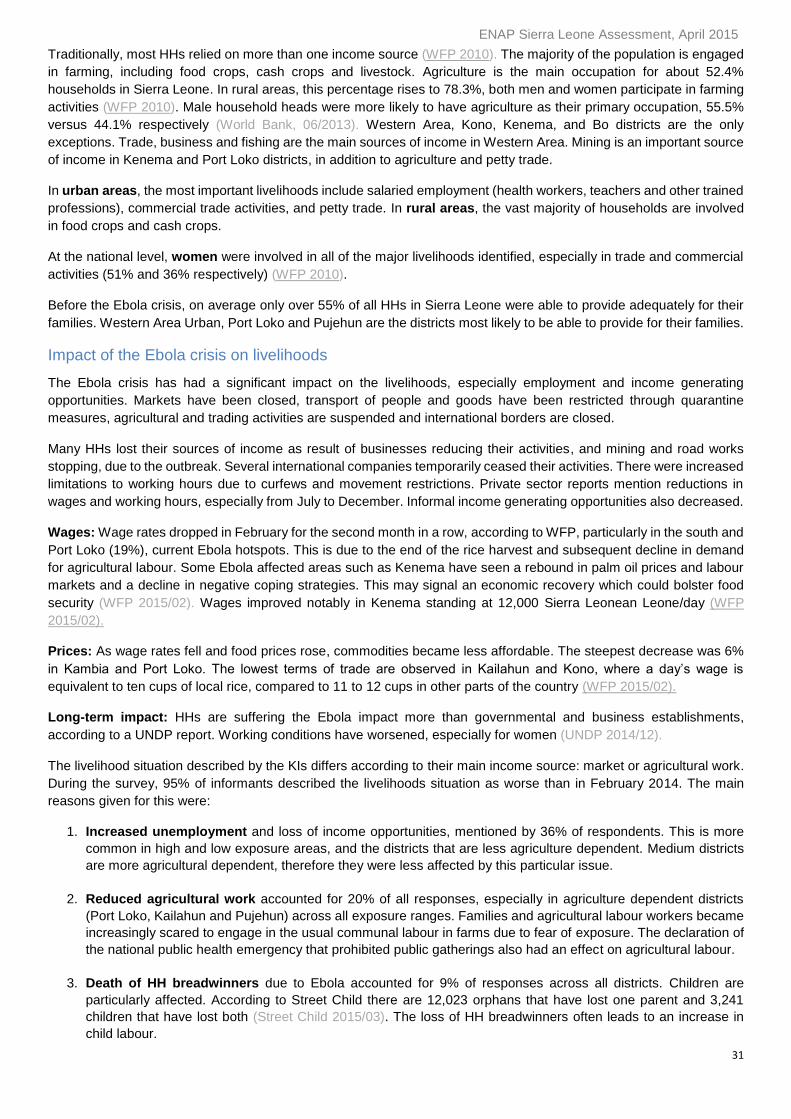
1. Increased unemployment and loss of income opportunities, mentioned by 36% of respondents. This is more
common in high and low exposure areas, and the districts that are less agriculture dependent. Medium districts
are more agricultural dependent, therefore they were less affected by this particular issue.
2. Reduced agricultural work accounted for 20% of all responses, especially in agriculture dependent districts
(Port Loko, Kailahun and Pujehun) across all exposure ranges. Families and agricultural labour workers became
increasingly scared to engage in the usual communal labour in farms due to fear of exposure. The declaration of
the national public health emergency that prohibited public gatherings also had an effect on agricultural labour.
3. Death of HH breadwinners due to Ebola accounted for 9% of responses across all districts. Children are
particularly affected. According to Street Child there are 12,023 orphans that have lost one parent and 3,241
children that have lost both (Street Child 2015/03). The loss of HH breadwinners often leads to an increase in
child labour.
ENAP Sierra Leone Assessment, April 2015
32
Other responses included movement restrictions to engage in any economically viable activities and the collapse /
reduction of business and petty trade, which had a negative impact on the earning capabilities of families.
Main reasons for the deterioration of livelihood conditions when compared to before the crisis
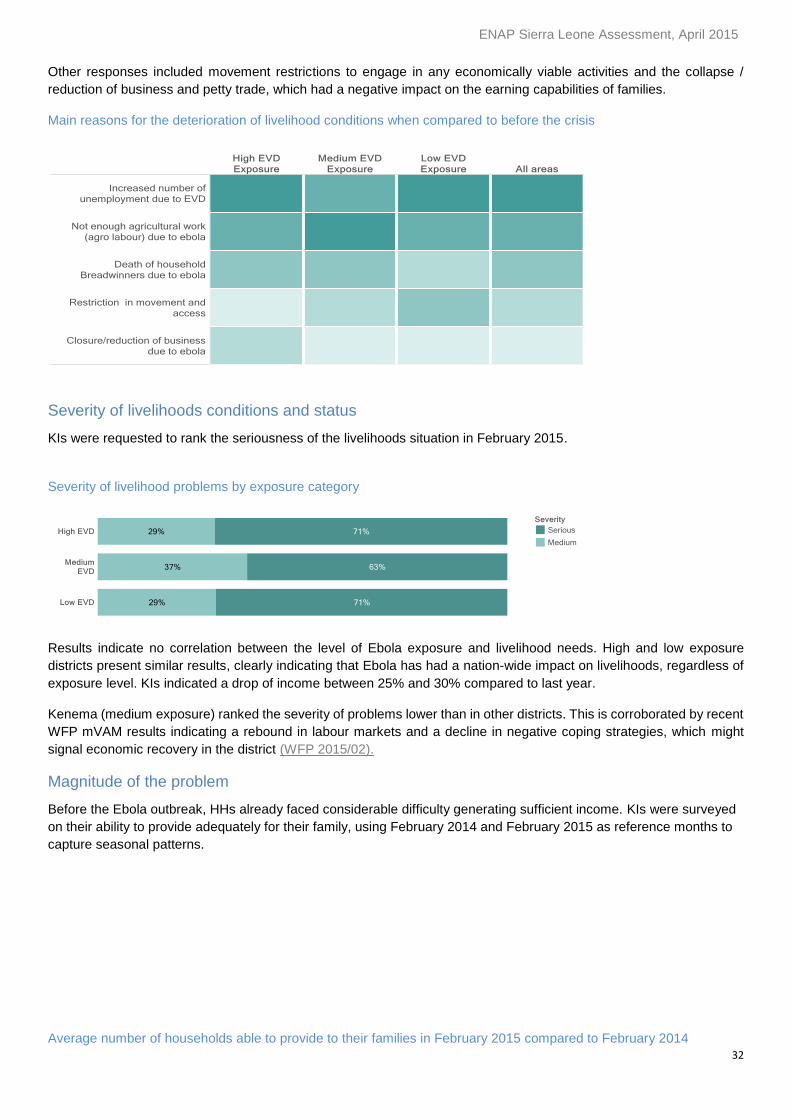
Severity of livelihoods conditions and status
KIs were requested to rank the seriousness of the livelihoods situation in February 2015.
Severity of livelihood problems by exposure category
Results indicate no correlation between the level of Ebola exposure and livelihood needs. High and low exposure
districts present similar results, clearly indicating that Ebola has had a nation-wide impact on livelihoods, regardless of
exposure level. KIs indicated a drop of income between 25% and 30% compared to last year.
Kenema (medium exposure) ranked the severity of problems lower than in other districts. This is corroborated by recent
WFP mVAM results indicating a rebound in labour markets and a decline in negative coping strategies, which might
signal economic recovery in the district (WFP 2015/02).
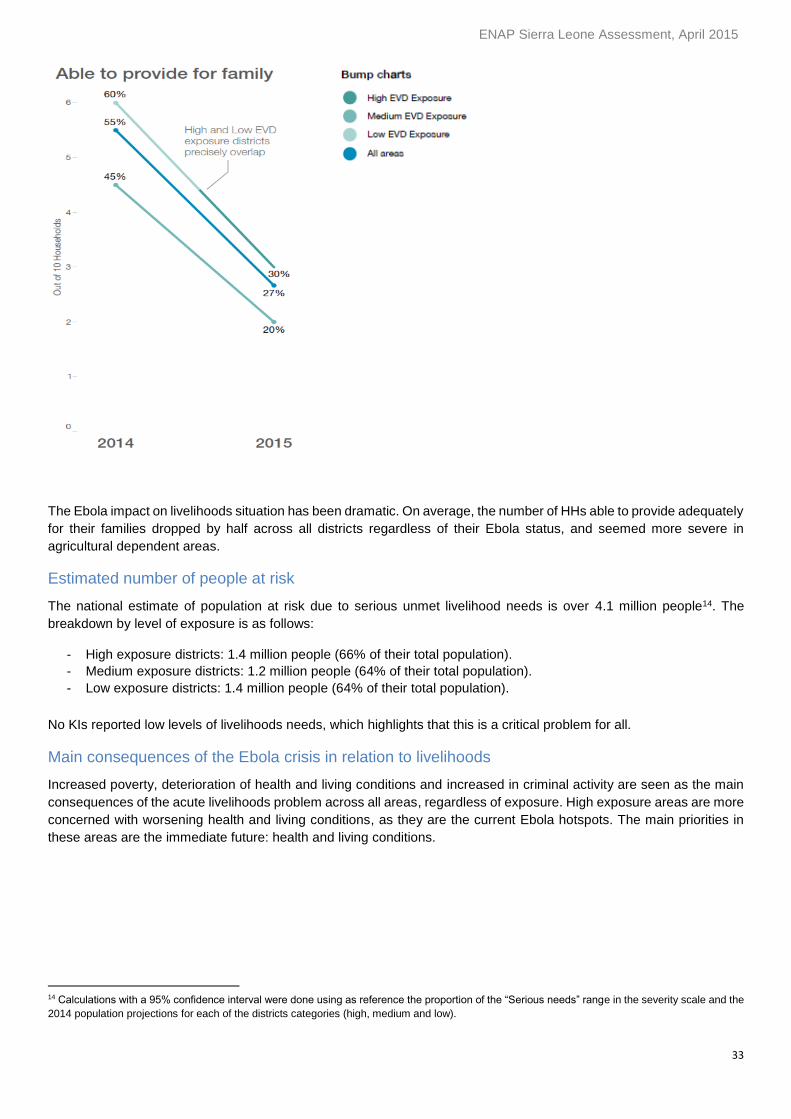
Magnitude of the problem
Before the Ebola outbreak, HHs already faced considerable difficulty generating sufficient income. KIs were surveyed
on their ability to provide adequately for their family, using February 2014 and February 2015 as reference months to
capture seasonal patterns.
Average number of households able to provide to their families in February 2015 compared to February 2014
ENAP Sierra Leone Assessment, April 2015
33
The Ebola impact on livelihoods situation has been dramatic. On average, the number of HHs able to provide adequately
for their families dropped by half across all districts regardless of their Ebola status, and seemed more severe in
agricultural dependent areas.
Estimated number of people at risk
The national estimate of population at risk due to serious unmet livelihood needs is over 4.1 million people14. The
breakdown by level of exposure is as follows:
- High exposure districts: 1.4 million people (66% of their total population).
- Medium exposure districts: 1.2 million people (64% of their total population).
- Low exposure districts: 1.4 million people (64% of their total population).
No KIs reported low levels of livelihoods needs, which highlights that this is a critical problem for all.
Main consequences of the Ebola crisis in relation to livelihoods
Increased poverty, deterioration of health and living conditions and increased in criminal activity are seen as the main
consequences of the acute livelihoods problem across all areas, regardless of exposure. High exposure areas are more
concerned with worsening health and living conditions, as they are the current Ebola hotspots. The main priorities in
these areas are the immediate future: health and living conditions.
14 Calculations with a 95% confidence interval were done using as reference the proportion of the “Serious needs” range in the severity scale and the
2014 population projections for each of the districts categories (high, medium and low).
ENAP Sierra Leone Assessment, April 2015
34
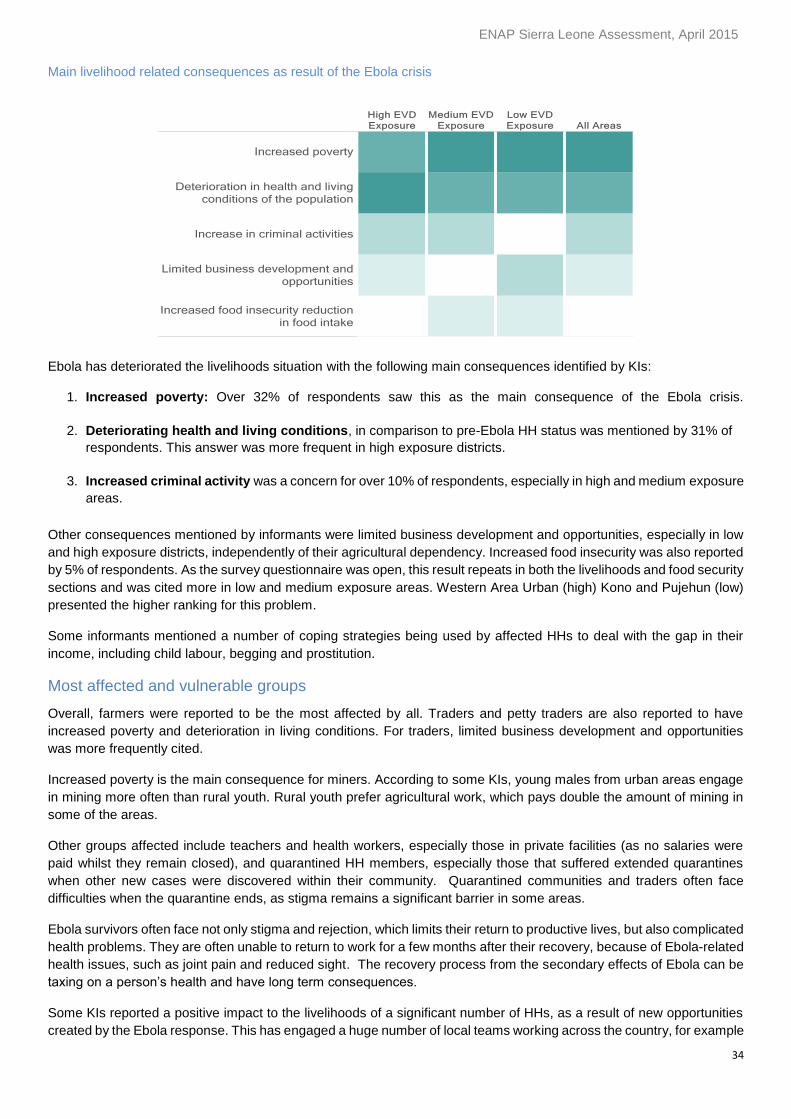
Main livelihood related consequences as result of the Ebola crisis
Ebola has deteriorated the livelihoods situation with the following main consequences identified by KIs:
1. Increased poverty: Over 32% of respondents saw this as the main consequence of the Ebola crisis.
2. Deteriorating health and living conditions, in comparison to pre-Ebola HH status was mentioned by 31% of
respondents. This answer was more frequent in high exposure districts.
3. Increased criminal activity was a concern for over 10% of respondents, especially in high and medium exposure
areas.
Other consequences mentioned by informants were limited business development and opportunities, especially in low
and high exposure districts, independently of their agricultural dependency. Increased food insecurity was also reported
by 5% of respondents. As the survey questionnaire was open, this result repeats in both the livelihoods and food security
sections and was cited more in low and medium exposure areas. Western Area Urban (high) Kono and Pujehun (low)
presented the higher ranking for this problem.
Some informants mentioned a number of coping strategies being used by affected HHs to deal with the gap in their
income, including child labour, begging and prostitution.
Most affected and vulnerable groups
Overall, farmers were reported to be the most affected by all. Traders and petty traders are also reported to have
increased poverty and deterioration in living conditions. For traders, limited business development and opportunities
was more frequently cited.
Increased poverty is the main consequence for miners. According to some KIs, young males from urban areas engage
in mining more often than rural youth. Rural youth prefer agricultural work, which pays double the amount of mining in
some of the areas.
Other groups affected include teachers and health workers, especially those in private facilities (as no salaries were
paid whilst they remain closed), and quarantined HH members, especially those that suffered extended quarantines
when other new cases were discovered within their community. Quarantined communities and traders often face
difficulties when the quarantine ends, as stigma remains a significant barrier in some areas.
Ebola survivors often face not only stigma and rejection, which limits their return to productive lives, but also complicated
health problems. They are often unable to return to work for a few months after their recovery, because of Ebola-related
health issues, such as joint pain and reduced sight. The recovery process from the secondary effects of Ebola can be
taxing on a person’s health and have long term consequences.
Some KIs reported a positive impact to the livelihoods of a significant number of HHs, as a result of new opportunities
created by the Ebola response. This has engaged a huge number of local teams working across the country, for example
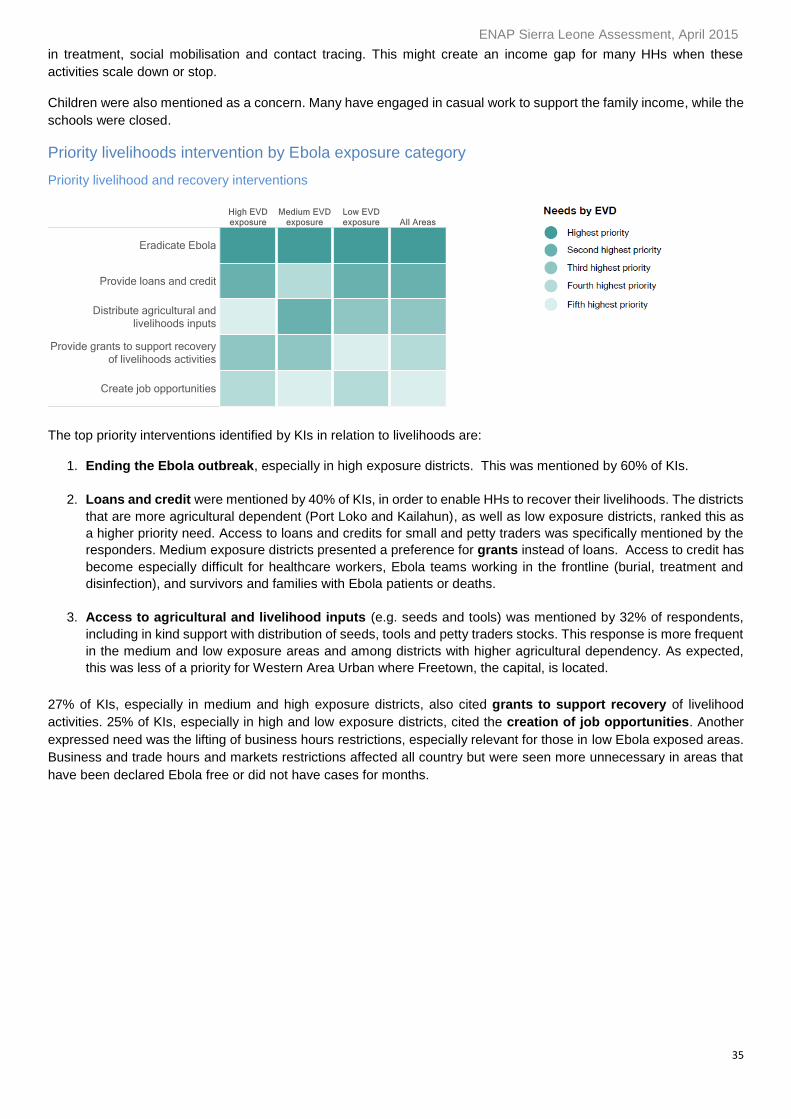
ENAP Sierra Leone Assessment, April 2015
35
in treatment, social mobilisation and contact tracing. This might create an income gap for many HHs when these
activities scale down or stop.
Children were also mentioned as a concern. Many have engaged in casual work to support the family income, while the
schools were closed.
Priority livelihoods intervention by Ebola exposure category
Priority livelihood and recovery interventions
The top priority interventions identified by KIs in relation to livelihoods are:
1. Ending the Ebola outbreak, especially in high exposure districts. This was mentioned by 60% of KIs.
2. Loans and credit were mentioned by 40% of KIs, in order to enable HHs to recover their livelihoods. The districts
that are more agricultural dependent (Port Loko and Kailahun), as well as low exposure districts, ranked this as
a higher priority need. Access to loans and credits for small and petty traders was specifically mentioned by the
responders. Medium exposure districts presented a preference for grants instead of loans. Access to credit has
become especially difficult for healthcare workers, Ebola teams working in the frontline (burial, treatment and
disinfection), and survivors and families with Ebola patients or deaths.
3. Access to agricultural and livelihood inputs (e.g. seeds and tools) was mentioned by 32% of respondents,
including in kind support with distribution of seeds, tools and petty traders stocks. This response is more frequent
in the medium and low exposure areas and among districts with higher agricultural dependency. As expected,
this was less of a priority for Western Area Urban where Freetown, the capital, is located.
27% of KIs, especially in medium and high exposure districts, also cited grants to support recovery of livelihood
activities. 25% of KIs, especially in high and low exposure districts, cited the creation of job opportunities. Another
expressed need was the lifting of business hours restrictions, especially relevant for those in low Ebola exposed areas.
Business and trade hours and markets restrictions affected all country but were seen more unnecessary in areas that
have been declared Ebola free or did not have cases for months.
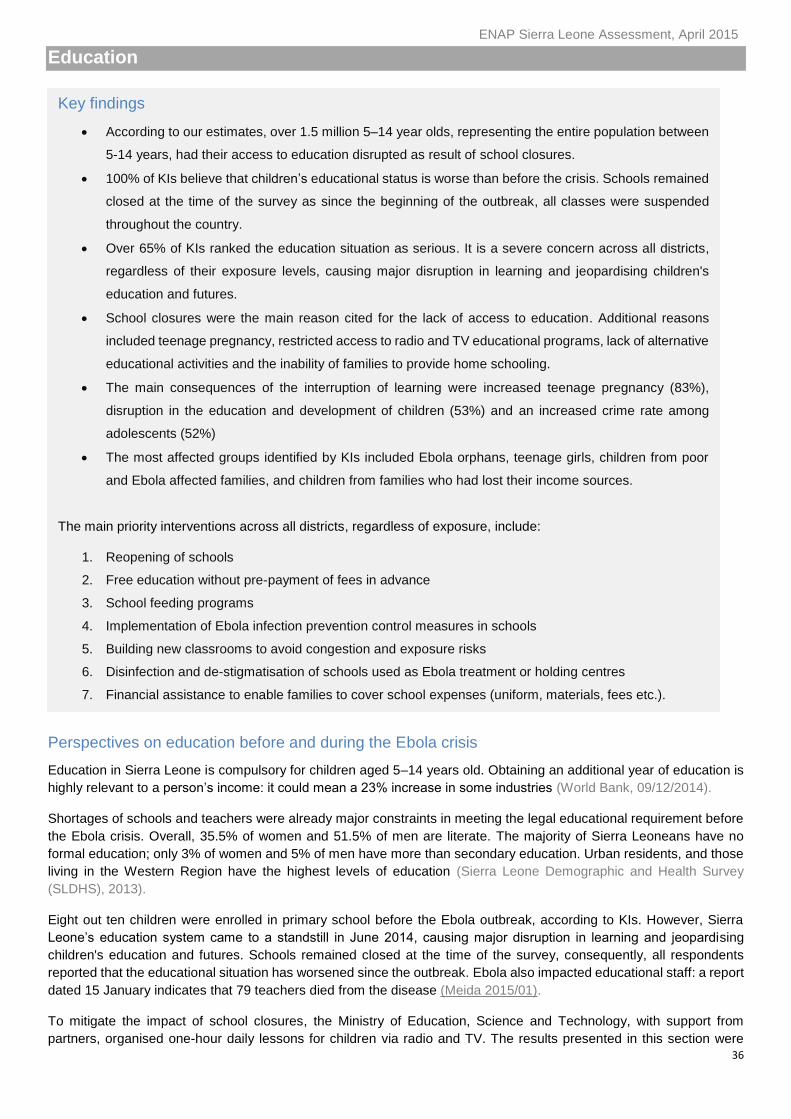
ENAP Sierra Leone Assessment, April 2015
36
Education
Perspectives on education before and during the Ebola crisis
Education in Sierra Leone is compulsory for children aged 5–14 years old. Obtaining an additional year of education is
highly relevant to a person’s income: it could mean a 23% increase in some industries (World Bank, 09/12/2014).
Shortages of schools and teachers were already major constraints in meeting the legal educational requirement before
the Ebola crisis. Overall, 35.5% of women and 51.5% of men are literate. The majority of Sierra Leoneans have no
formal education; only 3% of women and 5% of men have more than secondary education. Urban residents, and those
living in the Western Region have the highest levels of education (Sierra Leone Demographic and Health Survey
(SLDHS), 2013).
Eight out ten children were enrolled in primary school before the Ebola outbreak, according to KIs. However, Sierra
Leone’s education system came to a standstill in June 2014, causing major disruption in learning and jeopardising
children's education and futures. Schools remained closed at the time of the survey, consequently, all respondents
reported that the educational situation has worsened since the outbreak. Ebola also impacted educational staff: a report
dated 15 January indicates that 79 teachers died from the disease (Meida 2015/01).
To mitigate the impact of school closures, the Ministry of Education, Science and Technology, with support from
partners, organised one-hour daily lessons for children via radio and TV. The results presented in this section were
Key findings
According to our estimates, over 1.5 million 5–14 year olds, representing the entire population between
5-14 years, had their access to education disrupted as result of school closures.
100% of KIs believe that children’s educational status is worse than before the crisis. Schools remained
closed at the time of the survey as since the beginning of the outbreak, all classes were suspended
throughout the country.
Over 65% of KIs ranked the education situation as serious. It is a severe concern across all districts,
regardless of their exposure levels, causing major disruption in learning and jeopardising children's
education and futures.
School closures were the main reason cited for the lack of access to education. Additional reasons
included teenage pregnancy, restricted access to radio and TV educational programs, lack of alternative
educational activities and the inability of families to provide home schooling.
The main consequences of the interruption of learning were increased teenage pregnancy (83%),
disruption in the education and development of children (53%) and an increased crime rate among
adolescents (52%)
The most affected groups identified by KIs included Ebola orphans, teenage girls, children from poor
and Ebola affected families, and children from families who had lost their income sources.
The main priority interventions across all districts, regardless of exposure, include:
1. Reopening of schools
2. Free education without pre-payment of fees in advance
3. School feeding programs
4. Implementation of Ebola infection prevention control measures in schools
5. Building new classrooms to avoid congestion and exposure risks
6. Disinfection and de-stigmatisation of schools used as Ebola treatment or holding centres
7. Financial assistance to enable families to cover school expenses (uniform, materials, fees etc.).
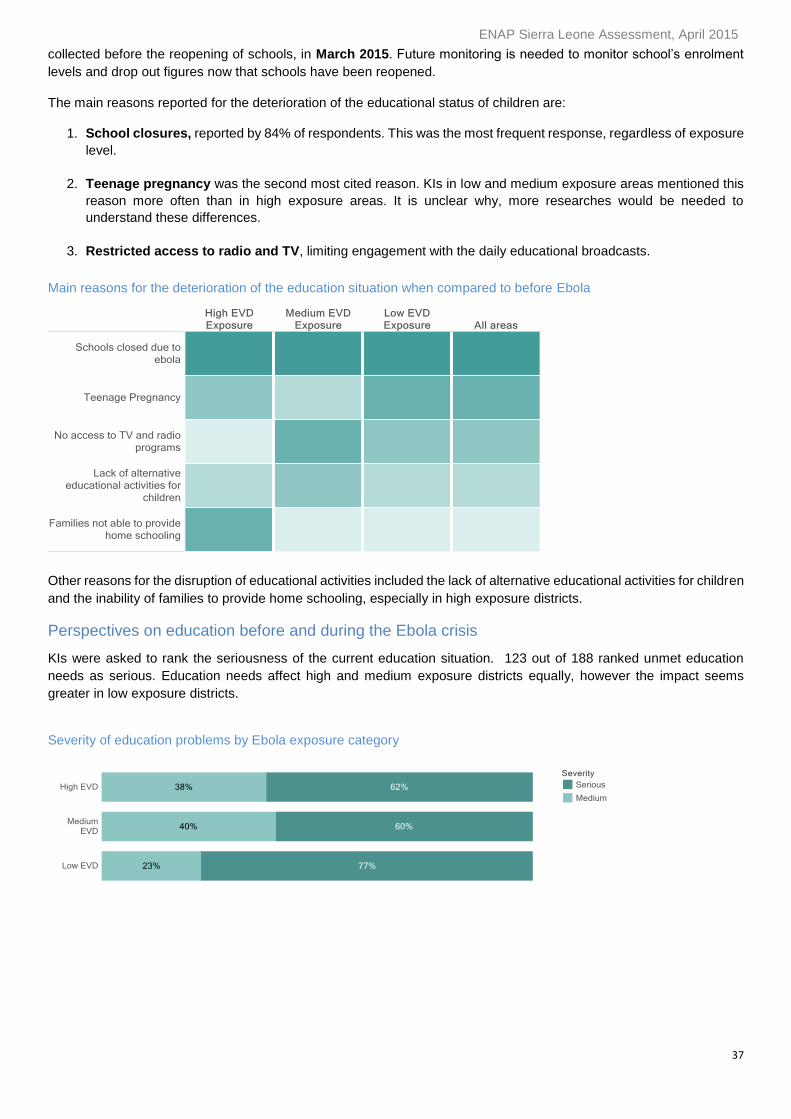
ENAP Sierra Leone Assessment, April 2015
37
collected before the reopening of schools, in March 2015. Future monitoring is needed to monitor school’s enrolment
levels and drop out figures now that schools have been reopened.
The main reasons reported for the deterioration of the educational status of children are:
1. School closures, reported by 84% of respondents. This was the most frequent response, regardless of exposure
level.
2. Teenage pregnancy was the second most cited reason. KIs in low and medium exposure areas mentioned this
reason more often than in high exposure areas. It is unclear why, more researches would be needed to
understand these differences.
3. Restricted access to radio and TV, limiting engagement with the daily educational broadcasts.
Main reasons for the deterioration of the education situation when compared to before Ebola
Other reasons for the disruption of educational activities included the lack of alternative educational activities for children
and the inability of families to provide home schooling, especially in high exposure districts.
Perspectives on education before and during the Ebola crisis
KIs were asked to rank the seriousness of the current education situation. 123 out of 188 ranked unmet education
needs as serious. Education needs affect high and medium exposure districts equally, however the impact seems
greater in low exposure districts.
Severity of education problems by Ebola exposure category
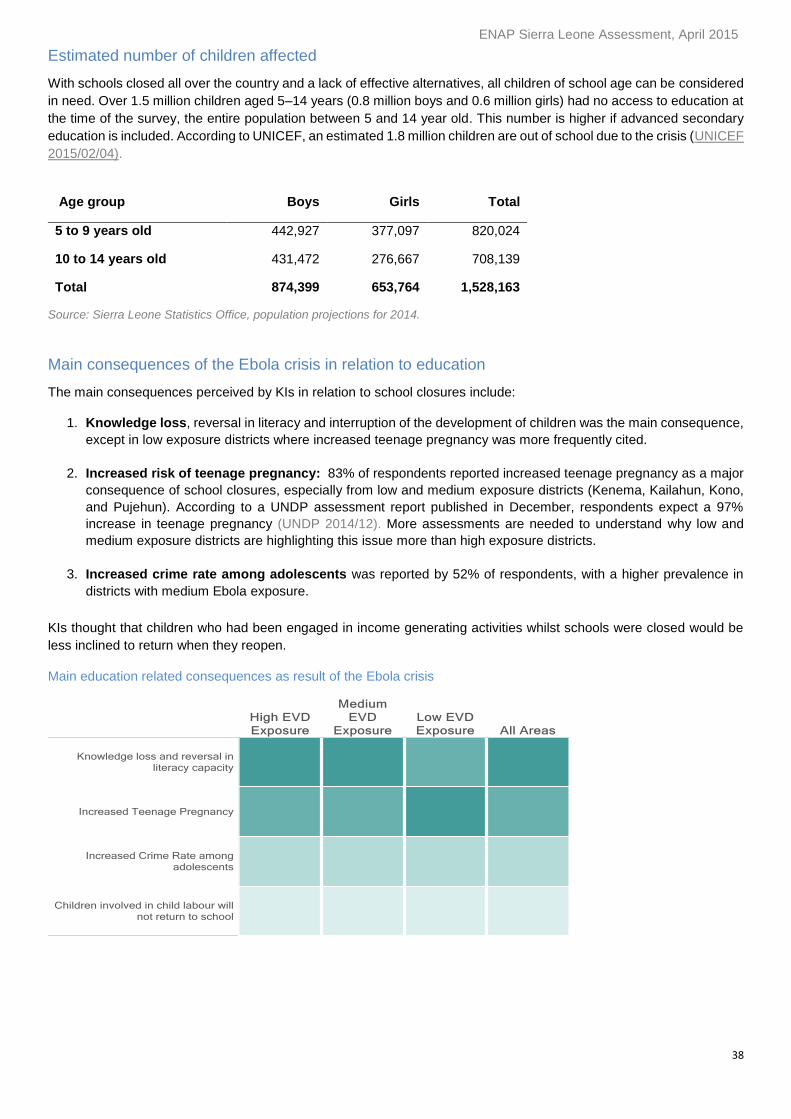
ENAP Sierra Leone Assessment, April 2015
38
Estimated number of children affected
With schools closed all over the country and a lack of effective alternatives, all children of school age can be considered
in need. Over 1.5 million children aged 5–14 years (0.8 million boys and 0.6 million girls) had no access to education at
the time of the survey, the entire population between 5 and 14 year old. This number is higher if advanced secondary
education is included. According to UNICEF, an estimated 1.8 million children are out of school due to the crisis (UNICEF
2015/02/04).
Age group Boys Girls Total
5 to 9 years old 442,927 377,097 820,024
10 to 14 years old 431,472 276,667 708,139
Total 874,399 653,764 1,528,163
Source: Sierra Leone Statistics Office, population projections for 2014.
Main consequences of the Ebola crisis in relation to education
The main consequences perceived by KIs in relation to school closures include:
1. Knowledge loss, reversal in literacy and interruption of the development of children was the main consequence,
except in low exposure districts where increased teenage pregnancy was more frequently cited.
2. Increased risk of teenage pregnancy: 83% of respondents reported increased teenage pregnancy as a major
consequence of school closures, especially from low and medium exposure districts (Kenema, Kailahun, Kono,
and Pujehun). According to a UNDP assessment report published in December, respondents expect a 97%
increase in teenage pregnancy (UNDP 2014/12). More assessments are needed to understand why low and
medium exposure districts are highlighting this issue more than high exposure districts.
3. Increased crime rate among adolescents was reported by 52% of respondents, with a higher prevalence in
districts with medium Ebola exposure.
KIs thought that children who had been engaged in income generating activities whilst schools were closed would be
less inclined to return when they reopen.
Main education related consequences as result of the Ebola crisis
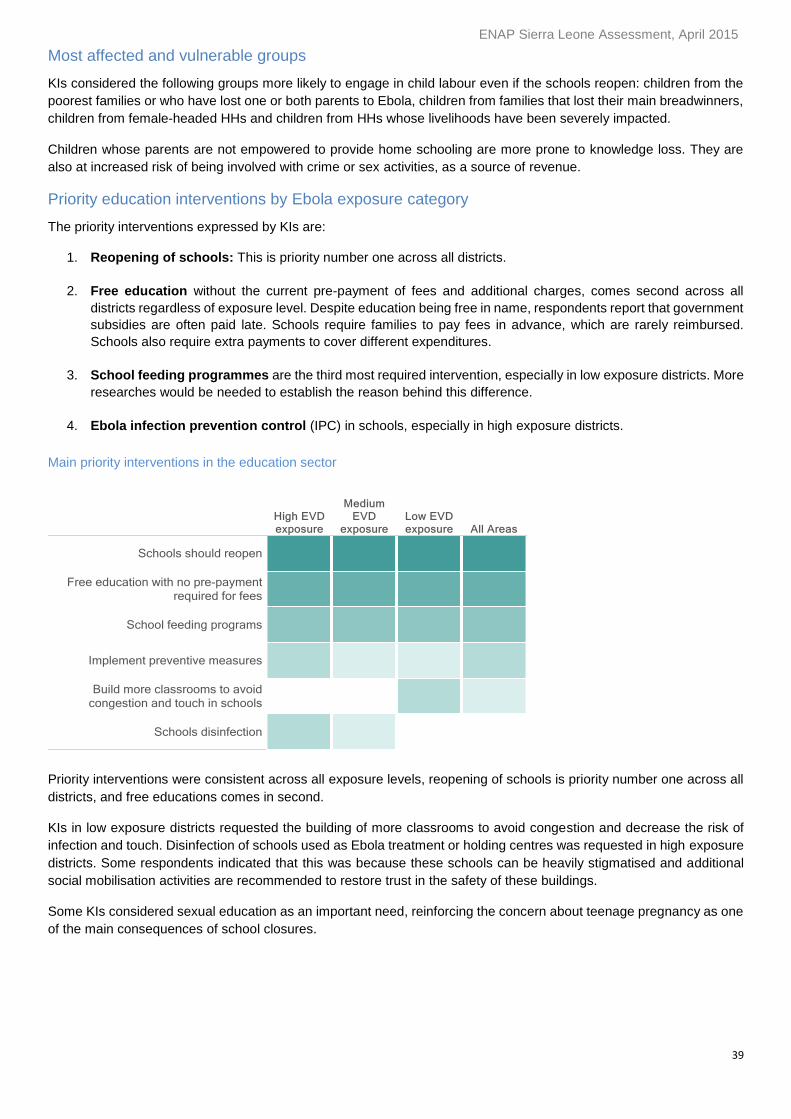
ENAP Sierra Leone Assessment, April 2015
39
Most affected and vulnerable groups
KIs considered the following groups more likely to engage in child labour even if the schools reopen: children from the
poorest families or who have lost one or both parents to Ebola, children from families that lost their main breadwinners,
children from female-headed HHs and children from HHs whose livelihoods have been severely impacted.
Children whose parents are not empowered to provide home schooling are more prone to knowledge loss. They are
also at increased risk of being involved with crime or sex activities, as a source of revenue.
Priority education interventions by Ebola exposure category
The priority interventions expressed by KIs are:
1. Reopening of schools: This is priority number one across all districts.
2. Free education without the current pre-payment of fees and additional charges, comes second across all
districts regardless of exposure level. Despite education being free in name, respondents report that government
subsidies are often paid late. Schools require families to pay fees in advance, which are rarely reimbursed.
Schools also require extra payments to cover different expenditures.
3. School feeding programmes are the third most required intervention, especially in low exposure districts. More
researches would be needed to establish the reason behind this difference.
4. Ebola infection prevention control (IPC) in schools, especially in high exposure districts.
Main priority interventions in the education sector
Priority interventions were consistent across all exposure levels, reopening of schools is priority number one across all
districts, and free educations comes in second.
KIs in low exposure districts requested the building of more classrooms to avoid congestion and decrease the risk of
infection and touch. Disinfection of schools used as Ebola treatment or holding centres was requested in high exposure
districts. Some respondents indicated that this was because these schools can be heavily stigmatised and additional
social mobilisation activities are recommended to restore trust in the safety of these buildings.
Some KIs considered sexual education as an important need, reinforcing the concern about teenage pregnancy as one
of the main consequences of school closures.
ENAP Sierra Leone Assessment, April 2015
40
Protection: Stigma and discrimination The assessment aimed to gather perspectives on discrimination and stigma during the Ebola outbreak, therefore there
is no pre-Ebola comparison in this section. Data was gathered to determine the groups experiencing discrimination and
the perceived reasons for their marginalisation, to better understand the types of stigmatisation they suffer.
The results presented in this section are based only on the answers provided by respondents who indicated the
existence of this problem in their chiefdoms – this amounted to just 88 respondents out of 188 mainly in high exposure
districts. Respondents from Kono, a low exposure district, which had cases at the time of the survey, also mentioned
the issue of protection. The rest of the districts assessed, medium districts (Kenema and Kailahun) and Pujehun did not
raise discrimination and stigma as an issue in their chiefdoms. The limited sampling size means results presented in
this section are merely descriptive and cannot be generalised beyond the population surveyed.
Perspectives on discrimination and stigma
47% of respondents indicated that Ebola-related stigma and discrimination exist in their communities, 50% did not rate
it as a problem and 3% did not express an opinion. The majority of KIs that did not perceive discrimination and stigma
as a problem are from districts in low and medium exposure. In Pujehun district (low), perceptions of this problem were
especially low (92% of KIs). This might be explained by the low number of cases in the district and by the fact it was
Ebola-free for a number of months.
Fear of Ebola infection was cited as the main reason for discrimination by all groups. It is important to note that most
KIs expressed sensitivity towards the feelings of the people at risk of stigma and discrimination.
Key findings
47% of respondents considered stigma and discrimination as result of Ebola to be a problem in their
areas, 50% mentioned that no problem existed and 3% had no opinion on this issue. Fear of infection is
the main reason for this issue.
High exposure districts and Kono (low exposure) presented a higher number of responses and ranked
protection issues as more serious.
The most affected and vulnerable groups being discriminated and stigmatised are Ebola survivors,
members of burial teams, members of quarantined HHs, healthcare workers and families with Ebola
cases or deaths, especially orphans.
The main types of stigma and discrimination suffered are not being allowed to touch or interact with
others (78% of KIs), rejection from the community (40%) and name-calling (34%). Additionally,
informants mentioned vacating homes (27%) and rejection by family (25%), especially affecting burial
teams, survivors and health workers.
Consequences of stigma include social exclusion, low self-esteem and family exclusion.
Priority interventions identified by KI are:
1. Social awareness campaigns to reduce fear and stigma.
2. Psychological support.
3. Social integration activities.
4. Access to healthcare and medicines.
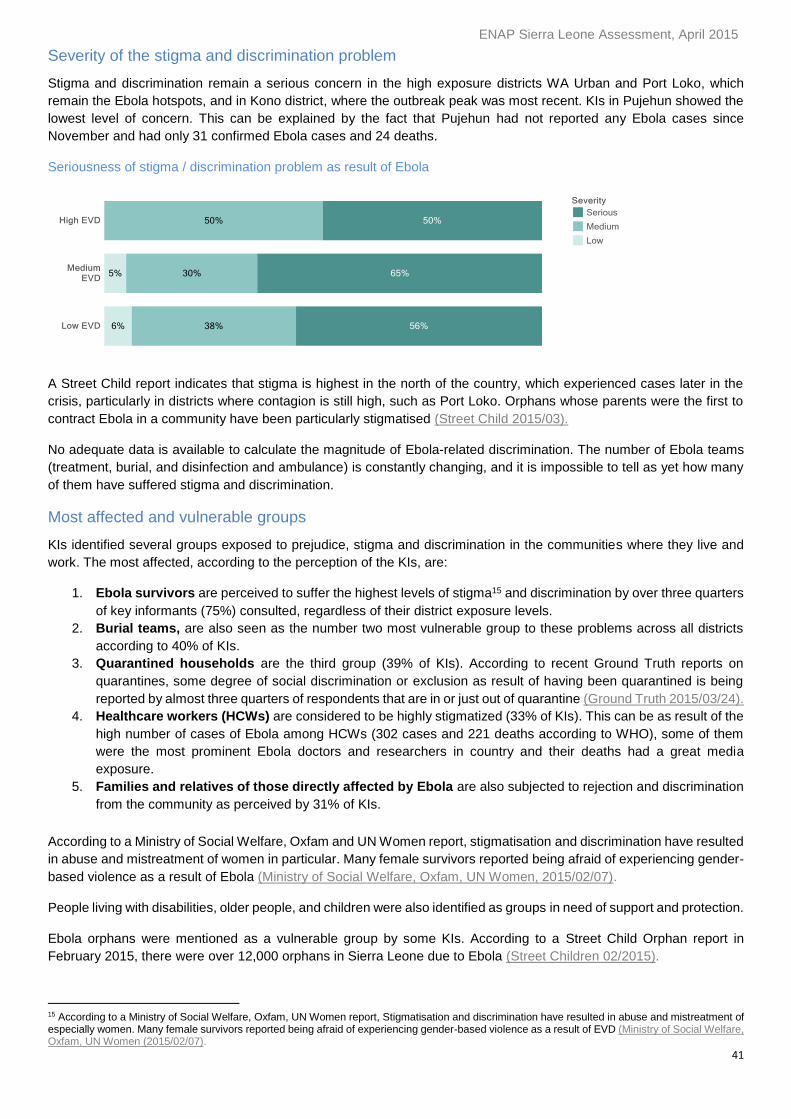
ENAP Sierra Leone Assessment, April 2015
41
Severity of the stigma and discrimination problem
Stigma and discrimination remain a serious concern in the high exposure districts WA Urban and Port Loko, which
remain the Ebola hotspots, and in Kono district, where the outbreak peak was most recent. KIs in Pujehun showed the
lowest level of concern. This can be explained by the fact that Pujehun had not reported any Ebola cases since
November and had only 31 confirmed Ebola cases and 24 deaths.
Seriousness of stigma / discrimination problem as result of Ebola
A Street Child report indicates that stigma is highest in the north of the country, which experienced cases later in the
crisis, particularly in districts where contagion is still high, such as Port Loko. Orphans whose parents were the first to
contract Ebola in a community have been particularly stigmatised (Street Child 2015/03).
No adequate data is available to calculate the magnitude of Ebola-related discrimination. The number of Ebola teams
(treatment, burial, and disinfection and ambulance) is constantly changing, and it is impossible to tell as yet how many
of them have suffered stigma and discrimination.
Most affected and vulnerable groups
KIs identified several groups exposed to prejudice, stigma and discrimination in the communities where they live and
work. The most affected, according to the perception of the KIs, are:
1. Ebola survivors are perceived to suffer the highest levels of stigma15 and discrimination by over three quarters
of key informants (75%) consulted, regardless of their district exposure levels.
2. Burial teams, are also seen as the number two most vulnerable group to these problems across all districts
according to 40% of KIs.
3. Quarantined households are the third group (39% of KIs). According to recent Ground Truth reports on
quarantines, some degree of social discrimination or exclusion as result of having been quarantined is being
reported by almost three quarters of respondents that are in or just out of quarantine (Ground Truth 2015/03/24).
4. Healthcare workers (HCWs) are considered to be highly stigmatized (33% of KIs). This can be as result of the
high number of cases of Ebola among HCWs (302 cases and 221 deaths according to WHO), some of them
were the most prominent Ebola doctors and researchers in country and their deaths had a great media
exposure.
5. Families and relatives of those directly affected by Ebola are also subjected to rejection and discrimination
from the community as perceived by 31% of KIs.
According to a Ministry of Social Welfare, Oxfam and UN Women report, stigmatisation and discrimination have resulted
in abuse and mistreatment of women in particular. Many female survivors reported being afraid of experiencing gender-
based violence as a result of Ebola (Ministry of Social Welfare, Oxfam, UN Women, 2015/02/07).
People living with disabilities, older people, and children were also identified as groups in need of support and protection.
Ebola orphans were mentioned as a vulnerable group by some KIs. According to a Street Child Orphan report in
February 2015, there were over 12,000 orphans in Sierra Leone due to Ebola (Street Children 02/2015).
15 According to a Ministry of Social Welfare, Oxfam, UN Women report, Stigmatisation and discrimination have resulted in abuse and mistreatment of especially women. Many female survivors reported being afraid of experiencing gender-based violence as a result of EVD (Ministry of Social Welfare, Oxfam, UN Women (2015/02/07).
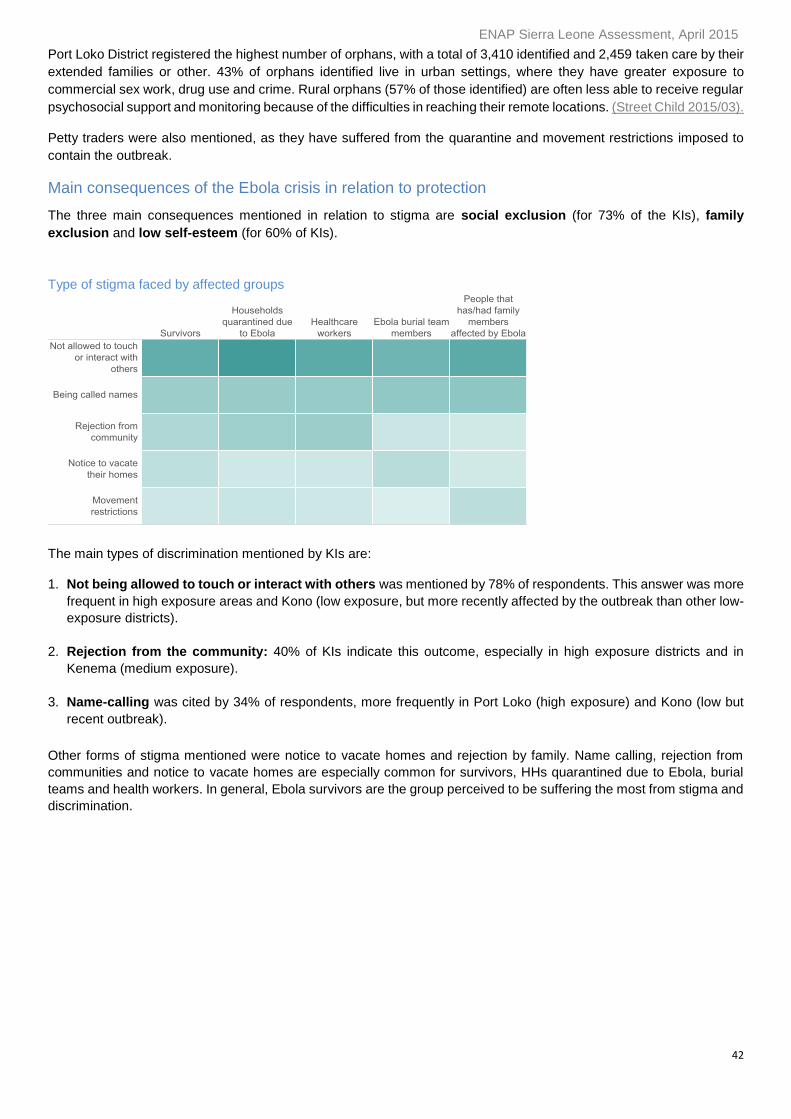
ENAP Sierra Leone Assessment, April 2015
42
Port Loko District registered the highest number of orphans, with a total of 3,410 identified and 2,459 taken care by their
extended families or other. 43% of orphans identified live in urban settings, where they have greater exposure to
commercial sex work, drug use and crime. Rural orphans (57% of those identified) are often less able to receive regular
psychosocial support and monitoring because of the difficulties in reaching their remote locations. (Street Child 2015/03).
Petty traders were also mentioned, as they have suffered from the quarantine and movement restrictions imposed to
contain the outbreak.
Main consequences of the Ebola crisis in relation to protection
The three main consequences mentioned in relation to stigma are social exclusion (for 73% of the KIs), family
exclusion and low self-esteem (for 60% of KIs).
Type of stigma faced by affected groups
The main types of discrimination mentioned by KIs are:
1. Not being allowed to touch or interact with others was mentioned by 78% of respondents. This answer was more
frequent in high exposure areas and Kono (low exposure, but more recently affected by the outbreak than other low-
exposure districts).
2. Rejection from the community: 40% of KIs indicate this outcome, especially in high exposure districts and in
Kenema (medium exposure).
3. Name-calling was cited by 34% of respondents, more frequently in Port Loko (high exposure) and Kono (low but
recent outbreak).
Other forms of stigma mentioned were notice to vacate homes and rejection by family. Name calling, rejection from
communities and notice to vacate homes are especially common for survivors, HHs quarantined due to Ebola, burial
teams and health workers. In general, Ebola survivors are the group perceived to be suffering the most from stigma and
discrimination.
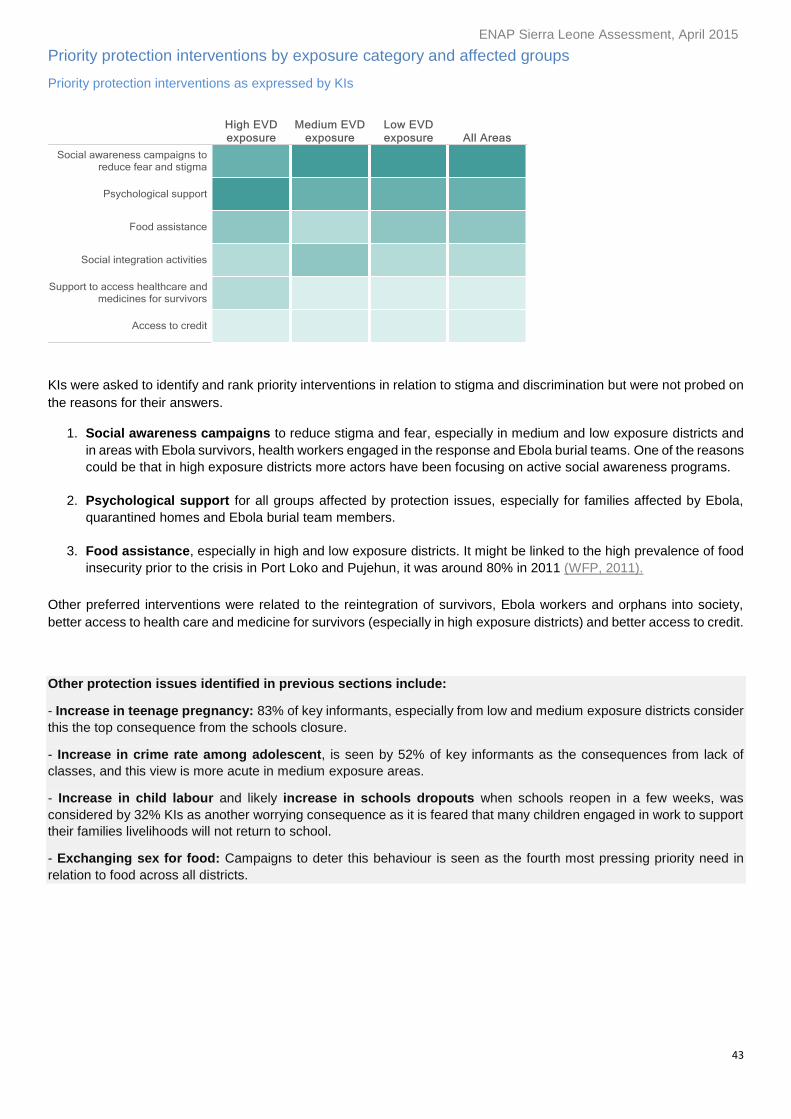
ENAP Sierra Leone Assessment, April 2015
43
Priority protection interventions by exposure category and affected groups
Priority protection interventions as expressed by KIs
KIs were asked to identify and rank priority interventions in relation to stigma and discrimination but were not probed on
the reasons for their answers.
1. Social awareness campaigns to reduce stigma and fear, especially in medium and low exposure districts and
in areas with Ebola survivors, health workers engaged in the response and Ebola burial teams. One of the reasons
could be that in high exposure districts more actors have been focusing on active social awareness programs.
2. Psychological support for all groups affected by protection issues, especially for families affected by Ebola,
quarantined homes and Ebola burial team members.
3. Food assistance, especially in high and low exposure districts. It might be linked to the high prevalence of food
insecurity prior to the crisis in Port Loko and Pujehun, it was around 80% in 2011 (WFP, 2011).
Other preferred interventions were related to the reintegration of survivors, Ebola workers and orphans into society,
better access to health care and medicine for survivors (especially in high exposure districts) and better access to credit.
Other protection issues identified in previous sections include:
- Increase in teenage pregnancy: 83% of key informants, especially from low and medium exposure districts consider
this the top consequence from the schools closure.
- Increase in crime rate among adolescent, is seen by 52% of key informants as the consequences from lack of
classes, and this view is more acute in medium exposure areas.
- Increase in child labour and likely increase in schools dropouts when schools reopen in a few weeks, was
considered by 32% KIs as another worrying consequence as it is feared that many children engaged in work to support
their families livelihoods will not return to school.
- Exchanging sex for food: Campaigns to deter this behaviour is seen as the fourth most pressing priority need in
relation to food across all districts.
ENAP Sierra Leone Assessment, April 2015
44
Prioritisation of needs across sectors
Comparison with neighbouring communities or chiefdoms
A substantial number of informants (79%) reported that the situation in their areas of residence was either similar or
better compared to neighbouring communities or chiefdoms.
The exception was Port Loko district where over half of KIs considered that their present circumstances were worse
than those in neighbouring districts and communities. This is likely because Port Loko is a high exposure and
agriculture-dependent district, which was an Ebola hotspot at the time of the data collection.
Ranking of needs
77% of the respondents ranked three priorities while 23% only ranked two. The top priority sectors were food security
and livelihoods (that received similar high ranking), followed by health and education. This ranking, provided by KI at
the end of each interview, correlates with the results of the severity scoring under each section and the estimated
number of population at risk for each section.
Analysis by exposure level reveals significant differences between high and low exposure area for healthcare, but not
for education or livelihoods. The need for healthcare is perceived to be higher in high exposure areas than in low
exposure areas. Since the Ebola toll is higher in the high exposure districts, the burden on the health facilities is
perceived as higher than in low exposure districts. The fear of infection is higher and prevent people for accessing
healthcare.
Affected vulnerable groups
As mentioned previously, the groups most directly affected by the negative consequences of Ebola are survivors,
orphans, health workers, burial teams, ambulance teams, disinfection teams, quarantined HHs and families with Ebola
cases. Women, older people, disabled people, young people and traders are considered the most vulnerable to the
cumulative effects of Ebola across the sectors.
Summary
At the end of each interview, KIs were asked the following questions:
Compare the situation in their own chiefdom with the situation in neighbouring chiefdoms and
communities.
Compare the health, food, livelihoods, and education sectors and rank the top three priority needs.
Identify and prioritise vulnerable groups needing protection.
Identify the groups most impacted by the cumulative effect of Ebola, across the sectors examined in the
interview.
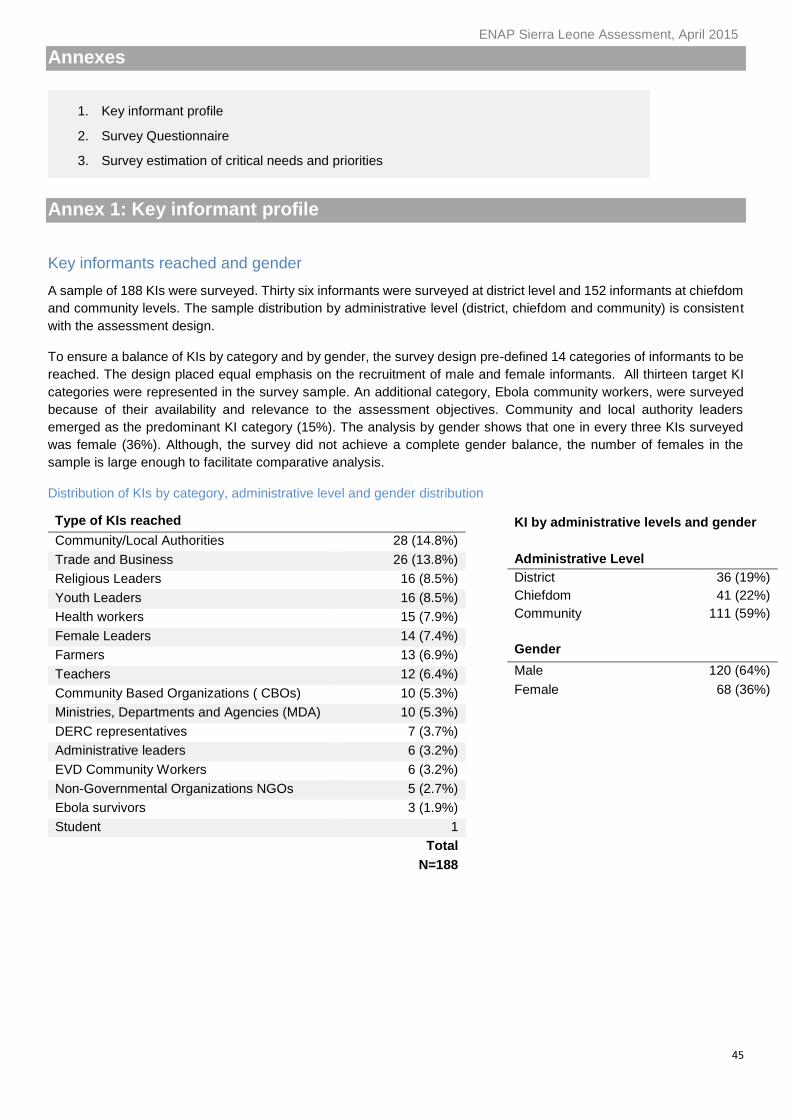
ENAP Sierra Leone Assessment, April 2015
45
Annexes
Annex 1: Key informant profile
Key informants reached and gender
A sample of 188 KIs were surveyed. Thirty six informants were surveyed at district level and 152 informants at chiefdom
and community levels. The sample distribution by administrative level (district, chiefdom and community) is consistent
with the assessment design.
To ensure a balance of KIs by category and by gender, the survey design pre-defined 14 categories of informants to be
reached. The design placed equal emphasis on the recruitment of male and female informants. All thirteen target KI
categories were represented in the survey sample. An additional category, Ebola community workers, were surveyed
because of their availability and relevance to the assessment objectives. Community and local authority leaders
emerged as the predominant KI category (15%). The analysis by gender shows that one in every three KIs surveyed
was female (36%). Although, the survey did not achieve a complete gender balance, the number of females in the
sample is large enough to facilitate comparative analysis.
Distribution of KIs by category, administrative level and gender distribution
Type of KIs reached
Community/Local Authorities 28 (14.8%)
Trade and Business 26 (13.8%)
Religious Leaders 16 (8.5%)
Youth Leaders 16 (8.5%)
Health workers 15 (7.9%)
Female Leaders 14 (7.4%)
Farmers 13 (6.9%)
Teachers 12 (6.4%)
Community Based Organizations ( CBOs) 10 (5.3%)
Ministries, Departments and Agencies (MDA) 10 (5.3%)
DERC representatives 7 (3.7%)
Administrative leaders 6 (3.2%)
EVD Community Workers 6 (3.2%)
Non-Governmental Organizations NGOs 5 (2.7%)
Ebola survivors 3 (1.9%)
Student 1
Total
N=188
KI by administrative levels and gender
Administrative Level
District 36 (19%)
Chiefdom 41 (22%)
Community 111 (59%)
Gender
Male 120 (64%)
Female 68 (36%)
1. Key informant profile
2. Survey Questionnaire
3. Survey estimation of critical needs and priorities
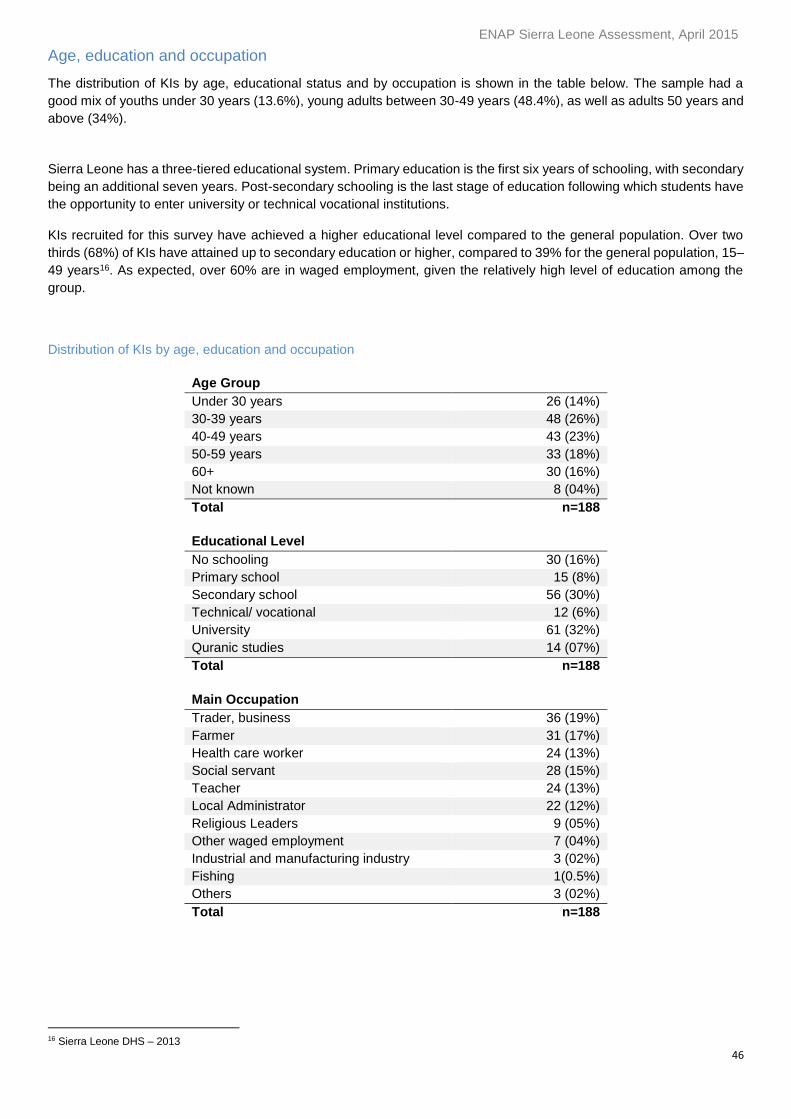
ENAP Sierra Leone Assessment, April 2015
46
Age, education and occupation
The distribution of KIs by age, educational status and by occupation is shown in the table below. The sample had a
good mix of youths under 30 years (13.6%), young adults between 30-49 years (48.4%), as well as adults 50 years and
above (34%).
Sierra Leone has a three-tiered educational system. Primary education is the first six years of schooling, with secondary
being an additional seven years. Post-secondary schooling is the last stage of education following which students have
the opportunity to enter university or technical vocational institutions.
KIs recruited for this survey have achieved a higher educational level compared to the general population. Over two
thirds (68%) of KIs have attained up to secondary education or higher, compared to 39% for the general population, 15–
49 years16. As expected, over 60% are in waged employment, given the relatively high level of education among the
group.
Distribution of KIs by age, education and occupation
Age Group
Under 30 years 30 years 26 (14%)
30-39 years 48 (26%)
40-49 years 43 (23%)
50-59 years 33 (18%)
60+ 30 (16%)
Not known 8 (04%)
Total n=188
Educational Level
No schooling 30 (16%)
Primary school 15 (8%)
Secondary school 56 (30%)
Technical/ vocational 12 (6%)
University 61 (32%)
Quranic studies 14 (07%)
Total n=188
Main Occupation
Trader, business 36 (19%)
Farmer 31 (17%)
Health care worker 24 (13%)
Social servant 28 (15%)
Teacher 24 (13%)
Local Administrator 22 (12%)
Religious Leaders 9 (05%)
Other waged employment 7 (04%)
Industrial and manufacturing industry 3 (02%)
Fishing 1(0.5%)
Others 3 (02%)
Total n=188
16 Sierra Leone DHS – 2013
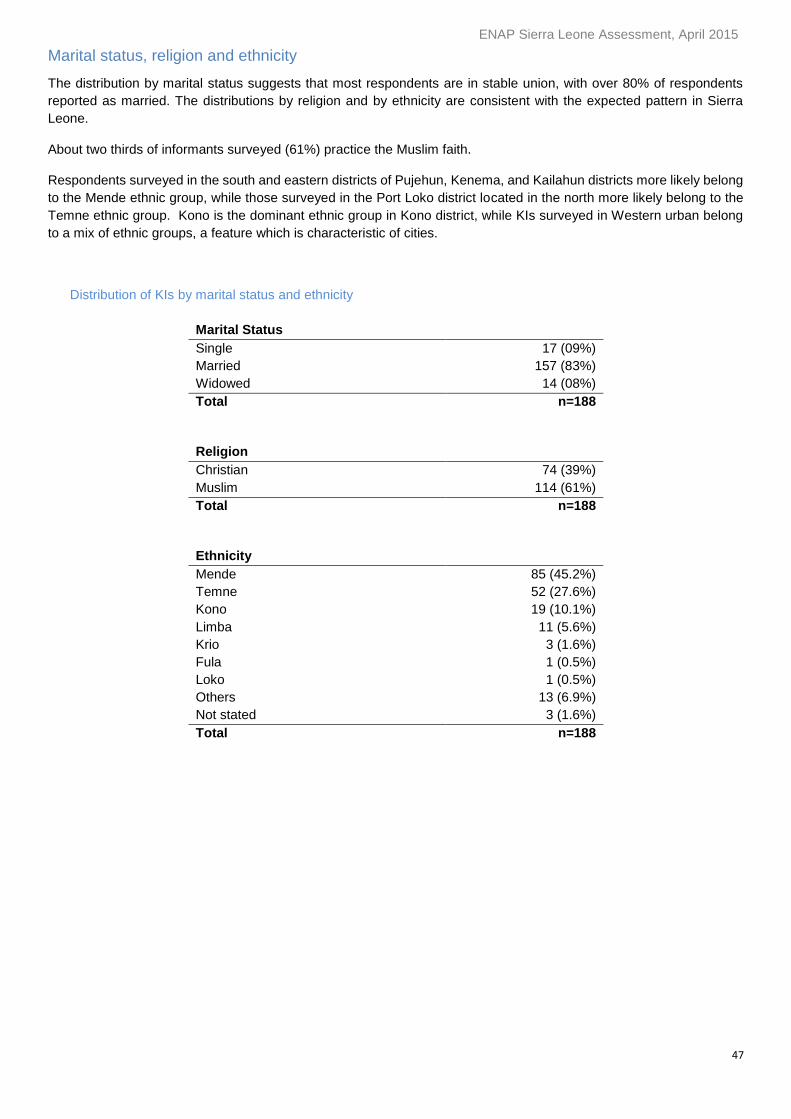
ENAP Sierra Leone Assessment, April 2015
47
Marital status, religion and ethnicity
The distribution by marital status suggests that most respondents are in stable union, with over 80% of respondents
reported as married. The distributions by religion and by ethnicity are consistent with the expected pattern in Sierra
Leone.
About two thirds of informants surveyed (61%) practice the Muslim faith.
Respondents surveyed in the south and eastern districts of Pujehun, Kenema, and Kailahun districts more likely belong
to the Mende ethnic group, while those surveyed in the Port Loko district located in the north more likely belong to the
Temne ethnic group. Kono is the dominant ethnic group in Kono district, while KIs surveyed in Western urban belong
to a mix of ethnic groups, a feature which is characteristic of cities.
Distribution of KIs by marital status and ethnicity
Marital Status
Single 17 (09%)
Married 157 (83%)
Widowed 14 (08%)
Total n=188
Religion
Christian 74 (39%)
Muslim 114 (61%)
Total n=188
Ethnicity
Mende 85 (45.2%)
Temne 52 (27.6%)
Kono 19 (10.1%)
Limba 11 (5.6%)
Krio 3 (1.6%)
Fula 1 (0.5%)
Loko 1 (0.5%)
Others 13 (6.9%)
Not stated 3 (1.6%)
Total n=188
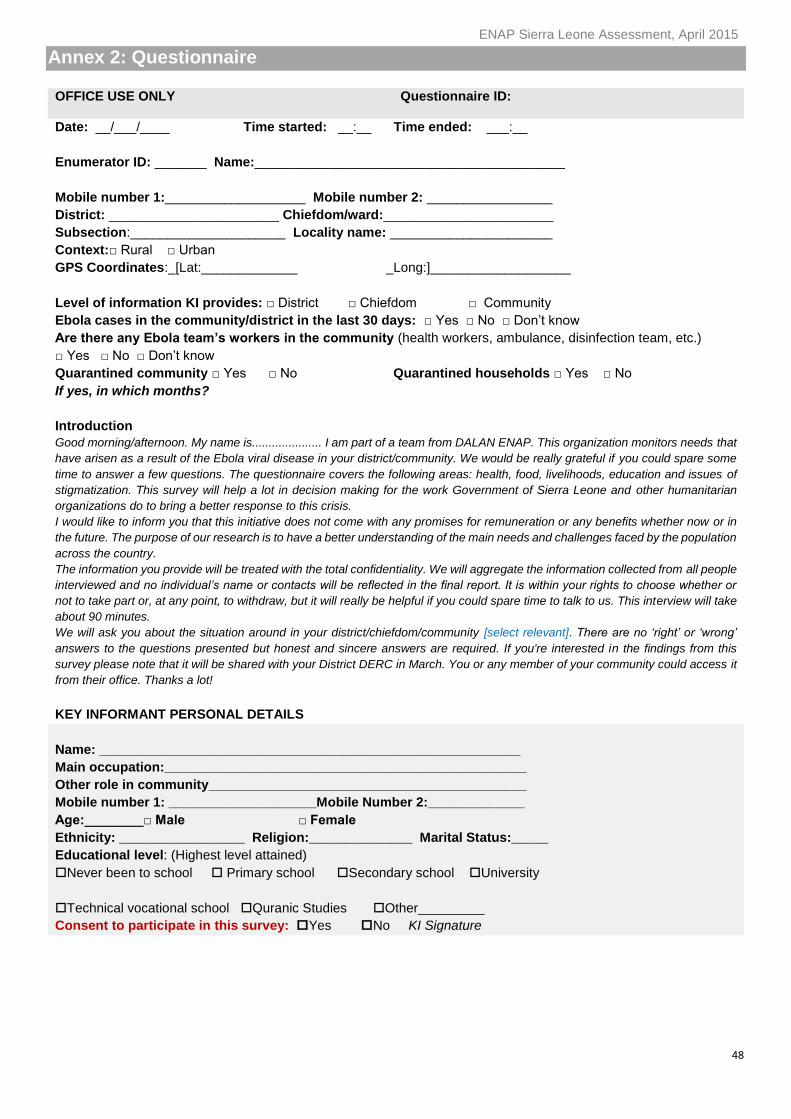
ENAP Sierra Leone Assessment, April 2015
48
Annex 2: Questionnaire
OFFICE USE ONLY Questionnaire ID:
Date: __/___/____ Time started: __:__ Time ended: ___:__
Enumerator ID: _______ Name:__________________________________________
Mobile number 1:___________________ Mobile number 2: _________________
District: _______________________ Chiefdom/ward:_______________________
Subsection:_____________________ Locality name: ______________________
Context:□ Rural □ Urban
GPS Coordinates:_[Lat:_____________ _Long:]___________________
Level of information KI provides: □ District □ Chiefdom □ Community
Ebola cases in the community/district in the last 30 days: □ Yes □ No □ Don’t know
Are there any Ebola team’s workers in the community (health workers, ambulance, disinfection team, etc.)
□ Yes □ No □ Don’t know
Quarantined community □ Yes □ No Quarantined households □ Yes □ No
If yes, in which months?
Introduction
Good morning/afternoon. My name is..................... I am part of a team from DALAN ENAP. This organization monitors needs that
have arisen as a result of the Ebola viral disease in your district/community. We would be really grateful if you could spare some
time to answer a few questions. The questionnaire covers the following areas: health, food, livelihoods, education and issues of
stigmatization. This survey will help a lot in decision making for the work Government of Sierra Leone and other humanitarian
organizations do to bring a better response to this crisis.
I would like to inform you that this initiative does not come with any promises for remuneration or any benefits whether now or in
the future. The purpose of our research is to have a better understanding of the main needs and challenges faced by the population
across the country.
The information you provide will be treated with the total confidentiality. We will aggregate the information collected from all people
interviewed and no individual’s name or contacts will be reflected in the final report. It is within your rights to choose whether or
not to take part or, at any point, to withdraw, but it will really be helpful if you could spare time to talk to us. This interview will take
about 90 minutes.
We will ask you about the situation around in your district/chiefdom/community [select relevant]. There are no ‘right’ or ‘wrong’
answers to the questions presented but honest and sincere answers are required. If you're interested in the findings from this
survey please note that it will be shared with your District DERC in March. You or any member of your community could access it
from their office. Thanks a lot!
KEY INFORMANT PERSONAL DETAILS
Name: _________________________________________________________
Main occupation:_________________________________________________
Other role in community___________________________________________
Mobile number 1: ____________________Mobile Number 2:_____________
Age:________□ Male □ Female
Ethnicity: _________________ Religion:______________ Marital Status:_____
Educational level: (Highest level attained)
Never been to school Primary school Secondary school University
Technical vocational school Quranic Studies Other_________
Consent to participate in this survey: Yes No KI Signature
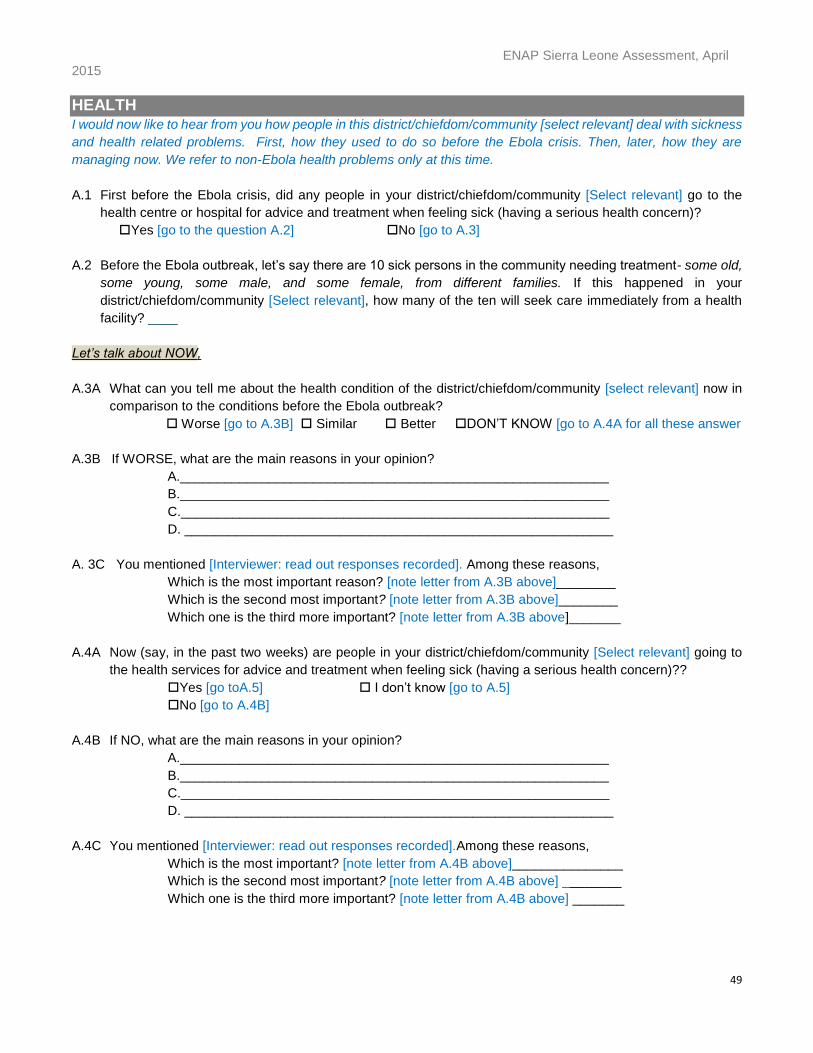
ENAP Sierra Leone Assessment, April 2015
49
HEALTH I would now like to hear from you how people in this district/chiefdom/community [select relevant] deal with sickness
and health related problems. First, how they used to do so before the Ebola crisis. Then, later, how they are
managing now. We refer to non-Ebola health problems only at this time.
A.1 First before the Ebola crisis, did any people in your district/chiefdom/community [Select relevant] go to the
health centre or hospital for advice and treatment when feeling sick (having a serious health concern)?
Yes [go to the question A.2] No [go to A.3]
A.2 Before the Ebola outbreak, let’s say there are 10 sick persons in the community needing treatment- some old,
some young, some male, and some female, from different families. If this happened in your
district/chiefdom/community [Select relevant], how many of the ten will seek care immediately from a health
facility? ____
Let’s talk about NOW,
A.3A What can you tell me about the health condition of the district/chiefdom/community [select relevant] now in
comparison to the conditions before the Ebola outbreak?
Worse [go to A.3B] Similar Better DON’T KNOW [go to A.4A for all these answer
A.3B If WORSE, what are the main reasons in your opinion?
A.__________________________________________________________
B.__________________________________________________________
C.__________________________________________________________
D. __________________________________________________________
A. 3C You mentioned [Interviewer: read out responses recorded]. Among these reasons,
Which is the most important reason? [note letter from A.3B above]________
Which is the second most important? [note letter from A.3B above]________
Which one is the third more important? [note letter from A.3B above]_______
A.4A Now (say, in the past two weeks) are people in your district/chiefdom/community [Select relevant] going to
the health services for advice and treatment when feeling sick (having a serious health concern)??
Yes [go toA.5] I don’t know [go to A.5]
No [go to A.4B]
A.4B If NO, what are the main reasons in your opinion?
A.__________________________________________________________
B.__________________________________________________________
C.__________________________________________________________
D. __________________________________________________________
A.4C You mentioned [Interviewer: read out responses recorded].Among these reasons,
Which is the most important? [note letter from A.4B above]_______________
Which is the second most important? [note letter from A.4B above] ________
Which one is the third more important? [note letter from A.4B above] _______
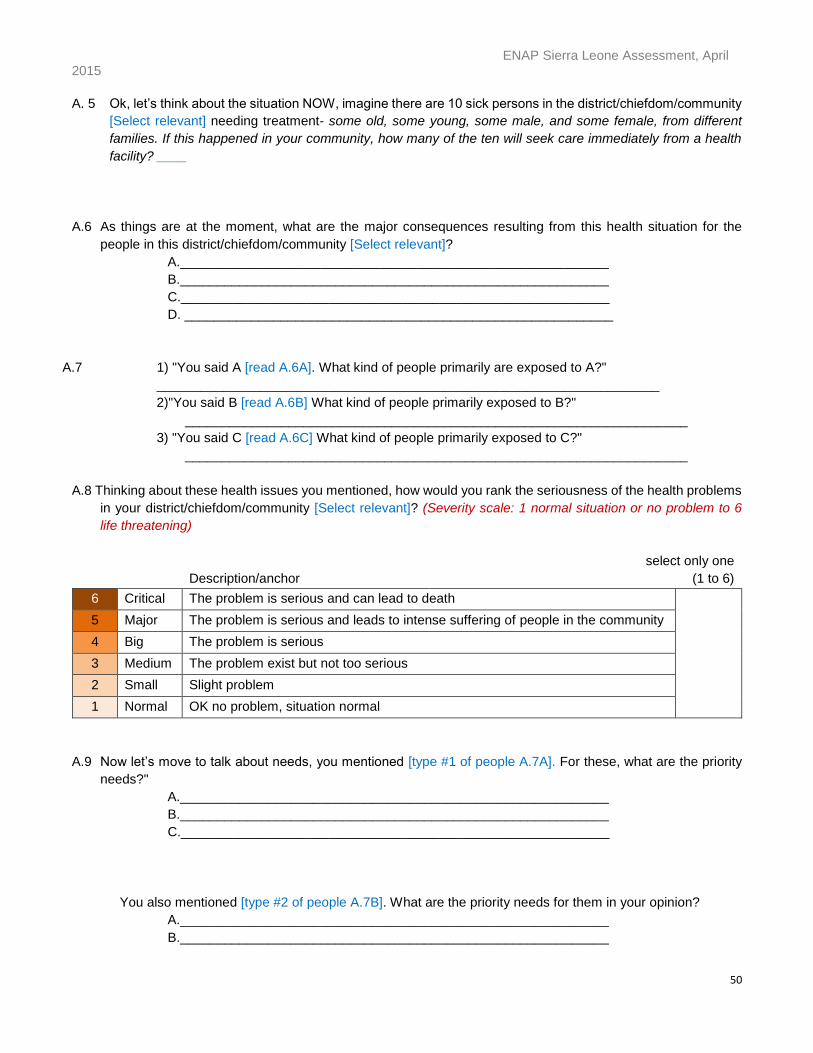
ENAP Sierra Leone Assessment, April 2015
50
A. 5 Ok, let’s think about the situation NOW, imagine there are 10 sick persons in the district/chiefdom/community
[Select relevant] needing treatment- some old, some young, some male, and some female, from different
families. If this happened in your community, how many of the ten will seek care immediately from a health
facility? ____
A.6 As things are at the moment, what are the major consequences resulting from this health situation for the
people in this district/chiefdom/community [Select relevant]?
A.__________________________________________________________
B.__________________________________________________________
C.__________________________________________________________
D. __________________________________________________________
A.7 1) "You said A [read A.6A]. What kind of people primarily are exposed to A?"
____________________________________________________________________
2)"You said B [read A.6B] What kind of people primarily exposed to B?"
____________________________________________________________________
3) "You said C [read A.6C] What kind of people primarily exposed to C?"
____________________________________________________________________
A.8 Thinking about these health issues you mentioned, how would you rank the seriousness of the health problems
in your district/chiefdom/community [Select relevant]? (Severity scale: 1 normal situation or no problem to 6
life threatening)
Description/anchor
select only one
(1 to 6)
6 Critical The problem is serious and can lead to death
5 Major The problem is serious and leads to intense suffering of people in the community
4 Big The problem is serious
3 Medium The problem exist but not too serious
2 Small Slight problem
1 Normal OK no problem, situation normal
A.9 Now let’s move to talk about needs, you mentioned [type #1 of people A.7A]. For these, what are the priority
needs?"
A.__________________________________________________________
B.__________________________________________________________
C.__________________________________________________________
You also mentioned [type #2 of people A.7B]. What are the priority needs for them in your opinion?
A.__________________________________________________________
B.__________________________________________________________
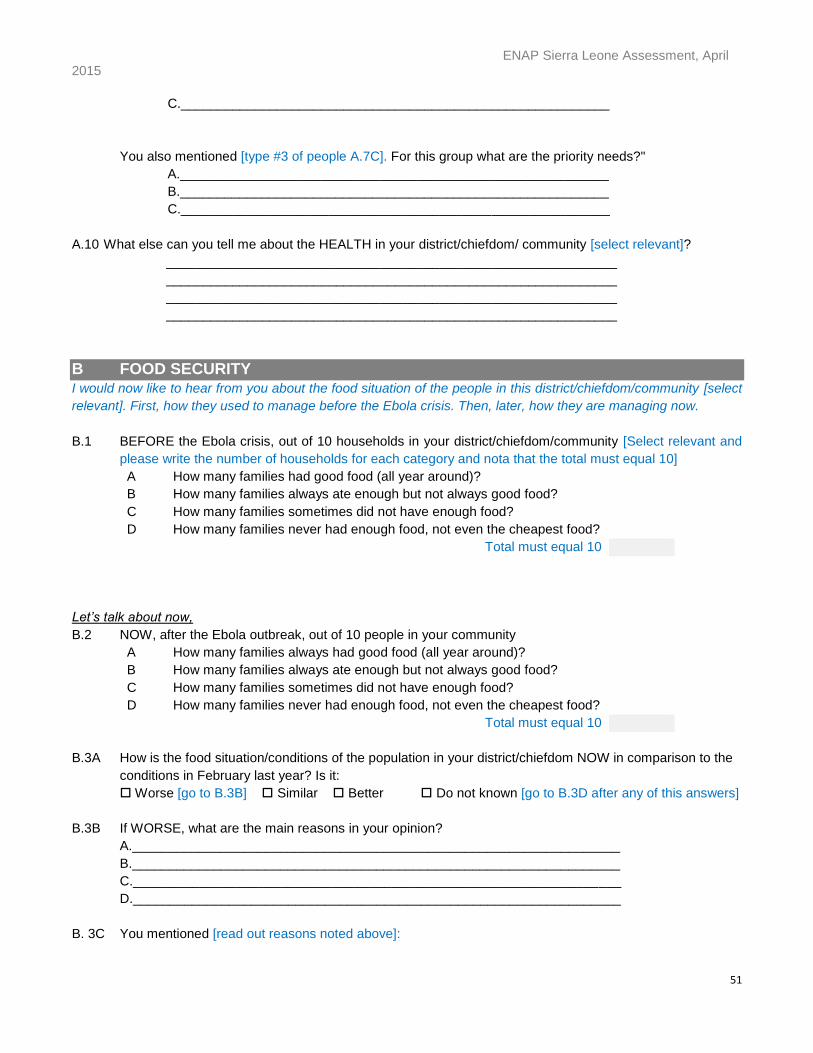
ENAP Sierra Leone Assessment, April 2015
51
C.__________________________________________________________
You also mentioned [type #3 of people A.7C]. For this group what are the priority needs?"
A.__________________________________________________________
B.__________________________________________________________
C.__________________________________________________________
A.10 What else can you tell me about the HEALTH in your district/chiefdom/ community [select relevant]?
_____________________________________________________________
_____________________________________________________________
_____________________________________________________________
_____________________________________________________________
B FOOD SECURITY I would now like to hear from you about the food situation of the people in this district/chiefdom/community [select
relevant]. First, how they used to manage before the Ebola crisis. Then, later, how they are managing now.
B.1 BEFORE the Ebola crisis, out of 10 households in your district/chiefdom/community [Select relevant and
please write the number of households for each category and nota that the total must equal 10]
A How many families had good food (all year around)?
B How many families always ate enough but not always good food?
C How many families sometimes did not have enough food?
D How many families never had enough food, not even the cheapest food?
Total must equal 10
Let’s talk about now,
B.2 NOW, after the Ebola outbreak, out of 10 people in your community
A How many families always had good food (all year around)?
B How many families always ate enough but not always good food?
C How many families sometimes did not have enough food?
D How many families never had enough food, not even the cheapest food?
Total must equal 10
B.3A How is the food situation/conditions of the population in your district/chiefdom NOW in comparison to the
conditions in February last year? Is it:
Worse [go to B.3B] Similar Better Do not known [go to B.3D after any of this answers]
B.3B If WORSE, what are the main reasons in your opinion?
A.__________________________________________________________________
B.__________________________________________________________________
C.__________________________________________________________________
D.__________________________________________________________________
B. 3C You mentioned [read out reasons noted above]:
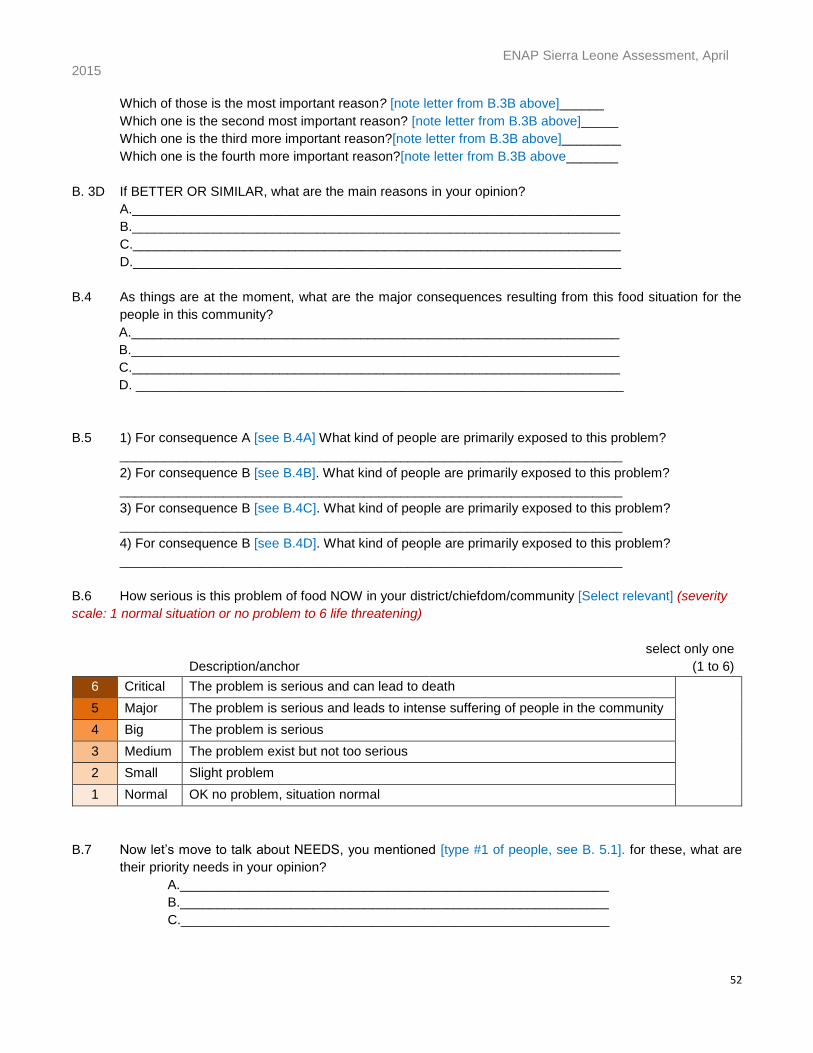
ENAP Sierra Leone Assessment, April 2015
52
Which of those is the most important reason? [note letter from B.3B above]______
Which one is the second most important reason? [note letter from B.3B above]_____
Which one is the third more important reason?[note letter from B.3B above]________
Which one is the fourth more important reason?[note letter from B.3B above_______
B. 3D If BETTER OR SIMILAR, what are the main reasons in your opinion?
A.__________________________________________________________________
B.__________________________________________________________________
C.__________________________________________________________________
D.__________________________________________________________________
B.4 As things are at the moment, what are the major consequences resulting from this food situation for the
people in this community?
A.__________________________________________________________________
B.__________________________________________________________________
C.__________________________________________________________________
D. __________________________________________________________________
B.5 1) For consequence A [see B.4A] What kind of people are primarily exposed to this problem?
____________________________________________________________________
2) For consequence B [see B.4B]. What kind of people are primarily exposed to this problem?
____________________________________________________________________
3) For consequence B [see B.4C]. What kind of people are primarily exposed to this problem?
____________________________________________________________________
4) For consequence B [see B.4D]. What kind of people are primarily exposed to this problem?
____________________________________________________________________
B.6 How serious is this problem of food NOW in your district/chiefdom/community [Select relevant] (severity
scale: 1 normal situation or no problem to 6 life threatening)
Description/anchor
select only one
(1 to 6)
6 Critical The problem is serious and can lead to death
5 Major The problem is serious and leads to intense suffering of people in the community
4 Big The problem is serious
3 Medium The problem exist but not too serious
2 Small Slight problem
1 Normal OK no problem, situation normal
B.7 Now let’s move to talk about NEEDS, you mentioned [type #1 of people, see B. 5.1]. for these, what are
their priority needs in your opinion?
A.__________________________________________________________
B.__________________________________________________________
C.__________________________________________________________
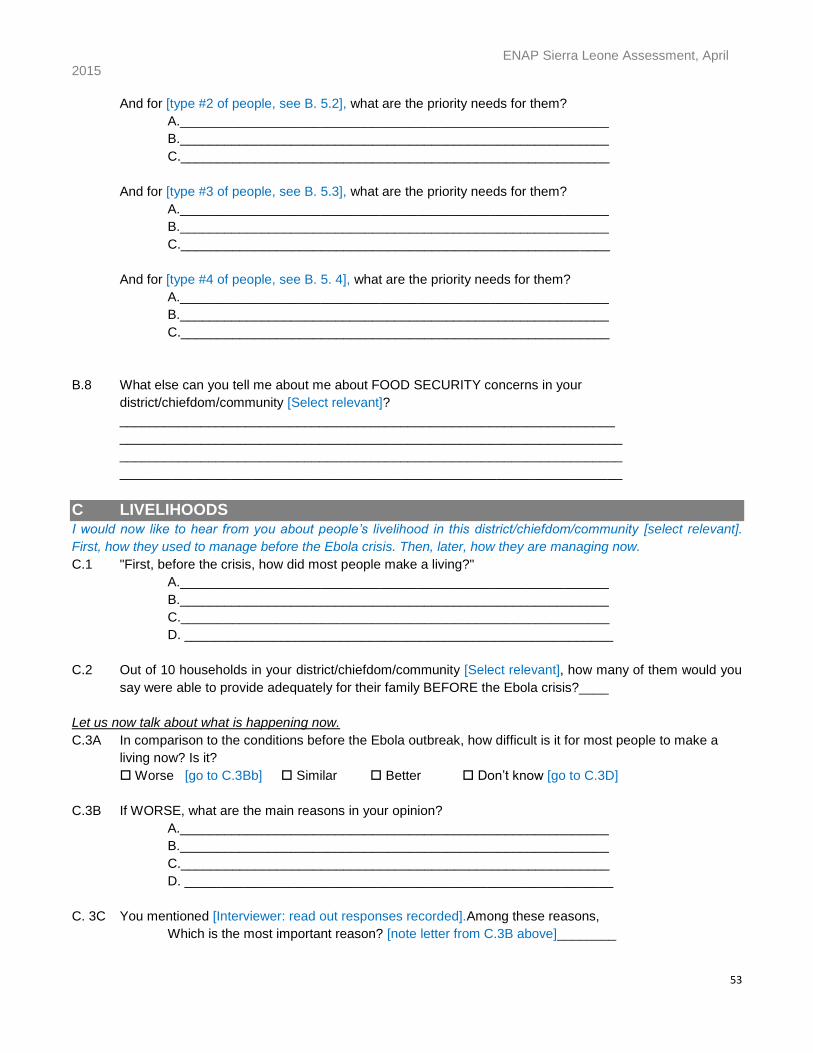
ENAP Sierra Leone Assessment, April 2015
53
And for [type #2 of people, see B. 5.2], what are the priority needs for them?
A.__________________________________________________________
B.__________________________________________________________
C.__________________________________________________________
And for [type #3 of people, see B. 5.3], what are the priority needs for them?
A.__________________________________________________________
B.__________________________________________________________
C.__________________________________________________________
And for [type #4 of people, see B. 5. 4], what are the priority needs for them?
A.__________________________________________________________
B.__________________________________________________________
C.__________________________________________________________
B.8 What else can you tell me about me about FOOD SECURITY concerns in your
district/chiefdom/community [Select relevant]?
___________________________________________________________________
____________________________________________________________________
____________________________________________________________________
____________________________________________________________________
C LIVELIHOODS I would now like to hear from you about people’s livelihood in this district/chiefdom/community [select relevant].
First, how they used to manage before the Ebola crisis. Then, later, how they are managing now.
C.1 "First, before the crisis, how did most people make a living?"
A.__________________________________________________________
B.__________________________________________________________
C.__________________________________________________________
D. __________________________________________________________
C.2 Out of 10 households in your district/chiefdom/community [Select relevant], how many of them would you
say were able to provide adequately for their family BEFORE the Ebola crisis?____
Let us now talk about what is happening now.
C.3A In comparison to the conditions before the Ebola outbreak, how difficult is it for most people to make a
living now? Is it?
Worse [go to C.3Bb] Similar Better Don’t know [go to C.3D]
C.3B If WORSE, what are the main reasons in your opinion?
A.__________________________________________________________
B.__________________________________________________________
C.__________________________________________________________
D. __________________________________________________________
C. 3C You mentioned [Interviewer: read out responses recorded].Among these reasons,
Which is the most important reason? [note letter from C.3B above]________
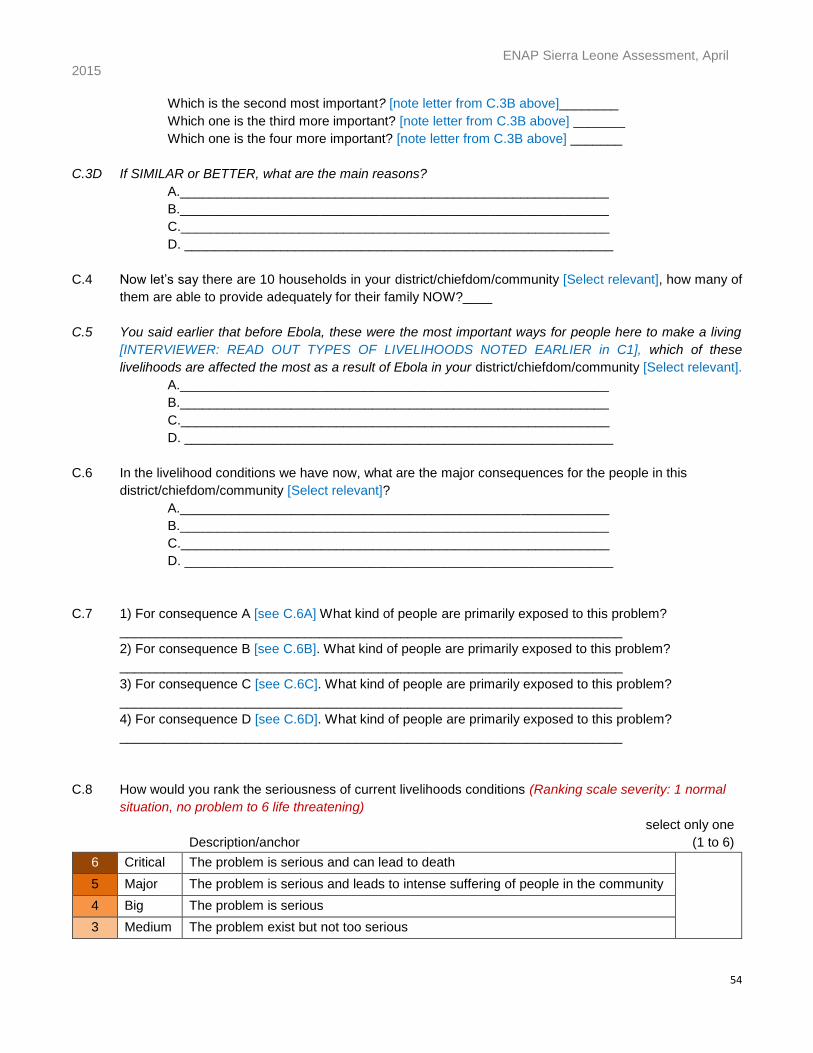
ENAP Sierra Leone Assessment, April 2015
54
Which is the second most important? [note letter from C.3B above]________
Which one is the third more important? [note letter from C.3B above] _______
Which one is the four more important? [note letter from C.3B above] _______
C.3D If SIMILAR or BETTER, what are the main reasons?
A.__________________________________________________________
B.__________________________________________________________
C.__________________________________________________________
D. __________________________________________________________
C.4 Now let’s say there are 10 households in your district/chiefdom/community [Select relevant], how many of
them are able to provide adequately for their family NOW?____
C.5 You said earlier that before Ebola, these were the most important ways for people here to make a living
[INTERVIEWER: READ OUT TYPES OF LIVELIHOODS NOTED EARLIER in C1], which of these
livelihoods are affected the most as a result of Ebola in your district/chiefdom/community [Select relevant].
A.__________________________________________________________
B.__________________________________________________________
C.__________________________________________________________
D. __________________________________________________________
C.6 In the livelihood conditions we have now, what are the major consequences for the people in this
district/chiefdom/community [Select relevant]?
A.__________________________________________________________
B.__________________________________________________________
C.__________________________________________________________
D. __________________________________________________________
C.7 1) For consequence A [see C.6A] What kind of people are primarily exposed to this problem?
____________________________________________________________________
2) For consequence B [see C.6B]. What kind of people are primarily exposed to this problem?
____________________________________________________________________
3) For consequence C [see C.6C]. What kind of people are primarily exposed to this problem?
____________________________________________________________________
4) For consequence D [see C.6D]. What kind of people are primarily exposed to this problem?
____________________________________________________________________
C.8 How would you rank the seriousness of current livelihoods conditions (Ranking scale severity: 1 normal
situation, no problem to 6 life threatening)
Description/anchor
select only one
(1 to 6)
6 Critical The problem is serious and can lead to death
5 Major The problem is serious and leads to intense suffering of people in the community
4 Big The problem is serious
3 Medium The problem exist but not too serious
ENAP Sierra Leone Assessment, April 2015
55
2 Small Slight problem
1 Normal OK no problem, situation normal
C.9 Now let’s move to talk about needs, in your opinion to help people make a living what should be done with
the greatest urgency?
A.__________________________________________________________
B.__________________________________________________________
C.__________________________________________________________
D.__________________________________________________________
C10 What else can you tell me about me about the situation of livelihoods in your district/chiefdom/community
[Select relevant]?
_________________________________________________________________
____________________________________________________________________
____________________________________________________________________
____________________________________________________________________
D EDUCATION
I would now like to hear from you how people in this district/chiefdom/community [select relevant] deal with schooling
of children, first how this was before the Ebola crisis. Then, later, what is happening now.
D.1 First before the Ebola crisis, did any children of primary school age in your district/chiefdom/community
[Select relevant] go to school?
Yes [go to D.2] No [go to D.3]
D.2 You said children did go to primary school. In your experience, for every ten children of that age, how many
would go to school BEFORE the Ebola outbreak? _______
Let us now talk about what is happening now.
D.3A How is the education situation/conditions of the children in your district/ chiefdom/community [Select
relevant] NOW in comparison to the conditions last February 2014? Is it
Worse [go to D.3B] Similar Better Don’t know [go to D.4]
D.3B If WORSE, what are the main reasons in your opinion?
A.__________________________________________________________
B.__________________________________________________________
C.__________________________________________________________
D.__________________________________________________________
D. 3C You mentioned [Interviewer: read out responses recorded in D.3B].Among these reasons,
Which is the most important reason? [note letter from C.3B above]________
Which is the second most important? [note letter from C.3B above]________
Which one is the third more important? [note letter from C.3B above] _______
Which one is the fourth more important? [note letter from C.3B above]_
ENAP Sierra Leone Assessment, April 2015
56
D.4a NOW, are there any primary school children in your district/chiefdom/ community [Select relevant] going
to school? Yes [Go to D.5] No [Go to D.4B]
D.4b If NO, what are the main reasons?
A.__________________________________________________________
B.__________________________________________________________
C.__________________________________________________________
D. __________________________________________________________
D. 4C You mentioned [Interviewer: read out responses recorded].Among these reasons,
Which is the most important reason? [note letter from D.3B above]________
Which is the second most important? [note letter from D.3B above]________
Which one is the third more important? [note letter from D.3B above] _______
Which one is the fourth more important? [note letter from D.3B above]______
D.5 What is your impression NOW. Out of ten children of primary school age, how many are going to school
NOW?"____
D.6 In this primary education conditions that we have now, what are the major consequences for the children
of primary school age in this district/chiefdom/ community [Select relevant]?
A.____________________________________________________________
B.____________________________________________________________
C.____________________________________________________________
D. ____________________________________________________________
D.7 "You said A. What kind of children primarily are exposed to A?"
___________________________________________________________________
"You said B. What kind of children primarily are exposed to B?"
____________________________________________________________________
"You said C. What kind of children primarily are exposed to C?"
____________________________________________________________________
D.8 How would you rank the seriousness of this educational problem in your district/chiefdom/community
[Select relevant]? (Ranking scale severity: 1 normal situation or no problem to 6 life threatening)
Description/anchor
select only one
(1 to 6)
6 Critical The problem is serious and can have a negative long term impact on children’s
development, jeopardizing their future
5 Major The problem is serious and can lead to temporal intense disruption of children’s
educational development
4 Big The problem is serious
3 Medium The problem exist but not too serious
2 Small Slight problem
1 Normal OK no problem, situation normal
D.9 Now let’s move to talk about needs: in your opinion, to improve children's schooling, what should be done
with the greatest urgency?
A.__________________________________________________________
ENAP Sierra Leone Assessment, April 2015
57
B.__________________________________________________________
C.__________________________________________________________
D.__________________________________________________________
D10 What else can you tell me about me about the status of education in your community/chiefdom/district?
___________________________________________________________________
____________________________________________________________________
____________________________________________________________________
E PROTECTION: DISCRIMINATION AND STIGMA
Let’s talk about the actual situation now, and what are the main problems faced by some of the people or groups of
people in your district/chiefdom/community [select relevant] as a result of being identified with Ebola or Ebola related
activities (Ebola infected, quarantined households, health workers, burial teams, ambulance crew, etc.)
E.1 Are people or groups in your district/chiefdom/community [Select relevant] being discriminated against or
stigmatized as a result of Ebola?
Yes [go to E.2] No [go to FINAL SECTION F] I don’t know [go to E.10]
E.2 Which groups are being stigmatized/discriminated against at the moment?
A.__________________________________________________________
B.__________________________________________________________
C.__________________________________________________________
D. __________________________________________________________
E.3 What types of discrimination or stigmatization do they suffer?
A.__________________________________________________________
B.__________________________________________________________
C.__________________________________________________________
D. __________________________________________________________
E.4 And what are the main reasons for this in your opinion?
A.__________________________________________________________
B.__________________________________________________________
C.__________________________________________________________
D. __________________________________________________________
E.5 1) You said A[see E.3.A]. What kind of people/group are primarily exposed to A?
___________________________________________________________________
2) You said B[see E.3.D].What kind of people/group are primarily exposed to B?
___________________________________________________________________
3) You said C[see E.3.C].. What kind of people/group primarily are exposed to C?
____________________________________________________________________
4) You said C[see E.3.D]. What kind of people/group primarily are exposed to D?
ENAP Sierra Leone Assessment, April 2015
58
____________________________________________________________________
E.6 In these conditions, what are the major consequences for the EVD affected people and their families?
A.____________________________________________________________
B.____________________________________________________________
C.____________________________________________________________
D.____________________________________________________________
E.7 And for health workers and Ebola teams members in this district/chiefdom?
A.____________________________________________________________
B.____________________________________________________________
C.____________________________________________________________
D.____________________________________________________________
E.8 How would you rank the seriousness of this problem in your district/chiefdom/ community [Select relevant]
? (Ranking scale severity: 1 normal situation or no problem to 6 life threatening)
Description/anchor
select only one
(1 to 6)
6 Critical The problem is serious and can lead to death
5 Major The problem is serious and leads to intense suffering of people in the community
4 Big The problem is serious
3 Medium The problem exist but not too serious
2 Small Slight problem
1 Normal OK no problem, situation normal
E.9 You mentioned [type #1 of people, see E.2.A]. For these, what are the priority needs?
A.____________________________________________________________
B.____________________________________________________________
C.__________________________________________________________
You also mentioned [type #2 of people, see E.2.B]. For them, what are the priority needs?
A.___________________________________________________________
B.___________________________________________________________
C.___________________________________________________________
You also mentioned [type #3 of people, see E.2.C]. For them, what are the priority needs?"
A.___________________________________________________________
B.___________________________________________________________
C.___________________________________________________________
You also mentioned [type #4of people, see E.2.D]. For them, what are the priority needs?"
A.___________________________________________________________
B.___________________________________________________________
C.___________________________________________________________
ENAP Sierra Leone Assessment, April 2015
59
E.10 What else can you tell me about the situation in your community in relation to protection issues?
___________________________________________________________________
____________________________________________________________________
____________________________________________________________________
F SUMMARY OVERVIEW ACROSS SECTORS
F.1 Based on our discussion, how would you say is the situation in your district/chiefdom/community [Select
relevant] around you? Is it? Worse Similar Better Don’t know
F.2 We talked about needs for Healthcare, food, livelihoods, and schools. Among those four, which is the
biggest need? PLEASE PROBE TO GET MORE SPECIFIC INFORMATION
A. Which the biggest need? _________________________________________
B. Second biggest need ____________________________________________
C. Third more important need________________________________________
F.3A Apart from stigma and discrimination against Ebola survivors, their relatives, Ebola teams and health
workers what other protection concerns exist at the district/chiefdom/community [Select relevant] level? [If
no answer, repeat the questions with a neutral] Can you think of anything else? Anybody who needs special
protection? [If nothing comes, well, then nothing is to be noted].
A.____________________________________________________________
B.____________________________________________________________
C.____________________________________________________________
F.3b Of these concerns mentioned [See F.3A] which are the most important in your opinion
A. Most important__________________________________________________
B. Second most important___________________________________________
C. Third more important_____________________________________________
F.4 Considering all the sectors we have talked about (health, food, livelihoods, education, and stigma) in your
opinion which are the categories of people that have suffered the most since the beginning of the
epidemic (rank top three):
A. Most impacted__________________________________________________
B. Second most impacted___________________________________________
C. Third more impacted_____________________________________________
F. 5 Is there anything else that you wanted to mention in relation with the impact of Ebola in your
district/chiefdom/community [Select relevant] that we have not discussed?
___________________________________________________________________
____________________________________________________________________
___________________________________________________________________
____________________________________________________________________
____________________________________________________________________
ENAP Sierra Leone Assessment, April 2015
60
We highly appreciate your time and participation in this survey. If we were to need further clarification during the
data entry process we would get in touch with you if you have provided consent and contact details at the beginning
of this interview. Additionally, if you have consented you might be contacted again in future monitoring surveys.
Many thanks!
Consent to participate in future surveys: Yes No
KI Signature_________________________________________________
KII CHECKLIST
This interview was fully completed
This interview was partially completed and replaced
This interview was not completed, and was replaced
This interview was not completed or replaced
This interview has been fully coded
This interview has not been fully coded
Code sheet attached to interview YES
Missing
If code sheet is not attached please explain why
Quality issues with this interview (provide details)
Field notes: Logistics, challenges, recommendations for the next visit, etc.
Observations during the field trip to this community
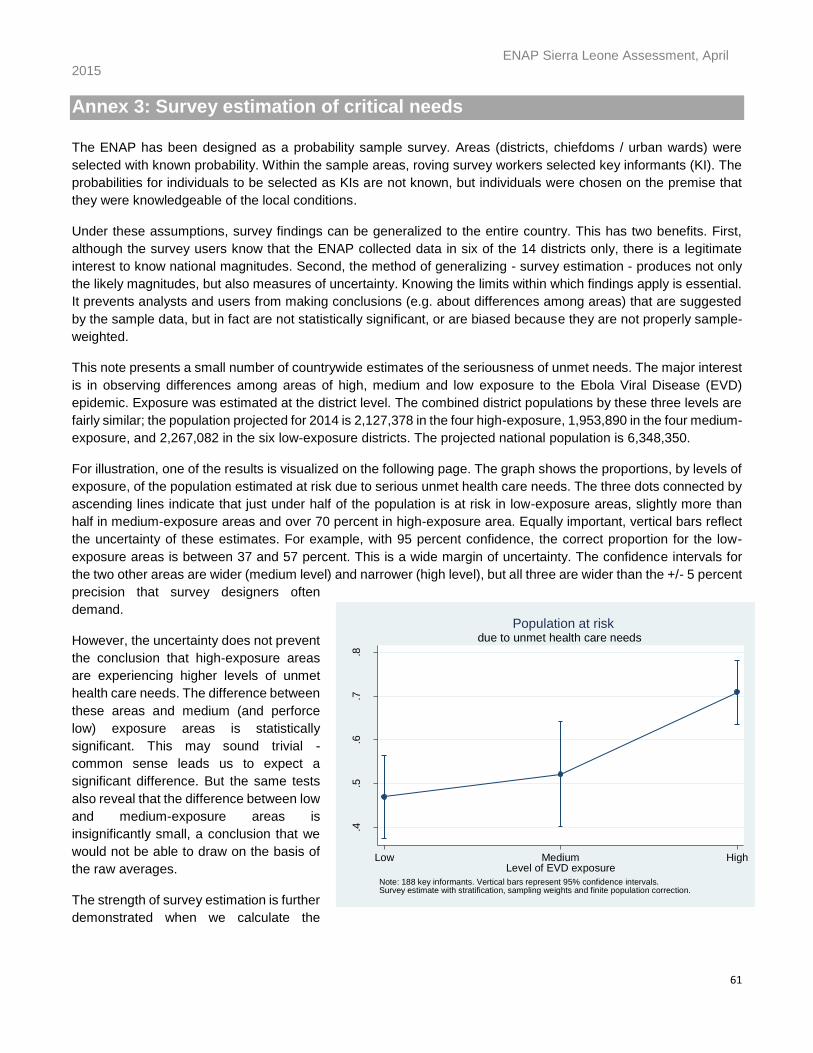
ENAP Sierra Leone Assessment, April 2015
61
Annex 3: Survey estimation of critical needs
The ENAP has been designed as a probability sample survey. Areas (districts, chiefdoms / urban wards) were
selected with known probability. Within the sample areas, roving survey workers selected key informants (KI). The
probabilities for individuals to be selected as KIs are not known, but individuals were chosen on the premise that
they were knowledgeable of the local conditions.
Under these assumptions, survey findings can be generalized to the entire country. This has two benefits. First,
although the survey users know that the ENAP collected data in six of the 14 districts only, there is a legitimate
interest to know national magnitudes. Second, the method of generalizing - survey estimation - produces not only
the likely magnitudes, but also measures of uncertainty. Knowing the limits within which findings apply is essential.
It prevents analysts and users from making conclusions (e.g. about differences among areas) that are suggested
by the sample data, but in fact are not statistically significant, or are biased because they are not properly sample-
weighted.
This note presents a small number of countrywide estimates of the seriousness of unmet needs. The major interest
is in observing differences among areas of high, medium and low exposure to the Ebola Viral Disease (EVD)
epidemic. Exposure was estimated at the district level. The combined district populations by these three levels are
fairly similar; the population projected for 2014 is 2,127,378 in the four high-exposure, 1,953,890 in the four medium-
exposure, and 2,267,082 in the six low-exposure districts. The projected national population is 6,348,350.
For illustration, one of the results is visualized on the following page. The graph shows the proportions, by levels of
exposure, of the population estimated at risk due to serious unmet health care needs. The three dots connected by
ascending lines indicate that just under half of the population is at risk in low-exposure areas, slightly more than
half in medium-exposure areas and over 70 percent in high-exposure area. Equally important, vertical bars reflect
the uncertainty of these estimates. For example, with 95 percent confidence, the correct proportion for the low-
exposure areas is between 37 and 57 percent. This is a wide margin of uncertainty. The confidence intervals for
the two other areas are wider (medium level) and narrower (high level), but all three are wider than the +/- 5 percent
precision that survey designers often
demand.
However, the uncertainty does not prevent
the conclusion that high-exposure areas
are experiencing higher levels of unmet
health care needs. The difference between
these areas and medium (and perforce
low) exposure areas is statistically
significant. This may sound trivial -
common sense leads us to expect a
significant difference. But the same tests
also reveal that the difference between low
and medium-exposure areas is
insignificantly small, a conclusion that we
would not be able to draw on the basis of
the raw averages.
The strength of survey estimation is further
demonstrated when we calculate the
.4.5
.6.7
.8
Pro
port
ion e
stim
ate
d a
t risk
HighMediumLowLevel of EVD exposure
Note: 188 key informants. Vertical bars represent 95% confidence intervals. Survey estimate with stratification, sampling weights and finite population correction.
due to unmet health care needs
Population at risk
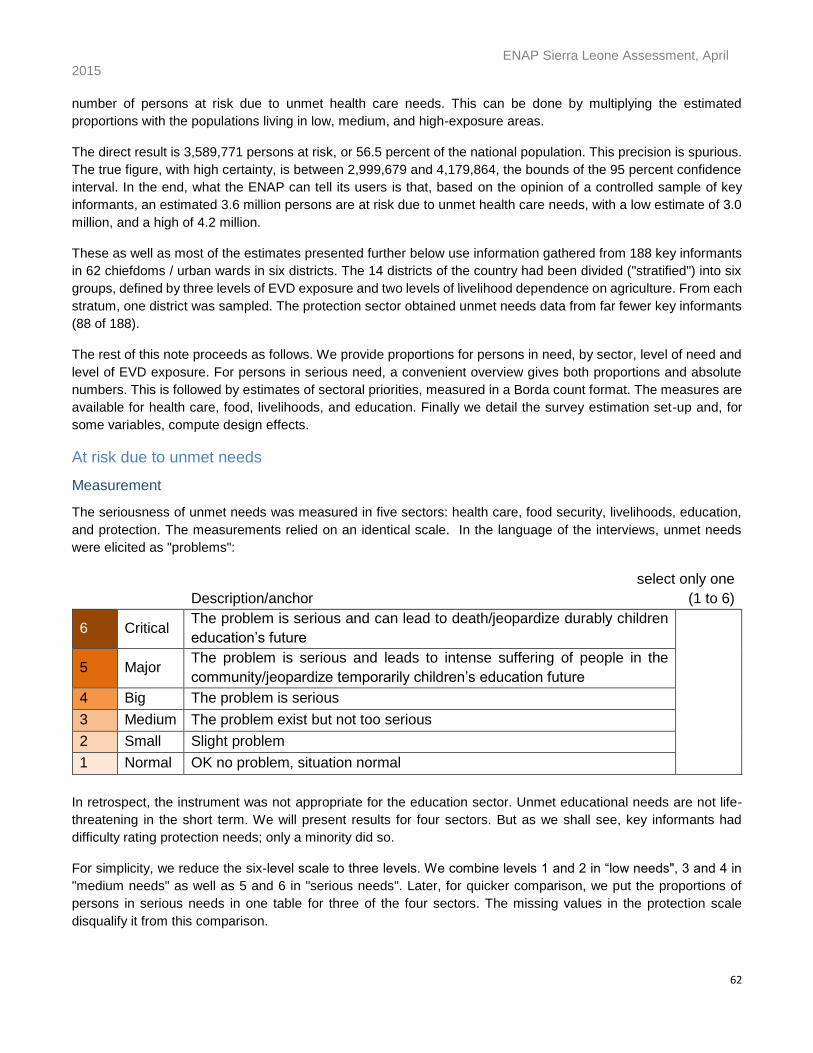
ENAP Sierra Leone Assessment, April 2015
62
number of persons at risk due to unmet health care needs. This can be done by multiplying the estimated
proportions with the populations living in low, medium, and high-exposure areas.
The direct result is 3,589,771 persons at risk, or 56.5 percent of the national population. This precision is spurious.
The true figure, with high certainty, is between 2,999,679 and 4,179,864, the bounds of the 95 percent confidence
interval. In the end, what the ENAP can tell its users is that, based on the opinion of a controlled sample of key
informants, an estimated 3.6 million persons are at risk due to unmet health care needs, with a low estimate of 3.0
million, and a high of 4.2 million.
These as well as most of the estimates presented further below use information gathered from 188 key informants
in 62 chiefdoms / urban wards in six districts. The 14 districts of the country had been divided ("stratified") into six
groups, defined by three levels of EVD exposure and two levels of livelihood dependence on agriculture. From each
stratum, one district was sampled. The protection sector obtained unmet needs data from far fewer key informants
(88 of 188).
The rest of this note proceeds as follows. We provide proportions for persons in need, by sector, level of need and
level of EVD exposure. For persons in serious need, a convenient overview gives both proportions and absolute
numbers. This is followed by estimates of sectoral priorities, measured in a Borda count format. The measures are
available for health care, food, livelihoods, and education. Finally we detail the survey estimation set-up and, for
some variables, compute design effects.
At risk due to unmet needs
Measurement
The seriousness of unmet needs was measured in five sectors: health care, food security, livelihoods, education,
and protection. The measurements relied on an identical scale. In the language of the interviews, unmet needs
were elicited as "problems":
Description/anchor
select only one
(1 to 6)
6 Critical The problem is serious and can lead to death/jeopardize durably children
education’s future
5 Major The problem is serious and leads to intense suffering of people in the
community/jeopardize temporarily children’s education future
4 Big The problem is serious
3 Medium The problem exist but not too serious
2 Small Slight problem
1 Normal OK no problem, situation normal
In retrospect, the instrument was not appropriate for the education sector. Unmet educational needs are not life-
threatening in the short term. We will present results for four sectors. But as we shall see, key informants had
difficulty rating protection needs; only a minority did so.
For simplicity, we reduce the six-level scale to three levels. We combine levels 1 and 2 in “low needs", 3 and 4 in
"medium needs" as well as 5 and 6 in "serious needs". Later, for quicker comparison, we put the proportions of
persons in serious needs in one table for three of the four sectors. The missing values in the protection scale
disqualify it from this comparison.
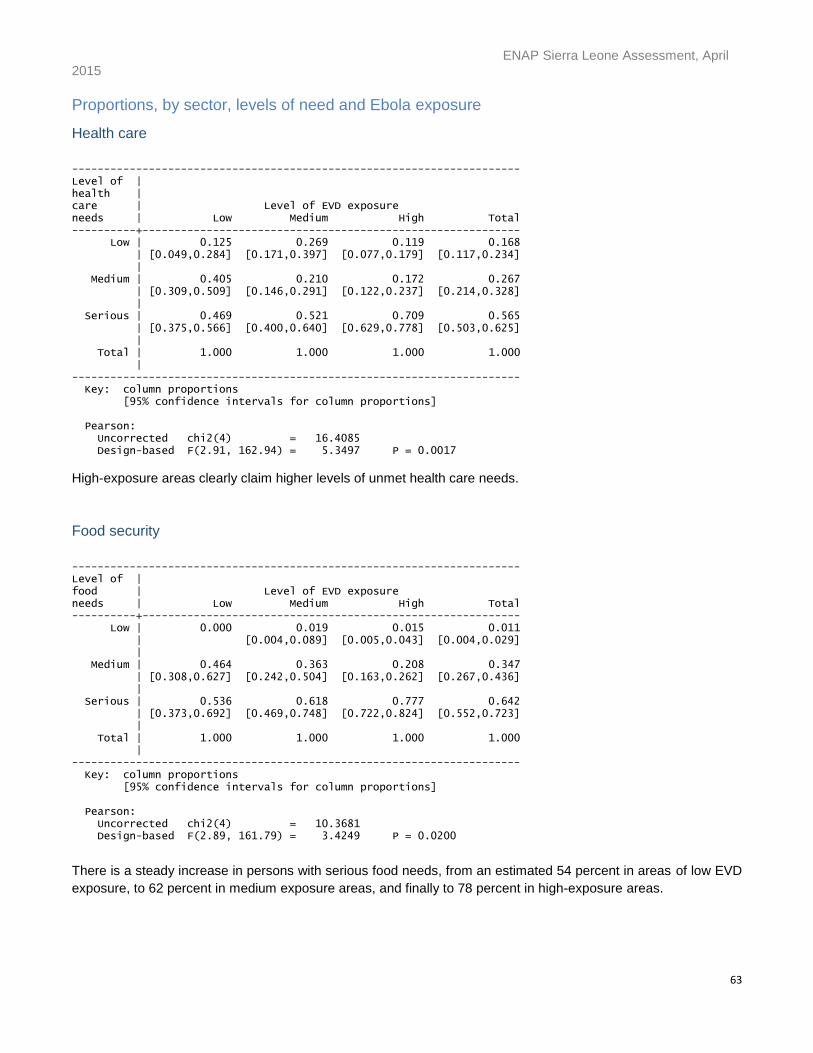
ENAP Sierra Leone Assessment, April 2015
63
Proportions, by sector, levels of need and Ebola exposure
Health care
---------------------------------------------------------------------- Level of | health | care | Level of EVD exposure needs | Low Medium High Total ----------+----------------------------------------------------------- Low | 0.125 0.269 0.119 0.168 | [0.049,0.284] [0.171,0.397] [0.077,0.179] [0.117,0.234] | Medium | 0.405 0.210 0.172 0.267 | [0.309,0.509] [0.146,0.291] [0.122,0.237] [0.214,0.328] | Serious | 0.469 0.521 0.709 0.565 | [0.375,0.566] [0.400,0.640] [0.629,0.778] [0.503,0.625] | Total | 1.000 1.000 1.000 1.000 | ---------------------------------------------------------------------- Key: column proportions [95% confidence intervals for column proportions] Pearson: Uncorrected chi2(4) = 16.4085 Design-based F(2.91, 162.94) = 5.3497 P = 0.0017
High-exposure areas clearly claim higher levels of unmet health care needs.
Food security
---------------------------------------------------------------------- Level of | food | Level of EVD exposure needs | Low Medium High Total ----------+----------------------------------------------------------- Low | 0.000 0.019 0.015 0.011 | [0.004,0.089] [0.005,0.043] [0.004,0.029] | Medium | 0.464 0.363 0.208 0.347 | [0.308,0.627] [0.242,0.504] [0.163,0.262] [0.267,0.436] | Serious | 0.536 0.618 0.777 0.642 | [0.373,0.692] [0.469,0.748] [0.722,0.824] [0.552,0.723] | Total | 1.000 1.000 1.000 1.000 | ---------------------------------------------------------------------- Key: column proportions [95% confidence intervals for column proportions] Pearson: Uncorrected chi2(4) = 10.3681 Design-based F(2.89, 161.79) = 3.4249 P = 0.0200
There is a steady increase in persons with serious food needs, from an estimated 54 percent in areas of low EVD
exposure, to 62 percent in medium exposure areas, and finally to 78 percent in high-exposure areas.
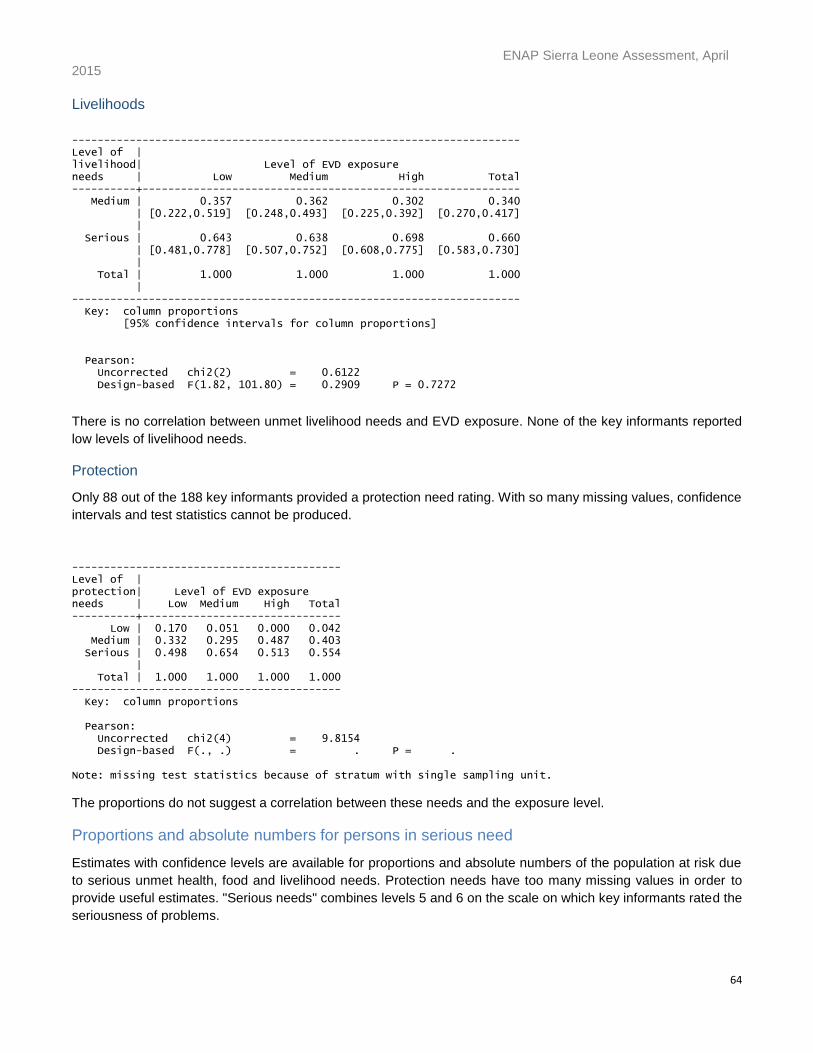
ENAP Sierra Leone Assessment, April 2015
64
Livelihoods
---------------------------------------------------------------------- Level of | livelihood| Level of EVD exposure needs | Low Medium High Total ----------+----------------------------------------------------------- Medium | 0.357 0.362 0.302 0.340 | [0.222,0.519] [0.248,0.493] [0.225,0.392] [0.270,0.417] | Serious | 0.643 0.638 0.698 0.660 | [0.481,0.778] [0.507,0.752] [0.608,0.775] [0.583,0.730] | Total | 1.000 1.000 1.000 1.000 | ---------------------------------------------------------------------- Key: column proportions [95% confidence intervals for column proportions] Pearson: Uncorrected chi2(2) = 0.6122 Design-based F(1.82, 101.80) = 0.2909 P = 0.7272
There is no correlation between unmet livelihood needs and EVD exposure. None of the key informants reported
low levels of livelihood needs.
Protection
Only 88 out of the 188 key informants provided a protection need rating. With so many missing values, confidence
intervals and test statistics cannot be produced.
------------------------------------------ Level of | protection| Level of EVD exposure needs | Low Medium High Total ----------+------------------------------- Low | 0.170 0.051 0.000 0.042 Medium | 0.332 0.295 0.487 0.403 Serious | 0.498 0.654 0.513 0.554 | Total | 1.000 1.000 1.000 1.000 ------------------------------------------ Key: column proportions Pearson: Uncorrected chi2(4) = 9.8154 Design-based F(., .) = . P = . Note: missing test statistics because of stratum with single sampling unit.
The proportions do not suggest a correlation between these needs and the exposure level.
Proportions and absolute numbers for persons in serious need
Estimates with confidence levels are available for proportions and absolute numbers of the population at risk due
to serious unmet health, food and livelihood needs. Protection needs have too many missing values in order to
provide useful estimates. "Serious needs" combines levels 5 and 6 on the scale on which key informants rated the
seriousness of problems.
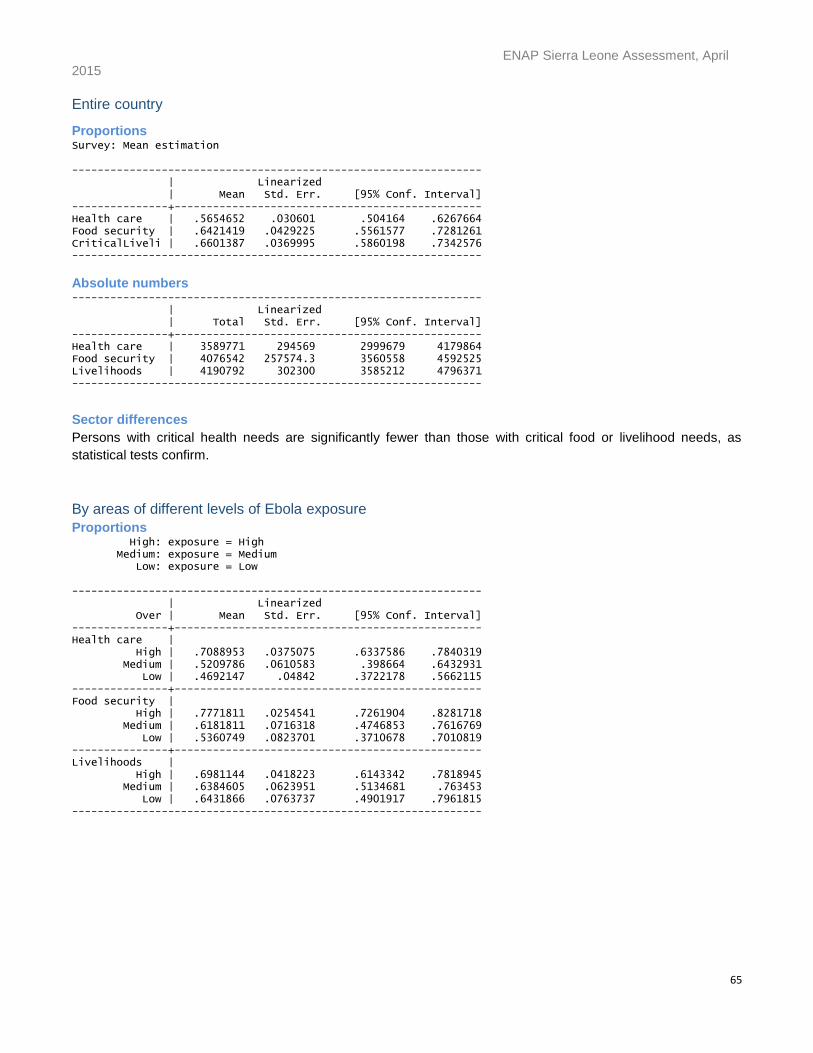
ENAP Sierra Leone Assessment, April 2015
65
Entire country
Proportions Survey: Mean estimation ---------------------------------------------------------------- | Linearized | Mean Std. Err. [95% Conf. Interval] ---------------+------------------------------------------------ Health care | .5654652 .030601 .504164 .6267664 Food security | .6421419 .0429225 .5561577 .7281261 CriticalLiveli | .6601387 .0369995 .5860198 .7342576 ----------------------------------------------------------------
Absolute numbers ---------------------------------------------------------------- | Linearized | Total Std. Err. [95% Conf. Interval] ---------------+------------------------------------------------ Health care | 3589771 294569 2999679 4179864 Food security | 4076542 257574.3 3560558 4592525 Livelihoods | 4190792 302300 3585212 4796371 ----------------------------------------------------------------
Sector differences
Persons with critical health needs are significantly fewer than those with critical food or livelihood needs, as
statistical tests confirm.
By areas of different levels of Ebola exposure
Proportions High: exposure = High Medium: exposure = Medium Low: exposure = Low ---------------------------------------------------------------- | Linearized Over | Mean Std. Err. [95% Conf. Interval] ---------------+------------------------------------------------ Health care | High | .7088953 .0375075 .6337586 .7840319 Medium | .5209786 .0610583 .398664 .6432931 Low | .4692147 .04842 .3722178 .5662115 ---------------+------------------------------------------------ Food security | High | .7771811 .0254541 .7261904 .8281718 Medium | .6181811 .0716318 .4746853 .7616769 Low | .5360749 .0823701 .3710678 .7010819 ---------------+------------------------------------------------ Livelihoods | High | .6981144 .0418223 .6143342 .7818945 Medium | .6384605 .0623951 .5134681 .763453 Low | .6431866 .0763737 .4901917 .7961815 ----------------------------------------------------------------
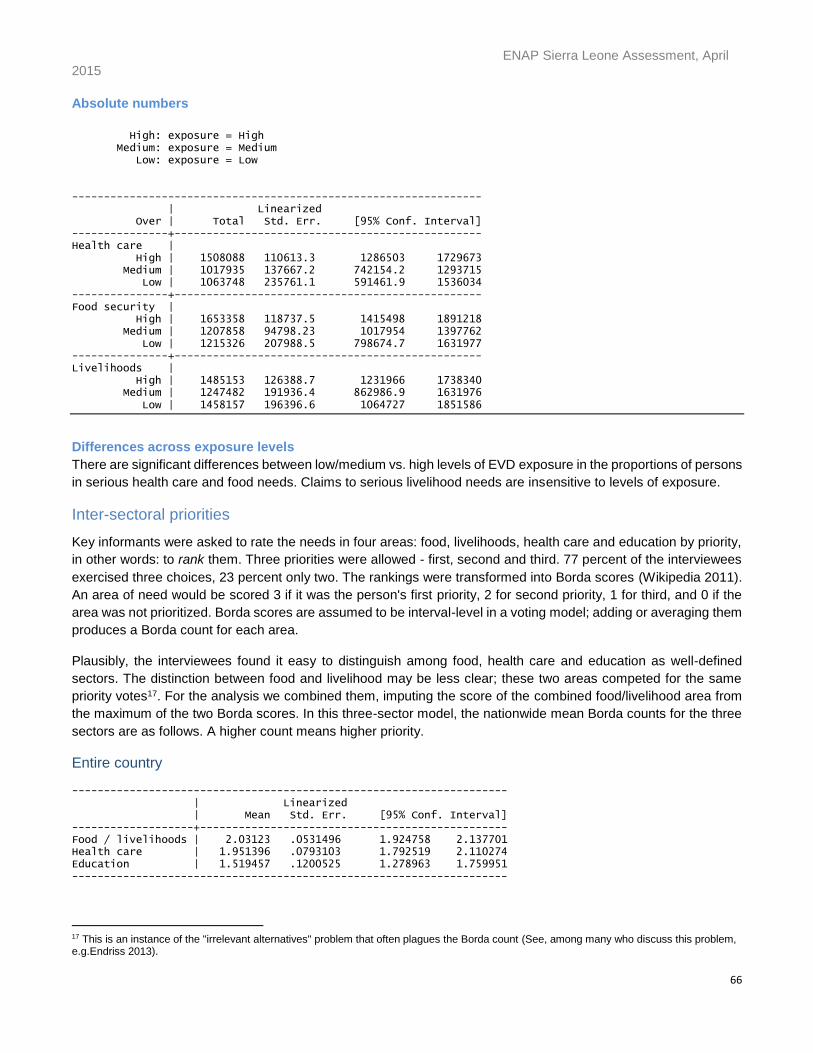
ENAP Sierra Leone Assessment, April 2015
66
Absolute numbers
High: exposure = High Medium: exposure = Medium Low: exposure = Low ---------------------------------------------------------------- | Linearized Over | Total Std. Err. [95% Conf. Interval] ---------------+------------------------------------------------ Health care | High | 1508088 110613.3 1286503 1729673 Medium | 1017935 137667.2 742154.2 1293715 Low | 1063748 235761.1 591461.9 1536034 ---------------+------------------------------------------------ Food security | High | 1653358 118737.5 1415498 1891218 Medium | 1207858 94798.23 1017954 1397762 Low | 1215326 207988.5 798674.7 1631977 ---------------+------------------------------------------------ Livelihoods | High | 1485153 126388.7 1231966 1738340 Medium | 1247482 191936.4 862986.9 1631976 Low | 1458157 196396.6 1064727 1851586
Differences across exposure levels
There are significant differences between low/medium vs. high levels of EVD exposure in the proportions of persons
in serious health care and food needs. Claims to serious livelihood needs are insensitive to levels of exposure.
Inter-sectoral priorities
Key informants were asked to rate the needs in four areas: food, livelihoods, health care and education by priority,
in other words: to rank them. Three priorities were allowed - first, second and third. 77 percent of the interviewees
exercised three choices, 23 percent only two. The rankings were transformed into Borda scores (Wikipedia 2011).
An area of need would be scored 3 if it was the person's first priority, 2 for second priority, 1 for third, and 0 if the
area was not prioritized. Borda scores are assumed to be interval-level in a voting model; adding or averaging them
produces a Borda count for each area.
Plausibly, the interviewees found it easy to distinguish among food, health care and education as well-defined
sectors. The distinction between food and livelihood may be less clear; these two areas competed for the same
priority votes17. For the analysis we combined them, imputing the score of the combined food/livelihood area from
the maximum of the two Borda scores. In this three-sector model, the nationwide mean Borda counts for the three
sectors are as follows. A higher count means higher priority.
Entire country -------------------------------------------------------------------- | Linearized | Mean Std. Err. [95% Conf. Interval] -------------------+------------------------------------------------ Food / livelihoods | 2.03123 .0531496 1.924758 2.137701 Health care | 1.951396 .0793103 1.792519 2.110274 Education | 1.519457 .1200525 1.278963 1.759951 --------------------------------------------------------------------
17 This is an instance of the "irrelevant alternatives" problem that often plagues the Borda count (See, among many who discuss this problem, e.g.Endriss 2013).
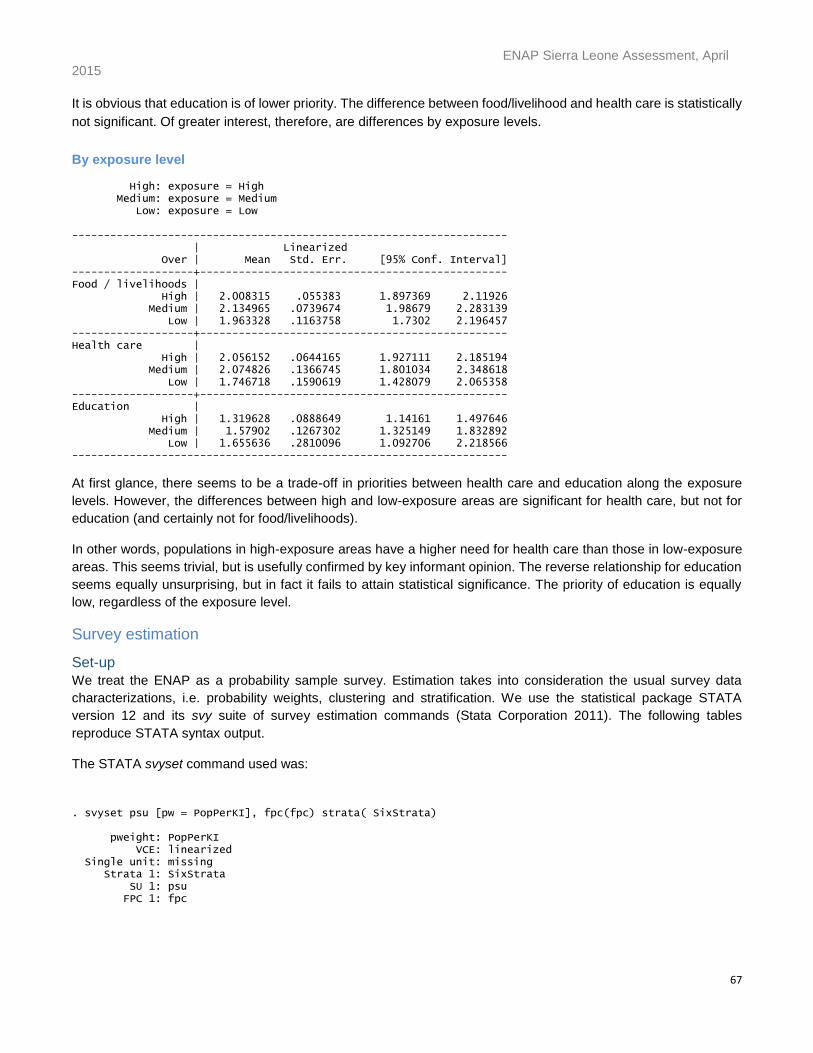
ENAP Sierra Leone Assessment, April 2015
67
It is obvious that education is of lower priority. The difference between food/livelihood and health care is statistically
not significant. Of greater interest, therefore, are differences by exposure levels.
By exposure level High: exposure = High Medium: exposure = Medium Low: exposure = Low -------------------------------------------------------------------- | Linearized Over | Mean Std. Err. [95% Conf. Interval] -------------------+------------------------------------------------ Food / livelihoods | High | 2.008315 .055383 1.897369 2.11926 Medium | 2.134965 .0739674 1.98679 2.283139 Low | 1.963328 .1163758 1.7302 2.196457 -------------------+------------------------------------------------ Health care | High | 2.056152 .0644165 1.927111 2.185194 Medium | 2.074826 .1366745 1.801034 2.348618 Low | 1.746718 .1590619 1.428079 2.065358 -------------------+------------------------------------------------ Education | High | 1.319628 .0888649 1.14161 1.497646 Medium | 1.57902 .1267302 1.325149 1.832892 Low | 1.655636 .2810096 1.092706 2.218566 --------------------------------------------------------------------
At first glance, there seems to be a trade-off in priorities between health care and education along the exposure
levels. However, the differences between high and low-exposure areas are significant for health care, but not for
education (and certainly not for food/livelihoods).
In other words, populations in high-exposure areas have a higher need for health care than those in low-exposure
areas. This seems trivial, but is usefully confirmed by key informant opinion. The reverse relationship for education
seems equally unsurprising, but in fact it fails to attain statistical significance. The priority of education is equally
low, regardless of the exposure level.
Survey estimation
Set-up
We treat the ENAP as a probability sample survey. Estimation takes into consideration the usual survey data
characterizations, i.e. probability weights, clustering and stratification. We use the statistical package STATA
version 12 and its svy suite of survey estimation commands (Stata Corporation 2011). The following tables
reproduce STATA syntax output.
The STATA svyset command used was:
. svyset psu [pw = PopPerKI], fpc(fpc) strata( SixStrata) pweight: PopPerKI VCE: linearized Single unit: missing Strata 1: SixStrata SU 1: psu FPC 1: fpc
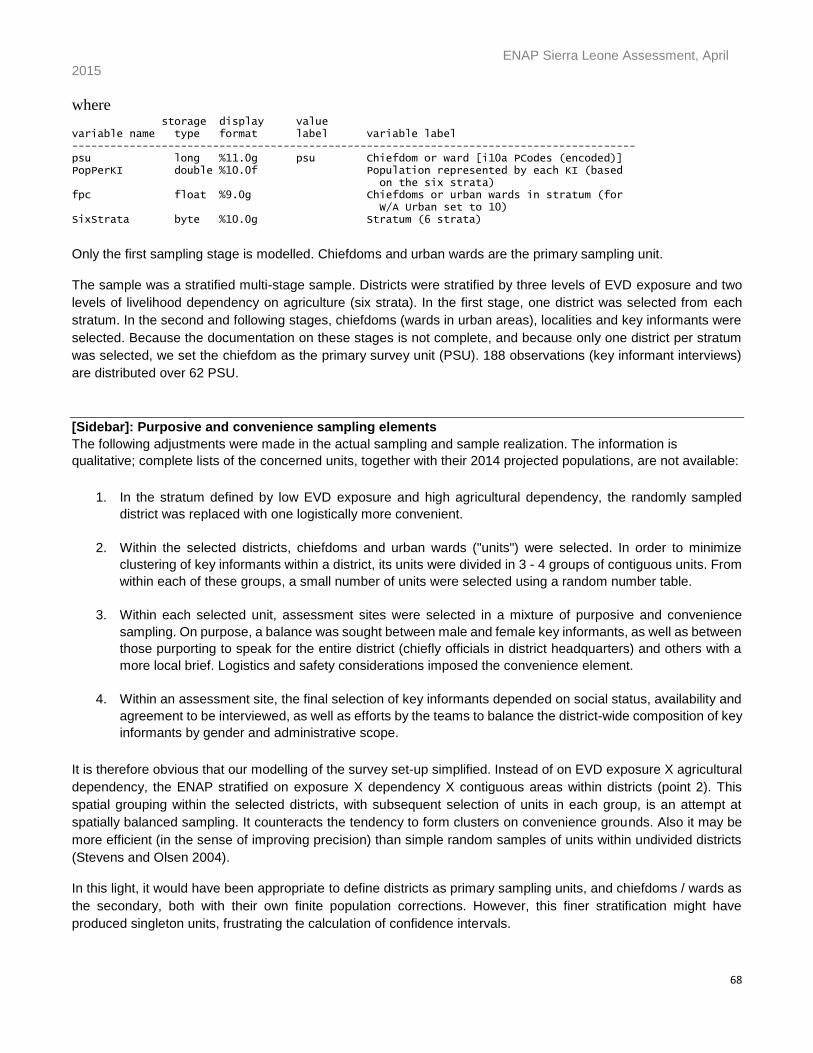
ENAP Sierra Leone Assessment, April 2015
68
where storage display value variable name type format label variable label ---------------------------------------------------------------------------------------- psu long %11.0g psu Chiefdom or ward [i10a PCodes (encoded)] PopPerKI double %10.0f Population represented by each KI (based on the six strata) fpc float %9.0g Chiefdoms or urban wards in stratum (for W/A Urban set to 10) SixStrata byte %10.0g Stratum (6 strata)
Only the first sampling stage is modelled. Chiefdoms and urban wards are the primary sampling unit.
The sample was a stratified multi-stage sample. Districts were stratified by three levels of EVD exposure and two
levels of livelihood dependency on agriculture (six strata). In the first stage, one district was selected from each
stratum. In the second and following stages, chiefdoms (wards in urban areas), localities and key informants were
selected. Because the documentation on these stages is not complete, and because only one district per stratum
was selected, we set the chiefdom as the primary survey unit (PSU). 188 observations (key informant interviews)
are distributed over 62 PSU.
[Sidebar]: Purposive and convenience sampling elements
The following adjustments were made in the actual sampling and sample realization. The information is
qualitative; complete lists of the concerned units, together with their 2014 projected populations, are not available:
1. In the stratum defined by low EVD exposure and high agricultural dependency, the randomly sampled
district was replaced with one logistically more convenient.
2. Within the selected districts, chiefdoms and urban wards ("units") were selected. In order to minimize
clustering of key informants within a district, its units were divided in 3 - 4 groups of contiguous units. From
within each of these groups, a small number of units were selected using a random number table.
3. Within each selected unit, assessment sites were selected in a mixture of purposive and convenience
sampling. On purpose, a balance was sought between male and female key informants, as well as between
those purporting to speak for the entire district (chiefly officials in district headquarters) and others with a
more local brief. Logistics and safety considerations imposed the convenience element.
4. Within an assessment site, the final selection of key informants depended on social status, availability and
agreement to be interviewed, as well as efforts by the teams to balance the district-wide composition of key
informants by gender and administrative scope.
It is therefore obvious that our modelling of the survey set-up simplified. Instead of on EVD exposure X agricultural
dependency, the ENAP stratified on exposure X dependency X contiguous areas within districts (point 2). This
spatial grouping within the selected districts, with subsequent selection of units in each group, is an attempt at
spatially balanced sampling. It counteracts the tendency to form clusters on convenience grounds. Also it may be
more efficient (in the sense of improving precision) than simple random samples of units within undivided districts
(Stevens and Olsen 2004).
In this light, it would have been appropriate to define districts as primary sampling units, and chiefdoms / wards as
the secondary, both with their own finite population corrections. However, this finer stratification might have
produced singleton units, frustrating the calculation of confidence intervals.
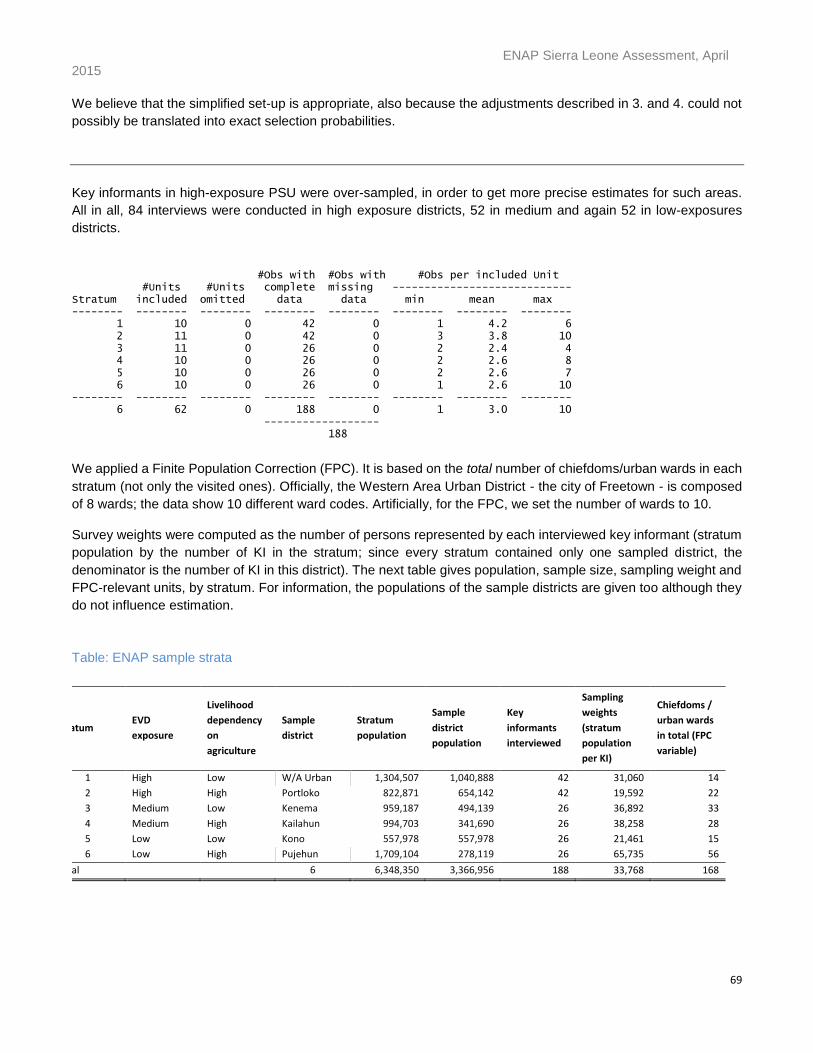
ENAP Sierra Leone Assessment, April 2015
69
We believe that the simplified set-up is appropriate, also because the adjustments described in 3. and 4. could not
possibly be translated into exact selection probabilities.
Key informants in high-exposure PSU were over-sampled, in order to get more precise estimates for such areas.
All in all, 84 interviews were conducted in high exposure districts, 52 in medium and again 52 in low-exposures
districts.
#Obs with #Obs with #Obs per included Unit #Units #Units complete missing ---------------------------- Stratum included omitted data data min mean max -------- -------- -------- -------- -------- -------- -------- -------- 1 10 0 42 0 1 4.2 6 2 11 0 42 0 3 3.8 10 3 11 0 26 0 2 2.4 4 4 10 0 26 0 2 2.6 8 5 10 0 26 0 2 2.6 7 6 10 0 26 0 1 2.6 10 -------- -------- -------- -------- -------- -------- -------- -------- 6 62 0 188 0 1 3.0 10 ------------------ 188
We applied a Finite Population Correction (FPC). It is based on the total number of chiefdoms/urban wards in each
stratum (not only the visited ones). Officially, the Western Area Urban District - the city of Freetown - is composed
of 8 wards; the data show 10 different ward codes. Artificially, for the FPC, we set the number of wards to 10.
Survey weights were computed as the number of persons represented by each interviewed key informant (stratum
population by the number of KI in the stratum; since every stratum contained only one sampled district, the
denominator is the number of KI in this district). The next table gives population, sample size, sampling weight and
FPC-relevant units, by stratum. For information, the populations of the sample districts are given too although they
do not influence estimation.
Table: ENAP sample strata
Stratum EVD
exposure
Livelihood
dependency
on
agriculture
Sample
district
Stratum
population
Sample
district
population
Key
informants
interviewed
Sampling
weights
(stratum
population
per KI)
Chiefdoms /
urban wards
in total (FPC
variable)
1 High Low W/A Urban 1,304,507 1,040,888 42 31,060 14
2 High High Portloko 822,871 654,142 42 19,592 22
3 Medium Low Kenema 959,187 494,139 26 36,892 33
4 Medium High Kailahun 994,703 341,690 26 38,258 28
5 Low Low Kono 557,978 557,978 26 21,461 15
6 Low High Pujehun 1,709,104 278,119 26 65,735 56
Total 6 6,348,350 3,366,956 188 33,768 168
ENAP Sierra Leone Assessment, April 2015
70
Design effects
The survey economies realized by clustering, stratification and finite population correction can be exemplified
through the design effects reported for some of the estimates above. The design effect (DEFF) is the ratio of the
variance of a parameter in the actual complex (clustered, stratified) design compared to what it would be under a
true simple random sample. For the serious need proportions by EVD exposure levels, we obtain these DEFF (the
DEFT are the square roots of the DEFF):
High: exposure = High Medium: exposure = Medium Low: exposure = Low ---------------------------------------------------------- | Linearized Over | Mean Std. Err. DEFF DEFT -------------+-------------------------------------------- Health care | High | .7088953 .0375075 .427213 .653605 Medium | .5209786 .0610583 .859823 .927252 Low | .4692147 .04842 .628665 .792872 -------------+-------------------------------------------- Food| High | .7771811 .0254541 .234466 .48421 Medium | .6181811 .0716318 1.25122 1.11856 Low | .5360749 .0823701 1.82191 1.34976 -------------+-------------------------------------------- Livelihoods | High | .6981144 .0418223 .520098 .721168 Medium | .6384605 .0623951 .970746 .98525 Low | .6431866 .0763737 1.69735 1.3028 ----------------------------------------------------------
The sample design was efficient for the combinations where the DEFF is smaller than one. This is the case by a
large margin for the over-sampled high-exposure districts. The extra allocations there should have been smaller,
with the savings given to low-exposure districts while ensuring that each PSU had more than one interviewed KI.
The imbalance is likely caused by the fact that the two strata with low EVD exposure contain no fewer than 71 of
the 168 chiefdoms / urban wards in total. This large number reduced the effect of the finite population correction,
i.e. allowed standard errors to be larger.
References
Endriss, U. (2013). Voting on actions with uncertain outcomes. Algorithmic Decision Theory, Springer. 167-180.
Stata Corporation (2011). Stata Statistical Software, Release 12: Reference Manual. College Station, TX,
StataCorp LP.
Stevens, D. L. and A. R. Olsen (2004). "Spatially balanced sampling of natural resources." Journal of the
American Statistical Association 99(465): 262-278.
Wikipedia. (2011)."Borda count." Retrieved 28 March 2011, from http://en.wikipedia.org/wiki/Borda_count.