Acalabrutinib (ACP-196): A covalent Bruton tyrosine kinase...
40
JPET #242909 1 Acalabrutinib (ACP-196): A covalent Bruton tyrosine kinase (BTK) inhibitor with a differentiated selectivity and in vivo potency profile Tjeerd Barf, Todd Covey, Raquel Izumi, Bas van de Kar, Michael Gulrajani, Bart van Lith, Maaike van Hoek, Edwin de Zwart, Diana Mittag, Dennis Demont, Saskia Verkaik, Fanny Krantz, Paul G. Pearson, Roger Ulrich and Allard Kaptein Acerta Pharma BV, Oss, The Netherlands This article has not been copyedited and formatted. The final version may differ from this version. JPET Fast Forward. Published on September 7, 2017 as DOI: 10.1124/jpet.117.242909 at ASPET Journals on June 20, 2018 jpet.aspetjournals.org Downloaded from
-
Upload
trinhquynh -
Category
Documents
-
view
228 -
download
1
Transcript of Acalabrutinib (ACP-196): A covalent Bruton tyrosine kinase...

JPET #242909
1
Acalabrutinib (ACP-196): A covalent Bruton tyrosine kinase (BTK) inhibitor with a differentiated
selectivity and in vivo potency profile
Tjeerd Barf, Todd Covey, Raquel Izumi, Bas van de Kar, Michael Gulrajani, Bart van Lith, Maaike van
Hoek, Edwin de Zwart, Diana Mittag, Dennis Demont, Saskia Verkaik, Fanny Krantz, Paul G. Pearson,
Roger Ulrich and Allard Kaptein
Acerta Pharma BV, Oss, The Netherlands
This article has not been copyedited and formatted. The final version may differ from this version.JPET Fast Forward. Published on September 7, 2017 as DOI: 10.1124/jpet.117.242909
at ASPE
T Journals on June 20, 2018
jpet.aspetjournals.orgD
ownloaded from

JPET #242909
2
Running Title: Acalabrutinib, a differentiated covalent BTK inhibitor
Corresponding Author: Tjeerd Barf, Acerta Pharma BV, Kloosterstraat 9, 5349 AB Oss, The Netherlands. E-mail: [email protected]. Tel. +31 412 700 574
Number of text pages: 59
Number of Tables: 3
Number of Figures: 5
Number of References: 43
Word count Abstract: 232
Word count Introduction: 513
Word count Discussion: 1548
Abbreviations: ADCC, antibody-dependent cellular cytoxicity; AUC, area under the concentration-time
curve; BCR, B-cell receptor; BLK, B-lymphocyte kinase; BMX, bone marrow tyrosine kinase gene in
chromosome X; BTK, Bruton’s tyrosine kinase; CLL, chronic lymphocytic leukemia; ErbB, erythroblastosis
oncogene B; EGFR (ErbB1), epidermal growth factor receptor; FACS, fluorescence-activated cell sorter;
FBS, fetal bovine serum; FGR, Gardner-Rasheed feline sarcoma viral (v-fgr) oncogene homolog; FYN,
Fgr/Yes related novel protein; HCK, hemopoietic cell kinase; hWB, human whole blood; IL, interleukin;
IMAP, immobilized metal affinity for phosphochemicals; ITK, IL2-inducible T-cell kinase; JAK, janus-
associated kinase; LCK, lymphocyte-specific protein tyrosine kinase; LYN, Lck/Yes novel; PBMC,
peripheral blood mononuclear cell; PBS, phosphate-buffered saline; PD, pharmacodynamics; PK,
pharmacokinetics; SRC, Rous sarcoma oncogene cellular homologue; SRR, structure-reactivity relationship;
TEC, tyrosine kinase expressed in hepatocellular carcinoma; Txk, T and X cell expressed kinase; XLA, X-
linked agammaglobulinemia; YES, Yamaguchi sarcoma viral oncogene homologue.
This article has not been copyedited and formatted. The final version may differ from this version.JPET Fast Forward. Published on September 7, 2017 as DOI: 10.1124/jpet.117.242909
at ASPE
T Journals on June 20, 2018
jpet.aspetjournals.orgD
ownloaded from

JPET #242909
3
Abstract
Several small-molecule BTK inhibitors are in development for B-cell malignancies and autoimmune
disorders, each characterized by distinct potency and selectivity patterns. Herein we describe the
pharmacologic characterization of BTK inhibitor acalabrutinib (1, ACP-196). Acalabrutinib possesses a
reactive butynamide group that binds covalently to Cys481 in BTK. Relative to the other BTK inhibitors
described here, the reduced intrinsic reactivity of acalabrutinib helps to limit inhibition of off-target kinases
having cysteine-mediated covalent binding potential. Acalabrutinib demonstrated higher biochemical and
cellular selectivity than ibrutinib (2) and spebrutinib (3). Importantly, off-target kinases that have been
associated with adverse effects, such as EGFR and ITK, are not inhibited. Determination of the inhibitory
potential of anti-IgM-induced CD69 expression in human PBMC and whole blood demonstrate that
acalabrutinib is a potent functional BTK inhibitor. In vivo evaluation in mice revealed that acalabrutinib is
more potent than ibrutinib and spebrutinib. Preclinical and clinical studies showed that the level and duration
of BTK occupancy correlate with in vivo efficacy. Evaluation of the pharmacokinetic properties of
acalabrutinib in healthy adult volunteers demonstrated rapid absorption and fast elimination. In these healthy
individuals, a single oral dose of 100 mg showed approximately 99% median target coverage at 3 and 12
hours, and around 90% at 24 hours in peripheral B cells. In conclusion, acalabrutinib is a BTK inhibitor with
key pharmacologic differentiators versus ibrutinib and spebrutinib, and is currently being evaluated in clinical
trials.
This article has not been copyedited and formatted. The final version may differ from this version.JPET Fast Forward. Published on September 7, 2017 as DOI: 10.1124/jpet.117.242909
at ASPE
T Journals on June 20, 2018
jpet.aspetjournals.orgD
ownloaded from

JPET #242909
4
INTRODUCTION
Bruton tyrosine kinase (BTK) is a TEC family non-receptor protein kinase expressed in B cells, myeloid
cells, mast cells and platelets. B-cell receptor (BCR)-mediated signaling is essential for activation,
proliferation and survival of B lymphocytes, and BTK is an essential component of the BCR signaling
cascade (Hendriks et al., 2014). Expression of BTK in B-cell leukemias and lymphomas has also been
reported (de Weers et al., 1993; Katz et al., 1994). Furthermore, BTK is involved in the regulation of FcγR
signaling in myeloid cells (Jongstra-Bilen et al., 2008), and in mast cell degranulation following FcεR1
activation (Ellmeijer et al., 2011). These features of BTK render it a very attractive target in treating B-cell
malignancies (Hendriks et al., 2014) and autoimmune disease (Whang and Chang, 2014). Several small-
molecule inhibitors of BTK have progressed to the clinic (Table 1), and collectively demonstrate clinical
validation of BTK inhibition in B-cell malignancies. Most of the BTK inhibitors listed in Table 1 have been
reported to bind in a covalent fashion to a cysteine residue (Cys481) at the rim of the ATP-binding pocket of
BTK (Norman 2016; Pan et al., 2007). To date, ibrutinib is the only BTK inhibitor that has received marketing
authorization for the treatment of B-cell malignancies (Ponader and Burger, 2014); however, it is associated
with adverse events not likely due to inhibition of BTK function based on clinical observations in X-linked
agammaglobulinemia (XLA) patients having dysfunctional BTK (Winkelstein et al., 2006). These ibrutinib-
mediated adverse events include rash, diarrhea, arthralgias or myalgias, atrial fibrillation and major
hemorrhage (Wang et al., 2013; Byrd et al., 2013; O’Brien et al., 2014), some of which may be explained by
inhibition of off-target kinases EGFR, TEC, ITK and TXK (Honigberg et al., 2010). Spebrutinib is another
covalent BTK inhibitor that was subject to clinical evaluation, and although reportedly a highly selective
inhibitor (Evans et al., 2013), doses needed to achieve a partial response in patients with relapsed/refractory
CLL/SLL are higher than for ibrutinib (Brown et al., 2016).
Here we report the differentiated profile of BTK inhibitor acalabrutinib (ACP-196, 1, 4-[8-amino-3-[(2S)-1-
but-2-ynoylpyrrolidin-2-yl]imidazo[1,5-a]pyrazin-1-yl]-N-(2-pyridyl)benzamide). Acalabrutinib is a small-
molecule irreversible BTK inhibitor (Figure 1) that shows encouraging clinical activity and safety in
relapsed/refractory CLL patients (Byrd et al., 2016). The preclinical profile of acalabrutinib and a few
additional compounds was compared with ibrutinib (PCI-32765, 2) and spebrutinib (CC-292, 3) to
This article has not been copyedited and formatted. The final version may differ from this version.JPET Fast Forward. Published on September 7, 2017 as DOI: 10.1124/jpet.117.242909
at ASPE
T Journals on June 20, 2018
jpet.aspetjournals.orgD
ownloaded from

JPET #242909
5
investigate potential differences in potency, efficacy and selectivity, while also engaging in covalent binding.
Comparative preclinical studies involved pharmacologic profiling in biochemical and functional cellular
assays, as well as in a PD model in mice. BTK target occupancy was correlated with PD markers by using a
potent and selective biotinylated probe that was developed based on the chemical structure of acalabrutinib.
In addition, we aimed to better understand the potential risk of adverse events by investigating the impact of
Structure-Reactivity Relationships (SRR) on kinase selectivity. Finally, data are presented on the PK/PD
relationships of acalabrutinib in healthy volunteers. The combined features of acalabrutinib result in a
selective and potent BTK inhibitor that appears to be differentiated from ibrutinib and spebrutinib, supporting
further clinical development.
This article has not been copyedited and formatted. The final version may differ from this version.JPET Fast Forward. Published on September 7, 2017 as DOI: 10.1124/jpet.117.242909
at ASPE
T Journals on June 20, 2018
jpet.aspetjournals.orgD
ownloaded from

JPET #242909
6
MATERIAL & METHODS
Biochemical Kinase assays. BTK and ITK enzyme activity was measured using the IMAP (immobilized
metal ion affinity-based fluorescence polarization) assay. BTK enzyme (Millipore) or ITK enzyme
(Millipore) was diluted to 16 nM and 34 nM, respectively in Kinase Reaction (KR) buffer (10 mM Tris-HCl,
10 mM MgCl2, 0.01% Tween-20, 0.1% NaN3, 1 mM DTT, 2 mM MnCl2, pH 7.5). Serial dilutions log10
from 1 mM to 31.6 nM of test compounds were made in 100% DMSO. The dilutions in DMSO were then
diluted 25-fold in KR-buffer. Final compound concentrations ranged from 10 μM to 0.316 nM. 5 μL/well of
test compound in KR buffer (final DMSO concentration in the assay is 1%) was mixed with 5 μl/well of BTK
or ITK enzyme (final concentration in the assay was 4 and 8 nM for BTK and ITK, respectively). Test
compounds and kinase enzyme were pre-incubated 1 hour at room temperature, before adding 5 μL/well of
200 nM Fluorescein labeled substrate peptide (Blk/Lyntide substrate, Molecular Devices) in KR-buffer. Final
peptide substrate concentration in assay was 50 nM. The kinase assay was started by adding 5 μL/well of 20
μM ATP in KR-buffer (final ATP concentration was 5 μM ATP, Km ATP). Following incubation for 2 hours
at room temperature the enzyme reaction was stopped by adding 40 μL/well IMAP Progressive Binding
Solution (Molecular Devices), according to product instructions, using 60% 1x buffer A and 40% 1x buffer
B with 800x diluted beads). After a 60-minute incubation at room temperature in the dark the FP signal was
read. Fluorescence at 535 nm was measured using parallel and perpendicular filters to determine differences
in rotation due to binding of the phosphorylated substrate peptide to the beads. Values were calculated as
percentage of the difference in readout (∆mPi) of the controls with and without ATP. IC50 values were
determined by curve fitting of the experimental results using Dotmatics.
Inhibitory activity on TEC was measured using the LanthaScreen assay from ThermoFisher according the
manufacturer’s protocol, using a final concentration of 1 nM of TEC enzyme (LifeTech) and 2 nM Eu-anti-
HIS antibody (Invitrogen). Serial dilutions of test compounds were prepared as described above for the BTK
and ITK IMAP assays. Test compounds, TEC enzyme/antibody mix and Tracer 178 (Invitrogen, final
concentration 1 nM) were mixed and incubated 2 hours at room temperature in the dark, prior to reading the
TR-FRET signal at 615 nm and 665 nm. The ratio 665/615 was used to calculate values expressed as
This article has not been copyedited and formatted. The final version may differ from this version.JPET Fast Forward. Published on September 7, 2017 as DOI: 10.1124/jpet.117.242909
at ASPE
T Journals on June 20, 2018
jpet.aspetjournals.orgD
ownloaded from
JPET #242909
7
percentage of the difference in readout (S/N) of the controls with and without Tracer. IC50 values were
determined by curve fitting of the experimental results using Dotmatics. BMX, TXK, EGFR, ErbB2, ErbB4,
JAK3, BLK, FGR, FYN, HCK, LCK, LYN, SRC, YES1 kinase activity was measured using the Z’-LYTE
assay at Thermo Fisher. A 10-point dose response was generated with 1 hour incubation of the test compound
with the kinase prior to initiation of the kinase reaction by the addition of ATP. ATP concentration in the
assay was Km ATP for the different kinases. IC50 values are determined by curve fitting of the experimental
results at Thermo Fisher.
Glutathione Reactivity Assay. 765 μL of a 3.32 mM solution of test compound in methanol was added to
765 μL of a 23.5 mM solution of L-Glutathione reduced (GSH) in phosphate buffer (pH=7.4). The mixtures
were stirred in a water bath held at 37°C. At specific time intervals, 200 μL aliquots were taken and analyzed
by RP-HPLC (Supplemental). Ln([compound]/[compound]0) was plotted against the time in minutes and
linear regression analysis was performed with MS Excel. The time point at which 50% of the compound is
consumed via reaction with the GSH (t½) was calculated as: t½ = Ln(2)/k, where k is the negative of the
slope of the linear trend line.
Human Blood Collection and Human Peripheral Blood Mononuclear Cell (PBMC) Isolation. Venous
blood was collected in heparin tubes from healthy human volunteers and kept at ambient temperature for no
longer than 24 hours. In case PBMC were isolated, this was done using the Histopaque gradient purification
method (GE Healthcare and cryopreserved in 90% DMSO + 10% FBS).
Inhibition of B cell Receptor (BCR)-induced CD69 Surface Expression in Human B cells. PBMC assay:
Cryopreserved PBMC were thawed, washed, and suspended at 2 X 10⁵ cells/well in RPMI + 10% FBS in 96-
well plates. Test compounds were added to PBMC using a ½ log dose titration (final concentration was 10
μM to 0.316 nM) and incubated for 2h at 37°C, 5% CO2. Final DMSO concentration in the assay was 0.1%.
Goat anti-human IgM F(ab’)2 (Southern Biotech) was added and cells were incubated for a further 18 hours.
Cells were stained with CD69-FITC, CD19-BV421, and CD3-BV510 antibodies (BD Biosciences) for 30
minutes at 4°C, with 7-AAD as a viability measure, followed by flow cytometry using a FACSVerse flow
This article has not been copyedited and formatted. The final version may differ from this version.JPET Fast Forward. Published on September 7, 2017 as DOI: 10.1124/jpet.117.242909
at ASPE
T Journals on June 20, 2018
jpet.aspetjournals.orgD
ownloaded from

JPET #242909
8
cytometer (BD Biosciences). Whole Blood (WB) assay: 45 µL blood was diluted 1:1 in RPMI + 1% FBS
and incubated with test compound (as described above). Blood was stimulated with 10 μg/mL mouse anti-
human anti-IgD (BD Biosciences) and incubation for 18 hours. Cells were stained with CD69-FITC, CD19-
BV421, and CD3-BV510 (BD Biosciences) for 15 minutes at room temperature, followed by RBCs lysis
with FACS Lysing Solution (BD Biosciences) in a 96-deep well plate. Cells were washed with 1mL/well
PBS + 0.5% BSA, pelleted, and resuspended in 200uL/well of PBS + 0.5% BSA, followed by flow cytometry.
For both PBMC and WB assays, median fluorescence intensity values for CD69 were obtained from the
CD19+ CD3- B lymphocyte gate using FCSExpress analysis software (De Novo Software). EC50 values were
determined by curve fitting of the experimental results using Dotmatics.
Murine PD model. Balb/c mice were dosed via oral gavage with inhibitors or vehicle and then euthanized
after 1 to 24 hours. Extracted spleens were disassociated to obtain single-cell suspensions. Red blood cells
(RBC) were lysed with an ammonium chloride solution (Sigma). Remaining cells were washed with cold
PBS and counted. An aliquot of 1 x 10⁶ cells was snap frozen (LN2) as cell pellets for subsequent BTK target
occupancy ELISA and the remainder was used for CD69 analysis (see below).
BTK Target Occupancy ELISA. The percent of drug-bound BTK in mouse and human samples was
determined by an ELISA based method as follows: OptiPlate 96-well plates (Perkin Elmer) were coated with
125 ng/well anti-BTK Ab (BD Biosciences) and blocked with BSA (Sigma-Aldrich). Samples containing
either 5 x 10⁵ or 1 x 10⁶ cells from human PBMC or mouse splenocytes, respectively were lysed in ice cold
lysis buffer containing 50 mM Tris-HCl pH 7.5, 250 mM sucrose, 5 mM MgCl2, 1 mM dithiothreitol (DTT),
0.05% digitonin, and protease inhibitor cocktail (Sigma-Aldrich). Cell lysates were then incubated for 1 hour
in the absence or presence of 1 µM acalabrutinib, a saturating concentration that results in complete BTK
occupancy. The difference with the signal of the cell lysates not incubated with an excess acalabrutinib
represents free BTK not occupied by a BTK inhibitor. Samples were incubated for 1 hour with 100 nM biotin
tag compound ACP-4016 (10). This probe will bind covalently to Cys481 in the ATP pocket in BTK when
the ATP pocket is not occupied by a covalent BTK inhibitor. Each sample was then added in duplicate to the
prepared Optiplate and incubated for 2 hours at ambient temperature. Plates were washed with PBS + 0.05%
This article has not been copyedited and formatted. The final version may differ from this version.JPET Fast Forward. Published on September 7, 2017 as DOI: 10.1124/jpet.117.242909
at ASPE
T Journals on June 20, 2018
jpet.aspetjournals.orgD
ownloaded from

JPET #242909
9
Tween20 four times. Streptavidin-HRP (Invitrogen; ELISA grade) was added at 100 µL/well (120 ng/mL)
and incubated for 1 hour at room temperature. Plates were washed with PBS + 0.05% Tween20 three times
and then washed with PBS (without Tween 20) two times. One hundred µL/well of SuperSignal ELISA
Femto Substrate (ThermoFisher Scientific) was added and then chemiluminescence was measured after 1
minute (EnVision® plate reader; PerkinElmer). The percent of BTK occupancy for each sample time point
was calculated relative to the day 1 predose sample for each patient. The signal from the day 1 predose
sample without exogenous acalabrutinib represents 100% free BTK (or 0% occupied BTK), whereas the
signal from the day 1 predose sample with exogenous acalabrutinib represents 0% free BTK (or 100%
occupied BTK). The incubation of each cell lysate with 1 µM acalabrutinib was used to correct for
background signal not related to free BTK:
% Free BTK sample X = (Sample X – Sample X+drug[1uM]) / (Day 1 Predose – Day 1 Predose+drug[1uM]) x
100%
% Occupied BTK = 100% - % Free BTK
Ex Vivo BCR-induced CD69 Expression in Mouse B cells. Splenocytes from drug- and vehicle-treated
mice were plated at 2 x 10⁵ cells/well in 96-well flat bottom plates. 10 μg/mL goat anti-mouse IgM (Southern
Biotech) was added and cultures were incubated for 18 hours in at 37°C, 5% CO2. Cells were treated with Fc
Block (BD Biosciences) and subsequently stained with CD69-FITC, CD19-BV421, CD3-BV510 (BD
Biosciences) and 7-AAD, followed by flow cytometry. MFI values for CD69 were obtained from the B
lymphocyte gate (CD19+, CD3-). Values were normalized to a percent of control (POC), with the control
being the CD69 MFI from the vehicle-treated mice for each time point. Cells without anti-IgM addition
served to define the basal expression.
EGF Receptor inhibition. A431 cell line were plated at 4 x 10⁴ cells/well in a 96-well culture plate
(MicroWell 96-well Microplates, Nunc) in DMEM/HAM F12 + 10% FBS and incubated overnight at 37°C,
5-7% CO2. Serial dilutions (½ log) of test compounds were made in 100% DMSO and added to the A431
cells (final compound concentration range in the assay from 10 μM to 0.316 nM, final concentration 1%
DMSO) and incubated with the cells for 2 hours at 37°C, 5-7% CO2, followed by a 10-minute stimulation
This article has not been copyedited and formatted. The final version may differ from this version.JPET Fast Forward. Published on September 7, 2017 as DOI: 10.1124/jpet.117.242909
at ASPE
T Journals on June 20, 2018
jpet.aspetjournals.orgD
ownloaded from

JPET #242909
10
with EGF (Tebu.bio BV final concentration 250 ng/ml). Culture medium was removed from the cells and
100 µl/well lysis buffer (Cell extraction buffer, Invitrogen + Protease Inhibitor Cocktail, Roche) was added.
Cell lysates were used to measure phospho-EGFR ELISA (DuoSet® IC, Human Phospho-EGFR/ErbB1,
R&D Systems). EC50 values were determined by curve fitting of the experimental results using Dotmatics
software.
Jurkat T cell assay. Regulation of anti-CD3/CD28-induced IL-2 production on Jurkat T cells was done
using a clone, obtained by dilution cloning, with high expression of IL-2 following stimulation (Jurkat
J.E6.2.11). Jurkat cells were plated at 2x10⁵ cells per well in a 96-well culture plate (MicroWell 96-well
Microplates, Nunc) cultured in DMEM F12 + 10% FBS and cultured overnight in cell culture incubator,
37%, 5-7% CO2. Serial dilution (½ log) of test compounds were made in 100% DMSO and added to the
Jurkat cells (final compound concentration range in the assay from 10 μM to 0.316 nM, final concentration
0.1% DMSO). Following a 1h incubation the Jurkat cells were stimulated with anti-human CD3 and anti-
human CD28 (BD Biosciences, 0.1 µg/ml final concentration in the assay). Cell culture medium was
harvested after a 6h incubation following activation and used subsequently to measure IL-2 produced by
ELISA (Human IL-2 Cytosets Biosource). EC50 values were determined by curve fitting of the experimental
results using Dotmatics software.
Human PBMC T cell assay. Cryopreserved PBMC were thawed, washed and suspended at 1 x 10⁵ cells/well
in RPMI + 10% FBS in 96-well U-bottom polypropylene plates and rested for 1 hour at 37˚C, 5% CO2. Cells
were then pre-treated with a 10-point serial dilution of compounds (as described above for B cell assays).
Pre-incubated PBMC were transferred to 96-well round-bottom polystyrene plates that have been coated with
anti-human CD3 antibody (Clone UCHT-1, BD Biosciences; coated at 10ug/ml for 2 hours at 37˚C) or
uncoated wells for controls and incubated over night at 37˚C, 5% CO2. PBMC were washed twice in PBS
containing 0.5% Bovine serum albumin (PBS + 0.5% BSA) and stained with CD4-AlexaFluor 647 (Clone
RPA-T4) and CD8-AlexaFluor 647 (Clone RPA-T8, BD Biosciences), CD19-BV421 (Clone HIB19), CD69-
FITC (Clone FN50, BD Biosciences) and CD25-PE-Cy7 antibodies (BD Biosciences) for 30 minutes at 4˚C
in the dark. After washing twice in PBS + 0.5% BSA, 7-Aminoactinomycin D (7-AAD, Life Technologies)
This article has not been copyedited and formatted. The final version may differ from this version.JPET Fast Forward. Published on September 7, 2017 as DOI: 10.1124/jpet.117.242909
at ASPE
T Journals on June 20, 2018
jpet.aspetjournals.orgD
ownloaded from

JPET #242909
11
was added and cells were analyzed on a FACSVerse flow cytometer (BD Biosciences). The percentages of
CD25+ T cells within viable CD4+CD8+CD19- T cells were determined using FCSExpress Software
(DeNovo Software, Glendale, CA). EC50 values were determined by curve fitting of the experimental results
using Dotmatics software.
PK Healthy Volunteers. Acalabrutinib was tested in an escalating dose, safety, and PK/PD study in healthy
adult volunteers. Two oral doses of 2.5, 5, 25, 50 mg were administered twelve hours apart on a single day,
or administered as a single dose of 75 or 100 mg (Study ACE-HV-001). The study was performed in
accordance with the ethical principles stated in the Declaration of Helsinki, US FDA regulation 21 CFR 312,
Parts 50 and 56, ICH GCP. All subjects provided informed consent on an IRB-approved protocol.
Acalabrutinib was administered after an overnight fast and blood samples were collected for pharmacokinetic
(PK) analysis at predose and 15 and 30 minutes, 1, 1.5, 2, 3, 4, 6, 8, 12, 13, 14, 15, 16, 18, 20, 24, 36, 48 and
60 hours postdose (± 5 minutes). Plasma concentrations of acalabrutinib were determined using a validated
analytical liquid chromatography-tandem mass spectrometry (LC-MS/MS) method against a stable labeled
internal standard at Basi (West Lafayette, IN) in lithium heparin plasma. The quantification range for
acalabrutinib was 1-1000 ng/mL.
PK analyses were performed using noncompartmental methods with Phoenix WinNonlin software, (version
6.3, Pharsight Inc., Mountain View, CA) and GraphPad Prism (v 6.00 for Windows, GraphPad Software Inc.,
La Jolla, CA). The Cmax and Tmax were taken directly from the individual’s data. The following PK
parameters were derived from the plasma concentrations of acalabrutinib: area under the concentration-time
curve (AUC) from time 0 to last quantifiable concentration (AUC0-last); AUC from time 0 to infinity (AUC0‐
inf); maximum observed plasma concentration (Cmax); time to reach Cmax (Tmax); terminal elimination half-life
(t1/2); terminal elimination rate constant (λz); The AUC0-12, AUC0-24 and AUC0-∞ (where data permit) were
calculated using the linear trapezoidal method (log / linear rule). As data permit, the elimination rate constant,
lambda z (λz), was calculated as the negative of the slope of the terminal log-linear segment of the plasma
concentration-time curve. The elimination half-life (t1/2) was calculated according to the following equation:
t1/2 = 0.693/λz. Oral clearance (CL/F) and volume of distribution (Vz/F) were calculated according to: CL/F
= (Dose/AUCINF) and Vz/F = Dose/λz • AUCINF.
This article has not been copyedited and formatted. The final version may differ from this version.JPET Fast Forward. Published on September 7, 2017 as DOI: 10.1124/jpet.117.242909
at ASPE
T Journals on June 20, 2018
jpet.aspetjournals.orgD
ownloaded from

JPET #242909
12
RESULTS
On Target Biochemical and Functional Characterization and Modeling of BTK Inhibitor Interactions.
Acalabrutinib (1) displayed low nanomolar inhibition in the IMAP assay with an IC50 value of 5.1 nM. In a
head-to-head comparison in the same biochemical assay, ibrutinib (2) had a potency (as measured by IC50)
of 1.5 nM, while the potency of spebrutinib (3) was 2.3 nM (Figure 2). However, the inhibitory potential of
spebrutinib was lower in BCR-mediated cell surface expression of CD69 in peripheral blood mononuclear
cells (PBMC) and in the human whole blood (hWB) assay. In the latter assay, acalabrutinib (EC50 9.2 ± 4.4
nM) and ibrutinib (EC50 5.8 ± 3.0 nM) showed no statistically significant difference; whereas, spebrutinib
was less potent with an EC50 of 140 nM. Inversion of the stereochemistry of acalabrutinib had a profound
effect on the inhibitory potency of BTK, as demonstrated by the ∼130-fold loss in the IMAP assay. The cell-
based EC50 values of the R-enantiomer (4) were consistent with this observation as well, being 592 nM and
1,530 nM in the PBMC and hWB assays, respectively.
Figure 1 shows a model of the acalabrutinib:BTK complex that was created by docking acalabrutinib into the
ATP pocket of BTK using a co-crystal structure of a reversible inhibitor:BTK complex (pdb entry 3GEN).
The model included minimization of two amino acids residues to accommodate the back pocket filling
substituent of acalabrutinib, Met449 and Leu542. This model indicates that H-bonding capabilities of the
central 8-aminoimidazopyrazine moiety with Met477 and Glu475 in the hinge region are present. The 2-
pyridylbenzamide shows hydrogen bonding interactions with Ser538 and Asp539.
The importance of the 2-pyridyl nitrogen was further elucidated by profiling compounds in which the 2-
pyridyl nitrogen is moved to the 3- and 4-position, respectively. Compounds containing 3-pyridyl (5) and 4-
pyridyl (6) moieties were 840- and 360-fold less potent than acalabrutinib in the biochemical assay. Absence
of activity was confirmed in peripheral B cells in functional assays using human PBMC and hWB with EC50
> 4 µM for both compounds (Figure 2). Data generated on additional compounds highlight the relevance of
the positioning of the H-bonding partners when the amide as the linker is employed (Supplemental Table 1).
We also explored the impact of (un)substituted acrylamide functions as in compounds 7, 8 and 9.
Unsubstituted acrylamide compound 7 is generally three-fold more potent in the biochemical and cell-based
assays compared with acalabrutinib. However, introduction of a methyl group on the β- (as in 8) or α-position
This article has not been copyedited and formatted. The final version may differ from this version.JPET Fast Forward. Published on September 7, 2017 as DOI: 10.1124/jpet.117.242909
at ASPE
T Journals on June 20, 2018
jpet.aspetjournals.orgD
ownloaded from

JPET #242909
13
(9) of the acrylamide reduced the biochemical and cell-based potency by ≥ 100- and ≥ 900-fold, respectively.
To demonstrate the relative contribution of affinity and inactivation rate, the KI and kinact were determined
for compounds 1, 2, 3 and 7 (Supplemental Table 2). The higher potency of acrylamide compound 7
compared to acalabrutinib seems to depend primarily on a faster inactivation rate (kinact) as the affinity (KI)
was relatively similar. For ibrutinib, the affinity component appears to be a relative important contributor to
the observed potency.
Glutathione Thiol Reactivity and Kinase Selectivity. Since the microenvironment of Cys481 in BTK has
been reported to augment the nucleophilicity of the cysteine compared with some other cysteine-containing
kinases, it presents an opportunity to improve (ie, reduce) the electrophilicity of covalent binding BTK
inhibitors. The pKa of the cysteine sulfhydryl group is directly influenced by proximal amino acids
(Kortemme and Creighton, 1995; Garske et al., 2011). All TEC kinases – except ITK – contain an asparagine
(Asn) residue at the i+3 position with respect to the reactive cysteine, and this results in a reported pKa of
approximately 7.7 for Cys481 in BTK (Zapf et al., 2012). Intriguingly, the other cysteine-containing kinases
such as EGFR, ERBB2, BLK and JAK3 have an aspartate (Asp) in this position, which has been suggested
to increase the pKa, and thus lower the nucleophilicity of the sulfhydryl group. Current data suggest that the
thiol pKa increases by about 0.6 – 1.3 log units for the Asp containing kinases (Supplemental Table 3). Lower
intrinsic electrophilicity of a covalent inhibitor appears to reduce the likelihood of covalent binding to off-
target cysteines with a lower nucleophilicity, and favorably affect kinase selectivity within the kinase subset
with an Asp in the i+3 position while preserving potency for BTK.
To further substantiate whether the relative reactivity of the electrophilic moieties could impact the BTK
potency and the overall kinase selectivity profile, the inhibitors were reacted with glutathione (GSH) in a
semi-physiological setting. Acalabrutinib has a butynamide moiety, which contributes to a slower conversion
of the parent with a half-life (t1/2) of 5.5 hours (Figure 2). In contrast, the acrylamide containing compounds
ibrutinib and spebrutinib were more rapidly consumed than acalabrutinib, with average t1/2 values of 2 hours
and 1 hour, respectively. Intriguingly, compound 7 displayed a much faster turn over than acrylamides
ibrutinib and spebrutinib. The closer proximity of the electrophile in 7 to the electron-deficient central
heteroaryl imidazopyrazine moiety could augment the electrophilicity, and may explain the lower t½ average
This article has not been copyedited and formatted. The final version may differ from this version.JPET Fast Forward. Published on September 7, 2017 as DOI: 10.1124/jpet.117.242909
at ASPE
T Journals on June 20, 2018
jpet.aspetjournals.orgD
ownloaded from

JPET #242909
14
of 0.6 hour. Methyl compounds 8 and 9 lose the capacity to react with GSH, which suggests that the degree
of BTK inhibition observed could be due to reversible binding (Figure 2). The observation that compound 8
still displayed some residual activity suggests that steric hindrance in proximity of Cys481 impacts the
binding potential, rather than the relative electrophilicity of the reactive group per se.
Profiling of the clinical BTK inhibitors and compound 7 on the cysteine kinase panel, distinguishes
acalabrutinib from the acrylamide compounds in terms of selectivity. All kinases with an Asp in the i+3
position were not sensitive to acalabrutinib, and the inhibition of TEC, BMX and TXK kinases was lower
than for any of the acrylamide compounds. A direct comparison of the IC50 values of acalabrutinib and
acrylamide containing compound 7, revealed the influence of the warhead choice on the cysteine-kinase
selectivity profile (Table 2). In this data set, ERBB4 is an outlier, as this is the only kinase that has a glutamate
(Glu) in the i+3 position. While the predicted cysteine pKa is at par with Asp kinases, the tested compounds
acalabrutinib, ibrutinib, spebrutinib and acrylamide 7 all displayed single or double digit nM inhibition in the
biochemical assay for ERBB4. Since spebrutinib was the most reactive, yet the least potent on ERBB4 (IC50
= 49 nM), the inhibition of ERBB4 may be governed to a lesser extent by the electrophilic nature of the
reactive moiety. Each of the clinical BTK inhibitors were also profiled at 1 µM in a competition binding
assay on a panel of 456 human kinases (KINOME scan at DiscoveRx). Of these kinases, 395 are non-mutant
protein kinases. Our results demonstrate that acalabrutinib is the most selective BTK inhibitor of the three
compounds profiled (Figure 3). For acalabrutinib, only 1.5% of the non-mutant protein kinases were inhibited
≥65% at 1 µM. For ibrutinib and spebrutinib, 8.9% and 7.6%, respectively, of the non-mutant protein kinases
were inhibited ≥65% at 1 µM. Interestingly, strong inhibition by ibrutinib was observed for all kinases
belonging to the SRC-family kinases, which is in line with earlier published results (Honigberg et al., 2010)
and our own data (Byrd et al., 2016). Spebrutinib showed a more scattered inhibition over the kinase
phylogenetic tree. Evaluation of SRC-family kinase inhibition confirmed that acalabrutinib did not inhibit
any member (IC50 values all exceeding 1 µM); whereas, ibrutinib demonstrated single- or double-digit
nanomolar inhibition on all members tested (Supplemental Table 4).
Off-target cellular activities of BTK inhibitors. The functional relevance of the differences in the observed
biochemical inhibition of non-BTK kinases by acalabrutinib, ibrutinib, spebrutinib and compound 7 was
This article has not been copyedited and formatted. The final version may differ from this version.JPET Fast Forward. Published on September 7, 2017 as DOI: 10.1124/jpet.117.242909
at ASPE
T Journals on June 20, 2018
jpet.aspetjournals.orgD
ownloaded from
JPET #242909
15
explored in specific cell lines. EGFR inhibition of selected BTK inhibitors was tested in two EGFR
expressing human tumor cells lines: An epidermoid carcinoma (A431) cell line (Table 3) and a bladder
carcinoma (HT-1376) cell line (Supplemental Figure 1). Both cell lines gave similar EC50 values for the
tested compounds on EGF-induced EGFR phosphorylation. Acalabrutinib showed no or only minimal
inhibition up to a concentration of 10 µM. Results with compound 7 suggest that this is due to the electrophile
switch from acrylamide to butynamide. Spebrutinib inhibited EGF-induced EGFR phosphorylation with an
EC50 of 4.7 µM, which suggests that the reactivity of electrophile is not the only parameter relevant for kinase
selectivity. Ibrutinib inhibited EGF-induced EGFR phosphorylation in A431 cells with an EC50 value of 71
nM.
The compounds were also evaluated in T cell functional assays. First, the compounds were profiled in anti-
CD3/CD28-induced IL-2 production in Jurkat T cells, using a Jurkat E6 T cell clone with high IL-2
expression following stimulation. Ibrutinib and spebrutinib showed inhibition of anti-CD3/anti-CD28-
induced IL-2 production with an EC50 of 99 and 150 nM, respectively (Table 3). Also, in line with the
biochemical data on ITK, compound 7 was less potent in the Jurkat T cell assay than ibrutinib and spebrutinib.
Acalabrutinib displayed an EC50 > 10 µM in the Jurkat T cell assay, which is expected given its biochemical
selectivity over T cell kinases ITK and TXK. In addition, effects in PBMC were studied by measuring the
inhibition of anti-CD3-induced CD25 cell surface expression on human peripheral T cells. The order of
inhibitory potential of the tested compounds followed the ranking as determined in Jurkat cells, with ibrutinib
being the most potent (EC50 = 257 nM) and acalabrutinib being the least potent (EC50 > 10 µM) (Table 3).
Preclinical PD model in mice. To investigate potency in vivo, mice were treated with oral doses ranging
from 0.1 – 30 mg/kg of acalabrutinib, ibrutinib, spebrutinib, or with vehicle. Three hours after dosing, spleens
were extracted and single cell suspensions of splenocytes were prepared. The splenocytes were stimulated
with anti-IgM for 18h, followed by analysis of CD69 expression by flow cytometry gated on CD19+ B cells
(Figure 4). ED50 determinations showed that acalabrutinib was the most potent BTK inhibitor in vivo (1.3
mg/kg), followed by ibrutinib (2.9 mg/kg), and spebrutinib (20 mg/kg). Due to the covalent nature of binding,
BTK inhibitors have been shown to have a prolonged PD effect even as plasma drug levels fall to undetectable
levels. To investigate this, a return of function (ROF) experiment was performed investigating anti-IgM-
This article has not been copyedited and formatted. The final version may differ from this version.JPET Fast Forward. Published on September 7, 2017 as DOI: 10.1124/jpet.117.242909
at ASPE
T Journals on June 20, 2018
jpet.aspetjournals.orgD
ownloaded from

JPET #242909
16
induced CD69 expression on the splenocyte B cells and BTK target occupancy in the splenocytes. The potent
biotinylated probe ACP-4016 (10) was developed to support development of an ELISA-based BTK target
occupancy assay (Figure 4D). The biochemical IC50 value of the probe averaged 2.2 nM (Supplemental Table
1). Mice (five per group) were dosed orally with a single dose of acalabrutinib, ibrutinib, spebrutinib (25
mg/kg) or vehicle. Spleens were extracted 3, 6, 12, 18 or 24h after dosing and single cell suspensions were
prepared. Splenocytes were cultured and stimulated with anti-IgM for 18h, followed by CD69 surface
expression measurement (Figure 4B), or used directly in the BTK target occupancy assay (Figure 4C).
Acalabrutinib and ibrutinib showed (near) complete BTK occupancy along with complete inhibition of anti-
IgM-induced CD69 expression on splenocyte B cells for the 3h post-dose time point. These results are in line
with the dose response data showing full inhibition of splenocyte B cells at oral doses ≥ 10 mg/kg for
acalabrutinib and ibrutinib, 3h after dosing. Additional experiments demonstrated that complete BTK target
occupancy and full B cell de-activation is already achieved 1h after dosing (data not shown). In contrast, a
25-mg/kg dose of spebrutinib showed incomplete BTK target occupancy (~15% free BTK versus vehicle
control) and inhibition of anti-IgM-induced CD69 expression on peripheral B cells (~25% remaining activity
versus vehicle control). This again corresponded with the observed higher ED50 of 20 mg/kg for this BTK
inhibitor. Over time, an increase in the amount of free BTK and an increase in splenocyte B cell function is
demonstrated, as measured by function of anti-IgM-induced CD69 expression. However, BTK target
occupancy and inhibition of B cell function was still observed 24 hours post-dose. Acalabrutinib and ibrutinib
displayed around 35% free BTK and 40% B cell activity versus vehicle control at 24 hours post-dose, whereas
for spebrutinib, ~55% free BTK and 75% splenocyte B cell activity was observed at this time point. The
average return rate for all three BTK inhibitors was estimated using linear fitting of the data for the return of
B cell function (anti-IgM-induced CD69 expression on splenocyte B cells) and the return of free BTK. These
return rates were 2.0 ± 0.2% and 1.7 ± 0.1% per hour, respectively.
PK/PD Healthy Volunteers. PK properties and safety of acalabrutinib were evaluated in a sequential dose-
escalation study in healthy adult volunteers (six per group) after oral administration of two doses of 2.5, 5,
25, or 50 mg given twelve hours apart on a single day and a single dose of either 75 or 100 mg. Acalabrutinib
was rapidly absorbed with median time to maximum plasma concentration (Tmax) values between 0.5 and 1.0
This article has not been copyedited and formatted. The final version may differ from this version.JPET Fast Forward. Published on September 7, 2017 as DOI: 10.1124/jpet.117.242909
at ASPE
T Journals on June 20, 2018
jpet.aspetjournals.orgD
ownloaded from

JPET #242909
17
hour for all dose cohorts, independent of dose level (Supplemental Figure 2, Supplemental Table 5). The
increase in mean Cmax was greater than dose proportional from 5 to 25 mg. However, between 2.5 to 5.0 mg,
25 to 50 mg, and 50 mg to 100 mg, the increases in mean Cmax were close to dose proportional. The mean
values AUC0-12, AUC0-24 or AUC0-inf, increased in a dose proportional manner based on the increases of the
total dose administered (Figure 5A). Linear regression analysis of the natural log (ln) transformed AUC0-24
and AUC0-inf relative to the ln transformed dose administered, indicated that the increases in AUC relative to
the increases in dose administered were linear. Rapid elimination was observed with mean half-life (t1/2)
values ranging from 0.88 hour to 2.1 hours in Cohort 1 to 5. The mean calculated CL/F values ranged from
165 to 219 L/h and appeared to be independent of the dose administered. The Vz/F values ranged from 233
to 612 L and also appeared to be independent of the dose administered.
Sixteen of 59 (27%) enrolled subjects reported one or more adverse events on study. All adverse events were
Grade 1 or Grade 2. No serious adverse events occurred on the study. Of the adverse events reported, 3
events (constipation, somnolence and feeling cold) were assessed as related to acalabrutinib. No study-drug
related adverse events lead to discontinuation from the study. No effect of acalabrutinib was observed on
any laboratory parameters (ie, hematology, serum chemistry, urinalysis, cardiac troponin I and C reactive
protein). No effect was observed of acalabrutinib on physical exams, vital signs or ECG parameters.
The pharmacodynamics of acalabrutinib was evaluated using the BTK occupancy assay and measuring the
inhibition of CD69 expression on B cells after ex vivo BCR-stimulation. Both PD readouts were dose-
dependent, with a plateau observed at the 75- and 100-mg dose levels, 3 hours after acalabrutinib
administration. At this timepoint, the degree of BTK median occupancy was around 99% for the 75- and 100-
mg dose (Figure 5B). This correlated with near complete inhibition for CD69 (Figure 5C) for the same doses
and time point. However, only the 100-mg cohort maintained high BTK median occupancy and high BCR
functional inhibition over time (Figure 5D). At 12 hours, the median occupancy was 99% and median CD69
inhibition was 95%, whereas at 24 hours these parameters were 90% and 84%, respectively. CD86
expression levels were also determined in parallel and essentially matched the inhibition of CD69 expression
(data not shown).
This article has not been copyedited and formatted. The final version may differ from this version.JPET Fast Forward. Published on September 7, 2017 as DOI: 10.1124/jpet.117.242909
at ASPE
T Journals on June 20, 2018
jpet.aspetjournals.orgD
ownloaded from

JPET #242909
18
DISCUSSION
Acalabrutinib was identified as a BTK inhibitor with a differentiated kinase selectivity profile compared to
other BTK inhibitors in development. Key structural components of acalabrutinib include a 2-
pyridylbenzamide moiety, and the electrophilic 2-butynamide moiety that is involved in covalent binding to
Cys481. The proximal positioning of the 2-butynamide moiety to the electron-deficient (and thus electron-
withdrawing) imidazopyrazine core may help to re-activate this otherwise fairly inert functionality. The
potency difference of the enantiomeric pair (compare acalabrutinib and 4) showed that the activity primarily
resides in the S-enantiomer, suggesting better positioning of the butynamide moiety. As demonstrated in the
GSH assay, acalabrutinib displayed lower reactivity than acrylamides ibrutinib, spebrutinib and compound
7. This may help to minimize inhibition of cysteine kinases that exhibit higher cysteine pKa values equivalent
to Cys481 in BTK. Indeed, acalabrutinib is the most selective with regards to inhibition of TEC-, EGFR- and
SRC-family kinases. The correlation of biochemical off-target inhibition and functional consequences in
selected cell lines was confirmed for different kinases.
Inhibitors of the EGFR signaling pathway cause skin rash and diarrhea, and these toxicities are believed to
be “class effects” (Lynch et al., 2007; Dy and Adjei, 2013). With respect to the inhibitory potential for EGFR,
the rank order of compounds was identical in biochemical and cellular settings, acalabrutinib showing a lack
of functional inhibitory effects (EC50 >10 µM). The events of diarrhea reported during acalabrutinib treatment
of CLL patients (38% grades 1-2, 39% all grades) have been generally mild (Byrd et al., 2016). Given the
observed exposure levels of acalabrutinib following a single oral dose of 100 mg (580 ± 150 ng/mL), and the
absence of effects on pEGFR inhibition in two relevant cell lines at these concentrations, we do not expect
to see EGFR-mediated adverse events for acalabrutinib.
ITK signaling in Jurkat cells and in primary human peripheral T cells correlated with the biochemical IMAP
data. The drug concentrations needed to inhibit IL-2 production in Jurkat cells and modulation of human
peripheral T cells may well be achieved in patients treated with ibrutinib or spebrutinib (Dubovsky et al.,
2013; Evans et al., 2013), and therefore may bear physiological relevance. Indeed, ibrutinib is a reported
irreversible covalent ITK inhibitor with confirmed occupancy on this kinase in CLL patients (Dubovsky et
al., 2013). Treatment with ibrutinib reduced the number of Th17 T cells as a percentage of the total T cell
This article has not been copyedited and formatted. The final version may differ from this version.JPET Fast Forward. Published on September 7, 2017 as DOI: 10.1124/jpet.117.242909
at ASPE
T Journals on June 20, 2018
jpet.aspetjournals.orgD
ownloaded from

JPET #242909
19
population in CLL patients, as well as Th17 development from mouse naïve CD4+ T cells. The mouse
observations are in line with data reported for ITK -/- mice, in which a shift in the balance from Th17 to
Tregs was observed (Gomez-Rodriguez et al., 2014). The same authors reported that this effect is even more
pronounced in ITK/TXK -/- mice (Gomez-Rodriguez et al., 2011), indicating redundancy between ITK and
TXK. Since ibrutinib inhibits both ITK and TXK in the low nM range in the biochemical assays, the effects
of ibrutinib on T cell differentiation most likely mimic the double knockout phenotype. ITK is also expressed
in NK cells, and inhibition thereof has been reported to decrease the antibody-dependent cellular cytotoxicity
(ADCC) function of NK cells (Khurana et al., 2007). It was reported that ibrutinib inhibited both rituximab-
and trastuzumab-induced NK cell cytokine secretion and lysis in vitro in a dose-dependent manner (0.1 and
1 µM), while acalabrutinib did not show any effects at 1 µM (Rajasekaran et al., 2014). This indicates that
acalabrutinib is associated with a reduced risk of affecting ADCC-mediated therapies.
An increased incidence in severe hemorrhage was reported in patients treated with ibrutinib, and has been
attributed to the effect of ibrutinib on several distinct signaling pathways (Byrd et al., 2015; Shatzel et al.,
2017; Wang et al., 2015). Therefore, patients receiving ibrutinib are monitored to reduce the potential of
bleeding risk. While the role of BTK on collagen-induced platelet aggregation has been well described, there
is no general increase of bleeding risk in XLA patients lacking functional BTK (Quek et al., 1998;
Winkelstein et al., 2006), suggesting that BTK inhibition alone is likely not responsible for increased bleeding
risk. In platelets, the downstream signaling of several receptors on platelets, including the platelet collagen
receptor glycoprotein VI (GPVI) and C-type lectin-like receptor 2 (CLEC-2), is mediated by BTK and TEC
(Shatzel et al., 2017). Earlier, we reported on differences in platelet aggregation using platelets from patients
treated with acalabrutinib or ibrutinib (Byrd et al., 2016). In an in vivo thrombus formation model, diminished
platelet reactivity was observed in samples from patients treated with ibrutinib, while platelets from
acalabrutinib-treated patients showed similar reactivity to those derived from non-treated, healthy controls.
As TEC kinase phosphorylation is highly dependent on platelet aggregation (Atkinson et al., 2003; Hamazaki
et al., 1998), the level of TEC inhibition may govern the bleeding risk. The relative biochemical IC50 values
for TEC of acalabrutinib (126 nM) and ibrutinib (10 nM) may well contribute to the observed differences in
the above model. In addition, inhibition of SRC family kinases by ibrutinib may also play a role in the
observed bleeding incidence in ibrutinib-treated patients through modulation of fibrinogen- and von
This article has not been copyedited and formatted. The final version may differ from this version.JPET Fast Forward. Published on September 7, 2017 as DOI: 10.1124/jpet.117.242909
at ASPE
T Journals on June 20, 2018
jpet.aspetjournals.orgD
ownloaded from

JPET #242909
20
Willebrand factor-induced platelet activation (Séverin et al., 2012; Senis et al., 2014). Even though inhibition
of these kinases by ibrutinib is reversible of nature, modulation of SRC-mediated platelet activation may be
anticipated at exposure levels observed in ibrutinib-treated patients. For instance, it has been reported that
ibrutinib demonstrated potent inhibition of phosphorylation of SRC-family members LCK and SRC in T
cells, with an EC50 of less than 0.2 μM, whereas the EC50 for acalabrutinib was not reached at 10 μM (Patel
et al., in press). Again, these data correspond well with the nanomolar inhibition by ibrutinib for both SRC
and LCK. Taken together, these observations indicate that effects of ibrutinib on bleeding could be
multifactorial. The improved selectivity profile of acalabrutinib for BTK versus TEC and certain SRC-family
kinases may prove advantageous in this regard.
Overall, the biochemical potency of all compounds tested for BTK activity traced well with the inhibitory
potential of marker CD69 in our PBMC and hWB assays, except for spebrutinib. For instance, the potency
of BTK-mediated inhibition of peripheral B cell function in hWB was approximately 15-fold lower for
spebrutinib than for acalabrutinib and ibrutinib. This suggests that plasma proteins or other components of
hWB (eg, red blood cells, platelets or neutrophils) may contribute to a lower free fraction of spebrutinib that
is available for BTK inhibition. The in vivo potency data generated in the mouse PD model mirrored the
cellular data generated, except that acalabrutinib showed better potency than ibrutinib in vivo. With
spebrutinib, efficacy could be obtained at higher dosages, but potency was inferior to acalabrutinib and
ibrutinib. Evaluation of return of free BTK and return of B cell function in mice, demonstrated that the return
rate is independent of the type of BTK inhibitor tested. Hence, the de novo synthesis rate of BTK is the
primary driver for the loss of PD effect in a single dose setting.
In human healthy subjects, acalabrutinib is an orally bioavailable BTK inhibitor with fast absorption, dose-
proportional PK, and a short half-life in systemic circulation. Despite the short half-life, acalabrutinib had a
pronounced on-target impact in peripheral blood B cells that was dose-dependent. Complete BTK occupancy
was observed 3 and 12 hours after a single 100-mg dose indicating a saturating concentration was achieved
that resulted in near-complete inhibition of a BCR-induced functional response (ie, CD69 expression). Both
measures remained high for 24 hours. Therefore, covalent modification of BTK by acalabrutinib prolonged
target occupancy and PD that extend beyond the relatively short plasma-half-life in healthy volunteers. In
patient populations with more rapidly proliferating B cells, we anticipate an increased de novo synthesis rate
This article has not been copyedited and formatted. The final version may differ from this version.JPET Fast Forward. Published on September 7, 2017 as DOI: 10.1124/jpet.117.242909
at ASPE
T Journals on June 20, 2018
jpet.aspetjournals.orgD
ownloaded from

JPET #242909
21
of BTK, suggesting that more frequent dosing may be required to achieve optimal BTK inhibition. Indeed, a
100-mg BID dose in CLL patients showed a higher median BTK occupancy, with less variability at trough,
than the 100-mg and 250-mg QD cohorts (Byrd et al., 2016). This illustrates that maximal target coverage
can be achieved with BID dosing, which we believe is advantageous for optimal treatment across B-cell
malignancy patient populations.
In conclusion, monitoring SRR may help to mitigate the risk for off-target adverse events related to reactivity
of the electrophile (Barf and Kaptein, 2012). Low electrophilicity is an important feature to consider to
progress the most suitable covalent inhibitor candidates through the pipeline. The use of a straightforward
GSH assay to assess the likelihood and the kinetics of covalent binding has revealed a difference in reactivity
between compounds containing butynamide and acrylamide moieties. We believe that the lower
electrophilicity of acalabrutinib along with higher nucleophilicity of Cys481 in BTK contributes to the
observed selectivity profile, which may reduce off-target mediated adverse events. In combination with the
improved in vivo potency, acalabrutinib appears to have a differentiated pre-clinical profile from ibrutinib
and spebrutinib. Selective covalent BTK probe 10 helped to confirm the correlation of the degree of BTK
occupancy and engagement by acalabrutinib in preclinical and clinical settings. Acalabrutinib is a rapidly
absorbed covalent BTK inhibitor with a short half-life, yet reaches full target occupancy at a single oral dose
of 100 mg in healthy human subjects. Clinical evaluation of acalabrutinib in multiple B-cell malignancies,
solid tumors and selected autoimmune indications is currently in progress.
This article has not been copyedited and formatted. The final version may differ from this version.JPET Fast Forward. Published on September 7, 2017 as DOI: 10.1124/jpet.117.242909
at ASPE
T Journals on June 20, 2018
jpet.aspetjournals.orgD
ownloaded from

JPET #242909
22
ACKNOWLEDGMENTS
We thank Anouk de Jong for performing the PBMC T cell assays, Tim Ingallinera for preparing the in vivo
formulations for the mouse PD experiments, Gerjan de Bruin for analysis of the KI and kinact data, and Greg
Slatter for the discussion on the human PK/PD data. BioAxis Research BV is acknowledged for the pKa
modeling of kinase cysteines. Final versions of the figures were created by Cognition Studios.
This article has not been copyedited and formatted. The final version may differ from this version.JPET Fast Forward. Published on September 7, 2017 as DOI: 10.1124/jpet.117.242909
at ASPE
T Journals on June 20, 2018
jpet.aspetjournals.orgD
ownloaded from

JPET #242909
23
AUTHORSHIP CONTRIBUTIONS
Participated in research design: Barf, Covey, Izumi, Gulrajani, Mittag, Pearson, Ulrich and Kaptein
Conducted experiments: Barf, van de Kar, Gulrajani, van Lith, van Hoek, de Zwart, Mittag, Demont, Verkaik,
Krantz
Performed data analysis: Barf, Covey, Izumi, van de Kar, Gulrajani, van Lith, van Hoek, de Zwart, Mittag,
Demont, Verkaik, Krantz, Pearson, and Kaptein
Wrote or contributed to the writing of the manuscript: Barf, Covey, Izumi, Pearson, and Kaptein.
This article has not been copyedited and formatted. The final version may differ from this version.JPET Fast Forward. Published on September 7, 2017 as DOI: 10.1124/jpet.117.242909
at ASPE
T Journals on June 20, 2018
jpet.aspetjournals.orgD
ownloaded from

JPET #242909
24
REFERENCES
Atkinson BT, Ellmeijer W, and Watson SP (2003) Tec regulates platelet activation by GPVI in the absence
of Btk Blood 102: 3592–3599.
Barf T and Kaptein A (2012) Irreversible protein kinase inhibitors: Balancing the benefits and risks J Med
Chem 55: 6243–6262.
Bender AT, Pereira A, Fu K, Samy E, Wu Y, Liu-Bujalski L, Caldwell R, Chen Y-Y, Tian H, Morandi F,
Head J, Koehler U, Genest M, Okitsu SL, Xu D, and Grenningloh R (2016) Btk inhibition treats
TLR7/IFN driven murine lupus Clin Immunol 164: 65–77.
Brown JR, Harb WA, Hill BT, Gabrilove J, Sharman JP, Schreeder MT, Barr PM, Foran JM, Miller TP,
Burger JA, Kelly KR, Mahadevan D, Ma S, Li Y, Pierce DW, Barnett E, Marine J, Miranda M, Azaryan
A, Yu X, Nava-Parada P, Mei J, and Kipps TJ (2016) Phase I study of single-agent CC-292, a highly
selective Bruton’s tyrosine kinase inhibitor, in relapsed/refractory chronic lymphocytic leukemia
Haematologica 101: e295–298.
Byrd JC, O'Brien S, and James DF (2013) Ibrutinib in relapsed chronic lymphocytic leukemia. N Engl J Med
369: 1278–1279.
Byrd JC, Furman RR, Coutre SE, Burger JA, Blum KA, Coleman M, Wierda WG, Jones JA, Zhao W,
Heerema NA, Johnson JA, Shaw Y, Bilotti E, Zhou C, James DF, and O’Brien S (2015) Three-year
follow-up of treatment-naïve and previously treated patients with CLL and SLL receiving single-agent
ibrutinib Blood 125: 2497–2506.
Byrd JC, Harrington, B, O’Brien S, Jones JA, Schuh A, Devereux S, Chaves J, Wierda WG, Awan FT,
Brown, JR Hillmen P, Stephens DM, Ghia P, Barrientos JC, Pagel JM, Woyach J, Johnson D, Huang J,
Wang X, Kaptein A, Lannutti, BJ, Covey T, Fardis M, McGreivy J, Hamdy A, Rothbaum W, Izumi R,
Diacovo TG, Johnson AJ, and Furman RR (2016) Acalabrutinib (ACP-196) in Relapsed Chronic
Lymphocytic Leukemia. N Engl J Med 374: 323–332.
de Weers M, Verschuren MC, Kraakman ME, Mensink RG, Schuurman RK, van Dongen JJ, and Hendriks
RW (1993) The Bruton’s tyrosine kinase gene is expressed throughout B-cell differentiation, from early
This article has not been copyedited and formatted. The final version may differ from this version.JPET Fast Forward. Published on September 7, 2017 as DOI: 10.1124/jpet.117.242909
at ASPE
T Journals on June 20, 2018
jpet.aspetjournals.orgD
ownloaded from
JPET #242909
25
precursor B-cell stages preceding immunoglobulin gene rearrangement up to mature B-cell stages Eur
J Immunol 23: 3109–3114.
Dubovsky JA, Beckwith KA, Natarajan G, Woyach JA, Jaglowski S, Zhong Y, Hessler JD, Liu T-M, Chang
BY, Larkin KM, Stefanovski MR, Chappell DL, Frissora FW, Smith LL, Smucker KA, Flynn JM, Jones
JA, Andritsos LA, Maddocks K, Lehman AM, Furman R, Sharman J, Mishra A, Caligiuri MA, Satoskar
AR, Buggy JJ, Muthusamy N, Johnson AJ, and Byrd JC (2013) Ibrutinib is an irreversible molecular
inhibitor of ITK driving a Th1-selective pressure in T lymphocytes Blood 122: 2539–2549.
Dy GK and Adjei AA (2013) Understanding, recognizing, and managing toxicities of targeted anticancer
therapies CA Cancer J Clin 63: 249–279.
Ellmeier W, Abramova A, and Schebesta A (2011) Tec family kinases: regulation of FcɛRI-mediated mast
cell activation FEBS J 278: 1990–2000.
Evans EK, Tester R, Aslanian S, Karp R, Sheets M, Labenski MT, Witowski SR, Lounsbury H, Chaturvedi
P, Mazdiyasni H, Zhu Z, Nacht M, Freed MI, Petter RC, Dubrovskiy A, Singh J, and Westlin WF (2013)
Inhibition of Btk with CC-292 provides early pharmacodynamic assessment of activity in mice and
humans J Pharmcol Exp Ther 346: 219–228.
Garske AL, Peters U, Cortesi AT, Perez JL, and Shokat KM (2011) Chemical genetic strategy for targeting
protein kinases based on covalent complementarity Proc Natl Acad Sci USA 108: 15046–15052.
Gomez-Rodriguez J, Kraus ZJ, and Schwartzberg PL (2011) Tec family kinases Itk and Rlk ⁄ Txk in T
lymphocytes: cross-regulation of cytokine production and T-cell fates FEBS Journal 278: 1980–1989.
Gomez-Rodriguez J, Wohlfert EA, Handon R, Meylan F, Wu JZ, Anderson, SM, Kirby MR, Belkaid, Y, and
Schwartzberg PL (2014) Itk-mediated integration of T cell receptor and cytokine signaling regulates
the balance between Th17 and regulatory T cells J Exp Med 211: 529–543.
Grenningloh R (2016) Discovery of the highly specific BTK inhibitor M2951 and Pharmacodynamic
Modeling of BTK Occupancy versus Efficacy in RA and SLE models 14th Annual Discovery on Target,
Boston (MA).
Hamazaki Y, Kojima H, Mano H, Nagata Y, Todokoro K, Abe T, and Nagasawa T (1998) Tec is involved
in G protein-coupled receptor-and integrin-mediated signaling in human blood platelets Oncogene 16:
2773–2779.
This article has not been copyedited and formatted. The final version may differ from this version.JPET Fast Forward. Published on September 7, 2017 as DOI: 10.1124/jpet.117.242909
at ASPE
T Journals on June 20, 2018
jpet.aspetjournals.orgD
ownloaded from
JPET #242909
26
Hendriks RW, Yuvaraj S, and Kil LP (2014) Targeting Bruton's tyrosine kinase in B-cell malignancies Nat
Rev Cancer 14: 219–232.
Herman SEM, Montraveta A, Niemann CU, Mora-Jensen H, Gulrajani M, Krantz F, Mantel R, Smith LL,
McClanahan F, Harrington BK, Colomer D, Covey T, Byrd JC, Izumi R, Kaptein A, Ulrich R, Johnson
AJ, Lannutti BJ, Wiestner A, and Woyach JA (2016) The Bruton Tyrosine Kinase (BTK) Inhibitor
Acalabrutinib Demonstrates Potent On-Target Effects and Efficacy in Two Mouse Models of Chronic
Lymphocytic Leukemia Clin Cancer Res doi: 10.1158/1078-0432.CCR-16-0463.
Honigberg L, Smith AM, Sirisawad M, Verner E, Loury D, Chang B, Li S, Pan Z, Thamm DH, Miller RA,
and Buggy JJ (2010) The Bruton tyrosine kinase inhibitor PCI-32765 blocks B-cell activation and is
efficacious in models of autoimmune disease and B-cell malignancy Proc Natl Acad Sci USA 107:
13075–13080.
Jongstra-Bilen J, Puig Cano A, Hasija M, Xiao H, Smith CI, and Cybulsky MI.(2008) Dual functions of
Bruton’s tyrosine kinase and Tec kinase during Fcgamma receptor-induced signaling and phagocytosis
J Immunol 181: 288–298.
Katz FE, Lovering RC, Bradley LA, Rigley KP, Brown D, Cotter F, Chessells JM, Levinsky RJ, and Kinnon
C (1994) Expression of the X‑linked agammaglobulinemia gene, btk in B-cell acute lymphoblastic
leukemia Leukemia 8: 574–577.
Khurana D, Arneson, LN, Schoon, RA, Dick, CJ, and Leibson PJ (2007) Differential regulation of human
NK cell-mediated cytotoxicity by the tyrosine kinase Itk J Immunol 178: 3575–3582.
Kortemme T and Creighton TE (1995) Ionisation of cysteine residues at the termini of model alpha-helical
peptides. Relevance to unusual thiol pKa values in proteins of the thioredoxin family J Mol Biol 253:
799−812.
Lynch TJ Jr, Kim ES, Eaby B, Garey J, West DP, and Lacouture ME (2007) Epidermal growth factor receptor
inhibitor-associated cutaneous toxicities: an evolving paradigm in clinical management Oncologist 12:
610–621.
Norman P (2016) Investigational Bruton’s tyrosine kinase inhibitors for the treatment of rheumatoid arthritis
Exp Opin Invest Drugs 25: 891–899.
This article has not been copyedited and formatted. The final version may differ from this version.JPET Fast Forward. Published on September 7, 2017 as DOI: 10.1124/jpet.117.242909
at ASPE
T Journals on June 20, 2018
jpet.aspetjournals.orgD
ownloaded from

JPET #242909
27
O’Brien S, Furman RR, Coutre SE, Sharman JP, Burger JA, Blum KA, Grant B, Richards DA, Coleman M,
Wierda WG, Jones JA, Zhao W, Heerema NA, Johnson AJ, Izumi R, Hamdy A, Chang BY, Graef T,
Clow F, Buggy JJ, James DF, Byrd JC (2014) Ibrutinib as initial therapy for elderly patients with
chronic lymphocytic leukaemia or small lymphocytic lymphoma: an open-label, multicenter phase 1b/2
trial Lancet Oncol 15: 48–58.
Pan Z, Scheerens H, Li S-J, Schultz BE, Sprengeler PA Burrill LC, Mendonca RV, Sweeney MD, Scott
KCK, Grothaus PG, Jeffery DA, Spoerke JM, Honigberg LA, Young PR, Dalrymple SA, and Palmer
JT (2007) Discovery of selective irreversible inhibitors for Bruton’s Tyrosine Kinase ChemMedChem
2: 58–61.
Park JK, Byun J-Y, Park JA, Kim Y-Y, Lee YJ, Oh JI, Jang SY, Kim YH, Song YW, Son J, Suh KH, Lee
Y-M, and Lee EB (2016) HM71224, a novel Bruton’s tyrosine kinase inhibitor, suppresses B cell and
monocyte activation and ameliorates arthritis in a mouse model: a potential drug for rheumatoid arthritis
Arthritis Res Ther 18: 1–9.
Patel V, Balakrishnan K, Bibikova E, Ayres M, Keating MJ, Wierda WG, and Gandhi V (2016) Comparison
of acalabrutinib, a selective Bruton tyrosine kinase inhibitor, with ibrutinib in chronic lymphocytic
leukemia cells Clin Cancer Res doi: 10.1158/1078-0432.CCR-16-1446.
Ponader S and Burger JA (2014) Bruton's Tyrosine Kinase: From X-Linked Agammaglobulinemia Toward
Targeted Therapy for B-Cell Malignancies J Clin Oncol 32: 1830–9.
Quek LS, Bolen J, and Watson SP (1998) A role for Bruton's tyrosine kinase (Btk) in platelet activation by
collagen Curr Biol 8:1137–1140.
Rajasekaran N, Sadaram M, Hebb J, Sagiv-Barfi I, Ambulkar S, Rajapaksa A, Chang S, Chester C, Waller
E, Wang L, Lannutti B, Johnson D, Levy R, and Kohrt HE (2014) Three BTK-Specific Inhibitors, in
Contrast to Ibrutinib, Do Not Antagonize Rituximab-Dependent NK-Cell Mediated Cytotoxicity Blood
124: 3118.
Senis YA, Mazharian A, and Mori J (2014) Src family kinases: at the forefront of platelet activation Blood
124: 2013–2024.
This article has not been copyedited and formatted. The final version may differ from this version.JPET Fast Forward. Published on September 7, 2017 as DOI: 10.1124/jpet.117.242909
at ASPE
T Journals on June 20, 2018
jpet.aspetjournals.orgD
ownloaded from

JPET #242909
28
Séverin S, Nash CA, Mori J, Zhao Y, Abram C, Lowell CA, Senis YA, and Watson SP (2012) Distinct and
overlapping functional roles of Src family kinases in mouse platelets J Thromb Haemost 10: 1631–
1645.
Shatzel JJ, Olson SR, Tao DL, McCarty OJT, Danilov AV, and DeLoughery TG (2017) Ibrutinib-associated
bleeding: pathogenesis, management, and risk reduction strategies J Thromb Haemost 15: 835–847.
Smith PF, Krishnarajah J, Nunn PA, Hill RJ, Karr D, Tam D, Masjedizadeh M, and Gourlay SG (2015) A
phase 1 clinical trial of PRN1008, an oral, reversible, covalent BTK inhibitor demonstrates clinical
safety and therapeutic levels of BTK occupancy without sustained systemic exposure EULAR Abstract
SAT0232.
Tam C, Grigg AP, Opat S, Ku M, Gilberson M, Anderson MA, Seymour JF, Ritchie DS, Dicorleto C,
Dimovski B, Hedrick E, Yang J, Wang L, Luo L, Xue L, and Roberts AW (2015) The BTK Inhibitor,
Bgb-3111, Is Safe, Tolerable, and Highly Active in Patients with Relapsed/ Refractory B-Cell
Malignancies: Initial Report of a Phase 1 First-in-Human Trial ASH 57th Annual Meeting & Exposition,
Orlando (FL) Abstract 832.
Walter HS, Rule SA, Dyer MJS, Karlin L, Jones C, Cazin B, Quittet P, Shah N, Hutchinson CV, Honda H,
Duffy K, Birkett J, Jamieson V, Courtenay-Luck N, Yoshizawa T, Sharpe J, Ohno T, Abe S, Nishimura
A, Cartron G, Morschhauser F, Fegan C, and Salles G (2016) A Phase 1 clinical trial of the selective
BTK inhibitor ONO/GS-4059 in relapsed and refractory mature B-cell malignancies Blood 127:411–
419.
Wang ML, Rule S, Martin P, Goy A, Auer R, Kahl BS, Jurczak W, Advani RH, Romaguera JE, Williams
ME, Barrientos JC, Chmielowska E, Radford J, Stilgenbauer S, Dreyling M, Jedrzejczak WW, Johnson
P, Spurgeon SE, Li L, Zhang L, Newberry K, Ou Z, Cheng N, Fang B, McGreivy J, Clow F, Buggy JJ,
Chang BY, Beaupre DM, Kunkel LA, and Blum KA (2013) Targeting BTK with ibrutinib in relapsed
or refractory mantle-cell lymphoma N Engl J Med 369: 507–516.
Wang ML, Blum KA, Martin P, Goy A, Auer R, Kahl BS, Jurczak W, Advani RH, Romaguera JE, Williams
ME, Barrientos JC, Chmielowska E, Radford J, Stilgenbauer S, Dreyling M, Jedrzejczak WW, Johnson
P, Spurgeon SE, Zhang L, Baher L, Cheng M, Lee D, Beaupre DM, and Rule S (2015) Long-term
This article has not been copyedited and formatted. The final version may differ from this version.JPET Fast Forward. Published on September 7, 2017 as DOI: 10.1124/jpet.117.242909
at ASPE
T Journals on June 20, 2018
jpet.aspetjournals.orgD
ownloaded from

JPET #242909
29
follow-up of MCL patients treated with single-agent ibrutinib: updated safety and efficacy results Blood
126: 739–745.
Whang JA and Chang BY (2014) Bruton's tyrosine kinase inhibitors for the treatment of rheumatoid arthritis
Drug Discov Today 19: 1200–1204.
Winkelstein JA, Marino MC, Lederman HM, Jones SM, Sullivan K, Burks AW, Conley ME, Cunningham-
Rundles C, and Ochs HD (2006), X-linked agammaglobulinemia: report on a United States registry of
201 patients Medicine 85: 193–202.
Zapf CW, Gerstenberger BS, Xing L, Limburg DC, Anderson DR, Caspers N, Han S, Aulabaugh A,
Kurumbail R, Shakya S, Li X, Spaulding V, Czerwinski RM, Seth N, and Medley QG (2012) Covalent
Inhibitors of Interleukin-2 Inducible T Cell Kinase (Itk) with Nanomolar Potency in a Whole-Blood
Assay J Med Chem 55: 10047–10063.
This article has not been copyedited and formatted. The final version may differ from this version.JPET Fast Forward. Published on September 7, 2017 as DOI: 10.1124/jpet.117.242909
at ASPE
T Journals on June 20, 2018
jpet.aspetjournals.orgD
ownloaded from

JPET #242909
30
FOOTNOTES
This article reveals the reflections of the authors on some of the research and data regarding acalabrutinib. This research
has spanned many years and is ongoing. This article does not attempt to address exhaustively every aspect and detail
of that research. Financial Disclosures: All authors are employees or consultants of the company, and are shareholders
of Acerta Pharma B.V.
This article has not been copyedited and formatted. The final version may differ from this version.JPET Fast Forward. Published on September 7, 2017 as DOI: 10.1124/jpet.117.242909
at ASPE
T Journals on June 20, 2018
jpet.aspetjournals.orgD
ownloaded from

JPET #242909
31
FIGURE LEGENDS
Fig. 1. (Left) Chemical structures of clinical irreversible binding BTK inhibitors. (Top right) Front view of a binding
model of acalabrutinib (gold) in the ATP binding pocket of BTK. (Bottom right) Second view of the model, showing
the hydrogen bonding interaction of the 2-pyridylamide moiety with Ser538 and Asp539.
Fig. 2. (A) Chemical structures of compounds 4 – 9. (B) Average t½ determination in a pseudo-first order glutathione
(GSH) reactivity assay. In brief, the compounds were incubated with an excess of GSH at 37°C and pH 7.4 in a buffered
aqueous methanol mixture. Consumption of the electrophilic parent compound was monitored via reversed phase
HPLC, and the t½ (50% of parent consumed) was determined based on linear regression analysis from two independent
experiments. (Table) Biochemical IMAP and cell-based data for compounds 1 – 9, and GSH reactivity data for selected
compounds.
Fig. 3. Comparison of acalabrutinib, ibrutinib and spebrutinib in competitive binding assays on wild type and mutant
kinases (DiscoveRx). Compounds were tested at a single concentration of 1 µM. Data are expressed as % remaining
activity versus control, Size of the circles represents intervals of % remaining activity versus untreated control. Data
presented are expansions from Herman et al, in press.
Fig. 4. (A) In vivo potency: Mice (5 per group) were given an oral dose of acalabrutinib, ibrutinib, spebrutinib or
vehicle over a concentration range (x-axis). After 3 hours, spleens were extracted and splenocytes stimulated with anti-
IgM for 18h, followed by CD69 expression analysis by flow cytometry gated on CD19+ B cells. The CD69 median
fluorescent intensity values were normalized as a percent of the vehicle control group and the mean average and SEM
were plotted for all mice in each dose cohort. (B) Return of function: Mice (5 per group) received a single, oral, 25
mg/kg dose of acalabrutinib, ibrutinib, spebrutinib or vehicle. Spleens were extracted 3, 6, 12, 18 or 24 hours after
dosing and single cell suspensions made. Splenocytes were immediately cultured with anti-IgM for 18 hours, followed
by CD69 surface expression measurement by flow cytometry as in panel A. Data shows CD69 expression for each
mouse normalized as a percentage of the vehicle control group. Data presented are expansions from Herman et al., in
press. (C) BTK target occupancy was measured in the mouse splenocyte samples from the experiment described under
B. (D) Structure of the target occupancy probe ACP-4016 (10).
This article has not been copyedited and formatted. The final version may differ from this version.JPET Fast Forward. Published on September 7, 2017 as DOI: 10.1124/jpet.117.242909
at ASPE
T Journals on June 20, 2018
jpet.aspetjournals.orgD
ownloaded from

JPET #242909
32
Fig. 5. PK vs PD after acalabrutinib dose in healthy human volunteers. (A) Dose-exposure relationship of acalabrutinib
in healthy subjects in Study ACE-HV-001. Log/log presentation showing individual AUC0-12 values with median
(horizontal line) for a single dose of 2.5, 5, 25, 50, 75 and 100 mg. (B and C) The PD measures, BTK target occupancy
and inhibition of anti-IgM-induced CD69 expression were derived from blood samples drawn from each subject 3 and
12 hours after acalabrutinib administration. Each point represents data from an individual blood sample, and each
group median represented by a horizontal line. (D) The mean acalabrutinib concentration in plasma (N=6; left axis,
light grey) is plotted with median BTK occupancy (N=4; right axis, grey dotted) and median inhibition of BCR-induced
CD69 protein expression on B cells (N=5; right axis, black) from individuals who received a single 100 mg dose. The
error bars show the SD for acalabrutinib plasma concentration. For the BTK occupancy and CD69 inhibition data, the
error bars show the interquartile range. BTK occupancy data is corrected for changes in B cell numbers.
This article has not been copyedited and formatted. The final version may differ from this version.JPET Fast Forward. Published on September 7, 2017 as DOI: 10.1124/jpet.117.242909
at ASPE
T Journals on June 20, 2018
jpet.aspetjournals.orgD
ownloaded from

JPET #242909
33
TABLES
Table 1: Mono-therapy clinical stage covalent BTK kinase inhibitors.
Compound Company Stage of Developmenta
Primary Therapeutic Area
Ref.
Ibrutinib (Imbruvica) J&J, Abbvie Approved Oncology Byrd et al., 2015 Acalabrutinib (ACP-196) Acerta Pharma Ph 3 Oncology Byrd et al., 2016
BGB-3111 BeiGene Ph 3 Oncology Tam et al., 2015 Spebrutinib (CC-292) Celgene Ph 2 Autoimmune Evans et al., 2013 Evobrutinib (M2951) MerckSerono Ph 2 Autoimmune Grenningloh, 2016
PRN-1008 Principia Ph 2 Autoimmune Smith et al., 2015 LY3337641 (HM-71224) Lilly Ph 2 Autoimmune Park et al., 2016
M7583 MerckSerono Ph 1/2 Oncology Bender et al., 2016 Tirabrutinib (GS-4059) Gilead Ph 1 Oncology Walter et al., 2016
AC-0058TA ACEA Biosciences Ph 1 Autoimmune -- a) Clinicaltrials.gov. Development stage of most advanced clinical programme. Additional potential covalent BTK inhibitors: CT-
1530, BMS-986195, and DTRMWXHS-12.
This article has not been copyedited and formatted. The final version may differ from this version.JPET Fast Forward. Published on September 7, 2017 as DOI: 10.1124/jpet.117.242909
at ASPE
T Journals on June 20, 2018
jpet.aspetjournals.orgD
ownloaded from

JPET #242909
34
Table 2. IC50 determination on cysteine kinases with a cysteine in the same position as Cys481 in BTK.
1 2 3 7
Kinase i+3 residue IC50 (nM)
BTK Asn 5.1 ± 1.0 1.5 ± 0.2 2.3 ± 0.5 1.6 ± 0.2
TEC Asn 126 ± 11 10 ± 2 16 ± 4 41 ± 3
ITK Asp >1,000 4.9 ± 1.2 24 ± 2 52 ± 5
BMX Asn 46 ± 12 0.8 ± 0.1 1.6 ± 0.4 3.3 ± 0.4
TXK Asn 368 ± 141 2.0 ± 0.3 9.1 ± 2.7 7.6 ± 2.4
EGFR Asp >1,000 5.3 ± 1.3 199 ± 35 20 ± 5
ERBB2 Asp ~1,000 6.4 ± 1.8 >1,000 13 ± 3
ERBB4 Glu 16 ± 5 3.4 ± 1.4 49 ± 12 5.3 ± 0.5
BLK Asp >1,000 0.1 ± 0.0 131 ± 27 19 ± 4
JAK3 Asp >1,000 32 ± 15 5.4 ± 1.1 >1,000 BTK and ITK kinase activity was measured using the IMAP assay. For BMX, TXK, EGFR, ERBB2, ERBB4, BLK and JAK3
kinase activity was measured at Thermo Fisher using the Z’-LYTE assay. TEC kinase activity is determined in a Lanthascreen
assay. Results are average ± SD of at least three independent experiments.
This article has not been copyedited and formatted. The final version may differ from this version.JPET Fast Forward. Published on September 7, 2017 as DOI: 10.1124/jpet.117.242909
at ASPE
T Journals on June 20, 2018
jpet.aspetjournals.orgD
ownloaded from

JPET #242909
35
Table 3. Effect of selected compounds on A431 and Jurkat cell lines, and on human PBMC.
Cmpd EGF-induced EGFR
phosphorylation A431 EC50 (nM)a
anti-CD3/CD28-induced IL-2 production Jurkat
EC50 (nM)b
anti-CD3-induced CD25 expression PBMC
EC50 (nM)b
1 >10,000 >10,000 >10,000
2 71 ± 14 99 ± 17 257 ± 71
3 4,680 ± 720 150 ± 22 575 ± 60
7 327 ± 2 911 ± 61 2,660 ± 956 a) Results are average ± error of two independent experiments. b) Average ± SD of three independent
experiments.
This article has not been copyedited and formatted. The final version may differ from this version.JPET Fast Forward. Published on September 7, 2017 as DOI: 10.1124/jpet.117.242909
at ASPE
T Journals on June 20, 2018
jpet.aspetjournals.orgD
ownloaded from
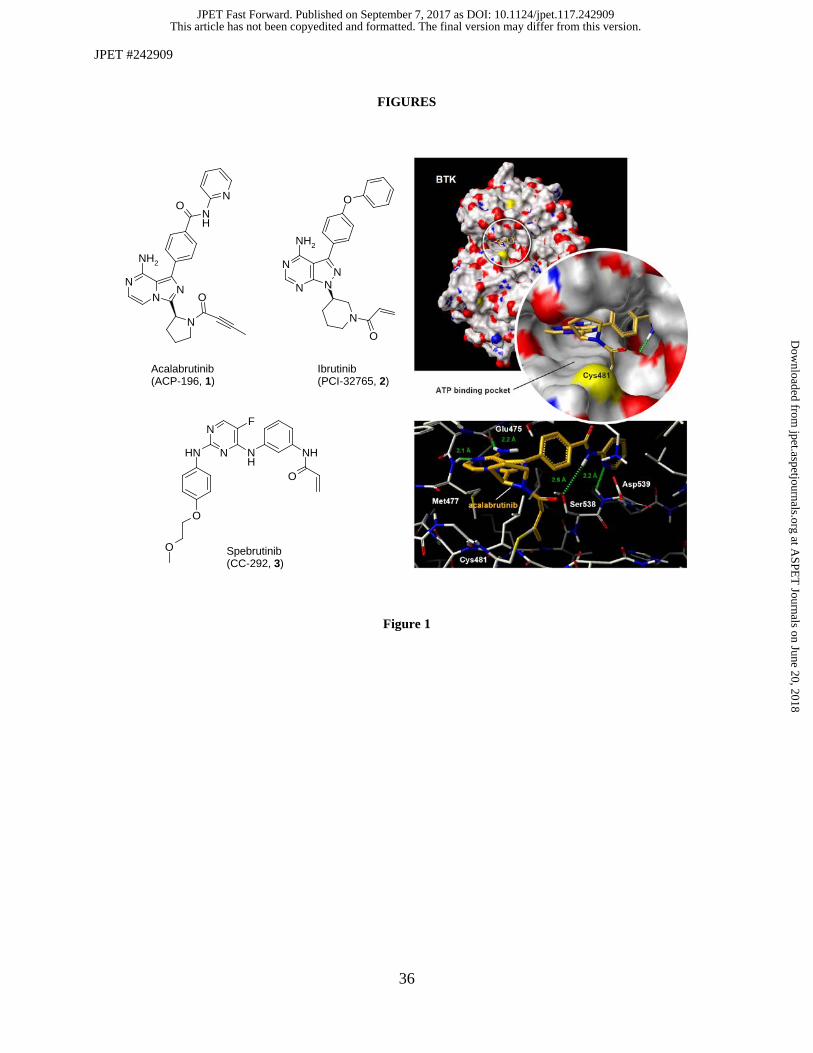
JPET #242909
36
FIGURES
Figure 1
N
N NN
NH2
O
N
O
N
N
F
NH NH
O
O
NH
O
NN
N
NH2
N
O
NH
ON
Ibrutinib(PCI-32765, 2)
Spebrutinib(CC-292, 3)
Acalabrutinib(ACP-196, 1)
This article has not been copyedited and formatted. The final version may differ from this version.JPET Fast Forward. Published on September 7, 2017 as DOI: 10.1124/jpet.117.242909
at ASPE
T Journals on June 20, 2018
jpet.aspetjournals.orgD
ownloaded from

JPET #242909
37
NN
N
NH2
N
R1
O
*
NH
O
N
*
NH
O
N
*
O
*
O
*
O
NN
N
NH2
N
NHO
N
ON
NN
NH2
NR2
NHO
N
(5)
(6)
(7) (8) (9)
(4)
R2:
R1:
A
B
Cmpd BTK (IMAP) IC50 (nM)a)
PBMC (CD69) EC50 (nM) a)
hWB (CD69) EC50 (nM) a)
GSH reactivityb) Average t½ (hour)
1 5.1 ± 1.0 2.9 ± 0.2 9.2 ± 4.4 5.5 2 1.5 ± 0.2 0.58 ± 0.04 5.8 ± 3.0 1.9 3 2.3 ± 0.5 7.4 ± 0.7 140 ± 85 1.0 4 697 ± 157 592 ± 24 1,530 ± 408 -- 5 3,970 ± 1,215 >10,000 ∼10,000 -- 6 1,857 ± 300 >10,000 4,210 ± 830 -- 7 1.6 ± 0.2 0.82 ± 0.34 2.2 ± 0.3 0.6 8 280 ± 138 119 ± 15 215 ± 62 ∼95 9 2,517 ± 1,279 1,717 ± 603 1,860 ± 306 No reaction
a) Results are average ± SD of at least three independent experiments. b) Results are average of two independent
experiments.
Figure 2
This article has not been copyedited and formatted. The final version may differ from this version.JPET Fast Forward. Published on September 7, 2017 as DOI: 10.1124/jpet.117.242909
at ASPE
T Journals on June 20, 2018
jpet.aspetjournals.orgD
ownloaded from
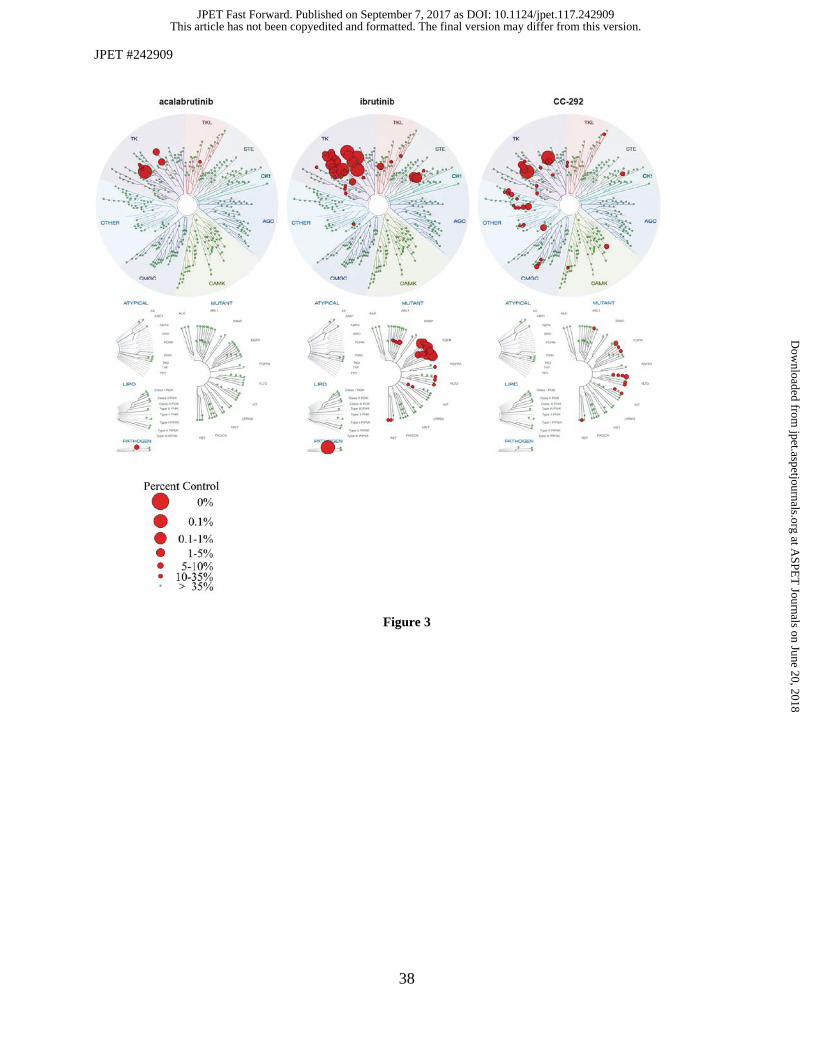
JPET #242909
38
Figure 3
This article has not been copyedited and formatted. The final version may differ from this version.JPET Fast Forward. Published on September 7, 2017 as DOI: 10.1124/jpet.117.242909
at ASPE
T Journals on June 20, 2018
jpet.aspetjournals.orgD
ownloaded from

JPET #242909
39
Figure 4
NN
N
NH2
NH
ON
N
O N
NNH
O
NHO
OO
ONH
O
S
NHNH
O
H
HACP-4016 (10)
This article has not been copyedited and formatted. The final version may differ from this version.JPET Fast Forward. Published on September 7, 2017 as DOI: 10.1124/jpet.117.242909
at ASPE
T Journals on June 20, 2018
jpet.aspetjournals.orgD
ownloaded from

JPET #242909
40
Figure 5
This article has not been copyedited and formatted. The final version may differ from this version.JPET Fast Forward. Published on September 7, 2017 as DOI: 10.1124/jpet.117.242909
at ASPE
T Journals on June 20, 2018
jpet.aspetjournals.orgD
ownloaded from