
Erin Strumpf, Ph.D. McGill University AcademyHealth Health Economics Interest Group June 7, 2008

AcademyHealth State-University
Partnership Learning Network
(SUPLN) Web Conference
Findings from the CHIPRA Quality
Demonstration Grant Program
September 17, 2015

Teleconference Instructions Please make sure your computer is linked to your phone:
A box should appear on your screen when you log-in with dial-in instructions.
OR
Click on the phone symbol in the toolbar at the top of your screen. Enter your phone number and click “join,” the system will call you directly.
OR
Call in directly:
– Dial 1-866-244-8528
– Enter the access code 602144 and press pound (#)
– Once you have dialed in, click on the information symbol in top right corner of the meeting room and dial the “Telephone Token” number into your phone.
– The system will link your phone with your computer.
2
2

If you would like to view the slides in full
screen, click the four way arrow button
on the top right corner of the slides.
View the Slides in Full Screen
•3
3

Download Slide Deck and Materials
If you would like to download the slide
deck and materials for this presentation,
click the “Download File(s)” button in the
box marked “Download Slides” in the
lower left-hand corner.
4

Technical Assistance
If you have technical questions during the event, please type them into the chat box in the lower left-hand corner of the screen.
Live technical assistance is also available:
– Please call Adobe Connect at (800) 422-3623
5
5

Discussion To raise your hand:
1. Participants can use the hand raise button at the top of the screen to signal to the presenter that they would to speak
To submit a question:
1. Click in the chat box on the left side of your screen
2. Type your question into the dialog box and click the Send button
Please mute your phones if you are not speaking to reduce background noise.
6
6

AcademyHealth Staff
Enrique Martinez-Vidal, Vice President
State Policy and Technical Assistance
Alyssa Walen, Senior Manager
Stephanie Kennedy, Research
Assistant
7
Agenda Welcome and Introduction
Core Set of Children’s Health Care Quality Measures for Medicaid and
CHIP: Lessons from the CHIPRA Quality Demonstration Grant Program Anna Christensen, Ph.D., Senior Health Researcher, Mathematica Policy Research
SC Medicaid-USC Partnership: Implementing CHIPRA Core Measures in
South Carolina Kathy Mayfield Smith, MA, MBA, Associate Director, Medicaid Policy Research, USC Institute
for Families in Society
Implementing Child Health Measures at the State and Practice-level:
Lessons Learned through Maine’s Improving Health Outcomes for
Children CHIPRA Quality Demonstration Grant Kimberley Fox, MPA, Senior Research Associate, Cutler Institute for Health and Social Policy,
Muskie School of Public Service, University of Southern Maine
Elizabeth Hill, Centers for Medicare and Medicaid Services
Q+A and Discussion
8

Current SUPLN Members California (UCSF, UCD,
UCLA)
Connecticut
Delaware
Florida
Georgia
Iowa
Kentucky
Maine
Maryland
Massachusetts
Michigan (MSU, UM)
Minnesota
New Hampshire
New Jersey
Ohio
Pennsylvania
South Carolina
Wisconsin
9

Core Set of Children’s Health Care
Quality Measures for Medicaid and
CHIP:
Presentation to the State-University Partnership
Learning Network
Lessons from the CHIPRA Quality
Demonstration Grant Program
Anna L. Christensen, Ph.D., Senior Health Researcher,
Mathematica Policy Research
September 17, 2015

11 11
Agenda
• Background on the CHIPRA Quality Demonstration Grants and
the CMS Child Core Set
• Evaluation Findings and Lessons Learned from the CHIPRA
Quality Demonstration Grant Program
• How are Demonstration States Using the Child Core Set
Measures to Improve Quality?

12 12
Background on the CHIPRA Quality
Demonstration Grants and the
CMS Child Core Set
13 13
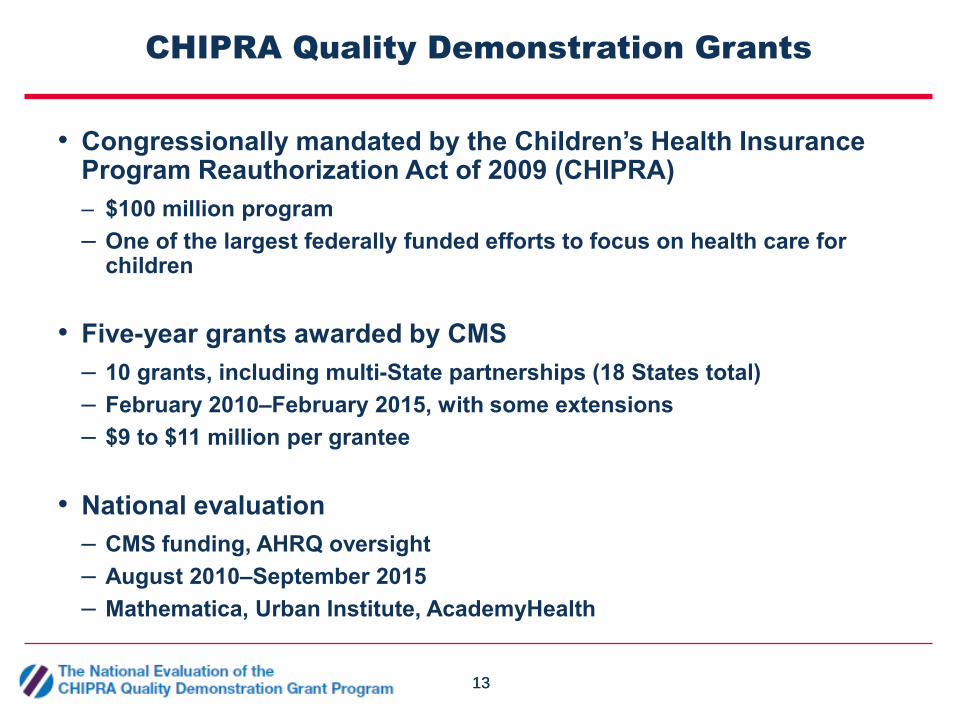
CHIPRA Quality Demonstration Grants
• Congressionally mandated by the Children’s Health Insurance Program Reauthorization Act of 2009 (CHIPRA)
– $100 million program
– One of the largest federally funded efforts to focus on health care for children
• Five-year grants awarded by CMS
– 10 grants, including multi-State partnerships (18 States total)
– February 2010–February 2015, with some extensions
– $9 to $11 million per grantee
• National evaluation
– CMS funding, AHRQ oversight
– August 2010–September 2015
– Mathematica, Urban Institute, AcademyHealth

14 14
Demonstration Grantees* and Partner States
Implemented 52 Projects in 5 Areas

15 15
Child Core Set
• Set of measures for voluntary annual reporting by
Medicaid and CHIP agencies (24 measures in 2015)
• Annual updates to measures based on review and public
comment
• Measure areas
– Access to care, preventive care, maternal and perinatal health,
behavioral health, care of acute and chronic conditions, oral health,
experience of care
• Fills a gap by providing a uniform set of state-level quality
measures for children’s care

16 16
2015 Child Core Set (1)
NQF # Measure Steward Measure Name
Access to Care
NA NCQA Child and Adolescents’ Access to Primary Care Practitioners (CAP)
Preventive Care
033 NCQA Chlamydia Screening in Women (CHL)
038 NCQA Childhood Immunization Status (CIS)
1392 NCQA Well-Child Visits in the First 15 Months of Life (W15)
1407 NCQA Immunizations for Adolescents (IMA)
1448 OHSU Developmental Screening in the First Three Years of Life (DEV)
1516 NCQA Well-Child Visits in the Third, Fourth, Fifth and Sixth Years of Life (W34)
1959 NCQA Human Papillomavirus Vaccine for Female Adolescents (HPV)
NA NCQA Adolescent Well-Care Visit (AWC)

17 17
2015 Child Core Set (2)
NQF # Measure Steward Measure Name
Maternal and Perinatal Health
0139 CDC Pediatric Central Line-Associated Bloodstream Infections – Neonatal
Intensive Care Unit and Pediatric Intensive Care Unit (CLABSI)
0471 TJC PC-02: Cesarean Section (PC02)
1382 CDC Live Births Weighing Less Than 2,500 Grams (LBW)
1391 NCQA Frequency of Ongoing Prenatal Care (FPC)
1517 NCQA Prenatal & Postpartum Care: Timeliness of Prenatal Care (PPC)
NA AMA-PCPI Behavioral Health Risk Assessment (for Pregnant Women) (BHRA)
Behavioral Health
0108 NCQA Follow-Up Care for Children Prescribed Attention-Deficit/Hyperactivity
Disorder (ADHD) Medication (ADD)
0576 NCQA Follow-Up After Hospitalization for Mental Illness (FUH)
1365 AMA-PCPI Child and Adolescent Major Depressive Disorder: Suicide Risk Assessment
(SRA)

18 18
2015 Child Core Set (3)
NQF # Measure Steward Measure Name
Care of Acute and Chronic Conditions
0024 NCQA Weight Assessment and Counseling for Nutrition and Physical Activity for
Children/Adolescents – Body Mass Index Assessment for
Children/Adolescents (WCC)
1799 NCQA Medication Management for People with Asthma (MMA)
NA NCQA Ambulatory Care – Emergency Department (ED) Visits (AMB)
Oral Health
2508 DQA (ADA) Prevention: Dental Sealants for 6–9 Year-Old Children at Elevated Caries
Risk (SEAL)
NA CMS Percentage of Eligibles Who Received Preventive Dental Services (PDENT)
Experience of Care
NA NCQA Consumer Assessment of Healthcare Providers and Systems (CAHPS®)
5.0H (Child Version Including Medicaid and Children with Chronic Conditions
Supplemental Items) (CPC)

19 19
Measure Specifications
• Measures that states report to CMS should include data on entire population of children in Medicaid/CHIP in the state
• Two-thirds are based on HEDIS health plan measures
• Data sources
– Primarily Medicaid/CHIP administrative data (enrollment and claims or managed care encounters)
– Some measures can use HEDIS hybrid methods (administrative data plus medical chart review)
– Some perinatal measures require vital records data
– States can link to other administrative data sources, including immunization registries
– One survey-based measure (CAHPS)
– Two EHR measures added in 2013 and 2015
20 20
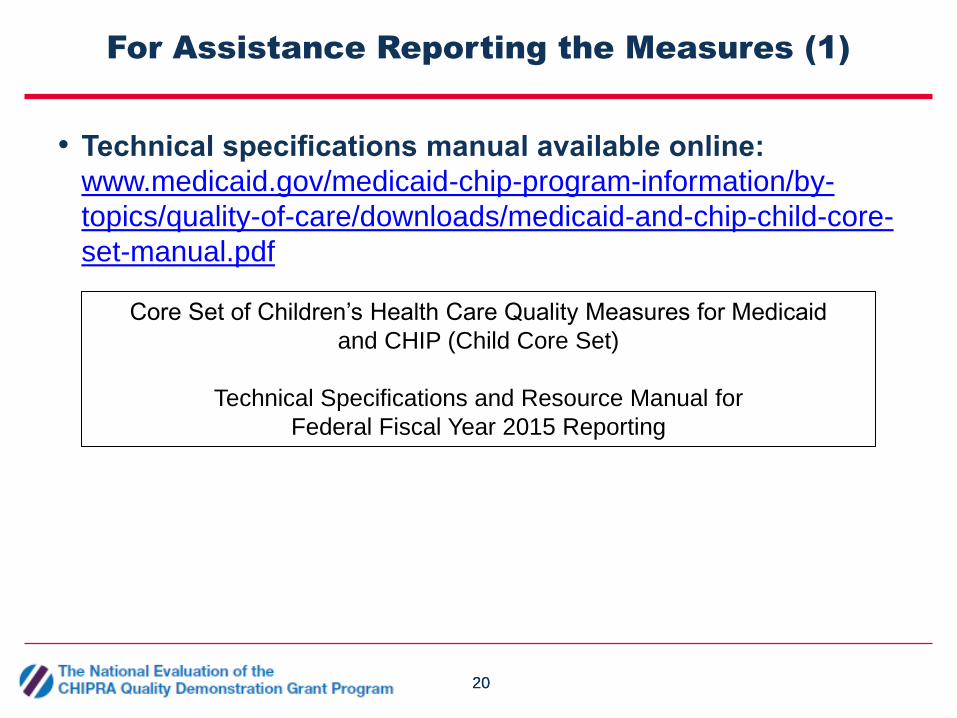
For Assistance Reporting the Measures (1)
• Technical specifications manual available online:
www.medicaid.gov/medicaid-chip-program-information/by-
topics/quality-of-care/downloads/medicaid-and-chip-child-core-
set-manual.pdf
Core Set of Children’s Health Care Quality Measures for Medicaid
and CHIP (Child Core Set)
Technical Specifications and Resource Manual for
Federal Fiscal Year 2015 Reporting

21 21
For Assistance Reporting the Measures (2)
• Medicaid/CHIP Health Care Quality Measures Technical
Assistance (TA) and Analytic Support Program
– Established by CMS in 2011 as a capacity-building program
– TA available to all states via:
• Resource manuals
• Email helpdesk
• Webinars
• Issue briefs
• In-person quality conferences

22 22
For Assistance Reporting the Measures (3)

23 23
For Measure Results
• Child Core Set
measures are
publicly reported
annually by HHS
www.medicaid.gov/
medicaid-chip-program-
information/by-
topics/quality-of-
care/downloads/2014-
child-sec-rept.pdf

24 24
Evaluation Findings and Lessons
Learned from the CHIPRA Quality
Demonstration Grant Program

25 25
Measure-Focused Demonstration States
• 10 states focused on calculating the Child Core Set
and on using the measures for quality improvement
• Several states partnered with universities

26 26
Measure-Focused Demonstration Activities
Calculate measures
Use measures to drive QI changes
Improve quality of care

27 27
Median Number of Child Core Set Measures
Reported to CMS for FFY 2010―FFY 2013
0
5
10
15
20
25
FFY 2010 FFY 2011 FFY 2012 FFY 2013
Media
n n
um
ber
of
measure
s
Reporting period
Measure-focused demonstration states (n = 10)
Other demonstration states (n = 8)
Non-demonstration states and DC (n = 33)

28 28
Median Number of Child Core Set Measures
Reported to CMS for FFY 2010―FFY 2013
0
5
10
15
20
25
FFY 2010 FFY 2011 FFY 2012 FFY 2013
Media
n n
um
ber
of
measure
s
Reporting period
Measure-focused demonstration states (n = 10)
Other demonstration states (n = 8)
Non-demonstration states and DC (n = 33)

29 29
Median Number of Child Core Set Measures
Reported to CMS for FFY 2010―FFY 2013
0
5
10
15
20
25
FFY 2010 FFY 2011 FFY 2012 FFY 2013
Media
n n
um
ber
of
measure
s
Reporting period
Measure-focused demonstration states (n = 10)
Other demonstration states (n = 8)
Non-demonstration states and DC (n = 33)

30 30
Median Number of Child Core Set Measures
Reported to CMS for FFY 2010―FFY 2013
0
5
10
15
20
25
FFY 2010 FFY 2011 FFY 2012 FFY 2013
Media
n n
um
ber
of
measure
s
Reporting period
Measure-focused demonstration states (n = 10)
Other demonstration states (n = 8)
Non-demonstration states and DC (n = 33)

31 31
Select Grant-Funded Activities to Expand the
Reporting of Measures
• Hiring dedicated measure programmers
• Working across state agencies to link data
• Contracting with Medicaid managed care plans and
external quality review organizations (EQROs) to support
measure reporting
• Partnering with universities
• Fielding CAHPS survey more systematically
• Developing standard testing procedures to ensure
measure accuracy

32 32
Challenges
• Combining data from different programs/sources
– Medicaid FFS, Medicaid MCOs, CHIP (if separate CHIP agency)
• Linking state data sources
– e.g., vital records data, state immunization registry
• Reporting measures from EHRs
• Adapting state-level measures to the practice-level for
quality improvement activities

33 33
Key Take Aways
• Calculating the measures took more time and resources
than states anticipated
• Some measures were more challenging than others
But…
• States can overcome many of the challenges to reporting
the Child Core Set measures if they invest in data quality
and reporting systems, identify staff or contractors who
have expertise in quality measurement, and make use of
TA and financial support

34 34
How are Demonstration States Using
the Child Core Set Measures to
Improve Quality?

35 35
States’ Quality Measure and Reporting Strategies
Calculate measures
Use measures to drive QI changes
Improve quality of care
• Report results to stakeholders
• Align QI priorities
• Support provider-level improvement

36 36
Reporting Results to Stakeholders
• Goals
– Document and be transparent about performance
– Allow comparisons across states, regions, and health plans
– Identify QI priorities and track improvement over time
• CHIPRA state strategies
– Produce reports from existing data (Medicaid claims, immunization
registries)
– Develop reports for different stakeholders: policymakers, health
plans, providers, and the public

37 37
Aligning Measures and QI Priorities
• Goals
– Foster system-level reflection
– Set the stage for collective action
– Create a powerful incentive for providers to improve care
• CHIPRA state strategies
– Formed multi-stakeholder quality improvement workgroups
– Encouraged consistent quality reporting standards across programs
– Required managed care organizations to meet quality benchmarks

38 38
Supporting Provider-Level Improvement
• Goals
– Help providers interpret quality reports and track performance
– Help providers identify QI priorities and design QI activities
– Encourage behavior change and use of evidence-based practices
among providers
• CHIPRA state strategies
– Financial support
• Paid providers for reporting measures and demonstrating improvement
• Changed reimbursement to support improvements
– Technical support
• Hosted learning collaboratives
• Provided individualized TA

39 39
For More Evaluation Results
• View evaluation highlights and other materials on the
evaluation webpage:
www.ahrq.gov/policymakers/chipra/demoeval/index.html

Presented by Kathy Mayfield Smith, MA, MBA
Associate Director, Medicaid Policy Research
USC Institute for Families in Society
September 17, 2015
SC Medicaid-USC Partnership:
Implementing CHIPRA Core Measures
in South Carolina

41
State–University Partnership
Continuous since 1996
41

SC Medicaid
• Covers about 22-25% of population, 52% of all births
• Majority Managed Care (Capitated MCO model)
• 72,000 (2007) – 700,000+ (2015) – 60%
• SCDHHS – University of SC Partnership
o Data Analysis – Program and Policy
o Technical Assistance & Evaluation Support
o Geo-spatial analysis
o Managed Care Quality Measure report card since
2007 (HEDIS and CAHPS)
o CARTS quality reporting
42
Historical Context
©2015 University of South Carolina. All Rights Reserved. USC Institute for Families in Society | Division of Medicaid Policy Research

43
©2015 University of South Carolina. All Rights Reserved. USC Institute for Families in Society | Division of Medicaid Policy Research

44
Medicaid Quality Indicators Initiative
Medicaid Product Line
Medicare Product Line
HEDIS NCQA Managed Care
and Fee-for-Service
HEDIS NCQA
PQI
CHIPRA Core QI Indicators
NQF
QUALITY INDICATORS
Agency Internal and External Supported Initiatives
Hospital Association Triple Aim
Managed Care Asthma QI
CMS Adult and Child
CARTS
NQF
Other
PQI
HEDIS NCQA
AHRQ Prevention Quality Indicators
(PQI) - Hospital
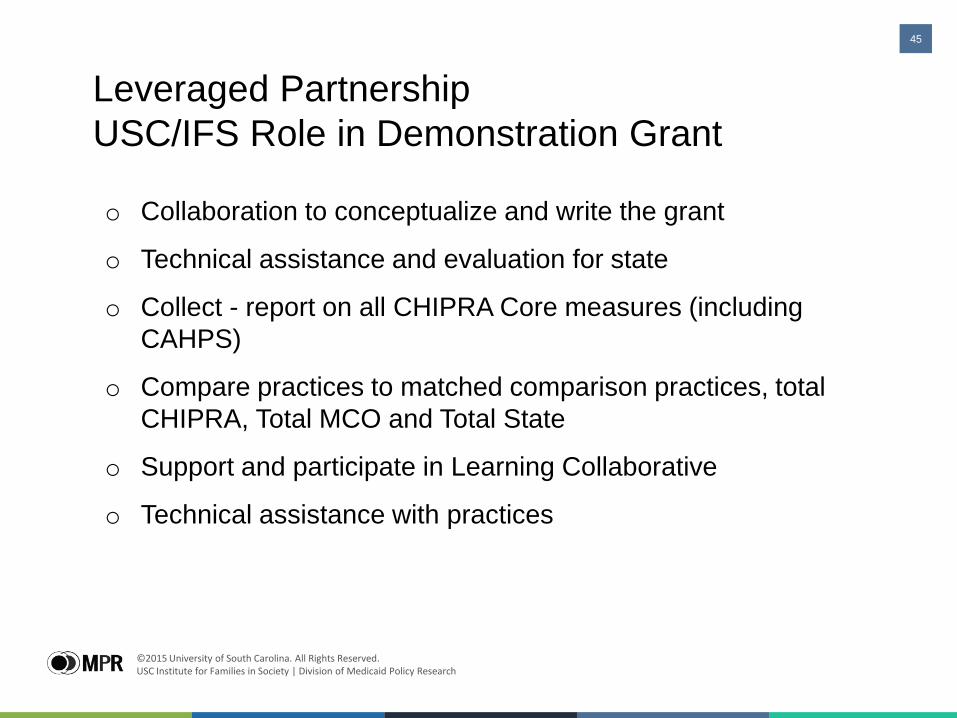
o Collaboration to conceptualize and write the grant
o Technical assistance and evaluation for state
o Collect - report on all CHIPRA Core measures (including
CAHPS)
o Compare practices to matched comparison practices, total
CHIPRA, Total MCO and Total State
o Support and participate in Learning Collaborative
o Technical assistance with practices
Leveraged Partnership
USC/IFS Role in Demonstration Grant
45
©2015 University of South Carolina. All Rights Reserved. USC Institute for Families in Society | Division of Medicaid Policy Research

• Four integrated areas:
o collecting and using a set of core child quality measures to
improve healthcare outcomes;
o enhancing HIT/HIE to facilitate quality improvement;
o developing provider-based model of integrated primary and
behavioral health care; and
o transforming pediatric practices into patient-centered medical
homes.
SC’s CHIPRA Demonstration - Quality through Technology and Innovation in Pediatrics (QTIP)
46

SC’s CHIPRA Demonstration - Quality through Technology and Innovation in Pediatrics (QTIP)
• 18 Child serving practices (4 years)
o Types: Private, FQHC/RHC, Academic
o Large/Med/Small - # clinicians – patient population
o 5% of pediatric practices serve over 20% of all children
in Medicaid
o Rural/Urban (7% of all Urban, 2% of Suburban, 3% of all Rural)
• 15 comparison practices were matched on all characteristics
o No academic comparison practices
47

SC’s CHIPRA Evaluation Framework
48
©2015 University of South Carolina. All Rights Reserved. USC Institute for Families in Society | Division of Medicaid Policy Research
Quality Strategies
49
Quality improvement (QI) team formed
at each practice
o Lead practitioner, typically a physician
champion
o Other clinician, typically a lead nurse
o Administrative staff, typically the office
manager
o All team members required to attend LCs to
network, learn, and share experiences

Quality Strategies Learning Collaborative (LC) framework built on SC AAP
state meetings
50
o Semi-annual meetings
o Evidence-based pediatric practice
o Peer to peer learning experiences
o Actionable next steps
o Facilitated collaborative problem solving

Core Measure Quality Strategies
All 24 Child Core measures
o 2-5 measures introduced by subject matter experts
o Targeted work on at least one new measure
Plan, Do, Study, Act Cycles
On-site TA after LC to reinforce
learning and QI skill building
Quality Improvement Reports - practice level
o Administrative claims and encounter data
o Compared to comparison practice, total QTIP, Child State Medicaid
51

52
©2015 University of South Carolina. All Rights Reserved. USC Institute for Families in Society | Division of Medicaid Policy Research
50.7 54.9
60.9
26.9 27.9
34.3
0.0
10.0
20.0
30.0
40.0
50.0
60.0
70.0
80.0
90.0
CY2011 CY2012 CY2013
CHIPRA
Medicaid Total
Minimum CHIPRA
Maximum CHIPRA
Adolescent Well-Care Visits
Results - Selected Measures

Well-Child Visits-
Third, Fourth, Fifth and Sixth Years of Life
53
©2015 University of South Carolina. All Rights Reserved. USC Institute for Families in Society | Division of Medicaid Policy Research
65.6 67.6
70.5
51.9 54.5
56.7
0.0
10.0
20.0
30.0
40.0
50.0
60.0
70.0
80.0
90.0
CY2011 CY2012 CY2013
CHIPRA
Medicaid Total
Minimum CHIPRA
Maximum CHIPRA

Developmental Screening -
Screened by 12 months of age
12.6
17.9
27.7
6.2 7.8
12.8
0.0
10.0
20.0
30.0
40.0
50.0
60.0
70.0
80.0
CY2011 CY2012 CY2013
CHIPRA
Medicaid Total
Minimum CHIPRA
Maximum CHIPRA

Lessons Learned
Practice performance drives state performance
TA and QI tools needed for data-driven quality improvement
Continued QI effort critical to sustained high performance
QI Team critical to practice change and improved performance
o Workflow changes, staff empowerment
o Communication of changes to ensure follow-through
Barriers between physician/practice coding and MCO/State impact
performance measures
o Practice workflow (staff strip quality codes traditionally not paid)
o Hospital coding practices (no more than 4)
System changes required at state and practice levels
55

Successes/Outcomes
Improved performance on quality measures
o Intervention practices showed statistically significant improvement over time
on 11 measures (e.g., Dental visits, Developmental screening, all Well Care)
o Intervention practices showed statistically significant improvement over
comparison on 4 measures (e.g., Weight assessment, Chlamydia
screening, developmental screenings)
Demonstrated practice performance drives state
performance on quality measures
56
Successes/Outcomes
Infusion of lessons learned into SCDHHS initiatives and
policy changes
o Billing and coding changes to support quality measurement
o MCO incentives/withholds encourage TA with practices
o TA quality initiatives and contracts target quality at practice level
o State Children’s quality unit to continue work of QTIP
57

58
Get in Touch
Online
ifs.sc.edu/MPR
and
schealthviz.sc.edu
Phone
(803)777-0930

Implementing Child Health Measures at the State and Practice-level
Lessons Learned through Maine’s Improving Health Outcomes for Children
CHIPRA Quality Demonstration Grant
Sept 17, 2015
State University Partnership Network Webinar
Kimberley Fox
Cutler Institute for Health and Social Policy
Muskie School of Public Service, University of Southern Maine
Funding for this work is provided under grant CFDA 93.767 from the U.S. Department of Health and Human Services, Centers for Medicare and Medicaid Services (CMS) authorized by Section 401(d) of the Child Health Insurance Program Reauthorization Act (CHIPRA)
Builds off longstanding cooperative agreement between Maine DHHS and University of Southern Maine, Muskie School of Public Service
Technical assistance and data analytic support using longitudinal data warehouse
Policy analyses, program development, grant writing support
Program evaluation and monitoring for Maine’s Medicaid program.
Unique grant requirement rewarding multi-state initiative allowed us to also partner with State of Vermont and University of Vermont.
CHIPRA Quality Demonstration grant role of State University Partnership
60 9/17/15

Pre-award
Data warehouse and measurement experience on which to demonstrate expertise, grant application preparation in partnership with Vermont.
Post-award
Cross-state grant and program administration in Maine, TA and data analytic support for child health measurement implementation at statewide and practice-level, rapid cycle evaluation.
Value of cross-state/university partnership
CHIPRA Quality Demonstration grant Role of State University Partnership (cont)
61 9/17/15

Collaborate with health systems, pediatric and family practice providers, associations, state programs and consumers to:
Select and promote a set of child health quality measures. Create Maine Child Health Improvement Partnership to identify
priorities and advise on child health topics in Maine. Build a health information technology infrastructure to support the
reporting and use of quality measurement information. Transform and standardize the delivery of healthcare services by
promoting patient centered medical home principles in child-serving practices.
Evaluate implementation and provide timely feedback to program and policymakers.
Maine’s Improving Health Outcomes for Children (IHOC) Initiative
62

Broad stakeholder engagement to identify/prioritize child health measures and identify gaps in care needing statewide/practice improvement
Investigate and assess the quality of data sources and feasibility of measure calculation methods.
Collect and analyze data to inform planning, implementation, and monitoring.
Identify policy and payment opportunities and guide change required to support child health quality improvement and measurement efforts.
Evaluate measure implementation to inform planning and assess effectiveness and disseminate results
IHOC’s Method for Implementing Child Health Measures
63 9/17/15
Maine Patient Centered Medical Home Pilot and MaineCare Health Homes initiative.
Pathways to Excellence– Public reporting initiative of quality metrics supported by employer, payer and provider coalition.
Other AAP/Health System/State Child Quality Initiatives (AAP Asthma Collaborative, MaineHealth’s From the First Tooth, Let’s Go!, Maine Developmental Disabilities Council, ME CDC Autism).
State Innovation Model grant
Alignment with Other Quality Initiatives in Maine
64 9/17/15

Developed IHOC Master List of Pediatric Measures
IHOC measures adopted/used by other statewide quality initiatives (e.g. PTE, MaineCare Health Homes, SIM, health systems internal QI)
Expanded number of child health statewide measures on Maine’s CHIP Annual Reports to CMS.
Produced annual “Summary of Pediatric Child Health Measures in Maine” report of CHIPRA and other child health measures.
Investigated feasibility of using Health Information Exchange and statewide registry for child health measures not captured in claims
Maine’s Statewide Child Health Measurement Successes
65 9/17/15

Implemented data-driven QI learning collaborative (First STEPS)
28 practices participated collectively serving 37,630 (@30%) MaineCare children
Provided technical assistance to support state registry modifications and changes to health systems EHRs for generating practice-level IHOC child health measures (e.g. immunizations, oral health risk assessments).
Guided MaineCare policy change and clarified billing payment to support QI and measurement (e.g. developmental screening and oral health)
Using Child Health Measures for Quality Improvement at Practice-level
66 9/17/15

Evaluating Success of Implementing Child Health Measures at Practice-Level
First STEPS Phase I: Raising Immunization Rates & Building a Patient Centered Medical Home (Sept 2011 – April 2012):
Goal: Within 12 months to increase overall immunization rates by more than 4 percentage points.
Far exceeded goal during that time period and also continued to improve over more extended period.
67 9/17/15

Muskie School of Public Service
First STEPS Phase I Evaluation Highlights: Increase in Practice-level Overall Immunization Rates
Immunization Rates in First STEPS Phase I Practices from Aug 2011 to Nov 2013
9/17/15

Percentage Point Change in First STEPS Phase I Practices’ Combination and Individual Rates, 8/11 – 9/12
11.6%*
4.3%
4.0%
3.8%
3.8%
2.6%
2.5%
2.5%
-3.5%
11.3%*
5.5%*
5.0%
4.9%
4.4%
4.6%
14.9%*
13.5%*
2.2%
14.9%*
Hepatitis A
Hepatitis B
Measles, Mumps, and Rubella
Varicella (chickenpox)
Polio
Haemophilus influenzae type B
Diphtheria, Tetanus and Pertussis
Pneumococcal conjugate vaccine
Rotavirus
% up-to-date on all vaccines
Measles, Mumps, and Rubella
Varicella (chickenpox)
Polio
Diphtheria, Tetanus and Pertussis
% up-to-date on all vaccines
Meningococcal vaccine (MCV)
Tetanus, Diphtheria (TD)
Human Papillomavirus (girls only)
% up-to-date on MCV & Tdap
2-ye
ar-o
lds
6-ye
ar-o
lds
13-y
ear-o
lds
Average 5.1%
*Significant change in immunization rate before and one year after First STEPS Phase I learning sessions, p<.05.
69 9/17/15

Percentage Point Change in IHOC Immunization Rates by Practice Site, First STEPS Practices, (8/11 – 9/12)
*Significant change in immunization rate before and one year after First STEPS Phase I learning sessions, p<.05.
70 9/17/15

Implementing Practice-level CHIPRA Immunization Rates
Challenges
Existing registry reporting functions were based on ACIP guidelines (grace periods/age cut-offs) that meet Nat’l CDC measure criteria; reports did not support the calculation of CHIPRA measures.
Modifying state registry to produce practice-level CHIPRA measures took longer than expected, requiring an interim approach.
Additional challenges due to not all practices entering dose data consistently for all age groups, or for doses given in the past.
Challenges in producing statewide CHIPRA rates from registry.
71 9/17/15
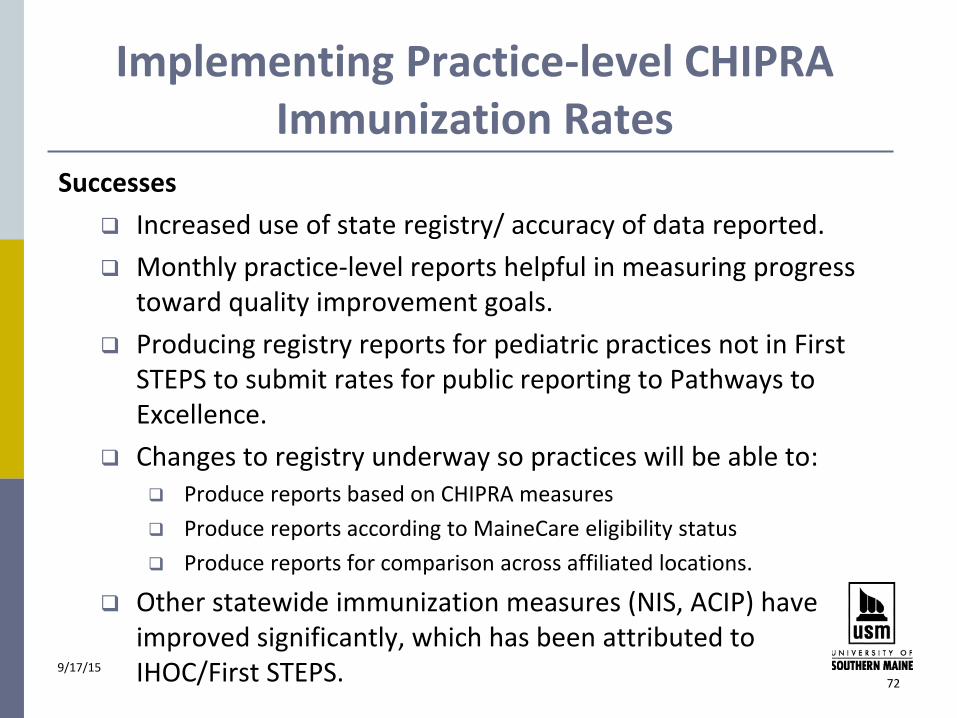
Implementing Practice-level CHIPRA Immunization Rates
Successes
Increased use of state registry/ accuracy of data reported.
Monthly practice-level reports helpful in measuring progress toward quality improvement goals.
Producing registry reports for pediatric practices not in First STEPS to submit rates for public reporting to Pathways to Excellence.
Changes to registry underway so practices will be able to: Produce reports based on CHIPRA measures
Produce reports according to MaineCare eligibility status
Produce reports for comparison across affiliated locations.
Other statewide immunization measures (NIS, ACIP) have improved significantly, which has been attributed to IHOC/First STEPS.
72
9/17/15

First STEPS Phase II: Developmental Screening Measures
First STEPS Phase II: Developmental, Autism and Lead Screening
(optional anemia screening):
Monthly data reports based on chart review.
MaineCare claims.
Goal for developmental, autism, and lead screening rates:
Improve the rate of these screenings (according to Bright Futures guidelines) by 50% between May 2012 and December 2012.
73 9/17/15

Measurement:
Developmental Screening Challenges with Claims-based measure:
Extremely (and unexpected) low statewide rates. Difficulty identifying specific types of screenings using the 96110
billing code as specified in the measure.
Policy Response:
MaineCare clarified and modified the billing method for developmental and autism-specific screenings (and autism testing) for use by primary care providers.
Clarified existing rate structure for related screenings and tests.
Added modifiers* to existing billing codes to distinguish between global developmental & autism-specific screening, and follow-up autism testing.
*96110 = global developmental screening *96110 HI = autism-specific screening *96111 HK = autism testing
74 9/17/15

First STEPS Phase II Evaluation Highlights: Increase in Practice-level Use of Developmental Screening Tools
based on Chart Review
AVERAGE PERCENT DOCUMENTED USE OF A DEVELOPMENTAL SCREENING TOOL (PEDS OR ASQ)
75
Source: Chart Review data from Phase II First STEPS practices as reported in: Improving Health
Outcomes for Children (IHOC) First STEPS Phase II Initiative: Improving Developmental, Autism and
Lead Screening for Children Final Evaluation Report, Muskie School of Public Service, University of
Southern Maine, Aug 2013
9/17/15
46%
22% 22%
97%
71%
58%
0%
20%
40%
60%
80%
100%
by 12 mo (between 6-12 mo)(n=7)
by 24 mo (between 18-23 mo)(n= 9)
by 36 mo (between 24-35 mo)(n=9)
May 2012 Average November 2012 Average

First STEPS Phase II Evaluation Highlights: Greater Increase in Practice-level Claims-based Developmental
Screening Rates than Statewide
76
Source: MaineCare Paid claims analyses. Improving Health Outcomes for Children (IHOC) First STEPS
Phase II Initiative: Improving Developmental, Autism and Lead Screening for Children Final Evaluation
Report, Muskie School of Public Service, University of Southern Maine, Aug 2013
9/17/15

First STEPS Phase II Evaluation Highlights: Increase in Practice-level Use of Developmental Screening Tools
based on Chart Review
NUMBER OF MAINECARE PAID CLAIMS FOR M-CHAT I AUTISM SCREENS FOR CHILDREN AGE ONE AND TWO
77
Source: MaineCare administrative claims data as reported in: Improving Health Outcomes for Children
(IHOC) First STEPS Phase II Initiative: Improving Developmental, Autism and Lead Screening for Children
Final Evaluation Report, Muskie School of Public Service, University of Southern Maine, Aug 2013
9/17/15
10
38 37
13
50
68
8
25
40
9
40
75
0
10
20
30
40
50
60
70
80
5/1/2012 -7/31/2012
8/1/2012 -10/31/2012
2/1/2013 -4/30/2013
Age 1 Phase II Practices Age 1 Statewide
Age 2 Phase II Practices Age 2 Statewide

Statewide Claims-based Developmental Screening Rates Increasing
78
2% 3%
1% 3%
6%
2%
13%
17%
12%
19%
26%
12%
0%
5%
10%
15%
20%
25%
30%
0 - < 1 Year 1 - < 2 Years 2 - < 3 Years
Per
cen
t o
f El
igib
le C
hild
ren
FFY2011 FFY2012 FFY2013 FFY2014
Developmental Screening Rates among MaineCare-Enrolled Children
Source: MaineCare administrative paid claims data as reported in: IHOC Summary of Pediatric Quality Measures for Children Enrolled in MaineCare FFY 2011-2014, Muskie School of Public Service, University of Southern Maine, Sept 2015.
9/17/15
Lessons Learned
Child health measures need to be actionable and available at the practice-level to improve performance.
Data source matters - Measures cannot be operationalized without reliable methods for capturing, collecting, calculating, and reporting the data.
Integrating data system improvements as part of child QI efforts helps increase visibility and accuracy of data and demonstrates how data can be ‘meaningfully used’ to sustain quality improvement over time.
Aligning measures across state initiatives is key for provider buy-in and to sustain quality improvement work after grant funding.
79 9/17/15

Questions or Comments?
For more information: Please contact: Kimberley Fox, [email protected] Or visit the IHOC website: http://www.maine.gov/dhhs/oms/provider/ihoc.shtml
80 9/17/15

Questions?

Thank You!
Please fill out the evaluation questions
on screen
Additional Questions? Contact: – Alyssa Walen
– Stephanie Kennedy
82


![Shatto slides from AcademyHealth 2013 ARM [PDF, 614KB]](https://static.fdocuments.in/doc/165x107/61fb29632e268c58cd5ae184/shatto-slides-from-academyhealth-2013-arm-pdf-614kb.jpg)


