ACADEMY OF EDUCATIONAL LEADERSHIP JOURNAL · iii Academy of Educational Leadership Journal, Volume...
136
Volume 12, Number 2 ISSN 1095-6328 ACADEMY OF EDUCATIONAL LEADERSHIP JOURNAL An official Journal of the Allied Academies, Inc. Michael Shurden Editor Lander University Charles Emery Editor Erskine College Academy Information is published on the Allied Academies web page www.alliedacademies.org The Academy of Educational Leadership Studies Journal is owned and published by the DreamCatchers Group, LLC, and printed by Whitney Press, Inc. Editorial content is under the control of the Allied Academies, Inc., a non-profit association of scholars, whose purpose is to support and encourage research and the sharing and exchange of ideas and insights throughout the world. W hitney Press, Inc. Printed by Whitney Press, Inc. PO Box 1064, Cullowhee, NC 28723 www.whitneypress.com
Transcript of ACADEMY OF EDUCATIONAL LEADERSHIP JOURNAL · iii Academy of Educational Leadership Journal, Volume...
Volume 12, Number 2 ISSN 1095-6328
ACADEMY OF EDUCATIONAL LEADERSHIPJOURNAL
An official Journal of theAllied Academies, Inc.
Michael ShurdenEditor
Lander University
Charles EmeryEditor
Erskine College
Academy Informationis published on the Allied Academies web page
www.alliedacademies.org
The Academy of Educational Leadership Studies Journal is owned and published by theDreamCatchers Group, LLC, and printed by Whitney Press, Inc. Editorial content is under thecontrol of the Allied Academies, Inc., a non-profit association of scholars, whose purpose is tosupport and encourage research and the sharing and exchange of ideas and insights throughout theworld.
Whitney Press, Inc.
Printed by Whitney Press, Inc.PO Box 1064, Cullowhee, NC 28723
www.whitneypress.com

Authors provide the Academy with a publication permission agreement. AlliedAcademies is not responsible for the content of the individual manuscripts. Anyomissions or errors are the sole responsibility of the individual authors. TheEditorial Board is responsible for the selection of manuscripts for publication fromamong those submitted for consideration. The Publishers accept final manuscriptsin digital form and make adjustments solely for the purposes of pagination andorganization.
The Academy of Educational Leadership Journal is published by the AlliedAcademies, Inc., PO Box 2689, 145 Travis Road, Cullowhee, NC 28723, (828) 293-9151, FAX (828) 293-9407. Those interested in subscribing to the Journal,advertising in the Journal, submitting manuscripts to the Journal, or otherwisecommunicating with the Journal, should contact the Executive Director [email protected].
Copyright 2008 by the Allied Academies, Inc., Cullowhee, NC
iii
Academy of Educational Leadership Journal, Volume 12, Number 2, 2008
ACADEMY OF EDUCATIONAL LEADERSHIP JOURNALEDITORIAL BOARD MEMBERS
Michael Shurden EditorLander University
Charles Emery, EditorErskine College
Kavous ArdalanMarist CollegePoughkeepsie, New York
Michael HarrisEastern Michigan UniversityYpsilanti, Michigan
Debbie BeardSoutheast Missouri State UniversityCape Girardeau, Missouri
Kanata JacksonHampton UniversityHampton, Virginia
Linda BresslerUniversity of Houston-DowntownHouston, Texas
Tim JohnstonThe University of Tennessee at MartinMartin, Tennessee
Doug CagwinLander UniversityGreenwood, South Carolina
Raghu KorrapatiWalden UniversityBlythewood, South Carolina
Charles EmeryErskine CollegeSouth Carolina
Asghar NazemzadehUniversity of Houston-DowntownHouston, Texas
Jerry GarrettIndiana University Purdue University Fort WayneFort Wayne, Indiana
Robert PritchardRowan UniversityGlassboro, New Jersey
Doug GriderUniversity of Arkansas-Fort SmithFort Smith, Arkansas
Mel SchnakeValdosta State UniversityValdosta, Georgia
Elizabeth E. GrandonUniversity of Bío-Bío Chile
Neil TerryWest Texas A&M UniversityCanyon, Texas
Rassule HadidiUniversity of Illinois at SpringfieldSpringfield, Illinois

iv
Academy of Educational Leadership Journal, Volume 12, Number 2, 2008
ACADEMY OF EDUCATIONAL LEADERSHIPJOURNAL
CONTENTS
EDITORIAL BOARD MEMBERS . . . . . . . . . . . . . . . . . . . . . . . . . . . . . . . . . . . . . . . . . . . . . . . iii
LETTER FROM THE EDITORS . . . . . . . . . . . . . . . . . . . . . . . . . . . . . . . . . . . . . . . . . . . . . . . . vi
UTILIZATION OF LAPTOP COMPUTERSIN THE SCHOOL OF BUSINESS CLASSROOM . . . . . . . . . . . . . . . . . . . . . . . . . . . . . 1Richard Skolnik, State University of New York – OswegoMia Puzo, State University of New York – Oswego
DEMOGRAPHIC FACTORS AND STUDENTPREFERENCES ON THE SYLLABUS INTHE PRINCIPLES OF ACCOUNTING COURSE . . . . . . . . . . . . . . . . . . . . . . . . . . . . 11Carl E. Keller, Jr., Indiana University-Purdue University, Fort WayneJohn G. Marcis, Coastal Carolina UniversityAlan B. Deck, Bellarmine University
RETHINKING FACULTY ROLEIN A KNOWLEDGE AGE . . . . . . . . . . . . . . . . . . . . . . . . . . . . . . . . . . . . . . . . . . . . . . . 35Craig Sasse, Rockhurst UniversityRandy Schwering, Rockhurst UniversitySylvia Dochterman, Rockhurst University
TRANSFORMATIONAL LEADERSHIP AS ANEFFECTIVE CLASSROOM LEADERSHIP MODELFOR BUSINESS ETHICS INSTRUCTION . . . . . . . . . . . . . . . . . . . . . . . . . . . . . . . . . . 49Lawrence S. Ruddell, Houston Baptist University

v
Academy of Educational Leadership Journal, Volume 12, Number 2, 2008
A STUDY OF BUSINESS EDUCATIONRESEARCH OUTLETS . . . . . . . . . . . . . . . . . . . . . . . . . . . . . . . . . . . . . . . . . . . . . . . . . 69Faye S. McIntyre, University of West GeorgiaJames E. McIntyre, Jr., Jacksonville State UniversityMary Kay Rickard, University of West Georgia
STRATEGIES FOR PROMOTING ACTIVE LEARNING IN A PRINCIPLES OF ACCOUNTING COURSE . . . . . . . . . . . . . . . . . . . . . . . . . . . . 87Daniel R. Brickner, Eastern Michigan UniversityEdwin R. Etter, Eastern Michigan University
STRUCTURAL CHANGE IN THE CPCU CURRICULUMAND ITS EFFECT ON THE COMPLETION TIME . . . . . . . . . . . . . . . . . . . . . . . . . . . 95Askar Choudhury, Illinois State UniversityJames R. Jones, Illinois State UniversityJinadasa Gamage, Illinois State UniversityKrzysztof Ostaszewski, Illinois State University
PREDICTING STUDENTS USAGE OF INTERNET INTWO EMERGING ECONOMIES USING AN EXTENDEDTECHNOLOGY ACCEPTANCE MODEL (TAM) . . . . . . . . . . . . . . . . . . . . . . . . . . . 109Khaled A. Alshare, Emporia State UniversityFaisal B. Alkhateeb, United Arab Emirates University

vi
Academy of Educational Leadership Journal, Volume 12, Number 2, 2008
LETTER FROM THE EDITORS
Welcome to the Academy of Educational Leadership Journal. The AELJ is published by theAllied Academies, Inc., a non profit association of scholars whose purpose is to encourage andsupport the advancement and exchange of knowledge, understanding and teaching throughout theworld. The AELJ is a principal vehicle for achieving the objectives of the organization. Theeditorial mission of this journal is to publish empirical, theoretical and scholarly manuscripts whichadvance the discipline, and applied, educational and pedagogic papers of practical value topractitioners and educators. We look forward to a long and successful career in publishing articleswhich will be of value to many scholars around the world.
The articles contained in this volume have been double blind refereed. The acceptance ratefor manuscripts in this issue, 25%, conforms to our editorial policies.
We intend to foster a supportive, mentoring effort on the part of the referees which will resultin encouraging and supporting writers. We welcome different viewpoints because in differences wefind learning; in differences we develop understanding; in differences we gain knowledge and indifferences we develop the discipline into a more comprehensive, less esoteric, and dynamic metier.
Information about the organization, its journals, and conferences are published on our website. In addition, we keep the web site updated with the latest activities of the organization. Pleasevisit our site and know that we welcome hearing from you at any time.
Michael ShurdenEditor
Lander UniversityCharles Emery
EditorErskine College

1
Academy of Educational Leadership Journal, Volume 12, Number 2, 2008
UTILIZATION OF LAPTOP COMPUTERSIN THE SCHOOL OF BUSINESS CLASSROOM
Richard Skolnik, State University of New York – OswegoMia Puzo, State University of New York – Oswego
ABSTRACT
This study uses student surveys, a faculty survey and direct classroom observation toascertain how students use laptop computers in the classroom and to identify the pedagogicaltechniques which greater student engagement. Students and faculty overwhelming indicate thatlaptop computers enhance course instruction. The results show that the benefits of laptop computersin the classroom include an increase in student spreadsheet skills and the ability to take noteselectronically. Both students and faculty indicate that the disadvantages of using laptop computersinclude distractions offered by the web and the possibility of increased academic dishonesty. Overhalf of the students surveyed acknowledged using laptops to engage in activities not related to thecourse. Class observations show that on average approximately 15% of students are off-task at anyone point in time. Pedagogy influences the effectiveness of laptops. Activities that engage studentsin the class help minimize the potential distraction created by access to the Internet. Lecturesaccompanied by PowerPoint slides led to the largest proportion of students engaged in off-taskactivity.
INTRODUCTION
Technology enhanced learning environments are becoming increasingly important inbusiness education. As a result, many colleges and universities have initiated programs to promotethe use of laptop computers in the classroom (Carnevale and Young, 2006). Laptop technologyprovides a number of benefits which enhance learning both in and out of the classroom. Integratinglaptops into the classroom environment allows students to take notes faster and keep them organized.Instructors can create a “real-time” class environment by having students immediately access webresources to enhance class discussions and download course material in place of using a textbook(Cudd et al., 2003). The portability and mobility of laptop computers is leading to a new kind ofclassroom environment, which has both advantages and disadvantages (Effaw et al., 2004;Oppenheimer, 2003).
The educational advantages of wireless Internet are also accompanied by challenges anddistractions for both instructors and students (Young, 2006). Suddenly, students have the ability totransport themselves anywhere the Internet will take them -- whether or not it has anything to do

2
Academy of Educational Leadership Journal, Volume 12, Number 2, 2008
with class. They can use their laptops to message friends, shop online, and surf the web.Additionally, the course instructor must learn a new set of teaching skills, and she or he must feelconfident and comfortable with the laptop environment in order to be effective. Instructors aresometimes overwhelmed by this prospect and are often faced with the daunting task of effectivelyintegrating the laptop into the day’s lecture (Hall and Elliot, 2003). The goal of this research is togain an understanding of how students use laptops in the classroom and which pedagogicaltechniques result in their most effective use.
EXPLORATORY SURVEY
The study began with an exploratory survey in the Fall 2005 semester for students enrolledin finance courses. All of the finance courses were offered in a tiered classroom with seating for 36students. Each student position had a laptop computer connected to the Internet. The classroom hadan instructor’s console equipped with a laptop, overhead projector and multimedia devices. Thestudent laptops were secured to the tables and could not be moved or adjusted. The instructor couldnot see the laptop screens without walking around the classroom, which was difficult because of thetiered seating.
At the end of the semester, a survey was given in the sections of three faculty members,which consisted of four sections of Corporate Finance and two sections of an upper-level financecourse. Corporate Finance, a required course for students in the School of Business, enrolls juniorsand seniors and has prerequisites of two accounting courses, two economics courses and a statisticscourse. The upper-level finance course has Corporate Finance as a prerequisite and enrolls primarilyseniors. The survey asked students about their usage of computers in the class and their perceptionof the advantages and disadvantages of having computers in the classroom.
As Table 1 indicates, 75% of the students found that the laptop enhanced learning; only 12%found that the laptop distracted them from learning. Although nearly half of the students had laptops,two thirds of them preferred having the laptop available in the classroom, even though the positionsand screens were not adjustable and there was limited space for books or writing. The students whoowned laptops but preferred using provided computers probably found carrying a laptop computerto class inconvenient.
The survey indicated that the effectiveness of the laptop varied with the pedagogy used bythe instructor. Over 90% of the students used the computer when spreadsheet problems weredemonstrated and a corresponding percentage felt that their spreadsheet skills improved. Studentshad access to files that instructors use for PowerPoint presentations and over three quarters utilizedthe computer during PowerPoint enhanced lectures. Class discussions and lectures with theinstructor typing notes or using the board resulted in a smaller, but still majority, of studentsindicating that the laptop was effective. Over half of the students indicated that they used the

3
Academy of Educational Leadership Journal, Volume 12, Number 2, 2008
computer during class discussions; however, the survey did not ask whether the computers wereused for on-task activities during discussions.
Table 1: Fall Student Survey
Yes No
Do you own a lap top? 48% 52%
Would you prefer the course in a room in which you could bring your own laptop? 38% 62%
StronglyAgree Agree Neutral Disagree
StronglyDisagree
Using the laptop computer enhanced mylearning in this course
40% 35% 13% 6% 6%
I used the laptop computer whenever theinstructor demonstrated Excel problems
58% 26% 10% 4% 1%
I feel that my Excel skills have improved because of computer use in this course.
51% 30% 10% 4% 5%
I feel more confident analyzing financialproblems.
39% 38% 18% 2% 4%
I used the laptop computer to take notes whenthe instructor lectured.
35% 22% 13% 15% 15%
I used the laptop computer to take notes whenthe instructor typed notes.
38% 19% 15% 13% 15%
I used the laptop computer to do work in otherclasses.
11% 18% 30% 18% 22%
I used the laptop computer for non-academicpursuits (email/surfing/games/etc.)
20% 35% 23% 12% 10%
I used the laptop computer in other classesbecause of using the computer in this course.
4% 15% 42% 21% 18%
Having computer access during quizzes andexams increases cheating.
21% 12% 24% 21% 21%
VeryEffective Effective Neutral Ineffective
VeryIneffective
Demonstration of spreadsheet problems. 68% 24% 7% 1% 0%
Lectures from PowerPoint. 42% 35% 18% 4% 1%
Lectures with the instructor typing notes. 32% 30% 25% 9% 4%
Lectures with the instructor writing on theboard.
22% 28% 35% 12% 3%
In class assignments that require surfing theweb.
39% 26% 19% 5% 1%
Class discussions. 26% 30% 27% 11% 6%

4
Academy of Educational Leadership Journal, Volume 12, Number 2, 2008
Students admitted to using the computers for non-class related activities. Approximately30% used the computer to work on assignments from other courses. Over half surfed the web,checked email, played games or did some other activity that was not academic. The survey did notask the students the relative amount of time that they used the computer for on-task versus off-taskactivities.
Laptop computers in the classroom can lead to increased cheating for a couple of reasons.The first, a low tech reason, occurs because of the increased visibility of peer work. Unlike an examon a desk, the laptop screens are vertical, which allows for greater visibility of answers, especiallyfor students sitting in the back row. Second, since the laptops are connected to the Internet, studentscan search web sites, email or instant message classmates, or retrieve stored notes. The survey foundthat one third of the students expressed concern that the computer increased cheating on exams;however, a greater percentage, 45%, felt that cheating did not increase.
The results of the Fall survey, indicated that a more in-depth study was needed to answerfundamental questions about laptop usage and the effectiveness of the computer in the classroom.The study was expanded in the following semester to include a wider range of classes andmeasurements, including a survey of instructors and direct classroom observation of pedagogicaltechnique and student activity.
SURVEY AND OBSERVATIONS
Laptop usage expanded in the Spring 2006 to include rooms not equipped with computers.Students in sophomore-level accounting and mathematics courses were required to bring their owncomputers to class. The Spring survey results spanned five instructors and 173 students. Results ofthe Spring Student Survey are presented in Table 2. Since most of the classes surveyed requiredstudents to have their own laptops, it is not surprising that 90% of the students owned a laptop and80% had two or more classes that required one. In contrast to the previous survey, most studentspreferred bringing their own computer to class rather than using one provided in the classroom.Students generally found that laptops enhanced their learning; 45% responded positively comparedto 30% who disagreed with the statement. However, student perception of the usefulness of laptopswas less in the Spring semester than in the Fall semester. In the Fall survey, 75 percent of thestudents agreed and 12 percent of the students disagreed that laptops enhanced learning, for apositive ratio of 6.25; in the Spring, the ratio was 1.5. Although only speculation, the drop in theratio may be attributed to either less serious students or instructors with less experience teaching inthe laptop environment. Many of the students in the Spring survey were sophomores while studentsin the Fall survey were juniors or seniors. In the Fall, all of the instructors had had previousexperience teaching in the laptop environment, while in the Spring, several instructors were teachingin the laptop environment for the first time.

5
Academy of Educational Leadership Journal, Volume 12, Number 2, 2008
Table 2: Spring Student Survey
Yes No
Do you own a lap top? 90% 10%
Would you prefer the course in a room in which you could bring your own laptop? 60% 40%
StronglyAgree Agree Neutral Disagree
StronglyDisagree
Using the laptop computer enhanced mylearning in this course
20% 25% 25% 17% 13%
I used the laptop computer whenever theinstructor demonstrated Excel problems
35% 32% 16% 9% 9%
I feel that my Excel skills have improved because of computer use in this course.
38% 29% 11% 12% 9%
I feel more confident analyzing financialproblems.
13% 36% 30% 12% 9%
I used the laptop computer to take noteswhen the instructor lectured.
11% 20% 17% 24% 28%
I used the laptop computer to take noteswhen the instructor typed notes.
9% 27% 14% 21% 29%
I used the laptop computer to do work inother classes.
20% 36% 12% 19% 13%
I used the laptop computer for non-academicpursuits (email/surfing/games/etc.)
35% 29% 17% 9% 10%
I used the laptop computer in other classesbecause of using the computer in this course.
10% 16% 26% 28% 20%
Having computer access during quizzes andexams increases cheating.
14% 20% 26% 20% 20%
I use a laptop computer in other courses evenif it is not required.
9% 17% 22% 32% 20%
VeryEffective Effective Neutral Ineffective
VeryIneffective
Demonstration of spreadsheet problems. 57% 27% 9% 6% 1%
Lectures from PowerPoint. 27% 36% 25% 9% 2%
Lectures with the instructor typing notes. 14% 20% 34% 24% 8%
Lectures with the instructor writing on theboard.
10% 26% 29% 27% 7%
In class assignments that require surfing theweb.
27% 33% 30% 8% 2%
Class discussions. 10% 20% 42% 20% 8%

6
Academy of Educational Leadership Journal, Volume 12, Number 2, 2008
Two thirds of the students felt that their Excel skills improved because of laptops in thecourse. The students’ perception of increased Excel skills is also reflected in the activities that theyfound the computer to be most useful. Two thirds used Excel when the instructor demonstratedExcel problems, while only 42% used the computer to take notes when the instructor lectured. Nearly 60% found the computer useful when web browsing was required. Less than one third usedthe computer during class discussion.
As indicated in the Fall semester survey, laptops can be a source of distraction for students.Nearly two-thirds of the students used the laptops for non-academic pursuits, like web-surfing,emailing, or gaming. Over half of the students reported using the laptop to complete assignmentsfrom other courses. Student perception of the effectiveness of laptops in the classroom is probablylinked to the degree in which students are inclined to use the laptop for non-academic purposes. Inthe Fall survey, 55 percent of the students agreed and 22 percent of the students disagreed that theyused the laptop for non-academic pursuits, for a ratio of 2.5. In the Spring survey, the ratio increasedto 3.4.
As in the Fall survey, students had diverse opinions regarding the impact that laptopcomputers had on cheating on exams and quizzes. Surprisingly, the proportion who thought thatcheating increased were nearly the same (34% in the Fall, 33% in the Spring), as was the proportionwho believed that cheating did not increase (42% in the Fall, 40% in the Spring). The diverseopinion may be the result of classroom management techniques or may reflect diversity withinsections. A cross-tabulation of the academic dishonesty question by section shows large intra-section variation in student responses. Students within the same section have very different viewsof the effect that laptop computers have on academic dishonesty.
The second stage of the study was supplemented with direct classroom observations ofstudents using laptop computers in the classroom. The observer sat in the classroom with a laptopcomputer and recorded the number of students that were using the laptop for course purposes, usingthe laptop for non-course purposes, or not using the laptop. The activity of the instructor was alsonoted. The observation period was one minute in length and the observations were spaced in tenminute intervals. Five observations were taken in each class.
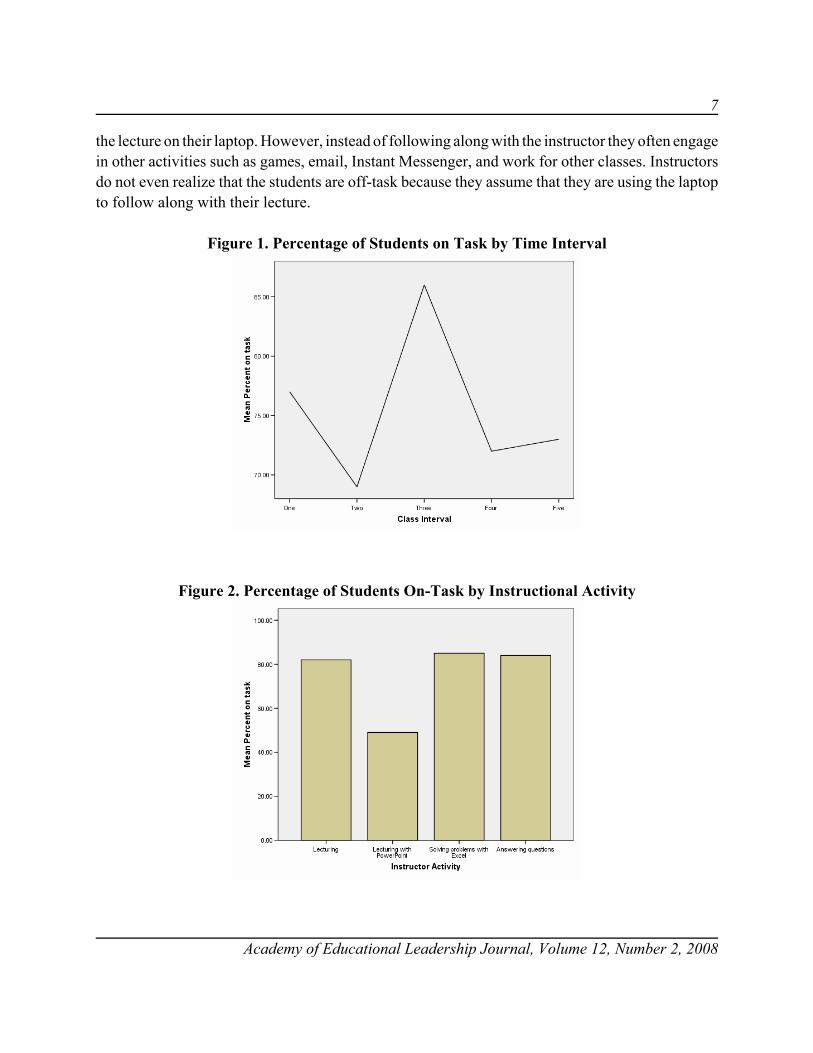
Figure 1 depicts the number of students on-task during each of the five observation intervals.The class observations indicate the highest number of students on-task can be found during classobservation interval three, which took place approximately 30 minutes into the class period.Students are the most engaged in class during the midpoint of class and the number of studentsengaging in on-task behaviors drops before and after the third observation interval.
The results of the class observations indicate that instructional activity plays a role instudents’ activities when using laptops in the classroom. Figure 2 depicts the percentage of studentson-task by instructional activity. The lowest percentage of on-task students was found when theinstructor lectured using PowerPoint. The reasons for this could be that many instructors post theirPowerPoint lectures online and students are expected to follow along with the instructor by viewing
7
Academy of Educational Leadership Journal, Volume 12, Number 2, 2008
the lecture on their laptop. However, instead of following along with the instructor they often engagein other activities such as games, email, Instant Messenger, and work for other classes. Instructorsdo not even realize that the students are off-task because they assume that they are using the laptopto follow along with their lecture.
Figure 1. Percentage of Students on Task by Time Interval
Figure 2. Percentage of Students On-Task by Instructional Activity
8
Academy of Educational Leadership Journal, Volume 12, Number 2, 2008
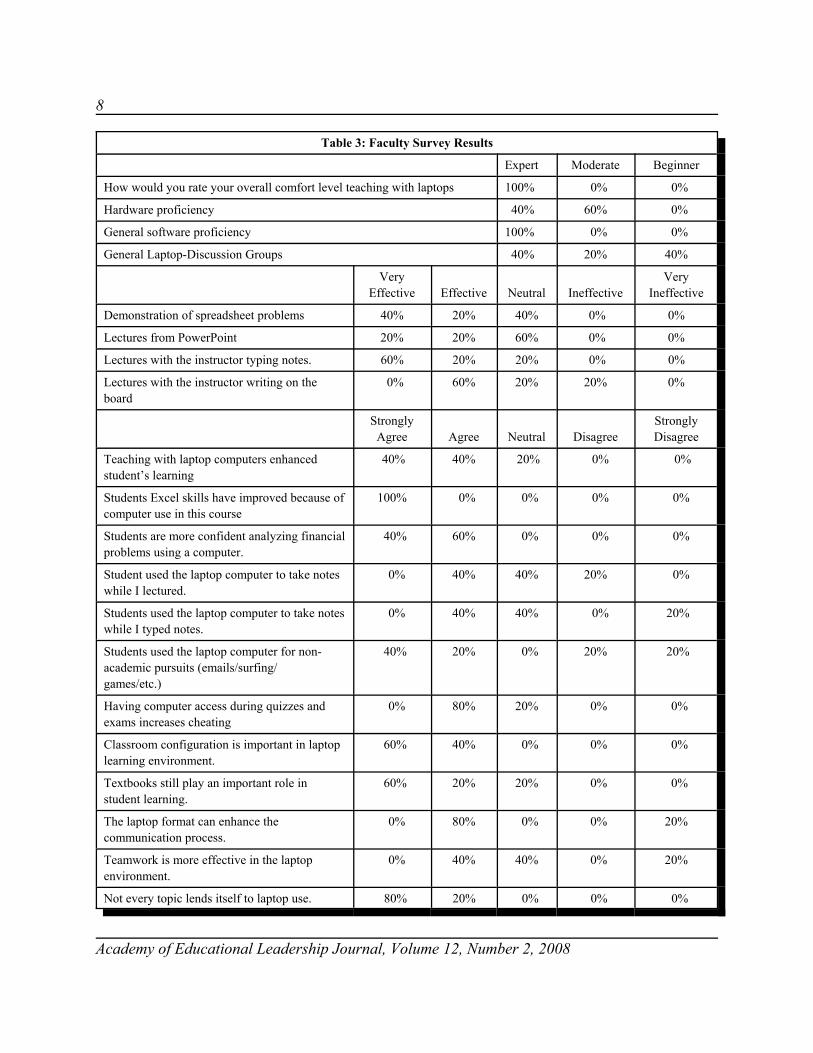
Table 3: Faculty Survey Results
Expert Moderate Beginner
How would you rate your overall comfort level teaching with laptops 100% 0% 0%
Hardware proficiency 40% 60% 0%
General software proficiency 100% 0% 0%
General Laptop-Discussion Groups 40% 20% 40%
VeryEffective Effective Neutral Ineffective
VeryIneffective
Demonstration of spreadsheet problems 40% 20% 40% 0% 0%
Lectures from PowerPoint 20% 20% 60% 0% 0%
Lectures with the instructor typing notes. 60% 20% 20% 0% 0%
Lectures with the instructor writing on theboard
0% 60% 20% 20% 0%
StronglyAgree Agree Neutral Disagree
StronglyDisagree
Teaching with laptop computers enhancedstudent’s learning
40% 40% 20% 0% 0%
Students Excel skills have improved because ofcomputer use in this course
100% 0% 0% 0% 0%
Students are more confident analyzing financialproblems using a computer.
40% 60% 0% 0% 0%
Student used the laptop computer to take noteswhile I lectured.
0% 40% 40% 20% 0%
Students used the laptop computer to take noteswhile I typed notes.
0% 40% 40% 0% 20%
Students used the laptop computer for non-academic pursuits (emails/surfing/games/etc.)
40% 20% 0% 20% 20%
Having computer access during quizzes andexams increases cheating
0% 80% 20% 0% 0%
Classroom configuration is important in laptoplearning environment.
60% 40% 0% 0% 0%
Textbooks still play an important role instudent learning.
60% 20% 20% 0% 0%
The laptop format can enhance thecommunication process.
0% 80% 0% 0% 20%
Teamwork is more effective in the laptopenvironment.
0% 40% 40% 0% 20%
Not every topic lends itself to laptop use. 80% 20% 0% 0% 0%
9
Academy of Educational Leadership Journal, Volume 12, Number 2, 2008
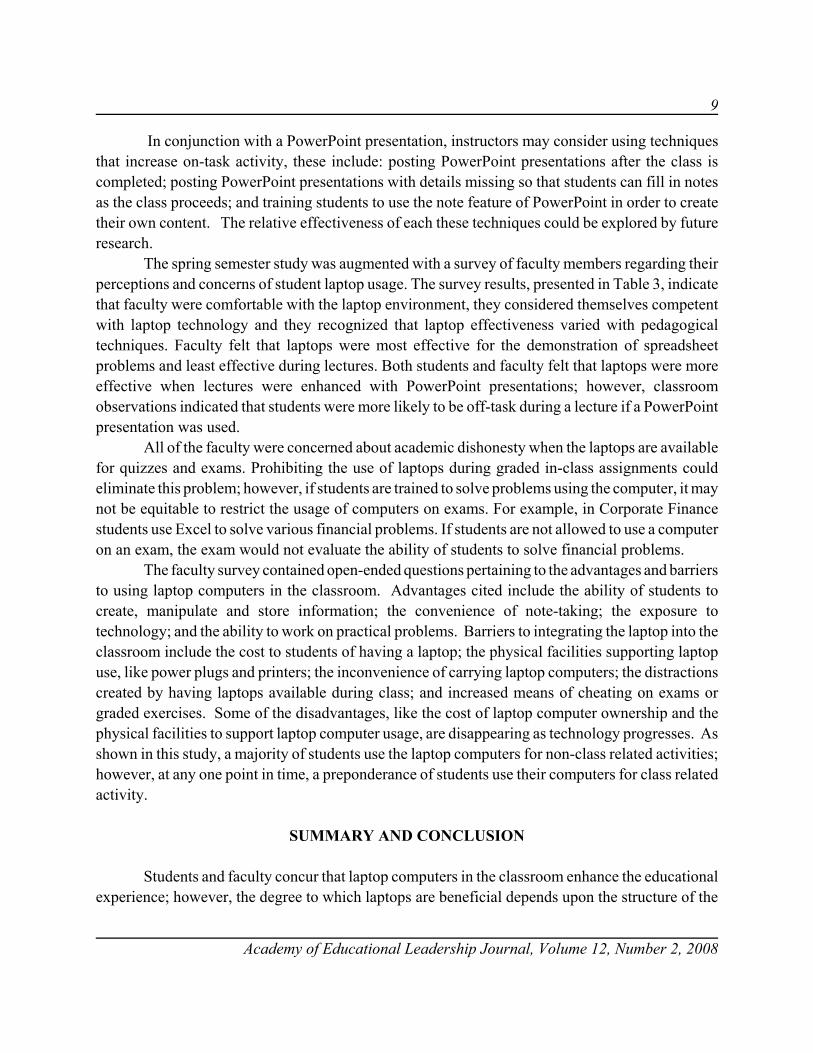
In conjunction with a PowerPoint presentation, instructors may consider using techniquesthat increase on-task activity, these include: posting PowerPoint presentations after the class iscompleted; posting PowerPoint presentations with details missing so that students can fill in notesas the class proceeds; and training students to use the note feature of PowerPoint in order to createtheir own content. The relative effectiveness of each these techniques could be explored by futureresearch.
The spring semester study was augmented with a survey of faculty members regarding theirperceptions and concerns of student laptop usage. The survey results, presented in Table 3, indicatethat faculty were comfortable with the laptop environment, they considered themselves competentwith laptop technology and they recognized that laptop effectiveness varied with pedagogicaltechniques. Faculty felt that laptops were most effective for the demonstration of spreadsheetproblems and least effective during lectures. Both students and faculty felt that laptops were moreeffective when lectures were enhanced with PowerPoint presentations; however, classroomobservations indicated that students were more likely to be off-task during a lecture if a PowerPointpresentation was used.
All of the faculty were concerned about academic dishonesty when the laptops are availablefor quizzes and exams. Prohibiting the use of laptops during graded in-class assignments couldeliminate this problem; however, if students are trained to solve problems using the computer, it maynot be equitable to restrict the usage of computers on exams. For example, in Corporate Financestudents use Excel to solve various financial problems. If students are not allowed to use a computeron an exam, the exam would not evaluate the ability of students to solve financial problems.
The faculty survey contained open-ended questions pertaining to the advantages and barriersto using laptop computers in the classroom. Advantages cited include the ability of students tocreate, manipulate and store information; the convenience of note-taking; the exposure totechnology; and the ability to work on practical problems. Barriers to integrating the laptop into theclassroom include the cost to students of having a laptop; the physical facilities supporting laptopuse, like power plugs and printers; the inconvenience of carrying laptop computers; the distractionscreated by having laptops available during class; and increased means of cheating on exams orgraded exercises. Some of the disadvantages, like the cost of laptop computer ownership and thephysical facilities to support laptop computer usage, are disappearing as technology progresses. Asshown in this study, a majority of students use the laptop computers for non-class related activities;however, at any one point in time, a preponderance of students use their computers for class relatedactivity.
SUMMARY AND CONCLUSION
Students and faculty concur that laptop computers in the classroom enhance the educationalexperience; however, the degree to which laptops are beneficial depends upon the structure of the

10
Academy of Educational Leadership Journal, Volume 12, Number 2, 2008
class. Access to computers in the classroom can increase student engagement as students take anactive role in learning; however, laptops in the classroom can lead to less engagement because ofincreased access to off-task activities, like the web, email and games. Course design becomes moreimportant in a laptop environment. A course that effectively integrates laptops has the potential ofincreasing student engagement; one that does not, has the potential of decreasing studentengagement. Just as course design becomes more important for student engagement in a laptopenvironment, so too does a culture of academic honesty. Technology increases the ways in whichstudents can receive aid on exams or other graded exercises. A strong culture of academic honestycan balance the increased ease of cheating. Currently, laptop computers outnumber desktop andlaboratory computers on campus (Wagner, 2005). Laptop computers will become increasinglyprevalent in college classrooms; faculty and administrators need to adapt pedagogy to maximizetheir usefulness. Future research could compare the learning outcomes of students with laptopsversus those without laptops.
REFERENCES
Ball, S., Eckel C. & Rojas, C. (2006). Technology Improves Learning in Large Principles of Economics Classes: UsingOur WITS, The American Economic Review, 96(2): 442-446.
Carnevale, D. & Young, J. (2006). The Challenges and Benefits of Requiring Students to Buy Laptops, The Chronicleof Higher Education, 52(38): 39.
Cudd, M., Lispscomb, T. & Tanner, J. (2003). Technology in the Classroom: An Assessment of Hardware and SoftwareUse in Finance Instruction, Journal of Education for Business, 78:5: 244-248.
Duncan, D. (2000). Using Computers in the Classroom: A Boon or Bust? Journal of Computer Information Systems,40:4: 1-4.
Effaw, J., Hampton, S., Martinez, S., & Smith, S. (2004). Miracle or Menace: Teaching and learning with laptopcomputers in the classroom. Educause Quarterly, 3, 10-18.
Hall, M. & Elliot. K. (2003). Diffusion of Technology Into the Teaching Process: Strategies to Encourage FacultyMembers to Embrace the Laptop Environment, Journal of Education for Business, 78:6: 301-307.
Oppenheimer, T. (2003). The flickering mind: The false promise of technology in the classroom and how learning canbe saved. New York: Random House Publishing Group.
Wagner, E. (2005). Enabling Mobile Learning, Educause Review, May/June: 41-52.
Young, J. (2006). The Fight for Classroom Attention: Professor vs. Laptop, The Chronicle of Higher Education, 52(39):27.

11
Academy of Educational Leadership Journal, Volume 12, Number 2, 2008
DEMOGRAPHIC FACTORS AND STUDENTPREFERENCES ON THE SYLLABUS IN
THE PRINCIPLES OF ACCOUNTING COURSE
Carl E. Keller, Jr., Indiana University-Purdue University, Fort WayneJohn G. Marcis, Coastal Carolina University
Alan B. Deck, Bellarmine University
ABSTRACT
At one time, the course syllabus was a one-page document. Today’s typical college syllabusis a multiple-page document that addresses a number of issues and contingencies. This paperpresents the results of a survey of 1,726 students from 31 universities in 19 states regarding thecourse syllabus. The survey instrument was administered during the spring 2002 term and contained28 items that previous research indicates are likely to appear on a course syllabus. The primarypurpose of this study is to assess the relative importance students in the Principles of Accountingcourse place on different items that frequently appear on a course syllabus. The results are analyzedby the following demographic characteristics: gender, age, years of college experience, and gradepoint average. The findings of the study indicate that students do not attach the same amount ofimportance to all syllabus components and that the level of perceived importance varies by thedemographic factors. Faculty members may use the findings of this study to adjust their syllabi toimprove communication to different types of students.
INTRODUCTION
In recent years, groups as diverse as the American Association for Higher Education, theCarnegie Foundation for the Advancement of Teaching, state legislatures, business leaders, students,and parents have called for improvements in higher education (Seldin 1990). Specific calls toimprove accounting education at colleges and universities have been made by the AccountingEducation Change Commission (AECC), the American Accounting Association (AAA), the majoraccounting firms, and many others (AAA, 1996; AECC, 1993; Albrecht & Sack, 2000; Kerr &Smith, 2003). The AECC identified five dimensions it considered critical for effective teaching, andthe Committee on Promoting and Evaluating Effective Teaching reaffirmed the importance of thefive critical areas (AAA, 1996). The five dimensions are designing/developing curriculums andcourses, selecting and using appropriate material strong presentation skills, using suitablepedagogical methods and assessment devices, and providing guidance and advisement to students.
12
Academy of Educational Leadership Journal, Volume 12, Number 2, 2008
Although most accounting syllabi do not specifically address presentation skills, they often reflectthe design of the course, the selection of appropriate material, the pedagogical methods andassessment devices that will be used, and some guidance to the students on how to successfullycomplete the course.
Furthermore, the instructor prepares the course syllabus for several stakeholders: students,colleagues, administrators, and accrediting agencies. Jervis and Hartley (2005) suggest that facultymay use syllabi from other schools to aid in developing a course, and several AAA sections supportsyllabi exchange websites. Faculty and administrators often view the syllabus as a formal contractbetween the instructor and students. Unfortunately, when a procedural difficulty occurs in a course,the lack of information in the syllabus is often the source of the problem. Consequently, the syllabusmay be a major consideration in student appeal proceedings (Parkes and Harris, 2002). In addition,the syllabus is used in decisions regarding accreditation of educational institutions and programs.Perhaps the mixture of several purposes and stakeholders has created a variance in the length ofcourse syllabi. Where the syllabus was once a one-page document, it has evolved into a detailedcourse guide of several pages that addresses a number of issues and contingencies (Garavalia et al.,1999).
A review of the literature also indicates some dissension on the purposes/components thatmake up an “ideal” syllabus. According to Matejka and Kurke (1994), an ideal course syllabusshould include the instructor’s plan of action for the course, the standard provisions for a contractbetween student and instructor, a statement of the course’s general purpose, the instructor’sorientation to the content and, finally, the information that should be given to the customer (i.e., thestudent). While Parkes and Harris (2002) agree that a syllabus should serve as a contract, theybelieve the other purposes of a syllabus are to provide permanent documentation for assessment andto provide information useful for student learning. While controversial, the idea that the syllabusshall form the basis of a contract is not surprising for instructors who believe that students are indeedcustomers (Shelley,, 2005; Halbesleben et al., 2003). Those teachers would be interested in researchthat determines what their customers want and need in a syllabus.
However, individuals involved in higher education who do not accept the viewpoint ofstudents as customers may still find student opinions are important for several pragmatic reasons(Zell, 2001). First, students may use the syllabus to decide if they should continue their enrollmentin the class. For example, a student may decide his/her schedule is overloaded if the syllabuscommunicates that several time-consuming projects are required for the class. The student canwithdraw from the class and take the course in a later semester, presumably when the student hasmore time available. Additionally, professors who have enrollment-sensitive classes may need toknow the most important syllabus factors in the prospective student’s decision. Second, an instructormay find it prudent to know the critical components of a course syllabus from a student’sperspective, given the relative weight of student evaluations in tenure, promotion, and pay raisedecisions. Course evaluation forms often ask the student to respond to questions about the syllabus

13
Academy of Educational Leadership Journal, Volume 12, Number 2, 2008
(e.g., “The instructor provided a syllabus that clearly stated the course requirements”). Thus, aninstructor’s evaluation scores could be negatively affected if the material considered most importantto the student is not included in their syllabus. Finally, as the course syllabus grows in length, thestudents may struggle with information overload. In other words, the increasing length of coursesyllabi may impede the student from discerning the information he/she really needs to process,particularly if the size of the syllabus discourages the student from reading the entire document.
In any case, Altman (1999) suggests that syllabus goals can only be achieved if the syllabusprovides sufficient information. Yet, sufficient information may not be the only problem facing theinstructor’s syllabus. One would expect students to read and remember only information they deemimportant. Even though an instructor may believe that all of the information in the syllabus is ofgreat importance, it does not necessarily follow that the students will attach the same weight to thatinformation. Furthermore, students with similar characteristics may have similar preferences oncourse design, teaching and assessment methods, and administrative issues, all of which are usuallyreflected in the course syllabus.
Therefore, this study assesses the relative importance that students in the Principles ofAccounting course place on items that previous research indicates frequently appear on a coursesyllabus. Data for the study were gathered with a one-page questionnaire. A national “conveniencesample” was conducted during the Spring 2002 term. The paper is organized in the followingmanner. The first section provides a review of the available literature. The second section discussesthe design and the administration of the survey questionnaire. The third section presents the study’sresults and the final section discusses the overall conclusions from the study.
REVIEW OF THE LITERATURE
Although numerous articles from various disciplines discuss general syllabus content,empirical studies of syllabus components are a generally unexplored area. In a search of theliterature, only three empirical studies of syllabus components were identified. A study by Smith andRazzouk (1993) gathered information from 152 students enrolled in two upper-division marketingcourses at a state-assisted university in the southwest U.S. The purpose of the study was to “assessthe nature and degree of usage of course syllabi” (Smith and Razzouk, 1993, 218) by advancedundergraduate marketing students. The survey instrument developed by Smith and Razzouk wascomposed primarily of open-ended questions that were dependent upon a student’s ability to recallspecific information from the course syllabus. Smith and Razzouk were surprised at the inability ofthese advanced undergraduates to recall relevant syllabus information such as course objectives andevaluation procedures. Smith and Razzouk concluded it was necessary to increase the effectivenessof the course syllabus “as a communication vehicle in the classroom” (Smith and Razzouk 1993,218).

14
Academy of Educational Leadership Journal, Volume 12, Number 2, 2008
Becker and Calhoon (1999) conducted a pre- and post-semester survey of 863 and 509undergraduate students, respectively, in various sections of introductory psychology courses at fourmidwestern institutions. The students were asked to view 29 items that are likely to appear on acourse syllabus and indicate (with a seven-point Likert scale) how much they would attend to eachof the 29 items. Of the 29 items, the four that were “most important” to students were: “examinationand quiz dates,” “due dates of assignments,” the “reading material covered by each exam or quiz,”and the “grading procedures and policies.” The four items that were the “least important” to thestudents were: the “titles and authors of textbooks and readings,” the “drop (withdrawal) dates,”“course information” (such as course number and title, section number, credit hours), and the“academic dishonesty policy.” Comparing “first semester students” to “continuing students,” Beckerand Calhoon found continuing students ranked items pertaining to the type of exams andassignments higher than first-semester students. Comparing students of “traditional age” with thoseof a “non-traditional age,” Becker and Calhoon found “continuing students rated items pertainingto course goals, title, and author of textbooks, and kind of assignments as more important than didtraditional-age students” (Becker and Calhoon, 1993, 9).
Garavalia et al. (1999) compared survey responses (using a five-point Likert scale) of 242students and 74 faculty at Valdosta State University. The undergraduate students were enrolled ineight sections of the university’s introductory psychology course. The 74 faculty who participatedin the study were solicited using a university faculty listserv that contained 536 members. Bothfaculty and students responded to a 39-item survey. The results of the study indicated that studentsand faculty members differed in the amount of importance assigned to 15 suggested syllabicomponents. Items students and faculty disagreed upon include: “examples of completedprojects/papers,” the “instructor’s home phone number,” the “basic format of examinations,” andthe “length of required projects/papers.” Examples of items that faculty members and students ratedsimilarly in importance were: the “instructor’s e-mail address,” the “grading scale for final coursegrade,” and “the syllabus should be adjusted periodically throughout the semester.”
RESEARCH METHODOLOGY
Accounting faculty at 50 colleges and universities were contacted via e-mail early in theSpring 2002 term and asked to participate in a study pertaining to the course syllabus. The contactedfaculty members were asked to administer a survey questionnaire to students enrolled in anintroductory accounting course. Some faculty stated they were interested in the research concept butwere not teaching an introductory course in the spring term. Other faculty stated that institutionalpolicies or other reasons made them unable/unwilling to participate in this study. Faculty at 31institutions in 19 states agreed to administer the survey questionnaire to students enrolled in thePrinciples of Accounting course. Faculty who agreed to have their classes participate in the studywere mailed a package that contained a specified number of student survey questionnaires and a pre-

15
Academy of Educational Leadership Journal, Volume 12, Number 2, 2008
paid, pre-addressed envelope in which to return the completed student questionnaires. Each facultyparticipant was asked to distribute the student questionnaires to willing volunteers. The studentsanswered the survey questions after their class session.
The instructions at the top of the survey were: “The Syllabus for a course is an ‘agreement’between the instructor and the students in a course. We are researching what factors students feelare important to include in a Syllabus.” The survey instrument contained two sections. The firstsection contained 28 items that frequently appear on a course syllabus. For the most part, the itemsused in this study were also used in the study by Becker and Calhoon (1999). A seven-point Likertscale was assigned to the student responses (where “1” = “no attention at all” to “7” = “great dealof attention”). Each item in this section had a corresponding reference to a course syllabuscomponent (e.g., “attendance policy,” “examination and quiz dates,” “late assignment policy,”“course goals and objectives,” and “required prerequisite coursework to enroll in the course”).
The second section of the survey requested demographic data from the individual studentrespondent. Specific questions pertained to the respondent’s gender, age, year in school, primaryfield of study, and grade point average. Each faculty member who distributed the survey alsocompleted a questionnaire. The faculty responded to the 28 syllabus items and provided datapertaining to institutional characteristics. Specific questions inquired if the institution was eitherprivate or state-assisted, if the school of business was accredited by the Association to AdvanceCollegiate Schools of Business-International (AACSB), the state in which the college/university waslocated, and the approximate “full-time equivalent” (FTE) size of the student body.
RESULTS
This study examines perceptions of syllabi items by different student groups. Therefore,Panel A of Table 1 summarizes institutional and student data for specific demographiccharacteristics. Students at state-assisted institutions accounted for 71.4 percent (1,233 of 1,726) ofthe respondents, although only 61.3 percent (19 of 31) of the colleges and universities thatadministered the survey were public institutions. While approximately one-third of U.S. collegesand universities were accredited by the AACSB in 2002, almost 39 percent (672 of 1,726) of thestudent respondents were at these institutions. Although none of the responding colleges anduniversities had more than 20,000 full-time equivalent (FTE) enrollment, almost half (48.4 percent)of the institutions had student enrollment between 1,000 and 4,999 FTE.
Panel B of Table 1 presents the self-reported data provided by the student respondents. Ofthe 1,726 respondents, the number of males and females were approximately equal, with 847 (49.1percent) female respondents, 864 (50 percent) male respondents, and 15 non-respondents (to thisquestion). The average age of the respondents was 21.63 years and the students were, on average,taking 14.29 credit hours of classes. Most students were in their second (44.8 percent) or third (31.6percent) year of collegiate studies. Although a number of academic majors were represented by the

16
Academy of Educational Leadership Journal, Volume 12, Number 2, 2008
respondents, the four most frequent majors were Management (18.4 percent), Accounting (16.6percent), General Business (15.6 percent), and Marketing (14.5 percent). The average cumulativegrade point average reported by the student respondents was 3.0.
Table 1: Institution and Respondent Demographic Data
Panel A: Institutional and Student Respondents
Institutions Students
Characteristic Number Percent Number Percent
Public (state-assisted) 19 61.3 1,233 71.4
Private 12 38.7 493 28.6
AACSB 10 32.3 672 38.9
Non-AACSB 21 67.7 1,054 61.1
Less than 1,000 FTE 1 3.2 19 1.1
1,000 – 4,999 FTE 15 48.4 834 48.3
5,000 – 9,999 FTE 10 32.3 551 31.9
10,000 – 20,000 FTE 5 16.1 322 18.6
More than 20,000 FTE 0 0.0 0 0.0
Panel B: Student Respondents
Characteristic Number Percent
Male 864 50.0
Female 847 49.1
Not Reported 15 0.9
First Year 169 9.8
Second Year 774 44.8
Third Year 546 31.6
Fourth Year 174 10.1
Fifth (or More) Year 31 1.8
Not Reported 32 1.9
Accounting 287 16.6
Economics 45 2.6
Finance 144 8.3
General Business 269 15.6
Information Systems 189 11.0
Management 318 18.4

17
Table 1: Institution and Respondent Demographic Data
Academy of Educational Leadership Journal, Volume 12, Number 2, 2008
Marketing 250 14.5
Other Business 45 2.6
Sciences 20 1.2
Humanities and Social Sciences 58 3.4
Journalism 8 0.5
Mathematics & Comp. Science 15 0.9
Education 3 0.2
Fine Arts 7 0.4
Other Major 25 1.4
Undecided/Undeclared 15 0.9
Not Reported 28 1.6
Characteristic Number Average
Age (in years) 1,677 21.63
Credit Hours Current Semester 1,691 14.29
Cumulative G.P.A. 1,508 3.00
Table 2 reports the summary statistics (mean and standard deviation) for each of the 28survey items, listed in order from the highest mean (most important item to appear on the syllabus)to the lowest mean (least important to appear on the syllabus). Using a seven-point Likert scale forthe responses (“1” = “no attention at all” to “7” = “great deal of attention”), the five items with thelargest numerical values were: “Grading procedure and policies” (6.451), “Number of examinationsand quizzes” (6.262), “Examination and quiz dates” (6.255), “Instructor information (for example,name, title, office location, phone number, and e-mail address)” (6.126), and the “Due dates of out-of-class assignments” (6.065). The five items with the lowest numerical values were: “Academicdishonesty policy” (4.691), “Title and authors of textbooks and readings” (4.750), “Requiredprerequisite coursework necessary to enroll in the course” (4.975), “Course information (forexample, course number and title, section number, credit hours)” (4.992), and “Drop/withdrawaldates” (5.051). These results indicate that students attach differing amounts of importance tosyllabus components. The extreme example is the amount of importance students place upon“Grading procedure and policies” as compared to “Academic dishonesty policy.” The difference inthe mean scores between those two items is 1.76 = (6.451 – 4.691). Thus, the score for “Gradingprocedure and policies” increased by 37.52 percent over the score given to the survey item titled“Academic dishonesty policy.”

18
Academy of Educational Leadership Journal, Volume 12, Number 2, 2008
Table 2: Syllabus Item Mean and Standard Deviation Results:
Ranked by Mean Score
10 Number of examinations and quizzes 6.262 1.098 1,719
12 Examination and quiz dates 6.255 1.293 1,720
6 Instructor information (i.e.; name, title, office location, phone, e-mail)
6.126 1.226 1,725
17 Due dates of out-of-class assignments 6.065 1.427 1,719
25 Instructor’s office hours 6.058 1.289 1,720
8 Attendance policy 6.045 1.360 1,719
11 Kind of assignments (i.e.; readings, papers, presentations, projects) 6.008 1.275 1,719
9 Type of examinations and quizzes (i.e.; multiple choice, essay) 5.981 1.339 1,722
13 Reading material covered by each examination or quiz 5.975 1.335 1,719
2 Days, hours, and location of class meetings 5.738 1.589 1,726
16 Whether extra credit can be earned 5.712 1.558 1,720
20 Dates and time of special events that must be attended outside class 5.690 1.630 1,721
18 Late assignment policy 5.662 1.487 1,718
14 Schedule of topics to be covered 5.624 1.449 1,716
5 Course format (i.e.; lecture, discussion, videos, classroom activities) 5.577 1.456 1,722
1 Class participation requirements 5.457 1.522 1,725
4 Course description 5.438 1.578 1,712
21 Amount of work (i.e.; amount, number & length of assignments) 5.322 1.598 1,721
23 Course goals and objectives 5.300 1.608 1,715
28 Available support services (i.e.; tutoring, computerized study guides) 5.272 1.720 1,705
24 Holidays observed 5.213 1.822 1,720
22 Where to obtain materials for class (i.e.; texts, readings, labs ) 5.062 1.737 1,719
27 Drop/withdrawal dates 5.051 1.865 1,714
3 Course information (i.e.; course #, title, section number, credit hours) 4.992 1.824 1,725
19 Required prerequisite coursework necessary to enroll in the course 4.975 1.884 1,712
15 Title and authors of textbooks and readings 4.750 1.938 1,719
26 Academic dishonesty policy 4.691 1.975 1,717
For Tables 3 through 6, tests were conducted to see if gender, years in college, GPA, or theage of the students made a difference in their responses to the syllabus components. In general, thesample data for each of the 28 items exhibited some distribution tendencies of skewness or kurtosis.

19
Academy of Educational Leadership Journal, Volume 12, Number 2, 2008
However, if each group has more than 30 subjects, a traditional ANOVA procedure is robust againstmoderate departures from normality (Lehman et al., 2005). Also, a Levene’s test for equal cellvariances was conducted for each of the 28 items in each of the following analyses. The Levene’stest results indicated that unequal variances occurred (p < .05) for gender in nine of 28 cases, twoof 28 cases for GPA, eight of 28 cases for class rank, and 13 of 28 cases in the analysis of traditionaland nontraditional students. Therefore, a Welch ANOVA was selected as a conservative statisticalapproach, as it allows for unequal group variances when testing for differences in group means. Ifthe Welch ANOVA indicated that a significant difference (p < .05) between groups existed, then aGames-Howell Pairwise Comparison test was used when more than two groups existed in the meanstest. The Games-Howell test is a nonparametric multiple comparison procedure used to determinewhich of the groups are different from one another. In addition, Tamhane’s T2, Dunnett’s T3, andDunnett’s C nonparametric multiple comparison procedures were conducted on the data and theparametric Tukey-Kramer HSD multiple comparison procedure was applied to the data. All of thetests yielded approximately the same results provided by the Games-Howell Pairwise Comparisontest.
Table 3 indicates that significant differences (p < .05) exist between male and female ratingsof syllabus components on 11 of the 28 questions. Except for three items, (“Where to obtainmaterials for class,” “Amount of work,” and “Course goals and objectives”) females rated thesyllabus components as more important than males. Thus, females appear to place more importanceon the communication of syllabus information. Both sexes rate “Grading procedures and policies”as the most important item, and both sexes provide the lowest mean for the item, “Academicdishonesty policy.” The most significant differences between the two groups’ responses were theitems: “Instructor’s office hours,” “Attendance policy,” “Number of examinations and quizzes,” and“Instructor information (for example, name, title, office location, phone number, e-mail address).”These results suggest that females put more importance on instructor information than males.
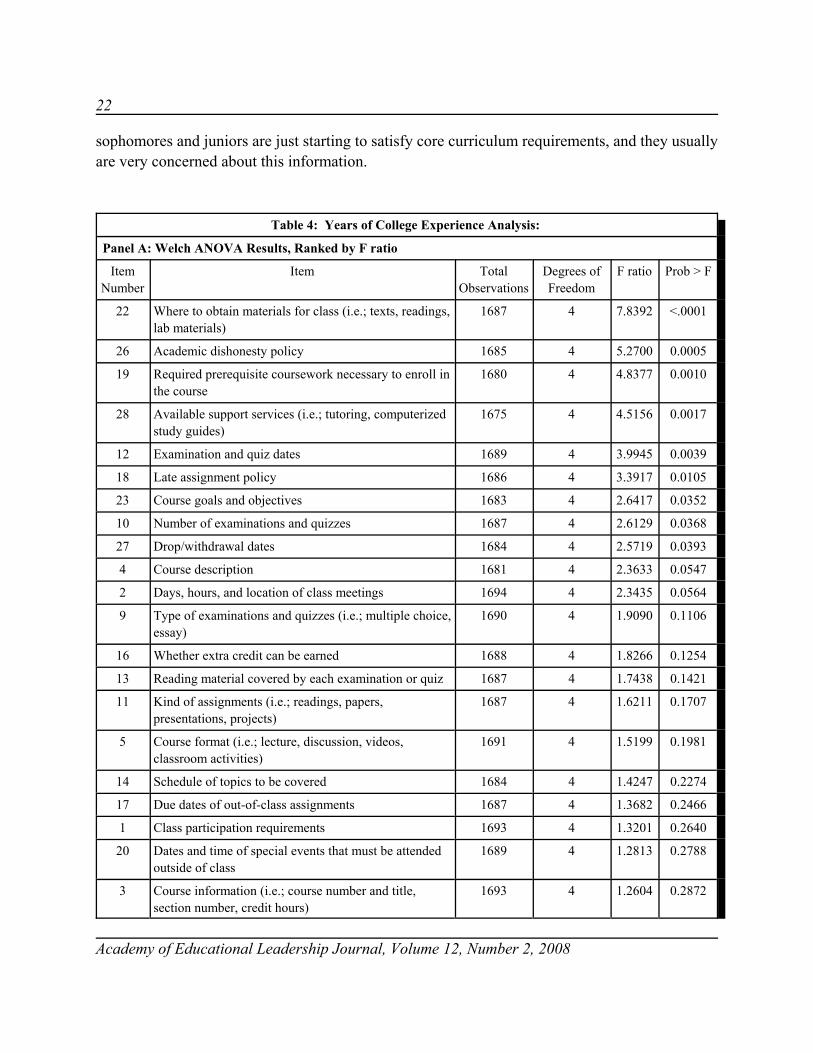
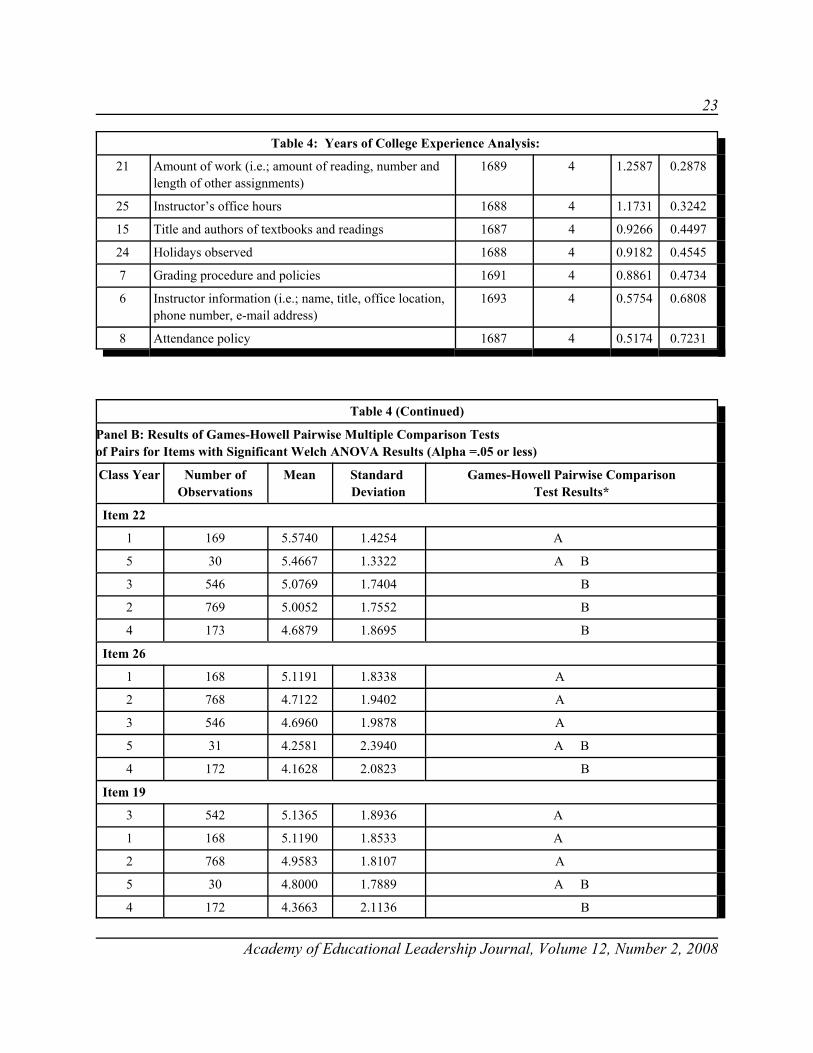
Table 4 reflects the effect of college experience on the importance that students attach tosyllabus components. Traditional class ranks of freshman, sophomore, junior, and senior weredesignated as one, two, three, or four years of experience, respectively. Students who reported thatthey had attended university classes for more than four years were placed into the same group, anddesignated to have at least five years of college experience. The number of usable responses to the28 items ranged from 1,675 to 1,694. Panel A of Table 4 displays the Welch ANOVA results. TheANOVA results indicate that significant differences (p < .05) exist between the different classgroups on nine of the 28 items. Items displaying the most significant differences (p < .001) include“Where to obtain materials for class (for example, texts, readings, lab materials)” and “Academicdishonesty policy.”

20
Academy of Educational Leadership Journal, Volume 12, Number 2, 2008
Table 3: Student Gender Analysis:
Welch ANOVA Results, Ranked by Absolute Difference between Means
Means AbsoluteDiff.
ItemNumber
Item Female Male betweenMeans
F ratio Prob > F
25 Instructor’s office hours 6.1965 5.9233 0.2732 19.3602 <.0001
8 Attendance policy 6.1809 5.9149 0.2660 16.4798 <.0001
17 Due dates of out-of-class assignments 6.1708 5.9582 0.2126 9.4894 0.0021
6 Instructor information (i.e.; name, title, officelocation, phone number, e-mail address)
6.2326 6.0209 0.2117 12.8107 0.0004
16 Whether extra credit can be earned 5.8197 5.6095 0.2102 7.7925 0.0053
10 Number of examinations and quizzes 6.3586 6.1676 0.1910 12.9764 0.0003
18 Late assignment policy 5.7547 5.5728 0.1819 6.4075 0.0115
20 Dates and time of special events that must beattended outside of class
5.7787 5.6074 0.1713 4.7242 0.0299
22 Where to obtain materials for class (i.e.;texts, readings, lab materials)
4.9775 5.1347 0.1572 3.4846 0.0621
11 Kind of assignments (i.e.; readings, papers,presentations, projects)
6.0852 5.9313 0.1539 6.2240 0.0127
7 Grading procedure and policies 6.5284 6.3766 0.1518 10.4629 0.0012
14 Schedule of topics to be covered 5.6956 5.5535 0.1421 4.1092 0.0428
1 Class participation requirements 5.5242 5.3893 0.1349 3.3544 0.0672
15 Title and authors of textbooks and readings 4.8107 4.6834 0.1273 1.8313 0.1762
12 Examination and quiz dates 6.3147 6.1947 0.1200 3.6547 0.0561
26 Academic dishonesty policy 4.7476 4.6276 0.1200 1.5665 0.2109
28 Available support services (i.e.; tutoring,computerized study guides)
5.3293 5.2255 0.1038 1.5393 0.2149
13 Reading material covered by eachexamination or quiz
6.0225 5.9302 0.0923 2.0428 0.1531
2 Days, hours, and location of class meetings 5.7792 5.6968 0.0824 1.1514 0.2834
19 Required prerequisite coursework necessaryto enroll in the course
5.0095 4.9274 0.0821 0.8046 0.3698
24 Holidays observed 5.2539 5.1798 0.0741 0.7025 0.4021
5 Course format (i.e.; lecture, discussion,videos, classroom activities)
5.6107 5.5406 0.0701 0.9835 0.3215
21
Table 3: Student Gender Analysis:
Welch ANOVA Results, Ranked by Absolute Difference between Means
Means AbsoluteDiff.
ItemNumber
Item Female Male betweenMeans
F ratio Prob > F
Academy of Educational Leadership Journal, Volume 12, Number 2, 2008
21 Amount of work (i.e.; amount of reading,number and length of other assignments)
5.3001 5.3442 0.0441 0.3221 0.5704
4 Course description 5.4618 5.4179 0.0439 0.3282 0.5668
9 Type of examinations and quizzes (i.e.;multiple choice, essay)
5.9965 5.9594 0.0371 0.3249 0.5687
23 Course goals and objectives 5.2889 5.3097 0.0208 0.0704 0.7908
27 Drop/withdrawal dates 5.0548 5.0418 0.0130 0.0206 0.8859
3 Course information (i.e.; course number andtitle, section number, credit hours)
4.9965 4.9850 0.0115 0.0170 0.8963
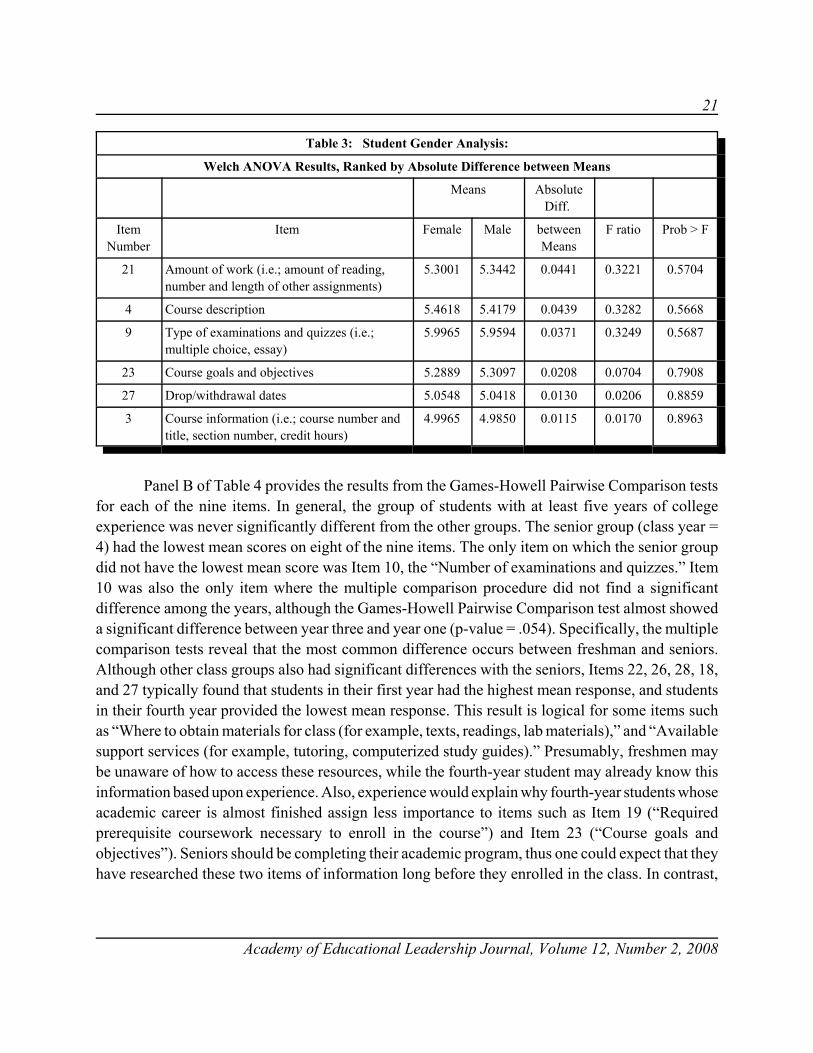
Panel B of Table 4 provides the results from the Games-Howell Pairwise Comparison tests
for each of the nine items. In general, the group of students with at least five years of collegeexperience was never significantly different from the other groups. The senior group (class year =4) had the lowest mean scores on eight of the nine items. The only item on which the senior groupdid not have the lowest mean score was Item 10, the “Number of examinations and quizzes.” Item10 was also the only item where the multiple comparison procedure did not find a significantdifference among the years, although the Games-Howell Pairwise Comparison test almost showeda significant difference between year three and year one (p-value = .054). Specifically, the multiplecomparison tests reveal that the most common difference occurs between freshman and seniors.Although other class groups also had significant differences with the seniors, Items 22, 26, 28, 18,and 27 typically found that students in their first year had the highest mean response, and studentsin their fourth year provided the lowest mean response. This result is logical for some items suchas “Where to obtain materials for class (for example, texts, readings, lab materials),” and “Availablesupport services (for example, tutoring, computerized study guides).” Presumably, freshmen maybe unaware of how to access these resources, while the fourth-year student may already know thisinformation based upon experience. Also, experience would explain why fourth-year students whoseacademic career is almost finished assign less importance to items such as Item 19 (“Requiredprerequisite coursework necessary to enroll in the course”) and Item 23 (“Course goals andobjectives”). Seniors should be completing their academic program, thus one could expect that theyhave researched these two items of information long before they enrolled in the class. In contrast,
22
Academy of Educational Leadership Journal, Volume 12, Number 2, 2008
sophomores and juniors are just starting to satisfy core curriculum requirements, and they usuallyare very concerned about this information.
Table 4: Years of College Experience Analysis:
Panel A: Welch ANOVA Results, Ranked by F ratio
ItemNumber
Item TotalObservations
Degrees ofFreedom
F ratio Prob > F
22 Where to obtain materials for class (i.e.; texts, readings,lab materials)
1687 4 7.8392 <.0001
26 Academic dishonesty policy 1685 4 5.2700 0.0005
19 Required prerequisite coursework necessary to enroll inthe course
1680 4 4.8377 0.0010
28 Available support services (i.e.; tutoring, computerizedstudy guides)
1675 4 4.5156 0.0017
12 Examination and quiz dates 1689 4 3.9945 0.0039
18 Late assignment policy 1686 4 3.3917 0.0105
23 Course goals and objectives 1683 4 2.6417 0.0352
10 Number of examinations and quizzes 1687 4 2.6129 0.0368
27 Drop/withdrawal dates 1684 4 2.5719 0.0393
4 Course description 1681 4 2.3633 0.0547
2 Days, hours, and location of class meetings 1694 4 2.3435 0.0564
9 Type of examinations and quizzes (i.e.; multiple choice,essay)
1690 4 1.9090 0.1106
16 Whether extra credit can be earned 1688 4 1.8266 0.1254
13 Reading material covered by each examination or quiz 1687 4 1.7438 0.1421
11 Kind of assignments (i.e.; readings, papers,presentations, projects)
1687 4 1.6211 0.1707
5 Course format (i.e.; lecture, discussion, videos,classroom activities)
1691 4 1.5199 0.1981
14 Schedule of topics to be covered 1684 4 1.4247 0.2274
17 Due dates of out-of-class assignments 1687 4 1.3682 0.2466
1 Class participation requirements 1693 4 1.3201 0.2640
20 Dates and time of special events that must be attendedoutside of class
1689 4 1.2813 0.2788
3 Course information (i.e.; course number and title,section number, credit hours)
1693 4 1.2604 0.2872
23
Table 4: Years of College Experience Analysis:
Academy of Educational Leadership Journal, Volume 12, Number 2, 2008
21 Amount of work (i.e.; amount of reading, number andlength of other assignments)
1689 4 1.2587 0.2878
25 Instructor’s office hours 1688 4 1.1731 0.3242
15 Title and authors of textbooks and readings 1687 4 0.9266 0.4497
24 Holidays observed 1688 4 0.9182 0.4545
7 Grading procedure and policies 1691 4 0.8861 0.4734
6 Instructor information (i.e.; name, title, office location,phone number, e-mail address)
1693 4 0.5754 0.6808
8 Attendance policy 1687 4 0.5174 0.7231
Table 4 (Continued)
Panel B: Results of Games-Howell Pairwise Multiple Comparison Testsof Pairs for Items with Significant Welch ANOVA Results (Alpha =.05 or less)
Class Year Number ofObservations
Mean Standard Deviation
Games-Howell Pairwise ComparisonTest Results*
Item 22
1 169 5.5740 1.4254 A
5 30 5.4667 1.3322 A B
3 546 5.0769 1.7404 B
2 769 5.0052 1.7552 B
4 173 4.6879 1.8695 B
Item 26
1 168 5.1191 1.8338 A
2 768 4.7122 1.9402 A
3 546 4.6960 1.9878 A
5 31 4.2581 2.3940 A B
4 172 4.1628 2.0823 B
Item 19
3 542 5.1365 1.8936 A
1 168 5.1190 1.8533 A
2 768 4.9583 1.8107 A
5 30 4.8000 1.7889 A B
4 172 4.3663 2.1136 B

24
Table 4 (Continued)
Panel B: Results of Games-Howell Pairwise Multiple Comparison Testsof Pairs for Items with Significant Welch ANOVA Results (Alpha =.05 or less)
Class Year Number ofObservations
Mean Standard Deviation
Games-Howell Pairwise ComparisonTest Results*
Academy of Educational Leadership Journal, Volume 12, Number 2, 2008
Item28
1 168 5.4286 1.6545 A
2 762 5.3504 1.6900 A
3 541 5.2717 1.7208 A
5 31 5.1290 1.7271 A B
4 173 4.7225 1.8719 B
Item 12
1 169 6.4556 1.0291 A
3 544 6.3640 1.1721 A
5 31 6.1935 1.2759 A B
2 771 6.1621 1.4081 B
4 174 6.1034 1.3688 A B
Item 18
1 169 5.8935 1.3231 A
3 541 5.7800 1.4278 A
5 31 5.6774 1.6204 A B
2 771 5.6174 1.4929 A B
4 174 5.3966 1.6157 B
Item 23
5 31 5.6129 1.4760 A B
1 169 5.4260 1.4907 A B
3 541 5.3715 1.5743 A
2 769 5.2705 1.6209 A B
4 173 4.9538 1.7581 B
Item 10
3 543 6.3757 1.0551 A
2 772 6.2358 1.1060 A
4 172 6.2093 1.0773 A
5 31 6.1613 1.0359 A

25
Table 4 (Continued)
Panel B: Results of Games-Howell Pairwise Multiple Comparison Testsof Pairs for Items with Significant Welch ANOVA Results (Alpha =.05 or less)
Class Year Number ofObservations
Mean Standard Deviation
Games-Howell Pairwise ComparisonTest Results*
Academy of Educational Leadership Journal, Volume 12, Number 2, 2008
1 169 6.1006 1.1784 A
Item 17
1 168 5.3036 1.7260 A
2 769 5.0897 1.8473 A B
3 542 5.0480 1.9008 A B
5 31 4.7419 1.7883 A B
4 174 4.7011 1.9568 B
*Levels not connected by the same letter are significantly different
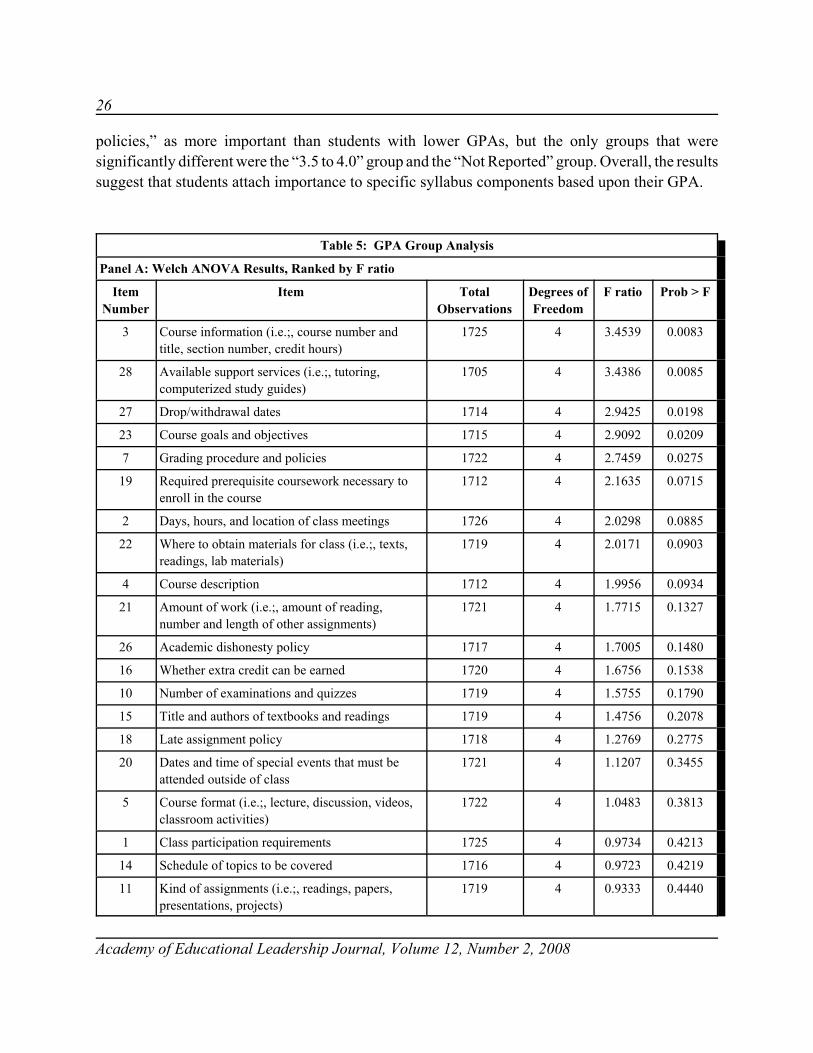
Table 5 examines the differences in syllabus component ratings by students with differinggrade point averages (GPA). The student sample was split into five groups. The first group self-reported a GPA of less than 2.5. The GPAs of the second, third, and fourth group ranged from 2.5to 2.99, 3.0 to 3.49, and 3.5 to 4.0, respectively. The fifth group was composed of students who didnot report their GPA, hence the group was labeled as “Not Reported.” Panel A of Table 5summarizes the results from the Welch ANOVA’s on the 28 survey items. The number of responsesranged from 1,705 to 1,726 for a given item. Significant results at the 0.05 level are shown for fiveof the 28 items. Those five items were further analyzed using the Games-Howell PairwiseComparison procedure and the results of those tests are displayed in Panel B of Table 5. Theanalysis failed to find any significant difference between the groups for Item 23, “Course goals andobjectives,” although the mean scores indicate students with lower GPAs rated the item as moreimportant than students with higher GPAs. Items that impact success in a course or indicate the lackof success showed differing responses based upon GPA. For example, students with a lower GPA(e.g., 2.5 to 2.99) displayed more interest in Item 28, “Available support services (for example,tutoring, computerized study guides),” than students with a higher GPA (e.g., 3.0 to 3.49).Furthermore, students with the lowest GPA ranked information about drop/withdrawal dates, Item27, as much more important than students with the highest GPAs. However, the Welch ANOVAresults in Panel A show other items (e.g., Items 9, 11, and 12) that were related to exam dates, examtimes, or types of assignments that might be graded, which did not display any significantdifferences among the groups. The multiple comparison test of Item 3, “Course information (forexample, course number and title, section number, credit hours),” suggests that students with a GPAof 2.5 to 2.99 believe that information is more important than students with a GPA of 3.5 to 4.0. Asone would expect, students in the higher GPA groups rated Item 7, “Grading procedure and
26
Academy of Educational Leadership Journal, Volume 12, Number 2, 2008
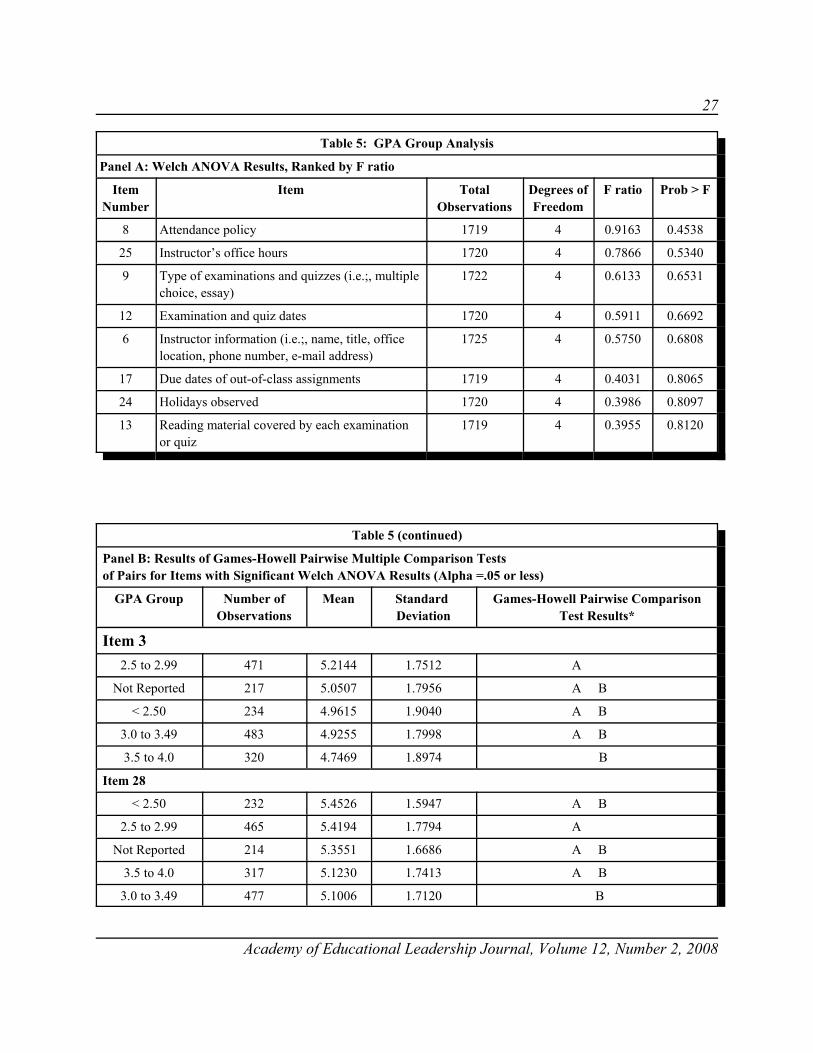
policies,” as more important than students with lower GPAs, but the only groups that weresignificantly different were the “3.5 to 4.0” group and the “Not Reported” group. Overall, the resultssuggest that students attach importance to specific syllabus components based upon their GPA.
Table 5: GPA Group Analysis
Panel A: Welch ANOVA Results, Ranked by F ratio
ItemNumber
Item TotalObservations
Degrees ofFreedom
F ratio Prob > F
3 Course information (i.e.;, course number andtitle, section number, credit hours)
1725 4 3.4539 0.0083
28 Available support services (i.e.;, tutoring,computerized study guides)
1705 4 3.4386 0.0085
27 Drop/withdrawal dates 1714 4 2.9425 0.0198
23 Course goals and objectives 1715 4 2.9092 0.0209
7 Grading procedure and policies 1722 4 2.7459 0.0275
19 Required prerequisite coursework necessary toenroll in the course
1712 4 2.1635 0.0715
2 Days, hours, and location of class meetings 1726 4 2.0298 0.0885
22 Where to obtain materials for class (i.e.;, texts,readings, lab materials)
1719 4 2.0171 0.0903
4 Course description 1712 4 1.9956 0.0934
21 Amount of work (i.e.;, amount of reading,number and length of other assignments)
1721 4 1.7715 0.1327
26 Academic dishonesty policy 1717 4 1.7005 0.1480
16 Whether extra credit can be earned 1720 4 1.6756 0.1538
10 Number of examinations and quizzes 1719 4 1.5755 0.1790
15 Title and authors of textbooks and readings 1719 4 1.4756 0.2078
18 Late assignment policy 1718 4 1.2769 0.2775
20 Dates and time of special events that must beattended outside of class
1721 4 1.1207 0.3455
5 Course format (i.e.;, lecture, discussion, videos,classroom activities)
1722 4 1.0483 0.3813
1 Class participation requirements 1725 4 0.9734 0.4213
14 Schedule of topics to be covered 1716 4 0.9723 0.4219
11 Kind of assignments (i.e.;, readings, papers,presentations, projects)
1719 4 0.9333 0.4440
27
Table 5: GPA Group Analysis
Panel A: Welch ANOVA Results, Ranked by F ratio
ItemNumber
Item TotalObservations
Degrees ofFreedom
F ratio Prob > F
Academy of Educational Leadership Journal, Volume 12, Number 2, 2008
8 Attendance policy 1719 4 0.9163 0.4538
25 Instructor’s office hours 1720 4 0.7866 0.5340
9 Type of examinations and quizzes (i.e.;, multiplechoice, essay)
1722 4 0.6133 0.6531
12 Examination and quiz dates 1720 4 0.5911 0.6692
6 Instructor information (i.e.;, name, title, officelocation, phone number, e-mail address)
1725 4 0.5750 0.6808
17 Due dates of out-of-class assignments 1719 4 0.4031 0.8065
24 Holidays observed 1720 4 0.3986 0.8097
13 Reading material covered by each examinationor quiz
1719 4 0.3955 0.8120
Table 5 (continued)
Panel B: Results of Games-Howell Pairwise Multiple Comparison Testsof Pairs for Items with Significant Welch ANOVA Results (Alpha =.05 or less)
GPA Group Number ofObservations
Mean Standard Deviation
Games-Howell Pairwise ComparisonTest Results*
Item 32.5 to 2.99 471 5.2144 1.7512 A
Not Reported 217 5.0507 1.7956 A B
< 2.50 234 4.9615 1.9040 A B
3.0 to 3.49 483 4.9255 1.7998 A B
3.5 to 4.0 320 4.7469 1.8974 B
Item 28
< 2.50 232 5.4526 1.5947 A B
2.5 to 2.99 465 5.4194 1.7794 A
Not Reported 214 5.3551 1.6686 A B
3.5 to 4.0 317 5.1230 1.7413 A B
3.0 to 3.49 477 5.1006 1.7120 B
28
Table 5 (continued)
Panel B: Results of Games-Howell Pairwise Multiple Comparison Testsof Pairs for Items with Significant Welch ANOVA Results (Alpha =.05 or less)
GPA Group Number ofObservations
Mean Standard Deviation
Games-Howell Pairwise ComparisonTest Results*
Academy of Educational Leadership Journal, Volume 12, Number 2, 2008
Item 27
< 2.50 233 5.3176 1.6847 A
2.5 to 2.99 469 5.1429 1.9422 A B
Not Reported 215 5.0512 1.8974 A B
3.0 to 3.49 481 4.9688 1.8419 A B
3.5 to 4.0 316 4.8418 1.8654 B
Item 23
Not Reported 218 5.4495 1.5745 A
2.5 to 2.99 467 5.4240 1.5462 A
< 2.50 232 5.3922 1.6268 A
3.5 to 4.0 318 5.1635 1.7234 A
3.0 to 3.49 480 5.1563 1.5797 A
Item 7
3.5 to 4.0 319 6.5517 0.9161 A
3.0 to 3.49 482 6.4959 0.8414 A B
2.5 to 2.99 471 6.4544 1.0008 A B
< 2.50 232 6.3707 1.0322 A B
Not Reported 218 6.2798 1.1638 B
*Levels not connected by the same letter are significantly different
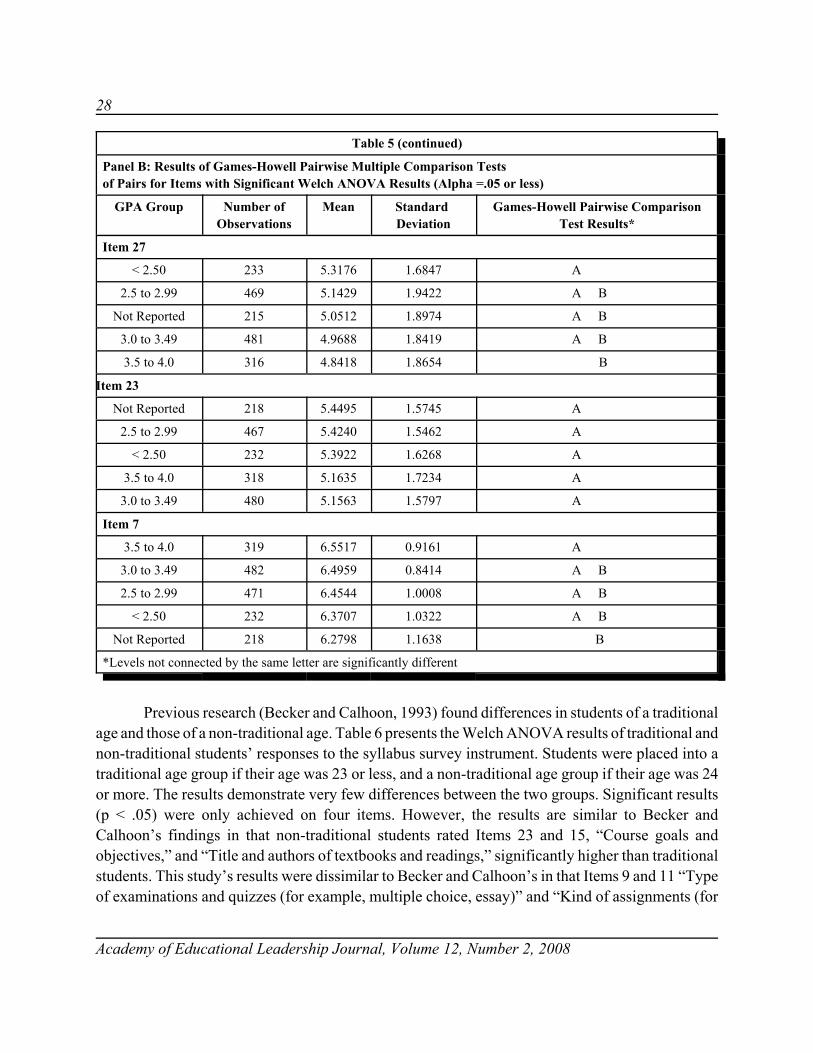
Previous research (Becker and Calhoon, 1993) found differences in students of a traditionalage and those of a non-traditional age. Table 6 presents the Welch ANOVA results of traditional andnon-traditional students’ responses to the syllabus survey instrument. Students were placed into atraditional age group if their age was 23 or less, and a non-traditional age group if their age was 24or more. The results demonstrate very few differences between the two groups. Significant results(p < .05) were only achieved on four items. However, the results are similar to Becker andCalhoon’s findings in that non-traditional students rated Items 23 and 15, “Course goals andobjectives,” and “Title and authors of textbooks and readings,” significantly higher than traditionalstudents. This study’s results were dissimilar to Becker and Calhoon’s in that Items 9 and 11 “Typeof examinations and quizzes (for example, multiple choice, essay)” and “Kind of assignments (for

29
Academy of Educational Leadership Journal, Volume 12, Number 2, 2008
example, readings, papers, presentations, projects),” were not rated significantly different by the twotypes of students. An interesting result was that traditional students rated Items 16 and 19, “Whetherextra credit can be earned” and “Required prerequisite coursework necessary to enroll in thecourse,” significantly more important than non-traditional students. Thus, the results suggest thatolder students may be more interested in the content of the course, but younger students have higherinterest levels on grade or curriculum issues.
Table 6: Traditional/Nontraditional Student AnalysisWelch ANOVA Results, Ranked by Absolute Difference between Means
ItemNumber
Item Mean AbsoluteDiff.
betweenMeans
F ratio Prob > F
Acred. Non-Acred.
23 Course goals and objectives 5.5810 5.2406 0.3404 9.8364 0.0019
16 Whether extra credit can be earned 5.4546 5.7497 0.2951 6.1928 0.0133
15 Title and authors of textbooks andreadings
4.9842 4.6923 0.2919 4.8106 0.0289
19 Required prerequisite courseworknecessary to enroll in the course
4.7331 5.0064 0.2733 3.9648 0.0473
26 Academic dishonesty policy 4.4841 4.7027 0.2186 2.3535 0.1260
24 Holidays observed 5.0438 5.2423 0.1985 2.2928 0.1309
9 Type of examinations and quizzes (i.e.;multiple choice, essay)
5.8110 6.0014 0.1904 3.6334 0.0575
27 Drop/withdrawal dates 4.8849 5.0644 0.1795 1.6853 0.1951
4 Course description 5.5857 5.4122 0.1735 2.6217 0.1063
17 Due dates of out-of-class assignments 5.9170 6.0783 0.1613 2.2371 0.1357
28 Available support services (i.e.; tutoring,computerized study guides)
5.1355 5.2919 0.1564 1.5188 0.2187
3 Course information (i.e.; course numberand title, section number, credit hours)
4.8504 5.0063 0.1559 1.4950 0.2223
20 Dates and time of special events that mustbe attended outside of class
5.5516 5.7037 0.1521 1.5958 0.2074
5 Course format (i.e.; lecture, discussion,videos, classroom activities)
5.4643 5.5904 0.1261 1.4506 0.2293
14 Schedule of topics to be covered 5.7115 5.5962 0.1153 1.3689 0.2428
11 Kind of assignments (i.e.; readings,papers, presentations, projects)
6.0870 5.9824 0.1046 1.4464 0.2299
21 Amount of work (i.e.; amount of reading, 5.2222 5.3247 0.1025 0.7603 0.3839

30
Table 6: Traditional/Nontraditional Student AnalysisWelch ANOVA Results, Ranked by Absolute Difference between Means
ItemNumber
Item Mean AbsoluteDiff.
betweenMeans
F ratio Prob > F
Acred. Non-Acred.
Academy of Educational Leadership Journal, Volume 12, Number 2, 2008
number and length of other assignments)
2 Days, hours, and location of classmeetings
5.6732 5.7533 0.0801 0.4468 0.5044
18 Late assignment policy 5.5929 5.6688 0.0759 0.4701 0.4934
22 Where to obtain materials for class (i.e.;texts, readings, lab materials)
4.9842 5.0599 0.0757 0.3527 0.5530
8 Attendance policy 6.0000 6.0642 0.0642 0.5299 0.4671
12 Examination and quiz dates 6.1976 6.2616 0.0640 0.5086 0.4762
6 Instructor information (i.e.; name, title,office location, phone number, e-mail)
6.0827 6.1294 0.0467 0.2699 0.6038
7 Grading procedure and policies 6.4229 6.4532 0.0303 0.1817 0.6702
25 Instructor’s office hours 6.0717 6.0556 0.0161 0.0315 0.8593
13 Reading material covered by eachexamination or quiz
5.9802 5.9661 0.0141 0.0211 0.8845
1 Class participation requirements 5.4606 5.4536 0.0070 0.0044 0.9470
10 Number of examinations and quizzes 6.2569 6.2609 0.0040 0.0027 0.9589
DISCUSSION AND CONCLUSION
As previously discussed, the syllabus has become a longer, more comprehensive documentof course content and policies. The content of the syllabus is important for accreditation, resolvingdisputes between instructors and students, and the administration of the course. Furthermore,instructors use the course syllabus to communicate their expectations of what students must do tobe successful in their course. Conversely, students make enrollment decisions and instructorevaluations based, in part, on the contents of the syllabus. Therefore, given the importance of thesyllabus, one finds it surprising that only three studies have empirically examined the coursesyllabus. This study’s primary purpose is to assess the relative importance that different types ofstudents enrolled in an introductory accounting class place on items that frequently appear withina course syllabus. Faculty members may use the findings of this study to reassess their syllabi and
31
Academy of Educational Leadership Journal, Volume 12, Number 2, 2008
perhaps include, emphasize, or provide more complete explanations of those items that are of thegreatest concern to their students.
The results of the study reveal the amount of importance that students assign to differentsyllabus components varies greatly. Furthermore, the study shows that different types of studentsassign different levels of importance to syllabus components. Given that the three highest-rankingitems in Table 2 deal with exams and grades, one can presume students would appreciate syllabi thatfully explain and highlight those items. A secondary area of importance that emerges from the datais that an instructor’s personal information and office hours are very important to students. On theother hand, one may be surprised to find that students do not consider information on the academicdishonesty policy, the name of their textbook(s), or the required prerequisites as important asholidays observed or the times and location of class meetings.
This study extends previous research on syllabus components because no other study hasbeen conducted on syllabus components that used a sample composed mainly of students fromseveral business disciplines enrolled in an accounting principles course. The only study conductedin a business field tested the recall of syllabus elements and by upper-level marketing students.Furthermore, this study extends prior research by investigating different responses by students tosyllabus components by the factors of gender, years of college experience, grade point average, andage. The study’s results suggest that females place more importance on the communication ofsyllabus information. Also, females desire information on the instructor more so than males. Theresults indicate the number of years that a student has been enrolled in a university also affect theirperceptions of the syllabus. Specifically, students in their fourth year of college assign lessimportance to information on obtaining class materials and drop/withdrawal dates than freshmen.In addition, the fourth-year student places less importance on other syllabus components such as:the academic dishonesty policy, the required course prerequisites, the available support services, andthe late assignment policy. The data analysis reveals that the GPA of a student may affect how muchthe student desires certain information in a course syllabus. Students with a low GPA are moreinterested in ascertaining the drop/withdrawal dates and the availability of support services than arestudents with a high GPA. Conversely, students with a high GPA rate information on gradingprocedures and policies as more important than students with a low GPA. These results may haveimplications for instructors who teach honors classes or remedial classes to “at-risk” students.Finally, some differences exist between traditional and nontraditional age students. The resultssuggest that students of traditional college age tend to focus more on grade and curriculum issuesthan nontraditional students, but the older students rated items dealing with the content of the coursesignificantly higher than the younger students.
However, this study does not specifically address how an instructor should incorporate thesefindings into their syllabus. Becker and Calhoon (1999) suggest alternative strategies may be usedto communicate syllabus information. An instructor who wishes to satisfy student interests can usethe results from this study to place the highest-rated components from their appropriate student
32
Academy of Educational Leadership Journal, Volume 12, Number 2, 2008
groups on the first page of the syllabus or to give the information a prominent display using wordprocessing features (e.g., boldface type, different font sizes, etc.). An alternative strategy is to usethe results to determine where student interest is lower, but the instructor believes the informationis highly important. Then the instructor attempts to overcome the lack of interest by making thosesyllabus items more prominent. A variant of this approach would be to create special handouts ofthe items the instructor considers the most important, or conversely, if the instructor feels theirsyllabus creates information overload, to eliminate unnecessary information and to use separatehandouts for topics of lesser importance.
A limitation of this study is survey response bias, which is inherent in all survey research.However, the large sample size should overcome most objections to this limitation. Furthermore,the study’s institutional response rate is 62 percent, as 31 of 50 schools agreed to participate in thisstudy. Further research might look for other factors that influence syllabi components. For example,how much influence do accreditation agencies exert upon the syllabus? A longitudinal studyinvestigating changes in syllabi components over time may be of interest to educators andadministrators. Finally, a study comparing faculty ratings to students’ ratings on the importance ofparticular syllabi items could lead to further insights that improve communication and courseadministration.
REFERENCES
Accounting Education Change Commission (1993). Evaluating and rewarding effective teaching: Issues statement No.5.Issues in Accounting Education 8(Fall), 436-439.
Albrecht, W. S., and R. J. Sack (2000). Accounting education: charting the course through a perilous future. AccountingEducation Series, Vol. 16, Sarasota, FL: American Accounting Association.
Altman, H. B. (1999). Syllabus shares “what the teacher wants.” M. Weimeer and R. A. Neff (Eds.), In teaching college:Collected readings for the new instructor (pp. 45-46). Madison, WI: Magna.
American Accounting Association (1996). A framework for encouraging effective teaching. Report of the Committeeon Promoting and Evaluating Effective Teaching.
Becker, A. H., and S. K. Calhoon (1999). What introductory psychology students attend to on a course syllabus.Teaching of Psychology 26(1), 6-11.
Garavalia, L. S., J. H. Hummel, L. P. Wiley, and W. H. Huitt (1999). Constructing the course syllabus: Faculty andstudent perceptions of important syllabus components. Journal on Excellence in College Teaching 10(1), 5-21.
Halbesleben, J. R. B., J. A. H. Becker, and M. R. Buckley (2003). Considering the labor contributions of students: Analternative to the student-as-customer metaphor. Journal of Education for Business 12(May/June), 255-257.

33
Academy of Educational Leadership Journal, Volume 12, Number 2, 2008
Jervis, K. J., and C. A. Hartley (2005). Learning to Design and Teach an Accounting Capstone. Issues in AccountingEducation 20(4), 311-339.
Kerr, D. S., and L. M. Smith (2003). Effective accounting instruction: A comparison of instructor practices and studentperspectives. Advances in Accounting Education Teaching and Curriculum Innovations 5, 143-163.
Lehman, A., N. O’Rourke, L. Hatcher, and E. J. Stepanski (2005). JMP for Basic Univariate and Multivariate Statistics:A Step by Step Guide Cary, NC: SAS Institute Inc.
Matejka, K., and L. B. Kurke (1994). Designing a great syllabus. College Teaching 42(3), 115-117.
Needles, B. E., Jr. (1998). The syllabus as a means of creating intellectual capital. Accounting Instructors’ Report 20,1-2.
Parkes, J., and M. B. Harris (2002). The purpose of a syllabus. College Teaching 50(2), 55-61.
Raymark, P. H., and P. A. Connor-Greene (2002). The syllabus quiz. Teaching of Psychology 29(4): 286-288.
Seldin, P. (1990). Preface. In P. Seldin & Associates (Eds.) How administrators can improve teaching, (pp. xvii-xxii).San Francisco: Jossey-Bass Inc.
Shelley, P. H. (2005). Colleges need to give students intensive care. The Chronicle of Higher Education 51(18), B16.
Smith, M. F., and N. Y. Razzouk (1993). Improving classroom communication: The case of the course syllabus. Journalof Education for Business 68(4), 215-221.
Zell, D. (2001). The market-driven business school: Has the pendulum swung too far? Journal of Management Inquiry10(4), 324-339.

34
Academy of Educational Leadership Journal, Volume 12, Number 2, 2008

35
Academy of Educational Leadership Journal, Volume 12, Number 2, 2008
RETHINKING FACULTY ROLEIN A KNOWLEDGE AGE
Craig Sasse, Rockhurst UniversityRandy Schwering, Rockhurst University
Sylvia Dochterman, Rockhurst University
ABSTRACT
While the relationship and the relative importance between the primary faculty tasks ofteaching and research have been debated and empirically examined, the fundamental facultyexpectations at most universities remains unchanged. The shift to a knowledge age and the needfor knowledge workers along with an emerging paradigm shift towards learning begs that thetraditional faculty role be reexamined. The need for faculty to disseminate information has beenreplaced by the need for learners to know how to use and apply information.
In this article, we apply value chain analysis to determine where the focus of faculty workis located and to identify how faculty can best create leverage among their activities along thechain. This analysis yields a shift in faculty focus “downstream” in the value chain, where moreis expected of faculty in the areas of course design and student learning and assessment. In fact,the article points out several trends that clearly indicate that this shift downstream has taken place.Based on this value chain analysis, the authors draw conclusions on what changes should beconsidered regarding faculty roles.
INTRODUCTION
Scholars have attempted to determine what, if any, relationship exists between research andteaching (e.g., Hattie and Marsh, 1996; Rowland, 1996; Marsh and Hattie, 2002). That is, do theskills required for effective teaching and effective scholarship complement one another so that onecan be competent or expert in both? Correlation studies have at best found no relation—in somecases it has been found that there is a negative relation (e.g., Hattie and Marsh, 1996). During thistime, our understanding of knowledge, an epistemological question, and our advances in learningtheory have widened the gap between actual teaching practice and espoused learning designs incollege and university classrooms. The faculty role, working on a well-worn model of performingboth research and teaching, is increasingly under stress to improve both. As such, it begs thequestion of whether teaching and scholarship are truly complementary skills and processes; that is,can faculty build leverage by spending time in one endeavor to inform and help the other?

36
Academy of Educational Leadership Journal, Volume 12, Number 2, 2008
While there is a need to continue to examine the empirical basis for the assumed synergybetween research and teaching, it is time for University administrations to act on the paradigm shiftthat is often attributed to the knowledge age. Driven by the simultaneous breakthroughs intechnology and learning theory, the knowledge age has created an environment of constant changeand changed the value propositions of knowledge itself. Other industries such as newspapers havehad to change their business models based on this shift. Many sober educators, based on theseexternal trends, have called for radical change—including change to traditional faculty roles—totake place in the field of higher education as a whole (e.g., Barnett, 1992; Guskin, 1994b).
In fact, one of the primary challenges facing Universities today is that they must becomemore efficient in the use of their resources. With faculty being the primary resource of universities,the question must be addressed as to how to use these resources most efficiently. Does thetraditional model that calls for nearly equal amounts of time spent between research and teaching(with relatively smaller responsibilities for service and administration) allow for the efficienciesnecessary for the modern University? Are there other ways of conceiving of the faculty role to makemore effective and efficient use of this essential, but costly resource? This article will use theconceptual model of value chains to analyze the faculty role; specifically, it will propose that basedon the leverage points for faculty work, many universities should consider differential faculty rolesto create efficiencies and to become more effective in delivering value in a knowledge age.
THE KNOWLEDGE AGE AND KNOWLEDGE WORKERS
As the structure and organization of business changes to reflect a global world, the need forcompetent learners has grown. International business and political commentator Thomas Friedman(2000) posits knowledge has taken on a different character and its value within organizations mustbe treated differently. Consider the National Security Agency (NSA). During the Cold War,information was disseminated on a “need to know” basis only. This top-down “knowledgemanagement” system is inadequate to today’s competitive challenges and has been modified toreflect a “need to share” policy. Command and control no longer works as organizations mustdepend on the ability of people throughout the organization to make decisions on vast and oftencompeting knowledge sources. Information is only important to the degree that it can be interpretedand transformed into meaningful knowledge. As Drucker (2001) predicted many years ago, thereis now a crying need for knowledge workers, people who can apply, synthesize, and evaluateinformation.
Knowledge workers tend to be more generalist than specialist. Friedman (2000) makescomparisons between journalists and academics, “There is a deeply ingrained tendency to think interms of highly segmented, narrow areas of expertise, which ignores the fact that the real world isnot divided up into such neat little beats and that the boundaries between domestic, international,political and technological affairs are all collapsing.” In a global world, where information is nearly
37
Academy of Educational Leadership Journal, Volume 12, Number 2, 2008
transparent, it is necessary to arbitrage several dimensions (or areas of knowledge) in order to beable to make meaning. That is, it is not the knowing of any single piece or perspective, but knowingthe “interaction of all of them together” that makes insight and application possible.
The metaphor of arbitrage is an apt one; a market term referring to the simultaneous buyingand selling of the same thing in different markets. Commodities traders engage in arbitrage whenthey take advantage of different prices of the same commodity in different markets (leveraging theirknowledge by buying at the cheaper price in Chicago, for example, and selling at the higher pricein New York.). Arbitrage requires a wide net of informants or information sources and an ability tosynthesize or exploit this information or knowledge. Jack Stack (2007) observed entrepreneur VikasGoel applying arbitrage to create a successful international business. Goel is the CEO of aSingapore-based company selling computer-based products. He has been able to compete inhypercompetitive markets because of his ability to “arbitrage” functions. For example, he is ableto finance his operations through vendors (at about 1-2% cost) by offering insurance to thosevendors. The key is that he can shop the world for the lowest rates—turns out that such insurancecan be gotten cheaply in Ireland and Germany. Using his knowledge and ability to garnerinformation widely, Goel has been able to make profits—on very slim gross margins—based on hisability to use information.
Not only has the nature of work changed, but so has the value of learning. Perhaps SiliconValley is the best metaphor for this transformance. The Valley is a rich, transparent network oftechnology talent, a community of practice, if you will. The notion is that learning is done throughcollaboration and information is shared rather than hoarded. The rhetoric of the learningorganization is considered an important way to create sustainable competitive advantage. High-levelpositions such as Chief Knowledge Officer are borne out of the need to capture what is alreadytacitly known within the organization so that it can be leveraged for productive use. Lew Platt,former CEO of Hewlett Packard once said “If HP knew what HP knows, we would be three timesas profitable.”
Within academia, a “learning paradigm” was ushered in by the mid 1990s by Barr and Tagg(1995) who noted the importance of learning and what is now known about it. Guskin (1994a)stressed that new knowledge about how people learn coupled with the power of digital technologyenabled a transformance of new methods for student learning. In theory, and almost overnight, thefaculty role was transformed from one of teacher as disseminator of knowledge to that of facilitatorof learning (e.g., Brew, 1999). There is now a rich body of literature in disparate fields such asbiology, anthropology, and cognitive science that reveals the nature of learning as a more learner-driven transaction where the learner constructs knowledge (see Brown, Collins, and Duguid, 1989).
Finally, the impact of technology on the world outside has been swift and significant. TheInternet and digital technology have created a “democratization of information” where now anyonewith a relatively inexpensive computer can tap into a vast array of information sources. Thesetechnologies have disrupted many old-line businesses. One example is the newspaper business,

38
Academy of Educational Leadership Journal, Volume 12, Number 2, 2008
which is discussed further in the next section. Another example is encyclopedias, which commandeda nice market of families with children. That market for print volumes collapsed within a few yearsin the early 1990’s because ordinary families could gain access to information through CD ROMsand the Internet—in effect the print volume no longer held an information advantage in its value tothe customer. The linkage or value chain was deconstructed.
Evans and Wurster (1999) call this phenomenon deconstruction, where the integratedlinkages between information and physical products are destroyed. Academia is not immune to thewidespread information “leakage”; consider the announcement a few years back by MIT that theywould digitize course notes for their entire curricula and make them available on the Internet—free.Information is ubiquitous, easier to access by consumers, citizens, and students. Value now residesin the products of knowledge use. Even in a liberal arts arena, knowledge for its own sake and inno particular context is insufficient to the needs of most learners who live in an information-richworld where access is no longer a problem but understanding is critical.
The needs of society are changing, and with the availability of new technologies (i.e., digitaland learning), the call for academic units to restructure still resonates today. A value chain analysisprovides one lens for showing how faculty work and how the dual research and teaching emphasisis at odds with the new value propositions most universities and colleges are being called to provide.
VALUE CHAINS
An analysis of most businesses can be done by examining the sets of internal activities andservices needed to deliver value—called value chains. Many industries in the past delivered anintegrated set of services, which allowed them to leverage their advantage of information sourcesand knowledge into products and services consumers desire. New technologies such as the Internet,however, have compromised these integrated value chains. Specifically, these businesses, relyingon integrated sets of services, have been deconstructed so that pieces of the integrated product canbe separated successfully. Deconstruction relates to the concept of the value chain and howtechnology can destroy or blow to bits the traditional linkages of the internal activities of thebusiness.
Consider the newspaper business where the established value chain has become vulnerableto deconstruction. Its value chain involves journalists and advertisers submitting copy, editors layingit out, printing, and distribution (see figure 1). In essence, the newspaper brings readers to selectedjournalists and advertisers, with value created in the linkages that bind each of the boxes representedin figure 1. Traditionally, newspapers have been able to leverage their capability to organize (editorsdo this), produce, and distribute something readers cannot easily get otherwise. However,technology now makes it possible in many cases to unbundle the pieces of this integrated valuechain. While newspapers will likely not go away because people like to read them, the business isnot as integrated as more highly focused companies (e.g., eBay) can pick off parts of the chain. Also,

39
Academy of Educational Leadership Journal, Volume 12, Number 2, 2008
journalists are now more able to bypass the traditional distribution channel of the newspaper to reachconsumers directly through media such as blogs or other Web sites. Furthermore, there is a chancethrough telecommunication networks and digital technology that individual customers can getcustomized information based on their individual wants and needs (e.g., Wall Street JournalInteractive).
Figure 1. The Newspaper Value Chain
Reader
(Final IntegratedProduct)
Reader
(Final IntegratedProduct)
SubmittingCopy
(Journalists &Advertisers)
SubmittingCopy
(Journalists &Advertisers)
Laying OutCopy
(Editors)
Laying OutCopy
(Editors)
Production
(PressOperator)
Production
(PressOperator)
Distribution
(Trucks, PaperRoutes)
Distribution
(Trucks, PaperRoutes)
Embedded in this value chain are services like classifieds, where the newspaper has enjoyedan information advantage of being able to bring sellers in touch with buyers. Due to technology thiscompetitive advantage has been diminished, with Internet auctions and other meeting places ableto bring much larger or more specialized pools of sellers together. No longer does the newspaperhold as clear an advantage of information or knowledge from the consumer/reader. In fact,newspapers find themselves downsizing and consolidating in the midst of new realities of theirbusiness—they were quasi-businesses that operated as public trust institutions. Now manynewspapers are searching new market opportunities as a way to survive. In short, the old valueproposition of the newspaper has been changed and those in the business must change in response.
Academic institutions have worked off a similar value chain. Specifically, the universitybrings knowledge from faculty to students leveraging the linkages of knowledge creating activitywith distribution of the final product (see figure 2).
Figure 2. Academic Value Chain
StudentLearning
(Final Product)
StudentLearning
(Final Product)
CreatingKnowledge
(Research)
CreatingKnowledge
(Research)
ApplyingKnowledge
(AppliedScholarship)
ApplyingKnowledge
(AppliedScholarship)
LearningCurriculum
(Production)
LearningCurriculum
(Production)
Design &Delivery
(Distribution)
Design &Delivery
(Distribution)
The value proposition for academic institutions, represented by the linkages of the valuecomponents, may be compromised by the ability of focused entities to take a piece of the valuechain. For example, online programs offered by institutions such as Phoenix University havebecome successful, at least in terms of enrollments, by focusing on the distribution (design and

40
Academy of Educational Leadership Journal, Volume 12, Number 2, 2008
delivery) slice of the chain to grant their degrees. Their value proposition is one of convenience tomostly non-traditional students. Online programs may not yet significantly threaten traditionalstudent populations that value the college experience, but it is evident that the stable, traditional,integrated educational product is challenged by both competitive forces and external pressures.
Before the explosion of technology helped usher in a global, knowledge-based economy andorganizations of all types began finding competitive advantage in the use of knowledge rather thansimply possession of information no one else had, academia had a straightforward approach to thelinkages in the value chain. Research and scholarship by professors had a direct impact on theinformation they would present in their lectures. That is, the knowledge creation function (theresearch role) provided some leverage for the teaching function. This relationship is captured infigure 3 (with the shaded area representing the area of leverage for faculty work).
Figure 3. Traditional Faculty Focus in Academic Value Chain
StudentLearningStudent
Learning
CreatingKnowledgeCreating
Knowledge
ApplyingKnowledgeApplying
KnowledgeCurriculumCurriculum
Course Design& Delivery
Course Design& Delivery
Discipline-basedFaculty Focus
Grades
For most universities and even colleges, the faculty focus was upstream or on the left sideof the value chain (shaded area). While teaching courses was still prominent, the teaching wasdriven by the search for knowledge—almost always within the bounds of a discipline—throughresearch and developing curriculum. Therefore, faculty were able to create some leverage amongtheir activities by focusing upstream, allowing them to spend less of their valuable time on coursedesign and delivery. Course load was measured not only by number of credit hours but also bynumber of preps. Schools had ways to adjust to variations in emphasis: adjust teaching load and/oruse teaching assistants. Liberal Arts colleges, where research-based scholarship tended to be less,teaching loads could be as much as 4-6 courses a semester. For research universities, the teachingrole for many faculty continues to be supported by use of teaching assistants along with reducedloads.
The point is not that colleges or faculty did not take their teaching role seriously—mostdid—only that the creative focus of their work was in the discipline, usually involving some sort of

41
Academy of Educational Leadership Journal, Volume 12, Number 2, 2008
research, inquiry, and/or study. The teaching function of preparing lecture notes, making tests, andmeeting with students was more a byproduct of their discipline work. Compared to scholarship,teaching was mostly a “low technology” activity, which took time and was important, but was abyproduct of the discipline-based scholarship. Thus, faculty were able to leverage off theirdiscipline-based work to meet the needs of their teaching load. Support was provided to help freeup time for research (i.e., teaching assistants) or give direct help in research activity. The facultymember would be in charge of the content and curriculum, leaving assistants the job ofadministering course duties such as tests and study sessions.
This framework for university faculty work was mostly consistent with the value proposition.Universities and colleges were aligned with this value as the salient performance metrics and statusgiven to faculty revolved around their discipline-based scholarship and teaching. As centers fordiscipline-based knowledge they fulfilled their mission to society by providing valuable researchin a number of fields (e.g., science in the aftermath of events like Sputnik or AIDS). It also provideda sufficient education for scores of post-secondary adults and conferred degrees that held currencywith employers. Furthermore, students and families valued the college experience as a transitionto adulthood and preparation for a number of careers. Like newspapers and encyclopedias, theenvironment has changed so as to upset the value proposition, not to mention the traditional role offaculty.
SHIFT IN FACULTY WORK
While literature shows that many faculty still value and prefer to work in the traditionaldiscipline-focused role (e.g., Massy and Wilger, 1995), it is evident that they are being pulleddownstream on the value chain. Now faculty often must think more about student learning as theybecome involved in activities like program assessment. They are being challenged with theirteaching as never before—the emergence of teaching and learning centers is evidence of this. Onestudy by Milem, Berger, and Dey (2000) showed that over a 20-year span (comparing 1972perceptions to those in 1992) faculty in the most recent group reported spending more time doingboth research and teaching. Although the study authors interpreted this finding as evidence thatwork spent on research did not take away time on teaching, it could be interpreted that the twoactivities have become more bifurcated, with faculty having to work more at each since theadditional teaching activities (such as assessment and learning designs) are not tied to research.Furthermore, these data are indication that faculty are being forced to spend more time in theirteaching role due to pressures to address student learning as required by accrediting bodies, fundingagencies, and the schools themselves.
Part of the challenge is that effective learning is no longer assumed to be the result ofdelivering content to students as faculty are more and more being challenged to produce and verifystudent learning. Over the last couple of decades, faculty have been introduced to pedagogical ideas
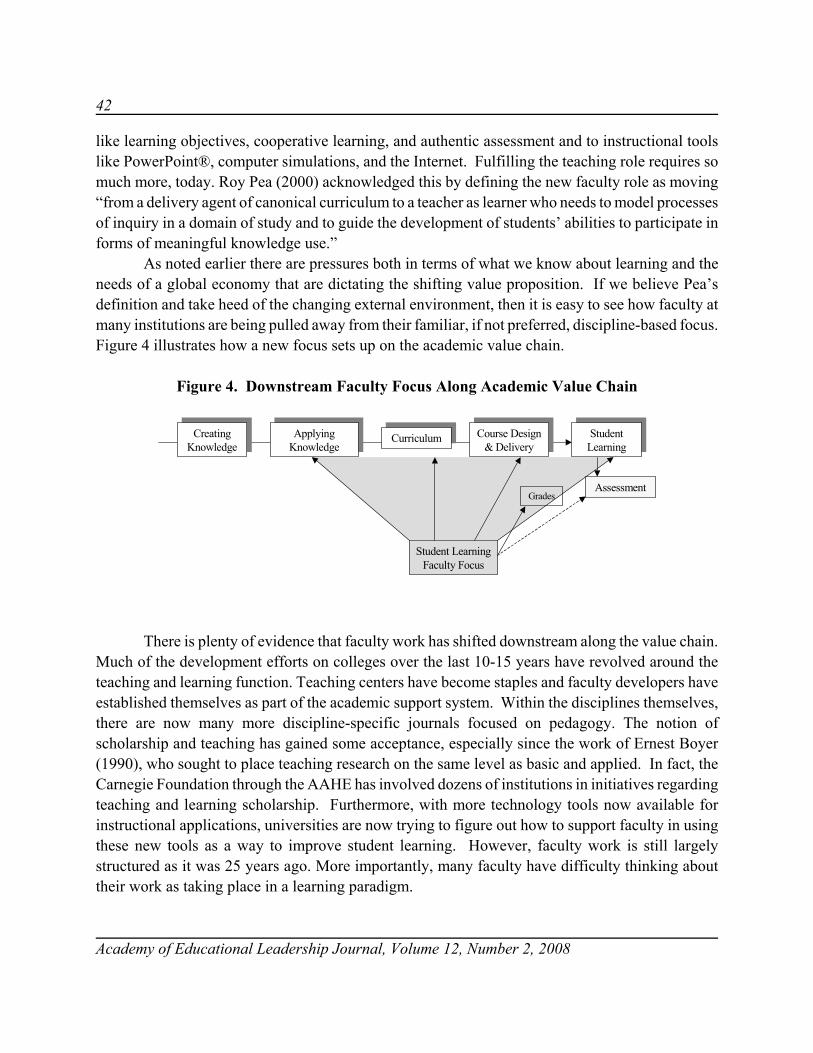
42
Academy of Educational Leadership Journal, Volume 12, Number 2, 2008
like learning objectives, cooperative learning, and authentic assessment and to instructional toolslike PowerPoint®, computer simulations, and the Internet. Fulfilling the teaching role requires somuch more, today. Roy Pea (2000) acknowledged this by defining the new faculty role as moving“from a delivery agent of canonical curriculum to a teacher as learner who needs to model processesof inquiry in a domain of study and to guide the development of students’ abilities to participate informs of meaningful knowledge use.”
As noted earlier there are pressures both in terms of what we know about learning and theneeds of a global economy that are dictating the shifting value proposition. If we believe Pea’sdefinition and take heed of the changing external environment, then it is easy to see how faculty atmany institutions are being pulled away from their familiar, if not preferred, discipline-based focus.Figure 4 illustrates how a new focus sets up on the academic value chain.
Figure 4. Downstream Faculty Focus Along Academic Value Chain
CreatingKnowledgeCreating
KnowledgeApplying
KnowledgeApplying
KnowledgeCurriculumCurriculum
Assessment
Student LearningFaculty Focus
Grades
Course Design& Delivery
Course Design& Delivery
StudentLearningStudent
Learning
There is plenty of evidence that faculty work has shifted downstream along the value chain.Much of the development efforts on colleges over the last 10-15 years have revolved around theteaching and learning function. Teaching centers have become staples and faculty developers haveestablished themselves as part of the academic support system. Within the disciplines themselves,there are now many more discipline-specific journals focused on pedagogy. The notion ofscholarship and teaching has gained some acceptance, especially since the work of Ernest Boyer(1990), who sought to place teaching research on the same level as basic and applied. In fact, theCarnegie Foundation through the AAHE has involved dozens of institutions in initiatives regardingteaching and learning scholarship. Furthermore, with more technology tools now available forinstructional applications, universities are now trying to figure out how to support faculty in usingthese new tools as a way to improve student learning. However, faculty work is still largelystructured as it was 25 years ago. More importantly, many faculty have difficulty thinking abouttheir work as taking place in a learning paradigm.

43
Academy of Educational Leadership Journal, Volume 12, Number 2, 2008
There are several things to note from the emerging faculty focus. First, it is broader,requiring faculty to be more than discipline experts. The shifting faculty focus does not eliminatescholarship, but it does change it. Remember Friedman’s assertion that the really insightful peopletoday are those that can arbitrage, rather than those narrowly focused. In fact, faculty might practicecollaboration across disciplines and functions, requiring them to read, study, and apply knowledgein a way that permits them to fulfill interdepartmental learning goals. In contrasting the nature ofacademic structures that have a learning focus vs. an instructional one, Barr and Tagg (1995) notethat a learning focus places importance on cross-discipline or departmental collaboration onprogram-wide outcomes as opposed to a strict structure of independent disciplines. The mindset offaculty focused downstream on the chain is one that recognizes themselves as teaching students, notjust teaching a subject.
Secondly, the creative focus is on creating learning environments and student learning, thusrequiring of faculty new ways to think and practice the teaching craft. Here is where teachingassistants—largely a tool to help manage faculty load, not to develop pedagogical skill—have beensupplanted by instructional designers and faculty developers. This downstream focus does notpreclude scholarship; it only means that basic, knowledge-creating research activity (vs.synthesizing and application scholarship) is largely unrelated to much of the downstream activityrequired of a student learning focus, especially at the undergraduate level. That is, the creativeefforts required for basic research in the discipline have little connection to building learningenvironments and addressing issues of student learning—and vice versa. While strong disciplineexpertise of the facilitator is still necessary for these learning environments, it is not sufficient tocreating the rich educational contexts described by Guskin (1994b) and consistent with the learningparadigm. Barr and Tagg (1995) assert that in a learning-centered approach, “faculty are the primarydesigners" of learning methods and environments. The movement towards the scholarship ofteaching and learning is recognition of the need to better leverage scholarship with downstreamteaching focus. Those that are focused downstream are most likely to spend their creative energyexploring life in the classroom and engaged in questions of how their students learn, not solelyfocused on “prepping” for what to teach.
Finally, the relation of faculty serving in such a role relative to the institution is moreintegrated. For example, downstream faculty tend to be more attuned to the need of assessment atthe program level. Accrediting bodies and new accountability structures have made programassessment mandatory. Downstream faculty, however, tend to understand why assessment as aprocess is important beyond simply satisfying demands. It is akin to how accountants characterizebudgets or managers might view strategic plans—the plan is nothing, planning is everything. Forthose faculty positioned downstream, program and course assessment is about meaningful process,not simply satisfying external demands. In a downstream focus, community is a wide net. Thosedownstream see community of practices as vital, where there is something to be learned outside thediscipline and outside academia.

44
Academy of Educational Leadership Journal, Volume 12, Number 2, 2008
The shift of faculty focus has been the result of a fundamental shift of societal needs in thatdirection. That is, the past needs for knowledge creation (i.e., basic and applied research) havesubtly shifted to needs for educated students able to learn. An analogy might be drawn with thepharmaceutical industry where there are three distinct parts to the value chain: research, testing, anddelivery. Mark Levin of Millennium Pharmaceuticals reported that his company had migrateddownstream towards the delivery end or customer focused part of the value chain because this hasthe most value right now (Champion, 2001). While research is still important, Levin noted thatvalue in the industry had shifted since the Human Genome Project was released (“We’re awash inbasic information about genes.”); basic knowledge has become a commodity with firms nowworking at the customer side of the chain in order to bring added value. To compare, perhaps fewerresources (e.g., faculty time) are needed to pursue academic research and relatively more resourcesspent on supporting faculty in creating positive learning experiences and engaging in scholarlyinquiry related to those efforts. For many universities, value must be found on the customer-sideof the chain.
ALTERNATIVES MOVING FORWARD
The point is not that universities are likely to be put out of business, only that they mustidentify clearly the value they mean to offer. Nor is it our point to diminish the discipline-basedfaculty focus—in many contexts, this type of faculty role still makes sense such as in researchuniversities with post graduate programs that have a significant accountability to grants specificallyearmarked for knowledge purposes located upstream on the value chain.
We do suggest, however, that colleges and universities should look at their value chainclosely to help them determine the work faculty must do. Many mid-tier institutions (comprehensiveuniversities and liberal arts colleges) and those serving heterogeneous populations should beidentifying their primary value proposition as being downstream—and establish themselves asinstitutions truly devoted to student learning. If faculty work remains strictly discipline-focused, thenefforts to meet twenty-first century societal and students’ needs will fall short and could diminishthe value of the degree. Already, businesses today spend four times as much on non-college trainingand education programs than on degree reimbursements. The ratio 25 years ago was one to one.
If the institution is large enough that it needs to conduct significant research and promotestudent learning, especially in the undergraduate area, then it must learn ways for more than one typeof faculty to exist. That is, if there is no leverage between the research and student learning endsof the chain, it is folly to try to require all faculty members to do both well. Instead, differentialfaculty roles make more sense—trying to exploit the variable talents of faculty and staff to providevalue at all parts of the value chain. As Barr and Tagg (1995) assert, fostering and empoweringstudent learning is a “challenging and complex” endeavor; faculty with a true downstream focus are
45
Academy of Educational Leadership Journal, Volume 12, Number 2, 2008
more likely to be able to devote the time to make these learning opportunities, in line with newlearning technologies, a reality.
Paradoxically, universities that view themselves as primarily providing value downstreamoften exclude candidates for faculty positions if they do not have a Ph.D. and do not have a strongpublication record. This leads to an inbreeding of a discipline-first mindset of people that value theprofessoriate and discipline-based scholarship above other value components. Although the Ph.D.is a worthy credential, the academic training for it is not likely to have prepared the instructor forexcelling on the student learning end of the value chain. Many faculty who have succeeded atfocusing downstream have done it after earning their Ph.D., not because of it—or never earned aPh.D. at all. In some ways, the practitioner, coming from outside academia, is better positioned tomeet the demands of the downstream faculty focus.
Finally, even if the administration identifies, aligns, and fully supports faculty roles thatallow for the leverage depicted in a student learning focus, it will not be easy to get many facultyto adopt the downstream role. The professoriate has evolved to a point where faculty are as loyalto their profession (and discipline) as they are to the institution for which they work. Many facultyimplicitly value discipline-based scholarship and publication as an important part of their professionas it is more easily measured and typically rewarded more. Furthermore, mobility is oftendetermined by a resume that includes a healthy publication record. Accrediting bodies can be ahindrance also as they define academically qualified to the degree faculty stay disciplined-based asdemonstrated by their research in that discipline.
Although corporate managers at Encyclopedia Britannica were slow in seeing CD ROMencyclopedia versions as viable competitors to their expensive print volumes, when they did try toadjust, they were thwarted by their own sales force, who liked selling door-to-door and receiving$500 commissions for sales. Under the old value proposition, value was in the dedicated sales force,which was able to take advantage of their information advantage on consumers. Similarly, the maindistribution channel for academic units, faculty, will need to change from a comfortable and oftenpreferred position of being content experts and scholars of discipline knowledge to learningfacilitators with content expertise. As Guskin (1994b) noted, while change must be instituted fromthe top, it is not likely that it can occur through decree or coercion—faculty will have to decide tooverride these professional constraints. Understandably, many faculty will not be easily persuadedwithout commitment by the University.
To move faculty to a downstream focus and to help them succeed in developing the skillsof facilitation requires new support structures inside the university. Because the Ph.D. does notprepare faculty for a downstream role, there must be long-term development activities helping movefaculty in this path. As noted earlier, most institutions have established teaching centers to supportfaculty teaching—these should be staffed by those imbued with a downstream focus and the skillsto foster substantive change. Moreover, these teaching center staff should be charged withdeveloping faculty holistically not just changing tools in their toolkit. That is, workshops on
46
Academy of Educational Leadership Journal, Volume 12, Number 2, 2008
techniques (e.g., cooperative learning skills) often get applied in ways that don’t really change theway students receive instruction. With a development focus, the interventions are long-term andtargeted at helping faculty engage in their own inquiry about how they can facilitate meaningfullearning for their students. Only to the extent communities of practice can be established, driven bystrong teaching centers and strong faculty leaders, can faculty begin realizing the promise ofworking at the customer end of the value chain.
In addition, educational technology must play a role in helping faculty address studentlearning. Technology has the potential to transform learning environments, but at a tremendous costand commitment by faculty who must design them. With the technology bundle getting bigger andmuch more sophisticated, the choice to learn new technologies is a tougher one to make. Yet, it isincreasingly clear that faculty will have to not only use technology, but design activities that requirestudents to use it as well. Educational technologists, with the ability to provide instructional design,are assets universities likely need to invest in and are already doing. Some universities, as a wayto bridge the gap of a disciplined-based skill set of its faculty, are developing models whereeducational technologists are working with faculty content experts to design online courses. Suchcollaborations should be considered as important for on-site programs as well. The downstreamfaculty focus requires supports like instructional developers and educational technologists whobelieve in and understand learning facilitation roles.
Finally, institutions will need to become more creative in how they acknowledge facultywork. Rank and tenure is typically wedded to the three categories of scholarship, teaching, andservice. Complaints about the inadequacy of rank and tenure systems have tended to becometiresome from all sides, yet the system is not typically set up to effectively acknowledge teachingperformance, let alone to judge the impact any one faculty member has on student learning. Forthose institutions that truly adopt a student learning focus, evaluation of individual teaching becomesless relevant because student learning is the result of a combined effort of many. By definition thelearning paradigm shifts focus from instructional goals to learning goals.
And faculty may need to follow the path of journalists like Friedman, who understand theholistic nature of understanding in a knowledge age. Friedman (2000) asserts,
If you want to be an effective reporter or columnist trying to make sense of global affairs today, youhave to be able to do something [that allows you to synthesize many different perspectives]. Becausetoday, more than ever, the traditional boundaries between politics, culture, technology, finance,national security and ecology are disappearing. You often cannot explain one without referring to theothers, and you cannot explain the whole without reference to them all. Therefore, to be an effectiveforeign affairs columnist or reporter, you have to learn how to arbitrage information from thesedisparate perspectives and then weave it all together to produce a picture of the world that you wouldnever have if you looked at it from only one perspective. That is the essence of information arbitrage.In a world where we are all so much more interconnected, the ability to read the connections, and toconnect the dots, is the real value added provided by a journalist. If you don’t see the connections,you won’t see the world.
47
Academy of Educational Leadership Journal, Volume 12, Number 2, 2008
Faculty, especially those working with a downstream focus, and the institutions that employthem have a similar challenge to redefine their role.
REFERENCES
Barnett, B. (1992, June 3). Teaching and research are inescapably incompatible. Chronicle of Higher Education, p.A40.
Barr, R. & J. Tagg (1995 Nov/Dec). “From Teaching to Learning—A New Paradigm for Undergraduate Education,”Change, Vol. 27.
Boyer, E. (1990). Scholarship Reconsidered: Priorities of the Professoriate. Princeton University Press.
Brew, A. (1999). Research and teaching: changing relationships in a changing context. Studies in Higher Education,24(3), 291-301.
Brown, J.S., A. Collins & P. Duguid (1989, Jan-Feb). Situated cognition and the culture of learning. EducationalResearcher, 32-42.
Champion, D. (2001, June). Mastering the value chain: An interview with Mark Levin of Millennium Pharmaceuticals.Harvard Business Review, 108-115.
Drucker, P. (2001). The Essential Drucker. New York: Harperbusiness.
Evans, P. & T. Wurster (1999). Blown to Bits: How the New Economics of Information Transforms Strategy. Boston:Harvard Business School Press.
Friedman, T. (2000). The Lexus and the Olive Tree. New York: Farrar, Straus and Giroux.
Guskin, A. (1994a, July/August). Reducing student costs and enhancing student learning. Change, 26 (4), 22-29.
Guskin, A. (1994b, September/October). Restructuring the role of faculty. Change, 26 (5), 16-25.
Hattie, J. & H.W. Marsh (1996). The relationship between research and teaching—a meta-analysis. Review ofEducational Research, 66, 507-542.
Marsh, H.W. & J. Hattie (2002). “The relation between research productivity and teaching effectiveness.” The Journalof Higher Education, 73(5), 603-641.
Massy, W. & A. Wilger (1995, July/August). Improving productivity: What faculty think about it—and its effect onquality. Change, 27(4), 10-20.
Milem, J., J. Berger, & E. Dey (2000). Faculty time allocation: A study of change over twenty years. Journal of HigherEducation, 71 (4), 454-475.

48
Academy of Educational Leadership Journal, Volume 12, Number 2, 2008
Pea, R. (2000 May 26). Keynote speech at the Program for Educational Transformation Through Technology (PETTT)Symposium. University of Washington.
Rowland, S. (1996). Relationships between teaching and research. Teaching in Higher Education, 1(1), 7-20.
Stack, J. & B. Burlingham (2007, April). My awakening. Inc.com. http://www.inc.com/magazine/20070401/features-my-awakening.html.

49
Academy of Educational Leadership Journal, Volume 12, Number 2, 2008
TRANSFORMATIONAL LEADERSHIP AS ANEFFECTIVE CLASSROOM LEADERSHIP MODEL
FOR BUSINESS ETHICS INSTRUCTION
Lawrence S. Ruddell, Houston Baptist University
ABSTRACT
Charges have gone out from business and academia to our university business programs toexamine ethics curriculum in order to produce more ethical employees (Soule, 2005).Transformational leadership offers promise as a model for business ethics instruction because it is“ultimately a moral exercise in that it serves to raise the standards of human conduct” (Burns,1978, p. 20) which is exactly what is needed to produce ethical business graduates.
As Kouzes and Posner (2002, p. 31) point out, “To effectively model the behavior they expectof others, leaders must first be clear about their guiding principles. … leaders are supposed tostand up for their beliefs, so they’d better have some beliefs to stand up for." This paper uses asurvey of the literature and a personal observation approach to explore how the transformationalleadership model serves as an effective classroom leadership model for instructors in business ethicsin theory and in practice.
THE CALL FOR MORE ETHICAL BUSINESS GRADUATES
It has been several years since a number of business scandals rocked the American businessclimate. Court verdicts still loom for some alleged culprits. Problems can come from anywherewhether family, government, the workplace or society at large (Ethics Education in BusinessSchools, 2004, p. 9). Many in the business and business ethics communities are realizing that realchanges have to take place in values based ethics, beyond the compliance recommendations ofSarbanes-Oxley. At stake is our free market system. The Ethics Education in Business Schools(2004, p. 7) report concurs: "At issue is no less than the future of the free market system, whichdepends on honest and open enterprise to survive and flourish." Aronson (2001, p. 245) highlightsthe need for corporate leaders to maintain long-term success of the firm and ultimately capitalismand democracy by demonstrating ethical behavior which he says "may essentially be described asbehavior which is good as opposed to bad or right as opposed to wrong." Mendonca (2001, p. 268)adds that "Organizational effectiveness on an enduring basis is greatly enhanced by the self-transformation of the leader and of the followers that is inherent in ethical leadership." The needfor more ethical leadership in business is clear. Something needs to be done to encourage ethics instudents.

50
Academy of Educational Leadership Journal, Volume 12, Number 2, 2008
Business leaders and business ethics leaders in the United States and elsewhere (Milton-Smith, 1995) are collaborating to discover solutions. Both are looking to business school instructionfor help. There is a realization that business schools aren't the only ones working to make the worlda better place but they can provide guidance to students to do the right thing and also be successful(Ethics Education in Business Schools, 2004). There is a sturdy resolve to find answers no matterhow much effort it takes.
Even though ethics instruction has been part of business schools for years, there is a concernthat business schools have not been taking their ethical instruction role seriously. An alumnus ofHarvard Business School provides an enlightening example. It was said that Jeff Skilling liked"guys with spikes" (McClean & Elkind, 2003). He appeared to resonate with a Darwinian survivalof the fitness approach to business ethics with raw cash tossed like dripping red meat as the stimulusand cutthroat, take no prisoner business tactics as the faithful response. Ironically, this enlightenedand practical view of business ethics culminated in a rumination by Skilling during the last days ofEnron: the traders have taken over (McClean & Elkind, 2003), one of the key groups that Skillingcontrolled.
Jeff Skilling graduated from Harvard Business School. Not too many years after Skillinggraduated (in the late 1980s), Etzioni (2002) relates his experience observing Harvard businessfaculty debating about what to do with a large grant to develop business ethics instruction for theirMBA students. In the debate on how the monies should be used most effectively, several professorsenjoined that business ethics instruction at the MBA level was useless. Students had already formedtheir views, so there was no need to interfere. One professor in particular argued that everything isrelative anyway so there can be no positive influence.
The Dean of the University of Houston-Downtown College of Business penned an articlewhere he asserted that he saw no problem accepting bribes in international business settings because"everyone is doing it" anyway and you have to "do what you have to do" to compete (Bates, 2006).In fact he basically chides those who don't take bribes as reflecting "our cultural arrogance as we tryto impose our values, our business practices and our way of doing things upon other countries. ...Imperialism of values ... is treacherous because it is indirect, subtle, subtle, cumulative and destroysthe sovereignty of countries." Obviously there is no antithesis with this gentleman. Insisting onhonesty can be unethical depending on what part of the world you live in.
Even in Australia concerns about audit fraud in the 1980s have caused business schools thereto come "under increasing pressure to address the issue of business ethics and to 'develop andeducate' a new generation of more ethical business people" in spite of the fact that there was arealization that they had previously provided little leadership in the area of business ethicsinstruction (Milton-Smith, 1995, p. 684).
As the AACSB puts it (Ethics Education in Business Schools, 2004, p. 9), "While a numberof business schools have developed innovative strategies for engaging students in the challenge ofproviding ethical leadership, the assumption of many faculty and program leaders that the majority

51
Academy of Educational Leadership Journal, Volume 12, Number 2, 2008
of students are being adequately prepared in this domain is highly questionable." So there has neverbeen a more opportune time for business ethics instructors to rise to the occasion and make positivedifferences for business ethics at the individual and corporate levels. Will you be one of thoseinstructors?
TRANSFORMATIONAL LEADERSHIP
There has been a strong call for a different approach, to make ethics work (Ethics Educationin Business Schools, 2004) and to teach students well to do well. Business ethics instructors serveas leaders for their students. Since they are leaders in the classroom, what leadership model will beused? What will be that leadership approach that will help students do well? In this section, we willreview the basic tenets of transformational leadership, affirm it as a viable moral leadershipapproach, show how this approach can be useful in any organizational situation, and explore howit is an effective approach for key leaders as they influence organizations for good.
People have been studying leadership for thousands of years including principles associatedwith transformational leadership (Humphreys & Einstein, 2003, p. 87). Recently more informationhas emerged. Today, the transformational leadership approach has promise because of its inherentfocus on morality. Ciulla (1995) notes that good leadership refers not only to competence but alsoto ethics. Hood (2003) ties leadership to values. She found that "the ethical orientation of the CEOis a critical issue to consider in understanding ethical practices in organizations" (Hood, 2003, p.269). She found that as the key leaders (CEOs) in organizations reflect social (includingforgiveness, helpfulness, politeness and affection) and personal morals (including honesty, self-respect, courage and broad-mindedness), based on Rokeach (1973) topology, that they tend tosupport formal statements of ethics and tend to strive to produce more ethical organizations. Alsoshe found that transformational leaders (as determined by the Multifactor Leadership Questionnaireby Bass and Avolio, 1995) tend to strive more for ethical conduct and ethical organizations.Mendonca (2001) concurs that effective leadership necessitates that leader's behavior and influencetechniques reflect ethical and moral values.
In recent years, transformational leadership has received as much or more research attentionas any other leadership paradigm (Sivanathan & Fekken, 2002). Avolio and Bass (2004) highlightfour basic components of transformational leadership:
1. Idealized influence (followers idealize and emulate the behaviors of their trustedleader)
2. inspirational motivation (followers are motivated by attainment of a common goal)3. intellectual stimulation (followers are encouraged to break away from old ways of
thinking and are encouraged to question their values, beliefs and expectations
52
Academy of Educational Leadership Journal, Volume 12, Number 2, 2008
4. individualized consideration (followers' needs are addressed both individually andequitably.
Transformational leadership occurs when, in their interactions, people "raise one another tohigher levels of motivation and morality. Transforming leadership ultimately becomes moral in thatit raises the level of human conduct and ethical aspiration of both the leader and the led, and thusit has a transforming effect on both” (Burns, 1978, p. 20). Leaders transform and motivate followersby: (Burns, 1978; Bass, 1985) (1) making them more aware of the importance of task outcomes, (2)inducing them to transcend their own self-interest for the sake of the organization or team, and (3)inducing their higher-order needs.
According to Bass (1996; 1997), transformational leadership is considered effective in anysituation or culture and does not specify any conditions under which authentic transformationalleadership is irrelevant or ineffective. Krishnan (2002, p. 23) shows that transformational leaderswill try to influence the values of his or her followers: "Transformational leadership involves theuncovering of contradictions among values and between values and practice, and the realigning ofvalues in followers. Congruence between the value hierarchies of leaders and followers wouldproduce a powerful potential for the exercise of purposeful leadership."
It seems that the values of key leaders play an important role in the health and effectivenessof organizations. This bodes well for the use of transformational leadership in the classroom, withits high level focus on the values of leaders, as a leadership model for key leaders in organizations.Hood (2003, p. 264) suggests that top managers, particularly their ethical traits, play a key roleshaping ethical behavior with individuals in the organization. Van der Colff (2004, p. 503) suggeststhat transformational leadership is one of the competencies required for leaders for the 21st century.Dionne, Yammarino, Atwater, and Spangler (2004) looked at the link between transformationalleadership and team performance. Krishnan (2002) highlights that several studies havedemonstrated empirically how values affect personal and organizational effectiveness. Chen (2004,p. 432) concluded that leaders can influence subordinates through interactions and culture inTaiwan. "Organization culture has a significant impact on how employees view their organizationalresponsibilities and their commitment. Leaders affect their subordinates both directly through theirinteractions and also through the organization's culture." Bass (1999) mentions the "augmentationeffect" which is the positive impact of transformational leaders. "Leaders are responsible for theorganization's moral climate ... Through the use of morally appropriate influence strategies andtactics that are motivated and guided by moral intent, leaders can facilitate the moral developmentof followers" (Mendonca, 2001, p. 268). Bass (1998) emphasizes that leaders (past and present)impact the organizational culture with their values which flow from their beliefs.
So transformational leadership offers promise for impacting organizations. But it has to bemore than the leader's beliefs. The leader has to also intentionally take action to bring ethics to bearon followers. "Ethical behavior on the part of the leader would appear to be a necessary conditionfor the establishment of an ethical organization, but this alone is not sufficient. Ethical leadership

53
Academy of Educational Leadership Journal, Volume 12, Number 2, 2008
is required. CEOs are obliged to set a moral example for organizational members and to demarcatethe constant striving for increased profits from those activities which may be detrimental to thevalues of society in general" (Aronson, 2001, p. 245). What can business ethics instructors do tohave that impact?
BUSINESS ETHICS INSTRUCTORS AS TRANSFORMATIONAL LEADERS
Let's continue our examination of transformational leadership and see how it might relateto teachers as leaders in business ethics classes. We will look at research on the issue and considerpersonal observations of a business ethics instructor.
Research
Pounder (2003, p. 8) acknowledges that "there is a paucity of research examining theapplicability of the transformational leadership notions to an instructional setting." But he goes onto emphasize that there really is a natural relationship between transformational leadership andinstruction: "Thus, communication of one's teaching philosophy falls squarely within theinspirational motivational dimension of transformational leadership and influencing students byexample is central to the integrity dimension" (Pounder, 2003, p. 10). Pounder also sees teachingas shaping the climate for excellence through inspirational motivation, integrity, and getting studentsto stretch their goals, which are aspects of transformational leadership. Motivating students throughfairness, feedback and encouragement is likely to be a product of employing impressionmanagement and individual consideration with the deep sense of values and commitment generatedthrough the use of inspirational motivation and integrity. Amitay, Popper, and Lipshitz (2005, p.57) show a link between transformational leadership style and learning as looked at through theconcept of "organization learning mechanisms" (OLM). "This refers to institutionalizedorganizational arrangements in which individuals reflect on behalf of the organization by collecting,analyzing, storing, retrieving, and dissemination information and knowledge that is relevant to theirown performance and to the performance of the organization. ... where members of the organizationinteract for the purpose of learning" (Amitay, Popper & Lipshitz, 2005, p. 58).
Qualities of CEOs that are important to transformational leadership also can pertain toteachers having a positive impact on students. So, even though there is not much research on theinstructor in business ethics learning, there is a fair amount of research that indicates what makesa leader have a positive impact on subordinates in business, thus tying transformational leadershipto subordinate effectiveness. Others concur. Belisle (2004, p. 3) alludes to transformationalleadership when she encourages the teacher leader to act as a change agent when working with highschool students, seeing teachers as leaders as the key to school reform. Hood (2003, p. 264)reiterates, "Ethical leadership is essentially transformational in nature. The preparation for ethical

54
Academy of Educational Leadership Journal, Volume 12, Number 2, 2008
leadership therefore involves the self-transformation of both the leader and of the followers. ...Undeniably, the leader is indeed the soul of the organization, whose beliefs, values, and behaviorsinfluence and share, for better or worse, the organization's moral environment." The leadership styleof the CEO thus serves to communicate and exhibit the values that lead to an ethical orientation inthe organization. Kelloway, Barling and Helleur (2000) emphasize the need to injecttransformational leadership principles into training. Leaders inspire followers but the leader's moralactions give creditability to the vision. Without moral actions, followers view the leader's visionwith skepticism (Mendonca, 2001). Hood's study (2003, p. 263) "adds to the literature ondeveloping and maintaining an ethical orientation by examining the underlying values andleadership style of the top manager and their effects on corporate ethical practices." Pounder (2003)summarizes several benefits of transformational leadership, particularly to learning including:gaining of confidence, coping with stress among teams, and enhanced individual commitment to thegroup or organization. Just as corporate leaders are critical for not only talking about ethics butmaking them work so that their behavior sets the tone for ethics; so professors in the classroom havethe exact same responsibility, if not MORE so. If CEOs are shown to be critical to business ethicsknowledge and practice, if educators say it is important, if leaders in business instruction advocateit, SURELY we must consider using the transformational leadership approach in our business ethicsinstruction.
Leadership suggests that you want to have a change in your learner. You want to influencethem in such a way that they will be different. How do you that in a classroom? How do you evokepassion in learners without becoming overbearing or bias? The solution is to realize that everyonehas a standard for ethics. The problem is that most people have not identified the basis for thatstandard. By passionately communicating your own standard as an instructor, as transformationalleadership suggests, and encouraging students to identify their standards, learning can take place;ethical learning. This creates in the classroom what is found in business. You have to carry outbusiness with different people. This means that you have to understand and appreciate those whohave different standards. However, you also must be true to your own standards. A healthyclassroom environment will encourage this dynamic.
In other words, you want to make your students into transformational leaders bydemonstrating transformational leadership to them as you teach. This is how business ethicsinstruction is multiplied into having a broader impact in the business world. If, as Kouzes andPolsner (2002) suggests, that leaders cannot impact others until they have clearly articulated theirown values, then one of the primary goals of business ethics instruction should be to have studentsfigure out their foundation for ethics; or universal. Because this will provide the passion that willcause them to want to make a difference in the lives of others.

55
Academy of Educational Leadership Journal, Volume 12, Number 2, 2008
Personal Observations
Now let's examine some applications. I base the following observations on my six years ofteaching business ethics and reading extensively on the topic. The purpose here is to try to identifyelements that should be included in our business ethics instruction that reflect the transformationalleadership approach and really do impact students to act more ethically in business.
What are the ramifications for the instructor for helping transform students? As atransformational leader delivering business ethics instruction, you must figure out your universaland be able to clearly articulate it. Krishnan (2002) makes an important distinction between aninstrumental value: a belief concerning a desirable mode of conduct; and a terminal value: a beliefconcerning a desirable end-state. Our end-state is our worldview. It answers the question why wehold to certain standards and not others. As a transformational leader you should passionatelyembrace your worldview to the point that you would want to encourage others to adopt it. This iscritical because the whole basis of transformational leader is to change others into something basedon some standard of what is right and wrong. To avoid this step can prove confusing to students.In my on going reading in the area of business ethics, I was referred to a book on ethics from areligious perspective. The author began the book by lauding another author who inspired hiswriting, James Rachels. Wanting to go to the original source, I poured over Rachels' book. It is anexcellent book, detailing the different views towards ethics. Yet I noticed a pattern in the book. Hecould not really say with conviction that anything was true, even the definition of the word morality:"It would be helpful, therefore, if we could begin with a simple, uncontroversial definition of whatmorality is. But that turns out to be impossible" (Rachels, 1986, p. 1). He goes through the entirebook presenting excellent material about different views towards ethics. He even presents his ownview at the end which he calls Morality Without Hubris (or MWH). Yet even after analyzing allviews and presenting his own, he is left with: "MTW is a satisfactory moral theory. ... However ...it would be wise not to make too grandiose a claim for one's own view" (Rachels, 1986, p. 151). Sothere is no real Truth that Rachels can assert, so there is no transformational leadership.
Many who teach business ethics may be using the same tentative approach. We realize thatwe need to give a tip of the hat to universals; metaphysical foundations for what we believe, but weare not willing to take a stand on right and wrong. Our approach is to simply dump different viewunceremoniously in front of students like a doctor performing an autopsy. The understandable affectis sobering. Does this inspire ethical behavior in students? I think not. Krishnan (2002, p. 30)found in his study that followers "emulate only the terminal value systems of transformationalleaders, but not their instrumental value systems ... One of the managerial implications of this studyis that one should pay attention to terminal values of subordinates if a change is contemplated." Inother words, followers pick up on the worldview of the leader and the reason for ethical actions, notjust the individual choices themselves.
56
Academy of Educational Leadership Journal, Volume 12, Number 2, 2008
In order to have a truly transformational impact on students, our standard must includeabsolutes and antitheses. As Schaeffer (1968, p. 13) argues, standards hinge on our methodology,"the way we approach truth and knowing." To have truth, and therefore morals, yourpresuppositions must include absolutes and antithesis: if something is true, the opposite must befalse. We don't like antithesis for two reasons; it can expose our own guilt. If some things are rightand wrong then we can be wrong and we don't feel comfortable with that. Also, antithesis can leadto legalism. This is why in the Christian tradition there is so much emphasis on love. The goal isgoodness, not harshness. Also, rules in themselves do not make people better. That happens in theheart.
I think the transformational leadership approach would argue something different. We oweit to our students. Transformational leaders clearly identify and articulate their own standards andwhere the standards come from. Then we can inspire students by encouraging them to think throughtheir own standards and cite ourselves as examples. We also want to model transformationalleadership in our class. We want to motivate students with ideas like this: "we want you to be greatin business ethics so that you will have a positive impact on your work environment, no matterwhere you go." We need to inspire students with the notion that they can make a difference inbusiness and warn them of difficulties. Aronson (2001, p. 248) highlights that ethics is basically thestudy of standards for determining good and bad behavior and that, "Various ethical theories existbecause throughout the ages philosophers have adopted different perspectives regarding the criteriaupon which ethical judgments should be based." Students need to think for themselves anddetermine which of these theories reflect Truth and which do not.
So, in teaching business ethics, there are two alternative. One is to present different viewsof business ethics and really not embrace any of them. This is not transformational and will not havean impact on students to act more ethically. Another alternative is to present different views ofbusiness ethics while embracing one particular view but not telling students about this preference.At best, this is an oversight, at worst, it is dishonest. Much of public discourse these days has lostall sense of reason and has shifted to the lowest basis for communication, the polemic. This is atechnique used to advance an agenda through verbal attack. The problem with the polemic forinstructional purposes is that it focuses on attacking opponents rather than rationally presenting one'sown position. It believes the worst about human nature that people are not smart enough to makedecisions on their own as to what is right, so they have to be manipulated verbally. This is not agood basis for instruction. It comes up in academia when students are penalized for taking a viewthat differs from an instructor. We do not want this atmosphere in business ethics instruction. Wewant to create an environment of freedom. We want students to freely express their own views.Hood (2003) states that transformational leadership strives to meet expressed needs of followers ontheir own terms regardless of his or her worldview. Transformational leadership style originates inpersonal values and beliefs of leaders, not in an exchange relationship between leaders and followers

57
Academy of Educational Leadership Journal, Volume 12, Number 2, 2008
(Bass, 1985), yet these values take into consideration followers' enduring needs. The goal is rationalpersuasion, not coercion.
But we also want students to understand different views because students have to carry outbusiness with those who disagree. So, when we present different standards for ethics we also needto give students the freedom to explore their own views. That's why a complete course guide shouldinclude different viewpoints as well as Outside Learning Activities where students can gain creditfor reading something of interest to them alone, that helps them in the task of exploring their ownworldview. Students should also be introduced to the concept of worldview and explain therelationship between universals and particulars; that for particular actions that occur in businessthere is an ultimate reason for those actions. Students should be reminded that beliefs form thefoundation of ethics because beliefs determine the standard. Students should be challenged to putforth their best effort. I say something like this: "You will be meaningfully employed for at least40 years after this course. You will be working hard and you will be holding on to some ethicalsystem. Don't you think it makes sense to spend ten weeks to really figure out what you believe?Because when you face the real difficulties of business, this is what you will hold on to; this is whatwill help see you through." The key point is honesty and fairness. We need to be up front aboutwhat we believe and fair and respectful toward those who disagree with us. Perhaps we need toproduce what Covey suggests (1991, p. 108): "honestly matching words and feeling with thoughtsand actions, with no desire other than for the good of others, without malice or desire to deceive,take advantage, manipulate or control."
Students should be encouraged to realize that their belief, no matter what it is, forms thefoundation of the particular ethical choices that they make. The goal is honesty on the part ofstudents so that they will become effective ethical leaders. As some argue, leadership can happenfrom any position in the organization if a person has expertise and integrity. People will listen andfollow that type of person. This also reflects the essence of transformational leadership and givesstudents emotional intelligence, which is that non-academic ability to understand people and howto effectively work with people.
To help students understand their own ethical viewpoints, they need to carry out research andreflect on their own views. This needs to culminate in an assignment where students have to writetheir own, personal ethics statement where they have to articulate their universal and the particularprinciples that flow from their universal. Taking something like The Worldview Questionnaire(Ruddell, 2002) can also help. Students need to be able to present their point of view and then workwith others to formulate a business ethics statement for an organization that allows them to find acommon ground for doing business.
In business ethics, students need to know how to resolve the challenge of finding some unityamidst diversity. This is accomplished by helping students understand the difference betweentolerance and pluralism. Belz (2001) argues that tolerance means that we respect each person andtreat everyone humanely while pluralism is the notion that every idea is equally valid. Both

58
Academy of Educational Leadership Journal, Volume 12, Number 2, 2008
tolerance and pluralism suggest that we show respect for people. This is important to any successfulorganization and students should understand and respect other viewpoints in class discussions. Oneway to accomplish this goal is to require a Cross-Cultural assignment where students research adifferent country and present findings on the cultural and ethical issues involved in doing businessin that country (or region). It is particularly helpful to have someone from the different countryparticipate in the group or speak during the presentation.
However, tolerance suggests that students not only respect different people and differentpoints of view but they are also obligated to think critically by analyzing these other points of viewin light of their own point of view. Specifically they should compare other ethical points of viewwith their own. The goal is to respect people but that does not mean that all ideas presented mustbe equally valid. Students need to learn to discriminate right from wrong, truth from falsehood,good from bad. Students need to understand that organizations can allow for diversity in manythings but there needs to be some agreement on the stated organizational standards (ethics) forproductive working relationships to exist. The key is to honestly understand and communicate thosestandards.
For students, "business is business" is simply making a grade and getting out of the class.Many students are functional utilitarians. They need to understand why ethics are good for businessin the long run. Milton-Smith emphasizes that there is a consistent opinion that ethics are good forthe long term survivability and help provide a positive reputation and the ability to competeworldwide (1995). In the classroom, this means creating an atmosphere for learning by focusing onwhy learning is good. Meet the desire of students for reward by being prompt with returning gradesbut also emphasize feedback based on class objectives on papers rather than a grade only. Print outgrades at the end of the semester so students can confirm the marks they have.
In summary, Hood (2003) reviews that a transformational leadership style tends to encourageethical practices in organizations but skills in defining values-based vision, communicating thevision to followers, and using power effectively to implement the ideal are also critical to creatingethical organizations. These are the things a teacher needs to do in the classroom to impact students.Siegrist (1999, p. 297) emphasizes the critical need for graduate business programs to "move beyondthe training of efficient managers" to develop curriculum and delivery systems to produce"visionary, moral, and transformational leaders." This must be our focus in business ethicsinstruction. As someone has said (English, 1994, p. 231) "leadership without morality is simplybureaucratic technique." We want to prepare students to be ethical as individuals in business butalso equip them to lead ethics initiatives in organizations in which they will be involved.
DISCUSSION
Let's look at some principles that relate to transformational leadership in business ethicsinstruction. More investigation needs to be done on each topic but we can still glean some practical

59
Academy of Educational Leadership Journal, Volume 12, Number 2, 2008
suggestions for business ethics instruction which will be summarized at the end. It is hoped thatthere will be additional and more in depth work on issues related to this important topic.
Transformational Leadership Principles for Instruction
Podsakoff, McKenzie, Moorman, and Fetter (1990), following a review of the literature ontransformational leadership, concluded that it can be summarized by six behaviors:
1. Identifying and articulating a vision2. providing an appropriate model3. fostering the acceptance of group goals4. high performance expectations5. . providing individualized support to staff6. intellectual stimulation
They adapted the above to include: communicates a vision, develops staff, provides support,empowers staff, is innovative, leads by example, and is charismatic. It might be useful to considerlisting in detail what classroom behaviors are needed to accomplish these leadership goals as a wayfor directing curriculum.
Some companies can simply go through the motions regarding business ethics by beinghaphazard at best by developing superficial codes of conduct (that may not apply to topmanagement) and strategic corporate philanthropy which can result in a bottom line approach(Milton-Smith, 1995). However, some large companies have moved ahead with developing businessethics in their organizations including: codes of ethics, ethics committees, communication systemsfor employees to report abuses or seek guidance, ethics training programs, ethics officers, anddisciplinary processes (Mendonca, 2001). Other qualities to develop include in businesses are(Ethics Education in Business Schools, 2004):
‚ corporate responsibility‚ corporate governance‚ tools for recognizing and responding to ethical issues both personally and
organizationally‚ positive and negative examples of everyday conduct in business‚ advance ethical awareness, ethical reasoning skills, and core ethical principles.
Milton-Smith (1995) mentions the following indicators that companies show a positiveinterest in business ethics: codes of ethics, ethics education programs, the handling of ethical
60
Academy of Educational Leadership Journal, Volume 12, Number 2, 2008
violations. This serves as another useful guide for business ethics curriculum; making sure businessethics students understand and can implement actions that improve business ethics in companies.
Business ethics instructors need to continually learn from business. "The self-transformationneeded for ethical leadership revolves principally around character development. Yet, a survey ofthe codes of conduct of more than 200 companies found that 'the most ignored item was personalcharacter - it seemed not to matter'" (Walton, 1988, p. 170). We need to be in touch with problemsand solutions found in business.
Let's consider measurement. There are some issues to resolve. The heart is important tocharacter development which certainly seems to be the purview of transformational leadership.Because the heart is all that is going on inside the person, it is difficult, if not impossible to measure.It is difficult to understand one's own heart, much less someone else's. We can look at actions butthat is difficult to measure in a higher education situation. It is hard to predict what people will doin the future and then tie the business ethics instruction that they received to that behavior. Perhapsthe best that can be done is to try to evaluate their attitude towards ethical issues that they will facein their academic lives and then project what they might do as a result of that and see if businessethics instruction has anything to do with a change in how they will face ethical issues in school andthen project that they will have a similar response in business. We can also measure understandingof issues related to business ethics and attitudes toward certain ethical issues. So some things toconsider for evaluation include a focus on knowledge obtained (do they know more about ethics thanwhen they started?): pre-test and post-test (Mendonca, 2001). We can look at whether or notstudents have more consistent understanding of their worldviews. We can look at their opinions;do they think they are more ethical and their basic attitudes towards school ethical issues: pre-testand post-test.
The issue of which standard is the focus for the transformation, as discussed previously, isimportant in helping students sort out communications in today's complex culture. We have to helpstudents understand that some would inject political and philosophical issues into the termtransformational that might prove misleading. For example, Rashke (1989, p. 22) notes that;"Lurking in back of New Age semantics, which become compressed into such flagrant, pseudo-religious word mysteries as 'empowerment,' 'wholeness,' or 'planetary awareness' are verbalsubliminal incendiary devices that can be used to torch just about all the benchmarks of moralauthority, logical inference, and critical scrutiny that distinguish a culture." He goes on to say(Rashke, 1989, p. 23), for example, that Abraham Maslow and California's Esalen Institute were thebenchmark for the New Age fusion with business and were first to "span the long-standing cleftbetween the 'softer' world of liberal learning and the 'harder' tradition of management science." Hegoes on to sound an important warning when it comes to transformational leadership (Rashke, 1989,p. 31): "Helping employees become better people sounds innocent enough. But the not so altruisticend behind the philanthropic semantics is behavior change." That's why it is so critical that businessethics instructors be open and honest. Students need to make choices with eyes wide open.

61
Academy of Educational Leadership Journal, Volume 12, Number 2, 2008
Ethics instruction needs to be broader than just a business ethics class. It needs to permeatethe entire business school and university curriculums. "Creating a learning organization wouldindeed be the objective of ethical leaders. To achieve this objective, the leader first acquirespersonal mastery and then assists and empowers all employees to do the same. ... critical elementsof personal mastery: shared vision, objective assessment, focused energies, and creative tension"(Mendonca, 2001, p. 271). Organizational values need to be widely shared if there is to be aconsistent organizational profile (Krishnan, 2002).
The covenant is a good model for consideration as part of the transformational organization:"The employee-organization relationship is that of covenant ... In such a relationship there is nottradeoff between economic success and moral principles. Rather, adherence to moral principlesconstitutes the organization's higher purpose" (Dupree, 1989, p. 271). The covenantal model reflectsthe stakeholder idea that all parties in a business transaction should be considered whether they beemployees, vendors, customers, stockholders, or society in general. The covenant stressescommitment to people based on trust with rewards and consequences to follow based on how thecommitment is carried out. The covenant also includes a sign of agreement. This can be a powerfulorganizational culture tool to have some physical sign of covenantal commitment present in anoffice.
There seems to be some similarities between transformational leadership and servantleadership which might merit further examination. Stone, Russell, and Patterson (2004, p. 349)found that they are similar but the primary difference is the focus: "the transformational leader'sfocus is directed toward the organization, and his or her behavior builds follower commitmenttoward organizational objectives, while the servant leader's focus is on the followers, and theachievement of organizational objectives is a subordinate outcome." ... both ... "offer the conceptualframework for dynamic leadership."
TQM principles might shed some light on transformational leadership and business ethicsinstruction. Babbar (1995) compares Total Quality Management principles to the classroom whichreflects on transformational leadership. Based on his research, he argues in favor of the applicationof TQM to instruction as follows:
1. communicate your teaching philosophy up-front;2. influence students by setting a good example;3. shape the climate for excellence and get the students to stretch their goals; and4. motivate students through fairness, feedback and encouragement while instilling in
them a deep sense of values and commitment.
The study of Wisdom can prove useful as a goal of business ethics instruction. Longman(2002, pp. 14-15) finds that; "Wisdom is a rich concept and is not easily summarized. ... wisdomis the skill of living. It is a practical knowledge that helps one know how to act and how to speak

62
Academy of Educational Leadership Journal, Volume 12, Number 2, 2008
in different situations. Wisdom entails the ability to avoid problems, and the skill to handle themwhen they present themselves. Wisdom also includes the ability to interpret other people's speechand writing in order to react correctly to what they are saying to us." It is not about academicintelligence but something more. This is why Proverbs 30:24-28 (tells us to notice ants, rockbadgers, locusts, and lizards) and other places point to animals for examples of wisdom becausethough they lack IQ, they "know how to navigate life well" (Longman, 2002, p. 15). Longman(2002, p. 15) continues by pointing out that the idea of emotional intelligence from the bookEmotional Intelligence, by Daniel Goleman "sounds very similar to the concept of wisdom in thebook of Proverbs - at least at this initial stage of our definition." If, as Leban and Zulauf (2004, p.560) suggest, there are linkages between emotional intelligence and transformational leadership,then perhaps a study of Wisdom can yield fruitful ideas for the practical application oftransformational leadership.
Bierly III, Kessler, and Christensen (2000) reiterate this practical application in a slightlydifferent way by showing how wisdom applies to organizational knowledge management. They(Bierly III, Kessler & Christensen, 2000, p. 596) point out the general argument of many that"superior knowledge in critical areas will lead to a sustainable competitive advantage andorganizational success" and also go on to point out the fallacy of the underlying assumption (thatmore information and knowledge lead to greater success) behind this argument. They argue for theneed for organizational wisdom which they describe as: "The judgment, selection and use of specificknowledge for a specific context ... That is, wisdom relates to the ability to effectively choose andapply the appropriate knowledge in a given situation" (Bierly III, Kessler & Christensen, 2000, p.597).
One challenge with the transformational leadership approach in the classroom is that nomatter how hard you try to show and tell students that it is OK for the professor to have a point ofview and still remain fair, some people will probably be offended, probably by those who disagreewith your values. It could be said that this is actually a sign that you are doing well; that you arecausing people to think. The main thing is that the offense comes because the other individual(student) is not transformational and cannot respect your values (as the instructor); not vice versa.More analysis needs to be done to discover exactly where the problem lies.
The transformational leadership approach certainly reflects a theistic worldview that Godwants to transform His people into His likeness. Cooper (2005) asserts that the Apostle Paulexhibited a strong sense of moral purpose and other qualities that qualified him as a transformationalleader and thus worth studying. He cautions against making too close an alliance withtransformational leadership (and the servant leadership model as well) but allows for discussion.He supports the idea of the Holy Spirit as transformer through the presentation of Truth (theScripture) presented in an accurate way.
How do can these principles be used? There are applications.

63
Academy of Educational Leadership Journal, Volume 12, Number 2, 2008
Practical Recommendations for the Classroom
Based on the preceding transformational leadership principles, here is a summary of somepractical suggestions for the classroom. Each principle will be listed followed by practicalsuggestions for instructional implementation.
Articulate a Vision
Provide an orientation for students the first day of class. Explain the vision for the course.You want students to become leaders. You want them to understand what they believe. Tell themthat you want them to make a positive difference in the world. Tell them that they will spend 40-60years working and this is probably going to be the only time in their lives where they will reflect ontheir business ethics; the ethics they will use for the rest of their lives. Tell them that the worldneeds ethical people. Tell them that they are important and can make an important difference in theworld.
Show a film clip of ethical leadership (like Dan Cathey of Chick-Fil-A) that will inspirestudents to pursue ethical leadership
Provide a Model
Tell students about yourself; your background, your strengths and weaknesses, and howstudents can best work with you. As part of the class orientation (1st or 2nd meeting), articulateyour ethical point of view. Tell students that you have a particular point of view about right andwrong and tell them the basis of this point of view. So during class, you will listen carefully to theirideas but also, when appropriate, tell them what you think. You want to serve as a model of ethicalbehavior and someone who has thought out an ethical point of view.
Confirm yourself as a model by demonstrating your integrity and fairness by the way youadminister the class. Always start class on time and always end on time. This communicates respectfor students. Make it a policy to return any graded work within two class periods of when it wasreceived or all students receive five bonus points on the assignment. Make sure all work for thesemester is given out the first day of class and provide reminders to students of what assignmentsare coming up so they can plan their work. Respond to students' e-mails as soon as received, no laterthan one working day from when the student sent the e-mail.
Make sure that you grade students based on their own point of view when assignments aregiven asking for their point of view. As long as they are wrestling with what they believe then thisis good and assignments or specific test questions where they are asked for their opinion/evaluationshould be good. Show sincere interest in new or different ideas presented by students. Askquestions from students to understand more clearly and, if asked, tell them what you think and why.
64
Academy of Educational Leadership Journal, Volume 12, Number 2, 2008
Show friendliness to students. Talk with them as they come into the classroom, during anybreaks, and after class. Model goodwill and acceptance. Take an interest in all aspects of their lives.
Give an assignment where students write out their own, personal ethics statements. Remindthem that as you have developed your own ethics statement as the instructor that you want eachstudent to do the same. This should not be primarily an academic paper but should capture what thestudent really believes.
Through cases and other examples, show how other companies and leaders demonstrate goodethics. Show films. Invite guest speakers. Explore cases. Invite students to attend professionalbusiness ethics meetings.
High Performance Expectations
As part of your orientation to students, tell them about your expectations for performanceand that understanding business ethics is so important that it merits effort. Remind them that inorder to accomplish all class goals, hard work is needed. Make sure that every assignment tiesdirectly to class goals. For example here are four goals to consider: understand how good ethicsties to good business, understand your own ethics and the ethics of others in a global businessenvironment, understand how to solve ethical problems in business, learn how to set up and carryout an ethics program in an organization. Use a baseball analogy. If they achieve the first goal, itis like a single. If they achieve all four goals, it is like a home run. Reward students for completingassignments (like receiving a 95 for completing homework) which rewards their effort as well asreward students for their knowledge and understanding (test grades). As you expect a great dealfrom students, expect a great deal from yourself as the instructor (see above and importance ofmodeling). Eliminate any extraneous reading or assignments from the curriculum that do notaccomplish the course goals so that you make the best use of students' time. Give the class feedbackon how the class is doing on homework assignments and what you expect from them so that therecan be improvement.
Individualized Support
Provide individualized mentoring through project assignments. Consider giving a semesterproject where teams of students (4-5 on each team) establish a company (real or imagined) and setup the ethics program for that company including: mission statement, vision statement, ethicsstatement, code of conduct, how to report problems, steps for solving ethical problems, details aboutthe ethics program, evaluation, reward systems, and how the ethics function fits into the rest of theorganization. Allow class time to work on the project so that you can provide feedback andmentoring. Based on student needs, recommend other reading or specific business cases to consider.

65
Academy of Educational Leadership Journal, Volume 12, Number 2, 2008
Make sure to keep consistent office hours so that you are in your office when you say you will bein your office.
Intellectual Stimulation
Use a variety of learning techniques in the course. Students are stimulated in different waysbased on their learning styles. Mix up your approach. In class include: short lectures, classdiscussion and small group discussion, group project activity with feedback, films, film clips to useas illustrations, research using the internet to reinforce class material, guest speakers, andpresentations. Outside of class for homework, include: reading and answering questions, carryingout interviews with business people about their ethics, researching ethics of other companies, writingshort papers about what they believe, attending business ethics events, reading other books ofinterest on business ethics and receiving extra credit, and researching articles on business ethicsissues and solutions. Model your passion about business ethics by discussing your own researchand/or reading as it applies to course goals.
In conclusion, we have examined transformational leadership as it applies to business ethicsinstruction. We have identified some principles and discussed ideas for possible implementation.I trust that together, we will lead students to more ethical behavior for the good of themselves, thosewith whom they work, and for the world.
REFERENCES
Amitay, M., M. Popper & R. Lipshitz (2005). Leadership styles and organizational learning in community clinics. TheLearning Organization, 12(1), 57-70.
Aronson, E. (2001). Integrating leadership styles and ethical perspectives. Canadian Journal of AdministrativeSciences, 18(4), 244-256.
Avolio, B.J. & B.M. Bass (2004). Multifactor leadership questionnaire manual (Third Edition). Lincoln, Nebraska:Mind Garden, Inc.
Bass, B.M. (1985). Leadership and performance beyond expectations. New York: Free Press.
Bates, D. (2006, January 15). Legalize bribery? Yes, it's a fact of life. Houston Chronicle, E1, E5.
Belisle, C.H. (2004). The teacher as leader: transformational leadership and the professional teacher or teacher-librarian.School Libraries in Canada, 24(3), 47-50.
Belz, J. (2001, October 27). Tolerance vs. pluralism. World Magazine, 87.
Bierly III, P.E, E.H. Kessler & E.W. Christensen (2000). Organizational learning, knowledge and wisdom. Journal ofOrganizational Change Management, 13(6), 595-618.

66
Academy of Educational Leadership Journal, Volume 12, Number 2, 2008
Burns, J.M. (1978). Leadership. New York: Harper & Row.
Charbonneau, D. (2004). Influence tactics and perceptions of transformational leadership. Leadership & OrganizationDevelopment Journal, 25(7/8), 565-572.
Chen, L.Y. (2004). Examining the impact of organization culture and leadership behaviors on organizationalcommitment, job satisfaction, and job performance at small and middle-sized firms of Taiwan. Journal ofAmerican Academy of Business, Cambridge, 5(½), 432-438.
Clawson, J.G. (2003). Level three leadership (Second Edition). Upper Saddle, NJ : Prentice Hall.
Cooper, M. (2005). The transformational leadership of the apostle Paul: a contextual and biblical leadership forcontemporary ministry. Christian Education Journal, 2(1), 48-61.
Covey, S.R. (1991). Principle-centered leadership. New York: Summit Books.
Dionne, S.D., F.J. Yammarino, L.E. Atwater & W.D. Spangler (2004). Transformational leadership and teamperformance. Journal of Organizational Change Management, 17(2), 177-193.
Donagan, A. (1977). The theory of morality. Chicago: University of Chicago Press.
Dupree, M. (1989). Leadership is an art. New York: Doubleday.
Ethics Education in Business Schools (2004). Report of the Ethics Education Task Force to AACSB International'sBoard of Directors. St. Louis, Missouri.
Etzioni, A. (2002, August 4). When it comes to ethics, b-schools get an F. WashingtonPost.com.
Gibson, K. & J.B. Cuilla (1999). Ethics: The heart of leadership. Teaching Business Ethics, 3(2), 201-205.
Goleman, D. (1995). Emotional intelligence. New York: Bantam Books.
Gupta, V. & V.R. Krishnan (2004). Impact of socialization on transformational leadership: role of leader memberexchange. South Asian Journal of Management, 11(3), 7-20.
Hood, J.N. (2003). The relationship of leadership style and CEO values to ethical practices in organizations. Journalof Business Ethics, 43(4), 263-273.
Hughes, R.L., R.C. Ginnett & G.J. Curphy. Leadership: Enhancing the lessons of experience (Fourth Edition). Boston,Massachusetts: McGraw-Hill Irwin.
Humphreys, J.H. & W.O. Einstein (2003). Nothing new under the sun: transformational leadership from a historicalperspective. Management Decision, 41(½), 85-95.
Kelloway, E.K., J. Barling & J. Helleur (2000). Enhancing transformational leadership: the role of training andfeedback. Leadership & Organization Development Journal, 21(3), 145-150.

67
Academy of Educational Leadership Journal, Volume 12, Number 2, 2008
Kouzes, J. & B.Z. Posner (2002). The leadership challenge (3rd Edition). San Francisco: Jossey-Bass.
Krishnan, V.R. (2002). Transformational leadership and value system congruence. International Journal of Value -Based Management, 15(1), 19-33.
Leban, W. & C. Zulauf (2004). Linking emotional intelligence abilities and transformational leadership styles.Leadership & Organization Development Journal, 25(7/8), 554-564.
Longman III, T. (2002). How to read proverbs. Downers Grove, Illinois: InterVarsity Press.
McLean, B. & P. Elkind (2003). The smartest guys in the room. New York: Portfolio.
Mendonca, M. (2001). Preparing for ethical leadership in organizations. Canadian Journal of Administrative Sciences,18(4), 266-276.
Milton-Smith, J. (1995). Ethics as excellence: a strategic management perspective. Journal of Business Ethics, 14(8),683-693.
Pounder, J.S. (2003). Employing transformational leadership to enhance the quality of management developmentinstruction. The Journal of Management Development, 22(½), 6-13.
Rachels, J. (1986). Elements of moral philosophy. New York: Random House.
Rashke, C. (1989). Business as unusual. Minding the Store: Influences of the New Age in Business. SpiritualCounterfeits Project Journal, 9(1), 20-25.
Ruddell, L. (1992). The worldview questionnaire. Self-published.
Ruddell, L. (2004). Business ethics - Faith that works. Houston, Texas: Halcyon Press, Ltd.
Schaeffer, F. (1968). The God who is there. Chicago: Inter-Varsity Press.
Siegrist, G. (1999). Educational leadership must move beyond management training to visionary and moraltransformational leaders. Education, 120(2), 297-303.
Sivanathan, N. & G. Fekken (2002). Emotional intelligence, moral reasoning and transformational leadership.Leadership & Organization Development Journal, 23(3/4), 198-201.
Soule, E. (2005). Embedding ethics in business and higher education: From leadership to management imperative.Business-Higher Education Forum Ethics Initiative.
Stone, A., R.Russell & K. Patterson (2004). Transformational versus servant leadership: A difference in leader focus.Leadership & Organization Development Journal, 25(3/4), 349-361.
Turner, N., J. Barling, O. Epitropaki & V.B. Milner (2002). Transformational leadership and moral reasoning. Journalof Applied Psychology, 87(2), 304-311.

68
Academy of Educational Leadership Journal, Volume 12, Number 2, 2008
Van der Colff, L. (2004). A new paradigm for business education: The role of the business educator and businessschool. Management Decision, 42(3/4), 499-503.
Yukl, G. (2002). Leadership in organizations (5th Edition). Upper Saddle River, NJ: Prentice Hall.

69
Academy of Educational Leadership Journal, Volume 12, Number 2, 2008
A STUDY OF BUSINESS EDUCATIONRESEARCH OUTLETS
Faye S. McIntyre, University of West GeorgiaJames E. McIntyre, Jr., Jacksonville State University
Mary Kay Rickard, University of West Georgia
ABSTRACT
Business school faculty are seeking to respond to a renewed emphasis on the scholarship ofteaching and must find publication outlets for their work. Though a number of studies have assessedthe source and content of education-oriented journal publications in specific business disciplines,no cross-disciplinary assessment of business education publishing opportunities exists. This paperpresents the findings of an analysis of historical and current education-related publishingopportunities for business school faculty. Initial findings indicate that the number of publicationoutlets has increased, but remains a small percentage of business outlets. Overall circulation ofeducation-related business journals has increased, though a larger percent of current journals haverelatively small circulations. Recent trends identified in the analysis include the introduction ofjournals that are distributed exclusively on-line and the increasing dominance of blind, rather thaneditorial, reviewed journals. Findings indicate both an increase in interest in the scholarship ofteaching and an increase in competition among contributors.
INTRODUCTION
Publishing in journals that focus on teaching accomplishes several goals within the academiccommunity. It demonstrates commitment to and insight about good teaching (Boyer, 1990).Additionally, it provides evidence for individual faculty in the review process. From a universityperspective, faculty publishing education-related articles provides evidence of scholarly productivityfor institutions accredited by or seeking accreditation by the American Assembly of CollegiateSchools of Business International (AACSBI), particularly given the new “mission-linked” standards.Institutions with teaching as a primary mission now are able to seek accreditation without the sameburden of basic research as would be expected from a research institution.
Business faculty seeking to respond to this renewed emphasis on the scholarship of teachingmust find publication outlets for their work. A large body of research exists that attempts to assess“quality” of journals; however, only a small number of studies have assessed education orientedjournal publications in specific business disciplines (e.g., Clark and Hanna, 1986; Clark, 1995), andno cross-disciplinary assessment of business education journals exists.

70
Academy of Educational Leadership Journal, Volume 12, Number 2, 2008
The purpose of this paper is to conduct an analysis of the education-related publishingopportunities for business school faculty and how they have changed in recent decades. Such ananalysis should provide insight previously unavailable about the changing nature of education-related publications in business. This insight can inform those who seek to encourage activity in thefield of business education scholarship, as well as serve as a benchmark for understandingproductivity in the scholarship of teaching.
BUSINESS DISCIPLINES AND THE SCHOLARSHIP OF TEACHING
Higher education in America is under close scrutiny from many different constituencies(Mundt, 1998) including legislators and other policy makers who increasingly operate with distrustof higher education and question faculty productivity (Clausen, 1996). Criticism of the universityculture paints a picture of an elitist academy of self-proclaimed scholars with little interest inteaching (Anderson, 1992), system-wide indifference to the needs of undergraduate students (Sykes,1988), and focus on theory rather than competence of graduates (Bennis and O’Toole, 2005;Stewart, 2005). These misplaced priorities have led to the perception of many that higher educationis “falling short in its attempts to transfer knowledge to students” (Binks, Starkey, and Mahon, 2006,p. 2).
Another factor affecting universities in general and business schools in particular is risingaccountability standards that require professors to demonstrate the effectiveness of their teachingvia outcome based assessments (Smart, Kelley, and Conant, 1999). As with other forms ofscholarship, the scholarship of teaching must be public, undergo critical evaluation, and beaccessible to other scholars for use and exchange (Carnegie Foundation, 1998). Such a definitionimplies blind review publication, or what many call research into the practice of teaching (Silva,1998).
In addition to such external criticism from a variety of stakeholder groups (e.g., Keillor,Bush, and Bush, 1995), or perhaps in response to such criticism, the perceived importance of thescholarship of teaching in business schools has increased in recent decades (Ehie and Karathanos,1994). Bilimoria (2000, p. 704) cites an “unprecedented attention to pedagogical issues” as one ofthe factors leading to a renewed emphasis on the scholarship of teaching and learning.
This renewed emphasis, along with several additional factors, is leading to a change in theway teaching is assessed. Activities and publications of the Boyer Commission, in particular, haveled many business schools to reexamine the role teaching plays and its evaluation. Boyer (1990, p.39) states that making the scholarship of teaching a top priority requires doing research onpedagogical issues and clearly argues that “articles about teaching should be peer reviewed andgiven weight for tenure and promotion.”

71
Academy of Educational Leadership Journal, Volume 12, Number 2, 2008
LITERATURE REVIEW
Education-oriented journals are broadly defined as those whose foci are devoted toimproving business pedagogy. They may concentrate on the philosophy, innovation, practice,theory, or analysis of business pedagogy. In addition, they include journals publishing case researchcommitted to improving problem-solving skills of students. Excerpts from the mission statementsfor selected journals are cited in the Appendix to clarify various pedagogical emphases employed.
Many studies are available that assess “quality” of journals available to academicians.However, a surprisingly large number of these do not include education journals in their analysis.For example, Oltheten, Theoarakis, and Travlos (2005, p. 226) used “previous studies, personalcommunications with faculty from various universities, and survey pre-testing” to identify 66finance journals, yet no education-oriented journals were identified for inclusion in the study.Gorman and Kanet’s (2005) study of 27 operations management journals included none with aneducation focus. A recent assessment of marketing journals compiled from four previous studiesincluded no education journals, even though the article appears in the Journal of MarketingEducation (Polonsky and Whitelaw, 2005). Other researchers (e.g., Moore and Taylor, 2000;Swanson, 2004; Fender, Taylor, and Burke, 2005) assessed “major” or “elite” publications, none ofwhich focus on pedagogy.
Several notable exceptions include education journals in their assessment. Baumgartner andPieters (2003) included both Journal of Marketing Education and Marketing Education Review intheir assessment of 49 marketing journals. These journals ranked 24 and 46, respectively, in overallinfluence. In addition to overall influence, Baumgartner and Pieters evaluated influence withinspecific subareas. Journal of Marketing Education ranked number 1 in the subarea “MarketingEducation.” Interestingly, however, Marketing Education Review tied with Journal of ConsumerPolicy and ranked 13 in this subarea.
DuBois and Reeb (2000) included no education journals in their analysis of internationalbusiness journals. However, a similar study of international accounting research (Prather-Kinsey andRueschhoff, 2004) identified 24 international articles in the Journal of Accounting Education, 17in the Accounting Educator’s Journal, and 6 in Issues in Accounting Education between 1981 and2000. They identified a total of 72 articles during this period that dealt with accounting education,ranking 7 of 11 in topic matter covered.
Publications by faculty in the top seven economics departments (by reputation) recorded1,715 articles in 281 journals between 1995 and 2000 (Rupp and McKinney, 2002). Whenidentifying journals with at least 5 articles by faculty from these elite institutions, the Journal ofEconomic Education accounting for only 1.79% of articles during this time period, ranking 77 of87 journals.
Two education journals appeared in Rainer and Miller’s (2005) assessment. These authorscompiled results from nine studies published between 1991 and 2003 and computed the average

72
Academy of Educational Leadership Journal, Volume 12, Number 2, 2008
ranking of 50 journals across studies. Journal of Information System Education and Journal ofEducation for Management Information Systems were both included in their assessment, and ranked33 and 38, respectively. A quick glance at their data on these previous studies, however, shows thatboth of these journals were included in only one of the nine studies.
Similarly, Beattie and Goodacre (2006) reviewed several prior studies on accounting andfinance journal rankings and included a new methodology based on the UK research assessmentexercise, which requires universities to submit research outlets of up to four of their bestpublications. Accounting Education was ranked 11 of 408 journals by “research-active” faculty inthe list of most frequently submitted journals. One interesting conclusion is that European academicsrank Accounting Education more highly than UK academics, indicating perceptual differencesamong varying geographic constituencies.
In assessing the two primary education oriented outlets in marketing (Journal of MarketingEducation and Marketing Education Review), McIntyre and Tanner (2004, p. 38) conclude thatpedagogical scholarship, in the form of publication, does not appear to be related to an emphasis onteaching, but is perhaps related to an emphasis on research. Their findings suggest that “differencesin missions, mission statements, and AACSBI accreditation do not seem to be reflected inpedagogical research productivity.” Additionally, they found that articles in both JME and MERwere written by faculty from both large and small departments and from institutions ranging fromResearch Intensive universities to small liberal arts colleges.
Of course, in addition to journals whose primary focus is education, other outlets foreducation related research do exist. For example, the Journal of Personal Selling & SalesManagement has published articles on student perceptions of sales as a career. Such articles couldreasonably be included in a broader study of teaching scholarship. B Quest includes a “pedagogy”section in addition to “research” and “commentary” sections. Journals such as the Journal ofBusiness Ethics and others have also published articles on education topics.
METHODOLOGY
To provide an historical and a current evaluation of education related publishingopportunities for business school faculty, two key decisions were identified: source of the data andtime frame for consideration. Though several sources are available (e.g., Ulrich's InternationalPeriodicals Directory and MLA Directory of Periodicals), Cabell’s directories have been widelyused in business for over three decades, and they provide a rather comprehensive list of publicationoutlets available.
The earliest edition of the directory is Directory of Publishing Opportunities in Business,Administration and Economics (Cabell, 1978). Two twelve-year periods (1990 and 2001-2002)allow an assessment of changes over time, and the data currently available (2006) provides a recentupdate. Both the 1978 and 1990 editions were published as a single text. The 2001-2002 directory,

73
Academy of Educational Leadership Journal, Volume 12, Number 2, 2008
however, was published as a four-volume set, and the most recent data, while available in text formas a four-volume set, is provided to subscribers on demand from Cabell’s website(http://www.cabells.com).
The investigators first counted the total number of journals listed (eliminating duplicationin multiple edition versions). Journals with a pedagogical focus were identified by the journal name;all those including the terms teaching, education, case, or instruction in the title were selected forinclusion in this study. Journals were organized into a database. The database included the journaltitle, type of review (blind or editorial), acceptance rate, percent of invited articles, time for articlereview, number of issues, and number of copies distributed per issue. In addition, journals thatcharge a fee to review and/or publish articles were identified, along with the amount of the fee.
ANALYSIS AND RESULTS
All journals included in this study are identified in Table 1. Over the four time periodsstudied, 76 business education journals were identified. However, only Business Education Forumand Journal of Economic Education appeared in all four of Cabell’s directories. Nineteen of thejournals in the current directory were not in any of the earlier editions. Thus, one-third of thepublication outlets in 2006 appear to have been introduced since 2001-02.
Table 1: Publication Outlets in Business Education
Journal Title 1979 1990 2001-02 2006
Academy of Educational Leadership Journal T T
Accounting Education: An International Journal T T
Accounting Educator’s Journal T T T
Accounting Instructors’ Report T T
Advances in Accounting Education T T
Advances in Financial Education T
Annals of Cases on Information Technology T
Annual Advances in Business Cases T T T
Business Case Journal T T
Business Education Digest T T
Business Education Forum T T T T
Case Journal T
Case Research Journal T T T
Collegiate News and Views T
Delta Pi Epsilon Journal T T
Economics and Economics Education Research Journal T
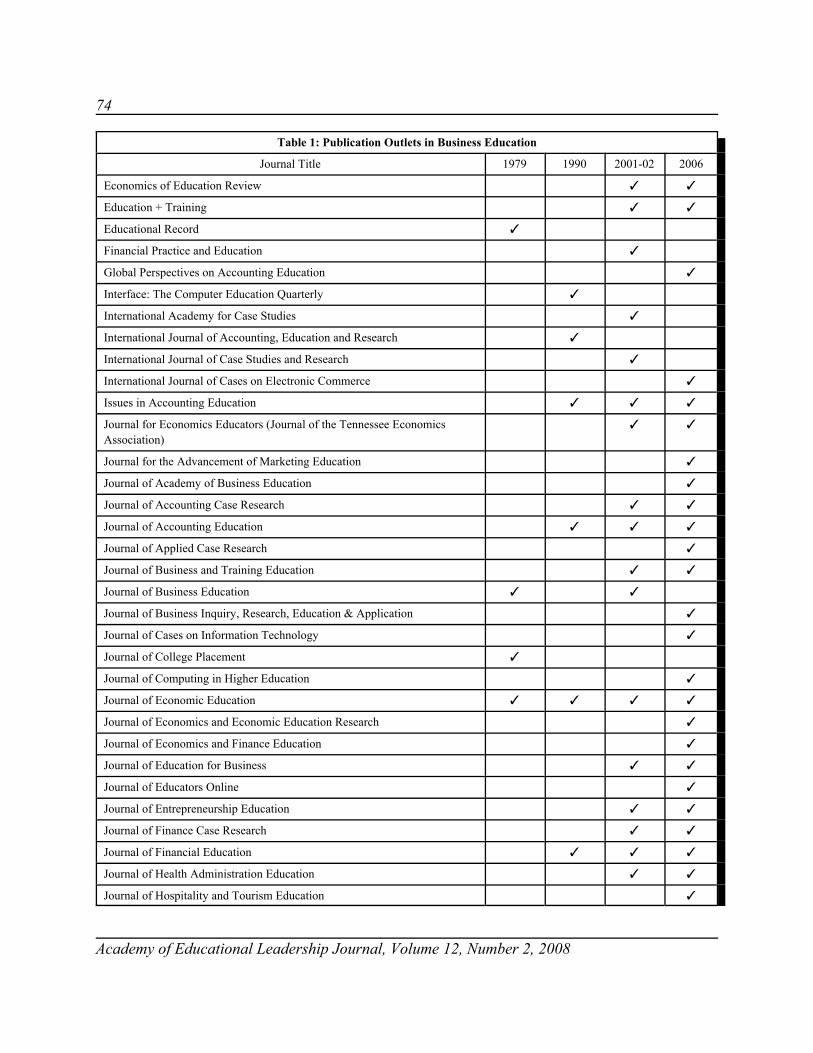
74
Table 1: Publication Outlets in Business Education
Journal Title 1979 1990 2001-02 2006
Academy of Educational Leadership Journal, Volume 12, Number 2, 2008
Economics of Education Review T T
Education + Training T T
Educational Record T
Financial Practice and Education T
Global Perspectives on Accounting Education T
Interface: The Computer Education Quarterly T
International Academy for Case Studies T
International Journal of Accounting, Education and Research T
International Journal of Case Studies and Research T
International Journal of Cases on Electronic Commerce T
Issues in Accounting Education T T T
Journal for Economics Educators (Journal of the Tennessee EconomicsAssociation)
T T
Journal for the Advancement of Marketing Education T
Journal of Academy of Business Education T
Journal of Accounting Case Research T T
Journal of Accounting Education T T T
Journal of Applied Case Research T
Journal of Business and Training Education T T
Journal of Business Education T T
Journal of Business Inquiry, Research, Education & Application T
Journal of Cases on Information Technology T
Journal of College Placement T
Journal of Computing in Higher Education T
Journal of Economic Education T T T T
Journal of Economics and Economic Education Research T
Journal of Economics and Finance Education T
Journal of Education for Business T T
Journal of Educators Online T
Journal of Entrepreneurship Education T T
Journal of Finance Case Research T T
Journal of Financial Education T T T
Journal of Health Administration Education T T
Journal of Hospitality and Tourism Education T

75
Table 1: Publication Outlets in Business Education
Journal Title 1979 1990 2001-02 2006
Academy of Educational Leadership Journal, Volume 12, Number 2, 2008
Journal of Informatics Education & Research T T
Journal of Information Systems Education T T
Journal of Information Technology Cases and Applications T T
Journal of Information Technology Education T
Journal of International Academy for Case Studies T
Journal of Legal Studies Education T T T
Journal of Management Education T T
Journal of Marketing Education T T T
Journal of Marketing for Higher Education T T T
Journal of Research on Computing in Education T
Journal of SMET Education: Innovation & Research T
Journal of Teaching in International Business T T T
Journal of Teaching in Travel & Tourism T T
Journal ;of Technology Education T
Journal of the Academy of Business Education T
Journal of the Association of Marketing Educators T
Kentucky Business Education Association Journal T T T
Marketing Education Review T T
Marketing Educator T
NABTE Review T T
Organizational Behavior Teaching Review T
Retail Education Today T T
Simulation and Games T
TBEA Journal (TBTEA Journal) T T T
Teaching Business Ethics T
The International Journal of Accounting and Educational Research T
Wisconsin Business Education Journal T T
Source: Cabell’s Directory of Publishing Opportunities: Various issues.
Table 2 shows the average submission fee for reviewing and for publishing articles. Manyof those journals that charge for review or publication indicate that the fee applies only to non-members or non-subscribers, though membership may be required for publication. Not surprisingly,journals charge more to publish articles than for review. As the table shows, average fees to review
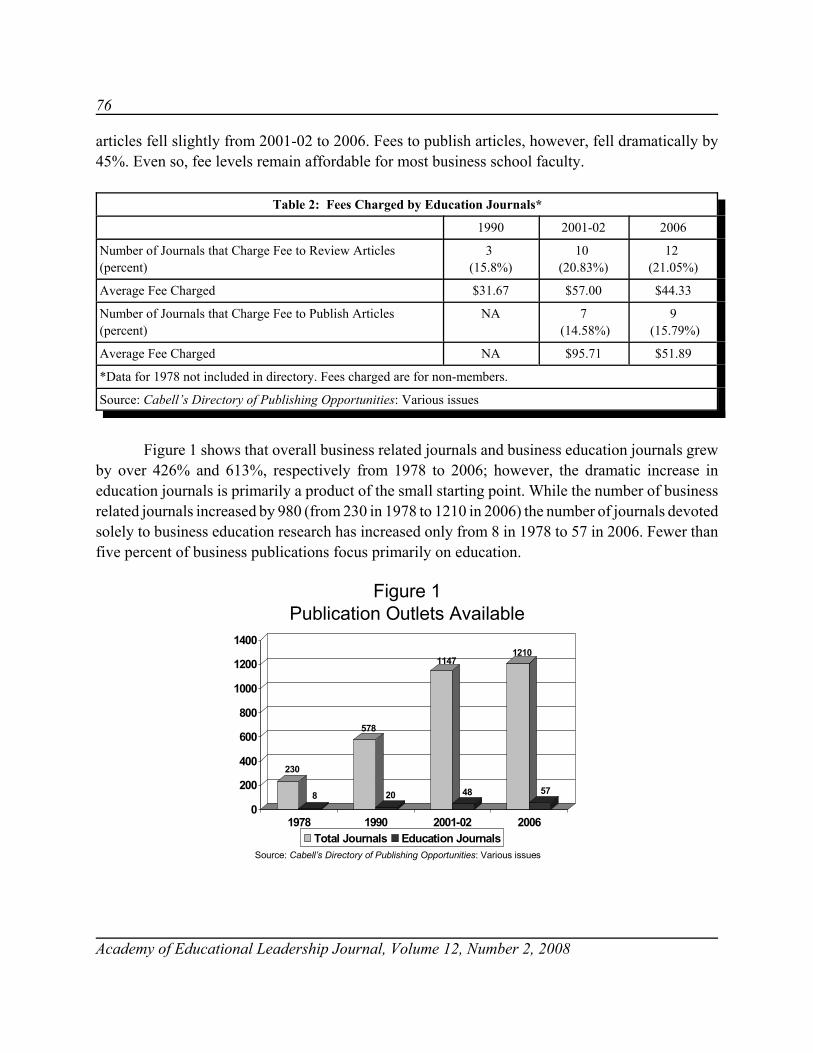
76
Academy of Educational Leadership Journal, Volume 12, Number 2, 2008
articles fell slightly from 2001-02 to 2006. Fees to publish articles, however, fell dramatically by45%. Even so, fee levels remain affordable for most business school faculty.
Table 2: Fees Charged by Education Journals*
1990 2001-02 2006
Number of Journals that Charge Fee to Review Articles(percent)
3 (15.8%)
10 (20.83%)
12 (21.05%)
Average Fee Charged $31.67 $57.00 $44.33
Number of Journals that Charge Fee to Publish Articles(percent)
NA 7 (14.58%)
9 (15.79%)
Average Fee Charged NA $95.71 $51.89
*Data for 1978 not included in directory. Fees charged are for non-members.
Source: Cabell’s Directory of Publishing Opportunities: Various issues
Figure 1 shows that overall business related journals and business education journals grewby over 426% and 613%, respectively from 1978 to 2006; however, the dramatic increase ineducation journals is primarily a product of the small starting point. While the number of businessrelated journals increased by 980 (from 230 in 1978 to 1210 in 2006) the number of journals devotedsolely to business education research has increased only from 8 in 1978 to 57 in 2006. Fewer thanfive percent of business publications focus primarily on education.
Figure 1Publication Outlets Available
230
8
578
20
1147
48
1210
57
0
200
400
600
800
1000
1200
1400
1978 1990 2001-02 2006Total Journals Education Journals
Source: Cabell’s Directory of Publishing Opportunities: Various issues

77
Academy of Educational Leadership Journal, Volume 12, Number 2, 2008
The increasing dominance of the blind-reviewed reviewed journals for business educationresearch since 1978 is illustrated in Figure 2. Taken together, Figures 1 and 2 show that while thereare still relatively few education outlets in business, those outlets are increasingly blind-reviewed.This would seem to be an encouraging trend for scholars interested in business education seekingpeer-reviewed outlets for their research.
Figure 2Type of Review
25%
75%84.21%
15.80%
95.74%
4.26%
94.64%
5.36%
0%
20%
40%
60%
80%
100%
1978 1990 2001-02 2006Blind Editorial
Source: Cabell’s Directory of Publishing Opportunities: Various issues
Figure 3 shows the falling percentage of invited articles in business education journals since1978. This may indicate business researchers increasingly recognize the importance of educationresearch resulting in more authors initiating this type of research voluntarily. The implication iseducation journals are therefore less reliant on solicited articles for content. Lower acceptance rates(23% in 2006 versus 26% in 1978), shown in Table 3, combined with fewer invited articles pointsto an increase in submissions to business education journals.
Table 3: Acceptance Rates by Education Journals
1978 1990 2001-02 2006
Average Acceptance Rate 26.25% 26.79% 26.32% 23.40%
Source: Cabell’s Directory of Publishing Opportunities: Various issues
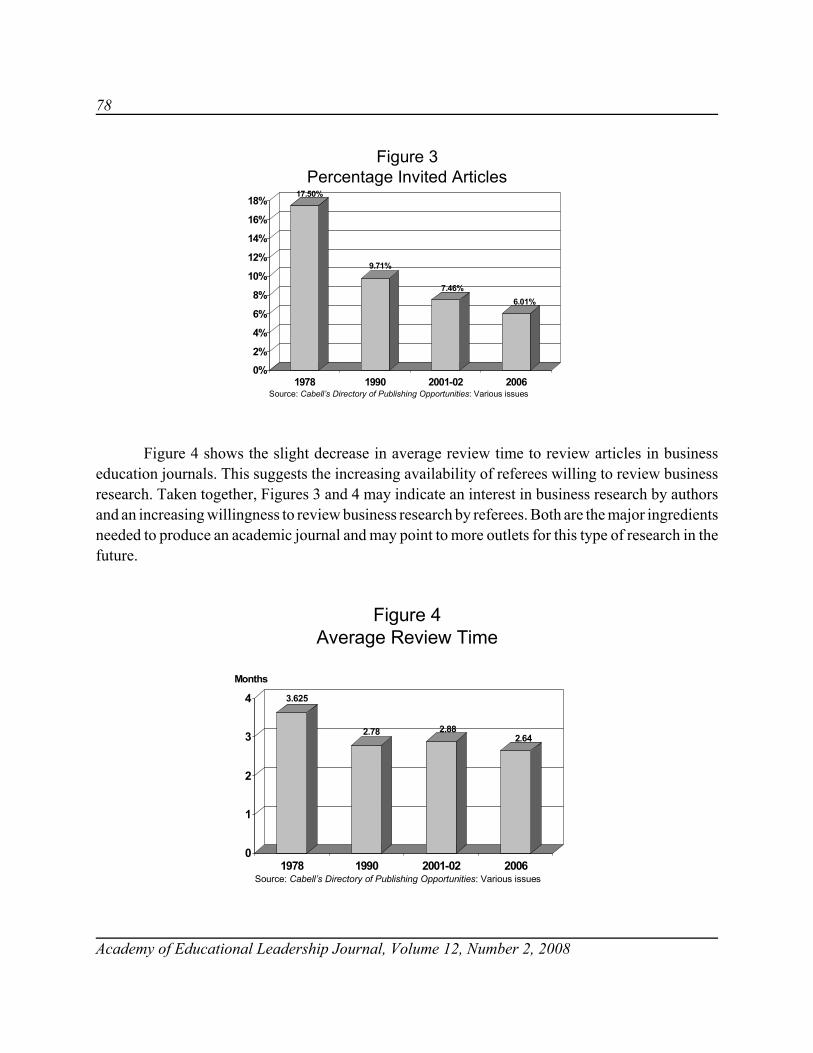
78
Academy of Educational Leadership Journal, Volume 12, Number 2, 2008
Figure 3Percentage Invited Articles
17.50%
9.71%
7.46%6.01%
0%
2%
4%
6%
8%
10%
12%
14%
16%
18%
1978 1990 2001-02 2006Source: Cabell’s Directory of Publishing Opportunities: Various issues
Figure 4 shows the slight decrease in average review time to review articles in businesseducation journals. This suggests the increasing availability of referees willing to review businessresearch. Taken together, Figures 3 and 4 may indicate an interest in business research by authorsand an increasing willingness to review business research by referees. Both are the major ingredientsneeded to produce an academic journal and may point to more outlets for this type of research in thefuture.
Figure 4Average Review Time
3.625
2.78 2.882.64
0
1
2
3
4
1978 1990 2001-02 2006
Months
Source: Cabell’s Directory of Publishing Opportunities: Various issues
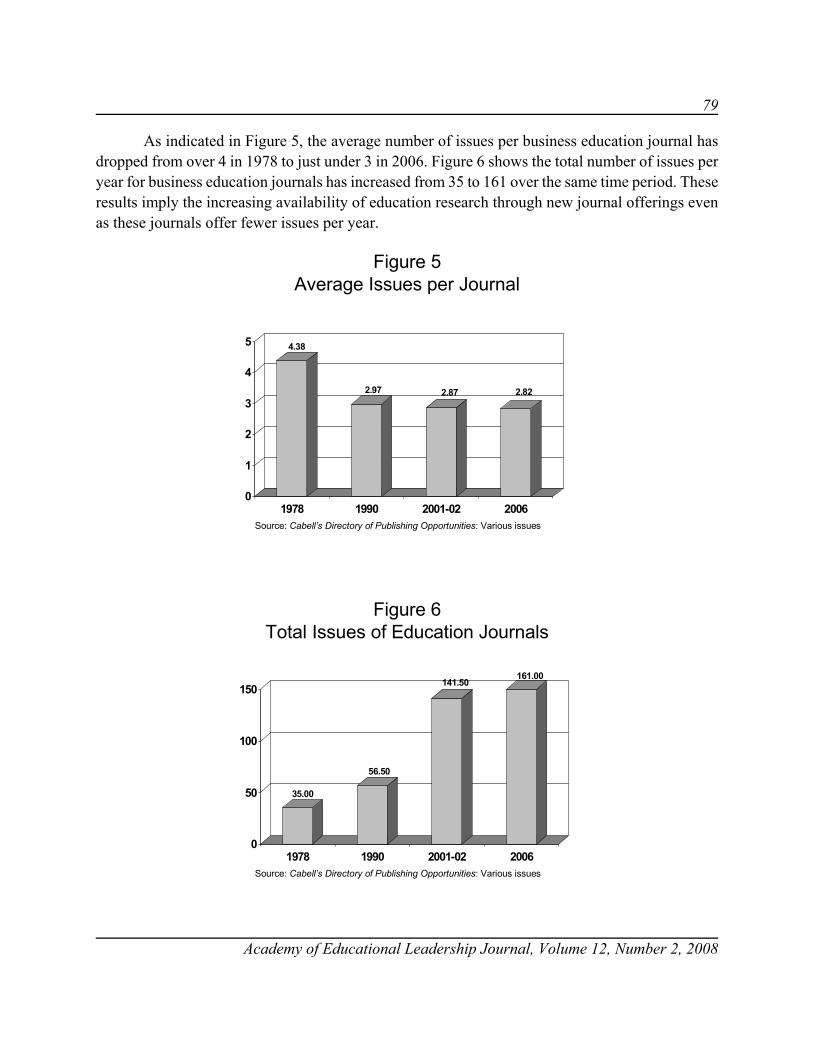
79
Academy of Educational Leadership Journal, Volume 12, Number 2, 2008
As indicated in Figure 5, the average number of issues per business education journal hasdropped from over 4 in 1978 to just under 3 in 2006. Figure 6 shows the total number of issues peryear for business education journals has increased from 35 to 161 over the same time period. Theseresults imply the increasing availability of education research through new journal offerings evenas these journals offer fewer issues per year.
Figure 5Average Issues per Journal
4.38
2.97 2.87 2.82
0
1
2
3
4
5
1978 1990 2001-02 2006Source: Cabell’s Directory of Publishing Opportunities: Various issues
Figure 6Total Issues of Education Journals
35.00
56.50
141.50161.00
0
50
100
150
1978 1990 2001-02 2006Source: Cabell’s Directory of Publishing Opportunities: Various issues
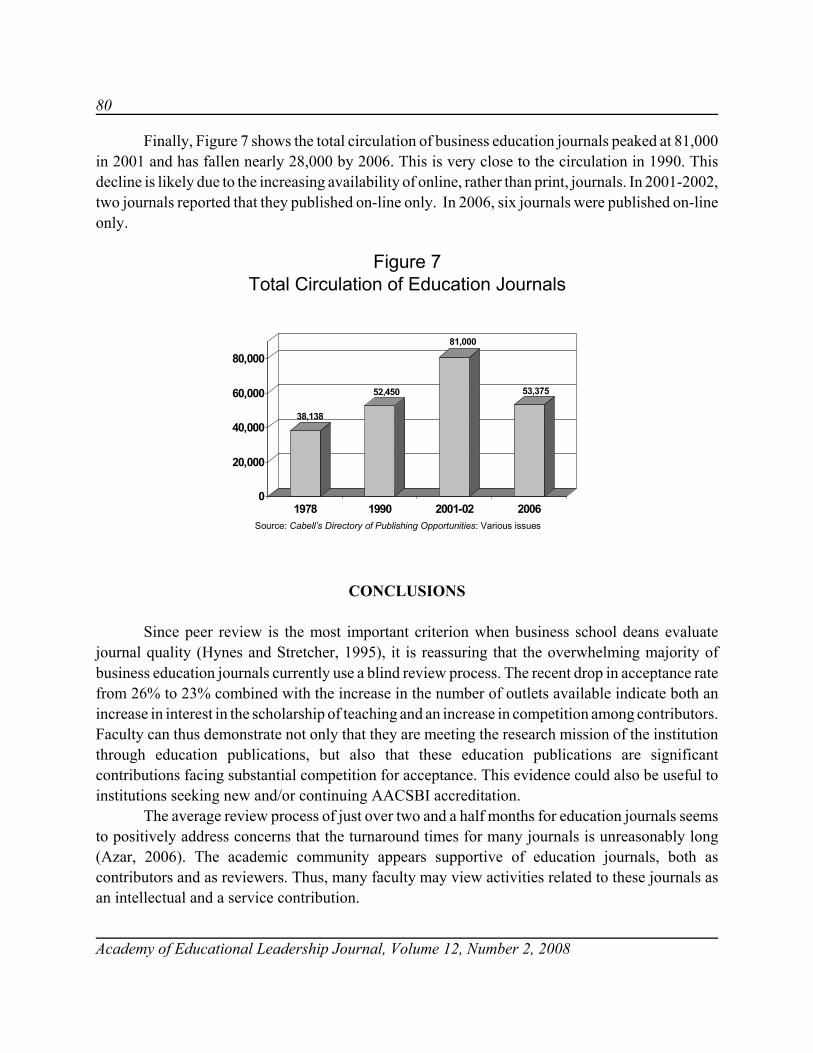
80
Academy of Educational Leadership Journal, Volume 12, Number 2, 2008
Finally, Figure 7 shows the total circulation of business education journals peaked at 81,000in 2001 and has fallen nearly 28,000 by 2006. This is very close to the circulation in 1990. Thisdecline is likely due to the increasing availability of online, rather than print, journals. In 2001-2002,two journals reported that they published on-line only. In 2006, six journals were published on-lineonly.
Figure 7Total Circulation of Education Journals
38,138
52,450
81,000
53,375
0
20,000
40,000
60,000
80,000
1978 1990 2001-02 2006Source: Cabell’s Directory of Publishing Opportunities: Various issues
CONCLUSIONS
Since peer review is the most important criterion when business school deans evaluatejournal quality (Hynes and Stretcher, 1995), it is reassuring that the overwhelming majority ofbusiness education journals currently use a blind review process. The recent drop in acceptance ratefrom 26% to 23% combined with the increase in the number of outlets available indicate both anincrease in interest in the scholarship of teaching and an increase in competition among contributors.Faculty can thus demonstrate not only that they are meeting the research mission of the institutionthrough education publications, but also that these education publications are significantcontributions facing substantial competition for acceptance. This evidence could also be useful toinstitutions seeking new and/or continuing AACSBI accreditation.
The average review process of just over two and a half months for education journals seemsto positively address concerns that the turnaround times for many journals is unreasonably long(Azar, 2006). The academic community appears supportive of education journals, both ascontributors and as reviewers. Thus, many faculty may view activities related to these journals asan intellectual and a service contribution.
81
Academy of Educational Leadership Journal, Volume 12, Number 2, 2008
Several potentially fruitful areas of research are suggested by this study. In addition tojournals primarily focused on education, a broader study of the scholarship of teaching could includediscipline-oriented publications that include pedagogical contributions. Such articles couldreasonably be included in a broader study of teaching scholarship. Journals such as the Journal ofPersonal Selling & Sales Management, B Quest, Journal of Business Ethics, and others havepublished articles on education topics and could be of interest to academicians conducting researchin this area.
Business school deans appear to generally accept electronic journals as equivalent to printjournals; however, a substantial minority of almost 20% automatically consider electronic journalsinferior (Hynes and Stretcher, 2005). As more journals are available online, this perception maychange. Future research should address both the objective quality and perceptions about onlinejournals.
Given criticisms of faculty concern for teaching, it is interesting to note the rise in thenumber of education publications outlets and the rise in contributions to and support of the journals.Perhaps the problem lies not in actual faculty interests, but in inaccurate community perceptions.To correct misperceptions, the nature of pedagogical research should be communicated toconstituents outside the university. University and college of business publications, such asrecruitment brochures, can highlight these activities and point to changes in pedagogy that may haveresulted from research on their campuses.
This study provides insight into publication outlets, but it does not attempt to assess theimpact of pedagogical research in the business school curriculum nor the value placed on thesepublications when faculty face tenure and promotion decisions. Clearly research is needed beforedefinitive conclusions can be drawn.
This study confirms the view that scholarship activities are “increasingly heterogeneous”(Hynes and Stretcher, 2005), with a renewed emphasis on the scholarship of teaching and learningin addition to more “traditional” basic and applied research. The findings raise a number ofinteresting questions to be addressed in the future. It is our hope that this work will spur more studyon the nature of the scholarship of teaching and will serve as a catalyst for increased participationamong faculty in this important research.
REFERENCES
Anderson, M. (1992). Imposters in the Temple. New York: Simon & Schuster.
Azar, O.A. (2006). The Academic Review Process: How Can We Make It More Efficient? American Economist, 50(Spring), 37-50.
Baumgartner, H. & R. Pieters (2003). The Structural Influence of Marketing Journals: A Citation Analysis of theDiscipline and Its Subareas Over Time. Journal of Marketing, 67 (April), 123-139.

82
Academy of Educational Leadership Journal, Volume 12, Number 2, 2008
Beattie, V. & A. Goodacre (2006). A New Method for Ranking Academic Journals in Accounting and Finance.Accounting and Business Research, 36 (2), 65-91.
Bennis, W. & J. O’Toole (2005). How Business Schools Lost Their Way. Harvard Business Review, 83 (May), 96-104.
Bilimoria, D. (2000). A New Scholarship of Teaching and Learning: An Agenda for Management EducationScholarship. Journal of Management Education, 24 (December), 704-707.
Binks, M., K. Starkey, & C.L. Mahon (2006). Entrepreneurship Education and the Business School. Technology Analysis& Strategic Management, 18 (February), 1-18.
Boyer, E.L. (1990). Scholarship Reconsidered: Priorities of the Professoriate. Princeton, NJ: The Carnegie Foundation.
Cabell, D.W.E., ed. (1978). Directory of Publishing Opportunities in Business, Administration and Economics.Beaumont, TX: Cabell Publishing Co.
Cabell, D.W.E., ed. (1990). Cabell’s Director of Publishing Opportunities in Business and Economics (Fifth Edition).Beaumont, TX: Cabell Publishing Co.
Cabell, D.W.E. & D.L. English, ed. (2000). Cabell’s Directory of Publishing Opportunities in Marketing (Eighth Edition2001-2002). Beaumont, TX: Cabell Publishing Co.
Cabell, D.W.E. & D.L. English, ed. (2000). Cabell’s Directory of Publishing Opportunities in Accounting (EighthEdition 2001-2002). Beaumont, TX: Cabell Publishing Co.
Cabell, D.W.E. & D.L. English, ed. (2000). Cabell’s Directory of Publishing Opportunities in Economics and Finance(Eighth Edition 2001-2002). Beaumont, TX: Cabell Publishing Co.
Cabell, D.W.E. & D.L. English, ed. (2000). Cabell’s Directory of Publishing Opportunities in Management (EighthEdition 2001-2002). Beaumont, TX: Cabell Publishing Co.
Cabell, D.W.E (2006). http://www.cabells.com/.
Carnegie Foundation for the Advancement of Teaching (1998). The Carnegie Teaching Academy Campus Program.Menlo Park CA: The Carnegie Foundation.
Clark, G.L. (1995). An Analysis of the Sources of Articles in the Journal of Marketing Education: An Update. Journalof Marketing Education, 17 (Spring), 25-33.
Clark, G.L. & N. Hanna (1986). An Analysis of the Source of Articles in the ‘Journal of Marketing Education’ SinceIts Founding in 1979. Journal of Marketing Education, 8 (Summer), 71-74.
DuBois, F.L. & D. Reeb (2000). Ranking the International Business Journals. Journal of International Business Studies,31 (Fourth Quarter), 689-704.

83
Academy of Educational Leadership Journal, Volume 12, Number 2, 2008
Ehie, I.C. & D. Karathanos (1994). Business Faculty Performance Evaluation Based on the New AACSBI AccreditationStandards. Journal of Education for Business, 69 (May/June), 257-262.
Fender, B.F., S.W. Taylor, & K.G. Burke (2005). Making the Big Leagues: Factors Contributing to Publication in EliteEconomics Journals. Atlantic Economic Journal, 33, 93-103.
Gorman, M.R. & J.J. Kanet (2005). Evaluating Operations Management-Related Journals via the Author AffiliationIndex. Manufacturing & Service Operations Management, 7 (Winter), 3-19.
Hynes, G.E. & R.H. Stretcher (2005). Business Schools’ Policies Regarding Publications in Electronic Journals. Journalof Education for Business, 81 (November/December), 73-80.
Keillor, B.D., R.P. Bush, & A.J. Bush (1995). Marketing-Based Strategies for Recruiting Business Students in the NextCentury. Marketing Education Review, 5 (Summer), 69-79.
McIntyre, F.S. & J.F. Tanner, Jr., (2004). The Scholarship of Teaching: A Study of Marketing Education JournalPublications. Marketing Education Review, 14 (Spring), 33-44.
Moore, L.J. & B.W. Taylor, III (1980). A Study of Institutional Publications in Business-Related Academic Journals,1972-78. The Quarterly Review of Economics and Business, 20 (Spring), 87-97.
Oltheten, E., V. Theoharakis, & N.G. Travlos (2005). Faculty Perceptions and Readership Patterns of Finance Journals:A Global View. Journal of Financial and Quantitative Analysis, 40 (March), 223-239.
Polonsky, M.J. & P. Whitelaw (2005). What Are We Measuring When We Evaluate Journals? Journal of MarketingEducation, 27 (August), 189-201.
Prather-Kinsey, J.J. & N.G. Rueschhoff (2204). An Analysis of International Accounting Research in U.S.- and Non-U.S. Based Academic Accounting Journals. Journal of International Accounting Research, 3 (1), 63-81.
Rainer, R. & M. Miller (2005). Examining differences across journal rankings. Communications of the ACM, 48 , 91-94.
Rupp, N.G. & C.N. McKinney, Jr. (2002). Eastern Economic Journal, 28 (Fall), 523-538.
Silva, M.C. (1998). The Scholarship of Teaching as Science and as Art. Inventio: Creative Thinking about Learning andTeaching, (February), www.doIit.gmu.edu/archives.
Smart, D.T., C.A. Kelley, & J.S. Conant (1999). Marketing Education in the Year 2000: Changes Observed andChallenges Anticipated. Journal of Marketing Education, 21 (December), 206-216.
Stewart, T.A. (2005). Practice Makes Perfect. Harvard Business Review, 83 (May), 10.
Swanson, E.P. (2004). Publishing in the Majors: A Comparison of Accounting, Finance, Management, and Marketing.Contemporary Accounting Research, 21 (Spring), 226-255.
Sykes, C.J. (1988). Profscam: Professors and the Demise of Higher Education. Washington, DC: Regnery Gateway.

84
Academy of Educational Leadership Journal, Volume 12, Number 2, 2008
APPENDIXEDUCATION-ORIENTED JOURNAL MISSIONS
Excerpts from the mission statements for selected journals used in this study are cited below to clarify the variouspedagogical emphases employed. All excerpts were compiled from information available on each journal’s web page.
Academy of Educational Leadership: “. . . publishes theoretical, empirical, practical or pedagogic manuscripts ineducation. Its primary objective is to expand the boundaries of the literature by supporting the exchange of ideas andinsights which further the understanding of education.”
Business Case Journal: “The Business Case Journal was established . . . to publish cases and research related to casewriting or teaching with cases.”
The Business Education Digest: “Manuscripts submitted for consideration by Business Education Digest should focuson instructional philosophy, theory, or practice of business education.”
Journal of the Academy of Business Education: “The Journal of the Academy of Business Education is a Multi-disciplinary journal seeking the following kinds of papers:
1. Educational research – empirical research that tests teaching practices, student performance andlearning environments;
2. Pedagogy – papers offering interesting or unique approaches to teaching or delivering businesseducation – general or discipline specific.
3. Curriculum – papers addressing interesting or unique approaches to curriculum development anddiscipline integration.
4. Cases – well crafted cases that illustrate several important issues to either single or multipledisciplines.
5. Literature reviews – papers that offer extensive reviews of current relevant research and thought.6. Multi-disciplinary – papers emphasizing multi-disciplinary approaches to business education.7. Ethics and Moral Values – papers offering guidance in the integration of ethics and moral values in
business education.”
Journal of Accounting Education: “. . . dedicated to promoting excellence in teaching and stimulating research inaccounting education internationally. The journal provides a forum for exchanging ideas, opinions, and research resultsamong accounting educators around the world.”
Journal of Economic Education: “. . . offers original articles on innovations in and evaluations of teaching techniques,materials, and programs in economics. Articles, tailored to the needs of instructors of introductory through graduate-leveleconomics, cover content and pedagogy in a variety of mediums.”
Journal of Economics and Finance Education: “JEFE invites economic and finance contributions in three main areas:research, instruction and content.”
Journal of Information Systems Education: “. . . seeks original articles on current topics of special interests toinformation systems educators. The journal publishes applications-oriented and research articles covering informationsystems education and training topics. Curriculum design and implementation issues and research or application oriented

85
Academy of Educational Leadership Journal, Volume 12, Number 2, 2008
articles that describe curriculum, pedagogy, professional development or educational facilities issues will be consideredfor publication in the journal.”
Journal of Management Education: “Created to meet the growing demand for research, analysis and discussions onteaching management and organizational behaviour, the Journal of Management Education serves as a forum for theimprovement of management education in both classroom and corporate settings. The journal’s reflective and informativenature makes it an ideal source for teaching exercises, ideas and strategies.”
Journal of Marketing Education: “The Journal of Marketing Education is the leading international scholarly journalpublishing articles on the latest techniques in marketing education, emphasizing new course content and effectiveteaching methods. The journal also addresses such professional issues as development of the curriculum, careerdevelopment, and the state of the profession. The Journal of Marketing Education provides a forum for the exchangeof ideas, information and experiences related to the process of educating students of marketing and advertising.”

86
Academy of Educational Leadership Journal, Volume 12, Number 2, 2008

87
Academy of Educational Leadership Journal, Volume 12, Number 2, 2008
STRATEGIES FOR PROMOTING ACTIVE LEARNING IN A PRINCIPLES OF ACCOUNTING COURSE
Daniel R. Brickner, Eastern Michigan UniversityEdwin R. Etter, Eastern Michigan University
ABSTRACT
This article presents strategies for creating an active learning environment in a principlesof accounting course. These strategies, which promote independent and lifelong learning, includethe use of interactive lecture materials, collaborative in-class exercises, and self-directed out-of-class assignments. The strategies presented should not only assist instructors in teaching a moreactive and effective introductory accounting course, but also offer the benefits of stimulating andincreasing student interest in accounting as a major.
INTRODUCTION
Principles of accounting courses present multiple challenges for instructors such as lowstudent motivation, attendance, participation, and knowledge retention, and high student anxiety andwithdrawal rates. In addition, the course material is very extensive and technical in nature, and oftenthe instructor has difficulty in covering all the material they would like to cover during the semester.In order to combat these challenges, studies conducted by the Accounting Education ChangeCommission (1990; 1992) and the American Accounting Association (1995) strongly promote theuse of active learning strategies in accounting courses.
Active learning is a pedagogical approach in which students do not passively acquireknowledge, but instead are actively involved and engaged in the learning process. Advocates ofactive learning suggest that it benefits students by promoting greater interest in the subject material,enhancing intrinsic learning satisfaction, increasing understanding and retention of course material,developing the desire and ability to become lifelong learners, and improving communication,interpersonal, problem solving, analytical thinking, and critical thinking skills.
The purpose of this paper is to present active learning strategies that we have incorporatedinto our principles of financial accounting course. Currently we employ active learning strategiesin our lectures and course assignments. The strategies we employ are relatively short and simple.However, we believe their use has enhanced student learning by creating a more interactiveclassroom environment, and by increasing students’ interest, motivation, attendance, andparticipation. At the same time, the use of active learning strategies has not prevented us from

88
Academy of Educational Leadership Journal, Volume 12, Number 2, 2008
covering the prescribed course material, but has in fact enabled us to cover additional material thatwe were unable to adequately cover before.
IN-CLASS STRATEGIES
Instead of providing no lecture notes or a complete set of lecture notes to students, weprovide them with what are often referred to as guided notes. Specifically, prior to each lecture wepost on the course webpage partially completed lecture notes that students are required to print andbring to class. During class, students complete or fill in the “missing pieces” such as key terms,concepts and formulas for that topic.
We have found multiple advantages to this strategy. First, by providing a partial set oflecture notes we are able to cover more material and do so more efficiently since students are notrequired to copy the entire set of lecture notes during class. This strategy also allows students toconcentrate more on what the instructor is saying and often results in questions during the lecturethat are more relevant and insightful. In addition, the use of guided notes promotes regular studentattendance since students need to attend lectures in order to complete the lecture notes.Furthermore, this strategy facilitates greater student interest and engagement in the class. Requiringthem to complete the lectures notes increases student attention during the lecture, and highlights andreinforces important information in the lecture. Finally, the missing elements of the course notesoften prompt increased student responses and participation. We rely heavily on students’ responsesin filling in the missing pieces and often create additional discussion by asking why other terms,phrases, formulas, etc. would not be correct.
During a lecture, many instructors notice that it is oftentimes difficult to maintain students’interest and attention for the duration of the class meeting. In response to this concern, anotherstrategy we utilize is to “bookend” the lecture. This involves breaking the lecture down intosegments of approximately 15 minutes in length. In between these segments, we incorporate severalactive learning strategies to enhance the students’ learning process. These strategies allow studentsto contribute actively to their knowledge and understanding of the course material.
One technique we use is the “pause procedure.” We allow the students to look over their justcompleted lecture notes for approximately two minutes in order revise their notes, compare whatthey have with their neighbors, and formulate questions. During this time, we walk around theclassroom answering questions and facilitating discussions between students. This exercise givesstudents time to clarify, reflect upon, and assimilate what they have just heard and written, and oftenresults in more in-depth questions and class discussions.
Other learning tools we use during this break are quantitative examples, mini-quizzes, andprobing or motivating questions. The quantitative examples are often from the homework in thetextbook and relate directly to the material we have just covered. We typically give the students

89
Academy of Educational Leadership Journal, Volume 12, Number 2, 2008
partial solutions to the examples, similar to our strategy with the lecture notes, in order to increaseefficiency, improve attention, and encourage participation.
The short mini-quizzes can be graded or non-graded, and usually consist of two to threetrue/false and/or multiple-choice questions that ask students knowledge- and comprehension-basedquestions. The quizzes encourage students to efficiently and effectively use the “pause time” toclarify their understanding of the material just covered.
The probing/motivating questions typically are conceptual in nature and ask the students tomake a prediction, relate the material to a previous topic we have discussed, or give real-worldexamples of the concepts presented.
For the mini-quizzes and probing/motivating questions, we use a think-pair-share strategy.Students first spend a minute or two reflecting on and writing their answers to the questions. Thenthey turn to one or two of their neighbors and spend a couple minutes sharing and comparing theiranswers. After they have shared their answers, individual students are called on randomly or theclass is surveyed for their answers and asked how they reached their conclusion and whether theyconsidered other alternatives, resulting in further class discussion.
There are several benefits to the think-pair-share strategy. First, it gives students time tocarefully think about and formulate their answers or opinions. Also, having them write down theirresponses makes students less passive, and encourages them to be more focused and precise in theiranswers. Furthermore, it requires students to be responsible for carefully listening to theirneighbors’ answers and opinions, sharing what they have written, and reaching a consensus. Byworking together, students teach and explain material to one another, create a spirit of cooperationand interdependence, and develop a personal responsibility for their learning and the learning ofothers. Also, the subject matter is more likely to be learned and reinforced by group interactions,and as a result, students often enhance their current level of knowledge and interpersonal skills. Thefamiliarity students develop with one another can facilitate their formation of study groups outsideof class and in other classes that they share. Finally, students have an opportunity to articulate theiranswers or opinions to the rest of the class and receive immediate feedback, and instructors areprovided with feedback about student comprehension of the material being presented.
Bookending the lecture and incorporating the above active learning strategies in between thelecture segments benefits students by increasing their attention, by encouraging participation, andby providing them with immediate feedback on whether they understand the information presented.As a result, their retention of course material is facilitated and the development of their thinking andcommunication skills is enhanced. Instructors act primarily as facilitators in the students’ learningprocess instead of merely “transmitters” of information. Instructors also realize immediate benefitsby using the feedback students provide in the class discussions to assess, modify, and refine existinglecture notes, questions, and strategies.
At the end of each class, we give the students two to three minutes to complete a “minutepaper.” Students first reflect on and assess their understanding of the day’s material. Next, they

90
Academy of Educational Leadership Journal, Volume 12, Number 2, 2008
respond in writing to the following questions: (1) What was the most important or usefulinformation you learned in class today? (2) What unanswered questions do you have and/or whatinformation is still unclear or confusing? After reviewing the minute papers, we take a few minutesat the beginning of the next class to address topics, specific questions, and/or concerns listed by asignificant number of the students. For those items not discussed, we actively encourage studentsto see us after class or during office hours.
We have found that the use of minute papers facilitates the assessment of student learningand promotes continuous course improvement, but is not extremely time consuming. Minute paperspermit us to gather immediate feedback from the students, and encourage and provide students witha simple and direct means of expressing their thoughts, concerns, and questions about the class.
We have also found it interesting and insightful to compare minute paper responses atvarious points during the semester. Initially, students typically respond that they have no questionsor concerns, usually for the sake of expediency. However, by taking time each class to addressquestions and concerns raised from the previous class, not only does the amount of tangibleresponses increase, but the overall quality of responses improves by giving students the opportunityto hear what questions and concerns were raised by their classmates.
OUT-OF-CLASS STRATEGIES
We also use active learning strategies in our assignments. Three out-of-class assignmentswe use are attendance at business student organization meetings, article summaries, and review ofannual reports. These assignments allow the instructor to use instructional resources and strategiesbeyond the classroom, which frees up critical class time. Students explore material that is oftenquite different, more realistic, and frequently more interesting than material covered in class. Theseassignments stimulate interest in the subject matter by demonstrating the relevance of the coursematerial to the “real world.” As a result, students begin to appreciate and develop independentlearning and lifelong learning skills.
In their 2003 monograph, PricewaterhouseCoopers (PWC) emphasized the need for entry-level accountants to understand what it means to be a member of the accounting profession. Theynote that students often fail to fully appreciate or even comprehend the roles and responsibilitiesthey will encounter during their careers. We address this concern as it applies to all students,regardless of their intended major, by requiring our students to attend two business studentorganization meetings where there is a presentation by an outside professional. Students are givena choice as to which presentation they would like to attend, subject to instructor approval, in orderto increase their interest and satisfaction in the presentation. After attending the presentation,students are required to write a short summary of the presentation, including what they learned fromthe presentation and how they would apply it to their professional career. Along with the summary,they submit a form listing their name, date of meeting, student organization, speaker (or

91
Academy of Educational Leadership Journal, Volume 12, Number 2, 2008
firm/company name), and presentation topic. The form is signed by the faculty advisor or a studentofficer at the end of the meeting. By attending these meetings and presentations students developa better understanding of what it means to be a professional through listening, meeting, and talkingto outside professionals. They learn about current issues and events that are impacting professionals,further develop and refine their interpersonal, networking, and communication skills, and learn aboutcareer paths in their intended profession. For those students that become actively involved in astudent organization, anecdotal evidence suggests that they become more motivated, thoughtful, andcommitted learners in the classroom.
Another out-of-class assignment we use is article summaries. Students are given a list oflevel-appropriate articles they can read from student-oriented (e.g., New Accountant) and profession-oriented (e.g., The CPA Journal and Journal of Accountancy) journals. Over the course of thesemester, students are required to read five articles. After reading an article, students write a 1 – 1½ page summary of the article. As part of the assignment, they are asked to indicate what theyfound particularly interesting about the article; any information in the article they found confusingor ambiguous; any additional information they would have liked included in the article; the mainarguments and evidence provided by the author(s); whether they agreed or disagreed with theauthor’s or authors’ conclusion or suggestions; and how they would apply any information learnedto their academic and/or professional careers. Similar to the business student organization meetingassignment, students choose, from a list provided by the instructor, which articles they read in orderto stimulate their interest and satisfaction. Reading the articles allows the students to explore currentevents and issues affecting accounting students and accountants (e.g., ethical issues), discover newideas, and exercise comprehensive thinking. It also diminishes many of the stereotypes studentshave about the accounting profession, often resulting in an increased interest in majoring inaccounting. The written summary emphasizes concise, to-the-point writing, which is a necessaryskill in business writing, but is not always an objective of written assignments in other academicdisciplines. In this assignment, students engage in analytical and synthetic activity, and learn thatin business there is not always a right or a wrong answer, or even an answer at all.
The final strategy we employ primarily utilizes out-of-class work, with some in-class groupwork. Students are first required to review a corporate annual report, which has been assigned bythe instructor, and individually answer questions based on that annual report. The company theinstructor chooses should be one that students know and with which they can identify. Theassignment consists of three problem sets with the first one covering general information in theannual report (e.g., products, geographic locations, board of directors, officers, and various lettersand reports). The second set of questions addresses the financial statements and the notes to thefinancial statements. The last set requires computation of financial ratios and ratio analyses. Afterstudents have had a chance to answer the questions at home, class time is allocated for group workso students can compare answers and, more importantly, discuss where they located the informationand how they reached their answer. Several methods are used to discourage any “free riders” and

92
Academy of Educational Leadership Journal, Volume 12, Number 2, 2008
ensure students are learning the information. First, groups are kept small (approximately threestudents) to maximize participation, and help create a sense of interdependence and accountability.Students are also required to submit a copy of their solutions before and after they have met withtheir group. In addition, the instructor walks around the classroom to observe the groups’ progressand level of participation, to keep the groups on task and focused, and to answer any questions.Finally, selected pages from another company’s annual report and similar questions are included onthe final exam. Several benefits are derived from the annual report assignments in addition to theones already addressed in the previous discussion of in-class assignments and group work. First,students are exposed to real-life examples of accounting information and applications. This oftenresults in an increased interest and appreciation of the accounting function, which thereby helpspromote accounting as a major. Second, it enhances intellectual skills, including the ability tolocate, obtain, and organize information. Third, it allows students to learn by doing and helpspromote independent learning. Finally, it allows instructors to provide a sense of realism in theircourse, and it saves valuable class time by letting the students explore the annual report outside ofclass, with only minimal class time used for group work.
CONCLUSION
This paper has discussed active learning strategies that the authors utilize in their principlesof financial accounting course. The strategies presented can be used in small- or large-sized classes,and are also appropriate, with some revisions in type and level of assignments, for upper-levelaccounting courses. One key to implementing these strategies is to keep them simple. Start smalland try not to overload your students with too many activities. Begin with strategies andassignments that are of short duration and structured, and ones with which you feel comfortable.As you and your students gain confidence and experience, longer and more involved strategies andassignments can be introduced. We have found that the use of the active learning strategiesdiscussed in this paper promotes a supportive classroom environment, both intellectually andemotionally, by increasing student interest, participation, satisfaction, and knowledge in accounting,and by developing the desire and ability in students to become independent and lifelong learners.
REFERENCES
Accounting Education Change Commission (September, 1990). Position Statement Number One: Objectives ofEducation for Accountants. Sarasota, FL: American Accounting Association. Retrieved October 22, 2007,from http://aaahq.org/aecc/PositionsandIssues/pos1.htm
Accounting Education Change Commission (June, 1992). Position Statement Number Two: The First Course inAccounting. Sarasota, FL: American Accounting Association. Retrieved October 22, 2007, fromhttp://aaahq.org/aecc/PositionsandIssues/pos2.htm
93
Academy of Educational Leadership Journal, Volume 12, Number 2, 2008
Francis, M.C., T.C. Mulder, & J.S. Stark (April, 1995). Intentional Learning: A Process for Learning to Learn in theAccounting Curriculum. Sarasota, FL: American Accounting Association. Retrieved October 22, 2007, fromhttp://aaahq.org/aecc/intent/cover.htm
PricewaterhouseCoopers LLP (March, 2003). Educating for the Public Trust: The PricewaterhouseCoopers Positionon Accounting Education. New York, NY: PricewaterhouseCoopers LLP. Retrieved October 22, 2007, fromhttp://www.pwc.com/Extweb/pwcpublications.nsf/docid/FCCEF4ED720B6381852571BD007B9038/$File/educatingfortrust.pdf

94
Academy of Educational Leadership Journal, Volume 12, Number 2, 2008

95
Academy of Educational Leadership Journal, Volume 12, Number 2, 2008
STRUCTURAL CHANGE IN THE CPCU CURRICULUMAND ITS EFFECT ON THE COMPLETION TIME
Askar Choudhury, Illinois State UniversityJames R. Jones, Illinois State University
Jinadasa Gamage, Illinois State UniversityKrzysztof Ostaszewski, Illinois State University
ABSTRACT
This study investigates the impact of structural change of CPCU program’s curriculum oncandidates (students) completion time. The CPCU professional certification is the most recognizedsystem in the area of property/casualty insurance, which provides a comprehensive, integrated, skilland knowledge set in all areas of property/casualty insurance. American Institute for CPCU haschanged their curriculum program in 2003; first, they have deleted two redundant courses from theprogram, second, provided students with two different options to choose from on elective courses.Data collected for this study include 1782 candidates who completed their program beginning 1999to 2006. After controlling for age, gender, and education level, we find that structural change in2003 is instrumental in shortening the length of program completion time. Results indicate that thepredictive power of structural change in the curriculum to be contingent on the level of educationand gender. Candidates with higher level of education, as measured by their highest degree earned,achieved significantly better performance. Findings of this study have important implications oncurriculum change for any certification or degree program. Despite the differences amongcandidates education level, academic performance is impacted by structural change in the programcurriculum. The relationship between gender-based increases in candidate’s academic performanceappears significant in this study. These findings are consistent with the hypothesis that efficientcurriculum structure combined with education level enhances the shortening process of programcompletion time.
INTRODUCTION
The system of CPCU (Chartered Property and Casualty Underwriter) professionalexaminations and certification is the most recognized system in the area of property/casualtyinsurance, which provides comprehensive integrated, skill and knowledge set in all areas ofproperty/casualty insurance. As with professional designations in other fields, such as the CPA inaccounting, the CPCU is awarded to individuals willing to go beyond the normal requirements oftheir profession. The American Institute for Chartered Property and Casualty Underwriters
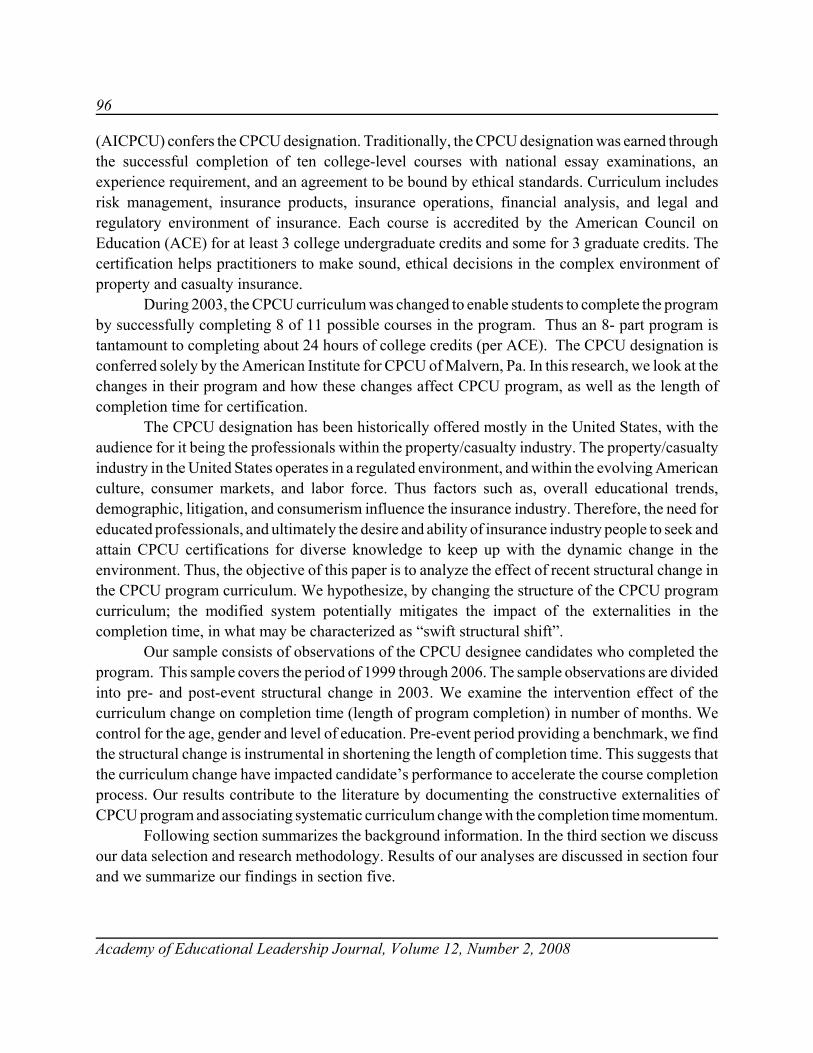
96
Academy of Educational Leadership Journal, Volume 12, Number 2, 2008
(AICPCU) confers the CPCU designation. Traditionally, the CPCU designation was earned throughthe successful completion of ten college-level courses with national essay examinations, anexperience requirement, and an agreement to be bound by ethical standards. Curriculum includesrisk management, insurance products, insurance operations, financial analysis, and legal andregulatory environment of insurance. Each course is accredited by the American Council onEducation (ACE) for at least 3 college undergraduate credits and some for 3 graduate credits. Thecertification helps practitioners to make sound, ethical decisions in the complex environment ofproperty and casualty insurance.
During 2003, the CPCU curriculum was changed to enable students to complete the programby successfully completing 8 of 11 possible courses in the program. Thus an 8- part program istantamount to completing about 24 hours of college credits (per ACE). The CPCU designation isconferred solely by the American Institute for CPCU of Malvern, Pa. In this research, we look at thechanges in their program and how these changes affect CPCU program, as well as the length ofcompletion time for certification.
The CPCU designation has been historically offered mostly in the United States, with theaudience for it being the professionals within the property/casualty industry. The property/casualtyindustry in the United States operates in a regulated environment, and within the evolving Americanculture, consumer markets, and labor force. Thus factors such as, overall educational trends,demographic, litigation, and consumerism influence the insurance industry. Therefore, the need foreducated professionals, and ultimately the desire and ability of insurance industry people to seek andattain CPCU certifications for diverse knowledge to keep up with the dynamic change in theenvironment. Thus, the objective of this paper is to analyze the effect of recent structural change inthe CPCU program curriculum. We hypothesize, by changing the structure of the CPCU programcurriculum; the modified system potentially mitigates the impact of the externalities in thecompletion time, in what may be characterized as “swift structural shift”.
Our sample consists of observations of the CPCU designee candidates who completed theprogram. This sample covers the period of 1999 through 2006. The sample observations are dividedinto pre- and post-event structural change in 2003. We examine the intervention effect of thecurriculum change on completion time (length of program completion) in number of months. Wecontrol for the age, gender and level of education. Pre-event period providing a benchmark, we findthe structural change is instrumental in shortening the length of completion time. This suggests thatthe curriculum change have impacted candidate’s performance to accelerate the course completionprocess. Our results contribute to the literature by documenting the constructive externalities ofCPCU program and associating systematic curriculum change with the completion time momentum.
Following section summarizes the background information. In the third section we discussour data selection and research methodology. Results of our analyses are discussed in section fourand we summarize our findings in section five.

97
Academy of Educational Leadership Journal, Volume 12, Number 2, 2008
BACKGROUND
The number of industry designations has continued to grow. Although these otherdesignations may not compete directly against CPCU in terms of curriculum offered, they maycompete in terms of time. According to the 2007 Society of Insurance Trainers and EducatorsDesignation Handbook, there are over 200 designations and certifications. U.S. Department ofEducation reported that over 125,000 people earned MBAs in 2005. Even though the number ofbusiness schools has increased by 10 percent according to the Department of Education, the growthrate of part-time students has been the most dramatic with 62 percent of schools reporting increasesin enrollment and 20 percent reporting significant increases in part-time MBAs. The average agefor part-time MBA enrollees is 31 years, which competes squarely with the market of prospectivestudents enrolling in CPCU, which also had an average age of 31 for enrollment in CPCU over theperiod studied. Because the CPCU curriculum is a broad-based curriculum, focusing on all aspectsof the industry including financial acumen, some courses are significantly quantitative. This maypose a problem to many students. The second half of the 20th century witnessed a trend of decliningstandards and quality in quantitative education in the U.S. Employers compete for a shrinking poolof talent of quantitative professionals, who can combine mathematical knowledge with practicalapplications. The effect of this trend is that a growing number of students may find the quantitative-oriented CPCU courses more challenging and therefore increase their completion time. This couldalso potentially affect the desire to enroll in or the ability to complete the CPCU program.
Exhibit 1: CPCU -- Old Program Structure.
Foundations of Risk Management and Insurance
Personal Lines Insurance Coverage
Commercial Property Risk and Insurance
Commercial Liability Risk and Insurance
Insurance Company Operations
The Legal Environment of Insurance
Management
Accounting and Finance in Insurance
Economics
Insurance Ethics and Professionalism
The American Institute for CPCU cited several reasons for changing the curriculum. First,many of the students specialized and/or worked for companies that specialized in personal lines orcommercial lines insurance. Enabling students to choose concentrations in their preferred area and

98
Academy of Educational Leadership Journal, Volume 12, Number 2, 2008
then taking a survey course on the other lines was seen as more practical and relevant. This shouldgenerate interests among candidates to complete the program on an accelerated manner. In addition,courses from the old curriculum such as Management and Economics were deleted. The primaryreason is that nearly 85 percent of CPCU matriculates had already taken similar course in theirundergraduate or graduate degree program. This also enables the program to dovetail better withpart-time MBA programs in which a growing number of professionals are enrolled. The growth inpart-time MBA programs is probably the most significant competition for the time and resourcesof existing and prospective CPCU students.
Allowing students to take courses on additional topics was viewed as more relevant andsupportive to the students. A new course on Financial Institutions was added to reflect theconvergence of the financial services industry and the need for students to better understand otherfinancial service products and operations in order to advance in their careers. Finally, the Institutebelieved that reducing the number of courses required from 10 to 8 would reduce “completion time”by several months. According to an internal survey conducted by AICPCU in 2001, “Time toComplete” was cited as the number one obstacle by students as reasons not to be able to completeCPCU certification program. The pressure on students to enroll in the CPCU program is always achallenge both with respect to money and time. Therefore, a structural transformation in the CPCUprogram can assist to alleviate these impediments.
Exhibit 2: CPCU -- New Program Structure.Five foundation courses:
Foundations of Risk Management, Insurance, and Professionalism
Insurance Operations, Regulation, and Statutory Accounting
The Legal Environment of Insurance
Finance for Risk Management and Insurance Professionals
Financial Services Institutions
Students can choose between (A or B) personal or commercial concentration.
A. Commercial Concentration (with personal survey)
Commercial Property Risk Management and Insurance
Commercial Liability Risk Management and Insurance
Survey of Personal Risk Management, Insurance, and Financial Planning
B. Personal Concentration (with commercial survey)
Personal Risk Management and Property-Liability Insurance
Personal Financial Planning
Survey of Commercial Risk Management and Insurance

99
Academy of Educational Leadership Journal, Volume 12, Number 2, 2008
DATA AND METHODOLOGY
The sample period is an eight year window with 1782 completed (i.e., number of candidateswho completed the program) candidates’ complete record of data. The event date, 2003, is the datewhen the structural change in the CPCU program went into effect. During this year they changedtheir regular ten course program into a more condensed 8 course program, which includes insurancerelated subject matters that are both at the undergraduate and graduate level. Revised program isequivalent to completing about 24 hours of college course credits and also has options betweenpersonal lines or commercial lines insurance. This has provided prospective candidates an incentiveto enroll into the program and accelerate the completion time. Such major change in the curriculumprocedure could impact the CPCU program and its affiliated CPCU Society greatly. To test theeffect of this event on candidates’ completion time (length of program completion), we divided oursample into two periods: the pre-event period -- January 1999 through December 2002 and the post-event period includes January 2003 through December 2006. Researchers in other studies exploredand tested this very important characteristic of intervention on both cross-section and longitudinaldata; see Choudhury (2007) for an intervention analysis of a tax reform act on a longitudinal data.
Table-1A and Table-1B presents summary statistics for the pre- and post-eventperiods. A multiple regression analysis was applied to assess the significance of structural changein the CPCU program. Structural change variable is created as a dummy variable to asses the impactof the program change in 2003. In addition to the primary independent variable, program change,the analysis also included three other independent variables: gender, age, and level of education.Gender is a binary variable and coded 1 for male and 0 for female. A number of prior studies haveinvestigated the impact of gender as a predictor of academic performance. Two earlier studies foundthat female students performed better than males in accounting area (Mutchler, Turner, & Williams,1987; Lipe, 1989), while others found males outperforming females in finance (Borde, Byrd, &Modani, 1996) and Economics (Dale & Crawford, 2000; Heath, 1989). Several studies in computerarena found that, compared to male, females tend to display lower computer aptitude (Rozell &Gardner, 1999; Smith & Necessary, 1996; Williams, Ogletree, Woodburn, & Raffeld, 1993) andhigher level of apprehension (Anderson, 1996; Bozionelos1996; Igbaria & Chakrabarti 1990). Otherstudies, such as Zeegers (2001), however, could not find any differences between male and femalelearning behavior. Because the present study focuses on candidates’ performance in terms ofcompletion time, we include gender in the research model so its effect can also be explored andcontrolled to observe other factors effect.
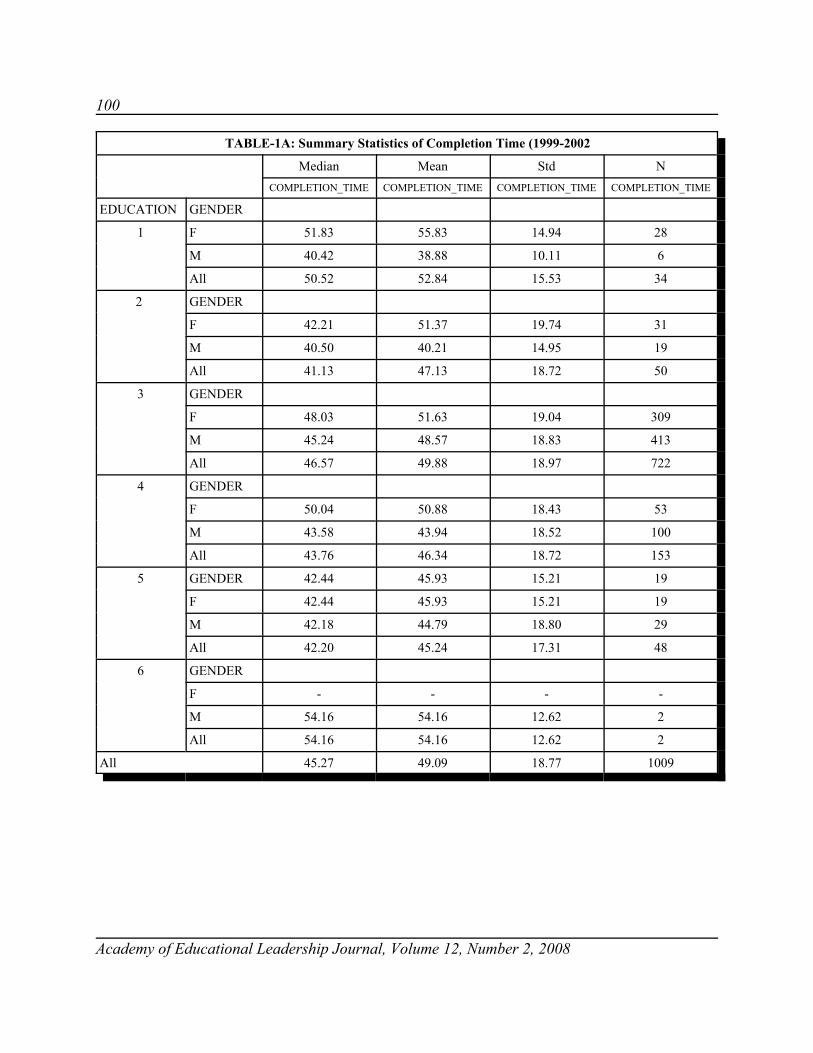
100
Academy of Educational Leadership Journal, Volume 12, Number 2, 2008
TABLE-1A: Summary Statistics of Completion Time (1999-2002
Median Mean Std NCOMPLETION_TIME COMPLETION_TIME COMPLETION_TIME COMPLETION_TIME
EDUCATION GENDER
1 F 51.83 55.83 14.94 28
M 40.42 38.88 10.11 6
All 50.52 52.84 15.53 34
2 GENDER
F 42.21 51.37 19.74 31
M 40.50 40.21 14.95 19
All 41.13 47.13 18.72 50
3 GENDER
F 48.03 51.63 19.04 309
M 45.24 48.57 18.83 413
All 46.57 49.88 18.97 722
4 GENDER
F 50.04 50.88 18.43 53
M 43.58 43.94 18.52 100
All 43.76 46.34 18.72 153
5 GENDER 42.44 45.93 15.21 19
F 42.44 45.93 15.21 19
M 42.18 44.79 18.80 29
All 42.20 45.24 17.31 48
6 GENDER
F - - - -
M 54.16 54.16 12.62 2
All 54.16 54.16 12.62 2
All 45.27 49.09 18.77 1009

101
Academy of Educational Leadership Journal, Volume 12, Number 2, 2008
TABLE-1B: Summary Statistics of Completion Time (2003-2006)
Median Mean Std NCOMPLETION_TIME COMPLETION_TIME COMPLETION_TIME COMPLETION_TIME
EDUCATION GENDER
1 F 24.79 27.19 9.62 6
M 32.02 28.14 7.49 6
All 27.80 27.67 8.24 12
2 GENDER
F 36.31 34.60 5.78 8
M 22.45 22.30 6.39 7
All 28.11 28.86 8.63 15
3 GENDER
F 28.70 29.01 8.70 144
M 27.62 26.85 8.95 233
All 28.01 27.67 8.90 377
4 GENDER
F 25.15 24.35 8.53 43
M 21.60 22.46 9.86 91
All 22.54 23.07 9.47 134
5 GENDER
F 21.73 23.46 8.53 9
M 18.58 20.99 9.75 15
All 20.84 21.91 9.21 24
6 GENDER
F 7.23 7.23 . 1
M 32.22 28.13 12.74 6
All 30.81 25.14 14.05 7
All 26.56 26.35 9.32 569
To test the relationship between completion time and change in the program we perform twoseparate analyses. First, we use correlation analysis (Table 3A) to examine the direction of theassociation between variables and also to observe whether the program change exhibits anystructural change. Second, we regress the completion time (number of months) on the age (AGE),

102
Academy of Educational Leadership Journal, Volume 12, Number 2, 2008
gender (GENDER), education level (EDUCATION), and structural change in the program(PRGM_CHANGE). Completion time is calculated as number of months taken to complete thecertification program. Therefore, the difference between the first examination date and the date ofcompletion of the program is termed as completion time. Age is a continuous independent variable.In general, it is assumed that there is a difference between younger and older people in their learningprocess. These differences may relate to candidates’ job position, the larger amount of lifeexperience with motivation that they bring with them to a learning environment.
Numerous studies have found GPA to be significantly correlated with student performancein accounting (Doran, Bouillon, & Smith, 1991; Eskew & Faley, 1988; Jenkins, 1998), marketing(Borde, 1998), and economics (Bellico, 1974; Cohn, 1972; Dale & Crawford, 2000). However,because the level of education (highest degree earned) differs greatly among candidates in this studyand their performance on completion time may be influenced due to the level of education, wetherefore include education level as an independent variable instead of GPA. Vermunt (2005)observed that, education and learning patterns influence student’s academic performance. In ourstudy, education is an ordinal (hierarchical) categorical variable and therefore, kept in its originalformat (similar to Likert-Scale) ranging from high school diploma to doctorate, rather than codinginto a set of indicator variables (note that, statistical significance remains comparable irrespectiveof type of coding of this factor). This factor will control for the level of background knowledge toisolate and test for candidates’ performance in completion time due to structural change. The natureof academic discipline and education level is supposed to influence peoples thinking strategies towhich academic performance may depend on.
Thus, a multiple regression model was run using SAS software (see, SAS/STAT User'sGuide, 1993) on four different independent variables; age, gender, education, and program change.Program change is to measure the recent structural change in the CPCU program. This measure isdesigned to test the hypothesis of structural change (pre and post) in view of candidates’performance. Therefore, the specification of the regression model is of the following form:
Where:
Completion_Time: Length of time needed to complete.Age: Age of a candidate.Gender: Male=1, Female=0.Education (Level of Education):
High School=1, Associate=2, Bachelor=3, Masters=4, Law=5, Doctorate=6.Prgm_Change: On or after 2003 = 1, before 2003 = 0.
Multiple regression is often appropriate for continuous and/or categorical predictive variable(X) with a continuous response (Y). It uses method of least squares or a method of maximum
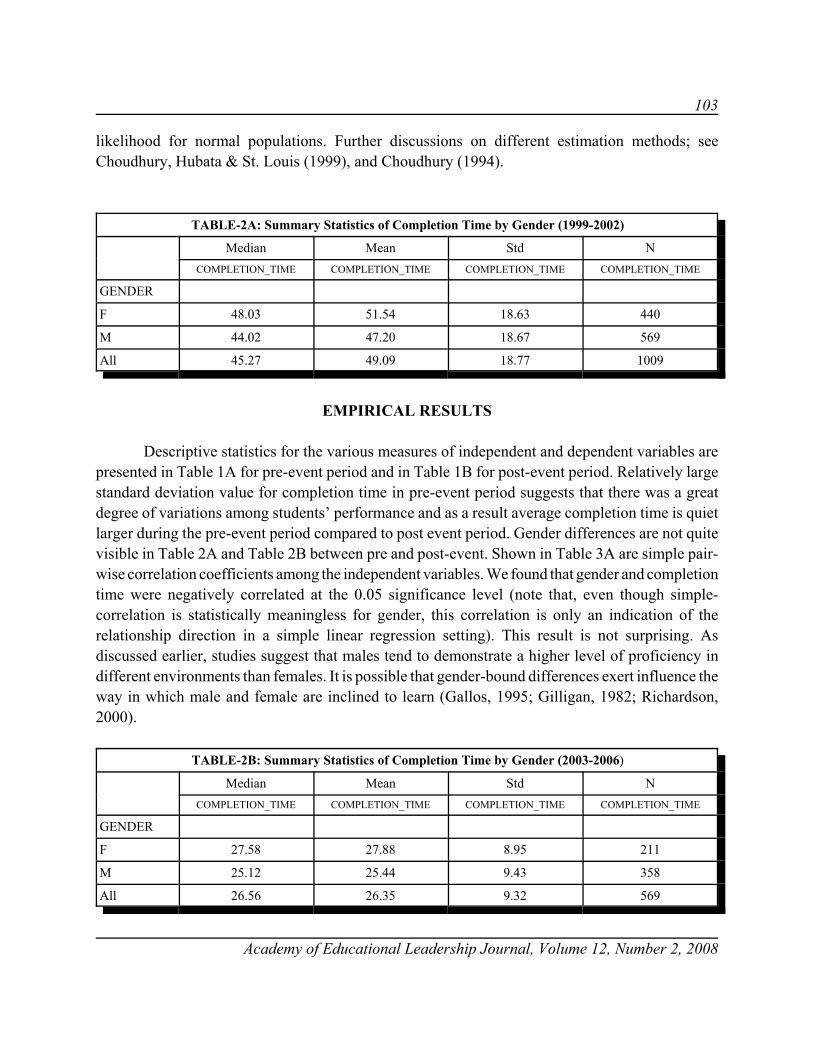
103
Academy of Educational Leadership Journal, Volume 12, Number 2, 2008
likelihood for normal populations. Further discussions on different estimation methods; seeChoudhury, Hubata & St. Louis (1999), and Choudhury (1994).
TABLE-2A: Summary Statistics of Completion Time by Gender (1999-2002)
Median Mean Std NCOMPLETION_TIME COMPLETION_TIME COMPLETION_TIME COMPLETION_TIME
GENDER
F 48.03 51.54 18.63 440
M 44.02 47.20 18.67 569
All 45.27 49.09 18.77 1009
EMPIRICAL RESULTS
Descriptive statistics for the various measures of independent and dependent variables arepresented in Table 1A for pre-event period and in Table 1B for post-event period. Relatively largestandard deviation value for completion time in pre-event period suggests that there was a greatdegree of variations among students’ performance and as a result average completion time is quietlarger during the pre-event period compared to post event period. Gender differences are not quitevisible in Table 2A and Table 2B between pre and post-event. Shown in Table 3A are simple pair-wise correlation coefficients among the independent variables. We found that gender and completiontime were negatively correlated at the 0.05 significance level (note that, even though simple-correlation is statistically meaningless for gender, this correlation is only an indication of therelationship direction in a simple linear regression setting). This result is not surprising. Asdiscussed earlier, studies suggest that males tend to demonstrate a higher level of proficiency indifferent environments than females. It is possible that gender-bound differences exert influence theway in which male and female are inclined to learn (Gallos, 1995; Gilligan, 1982; Richardson,2000).
TABLE-2B: Summary Statistics of Completion Time by Gender (2003-2006)
Median Mean Std NCOMPLETION_TIME COMPLETION_TIME COMPLETION_TIME COMPLETION_TIME
GENDER
F 27.58 27.88 8.95 211
M 25.12 25.44 9.43 358
All 26.56 26.35 9.32 569

104
Academy of Educational Leadership Journal, Volume 12, Number 2, 2008
We also found education and completion time to be negatively correlated; this is consistentwith the expectation that high-achieving students make greater efforts in acquiring the necessaryknowledge and skills; as a result they may be more competitive. The correlations found in Table 3Ado not pose a serious multicollinearity threat. Most of the correlation coefficients amongindependent variables are relatively small in magnitude.
TABLE-3A: Correlation Analysis (1999-2006)
Pearson Correlation CoefficientsProb > |r| under H0: Rho=0
COMPLETION_TIME PRGM_CHANGE AGE GENDER EDUCATION
COMPLETION_TIME 1.00000 -0.57858<.0001
-0.028760.2258
-0.14852<.0001
-0.19816<.0001
PRGM_CHANGE -0.57858<.0001
1.00000 -0.004500.8497
0.070550.0030
0.24103<.0001
AGE -0.028760.2258
-0.004500.8497
1.00000 0.014690.5377
0.078240.0010
GENDER -0.14852<.0001
0.070550.0030
0.014690.5377
1.00000 0.087090.0002
EDUCATION -0.19816<.0001
0.24103<.0001
0.078240.0010
0.087090.0002
1.00000
Note: PRGM_CHANGE – represents the structural change in the curriculum of CPCU program
In Table 3B, we report the results of the regression analysis. The proposed model appearedto fit well in estimating performance as a result of completion time. Reported coefficients ofdetermination (R2) is 0.35, while F value is 236.33, at a significance level <0.0001. Results indicatethat structural change is a significant (p-value <0.0001) predictor of student’s performance asmeasured by completion time. Therefore, the program curriculum change in 2003 resulted inshortening candidates’ completion time by 1.83 years (21.97 months) on average after controllingfor demographic factors. Age is not statistically significant. Therefore, there was no evidence tosupport that age influences candidate’s performance. Although, level of education is statisticallysignificant but the magnitude of the coefficient does not contribute much to the curbing ofcompletion time. Finally, we found gender to be a significant factor on completion time. This resultprovides support for the hypothesis that candidates’ gender may contribute to a four month curbingof completion time for males. A number of possible explanations exist for this difference.
One explanation relates to differences in learning styles. Severiens and Ten Dam (1997)observe that males scored higher than female on undirected learning. The CPCU is primarily a self-study program. Nearly two-thirds of the students reported that they self-study. Although self-study

105
Academy of Educational Leadership Journal, Volume 12, Number 2, 2008
could potentially be directed, it may be less directed than other educational alternatives. Contrastthe CPCU program to MBA programs that provide instructor-led learning and directed grouplearning. The perceived self-efficacy may be higher for women in these more directed learningenvironments as one study indicates that in group work females perceive that they contribute morethan their male counterparts (Kaenzig, Anderson and Lynn, 2006).
Competing educational alternatives may also explain the difference. In 2001, the numberof females surpassed the number of males earning a bachelor’s degree in business (see, U.S. Dept.of Ed., National Center for Education Statistics, Earned Degrees Conferred). Women earning abachelor’s in business may find the MBA education as a superior educational alternative forattaining professional credentials than a CPCU designation. In fact, 51 percent of schools offeringMBA stated that they had special outreach efforts for females and in 2006 public universities sawa 55 percent increase in female applicants for MBA programs (GMAC 2006). Thus women who mayhave started their CPCU program may ultimately find that an MBA offers greater utility and bettersuitability to their learning style. Concurrent enrollment in MBA or other educational alternativeswith greater perceived utility may contribute to augmenting the time for females to complete theCPCU designation.
Finally, a more traditional explanation of competing time demands for women compared tomen, could also account for the difference. Considering that the average age of a CPCU enrollee is31, competing time for family care could be a factor and gender differences in time spent on familycare is well-documented. On weekdays, among adults living in households with children under 18,women spent 115 minutes each day performing childcare activities; by contrast, men spent 49minutes. On weekends, women spent 78 minutes each day on childcare while men provided about52 minutes. This amounts to annual difference of nearly 80 hours a year, the approximate amountof time to study for one CPCU exam. Furthermore the differences are even greater when consideringsecondary childcare activities such as housekeeping and purchasing goods and services for children(BLS 2006).
TABLE-3B: Regression Results on Completion Time (1999-2006)
Analysis of Variance
Source DFSum ofSquares
MeanSquare F Value Pr > F
Model 4 228245 57061 236.33 <.0001
Error 1758 424470 241.45046
Corrected Total 1762 652715
R-Square 0.3497 Adj R-Sq 0.3482

106
Academy of Educational Leadership Journal, Volume 12, Number 2, 2008
Each of the above possible explanations suggests strategies for the American Institute forCPCU for addressing gender differences including facilitating more directed and group learning,special marketing efforts to females, especially those with bachelor degrees in business, developingflexible exam and online learning formats. Also, facilitating improved expectation settings forfamily members of women enrolled in CPCU education.
CONCLUSIONS
In this study, we examine the performance impact of CPCU candidates’ due to the structuralchange in the program. Results of multiple regression analysis found the predictive power ofstructural change in the program curriculum to be dependent on the level of education and gender.As expected, candidates with a higher level of education, as measured by their highest degreeearned, achieved significantly better performance.
Findings from this study have important implications on curriculum change for anycertification program. Despite the differences among candidates education level, their academicperformance is impacted by the curriculum change. The relationship between gender-based increasesin candidate’s academic performance appears significant in this study. This predictive power ofgender on performance may not depend on whether and how much level of education is attained bythe candidate. Rather, it probably depends on which professional and personal lives environmentthey exist. These findings are consistent with the hypothesis that efficient curriculum structurecombined with education level generates a motivational environment for shortening the completiontime. Therefore, the results of this study indicate that the structural modification in the program haveimpacted and motivated candidates to accelerate their completion process.
REFERENCES
Anderson, A.A. (1996). Predictors of computer anxiety and performance in information Systems. Computers in HumanBehavior, (12)1, 61-77.
Bagamery, B.D., J.J. Lasik & D.R. Nixon (2005). Determinants of Success on the ETS Business Major Field Exam forStudents in an Undergrduate Multisite Regional University Business Program. Journal of Education forBusiness, 81(1), 55-63.
Bellico, R. (1974). Student attitudes and undergraduate achievement for economics majors. Journal of EconomicEducation, (5)2, 67-68.
Borde, S.F. (1998). Predictors of student academic performance in the introductory marketing course. Journal ofEducation for Business, 73(5), 302-306.
Borde, S.F., A.K. Byrd & N.K. Modani (1996). Determinants of student performance in introductory corporate financecourses, Presented at the Southern Finance Association Annual Meeting, Key West, Florida.
107
Academy of Educational Leadership Journal, Volume 12, Number 2, 2008
Bozionelos, N. (1996). Psychology of computer use: XXXIX. Prevalence of computer anxiety in British managers andprofessionals. Psychological Reports (78), 995-1002.
Bureau of Labor Statistics (BLS) of the U.S. Department of Labor (2006). American Time Use Survey-2006 results,USDL 07-0930, pp. 21-22. http://www.bls.gov/tus/
Choudhury, A. (2007). Intervention Impact of Tax Reform Act on the Business Failure Process. Academy of Accountingand Financial Studies Journal, 11(3), 57-68.
Choudhury, A. (1994). Untransformed first observation problem in regression model with moving average process.Communications in Statistics: Theory and Methods, 23(10), 2927-2937.
Choudhury, A., R. Hubata & R. St. Louis (1999). Understanding Time-Series Regression Estimators. The AmericanStatistician, 53(4), 342-348.
Cohn, E. (1972). Students' characteristics and performance in economic statistics. Journal of Economic Education, (3)1,106-111.
Dale, L.R. & J. Crawford (2000). Student Performance Factors in Economics and Economic Education. Journal ofEconomics and Economic Education Research, 1, 45-53.
Doran, B. M., M. L. Bouillon & C. G. Smith (1991). Determinants of student performance in Accounting Principles Iand II. Issues in Accounting Education, (6)1, 74-84.
Eskew, R. K., & R. H. Faley (1988). Some determinants of student performance in the first collegelevel financialaccounting course. The Accounting Review, (63)1, 137-147.
Gallos, J. V. (1995). Gender and silence: implications of women's ways of knowing. College Teaching, 43(3), 101-5.
Gilligan, C. (1982). In a Different Voice: Psychological Theory and Women's Development. Cambridge, MA: HarvardUniversity Press.
GMAC (2006). Application Trends Survey 2006. Graduate Management Admission Council survey,h t t p : / / w w w . g m a c . c o m / N R / r d o n l y r e s / 5 5 3 2 F 6 1 0 - 9 1 8 D - 4 9 8 D - 8 4 3 E -10D9FA20C890/0/AppTrends2006_FINAL.pdf
Heath, J.A. (1989). Factors affecting student learning — An econometric model of the role of gender in economiceducation, Journal of Economic Education, (20)2, 226-230.
Igbaria, M., & Chakrabarti, A. (1990). Computer anxiety and attitudes toward microcomputer use. Behavior andInformation Technology, (9)3, 220-241.
Kaenzig, R., S. H. Anderson, E. G. Lynn (2006). Gender Differences in Students’ Perceptions of Group LearningExperiences. Academy of Educational Leadership Journal, 10(1), 119-127.
108
Academy of Educational Leadership Journal, Volume 12, Number 2, 2008
Lipe, M.G. (1989). Further evidence on the performance of female versus male accounting students. Issues in AccountingEducation, (4)1, 144-152.
Mutchler, J.F., J.H. Turner & D.D. Williams (1987). The performance of female versus male accounting students. Issuesin Accounting Education, (2)1, 103-111.
Richardson, J.T.E. (2000). Researching student learning. Buckingham: SRHE and Open University Press.
Rozell, E.J., & W.L. Gardner (1999). Computer-related success and failure: A longitudinal field study of the factorsinfluencing computer-related Performance. Computers in Human Behavior, (15)1, 1-10.
SAS/STAT User’s Guide. (1993). SAS Institute, Inc, Cary, North Carolina.
Severiens, S. and G.T. Dam (1997). Gender and gender identity differences in learning styles. Educational Psychology,17, 79–93.
Smith, B.N., & J.R. Necessary (1996). Assessing the computer literacy of undergraduate college students. Journal ofEducation, (117)2, 188-193.
Vermunt, J.D. (2005). Relations between Student Learning Patterns and Contextual Factors and Academic Performance.Higher Education,49, 205-234.
Williams, S.W., S.M. Ogletree, W. Woodburn & P. Raffeld (1993). Gender Roles, Computer Attitudes, and DyadicComputer Interaction Performance in College Students. Sex Roles, (29)7-8, 515-525.
Zeegers, P. (2001). Approaches to learning in science: A longitudinal study. British Journal of Educational Psychology,71, 115–132.
109
Academy of Educational Leadership Journal, Volume 12, Number 2, 2008
PREDICTING STUDENTS USAGE OF INTERNET INTWO EMERGING ECONOMIES USING AN EXTENDED
TECHNOLOGY ACCEPTANCE MODEL (TAM)
Khaled A. Alshare, Emporia State UniversityFaisal B. Alkhateeb, United Arab Emirates University
ABSTRACT
This study employed an extended technology acceptance model (TAM) to predict Internetusage in two developing countries (Chile and United Arab Emirates (UAE)). In addition toinvestigating the impacts of perceived ease of use (PEOU), perceived usefulness (PU), andperceived Internet content (PIC) on students’ usage of the Internet, it analyzed the direct impactsof external variables such as gender, educational background, income level, self-reported measureof computer knowledge, Internet cost, and Internet availability on Internet usage and theirmoderating role in the relationship between PEOU, PU, and PIC and Internet usage. To validatethe research model, data was collected from 169 students from Chile and 194 students from UnitedArab Emirates (UAE). The results showed that only PU was a significant predictor of Internet usagefor both Emirates and Chilean samples. Additionally, while gender significantly impacted Emiratesstudents’ usage of Internet, self-reported knowledge about computers significantly impacted Chileanstudents’ usage of Internet. Income level was the only significant moderator for both countries. PUaffected usage of the Internet more positively for students with high income level than it did for thosestudents with low income. Discussion of practical implications of the results was included.
INTRODUCTION
Most studies of the Internet have focused primarily on adoption, e-commerce, and webdesign (e.g., Kim et al., 2005; Park, et al., 2004; Stanfield and Grant 2003; Ranganathan andGrandon 2002; Tan and Teo 1998; Teo and Pian 2004). Little research has been done on studentusage of the Internet (Alshare et al, 2005a). Additionally, the majority of studies on Internet usagein the last decade have been carried out in developed countries. There is a need to understand notonly why technology has or has not been adopted but also to comprehend the impacts of its adoptionby developing countries. The Internet has major impacts upon the ability of developing countriesand citizens to be more effective participants in the emerging global business environment.
The Technology Acceptance Model (TAM), introduced by Davis (1989), is the most popularmodel used in Information Systems (IS) literature to predict the intention or the usage of InformationTechnology (IT). According to the citation index of the Institute for Scientific Information (ISI
110
Academy of Educational Leadership Journal, Volume 12, Number 2, 2008
2005), by September 2005, there were 631 journal citations for the original Davis (1989) article. Inhis model, Davis introduced perceived ease of use and perceived usefulness as the two main factorsthat influence computer usage (e-mail). TAM has been used in predicting intention or usage ofdifferent computer applications primarily in the region of North America (Lapczynski 2004; Pijpers2001). TAM was then extended by incorporating additional factors; see for examples, (Alshare et.al, 2004; Davis et al., 1989; Gefen and Straub 1997; Venkatesh et al. 2003; Venkatesh and Davis2000; and Lucas and Spitler 2000). It is worth mentioning that there were few studies that testedTAM or extended versions outside the region of North America, primarily in developed countries(e.g., Al-Gahtani 2001, Huang et al., 2003; Lai and Wong 2003; Straub et al., 1997). Moreover,fewer studies applied TAM or extended versions to developing countries (e.g., Akour et al. 2006;Elbeltagi et al., 2005; Loch et al., 2003; McCoy et al. 2005; Parboteeah et al., 2005; Rose andStraub, 1998; Zakour 2004).
In this study, we extended the research that was conducted by Alshare et. al (2005a) byincluding more external variables such as Internet cost and Internet availability. Additionally, wetested a modified TAM model outside the region of North American in two developing countries,Chile and the United Arab Emirates (UAE). These two countries represent two emerging economies(The World Competitiveness Yearbook, 2002).
LITERATURE REVIEW OF CONSTRUCTS AND HYPOTHESES
Perceived Ease of Use (PEOU) and Perceived Usefulness (PU)
According to TAM, perceived ease of use refers to the extent to which a person feels thatusing a particular technology would be free of effort. On the other hand, perceived usefulness refersto the extent to which a person believes that using a particular technology would enhance his/herproductivity and effectiveness (Davis 1989). TAM has been utilized in many studies and found thatPEOU and PU were significantly related to computer usage (Adams 2002; Igbaria et al., 1997,Mccloskey (2003-2004); Seyal et. al. 2002; Venkatesh and Davis 2000). Seyal et al. (2002)developed a model to test whether PU, PEOU, and other variables determine Internet usage amongcollege academics. They found that PU and PEOU were significant predictors of technology usage.In this study, we focused on PU and PEOU to explore their direct impact on Internet use. Thus, wedeveloped the following hypotheses for testing:
H1: Perceived ease of use (PEOU) has a significant impact on Internet usage.H2: Perceived usefulness (PU) has a significant impact on Internet usage.

111
Academy of Educational Leadership Journal, Volume 12, Number 2, 2008
Perceptions of Internet Content (PIC)
Many studies have focused on factors that make web sites more attractive to users (Liu andArnett 2000; Park, et al., 2004; Ranganathan and Ganaphaty 2002; Ranganathan and Grandon 2002).Internet content was found to be a major factor that influenced user usage of the Internet (Huizingh2000; Torkzadeh and Dhillon 2002; Palmer 2002). However, Alshare et al (2005a) investigatedstudents’ usage of the Internet in the USA, and they found that PEOU and PU, but not PIC hadsignificant influence on Internet usage. Since this study focused on students in Chile and UAE whorepresent two different cultural settings (Hofstede 1997), it was natural to think that some peopleperceived Internet content as a threat to their values and culture and avoided its usage, while othershad a positive perception toward it and would continue or start to use it (Alshare 2005b). Thus, weproposed the following research hypothesis:
H3: Perception of Internet content (PIC) has a significant impact on Internet usage.
The Impact External Variables
Many studies have explored the effect of external variables on the relationship betweenPEOU, PU, and technology usage (Alshare et al., 2005a; Alshare et al., 2004; Venkatesh et al., 2003;Venkatesh and Morris 2000). For example, Alshare et al. (2005a) explored the direct effect ofexternal variables (gender, income level, educational background, computer users’ classification,and self-reported measures of computer knowledge) on Internet usage and their moderating effecton the relationship between PEOU, PU, and PIC and Internet usage. They found that gender wasthe only significant moderator (PEOU affected usage of the Internet more strongly for femalestudents than it did for male students). However, they found that classification of computer usersand self-reported knowledge about computers were significant predictors of Internet usage.Venkatesh and Morris (2000) explored the moderation effect of gender on the relationship betweenPEOU, PU, and subjective norm with the intention to use a system for data and information retrieval.They found that male technology usage decisions were more strongly influenced by their perceptionsof usefulness, while females were more strongly influenced by perceptions of ease of use. It was alsoreasonable to assume that the cost and the availability of the Internet would influence students’usage of the Internet. For example, Alshare et al., (2003) found that there was a significantrelationship between Internet cost and its usage. Based on the above discussion we proposed thefollowing hypotheses:
H4: Gender has a significant impact on Internet usage. H5: Educational background has a significant impact on Internet usage.H6: Income level has a significant impact on Internet usage.

112
Academy of Educational Leadership Journal, Volume 12, Number 2, 2008
H7: Self-reported knowledge about computers has a significant impact on Internet usage.H8: Internet cost has a significant impact on Internet usage. H9: Internet availability has a significant impact on Internet usage.
In this study, we followed the aforementioned research and proposed that gender, educationalbackground, income level, self-reported measure of computer knowledge, Internet cost, andavailability can be considered as moderating variables in the relationship between PEOU, PU, andPIC and Internet usage. Thus, we proposed the following set of hypotheses:
H10a: The impact of perceived ease of use on Internet usage depends on gender. H10b The impact of perceived ease of use on Internet usage depends on educational
background. H10c: The impact of perceived ease of use on Internet usage depends on income level. H10d: The impact of perceived ease of use on Internet usage depends on self-reported
knowledge about computers. H10e: The impact of perceived ease of use on Internet usage depends on Internet cost. H10f: The impact of perceived ease of use on Internet usage depends on Internet
availability.H11a: The impact of perceived usefulness on Internet usage depends on gender. H11b: The impact of perceived usefulness on Internet usage depends on educational
background. H11c: The impact of perceived usefulness on Internet usage depends on income level. H11d: The impact of perceived usefulness on Internet usage depends on self-reported
knowledge about computers. H11e: The impact of perceived usefulness on Internet usage depends on Internet cost. H11f: The impact of perceived usefulness on Internet usage depends on Internetavailability.H12a: The impact of perceived Internet content on Internet usage depends on gender. H12b: The impact of perceived Internet content on Internet usage depends on educational
background. H12c: The impact of perceived Internet content on Internet usage depends on income level.H12d: The impact of perceived Internet content on Internet usage depends on self-reported
knowledge about computers. H12e: The impact of perceived Internet content on Internet usage depends on Internet cost.H12f: The impact of perceived Internet content on Internet usage depends on Internet
availability.

113
Academy of Educational Leadership Journal, Volume 12, Number 2, 2008
RESEARCH METHOD
The Proposed Model
Based on the previous analysis, we proposed the following theoretical model.
Figure 1: Proposed Theoretical Model Based on Alshare et. al. (2005a) StudyApplied to Each Country
H3
H1
H2
H12a-H12f
H11a-H11f
H10a-H10f
Perceived Ease of Use (PEOU)
Perceived Usefulness (PU)
Perceived Internet Content (PIC)
Internet Usage (IU)
Gender Educational background
Income Self-reported level of computer knowledge
Internet Cost Internet Availability
H4-H9
Survey Questionnaire
In addition to asking questions concerning demographic variables such as gender, age,educational background, and income level, the questionnaire solicited information about Internetusage, PEOU, PU, and PIC. Five items were used to measure each of the PEOU and PU constructsthat were taken directly from Davis’ (1989) scale and modified to measure Internet usage. The PICconstruct was adopted from Alshare et al., (2005a). Four items were used to measure the constructPIC. The survey instrument was developed, reviewed for content as well as readability, and pilot

114
Academy of Educational Leadership Journal, Volume 12, Number 2, 2008
tested; then, the survey was modified accordingly. Survey participants responded to statements usinga 5-point Likert scale ranging from strongly disagree to strongly agree. The Statistical Packages forthe Social Services (SPSS) was used to compute frequencies, means, percentage, factor analysis, andreliability (Cronbach alpha coefficient). The regression procedure was utilized to test the hypotheses.
Samples and Data Collection
The survey questionnaire was administered to convenient samples of college students in theUAE and Chile during Fall 2003-Spring 2004. In Chile and UAE, colleagues of the authors wereapproached and asked to distribute the survey to students in their schools. Students completed thesurvey during class time; then the surveys were collected by the instructors and sent back to theUSA via postage mail. The questionnaire was distributed to 300 college students in each country.Since English is the second spoken language in the UAE and students and instructors were familiarwith it (AMIDEAST 2005), the questionnaire was administrated in English to the UAE sample. InChile, however, the questionnaire was administered in Spanish, since only 2% of Chileans older than15 years were fluent in English (Miranda, 2004). Back translation procedure (Brislin, 1986) wasused to ensure that the meaning of the questions was not lost during the translation process.
Measures of Variables and Constructs
The dependent variable Internet usage (IU) was measured with a single item that representedthe number of hours devoted to the usage of Internet per day. The independent variables includedthree constructs: perceived ease of use (PEOU) measured using 5 items, perceived usefulness (PU)measured using 5 items, and perceived of internet content (PIC) measured using 4 items.
The external variables considered in this study were gender (GEN), educational background(EDBACK), family-monthly income (INC), self-reported knowledge about computers (KNOWL),Internet cost (ICO), and Internet availability (IAV). The above external variables wereoperationalized as follows:
Gender is a dummy variable that takes on a value of 0 for males and a value of 1 for females.EDBACK is a dummy variable that takes on a value of 0 for business majors and 1 for other
majors.INC is a dummy variable that takes on a value of 0 for low family-monthly income and
1 for high family-monthly income.KNOWL is a dummy variable that takes on a value of 0 for very good-to-excellent computer
knowledge and 1 for poor-to-good computer knowledge.ICO is a dummy variable that takes on a value of 0 for expensive-very expensive and 1
for very cheap-fair.

115
Academy of Educational Leadership Journal, Volume 12, Number 2, 2008
IAV is a dummy variable that takes on a value of 0 for very good-excellent and 1 for fair-good.
Regression Models
Three regression models were used to test hypotheses (H1-H12f). The average of the itemsfor each construct was used in the regression analysis. The external variables were included in themultiple regression equations as dummy variables. We evaluated their effects on the relationshipbetween PEOU, PU, PIC and IU by adding the interaction term between the external variable andeach of the independent variables.
Model 1: IU = a1 + $1 (PEOU) + $2(PU) + $3 (PIC) + e1
Model 2: IU = a2 + $1 (GEN) + $2 (EDBACK)+ $3 (INC) + $4 (KNOWL) + $5 (ICO) +$6 (IAV) + e2
Model 3: IU = a3 + $1 (PEOU*GEN) + $2 (PEOU*EDBACK) + $3 (PEOU*INC) +$4 (PEOU*KNOWL) + $5 (PEOU*ICO) + $6 (PEOU*IAV) + $7 (PU*GEN) +$8 (PU*EDBACK) + $9 (PU*INC) + $10 (PU*KNOWL) + $11 (PU*ICO) + $12 (PU*IAV) + $13 (PIC*GEN) + $14 (PIC*EDBACK) + $15 (PIC*INC) + $16 (PIC*KNOWL) + $17 (PIC*ICO) + $18 (PIC*IAV) + e3
Where:
IU: Internet usagePEOU: Perceived ease of usePU: Perceived usefulnessPIC: Perceived Internet contentGEN: GenderEDBACK: Educational backgroundINC: Family-monthly incomeKNOWL: Self-reported knowledge about computersICO: Internet costIAV: Internet availability e: error term
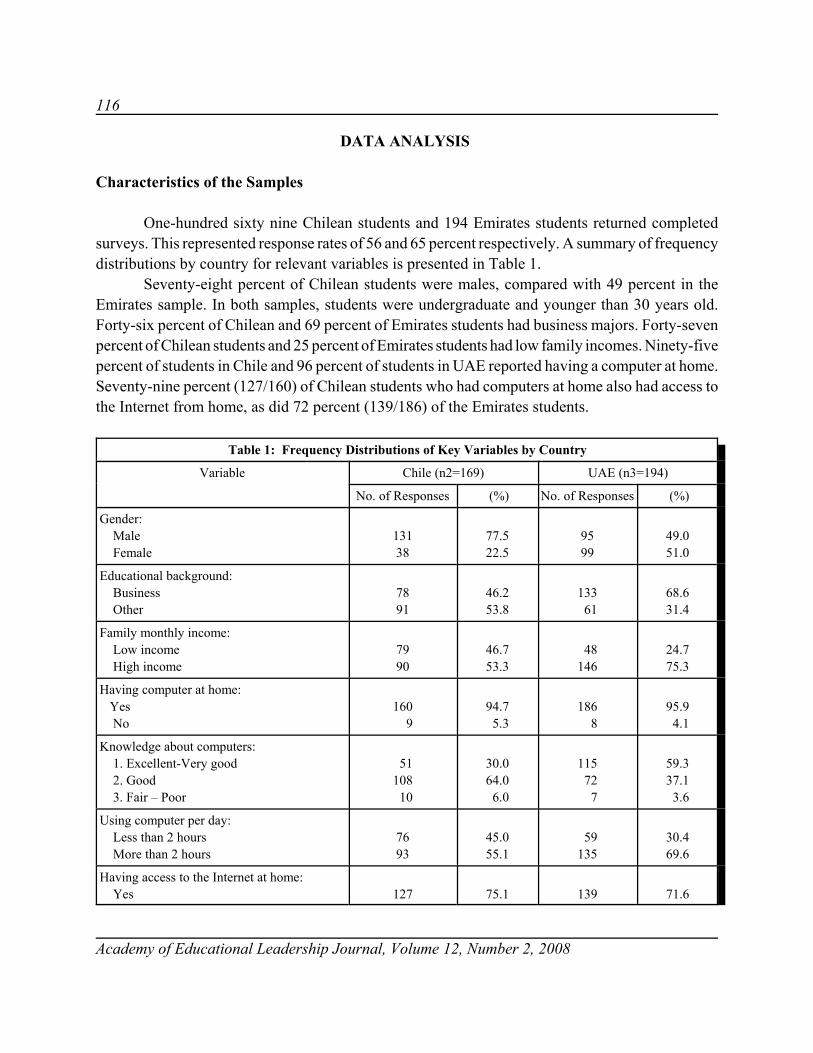
116
Academy of Educational Leadership Journal, Volume 12, Number 2, 2008
DATA ANALYSIS
Characteristics of the Samples
One-hundred sixty nine Chilean students and 194 Emirates students returned completedsurveys. This represented response rates of 56 and 65 percent respectively. A summary of frequencydistributions by country for relevant variables is presented in Table 1.
Seventy-eight percent of Chilean students were males, compared with 49 percent in theEmirates sample. In both samples, students were undergraduate and younger than 30 years old.Forty-six percent of Chilean and 69 percent of Emirates students had business majors. Forty-sevenpercent of Chilean students and 25 percent of Emirates students had low family incomes. Ninety-fivepercent of students in Chile and 96 percent of students in UAE reported having a computer at home.Seventy-nine percent (127/160) of Chilean students who had computers at home also had access tothe Internet from home, as did 72 percent (139/186) of the Emirates students.
Table 1: Frequency Distributions of Key Variables by Country
Variable Chile (n2=169) UAE (n3=194)
No. of Responses (%) No. of Responses (%)
Gender: Male Female
13138
77.522.5
9599
49.051.0
Educational background: Business Other
7891
46.253.8
133 61
68.631.4
Family monthly income: Low income High income
7990
46.753.3
48146
24.775.3
Having computer at home: Yes No
160 9
94.7 5.3
186 8
95.9 4.1
Knowledge about computers: 1. Excellent-Very good 2. Good 3. Fair – Poor
51108 10
30.064.0 6.0
115 72 7
59.337.1 3.6
Using computer per day: Less than 2 hours More than 2 hours
7693
45.055.1
59135
30.469.6
Having access to the Internet at home: Yes 127 75.1 139 71.6

117
Table 1: Frequency Distributions of Key Variables by Country
Variable Chile (n2=169) UAE (n3=194)
No. of Responses (%) No. of Responses (%)
Academy of Educational Leadership Journal, Volume 12, Number 2, 2008
No 42 24.9 55 28.4
Cost of Internet: 1. Very Cheap-Cheap 2. Fair 3. Expensive-Very Expensive
116989
6.540.852.7
43101 50
22.252.125.7
Availability of Internet: 1. Poor - Good 2. Very good - Excellent
114 55
67.4532.55
42152
21.6578.25
Using Internet per day: Less than 2 hours More than 2 hours
107 62
63.436.7
86108
44.355.7
Internet applications usage: Class related activities Communication Entertainment Other activities Selling/buying
130132 84 78 18
76.9278.1149.7046.1510.65
141128104116 33
72.6865.9753.6059.7917.01
Thirty percent of Chilean, compared to 59 percent of Emirates students, stated that theirknowledge about computers was very good to excellent. Six percent of Chilean compared to 4percent of Emirates students reported that their knowledge was poor to fair. Some 64 percent ofChilean students compared to 37 percent of Emirates students indicated that their knowledge aboutcomputers was good. This should be of no surprise, since more than one-half of the students, in bothcountries, used computers over two hours per day. Thirty-seven percent of Chilean, compared to 56percent of Emirates students, used the Internet for more than two hours per day, mostly for class-related activities and communication (e-mail). Shopping on line was reported to be the least-usedactivity on the Internet in both countries. However, approximately 50 percent of students in bothcountries used the Internet for entertainment activities. While the majority of students in Chilereported that the cost of the Internet was “expensive-very expensive”, the majority of students inUAE indicated that the cost of the Internet was “fair”. Additionally, two-thirds of Chilean felt thatthe availability of the Internet in their country was “poor-good”, while three-quarters of Emiratesstudents felt that the availability of the Internet in their country was “very good-excellent”.

118
Academy of Educational Leadership Journal, Volume 12, Number 2, 2008
Validation of the Measures
Exploratory factor analysis and Cornbach’s alpha were used to assess the psychometricproprieties of the scales. Factor analysis (Principal component, with Varimax rotation) wasperformed to confirm that the items loaded according to the proposed model. According to Hair etal. (2006), the acceptable value for factor loading for a sample size of 150 is 0.45. Thus, items withloading less than 50 percent were dropped from further analysis. As a result, two items were droppedfrom each of PEOU, PU, and PIC. Appendix A presents the results of factor analysis and AppendixB shows the items and their descriptions that were used in the computations. Scale reliability wasmeasured using Cronbach’s alpha coefficient. As shown in Table 2, the values of alpha for the twosamples ranged from 0.62 to 0.83. These values are considered to be sufficient according to Hair etal., 2006.
Table 2: Reliability Analysis (Cronbach Alpha Coefficient)
Construct UAE Chile
Perceived Ease of Use (PEOU) (3 items) 0.83 0.65
Perceived Usefulness (PU) - (3 items) 0.76 0.70
Perceived Internet Content (PIC) - (2 items) 0.62 0.69
THE RESULTS OF THE STUDY
The results of the study are divided into three sections. The first section discusses therelationships between the usage of the Internet and PEOU, PU, and PIC. For each country, themultiple regression procedure was employed to test the hypotheses (H1-H3). The second sectionanalyzes the direct effect of the external variables of gender, educational background (business vs.non-business), income level (low vs. high), a self-reported measure of computer knowledge (verygood-excellent vs. poor-good), Internet cost (very cheap-fair vs. expensive-very expensive), andInternet availability (fair-good vs. very good-excellent) on Internet usage (hypotheses H4-H9). Thethird section reports the impact of the external variables on the relationship between PEOU, PU, PICand usage of the Internet (hypotheses H10a-H12f).
Before testing the hypotheses, the assumptions of the multiple regression models werevalidated. Several tests such as multicollinearity, autocorrelation, plotted histogram, and the plotsof the dependent variable against each of the independent variables were conducted.Multicollinearity was not a problem since the variance inflation factor (VIFs) were low (< 2.0) forboth samples. Autocorrelation problem was not an issue since the D.W. values ranged from 1.80 to1.96. The plotted histograms of the data depicted a normal distribution. Additionally, the plots ofthe dependent variable against each of the independent variables showed a linear relationship.
119
Academy of Educational Leadership Journal, Volume 12, Number 2, 2008
The Impact of PEOU, PU, and PIC on Internet Usage (IU)
Based on the regression results of Model 1 (Table 3), only the second hypothesis (H2) wassupported by the data for both samples. Thus, PU was a significant predictor of Internet usage (t=2.068, p= 0.04 for UAE, and t=2.104, p= 0.037 for Chile). On the other hand, PEOU (t= 1.292, p=0.198 for UAE, and t= 0.151, p= 0.880 for Chile) and PIC (t= -0.636, p= 0.526 for UAE, and t=0.663, p= 0.508 for Chile) were not significant in predicting Internet usage.
The Impact of External Variables on Internet Usage
In this section, hypotheses (H4-H9) were tested using multiple regression procedure asdescribed earlier in Model 2. As shown in Table 3, two external variables had significant impactson the Internet usage. Gender had significant impact on Internet usage for the case of the UAEsample (t = 2.312, p = 0.022). Female students in UAE would spend more time using the Internetcompared to their male counterparts (H4 was supported). For the case of the Chilean sample, self-reported knowledge about computers was a significant variable that impacted student’s Internetusage (t = -2.605, p = 0.009). Chilean students who rated their knowledge about computers as“poor-good” would spend less time using the Internet compared to those who rated their knowledge“very-good-excellent” (H7 was supported).
The Moderating Effect of the External Variables
In Model 3, the interaction terms between PEOU, PU, PIC and the external variables(gender, educational background, family-monthly income level, self-reported knowledge aboutcomputers, Internet cost, and Internet availability) were regressed to determine the role of theexternal variable in moderating the relationship between PEOU, PU, and PIC and Internet usage(H10a-H12f)
As shown in Table 3 at the end of the text, only one interaction term was significant that is(PU *income) for both samples; UAE (t = 2.132, p = 0.035) and Chile (t = 2.211, p = 0.029).Therefore, all hypotheses (H10a-H12f) were not supported with the exception of H11c (The impactof perceived usefulness on Internet usage depends on income level). PU affected usage of theInternet more positively for Emirates and Chilean students with high-income level than it did forthose students with low income.
DISCUSSION AND CONCLUSIONS
This study investigated the effect of PEOU, PU, and PIC on students’ usage of the Internetin Chile and UAE. It also examined the direct impact of external variables such as gender,

120
Academy of Educational Leadership Journal, Volume 12, Number 2, 2008
educational background, family-monthly income, self-reported knowledge about computers, Internetcost, and Internet availability on Internet usage. Additionally, the study evaluated the moderationrole of the external variables in the relationship between PEOU, PU, and PIC and IU.
Table 4 shows a comparison between the results of this study and the results of Alshare etal. (2005a) study that was conducted in the U.S. The results showed that while PU was the onlysignificant predictor of Internet usage for both Emirates and Chilean students, PEOU and PU weresignificant predictors of Internet usage for American students. It seems that students in the threecountries regardless of their differences of cultural backgrounds felt that the use of Internet wouldbe beneficial to them. On the other hand, American students, compared to Emirates and Chileanstudents, felt that the ease of use of Internet motivated them to use it more frequently. Anexplanation for this finding is that Emirates and Chilean students, compared to American students,would be more dependent on their teachers according to Hofstede’s cultural dimensions (Alshareet. al. 2005b), and they expect support and help from their teachers. Thus, PEOU was not animportant factor in predicting Internet usage. On the other hand, American students are moredependent on themselves in learning how to use the Internet; therefore, PEOU was a significantfactor in predicting Internet usage. Another plausible suggestion might be that Emirates and Chileanstudents believed in the importance of using the Internet regardless of its learning difficulty. On theother hand, American students felt that the difficulty level of learning how to use the Internet wasa major factor that influenced their usage of the Internet. According to the results of Alshare et al.(2005a) study, PEOU was the most influential factor that affected American students’ usage of theInternet.
Table 4: A Comparison of three-countries (USA, Chile, UAE)*
VariableAlshare et al. (2005a) This Study
USA CHILE UAE
PEOU Sig. Not Sig. Not Sig.
PU Sig. Sig. Sig.
PIC Not Sig. Not Sig. Not Sig.
Gender Not Sig. Not Sig. Sig.
Education background Not Sig. Not Sig. Not Sig.
Income Not Sig. Not Sig. Not Sig.
Self-reported knowledge about computers Sig. Sig. Not Sig.
Internet cost NA Not Sig. Not Sig.
Internet availability NA Not Sig. Not Sig.
Gender*PEOU Sig. Not Sig. Not Sig.
Income*PU Not Sig. Sig. Sig.
*. The remaining of interaction terms were not significant.

121
Academy of Educational Leadership Journal, Volume 12, Number 2, 2008
Even though PIC was found to be a valid and reliable construct, it did not significantly affectstudents’ usage of the Internet. Once again this finding was consistent with Alshare et al (2005a)findings. This outcome should be of interest to instructors. It appeared that students consideredInternet content as a trusted source for class-related activities. The role of instructors becomes moreimportant to show students the correct way for obtaining quality information on the Internet. Oneexplanation for not having PIC as a significant factor could be the fact that the Internet is consideredby many students to be the most convenient way of finding information for class-related activities;therefore, students may not have much concern about the actual content.
With respect to the impact of external variables, educational background (business vs. non-business), family-monthly income level (low vs. high), Internet cost (very cheap-fair vs. expensive-very expensive), and Internet availability (fair-good vs. very good-excellent) did not influencestudents’ usage of the Internet in the three countries as shown in Table 4. One can say that most ofthe teachers in many academic majors do request their students to utilize the Internet as a source forinformation; thus, educational background was not significant. As mentioned earlier and as shownin Table 1 the majority of students used the Internet for class related activities and communication(email). Since access to the Internet is available to all students in the three countries at their schools,income level, Internet cost, and Internet availability were not significant factors.
While gender significantly influenced Emirates students’ usage of the Internet, self-reportedknowledge about computers (very good-excellent vs. poor-good) significantly influenced Americanand Chilean students’ usage of the Internet as reported in Table 4. As expected students with greaterknowledge about computers would feel at ease in utilizing computer applications such as theInternet; and therefore, use it more frequently. While it might be easier to explain, based on the“gender gap” concept, why male students, compared to female students, would spend more timeusing the Internet, it is not quite easy to explain why Emirates female students would spend moretime using the Internet. One explanation could be based on the UAE culture. According toHofstede’s cultural dimensions, the culture of the Arab countries, which UAE is one of them, is aconservative society (Alshare et al. 2005b). Therefore, Emirates female students, compared to theirmale counterparts, would use more frequently the Internet for communication (email); especiallywith their teachers. Additionally, Emirates female students who live on campus are limited in theirsocial interactions outside the campus; therefore, the Internet would be their social outlet.
As shown in Table 4, family-monthly income level was the only significant moderator in thecase of UAE and Chilean samples. It moderated the impact of PU on Internet usage. On the otherhand, gender was the only significant moderator in the case of the American sample. It moderatedthe relationship between PEOU and Internet usage. PU influenced usage of the Internet morepositively for Emirates and Chilean students with high income level than it did for those studentswith low income. It is reasonable to assume that people with high income level would have accessto the Internet at home or Internet shops; and thus, they use the Internet more often for a variety ofreasons, and they would appreciate its usefulness. As a matter of fact, the majority of students with

122
Academy of Educational Leadership Journal, Volume 12, Number 2, 2008
high income level spend more than 4 hours per day using the Internet, while the majority of studentswith low income level spend lees than 3 hours. On the other hand, Income level was not a significantmoderator for American sample because the Internet cost, compared to the cost in UAE and Chile,is considered cheap. Thus, both groups of income levels could afford to have internet access athome; and therefore, appreciate its usefulness. As reported by Alshare et al., (2005a) PEOUinfluenced usage of the Internet more positively for American female students than it did for males.Female students felt that the ease of use of the Internet, but not necessarily its usefulness or itscontent, motivated them to use the Internet more frequently. However, for Emirates and Chileanstudents this was not the case. The impact of gender on the relationship between PEOU and Internetusage was not significant.
Finally, the results revealed that an extended TAM model was partially valid in non-westerncultures such as Chilean and Emirates cultures. Only PU impacted student’s usage of the Internetregardless of their cultural backgrounds. Therefore, educators need to reinforce this concept(perceived usefulness) especially when deciding to teach online classes. Instructors might requeststudents to use the Internet more frequently and demonstrate how easy it is for them to find thedesired information.
The limitations of the study includes: first, the reliance on self-reported data on allconstructs. Thus, relationships among the constructs might be inflated. Second, the use of studentsas the target population restricts the ability to generalize the results. Therefore, future researchmight use a more detailed questionnaire survey with a follow up with subjects. Another futureresearch might be targeting all population segments; and thus, results of the study could begeneralized. Finally, another plausible future research could be examining the impact of culturaldimensions on the proposed model by including constructs that represents cultural dimensions.
REFERENCES
Adams, N. (2002), Educational Computing Concerns of Postsecondary Faculty, Journal of Research on Technology inEducation, 34(3): p. 285-303.
Akour, I., Alshare, K., Miller, D., and Dwairi, M. (2006). An Exploratory Analysis of Culture, Perceived Ease of Use,Perceived Usefulness, and Internet Acceptance: The Case of Jordan. The Journal of Internet Commerce, 5 (3)(forthcoming).
Al-Gahtani, S. (2001). The Applicability of TAM Outside North America: An Empirical Test in the United Kingdom,Information Resources Management Journal 14 (3), pp. 37-46.
Alshare, K., Grandon, E., and Miller, D., (2005a) Internet Usage in the Academic Environment: the TechnologyAcceptance Model Perspective. Academy of Educational Leadership Journal, 9(2), 81-97.

123
Academy of Educational Leadership Journal, Volume 12, Number 2, 2008
Alshare, K., Grandon, E., and Badri, M. (2005b). How Do College Students Perceive Arguments for and against theImpact of the Internet on a Country’s Social and Political Affairs? Evidence from Three Countries. TheInternational Journal of Business and Public Administration. 2 (1), 75-91.
Alshare, K., Grandon, E., and Miller, D. (2004). Antecedents of computer technology usage: Considerations of thetechnology acceptance model in the academic environment. The Journal of Computing Sciences in Colleges,April 2004, 164-180.
Alshare, K., Al-dwairi, M., and Akour, I. (2003) Student-Instructor Perception of Computer Technology in DevelopingCountries: the Case of Jordan. Journal of Computer Information Systems, 43(4), Summer 2003, p. 115-123.
AMIDEAST (2005), United Arab Emirates (UAE) Country Information, Retrieved December 11, 2005 fromhttp://www.amideast.org/offices/uae/country_info.htm
Brislin R. (1986) The wording and translation of research instrument. In W. J. Lonner & J. W. Berry (Eds.). Fieldmethods in cross-cultural research. Beverly Hills, CA: Sage. pp 137-164.
Davis, F. (1989). Perceived usefulness, perceived ease of use, and user acceptance of information technology. MISQuarterly, 319-340.
Elbeltagi, I., McBride, N., and Hardaker, G. (2005). Evaluating thr factors affecting DSS usage by senior managers inlocal authorities in Egypt. Journal of Global Information Management, 13 (2), 42-65.
Gefen, D. and Straub, D. (1997). Gender differences in the perception and use of e-mail: An extension to the technologyacceptance model. MIS Quarterly, 389-400.
Hair, J, Black, W., Babin, B., Anderson, R., and Tatham, R. (2006), Multivariate Data Analysis 6th, Prentice HallPublishing Company.
Hofstede, G. (1997). Cultures and Organizations. Software of the Mind. Intercultural Cooperation and its Importancefor Survival, New Jersey: McGraw-Hill.
Huang, L. Lu, M. and Wong, B. (2003). The Impact of Power Distance on Email Acceptance: Evidence from the PRC,Journal of Computer Information Systems, 44 (1), pp. 93-101.
Huizingh, E. K. (2000). The content and design of web sites: An empirical study. Information & Management. 37, 123-134.
Igbaria, M., Zinatelli, N., Cragg, P., and Cavaye, A. (1997, September). Personal computing acceptance factors in smallfirms: A structural equation model. MIS Quarterly, 279-302.
Institute for Scientific Information (2005). Requested September 5, 2005 from http://www.isinet.com/cit/
Kim, C., Galliers, R., and Hoon Yang, K., (2005), “Comparison of Web-based Shopping Systems in the UK and Korea,”Journal of Global Information Technology Management, Vol. 8 (4), October 2005
124
Academy of Educational Leadership Journal, Volume 12, Number 2, 2008
Lai, V. and Wong, B. (2003). The moderating effect of local environment on a foreign affiliate’s global IS strategy-effectiveness relationship, IEEE Transactions on Engineering Management 50(3), pp. 353-362.
Lapczynski, P. (2004), An Integrated Model of Technology Acceptance for Small Mobile Technology Devices,Unpublished Doctoral Dissertation, School of Computer Science and Information Systems, Pace University.
Liu, C., and Arnett, K. P. (2000). Exploring the factors associated with web site success in the content of electroniccommerce. Information & Management, 38(1), 23-33.
Loch, K.D, Straub, D.W., Kamel, S. (2003). The role of social norms and technological culturation. IEEE Transactionson Engineering Management, 50 (1): 45-63.
Lucas, H. and Spitler, V. (2000). Implementation in a world of workstations and networks, Information and Management38 (2), pp. 119-128.
McCloskey, D. (2003-2004). Evaluating electronic commerce acceptance with the technology acceptance model.Journal of Computer Information Systems. 49-57.
McCoy, S. Everard, A. and Jones, B. (2005). An Examination of the Technology Acceptance Model in Uruguay and theUS: A Focus on Culture, Journal of Global Information Technology Management 8 (2), pp. 27-45.
Miranda N (2004) Las formulas mas atractivas para aprender Ingles. La Tercera, online edition, 2004. Retrieved March15, 2004, from www.tercera.cl/articulo/0,5819,3255_5726_ 63463513,00.html
Palmer, J. W. (2002). Web site usability, design, and performance metrics, Information Systems Research, 13(2), 151-167.
Parboteeah, V., Parboteeah, P., Cullen, J., and Basu, C. (2005) “Perceived Usefulness of Information Technology: ACross National Model” Journal of Global Information Technology Management, Vol. 8 (4), October 2005.
Park, J., Dongwon Lee, D., and Ahn, J., (2004), “Risk-Focused E-Commerce Adoption Model: A cross-CountryStudy,”Journal of Global Information Technology Management, Vol. 7 (2), April 2004.
Pijpers, A., Senior Executives’ Use of Information Technology: An examination of factors influencing managerialbeliefs, attitude and use of Information Technology, Unpublished Doctoral Dissertation, Eindhoven Universityof Technology, Netherlands, 2001.
Ranganathan, C., and Ganapathy, S. (2002). Key dimensions of business-to-consumer web sites. Information &Management, 39, 457-465.
Ranganathan, C. and Grandon, E. (2002). An exploratory examination of factors affecting online sales. Journal ofComputer Information Systems, 87-93.
Rose & Straub, D. (1998). Predicting General IT Use: A Study in Arab Developing Nations," Journal of GlobalInformation Management, 6 (3), Summer, 1998, 39-46
125
Academy of Educational Leadership Journal, Volume 12, Number 2, 2008
Seyal, A. H., Rahman, M. N. A., and Rahim, M. M. (2002). Determinants of academic use of the Internet: A structuralequation model. Behavior & Information Technology, 21(1), 71-86.
Stansfield, M., and Grant, K. (2003). An investigation into issues influencing the use of the Internet and e-commerceamong small-medium sized enterprises. Journal of Electronic Commerce Research, 4(1), 15-33.
Straub, D. Keil, M. and Bernner, W. (1997). Testing the Technology Acceptance Model Across Cultures: A ThreeCountry Study, Information & Management 33, pp. 1-11.
Tan, M., and Teo, T. S. H. (1998). Factors influencing the adoption of the Internet. International Journal of ElectronicCommerce, 2(3), 5-18.
Teo, T. S. H., and Pian, Y. (2004). A model for Web adoption. Information & Management, 41, 457-468.
The World Competitiveness Yearbook, (2002). Retrieved February 10, 2004, from http://ecolu-info.unige.ch/archives/ceeman02/0214.html
Torkzadeh, G., and Dhillon, G. (2002). Measuring factors that influence the success of Internet commerce. InformationSystems Research, 13(2), 187-204.
Venkatesh, V. and Morris, M. (2000). Why don’t men ever stop to ask for directions? Gender, social influence, and their
role in technology acceptance and usage behavior. MIS Quarterly, 24(1), 115-139.
Venkatesh, V., Morris, M. G., Davis, G. B., and Davis, F. D. (2003). User acceptance of information technology:Toward a unified view. MIS Quarterly, 27(3),425-478.
Venkatesh, V., and Davis, F. (2000). A theoretical extension of the technology acceptance model: Four longitudinal fieldstudies, Management Science 46(2), pp. 186-204.
Zakour, A. (2004). Cultural differences and information technology acceptance, Proceedings of the 7th AnnualConference of the Southern Association for Information Systems, pp. 156-161

126
Academy of Educational Leadership Journal, Volume 12, Number 2, 2008
Appendix AUAE and Chile
Rotated Component Matrix (Factor Analysis)
Component
UAE 1 2 3
PEOU3 .880 .233 0.163
PEOU1 .803 .297 0.176
PEOU2 .723 .269 0.28
PU3 .131 .820 0.27
PU1 .276 .774 -0.009
PU4 .316 .694 0.172
PIC2 .105 .341 0.783
PIC1 .421 -.022 0.703
Total Variance Explained: 71.969%
Component
Chile 1 2 3
PU1 .800 .211 -0.021
PU3 .794 .250 0.186
PU4 .717 .037 0.138
PEOU1 .339 .725 -0.068
PEOU2 .073 .719 -0.032
PEOU3 .115 .692 0.308
PIC1 -.033 .105 0.835
PIC2 .196 .228 0.702
Total Variance Explained: 62.434%.

127
Academy of Educational Leadership Journal, Volume 12, Number 2, 2008
Appendix BSignificant Items Considered in the Final Analysis
Construct Item Description
Perceived Ease of Use(PEOU)
PEOU1 Learning to use the Internet would be easy for me
PEOU2 I would find it is easy to get the Internet to do what I want it to do
PEOU3 I would find the Internet easy to use
Perceived Usefulness(PU)
PU1 Using the Internet would increase my productivity
PU3 I would find the Internet useful in my career
PU4 Using the Internet would make my communication with others more efficient
Perceived InternetContent (PIC)
PIC1 The information provided by the Internet is reliable
PIC2 I am satisfied with the quality of the information provided by the Internet
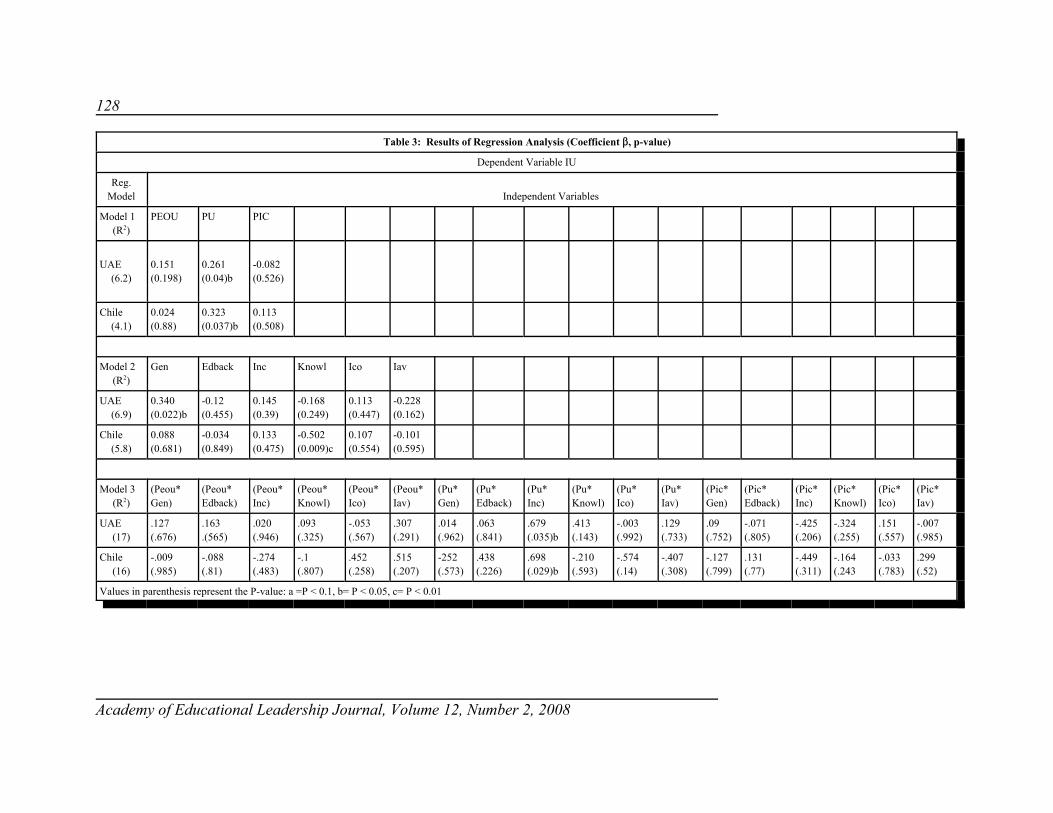
128
Academy of Educational Leadership Journal, Volume 12, Number 2, 2008
Table 3: Results of Regression Analysis (Coefficient $, p-value)
Dependent Variable IU
Reg.Model Independent Variables
Model 1(R2)
PEOU PU PIC
UAE(6.2)
0.151(0.198)
0.261 (0.04)b
-0.082(0.526)
Chile(4.1)
0.024(0.88)
0.323(0.037)b
0.113(0.508)
Model 2(R2)
Gen Edback Inc Knowl Ico Iav
UAE(6.9)
0.340(0.022)b
-0.12(0.455)
0.145(0.39)
-0.168(0.249)
0.113(0.447)
-0.228(0.162)
Chile(5.8)
0.088(0.681)
-0.034(0.849)
0.133(0.475)
-0.502(0.009)c
0.107(0.554)
-0.101(0.595)
Model 3(R2)
(Peou*Gen)
(Peou*Edback)
(Peou*Inc)
(Peou*Knowl)
(Peou*Ico)
(Peou*Iav)
(Pu*Gen)
(Pu*Edback)
(Pu*Inc)
(Pu*Knowl)
(Pu*Ico)
(Pu*Iav)
(Pic*Gen)
(Pic*Edback)
(Pic*Inc)
(Pic*Knowl)
(Pic*Ico)
(Pic*Iav)
UAE(17)
.127(.676)
.163
.(565).020(.946)
.093(.325)
-.053(.567)
.307(.291)
.014(.962)
.063(.841)
.679(.035)b
.413(.143)
-.003(.992)
.129(.733)
.09(.752)
-.071(.805)
-.425(.206)
-.324(.255)
.151(.557)
-.007(.985)
Chile(16)
-.009(.985)
-.088(.81)
-.274(.483)
-.1(.807)
.452(.258)
.515(.207)
-252(.573)
.438(.226)
.698(.029)b
-.210(.593)
-.574(.14)
-.407(.308)
-.127(.799)
.131(.77)
-.449(.311)
-.164(.243
-.033(.783)
.299(.52)
Values in parenthesis represent the P-value: a =P < 0.1, b= P < 0.05, c= P < 0.01
129
Academy of Educational Leadership Journal, Volume 12, Number 2, 2008
Allied Academies
invites you to check our website at
www.alliedacademies.orgfor information concerning
conferences and submission instructions

130
Academy of Educational Leadership Journal, Volume 12, Number 2, 2008
Allied Academies
invites you to check our website at
www.alliedacademies.orgfor information concerning
conferences and submission instructions