ACADEMIC YEAR 2006-2007 FACT BOOK · ACADEMIC YEAR 2006-2007 FACT BOOK ... Mr. Gerald B. Lang Mr....
81
ACADEMIC YEAR 2006-2007 FACT BOOK OFFICE OF INSTITUTIONAL RESEARCH, ASSESSMENT & PLANNING
Transcript of ACADEMIC YEAR 2006-2007 FACT BOOK · ACADEMIC YEAR 2006-2007 FACT BOOK ... Mr. Gerald B. Lang Mr....
ACADEMIC YEAR
2006-2007
FACT BOOK
OFFICE OF INSTITUTIONAL
RESEARCH, ASSESSMENT
&
PLANNING

i
THE OFFICE OF INSTITUTIONAL RESEARCH, ASSESSMENT AND PLANNING
The staff of the Office of Institutional Research, Assessment and Planning is pleased to present the University of the District of Columbia 2006-2007 Fact Book. The Fact Book is issued periodically to provide frequently requested statistical, programmatic, and operational data about the University of the District of Columbia and serves as a reference resource tool for the University community. Information presented in the Fact Book is divided into sections, as indicated in the Table of Contents, and is presented in tabular and/or graphic form. Citations of the data sources used for this resource are also indicated. Suggestions or corrections are welcome and should be directed to the Office of Institutional Research, Assessment and Planning.
David Caruth, Ph.D. – Director Diane Hayes, M.A. - Operations Research Analyst
Gashaw Mekonnen, M.S. - Senior Operations Research Analyst Marie Racine, Ph.D. - Assessment Coordinator
Latresa Stewart, B.S. - Office Manager
ii
ACKNOWLEDGEMENT
The Office of Institutional Research, Assessment and Planning would like to dedicate this Fact Book to Diane Dickerson-Hayes, longtime Operations Research Analyst and University Statistician for her unyielding commitment and dedication to the success of this office. Mrs. Dickerson-Hayes has dedicated more than 32 years of her professional academic career to serving the University community and the students we serve. This Fact Book is a testament to her hard work and for that we offer her our deepest gratitude.

iii
FROM THE DIRECTOR
This Second Edition of the University of the District of Columbia Fact
Book is a publication of the Office of Institutional Research, Assessment and
Planning. This document provides factual, statistical information about UDC,
and provides administrators, faculty, staff and other university constituents with
better access to operational data.
In our ongoing effort to provide useful institutional data, we aim to publish
sequential editions of the fact book each year. We welcome your valuable
comments and suggestions to improve the content of published facts about UDC.
This second edition of the UDC fact book will be published on the University’s
website at: (http://www.udc.edu/irap).
We hope that those of you who are less familiar with our University will
find this publication to be informative and useful. We invite you to visit our
campus at 4200 Connecticut Avenue, N.W., Washington, D.C., 20008 to learn
more about our academic offerings as well as, to meet our outstanding student
body, faculty, administrators and support staff.
Respectively,
David Caruth
David Caruth, PhD
Director
Office of Institutional Research, Assessment and Planning

iv
PREFACE
The information presented here was collected and organized by the Office of Institutional
Research, Assessment and Planning. This office serves as the clearinghouse for official University
statistics to promote consistency in reporting and the provision of timely and accurate information. All
information provided was collected from official University reports generated by the Office of
Information Technology. These reports represent official institutional records used for reporting to federal
and local agencies.
The data included in this document are also available on-line. To access this information in
electronic format, please visit our web site at: http://www.udc.edu. Should you need to request data that
is not contained this book, visit the IR web site where we have made Data Request Forms available for
your convenience. If you have any comments or suggestions, please let us hear from you.
v
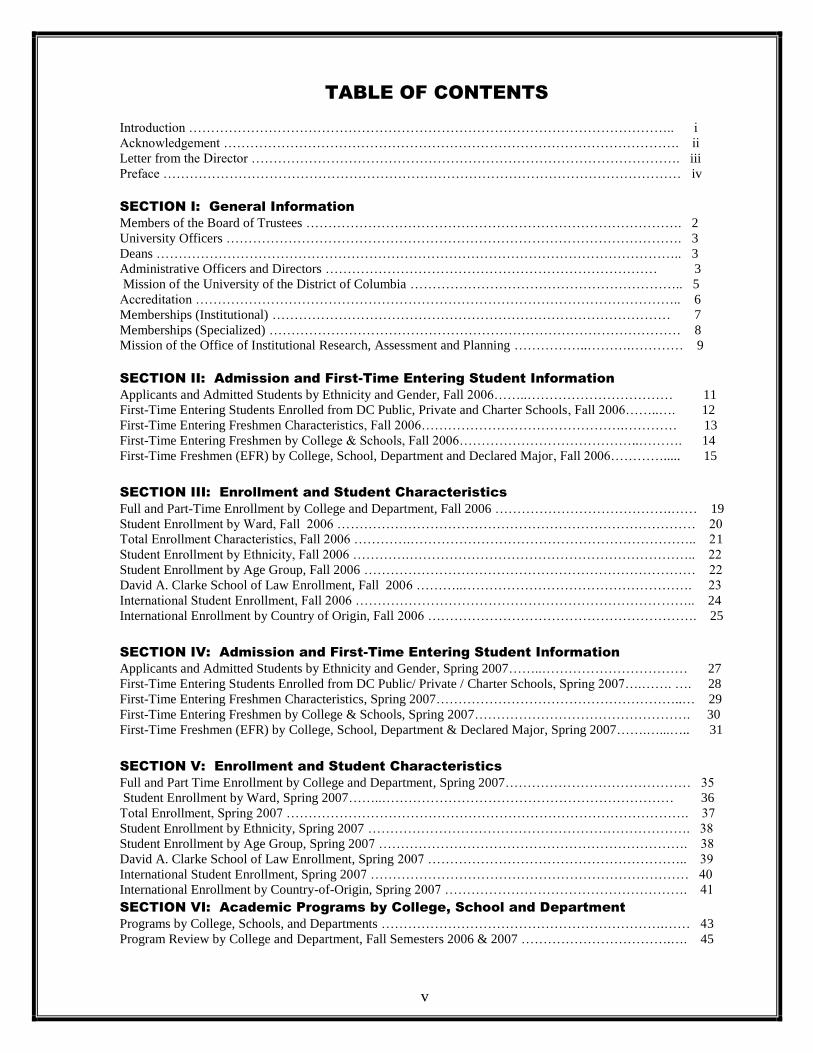
TABLE OF CONTENTS
Introduction ……………………………………………………………………………………………….. i
Acknowledgement …………………………………………………………………………………………. ii
Letter from the Director ……………………………………………………………………………………. iii
Preface ……………………………………………………………………………………………………… iv
SECTION I: General Information
Members of the Board of Trustees …………………………………………………………………………. 2
University Officers …………………………………………………………………………………………. 3
Deans ……………………………………………………………………………………………………….. 3
Administrative Officers and Directors ………………………………………………………………… 3
Mission of the University of the District of Columbia …………………………………………………….. 5
Accreditation ……………………………………………………………………………………………….. 6
Memberships (Institutional) ……………………………………………………………………………… 7
Memberships (Specialized) ………………………………………………………………………………… 8
Mission of the Office of Institutional Research, Assessment and Planning ……………..……….………… 9
SECTION II: Admission and First-Time Entering Student Information
Applicants and Admitted Students by Ethnicity and Gender, Fall 2006……..…………………………… 11
First-Time Entering Students Enrolled from DC Public, Private and Charter Schools, Fall 2006……..…. 12
First-Time Entering Freshmen Characteristics, Fall 2006……………………………………….………… 13
First-Time Entering Freshmen by College & Schools, Fall 2006…………………………………..………. 14
First-Time Freshmen (EFR) by College, School, Department and Declared Major, Fall 2006…………..... 15
SECTION III: Enrollment and Student Characteristics
Full and Part-Time Enrollment by College and Department, Fall 2006 ………………………………….…… 19
Student Enrollment by Ward, Fall 2006 ……………………………………………………………………… 20
Total Enrollment Characteristics, Fall 2006 ………….……………………………………………………….. 21
Student Enrollment by Ethnicity, Fall 2006 ………….……………………………………………………….. 22
Student Enrollment by Age Group, Fall 2006 ………………………………………………………………… 22
David A. Clarke School of Law Enrollment, Fall 2006 ………..……………………………………………. 23
International Student Enrollment, Fall 2006 ………………………………………………………………….. 24
International Enrollment by Country of Origin, Fall 2006 ……………………………………………………. 25
SECTION IV: Admission and First-Time Entering Student Information
Applicants and Admitted Students by Ethnicity and Gender, Spring 2007……..…………………………… 27
First-Time Entering Students Enrolled from DC Public/ Private / Charter Schools, Spring 2007….……. …. 28
First-Time Entering Freshmen Characteristics, Spring 2007………………………………………………..… 29
First-Time Entering Freshmen by College & Schools, Spring 2007…………………………………………. 30
First-Time Freshmen (EFR) by College, School, Department & Declared Major, Spring 2007…….…...….. 31
SECTION V: Enrollment and Student Characteristics
Full and Part Time Enrollment by College and Department, Spring 2007…………………………………… 35
Student Enrollment by Ward, Spring 2007……..………………………………………………………… 36
Total Enrollment, Spring 2007 ………………………………………………………………………………. 37
Student Enrollment by Ethnicity, Spring 2007 ………………………………………………………………. 38
Student Enrollment by Age Group, Spring 2007 ……………………………………………………………. 38
David A. Clarke School of Law Enrollment, Spring 2007 ………………………………………………….. 39
International Student Enrollment, Spring 2007 ……………………………………………………………… 40
International Enrollment by Country-of-Origin, Spring 2007 ………………………………………………. 41
SECTION VI: Academic Programs by College, School and Department
Programs by College, Schools, and Departments ……………………………………………………….…… 43
Program Review by College and Department, Fall Semesters 2006 & 2007 …………………………….…. 45
vi
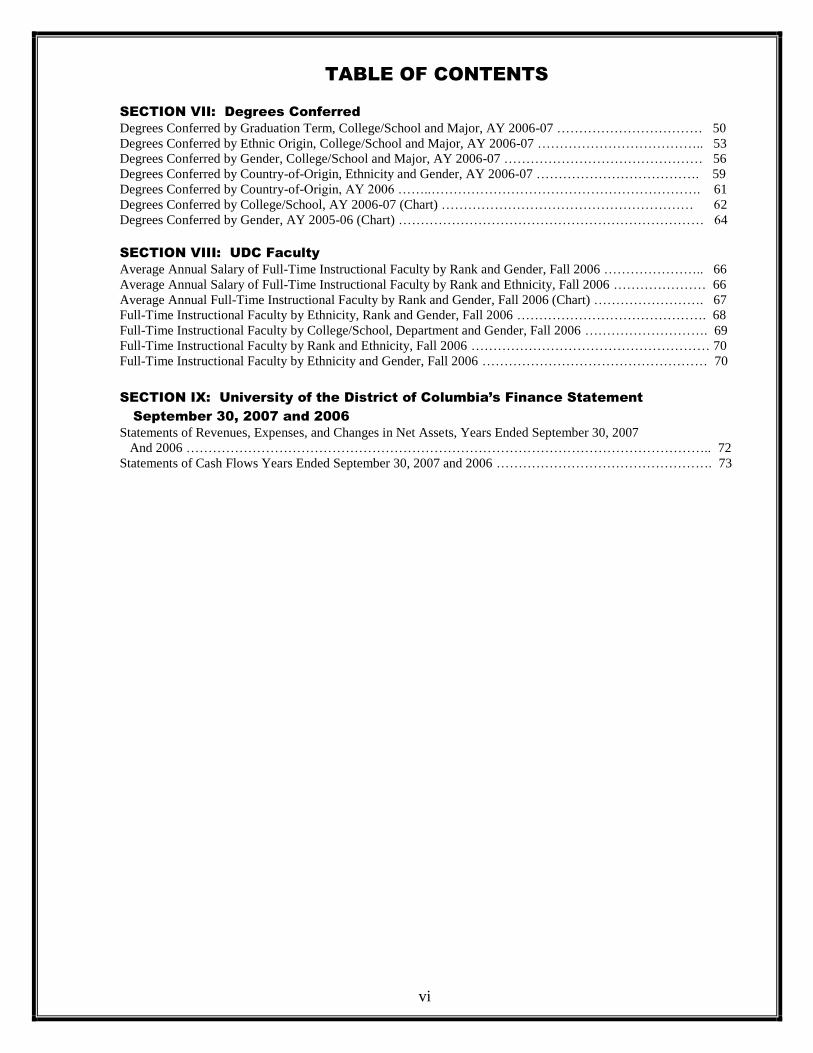
TABLE OF CONTENTS
SECTION VII: Degrees Conferred
Degrees Conferred by Graduation Term, College/School and Major, AY 2006-07 …………………………… 50
Degrees Conferred by Ethnic Origin, College/School and Major, AY 2006-07 ……………………………….. 53
Degrees Conferred by Gender, College/School and Major, AY 2006-07 ……………………………………… 56
Degrees Conferred by Country-of-Origin, Ethnicity and Gender, AY 2006-07 ………………………………. 59
Degrees Conferred by Country-of-Origin, AY 2006 ……..……………………………………………………. 61
Degrees Conferred by College/School, AY 2006-07 (Chart) ………………………………………………… 62
Degrees Conferred by Gender, AY 2005-06 (Chart) …………………………………………………………… 64
SECTION VIII: UDC Faculty
Average Annual Salary of Full-Time Instructional Faculty by Rank and Gender, Fall 2006 ………………….. 66
Average Annual Salary of Full-Time Instructional Faculty by Rank and Ethnicity, Fall 2006 ………………… 66
Average Annual Full-Time Instructional Faculty by Rank and Gender, Fall 2006 (Chart) ……………………. 67
Full-Time Instructional Faculty by Ethnicity, Rank and Gender, Fall 2006 ……………………………………. 68
Full-Time Instructional Faculty by College/School, Department and Gender, Fall 2006 ………………………. 69
Full-Time Instructional Faculty by Rank and Ethnicity, Fall 2006 ……………………………………………… 70
Full-Time Instructional Faculty by Ethnicity and Gender, Fall 2006 …………………………………………… 70
SECTION IX: University of the District of Columbia’s Finance Statement
September 30, 2007 and 2006
Statements of Revenues, Expenses, and Changes in Net Assets, Years Ended September 30, 2007
And 2006 ……………………………………………………………………………………………………….. 72
Statements of Cash Flows Years Ended September 30, 2007 and 2006 …………………………………………. 73

1
SECTION I
General Information
2
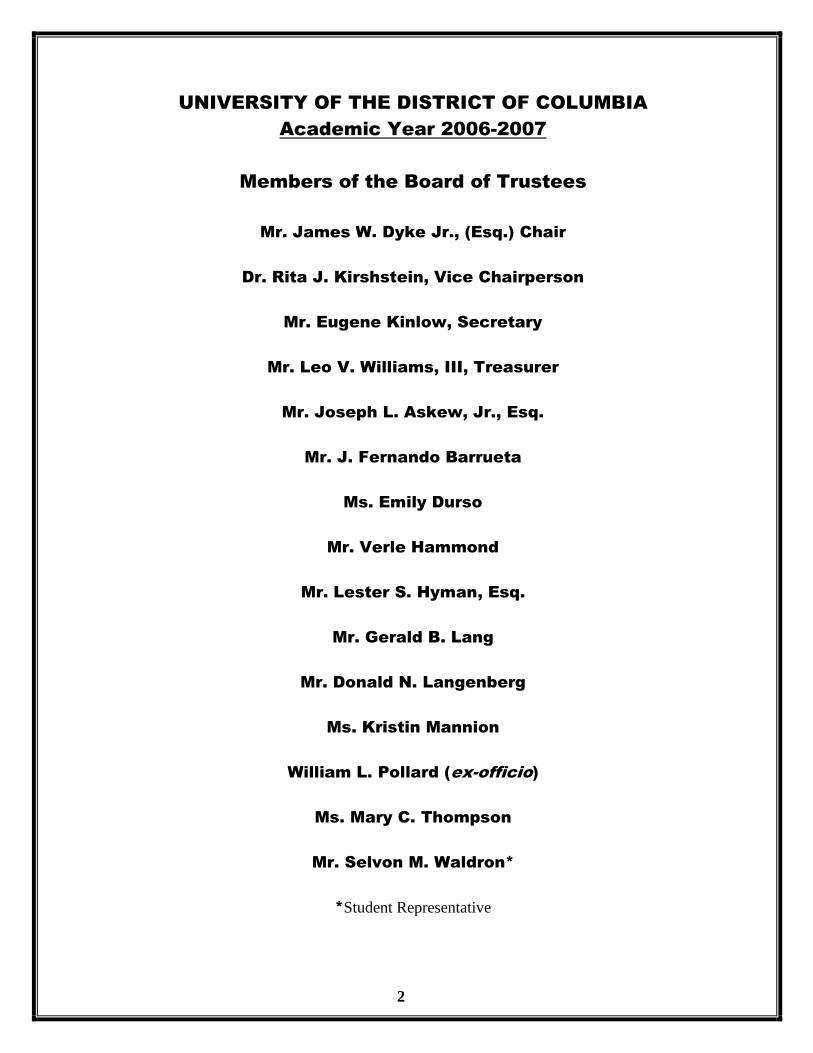
UNIVERSITY OF THE DISTRICT OF COLUMBIA
Academic Year 2006-2007
Members of the Board of Trustees
Mr. James W. Dyke Jr., (Esq.) Chair
Dr. Rita J. Kirshstein, Vice Chairperson
Mr. Eugene Kinlow, Secretary
Mr. Leo V. Williams, III, Treasurer
Mr. Joseph L. Askew, Jr., Esq.
Mr. J. Fernando Barrueta
Ms. Emily Durso
Mr. Verle Hammond
Mr. Lester S. Hyman, Esq.
Mr. Gerald B. Lang
Mr. Donald N. Langenberg
Ms. Kristin Mannion
William L. Pollard (ex-officio)
Ms. Mary C. Thompson
Mr. Selvon M. Waldron*
*Student Representative

3
UNIVERSITY OFFICERS
William L. Pollard, Ph.D., President
Wilhelmina Reuben-Cooke, J.D., Provost and Vice President for Academic Affairs
Stanley Jackson, B.A., Senior Vice President and Chief of Staff
Clemmie Soloman, Ph.D., Vice President for Student Affairs
Bobby W. Austin, Ph.D., Vice President for University Relations and Communications
Robert T. Robinson, M.Ed., Vice President for Public Safety and Emergency Management
Earl C. Cabell, M.B.A., Vice President for Management
Walter D. Watts, J.D., Vice President for Real Estate and Facilities Management
Myles Mutnick, M.B.A., Chief Financial Officer
George Michael Jacks, B.B.A., Vice President for Technology
Wossen Encubahre, Ph.D., Agency Chief Contracting Officer
DEANS
Rachel M. Petty, Ph.D., Dean, College of Arts and Sciences
Melanie A. Anderson, Ph.D., Acting Dean, School of Business and Public Administration
Ben O. Latigo, Ph.D., Dean, School of Engineering and Applied Sciences
Katherine S. Broderick, J.D., Dean, the UDC David A. Clarke School of Law
Gloria Wyche-Moore, Ph.D., Acting Dean, Community Outreach and Extension Services
Albert J. Casciero, M.A., Dean, Division of Learning Resources
ADMINISTRATIVE OFFICERS AND DIRECTORS
Henry Anderson, B.A., Director, Financial Aid
Lucious Anderson, B.S., Acting Director, Continuing Education
Laurie Blackman, B.A., Interim Director, Institute of Gerontology
Joseph Brooks, B.S., Interim Controller, Finance Division
Melba Broome, B.S., Assistant Dean, Learning Resources
Saundra Carter, M.Ed., Director, TRIO and College Preparatory Programs
David Caruth, Ph.D., Director, Office of Institutional Research, Assessment and Planning
Agnita Coleman, M.A., Director, Student Support Services
Alvin Darby, Ph.D., Assistant Dean, School of Engineering and Applied Sciences
Peggy Elder-Mack, Ed.D. Acting Director, vocational and Adult Education Program
Laverne Hill-Flanagan, M.A., Director, Enrollment Services and Registrar
E. Gail Anderson Holness, D.Min., J.D., Director, Community Outreach and Involvement
C. Gerard Johnson, M.S., Director, Campus Services
Edward Jones, Jr., B.A., General Manager, UDC Cable Television
Joan Levermore, M.A., Acting Director, Grants Administration
Deborah L. Lyons, Ph.D., Director, Center for Applied Research and Urban Policy
April Massey, Ph.D., Assistant Dean, College of Arts and Sciences
Vijaya Melnick, Ph.D., Director, Office of Sponsored Research and Programs
Harold Merritt, Ph.D., Director, Intercollegiate Athletics

4
ADMINISTRATIVE OFFICERS AND DIRECTORS
Bertha D. Minus, Ph.D., Associate Provost for Student Retention, Professional
Development,
and International Programs
Kevin Naiker, Ph.D., Director, Counseling and Career Development Center
John Page, M.S., Associate Dean, Learning Resources
Ernesta P. Pendleton, Ed.D. Title III Officer and Special assistant to the Vice President,
Academic Affairs
Christine Poole, B.B.A., Director, Human Resources
Ann Richardson, J.D., Associate Dean, UDC David A. Clarke School of Law
Susan D. Saunders, J.D., Director, Governmental Affairs
Connie Spinner, M.A., State Director, Adult Education Agency
Janice Washington, J.D., Associate Dean, UDC David A. Clarke School of Law
Ray Whitman, Ph.D., Assistant Dean, School of Business and Public Administration

5
MISSION OF THE UNIVERSITY OF THE DISTRICT OF COLUMBIA
The University of the District of Columbia is an urban land-grant institution of higher
education with an open admission policy. Is a comprehensive public institution offering
quality, affordable postsecondary education to the District of Columbia residents at the
certificate, associate’s baccalaureate, and graduate levels. These programs will prepare
students for immediate entry into the workforce, for the next level of education, for
specialized employment opportunities, and for lifelong learning.
UNIVERSITY GOALS
1. Student Access: To ensure the legislative entitlement of the residents of the
District of Columbia to comprehensive public post-secondary education;
2. Student Choice: To offer a broad variety of programs within its available
resources to provide reasonable choices for post-secondary education to the
residents of the District of Columbia that will lead to meaningful employment
opportunities;
3. Student Achievement: To set high standards for student achievement and to
provide quality instruction and support services to enable students to meet those
standards;
4. Land-Grant Functions: To be innovative in carrying out the traditional land-
grant functions of teaching, research, and public service to solve urban community
problems and to improve the overall quality of urban living in the District of
Columbia;
5. Institutional Quality: To ensure institutional excellence in management and
leadership, academic programs, support services, instruction, research and public
service.
6. Institutional Growth and Development: To be responsive to new and emerging
job market demands in the Washington, D.C. Metropolitan Area, and
7. Advancement of Knowledge: To advance knowledge at the local, national, and
international levels through various innovative strategies in teaching, research, and
public service as America’s only public urban land-grant institutions.
6
ACCREDITATION
The University of the District of Columbia is accredited by the Commission on Higher
Education of the Middle States Association of Colleges and Schools, 3624 Market
Street, Philadelphia, PA 19104, (215) 662-5606. The Commission on Higher
Education is an institutional accrediting agency recognized by the U.S. Secretary of
Education and the Commission on Recognition of Postsecondary Accreditation. In
2005, the University received a 10-yrear unconditional reaffirmation of its
accreditation from the Commission on Higher Education of the Middle States
Association of Colleges and Schools.
Specialized Accrediting Bodies
Accreditation Board for Engineering and Technology (ABET)
111 Market Place, Suite 1050
Baltimore, MD 21202
American Board of Funeral Service Education (ABFSE)
13 Garner Road, #316
P.O. Box 1305
Brunswick, ME 04011
American Chemical Society (ACS)
Committee on Professional Training
1155 Sixteenth Street, N.W.
Washington, D.C. 20036
Association of Collegiate Business Schools and Programs (ACBSP)
7007 College Boulevard, Suite 420
Overland Park, Kansas 66211
Committee on Accreditation for Respiratory Care (CoARC)
1248 Harwood Road
Bedford, Texas 76021-4244
Council on Academic Accreditation in Audiology and Speech Language
Pathology (CAA)
10801 Rockville Pike
Rockville, MD 20852
(301) 897-5700
Council on Social Work Education (CSWE)
1600 Duke Street
Alexandria, VA 223134
(703) 683-8080
7
ACCREDITATION
Specialized Accrediting Bodies
Joint Review Committee on Education of Radiologic Technology (JRCERT)
20 North Wacker Drive, Suite 2850
Chicago, IL 60606-3182
National Council for Accreditation of Teacher Education (NCATE)
2010 Massachusetts Avenue, N.W., Suite 500
Washington, D.C. 20036
(202) 466-7496
National League for Nursing Accrediting Commission (NLNAC)
61 Broadway, 33rd
Floor
New York, NY 10006
(212) 363-5555
MEMBERSHIPS
Institutional
American Association of State Colleges and Universities (AASCU)
American Council on Education (ACE)
Association for Intuitional Research (AIR)
Association of Governing Boards of Universities and Colleges (AGB)
College and University Personnel Association (CUPA)
Consortium of Universities of the Washington Metropolitan Area
Council on Undergraduate Research (CUR)
Middle States Association of Colleges and Schools, Inc.
National Association for Equal Opportunity in Higher Education (NAFEO)
National Association of State Universities and Land-Grant Colleges
(NASULGC)
National Association of Student Financial Aid Administrators (NASFAA)
The Greater Washington Board of Trade
8
MEMBERSHIPS
Specialized
Association to Advance Collegiate Schools of Business (AASSB International)
American Association of Colleges for Teacher Education (AATC)
American Association of Colleges of Nursing
American Association of Paralegal Education
American Association for Higher Education
American Mathematical Society (AMS)
American Society for Engineering Education
American Speech-Language-Hearing Association (ASHA)
Association of Collegiate Business Schools and Programs
Association of Collegiate Schools of Architecture
Council of Academic Programs on Communication Sciences and Disorders
(CAPCSD)
Council of Colleges of Arts and Sciences (CCAS)
Council of Colleges of Arts and Sciences in Urban Universities (CCASUU)
Council of Graduate Programs
Council of Graduate Schools
Engineering Accreditation Commission
International Council on Hotel, Restaurant, and Institutional Education
(ICHRIE)
Mathematical Association of America (MAA)
Mid-Atlantic Consortium of Social Work Directors
National Association of Education of Young Children
National Association of Schools of Public Affairs and Administration
National Association of Mathematics (NAM)

9
National Institutes of Water Resources
Society for College and University Planning (SCUP)
Technology Accreditation Commission
MISSION OF THE OFFICE OF INSTITUTIONAL RESEARCH,
ASSESSMENT AND PLANNING
The mission of the Office of Institutional Research, Assessment and Planning is to
enhance institutional effectiveness by providing information that supports academic and
university planning and strengthens assessment and decision making processes for the
administration of the University of the District of Columbia. An integral part of our
mission is to support internal and external requests for information and research regarding
the University including demographic and education related matters.
Goals and Objectives
To support informed decision making throughout the University, independently and
in collaboration with other campus constituencies charged with the responsibility
for data collection, analysis, and presentation of institutional data.
To coordinate institutional data collection efforts that support internal and external
reporting as well as compliance with governing agencies and accreditation bodies.
To provide access to, and to coordinate the release of selected, reliable university-
wide data.
To assist with assessment and program evaluation efforts through the provision of
resources and data.
Provide significant support and coordination for University planning efforts by
collecting, analyzing and summarizing data from operational activities.
Produce facts about the University and engage in special studies when needed.
10
SECTION II
Admission and First-Time
Entering Student
Information
11
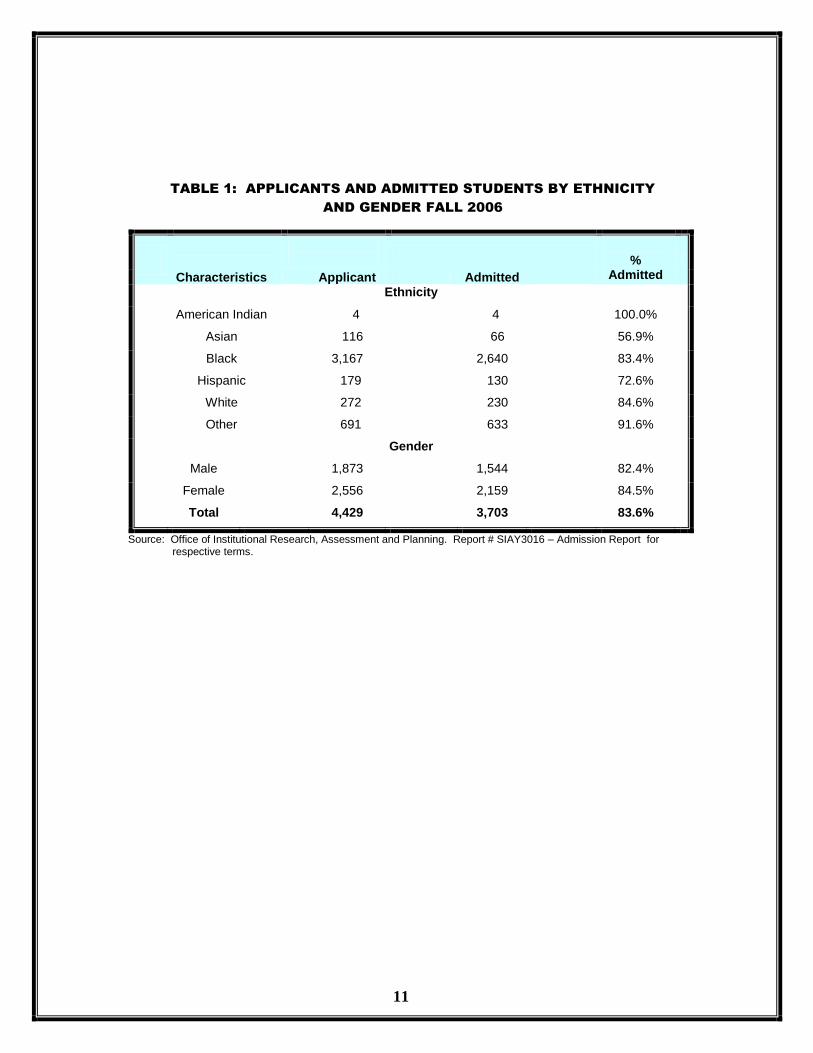
TABLE 1: APPLICANTS AND ADMITTED STUDENTS BY ETHNICITY
AND GENDER FALL 2006
% Admitted
Characteristics Applicant Admitted Ethnicity
American Indian 4 4 100.0%
Asian 116 66 56.9%
Black 3,167 2,640 83.4%
Hispanic 179 130 72.6%
White 272 230 84.6%
Other 691 633 91.6%
Gender
Male 1,873 1,544 82.4%
Female 2,556 2,159 84.5%
Total 4,429 3,703 83.6%
Source: Office of Institutional Research, Assessment and Planning. Report # SIAY3016 – Admission Report for respective terms.
12
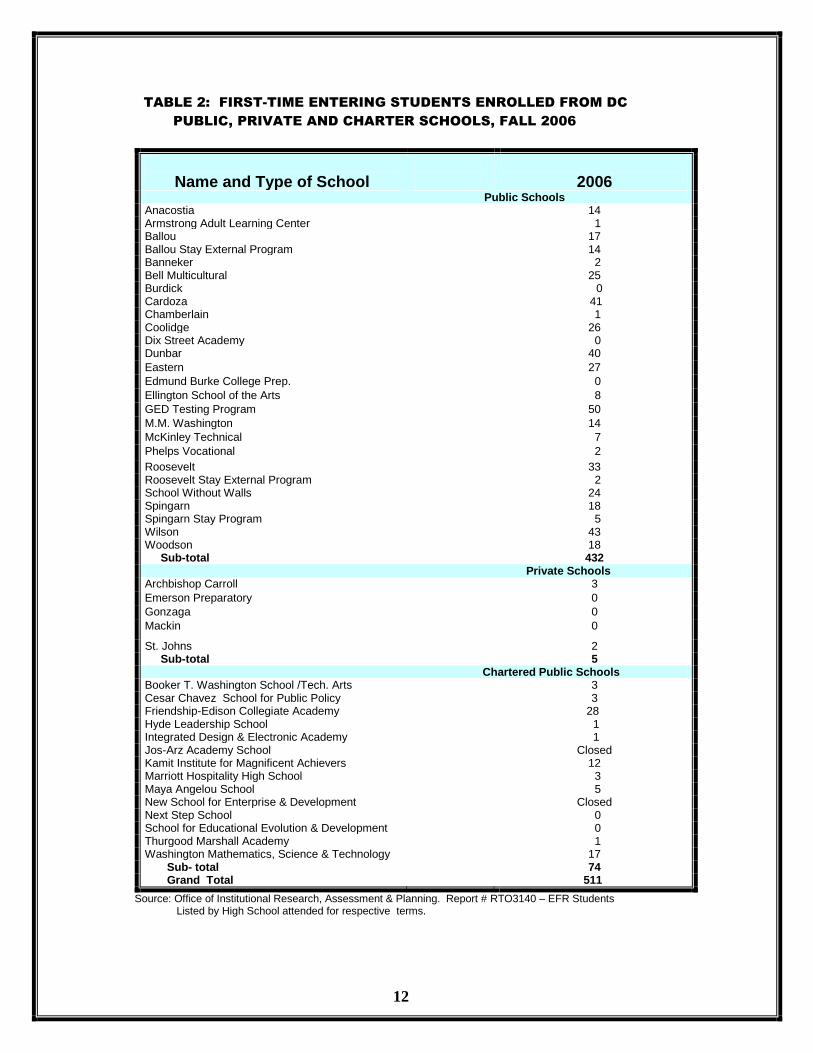
TABLE 2: FIRST-TIME ENTERING STUDENTS ENROLLED FROM DC
PUBLIC, PRIVATE AND CHARTER SCHOOLS, FALL 2006
Name and Type of School
2006
Public Schools Anacostia 14 Armstrong Adult Learning Center 1 Ballou 17 Ballou Stay External Program 14 Banneker 2 Bell Multicultural 25 Burdick 0 Cardoza 41 Chamberlain 1 Coolidge 26 Dix Street Academy 0 Dunbar 40
Eastern 27
Edmund Burke College Prep. 0
Ellington School of the Arts 8
GED Testing Program 50
M.M. Washington 14
McKinley Technical 7
Phelps Vocational 2
Roosevelt 33 Roosevelt Stay External Program 2 School Without Walls 24 Spingarn 18 Spingarn Stay Program 5 Wilson 43 Woodson 18 Sub-total 432
Private Schools Archbishop Carroll 3
Emerson Preparatory 0
Gonzaga 0
Mackin 0
St. Johns 2 Sub-total 5
Chartered Public Schools Booker T. Washington School /Tech. Arts 3 Cesar Chavez School for Public Policy 3 Friendship-Edison Collegiate Academy 28 Hyde Leadership School 1 Integrated Design & Electronic Academy 1 Jos-Arz Academy School Closed Kamit Institute for Magnificent Achievers 12 Marriott Hospitality High School 3 Maya Angelou School 5 New School for Enterprise & Development Closed Next Step School 0 School for Educational Evolution & Development 0 Thurgood Marshall Academy 1 Washington Mathematics, Science & Technology 17 Sub- total 74 Grand Total 511
Source: Office of Institutional Research, Assessment & Planning. Report # RTO3140 – EFR Students Listed by High School attended for respective terms.

13
TABLE 3: FIRST-TIME ENTERING FRESHMEN CHARACTERISTICS
FALL SEMESTER 2006
CHARACTERISTICS
FALL 2006
Number Percent
Total First-Time Freshmen 1,425 100.0%
Academic Workload
Full-Time 932 65.4
Part-Time 493 34.6
Total 1,425 100.0
Residency
Non-Resident 751 52.7
Resident 674 47.3
Total 1,425 100.0
Credit Hours
Full-Time 13,111 79.3
Part-Time 3,427 20.7
Total 16,538 100.0
Gender
Female 708 49.7
Male 717 50.3
Total 1,425 100.0
Full-Time Equivalency (FTE)
Full-Time 874 79.3
Part-Time 228 20.7
Total 1,102 100.0
Ethnicity
American Indian 1 0.1
Asian 34 2.4
Black 784 55.0
Hispanic or Latino 55 3.9
White 83 5.8
Other 468 32.8
Total 1,425 100.0
Source: Office of Institutional Research, Assessment and Planning. Report # EXO3010J – Enrollment Statistics for respective terms.
14
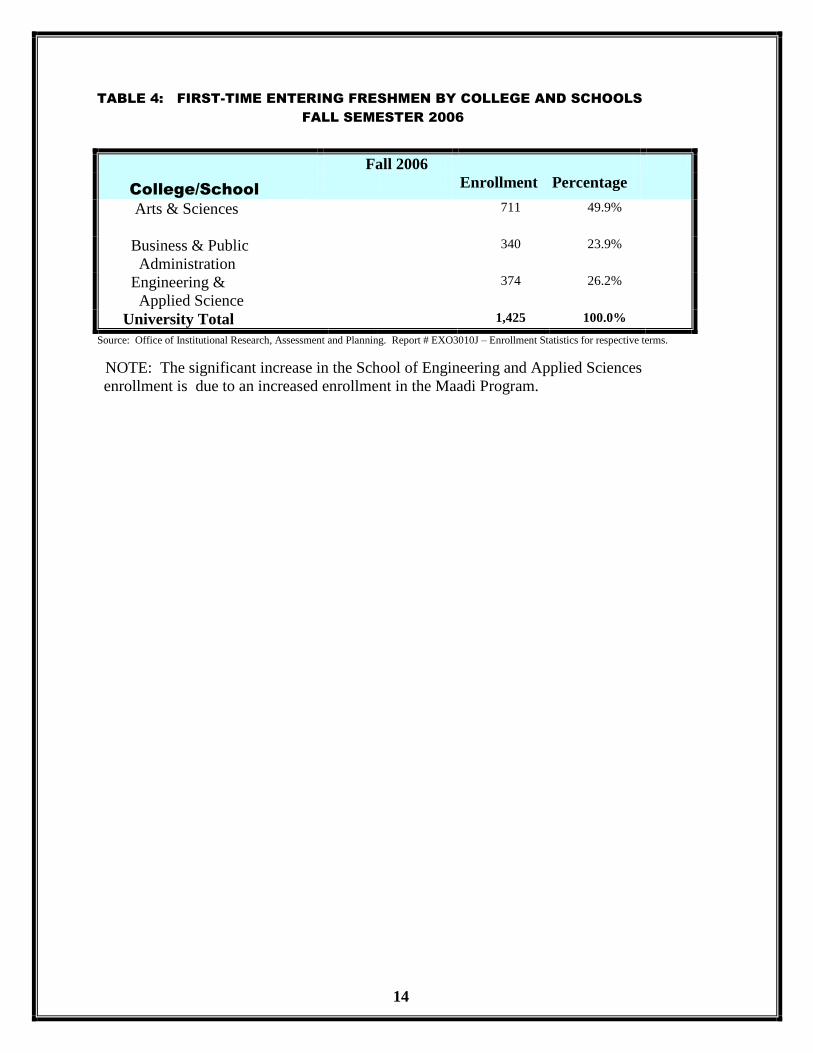
TABLE 4: FIRST-TIME ENTERING FRESHMEN BY COLLEGE AND SCHOOLS
FALL SEMESTER 2006
College/School
Fall 2006
Enrollment Percentage
Arts & Sciences
711 49.9%
Business & Public
Administration
340 23.9%
Engineering &
Applied Science
374 26.2%
University Total 1,425 100.0%
Source: Office of Institutional Research, Assessment and Planning. Report # EXO3010J – Enrollment Statistics for respective terms.
NOTE: The significant increase in the School of Engineering and Applied Sciences
enrollment is due to an increased enrollment in the Maadi Program.

15
TABLE 5: FIRST-TIME FRESHMEN (EFR) BY COLLEGE, SCHOOL, DEPARTMENT,
DECLARED MAJOR, FALL SEMESTER 2006
School/College/Dept./Major
Fall 2006
¤ Students Percent
COLLEGE OF ARTS AND SCIENCES
Education: Child Dev. & Nursery School Educ. (AAS) 48 52.2%
Early Childhood Education (BA) 22 23.9%
Elementary Education (BA) 14 15.2%
Health Education (BS) 7 7.6%
Special Education (BS) 1 1.1%
Department Total 92 100.0%
English Studies: English (BA) 22 100.0%
Department Total 22 100.0%
Language & Communication & Disorders: French (BA) 0 0
Spanish (BA) 1 16.7%
Speech/Language Pathology (BS) 5 83.3%
Department Total 6 100.0%
Mass Media Visual & Performing Arts: Graphic Communications (BS) 8 12.1%
Graphic Design (AA) 10 15.1%
Mass Media Art (BA) 31 47.0%
Music (AA) 0 0
Music (BM) 15 22.7%
Studio Art (BA) 0 0
Theatre Arts (BA) 2 3.0%
Department Total 66 100.0%
Biological & Environmental Science:
Biology (BS) 30 83.3%
Environmental Science (BS) 0 0
Nutrition & Food Science (BS) 6 16.7%
Water Quality & Marine Science (AAS) 0 0
Department Total 36 100.0%
Chemistry & Physics:
Chemistry (BS) 9 69.2%
Physics (BS) 4 30.8%
Department Total 13 100.0%
Mathematics: Mathematics (BS) 3 100.0%
Department Total 3 100.0%
Nursing & Allied Health: Medical Radiography (AAS) 33 15.6%
Mortuary Science (AAS) 12 5.7%
Nursing (AAS) 82 38.6%
Nursing (BS) 75 35.4%
Respiratory Therapy (AAS) 10 4.7%
Department Total 212 100.0%
Source: Office of Institutional Research, Assessment and Planning. Report # RTO3155 – Students Enrolled by Classification for fall 2006.

16
TABLE 6: FIRST-TIME FRESHMEN (EFR) BY COLLEGE, SCHOOL, DEPARTMENT,
DECLARED MAJOR, FALL SEMESTER 2006
School/College/Dept./Major
Fall 2006
Students Percentage
COLLEGE OF ARTS AND SCIENCES
Psychology & Counseling:
Psychology 30 100.0%
Department Total 30 100.0%
Urban Affairs, Social Sciences & Social Work:
Administration of Justice (BA) 30 36.6%
History (BA) 7 8.5%
Corrections Administration (AA) 0 0
Law Enforcement (AS) 6 7.3%
Political Science (BA) 10 12.3%
Social Work (BSW) 20 24.4%
Sociology & Anthropology (BA) 6 7.3%
Urban Studies (BA) 3 3.6%
Department Total 82 100.0%
Undeclared 149 100.0%
College Total 711 (49.9%)
SCHOOL OF BUSINESS AND PUBLIC ADMINISTRATION
Accounting, Finance & Economics:
Accounting (BBA) 86 81.9%
Accounting Technology (AAS) 0 0
Computer Accounting Tech. (AAS) 4 3.8%
Economics (BS) 10 9.5%
Finance (BA) 5 4.8%
Department Total 105 100.0%
Management, Hospitality & Graduate Studies:
Administrative Office Mgt. (AAS) 4 1.7%
Business Management (BBA) 192 81.7%
Business Technology (AAS) 6 2.6%
(Computer Science) Infor. Systems (BA) 7 3.0%
Hospitality Mgt. & Tourism (AAS) 9 3.8%
Legal Assistant (AAS) 2 0.8%
Marketing (BBA) 10 4.3%
Office Administration (BS) 4 1.7%
Procurement & Pub. Cont.(BBA) 1 0.4%
Department Total 235 100.0%
School Total 340 (23.9%)
SCHOOL OF ENGINEERING AND APPLIED SCIENCES
Engineering, Architecture & Aerospace Technology:
Airway Science (BS) 3 3.8%
Arch. Engineering Technology (AAS) 4 5.1%
Architecture (BA) 5 6.4%
Aviation Maintenance (AAS) 9 11.5%
Civil Engineering (BS) 7 9.0%
Construction Engineering Tech. (BS) 0 0
Fire Science (AAS) 8 10.3%
Fire Science Administration (BS) 12 15.4%
Mechanical Engineering (BS) 30 38.5%
Department Total 78 100.0%
Source: Office of Institutional Research, Assessment and Planning. Report # RTO3155 – Students Enrolled by Classification for fall semester
2006.
17
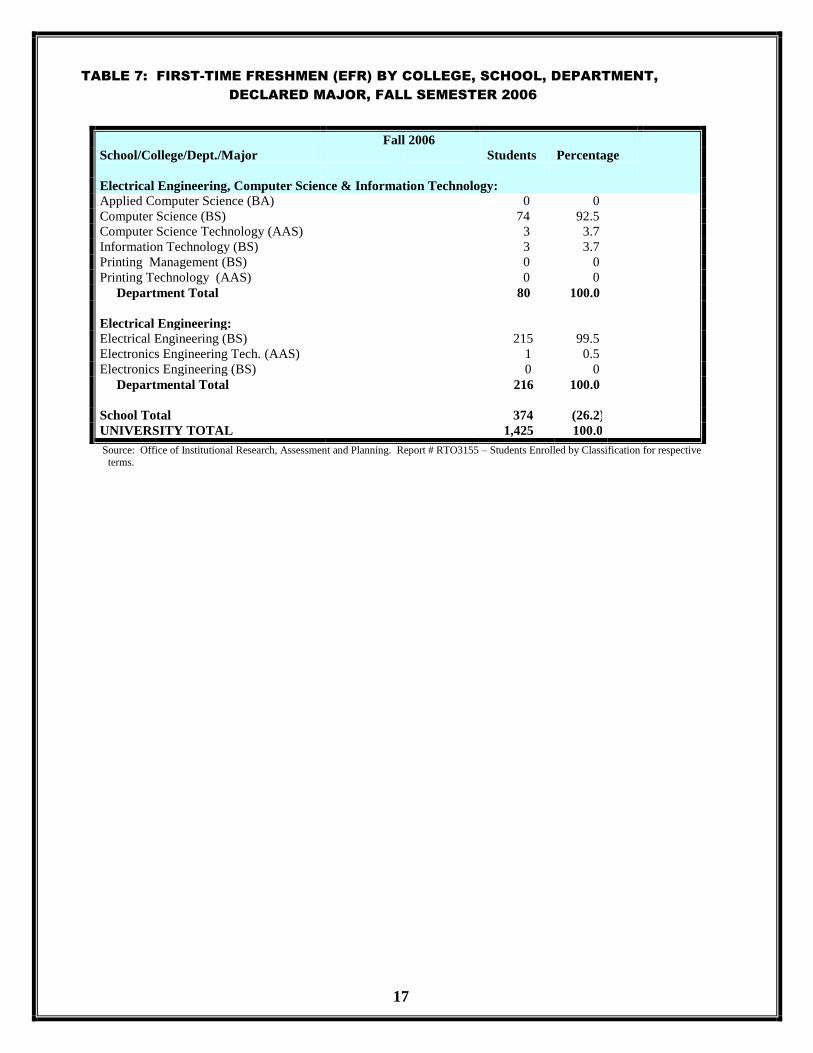
TABLE 7: FIRST-TIME FRESHMEN (EFR) BY COLLEGE, SCHOOL, DEPARTMENT,
DECLARED MAJOR, FALL SEMESTER 2006
School/College/Dept./Major
Fall 2006
Students Percentage
Electrical Engineering, Computer Science & Information Technology:
Applied Computer Science (BA) 0 0
Computer Science (BS) 74 92.5
Computer Science Technology (AAS) 3 3.7
Information Technology (BS) 3 3.7
Printing Management (BS) 0 0
Printing Technology (AAS) 0 0
Department Total 80 100.0
Electrical Engineering:
Electrical Engineering (BS) 215 99.5
Electronics Engineering Tech. (AAS) 1 0.5
Electronics Engineering (BS) 0 0
Departmental Total 216 100.0
School Total 374 (26.2)
UNIVERSITY TOTAL 1,425 100.0
Source: Office of Institutional Research, Assessment and Planning. Report # RTO3155 – Students Enrolled by Classification for respective terms.

18
SECTION III
ENROLLMENT AND
STUDENT
CHARACTERISTICS
FALL SEMESTER 2006

19
TABLE 8: FULL AND PART TIME ENROLLMENT BY COLLEGE AND DEPARTMENT
FALL SEMESTER 2006
College/Department Full Time Part Time Total UG G Total UG G Total
College of Arts and Sciences Education
255 1 256 455 5 460 716
English 27 3 30 36 11 47 77
Languages and Communication Disorders 31 16 47 30 8 38 85
Mass Media, Visual and Performing Arts 187 0 187 176 0 176 363
Biological and Environmental Sciences 126 4 130 90 2 92 222
Chemistry and Physics 33 0 33 23 0 23 56
Mathematics 7 2 9 14 1 15 24
Nursing and Allied Health 290 0 290 318 0 318 608
Psychology and Counseling 60 16 76 80
25
105 181
Urban Affairs, Social Sci. & Soc. Work 189 0 189 194
0
194 383
Subtotal 1205 42 1247 1416 52 1468 2715
School of Business and Public Administration Accounting, Finance and Economics 234 0 234 128 0 128 362
Mgt. Marketing and Information Systems 420 42 462 321 41 362 824 Subtotal 654 42 696 449 41 490 1186
School of Engineering and Applied Science Architecture, Graphic Comm. & Design 74 0 74 51 0 51 125
Engineering and Aerospace Technology 318 0 318 196 0 196 514
Electrical Eng. And Computer Science 121 0 121 79 0 79 200
Subtotal 513 0 513 326 0 326 839
Undeclared 375 7 382 362 50 412 794
University Total
2447
91
2838
2533
143
2696
5534
Source: Office of Institutional Research, Assessment and Planning. Report #: RTO3270 – Full/Part-Time Enrollment & Student FTE, 2005.
20
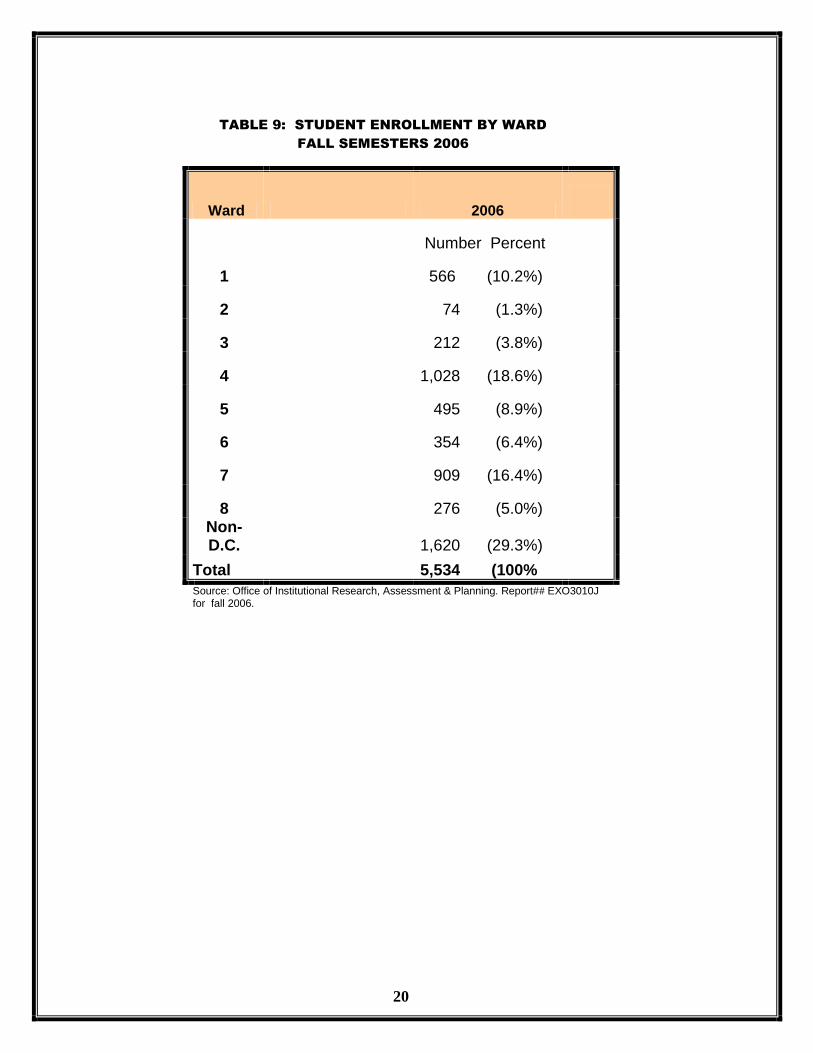
TABLE 9: STUDENT ENROLLMENT BY WARD
FALL SEMESTERS 2006
Ward 2006
Number Percent
1 566 (10.2%)
2 74 (1.3%)
3 212 (3.8%)
4 1,028 (18.6%)
5 495 (8.9%)
6 354 (6.4%)
7 909 (16.4%)
8 276 (5.0%) Non-D.C. 1,620 (29.3%)
Total 5,534 (100%
Source: Office of Institutional Research, Assessment & Planning. Report## EXO3010J for fall 2006.
21
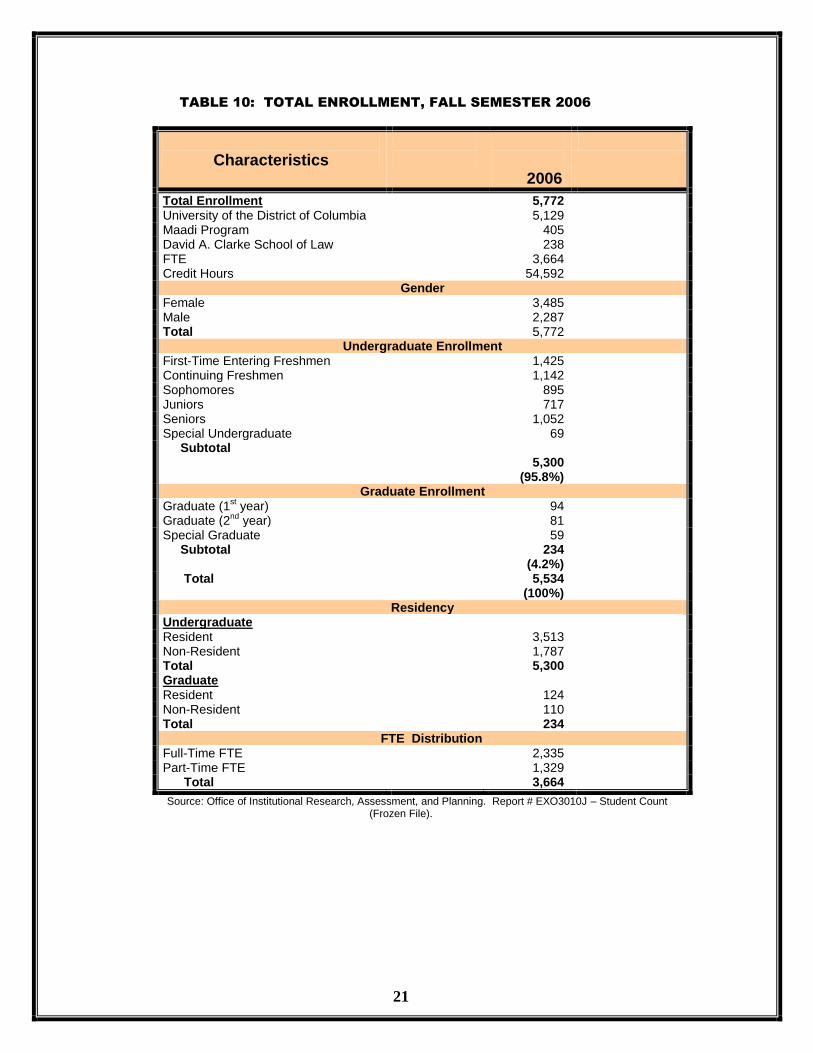
TABLE 10: TOTAL ENROLLMENT, FALL SEMESTER 2006
Source: Office of Institutional Research, Assessment, and Planning. Report # EXO3010J – Student Count (Frozen File).
Characteristics
2006
Total Enrollment 5,772 University of the District of Columbia 5,129 Maadi Program 405 David A. Clarke School of Law 238 FTE 3,664 Credit Hours 54,592
Gender Female 3,485 Male 2,287 Total 5,772
Undergraduate Enrollment First-Time Entering Freshmen 1,425 Continuing Freshmen 1,142 Sophomores 895 Juniors 717 Seniors 1,052 Special Undergraduate 69 Subtotal
5,300 (95.8%)
Graduate Enrollment Graduate (1
st year) 94
Graduate (2nd
year) 81 Special Graduate 59 Subtotal 234
(4.2%)
Total 5,534 (100%)
Residency Undergraduate Resident 3,513 Non-Resident 1,787 Total 5,300 Graduate Resident 124 Non-Resident 110 Total 234 FTE Distribution Full-Time FTE 2,335 Part-Time FTE 1,329 Total 3,664

22
TABLE 11: STUDENT ENROLLMENT BY ETHNICITY FALL SEMESTERS 2006
ETHNICITY
2006
NUMBER PERCENT
Black 4,039 73.0%
American Indian 6 0.1%
Asian 133 2.4%
Hispanic 291 5.3%
White 350 6.3%
Unspecified 715 12.9%
Total 5,534 100%
TABLE 12: STUDENT ENROLLMENT BY AGE GROUP
FALL SEMESTERS 2006
Age Group 2006
Number Percent
< 18 179 3.2% 18-19 805 14.5% 20-21 624 11.3% 22-24 825 14.9% 25-29 965 17.4% 30-34 591 10.7% 35-39 424 7.7% 40-49 654 11.8% 50-64 393 7.1% 65+ 74 1.3%
Total 5,534 100% Source: Office of Institutional Research, Assessment and Planning. Report# EXO3010J for respective terms.

23
TABLE 13: DAVID A. CLARKE SCHOOL OF LAW ENROLLMENT
FALL SEMESTERS 2006
Characteristics
2006
Total Enrollment 238
Total FTE 238.0
Total Credit Hours 3,493
Classification
First Year 96
Second Year 70
Third Year 69
Total 235
Residency
Resident 100
Non-Resident 138
Total 238
Gender
Female 146
Male 92
Total 238
Non-Degree Students
Full-Time 0
Part-Time 3
Total 3
Source: Office of Institutional Research, Assessment & Planning. David A. Clarke School of Law, Office of the Registrar.
24
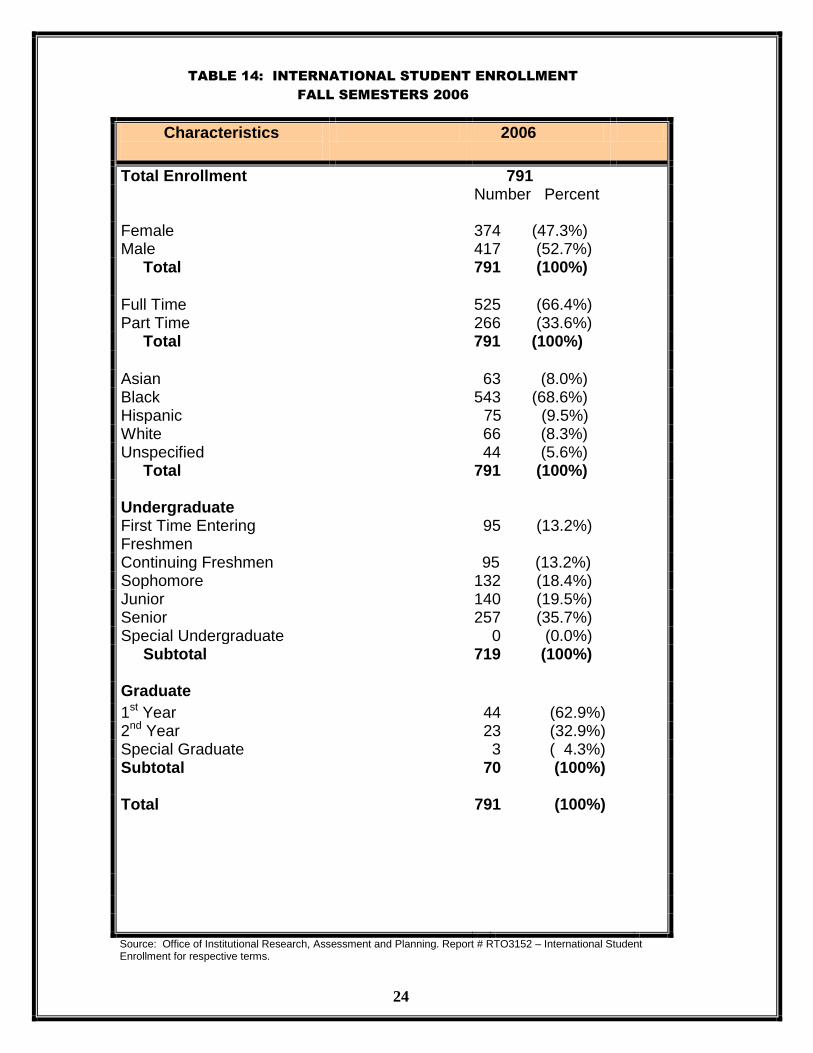
TABLE 14: INTERNATIONAL STUDENT ENROLLMENT
FALL SEMESTERS 2006
Characteristics
2006
Total Enrollment 791 Number Percent
Female Male
374 (47.3%) 417 (52.7%)
Total 791 (100%)
Full Time Part Time
525 (66.4%) 266 (33.6%)
Total 791 (100%) 266 (33.6%)
Asian 63 (8.0%) Black 543 (68.6%) Hispanic 75 (9.5%) 75 (9.5%) White 66 (8.3%) Unspecified 44 (5.6%) Total 791 (100%) Undergraduate First Time Entering Freshmen
95 (13.2%)
Continuing Freshmen 95 (13.2%) 95 (13.2%) Sophomore 132 (18.4%) Junior 140 (19.5%) Senior 257 (35.7%) Special Undergraduate 0 (0.0%) Subtotal 719 (100%) Graduate
1st Year 44 (62.9%) 2nd Year 23 (32.9%) Special Graduate 3 ( 4.3%) Subtotal 70 (100%)
Total
791 (100%)
Source: Office of Institutional Research, Assessment and Planning. Report # RTO3152 – International Student Enrollment for respective terms.

25
TABLE 15: INTERNATIONAL ENROLLMENT BY COUNTRY OF ORIGIN
FALL SEMESTERS 2006
(Top 11 Countries)
Country of Origin
2006
Enrollment Percentage
Nigeria 62 7.8% Kenya 56 7.2% Ethiopia 59 7.4% Cameroon 36 4.6% Mali 24 3.0% Liberia 9 1.1% Senegal 20 2.5% Trinidad 26 3.3% Ghana 14 1.8% Turkey 17 2.1% Vietnam 11 1.4% Other Countries
457 57.8%
Total 791 100.0% No. of Countries Served
97
Source: Office of Institutional Research, Assessment & Planning. Report # RTO3152 – International Student Enrollment for fall semester 2006.

26
SECTION IV
Admission and First-Time
Entering Student
Information
SPRING 2007
27
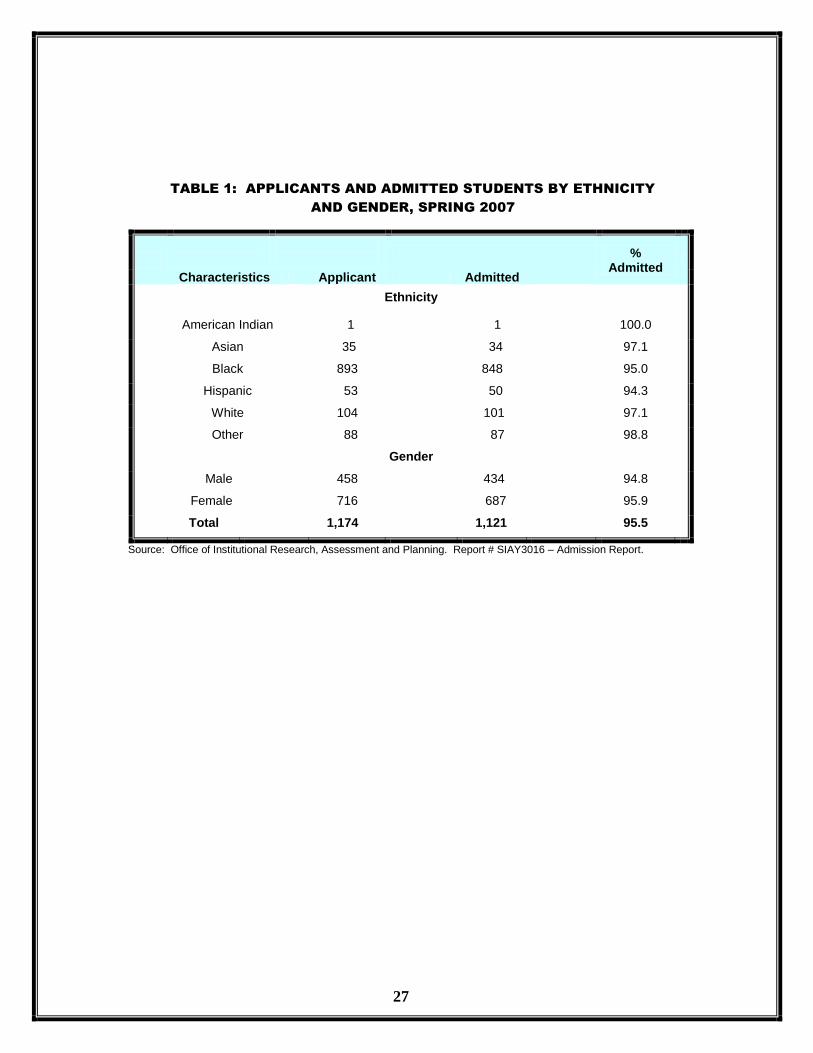
TABLE 1: APPLICANTS AND ADMITTED STUDENTS BY ETHNICITY
AND GENDER, SPRING 2007
% Admitted
Characteristics Applicant Admitted
Ethnicity
American Indian 1 1 100.0
Asian 35 34 97.1
Black 893 848 95.0
Hispanic 53 50 94.3
White 104 101 97.1
Other 88 87 98.8
Gender
Male 458 434 94.8
Female 716 687 95.9
Total 1,174 1,121 95.5
Source: Office of Institutional Research, Assessment and Planning. Report # SIAY3016 – Admission Report.
28
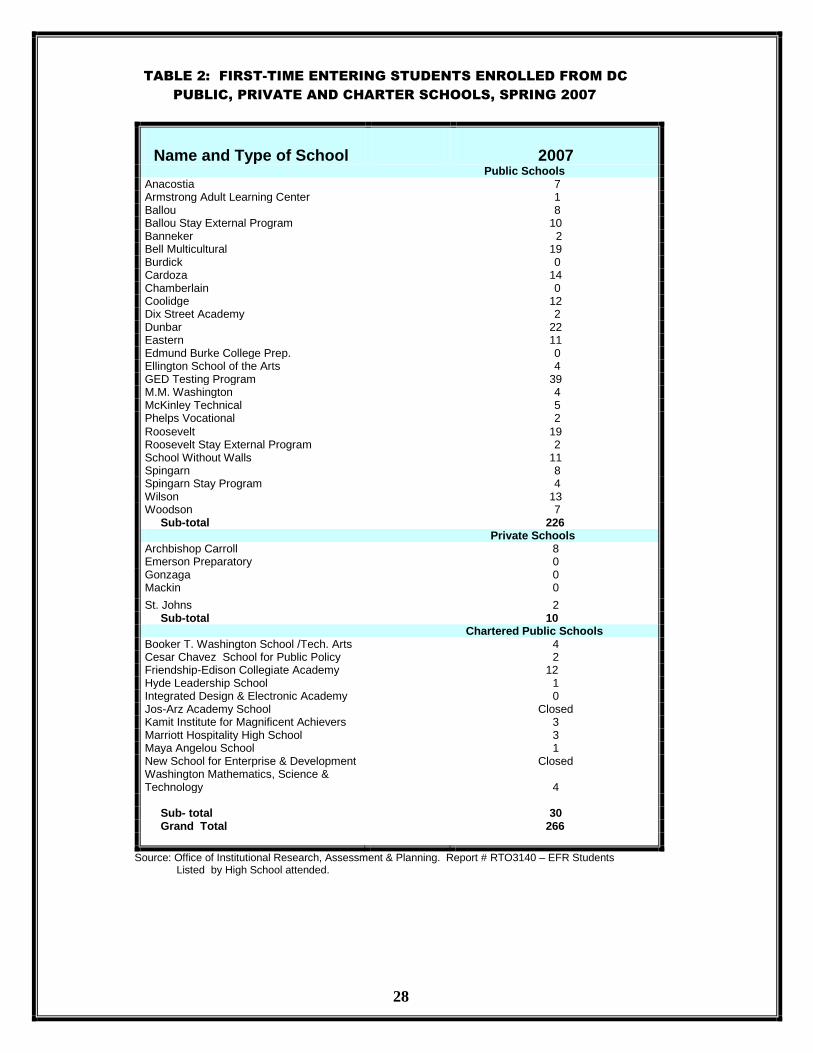
TABLE 2: FIRST-TIME ENTERING STUDENTS ENROLLED FROM DC
PUBLIC, PRIVATE AND CHARTER SCHOOLS, SPRING 2007
Name and Type of School
2007
Public Schools Anacostia 7 Armstrong Adult Learning Center 1 Ballou 8 Ballou Stay External Program 10 Banneker 2 Bell Multicultural 19 Burdick 0 Cardoza 14 Chamberlain 0 Coolidge 12 Dix Street Academy 2 Dunbar 22 Eastern 11 Edmund Burke College Prep. 0 Ellington School of the Arts 4 GED Testing Program 39 M.M. Washington 4 McKinley Technical 5 Phelps Vocational 2
Roosevelt 19 Roosevelt Stay External Program 2 School Without Walls 11 Spingarn 8 Spingarn Stay Program 4 Wilson 13 Woodson 7 Sub-total 226
Private Schools Archbishop Carroll 8 Emerson Preparatory 0 Gonzaga 0 Mackin 0
St. Johns 2 Sub-total 10
Chartered Public Schools Booker T. Washington School /Tech. Arts 4 Cesar Chavez School for Public Policy 2 Friendship-Edison Collegiate Academy 12 Hyde Leadership School 1 Integrated Design & Electronic Academy 0 Jos-Arz Academy School Closed Kamit Institute for Magnificent Achievers 3 Marriott Hospitality High School 3 Maya Angelou School 1 New School for Enterprise & Development Washington Mathematics, Science & Technology
Closed
4 Sub- total 30 Grand Total 266
Source: Office of Institutional Research, Assessment & Planning. Report # RTO3140 – EFR Students Listed by High School attended.
29
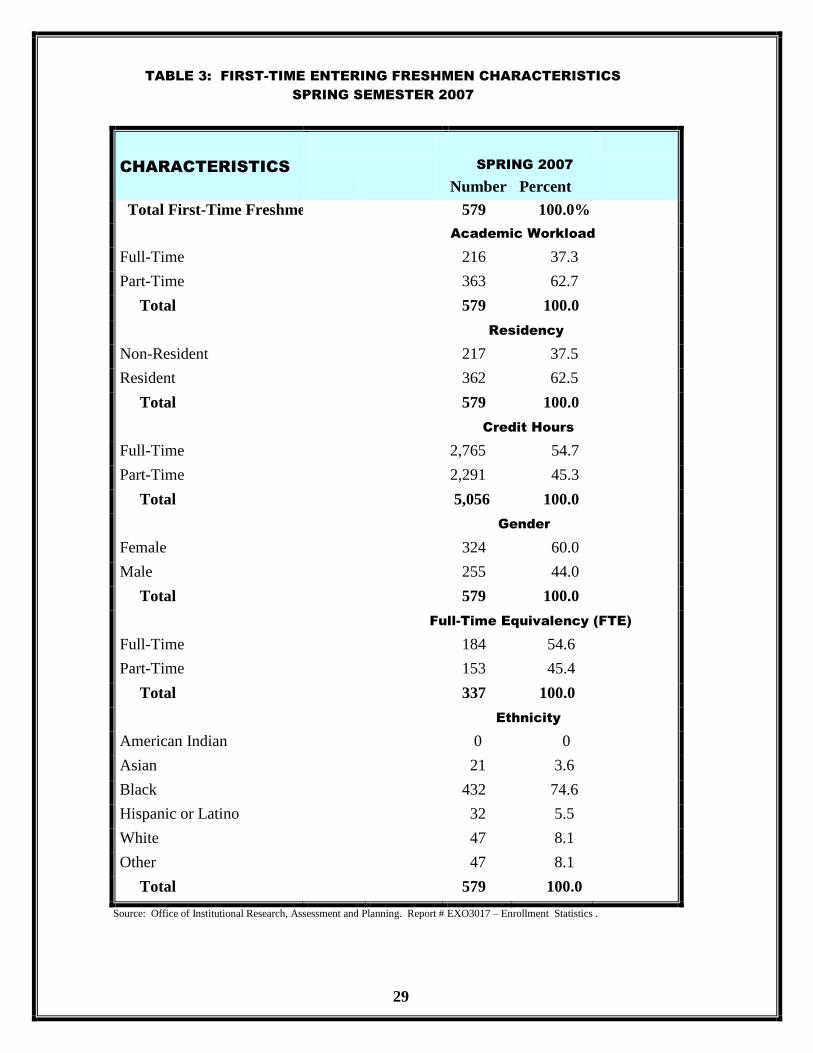
TABLE 3: FIRST-TIME ENTERING FRESHMEN CHARACTERISTICS
SPRING SEMESTER 2007
CHARACTERISTICS
SPRING 2007
Number Percent
Total First-Time Freshmen 579 100.0%
Academic Workload
Full-Time 216 37.3
Part-Time 363 62.7
Total 579 100.0
Residency
Non-Resident 217 37.5
Resident 362 62.5
Total 579 100.0
Credit Hours
Full-Time 2,765 54.7
Part-Time 2,291 45.3
Total 5,056 100.0
Gender
Female 324 60.0
Male 255 44.0
Total 579 100.0
Full-Time Equivalency (FTE)
Full-Time 184 54.6
Part-Time 153 45.4
Total 337 100.0
Ethnicity
American Indian 0 0
Asian 21 3.6
Black 432 74.6
Hispanic or Latino 32 5.5
White 47 8.1
Other 47 8.1
Total 579 100.0
Source: Office of Institutional Research, Assessment and Planning. Report # EXO3017 – Enrollment Statistics .

30
TABLE 4: FIRST-TIME ENTERING FRESHMEN BY COLLEGE AND SCHOOLS
SPRING SEMESTER 2007
College/School
Spring 2007
Enrollment Percentage
Arts & Sciences
391 69.7
Business & Public
Administration
109 19.4
Engineering &
Applied Science
61 10.9
University Total 561 100.0%
Source: Office of Institutional Research, Assessment and Planning. Report # EXO3010J – Enrollment Statistics for respective terms.
NOTE: The significant increase in the School of Engineering and Applied Sciences
enrollment is due to an increased enrollment in the Maadi Program.

31
TABLE 5: FIRST-TIME FRESHMEN (EFR) BYCOLLEGE, SCHOOL, DEPARTMENT,
DECLARED MAJOR, SPRING SEMESTER 2007
School/College/Dept./Major
Spring 2007
¤ Students Percent
COLLEGE OF ARTS AND SCIENCES
Education: Child Dev. & Nursery School Educ. (AAS) 20 55.6
Early Childhood Education (BA) 7 19.4
Elementary Education (BA) 7 19.4
Health Education (BS) 2 5.6
Special Education (BS) 0 0
Department Total 36 100.0%
English Studies: English (BA) 9 100.0%
Department Total 9 100.0%
Language & Communication & Disorders: French (BA) 2 25.0
Spanish (BA) 2 25.0
Speech/Language Pathology (BS) 4 50.0
Department Total 8 100.0%
Mass Media Visual & Performing Arts: Graphic Communications (BS) 5 11.9
Graphic Design (AA) 11 26.2
Mass Media Art (BA) 14 33.3
Music (AA) 1 2.4
Music (BM) 6 14.3
Studio Art (BA) 0 0
Theatre Arts (BA) 5 11.9
Department Total 42 100.0%
Biological & Environmental Science:
Biology (BS) 19 90.5
Environmental Science (BS) 0 0
Nutrition & Food Science (BS) 2 9.5
Water Quality & Marine Science (AAS) 0 0
Department Total 21 100.0%
Chemistry & Physics:
Chemistry (BS) 6 100.0
Physics (BS) 0 0
Department Total 6 100.0%
Mathematics: Mathematics (BS) 1 100.0
Department Total 1 100.0%
Nursing & Allied Health: Medical Radiography (AAS) 13 13.4
Mortuary Science (AAS) 10 10.3
Nursing (AAS) 36 37.1
Nursing (BS) 34 35.1
Respiratory Therapy (AAS) 4 4.1
Department Total 97 100.0%
Source: Office of Institutional Research, Assessment and Planning. Report # RTO3155 – Students Enrolled by Classification for Spring 2007.
32
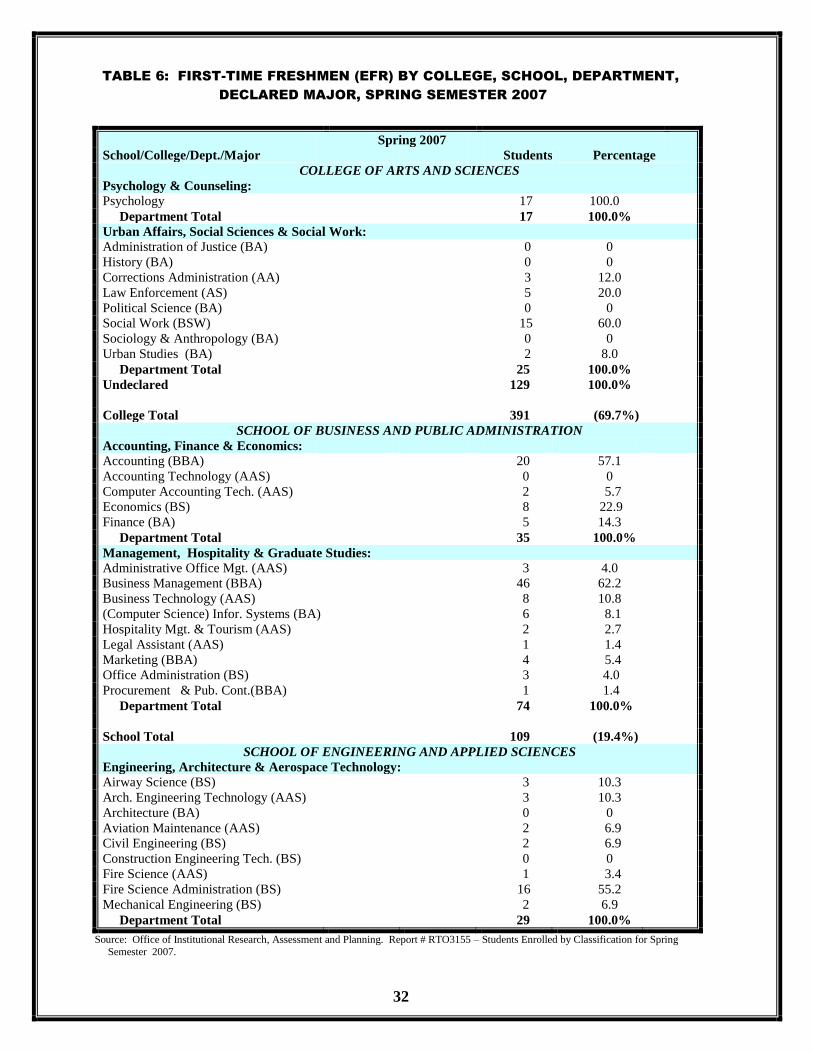
TABLE 6: FIRST-TIME FRESHMEN (EFR) BY COLLEGE, SCHOOL, DEPARTMENT,
DECLARED MAJOR, SPRING SEMESTER 2007
School/College/Dept./Major
Spring 2007
Students Percentage
COLLEGE OF ARTS AND SCIENCES
Psychology & Counseling:
Psychology 17 100.0
Department Total 17 100.0%
Urban Affairs, Social Sciences & Social Work:
Administration of Justice (BA) 0 0
History (BA) 0 0
Corrections Administration (AA) 3 12.0
Law Enforcement (AS) 5 20.0
Political Science (BA) 0 0
Social Work (BSW) 15 60.0
Sociology & Anthropology (BA) 0 0
Urban Studies (BA) 2 8.0
Department Total 25 100.0%
Undeclared 129 100.0%
College Total 391 (69.7%)
SCHOOL OF BUSINESS AND PUBLIC ADMINISTRATION
Accounting, Finance & Economics:
Accounting (BBA) 20 57.1
Accounting Technology (AAS) 0 0
Computer Accounting Tech. (AAS) 2 5.7
Economics (BS) 8 22.9
Finance (BA) 5 14.3
Department Total 35 100.0%
Management, Hospitality & Graduate Studies:
Administrative Office Mgt. (AAS) 3 4.0
Business Management (BBA) 46 62.2
Business Technology (AAS) 8 10.8
(Computer Science) Infor. Systems (BA) 6 8.1
Hospitality Mgt. & Tourism (AAS) 2 2.7
Legal Assistant (AAS) 1 1.4
Marketing (BBA) 4 5.4
Office Administration (BS) 3 4.0
Procurement & Pub. Cont.(BBA) 1 1.4
Department Total 74 100.0%
School Total 109 (19.4%)
SCHOOL OF ENGINEERING AND APPLIED SCIENCES
Engineering, Architecture & Aerospace Technology:
Airway Science (BS) 3 10.3
Arch. Engineering Technology (AAS) 3 10.3
Architecture (BA) 0 0
Aviation Maintenance (AAS) 2 6.9
Civil Engineering (BS) 2 6.9
Construction Engineering Tech. (BS) 0 0
Fire Science (AAS) 1 3.4
Fire Science Administration (BS) 16 55.2
Mechanical Engineering (BS) 2 6.9
Department Total 29 100.0%
Source: Office of Institutional Research, Assessment and Planning. Report # RTO3155 – Students Enrolled by Classification for Spring
Semester 2007.

33
TABLE 7: FIRST-TIME FRESHMEN (EFR) BY COLLEGE, SCHOOL, DEPARTMENT,
DECLARED MAJOR, SPRING SEMESTER 2007
School/College/Dept./Major
Spring 2007
Students Percentage
Electrical Engineering, Computer Science & Information Technology:
Applied Computer Science (BA) 0 0
Computer Science (BS) 14 82.4
Computer Science Technology (AAS) 3 17.6
Information Technology (BS) 0 0
Printing Management (BS) 0 0
Printing Technology (AAS) 0 0
Department Total 17 100.0
Electrical Engineering:
Electrical Engineering (BS) 13 86.7
Electronics Engineering Tech. (AAS) 2 13.3
Electronics Engineering (BS) 0
Departmental Total 15 100.0
School Total 61 (10.9%).0
UNIVERSITY TOTAL 561 100.0
Source: Office of Institutional Research, Assessment and Planning. Report # RTO3155 – Students Enrolled by Classification for respective terms.

34
SECTION V
ENROLLMENT AND
STUDENT
CHARACTERISTICS
SPRING SEMESTER 2007
35
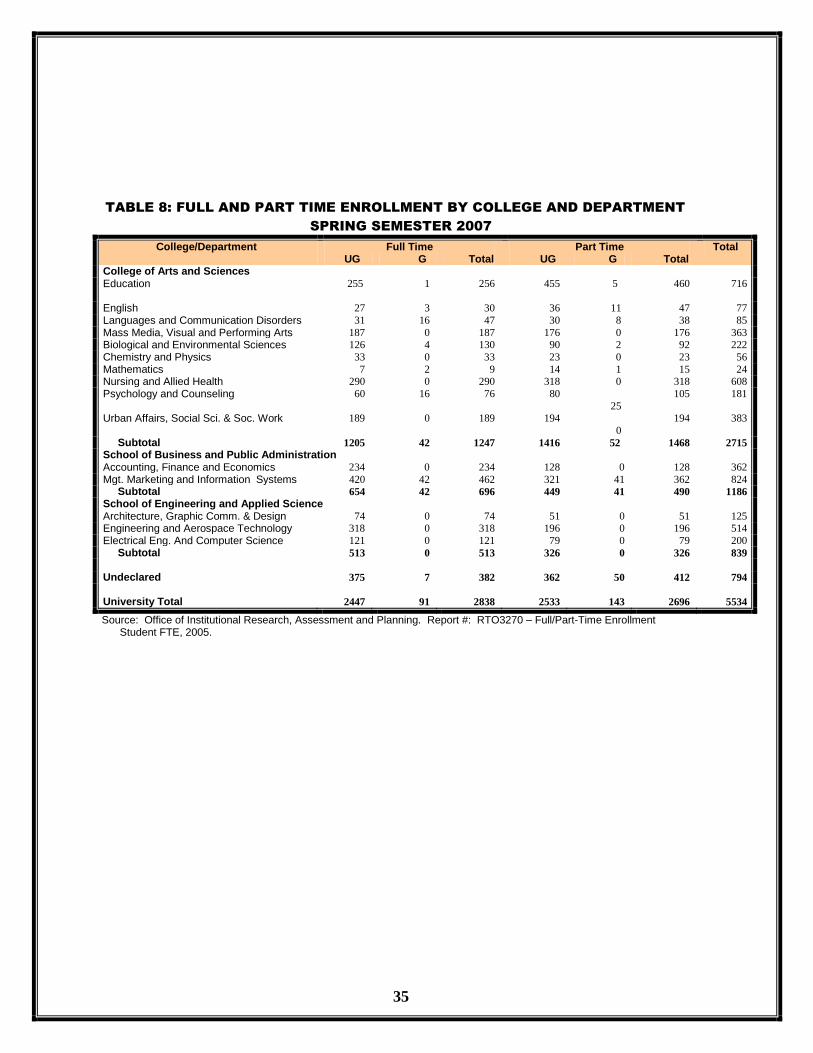
TABLE 8: FULL AND PART TIME ENROLLMENT BY COLLEGE AND DEPARTMENT
SPRING SEMESTER 2007
College/Department Full Time Part Time Total UG G Total UG G Total
College of Arts and Sciences Education
255 1 256 455 5 460 716
English 27 3 30 36 11 47 77
Languages and Communication Disorders 31 16 47 30 8 38 85
Mass Media, Visual and Performing Arts 187 0 187 176 0 176 363
Biological and Environmental Sciences 126 4 130 90 2 92 222
Chemistry and Physics 33 0 33 23 0 23 56
Mathematics 7 2 9 14 1 15 24
Nursing and Allied Health 290 0 290 318 0 318 608
Psychology and Counseling 60 16 76 80
25
105 181
Urban Affairs, Social Sci. & Soc. Work 189 0 189 194
0
194 383
Subtotal 1205 42 1247 1416 52 1468 2715
School of Business and Public Administration Accounting, Finance and Economics 234 0 234 128 0 128 362
Mgt. Marketing and Information Systems 420 42 462 321 41 362 824 Subtotal 654 42 696 449 41 490 1186
School of Engineering and Applied Science Architecture, Graphic Comm. & Design 74 0 74 51 0 51 125
Engineering and Aerospace Technology 318 0 318 196 0 196 514
Electrical Eng. And Computer Science 121 0 121 79 0 79 200
Subtotal 513 0 513 326 0 326 839
Undeclared 375 7 382 362 50 412 794
University Total
2447
91
2838
2533
143
2696
5534
Source: Office of Institutional Research, Assessment and Planning. Report #: RTO3270 – Full/Part-Time Enrollment Student FTE, 2005.
36
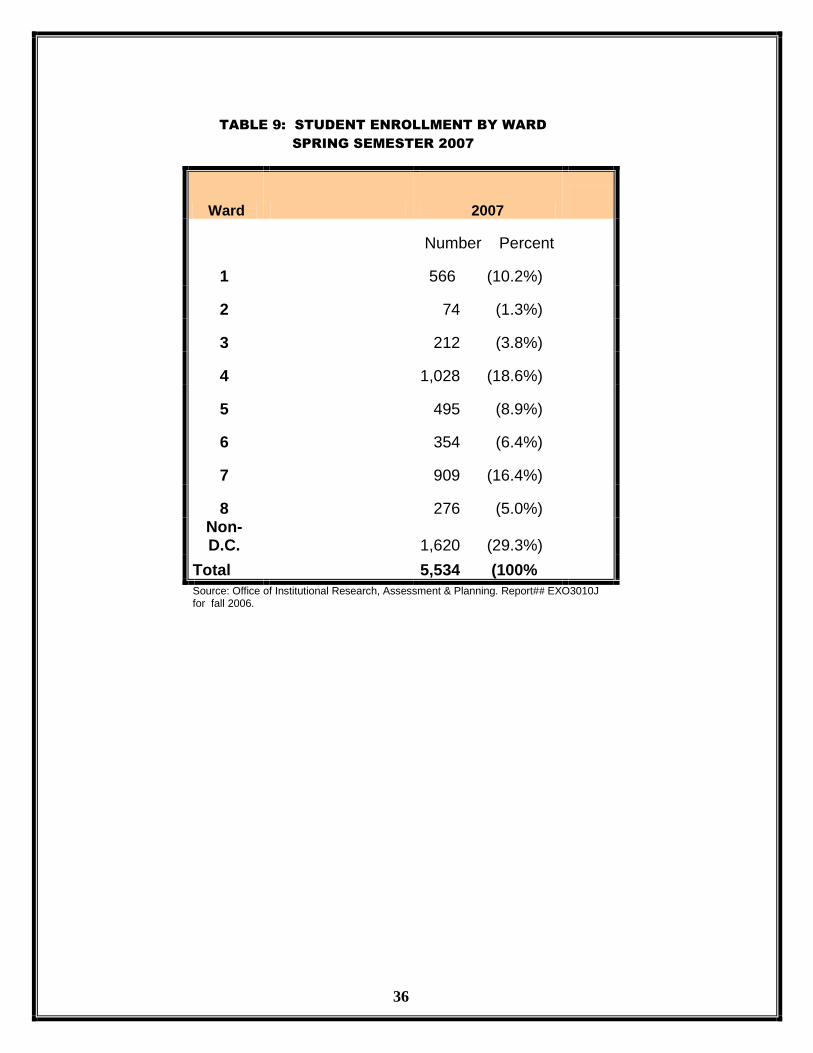
TABLE 9: STUDENT ENROLLMENT BY WARD
SPRING SEMESTER 2007
Ward 2007
Number Percent
1 566 (10.2%)
2 74 (1.3%)
3 212 (3.8%)
4 1,028 (18.6%)
5 495 (8.9%)
6 354 (6.4%)
7 909 (16.4%)
8 276 (5.0%) Non-D.C. 1,620 (29.3%)
Total 5,534 (100%
Source: Office of Institutional Research, Assessment & Planning. Report## EXO3010J for fall 2006.

37
TABLE 10: TOTAL ENROLLMENT, SPRING SEMESTER 2007
Source: Office of Institutional Research, Assessment, and Planning. Report # EXO3010J – Student Count (Frozen File).
Characteristics
2007
Total Enrollment 5,772 University of the District of Columbia 5,129 Maadi Program 405 David A. Clarke School of Law 238 FTE 3,664 Credit Hours 54,592
Gender Female 3,485 Male 2,287 Total 5,772
Undergraduate Enrollment First-Time Entering Freshmen 1,425 Continuing Freshmen 1,142 Sophomores 895 Juniors 717 Seniors 1,052 Special Undergraduate 69 Subtotal
5,300 (95.8%)
Graduate Enrollment Graduate (1
st year) 94
Graduate (2nd
year) 81 Special Graduate 59 Subtotal 234
(4.2%)
Total 5,534 (100%)
Residency Undergraduate Resident 3,513 Non-Resident 1,787 Total 5,300 Graduate Resident 124 Non-Resident 110 Total 234 FTE Distribution Full-Time FTE 2,335 Part-Time FTE 1,329 Total 3,664

38
TABLE 11: STUDENT ENROLLMENT BY ETHNICITY SPRING SEMESTER 2007
ETHNICITY
2007
NUMBER PERCENT
Black 4,039 73.0%
American Indian 6 0.1%
Asian 133 2.4%
Hispanic 291 5.3%
White 350 6.3%
Unspecified 715 12.9%
Total 5,534 100%
TABLE 12: STUDENT ENROLLMENT BY AGE GROUP
SPRING SEMESTER 2007
Age Group 2007
Number Percent
< 18 179 3.2% 18-19 805 14.5% 20-21 624 11.3% 22-24 825 14.9% 25-29 965 17.4% 30-34 591 10.7% 35-39 424 7.7% 40-49 654 11.8% 50-64 393 7.1% 65+ 74 1.3%
Total 5,534 100% Source: Office of Institutional Research, Assessment and Planning. Report# EXO3010J for respective terms.
39
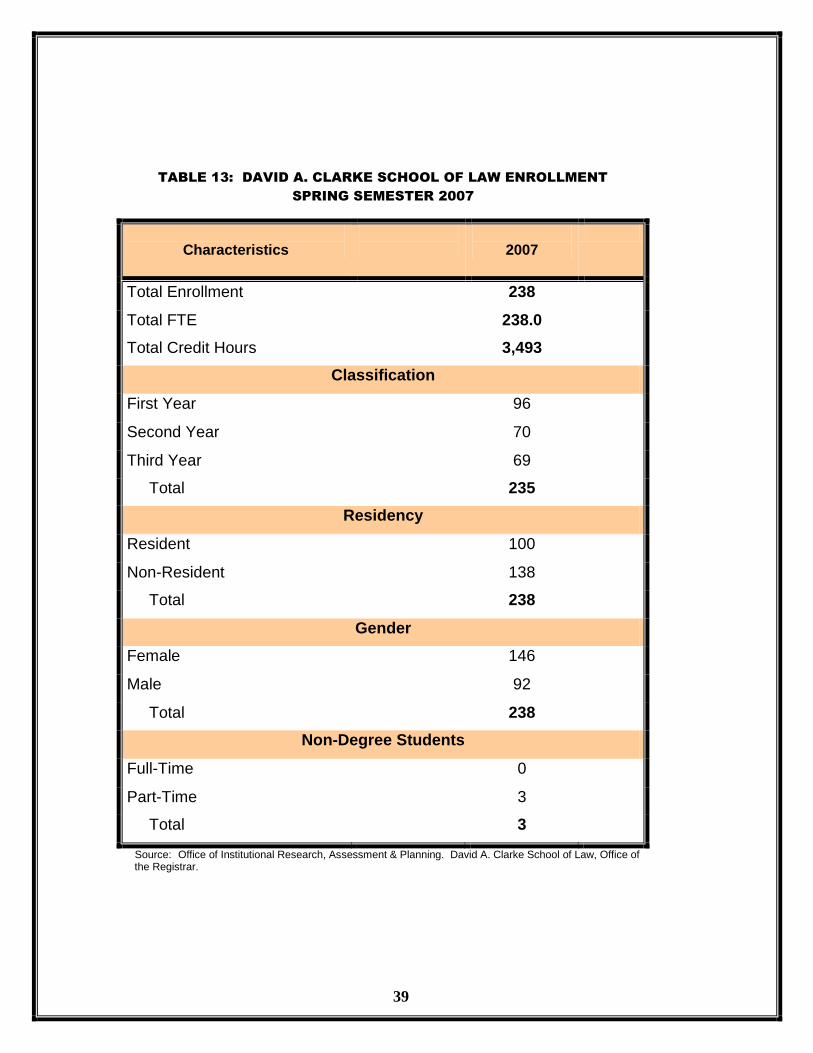
TABLE 13: DAVID A. CLARKE SCHOOL OF LAW ENROLLMENT
SPRING SEMESTER 2007
Characteristics
2007
Total Enrollment 238
Total FTE 238.0
Total Credit Hours 3,493
Classification
First Year 96
Second Year 70
Third Year 69
Total 235
Residency
Resident 100
Non-Resident 138
Total 238
Gender
Female 146
Male 92
Total 238
Non-Degree Students
Full-Time 0
Part-Time 3
Total 3
Source: Office of Institutional Research, Assessment & Planning. David A. Clarke School of Law, Office of the Registrar.
40
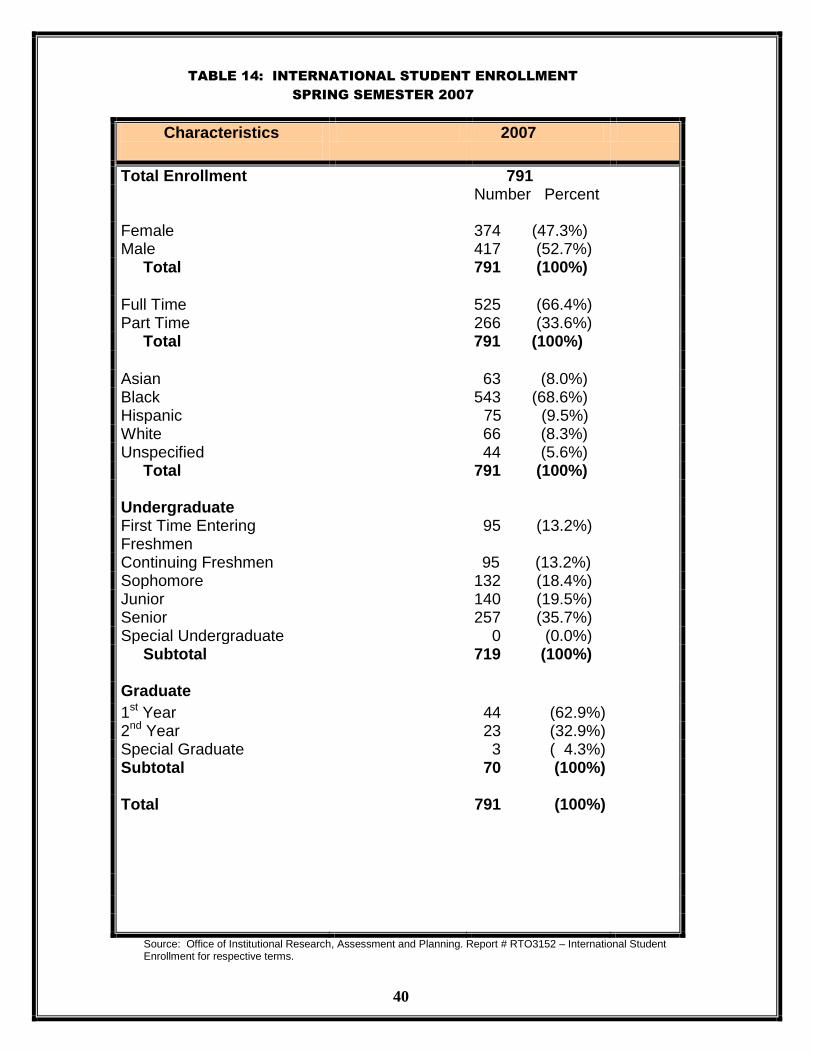
TABLE 14: INTERNATIONAL STUDENT ENROLLMENT
SPRING SEMESTER 2007
Characteristics
2007
Total Enrollment 791 Number Percent
Female Male
374 (47.3%) 417 (52.7%)
Total 791 (100%)
Full Time Part Time
525 (66.4%) 266 (33.6%)
Total 791 (100%) 266 (33.6%)
Asian 63 (8.0%) Black 543 (68.6%) Hispanic 75 (9.5%) 75 (9.5%) White 66 (8.3%) Unspecified 44 (5.6%) Total 791 (100%) Undergraduate First Time Entering Freshmen
95 (13.2%)
Continuing Freshmen 95 (13.2%) 95 (13.2%) Sophomore 132 (18.4%) Junior 140 (19.5%) Senior 257 (35.7%) Special Undergraduate 0 (0.0%) Subtotal 719 (100%) Graduate
1st Year 44 (62.9%) 2nd Year 23 (32.9%) Special Graduate 3 ( 4.3%) Subtotal 70 (100%)
Total
791 (100%)
Source: Office of Institutional Research, Assessment and Planning. Report # RTO3152 – International Student Enrollment for respective terms.

41
TABLE 15: INTERNATIONAL ENROLLMENT BY COUNTRY OF ORIGIN
SPRING SEMESTER 2007
(Top 11 Countries)
Country of Origin
2007
Enrollment Percentage
Nigeria 62 7.8% Kenya 56 7.2% Ethiopia 59 7.4% Cameroon 36 4.6% Mali 24 3.0% Liberia 9 1.1% Senegal 20 2.5% Trinidad 26 3.3% Ghana 14 1.8% Turkey 17 2.1% Vietnam 11 1.4% Other Countries
457 57.8%
Total 791 100.0% No. of Countries Served
97
Source: Office of Institutional Research, Assessment & Planning. Report # RTO3152 – International Student Enrollment for fall semester 2006.
42
SECTION VI
ACADEMIC PROGRAMS
BY COLLEGE, SCHOOL AND
DEPARTMENT

43
PROGRAMS BY COLLEGE, SCHOOLS, AND DEPARTMENTS
COLLEGE OF ARTS AND SCIENCES
Dr. Rachel Petty, Dean
DIVISION OF ARTS AND EDUCATION
Department of Education
Dr. Patricia Myers, Chairperson
(202) 274-7404, Bldg. 38, Room 109
Child Development and Nursery School
Education – A.A.
Early Childhood Education – B.A.,
Elementary Education – B.A.
Health Education – B.S.
Early Childhood Education – M.A.
Special Education – B.A., M.A.
Department of English
Dr. Helene Krauthamer, Acting Chairperson
(202) 274-5137, Bldg. 41, Room 413-04
English – B.A.
English Composition and Rhetoric – M.A.
Department of Languages and
Communication Disorders
Dr. Marc Christhope, Chairperson
(202) 274-7405, Bldg. 41, Room 413-05
French – B.A.
Spanish – B.A.
Speech and Language Pathology – B.S., M.S.
Department of Mass Media, Visual
And Performing Arts
Dr. Meredith Rode, (Interim) Chairperson
(202) 274-7402, bldg. 46, Room A03-B
Music – A.A., B.M.
Art – B.A.
Theatre Arts – B.A.
Mass Media – B.A.
Graphic Communications – B..S.
Graphic Design - A.A.
Graphic Communications Technology – A.A..S.
DIVISION OF SCIENCE AND
MATHEMATICS
Department of Biological and
Environmental Sciences
Dr. Freddie Dixon, Chairperson
(202) 274-7401, Bldg. 44, Room 200-03
Water Quality and Marine Science – A.A.S., Biology
– B.S., Environmental Science – B.S., Nutrition and
Food Science – B.S., Cancer Biology, Prevention &
Control – M.S.
Department of Chemistry and
Physics
Dr. Isadora Posey, Chairperson
(202) 274-7410, Bldg. 44, Room 200-18
Chemistry – B.S., Physics – B.S.
Department of Mathematics
Dr. Vernise Steadman, Chairperson
(202) 274-7410 Bldg. 32, Room B06-F
Mathematics – B.S., Physics – B.S.
Mathematics – M.S.T.
Department of Nursing and Allied
Health
Dr. Connie M. Webster, Chairperson
(202) 274-5940 Bldg. 44, Room 102
Medical Radiography – A.A.S., Mortuary
Science – A.A.S.
Respiratory Therapy – A.A.S., Nursing –
A.A.S., B.S.
DIVISION OF URBAN AFFAIRS,
BEHAVIORAL AND SOCIAL
SCIENCES
Department of Psychology and
Counseling
Dr. Lisa Moon, Acting Chairperson
(202) 274-7406 Bldg. 44, Room 200-35
Psychology – B.S., Clinical Psychology – M.S.,
Counseling – M.S.
Department of Urban Affairs, Social
Sciences, and Social Work
Dr. Shiela Harmon-Martin, Chairperson
(202) 274-7403 Bldg. 41, Room 413-09
History – B.A., Political Science – B.A.,
Sociology & Anthropology – B.A.,
Administration of Justice – B.A., Social Work –
BSW, Urban Studies – B.A., Certificate in Non-
Profit Leadership
44
SCHOOL OF BUSINESS AND PUBLIC
ADMINISTRATION
Dr. Melanie Anderson (Acting Dean)
(202) 274-7000 Bldg. 52, Room 508
Department of Accounting, Finance &
Economics
Dr. Tarsaim Goyal, Chairperson
(202) 274-7002 Bldg.52, Room 415-F
Computer Accounting Technology – A.A.S.,
Economics – B.A., Finance – B.B.A., Accounting –
B.B.A.,
Department of Management,
Hospitality & Graduate Studies
Dr. Hany Makhlouf, Chairperson
(202) 274-7001 Bldg. 52, Room 504-G
Business Technology – A.A.S., Hospitality
Management and Tourism – A.A.S., Business
Administration – M.B.A., Business Management –
B.B.A., Public Administration – M.P.A.
Department of Marketing, Legal
Studies and Information Systems
Dr. Leslie Vermillion, Chairperson
(202) 274-7002, Bldg. 52, Room 504-P
Administrative Office Management – A.A.S, Legal
Assistant – A.A.S., Marketing – B.B.A., Office
Administration – B.S., Computer Information &
Systems Science – B.A., Procurement & Public
Contracting – B.B.A.,
SCHOOL OF ENGINEERING AND
APPLIED SCIENCES
Dr. Ben O. Latigo, Dean
(202) 274-5220 Bldg. 42, Room 212
Department of Engineering,
Architecture and Aerospace
Technology
Dr. Abiose Adebayo, Chairperson
(202) 274-5126 Bldg. 42, Room 213-G
Architecture – B.S., Architectural Engineering
Technology – A.A.S., Airway Science – B.S.,
Civil Engineering – B.S., Mechanical
Engineering – B.S.,
Fire Science Administration – B.S., Aviation
Maintenance Technology – A.A.S., Aviation
Maintenance Management – B.S., Fire Science
– A.A.S.
Department of Computer Science
and Information Technology
Dr. Roger Marshall, Chairperson
(202) 274-6289 Bldg. 42, Room 112
Computer Science – B.S., M.S., Computer
Science Technology – A.A.S., Information
Technology – B.S.
Department of Electrical
Engineering
Dr. Samuel Lakeou
(202) 274-7409 Bldg. 42, Room 109-E
Electrical Engineering – B.S., Electronics
Engineering – B.S., Electronics Engineering
Technology – A.A.S.
45
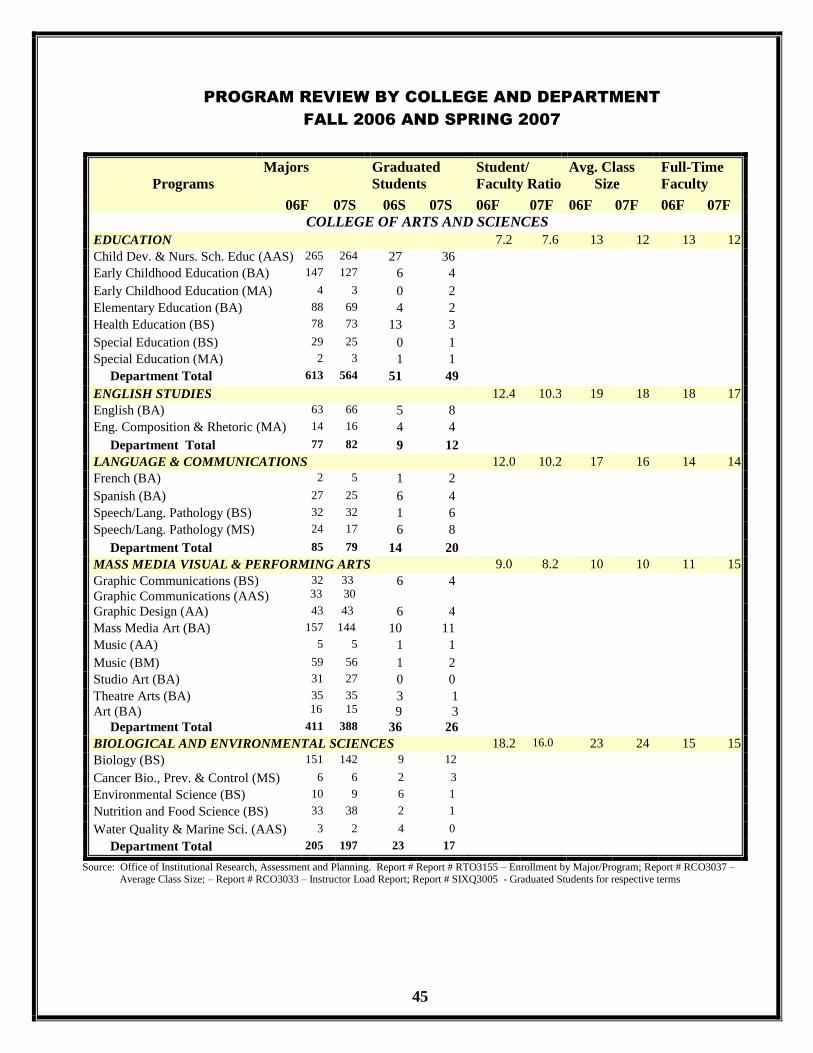
PROGRAM REVIEW BY COLLEGE AND DEPARTMENT
FALL 2006 AND SPRING 2007
Programs
Majors Graduated
Students
Student/
Faculty Ratio
Avg. Class
Size
Full-Time
Faculty
06F 07S 06S 07S 06F 07F 06F 07F 06F 07F
COLLEGE OF ARTS AND SCIENCES
EDUCATION 7.2 7.6 13 12 13 12
Child Dev. & Nurs. Sch. Educ (AAS) 265 264 27 36
Early Childhood Education (BA) 147 127 6 4
Early Childhood Education (MA) 4 3 0 2
Elementary Education (BA) 88 69 4 2
Health Education (BS) 78 73 13 3
Special Education (BS) 29 25 0 1
Special Education (MA) 2 3 1 1
Department Total 613 564 51 49
ENGLISH STUDIES 12.4 10.3 19 18 18 17
English (BA) 63 66 5 8
Eng. Composition & Rhetoric (MA) 14 16 4 4
Department Total 77 82 9 12
LANGUAGE & COMMUNICATIONS 12.0 10.2 17 16 14 14
French (BA) 2 5 1 2
Spanish (BA) 27 25 6 4
Speech/Lang. Pathology (BS) 32 32 1 6
Speech/Lang. Pathology (MS) 24 17 6 8
Department Total 85 79 14 20
MASS MEDIA VISUAL & PERFORMING ARTS 9.0 8.2 10 10 11 15
Graphic Communications (BS)
Graphic Communications (AAS)
32
33
33
30 6 4
Graphic Design (AA) 43 43 6 4
Mass Media Art (BA) 157 144 10 11
Music (AA) 5 5 1 1
Music (BM) 59 56 1 2
Studio Art (BA) 31 27 0 0
Theatre Arts (BA)
Art (BA)
35
16
35
15 3
9
1
3
Department Total 411 388 36 26
BIOLOGICAL AND ENVIRONMENTAL SCIENCES 18.2 16.0 23 24 15 15
Biology (BS) 151 142 9 12
Cancer Bio., Prev. & Control (MS) 6 6 2 3
Environmental Science (BS) 10 9 6 1
Nutrition and Food Science (BS) 33 38 2 1
Water Quality & Marine Sci. (AAS) 3 2 4 0
Department Total 205 197 23 17
Source: Office of Institutional Research, Assessment and Planning. Report # Report # RTO3155 – Enrollment by Major/Program; Report # RCO3037 – Average Class Size; – Report # RCO3033 – Instructor Load Report; Report # SIXQ3005 - Graduated Students for respective terms

46
PROGRAM REVIEW BY COLLEGE, DEPARTMENT AND PROGRAMS
FALL 2006 AND SPRING 2007
Programs
Majors Graduated
Students
Student/
Faculty Ratio
Avg. Class
Size
Full-Time
Faculty
06F 07S 06S 07S 06F 07F 06F 07F 06F 07F
COLLEGE OF ARTS AND SCIENCES
CHEMISTRY AND PHYSICS 13.3 13.2 16 18 11 11 Chemistry (BS) 53 50 3 3
Physics (BS) 7 5 0 3
Department Total 60 55 3 6
MATHEMATICS 13.8 13.8 19 18 17 17
Mathematics (BS) 21 21 2 1
Mathematics (MST) 3 1 2 2
Department Total 24 22 4 3
NURSING AND ALLIED HEALTH 10.0 9.0 11 12 15 14 Medical Radiography (AAS) 131 130 24 16
Mortuary Science ((AAS) 71 62 6 8
Nursing (AAS) 297 294 14 30
Nursing (BS) 222 205 7 1
Respiratory Therapy (AAS) 76 75 22 16
Department Total 797 766 73 71
PSYCHOLOGY AND COUNSELING 7.8 6.3 13 12 7 7 Clinical Psychology (MS) 21 12 1 3
Counseling (MS) 20 21 8 8
Psychology (BS) 140 113 3 8
Department Total 181 146 12 19
URBAN AFFAIRS, SOCIAL SCIENCES AND SOCIAL WORK 13.2 10.2 18 17 13 13
Admin. Of Justice (BA) 181 163 11 16
History (BA) 34 36 1 4
Corrections Adm. (AA) 5 5 1 0
Law Enforcement (AAS) 21 17 10 5
Political Science (BA) 72 73 11 10
Social Work (BSW) 178 169 12 13
Sociology/Anthro. (BA) 50 62 10 17
Urban Studies (BA) 23 17 2 2
Department Total 564 542 58 67
COLLEGE TOTAL 2968 2841 281 290
Source: Office of Institutional Research, Assessment and Planning. Report # Report # RTO3155 – Enrollment by Major/Program; Report # RCO3037 – Average Class Size; – Report # RCO3033 – Instructor Load Report; Report # SIXQ3005 - Graduated Students for respective terms
47
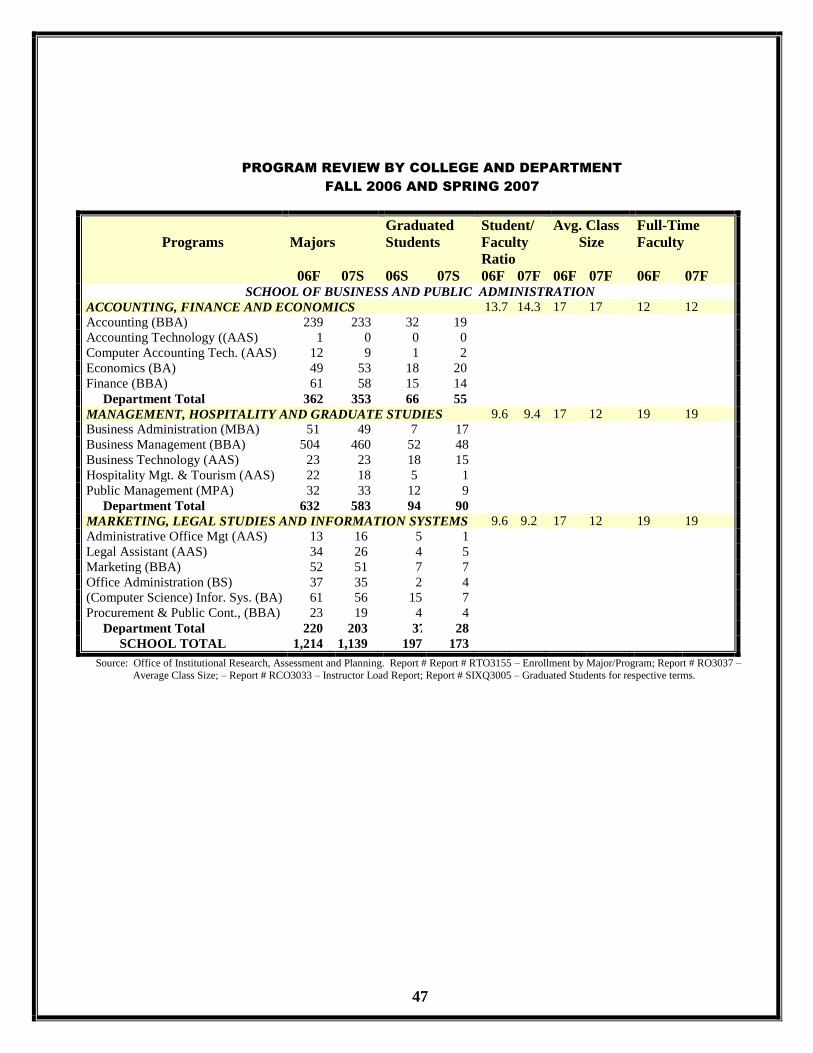
PROGRAM REVIEW BY COLLEGE AND DEPARTMENT
FALL 2006 AND SPRING 2007
Programs
Majors
Graduated
Students
Student/
Faculty
Ratio
Avg. Class
Size
Full-Time
Faculty
06F 07S 06S 07S 06F 07F 06F 07F 06F 07F SCHOOL OF BUSINESS AND PUBLIC ADMINISTRATION
ACCOUNTING, FINANCE AND ECONOMICS 13.7 14.3 17 17 12 12
Accounting (BBA) 239 233 32 19
Accounting Technology ((AAS) 1 0 0 0
Computer Accounting Tech. (AAS) 12 9 1 2
Economics (BA) 49 53 18 20
Finance (BBA) 61 58 15 14
Department Total 362 353 66 55
MANAGEMENT, HOSPITALITY AND GRADUATE STUDIES 9.6 9.4 17 12 19 19
Business Administration (MBA) 51 49 7 17
Business Management (BBA) 504 460 52 48
Business Technology (AAS) 23 23 18 15
Hospitality Mgt. & Tourism (AAS) 22 18 5 1
Public Management (MPA) 32 33 12 9
Department Total 632 583 94 90
MARKETING, LEGAL STUDIES AND INFORMATION SYSTEMS 9.6 9.2 17 12 19 19
Administrative Office Mgt (AAS) 13 16 5 1
Legal Assistant (AAS) 34 26 4 5
Marketing (BBA) 52 51 7 7
Office Administration (BS) 37 35 2 4
(Computer Science) Infor. Sys. (BA) 61 56 15 7
Procurement & Public Cont., (BBA) 23 19 4 4
Department Total 220 203 37 28
SCHOOL TOTAL 1,214 1,139 197 173
Source: Office of Institutional Research, Assessment and Planning. Report # Report # RTO3155 – Enrollment by Major/Program; Report # RO3037 –
Average Class Size; – Report # RCO3033 – Instructor Load Report; Report # SIXQ3005 – Graduated Students for respective terms.

48
PROGRAM REVIEW BY COLLEGE AND DEPARTMENT
FALL 2006 AND SPRING 2007
Programs
Majors
Graduated
Students
Student/
Faculty
Ratio
Avg. Class
Size
Full-Time
Faculty
06F 07S 06S 07S 06F 07F 06F 07F 06F 07F
SCHOOL OF ENGINEERING AND APPLIED SCIENCES
ENGINEERING, ARCHITECTURE & AEROSPACE TECH. 7.9 8.7 7 10.4 13 13 Airway Science (BS) 12 13 1 3
Architecture Eng. Tech. (AAS) 18 21 5 5
Architecture (BARC)
Architecture (BS)
47
2
41
7
4
0
0
4
Aviation Maintenance (AAS) 23 17 4 2
Civil Engineering (BS) 33 37 2 3
Civil Engineering Tech. (AAS) 0 0 0 0
Construction Eng. Tech.(BS) 3 2 1 0
Electromechanical Eng. Tech. (BS) 0 0 0 0
Fire Science (AAS) 24 12 2 5
Fire Science Administration (BS) 78 78 4 4
Mechanical Engineering (BS) 61 48 3 3
Mechanical Eng. Tech. (AAS) 0 0 0 0
Department Total 299 276 26 29
COMPUTER SCIENCE & INFORMATION TECHNOLOGY 10.9 11.7 12 10.2 13 6 Applied Computer Science (BA) 19 17 16 8 Computer Science (BS) 162 134 21 6
Computer Science (MS) 0 0 0 0
Computer Science Tech. (AAS) 19 16 7 3
Information Technology (BS) 29 27 2 7
Printing Management (BS) 1 1 0 0
Printing Technology (AAS) 1 0 0 0
Department Total 231 195 46 24
ELECTRICAL ENGINEERING 13.4 13.2 16 14.5 13 6 Electrical Engineering (BS) 309 268 20 12
Electronics Engineering (BS) 0 5 0 0
Electronics Eng. Tech.(AAS) 6 0 3 4
Department Total 315 273 23 16
SCHOOL TOTAL 845 743 95 69
UNDECLARED STUDENTS
Special /Transient Students 59 45 0 0
Undeclared (No Majors) 449 344 0 0
Total 508 389 0 0
UNIVERSITY TOTAL 5,534 5,106 573 532
Source: Office of Institutional Research, Assessment and Planning. Report # Report # RTO3155 – Enrollment by Major/Program; Report # RCO3037 –
Average Class Size; – Report # RCO3033 – Instructor Load Report; Report # SIXQ3005 – Graduated Students for respective terms.
49
SECTION VII
DEGREES CONFERRED

50
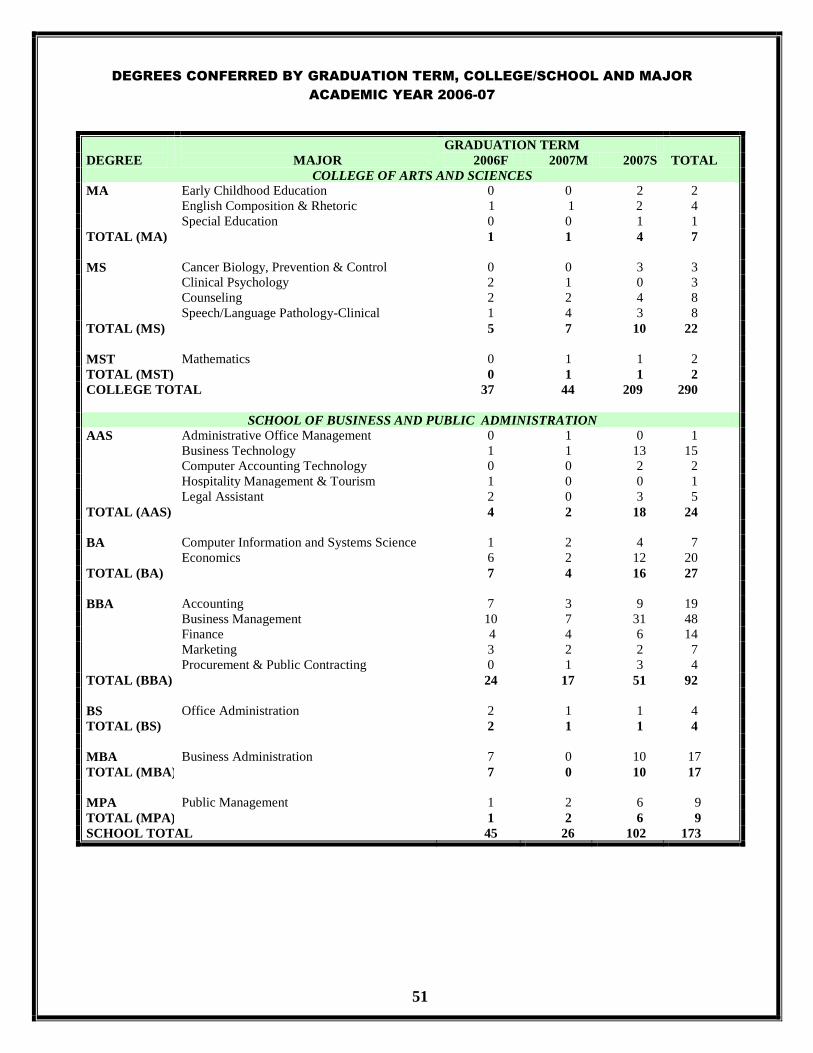
DEGREES CONFERRED BY GRADUATION TERM, COLLEGE/SCHOOL AND MAJOR
ACADEMIC YEAR 2006-07
DEGREE
MAJOR
GRADUATION TERM
TOTAL 2006F 2006M 2007S
COLLEGE OF ARTS AND SCIENCES
AA Graphic Design 0 0 4 4
Child Development & Nursery School Educ. 1 1 34 36
Music 0 0 1 1
TOTAL (AA) 1 1 38 41
AAS Corrections Administration 0 0 0 0
Graphic Communications Technology 0 0 0 0
Law Enforcement 3 0 2 5
Medical Radiography 0 0 16 16
Mortuary Science 1 0 7 8
Nursing 0 13 17 30
Respiratory Therapy 0 0 16 16
Water Quality and Marine Science 0 0 0 0
TOTAL (AAS) 4 13 58 75
BA Administration of Justice 2 2 12 16
Art 1 1 1 3
Early Childhood Education 0 0 4 4
Elementary Education 1 0 1 2
English 0 2 6 8
French 0 2 0 2
History 0 0 4 4
Mass Media Art 3 1 7 11
Political Science 2 1 7 10
Sociology and Anthropology 2 4 11 17
Spanish 1 0 3 4
Theatre Arts 1 0 0 1
Urban Studies 2 0 0 2
TOTAL (BA) 15 13 56 84
BM Music 0 0 2 2
TOTAL (BM) 0 0 2 2
BS Biology 1 0 11 12
Chemistry 0 1 2 3
Environmental Science 1 0 0 1
Graphic Communications 1 0 3 4
Health Education 0 1 2 3
Mathematics 0 0 1 1
Nutrition and Food Science 1 0 0 1
Nursing 1 0 0 1
Psychology
Special Education
4
0
1
0
3
1
8
1
Speech/language Pathology 1 0 5 6
TOTAL (BS) 10 5 29 44
BSW Social Work 1 3 9 13
TOTAL (BSW)
51
DEGREES CONFERRED BY GRADUATION TERM, COLLEGE/SCHOOL AND MAJOR
ACADEMIC YEAR 2006-07
DEGREE
MAJOR
GRADUATION TERM
TOTAL 2006F 2007M 2007S
COLLEGE OF ARTS AND SCIENCES
MA Early Childhood Education
English Composition & Rhetoric
0
1
0
1
2
2
2
4
Special Education 0 0 1 1
TOTAL (MA) 1 1 4 7
MS Cancer Biology, Prevention & Control 0 0 3 3
Clinical Psychology 2 1 0 3
Counseling 2 2 4 8
Speech/Language Pathology-Clinical 1 4 3 8
TOTAL (MS) 5 7 10 22
MST Mathematics 0 1 1 2
TOTAL (MST) 0 1 1 2
COLLEGE TOTAL 37 44 209 290
SCHOOL OF BUSINESS AND PUBLIC ADMINISTRATION
AAS Administrative Office Management 0 1 0 1
Business Technology 1 1 13 15
Computer Accounting Technology 0 0 2 2
Hospitality Management & Tourism 1 0 0 1
Legal Assistant 2 0 3 5
TOTAL (AAS) 4 2 18 24
BA Computer Information and Systems Science 1 2 4 7
Economics 6 2 12 20
TOTAL (BA) 7 4 16 27
BBA Accounting 7 3 9 19
Business Management 10 7 31 48
Finance 4 4 6 14
Marketing 3 2 2 7
Procurement & Public Contracting 0 1 3 4
TOTAL (BBA) 24 17 51 92
BS Office Administration 2 1 1 4
TOTAL (BS) 2 1 1 4
MBA Business Administration 7 0 10 17
TOTAL (MBA) 7 0 10 17
MPA Public Management 1 2 6 9
TOTAL (MPA) 1 2 6 9
SCHOOL TOTAL 45 26 102 173
52
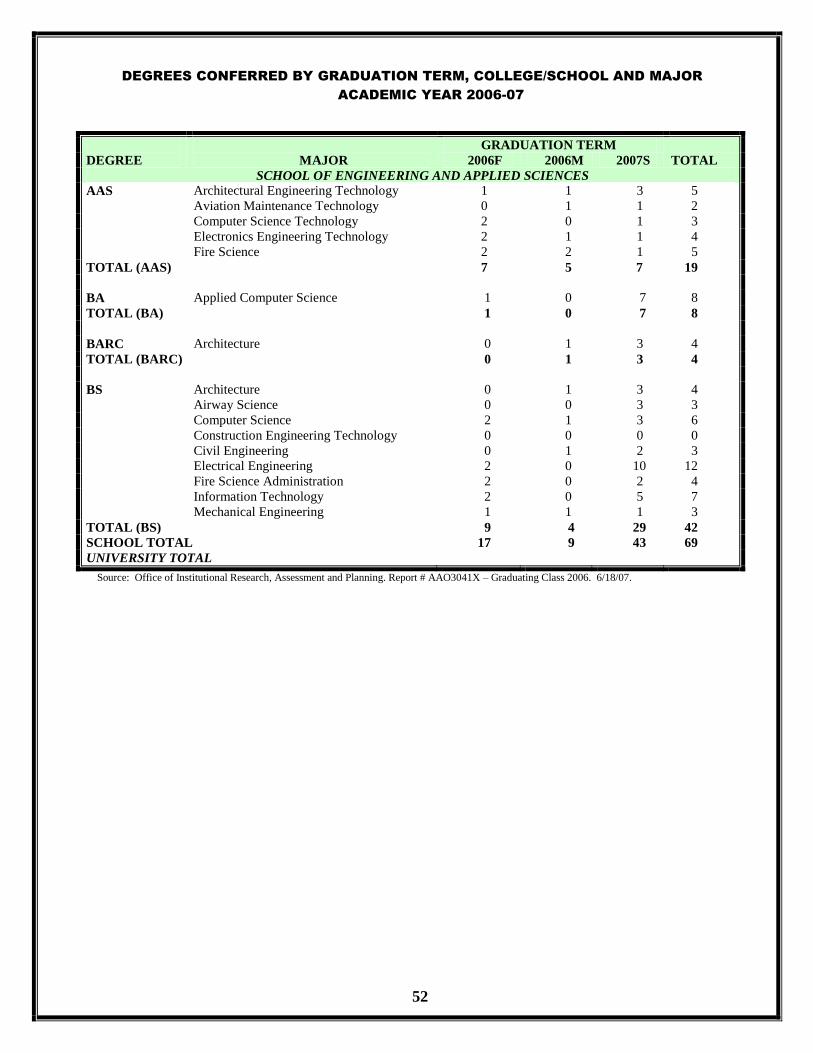
DEGREES CONFERRED BY GRADUATION TERM, COLLEGE/SCHOOL AND MAJOR
ACADEMIC YEAR 2006-07
DEGREE
MAJOR
GRADUATION TERM
TOTAL 2006F 2006M 2007S
SCHOOL OF ENGINEERING AND APPLIED SCIENCES
AAS Architectural Engineering Technology 1 1 3 5
Aviation Maintenance Technology 0 1 1 2
Computer Science Technology 2 0 1 3
Electronics Engineering Technology 2 1 1 4
Fire Science 2 2 1 5
TOTAL (AAS) 7 5 7 19
BA Applied Computer Science 1 0 7 8
TOTAL (BA) 1 0 7 8
BARC Architecture 0 1 3 4
TOTAL (BARC) 0 1 3 4
BS Architecture 0 1 3 4
Airway Science 0 0 3 3
Computer Science 2 1 3 6
Construction Engineering Technology 0 0 0 0
Civil Engineering 0 1 2 3
Electrical Engineering 2 0 10 12
Fire Science Administration 2 0 2 4
Information Technology 2 0 5 7
Mechanical Engineering 1 1 1 3
TOTAL (BS) 9 4 29 42
SCHOOL TOTAL 17 9 43 69
UNIVERSITY TOTAL
Source: Office of Institutional Research, Assessment and Planning. Report # AAO3041X – Graduating Class 2006. 6/18/07.

53
DEGREES CONFERRED BY ETHNIC ORIGIN, COLLEGE/SCHOOL AND MAJOR
ACADEMIC YEAR 2006-07
DEGREE
MAJOR
ETHNIC ORIGIN
TOTAL Asian Black Hispanic White Other
COLLEGE OF ARTS AND SCIENES
AA Graphic Design 1 2 0 0 0 3
Child Development & Nursery Sch. Educ. 1 29 3 1 0 34
Music 0 0 1 0 0 1
TOTAL (AA) 2 32 3 1 0 38
AAS Corrections Administration 0 0 0 0 0 0
Graphic Communications Technology 0 0 0 0 0 0
Law Enforcement 0 0 5 0 0 5
Medical Radiography 1 14 0 0 1 16
Mortuary Science 0 5 0 2 0 7
Nursing 0 19 1 3 1 24
Respiratory Therapy 1 14 0 0 1 16
Water Quality and Marine Science 0 0 0 0 0 0
TOTAL (AAS) 2 57 1 5 3 68
BA Administration of Justice 0 15 0 1 0 16
Art 0 0 0 0 0 0
Early Childhood Education 0 3 0 1 0 4
Elementary Education 0 2 0 0 0 2
English 0 5 0 0 3 8
French 0 1 0 0 1 2
History 0 2 1 0 0 3
Mass Media Art 0 10 0 0 1 11
Political Science 0 6 1 0 3 10
Sociology and Anthropology 1 14 0 2 0 17
Spanish 0 0 4 0 0 4
Theatre Arts 0 1 0 0 0 1
Urban Studies 0 1 0 1 0 2
TOTAL (BA) 1 61 6 6 9 83
BM Music 0 1 0 0 1 2
TOTAL (BM) 0 1 0 0 1 2
BS Biology 2 10 0 0 0 12
Chemistry 0 3 0 0 0 3
Environmental Science 0 0 0 0 1 1
Graphic Communications 1 2 0 0 0 3
Health Education 0 1 0 0 0 1
Mathematics 0 1 0 0 0 1
Nutrition and Food Science 0 0 0 0 1 1
Nursing 0 1 0 0 0 1
Physics
Psychology
0
0
2
8
0
0
1
0
0
0
3
8
Special Education
Speech/language Pathology
0
0
1
6
0
0
0
0
0
0
1
6
TOTAL (BS) 3 35 0 1 2 41

54
DEGREES CONFERRED BY ETHNIC ORIGIN, COLLEGE/SCHOOL AND MAJOR
ACADEMIC YEAR 2006-07
DEGREE
MAJOR
ETHNIC ORIGIN
TOTAL Asian Black Hispanic White Other
MA Early Childhood Education
English Composition & Rhetoric
0
0
2
3
0
0
0
1
0
0
2
4
Special Education 0 1 0 0 0 1
TOTAL (MA) 0 6 0 1 0 7
MS Cancer Biology, Prevention & Control 0 0 1 1 0 2
Clinical Psychology 0 1 1 0 1 3
Counseling 0 7 1 0 0 8
Speech/Language Pathology-Clinical 0 4 0 1 3 8
TOTAL (MS) 0 12 3 2 4 21
MST Mathematics 0 1 0 0 1 2
TOTAL (MST) 0 1 0 0 1 2
COLLEGE TOTAL 8 217 13 15 21 274
SCHOOL OF BUSINESS AND PUBLIC ADMINISTRATION
AAS Administrative Office Management 0 1 0 0 0 1
Business Technology 0 14 0 0 0 14
Computer Accounting Technology 0 2 0 0 0 2
Hospitality Management & Tourism 0 1 0 0 0 1
Legal Assistant 0 4 1 0 0 5
TOTAL (AAS) 0 22 1 0 0 23
BA Computer Information & System Science 1 5 0 0 0 6
Economics 1 13 0 1 5 20
TOTAL (BA) 2 18 0 1 5 26
BBA Accounting 1 16 2 0 0 19
Business Management 1 38 4 2 1 46
Finance 1 10 2 0 1 14
Marketing 0 4 1 1 1 7
Procurement & Public Contracting 0 3 0 1 0 4
TOTAL (BBA) 3 71 9 4 3 90
BS Office Administration 0 4 0 0 0 4
TOTAL (BS) 0 4 0 0 0 4
MBA Business Administration 3 11 1 1 0 16
TOTAL (MBA) 3 11 1 1 0 16
MPA Public Management 1 6 0 1 1 9
TOTAL (MPA) 1 6 0 1 1 9
SCHOOL TOTAL 9 132 11 7 9 168

55
DEGREES CONFERRED BY ETHNIC ORIGIN, COLLEGE/SCHOOL AND MAJOR
ACADEMIC YEAR 2006-07
DEGREE
MAJOR
ETHNIC ORIGIN
TOTAL Asian Black Hispanic White Other
SCHOOL OF ENGINEERING AND APPLIED SCIENCES
AAS Architectural Engineering Technology 0 3 1 0 0 4
Aviation Maintenance Technology 0 1 1 0 0 2
Computer Science Technology 0 3 0 0 0 3
Electronics Engineering Technology 0 4 0 0 0 4
Fire Science 0 4 0 0 1 5
TOTAL (AAS) 0 15 2 0 1 18
BA Applied Computer Science 0 8 0 0 0 8
TOTAL (BA) 0 8 0 0 0 8
BARC Architecture 0 0 0 0 0 0
TOTAL (BARC) 0 0 0 0 0 0
BS Architecture 0 3 1 0 0 4
Airway Science 0 3 0 0 0 3
Computer Science 1 3 1 0 0 5
Construction Engineering Technology 0 0 0 0 0 0
Civil Engineering 1 1 0 1 0 3
Electrical Engineering 3 8 0 1 0 12
Fire Science Administration 0 3 0 1 0 4
Information Technology 1 4 0 0 1 6
Mechanical Engineering 0 3 0 0 0 3
TOTAL (BS) 6 28 2 3 1 40
SCHOOL TOTAL 6 51 4 2 3 66 UNIVERSITY TOTAL 23 400 28 32 25 508
Source: Office of Institutional Research, Assessment and Planning. Report # AAO3041X – Graduating Class 2006, 6/09/07.
56
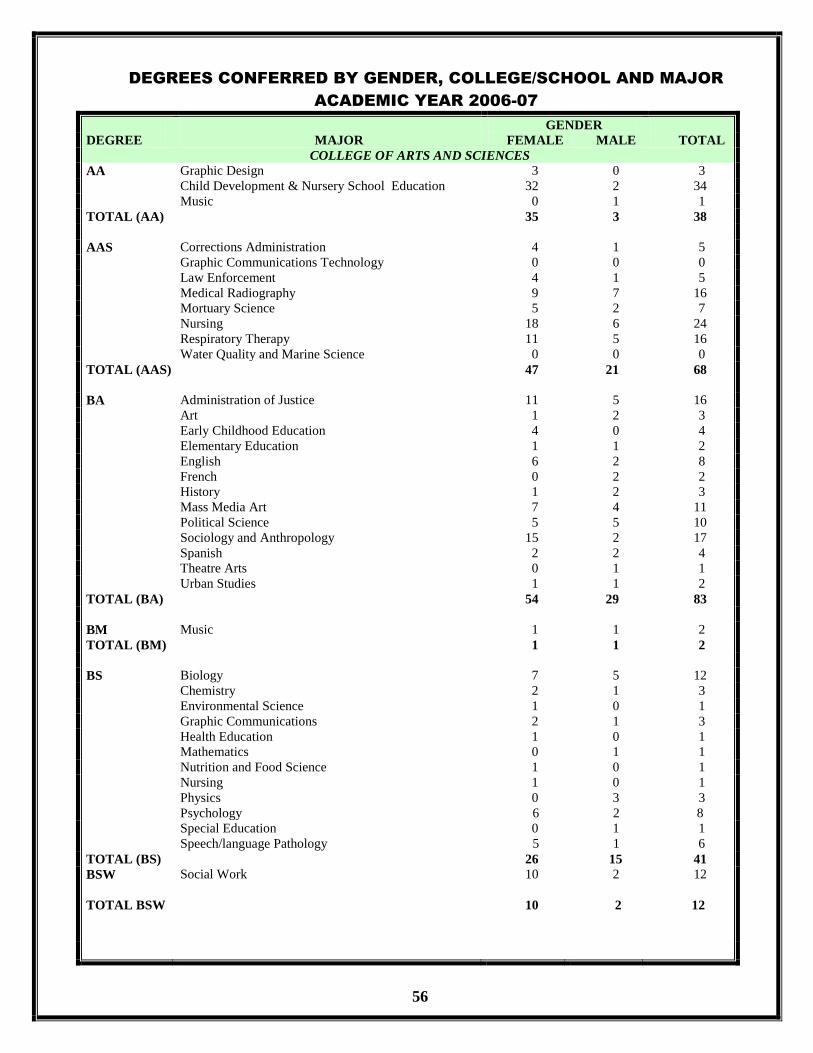
DEGREES CONFERRED BY GENDER, COLLEGE/SCHOOL AND MAJOR
ACADEMIC YEAR 2006-07
DEGREE
MAJOR
GENDER
TOTAL FEMALE MALE
COLLEGE OF ARTS AND SCIENCES
AA Graphic Design 3 0 3
Child Development & Nursery School Education 32 2 34
Music 0 1 1
TOTAL (AA) 35 3 38
AAS Corrections Administration 4 1 5
Graphic Communications Technology 0 0 0
Law Enforcement 4 1 5
Medical Radiography 9 7 16
Mortuary Science 5 2 7
Nursing 18 6 24
Respiratory Therapy 11 5 16
Water Quality and Marine Science 0 0 0
TOTAL (AAS) 47 21 68
BA Administration of Justice 11 5 16
Art 1 2 3
Early Childhood Education 4 0 4
Elementary Education 1 1 2
English 6 2 8
French 0 2 2
History 1 2 3
Mass Media Art 7 4 11
Political Science 5 5 10
Sociology and Anthropology 15 2 17
Spanish 2 2 4
Theatre Arts 0 1 1
Urban Studies 1 1 2
TOTAL (BA) 54 29 83
BM Music 1 1 2
TOTAL (BM) 1 1 2
BS Biology 7 5 12
Chemistry 2 1 3
Environmental Science 1 0 1
Graphic Communications 2 1 3
Health Education 1 0 1
Mathematics 0 1 1
Nutrition and Food Science 1 0 1
Nursing 1 0 1
Physics
Psychology
0
6
3
2
3
8
Special Education
Speech/language Pathology
0
5
1
1
1
6
TOTAL (BS) 26 15 41
BSW
TOTAL BSW
Social Work 10
10
2
2
12
12

57
DEGREES CONFERRED BY GENDER, COLLEGE/SCHOOL AND MAJOR
ACADEMIC YEAR 2006-07
DEGREE
MAJOR
GENDER
TOTAL FEMALE MALE
COLLEGE OF ARTS AND SCIENCES
MA Early Childhood Education
English Composition & Rhetoric
2
3
0
1
2
4
Special Education 1 0 1
TOTAL (MA) 6 1 7
MS Cancer Biology, Prevention & Control 2 0 2
Clinical Psychology 0 3 3
Counseling 5 3 8
Speech/Language Pathology-Clinical 8 0 8
TOTAL (MS) 15 6 21
MST Mathematics 1 1 2
TOTAL (MST) 1 1 2
COLLEGE TOTAL 195 79 274
SCHOOL OF BUSINESS AND PUBLIC ADMINISTRATION
AAS Administrative Office Management 1 0 1
Business Technology 10 4 14
Computer Accounting Technology 1 1 2
Hospitality Management & Tourism 1 0 1
Legal Assistant 5 0 5
TOTAL (AAS) 18 5 23
BA (Computer Science) Information Systems 3 3 6
Economics 8 12 20
TOTAL (BA) 11 15 26
BBA Accounting 10 9 19
Business Management 27 19 46
Finance 4 10 14
Marketing 4 3 7
Procurement & Public Contracting 2 2 4
TOTAL (BBA) 47 43 90
BS Office Administration 4 0 4
TOTAL (BS) 4 0 4
MBA Business Administration 5 11 16
TOTAL (MBA) 5 11 16
MPA Public Management 3 6 9
TOTAL (MPA) 3 6 9
SCHOOL TOTAL 88 80 168

58
DEGREES CONFERRED BY GENDER, COLLEGE/SCHOOL AND MAJOR
ACADEMIC YEAR 2006-07
DEGREE
MAJOR
GENDER
TOTAL FEMALE MALE
SCHOOL OF ENGINEERING AND APPLIED SCIENCES
AAS Architectural Engineering Technology 3 1 4
Aviation Maintenance Technology 0 2 2
Computer Science Technology 0 3 3
Electronics Engineering Technology 0 4 4
Fire Science 1 4 5
TOTAL (AAS) 4 14 18
BA Applied Computer Science 5 3 8
TOTAL (BA) 5 3 8
BARC Architecture 0 0 0
TOTAL (BARC) 0 0 0
BS Architecture 1 3 4
Airway Science 0 3 3
Computer Science 2 3 5
Construction Engineering Technology 0 0 0
Civil Engineering 0 3 3
Electrical Engineering 0 12 12
Fire Science Administration 0 4 4
Information Technology 1 5 6
Mechanical Engineering 0 3 3
TOTAL (BS) 4 36 40
SCHOOL TOTAL 13 53 66 UNIVERSITY TOTAL 296 212 508
Source: Office of Institutional Research, Assessment and Planning. Report # AAO3041X – Graduating Class 2006-07, 6/09/07.
59
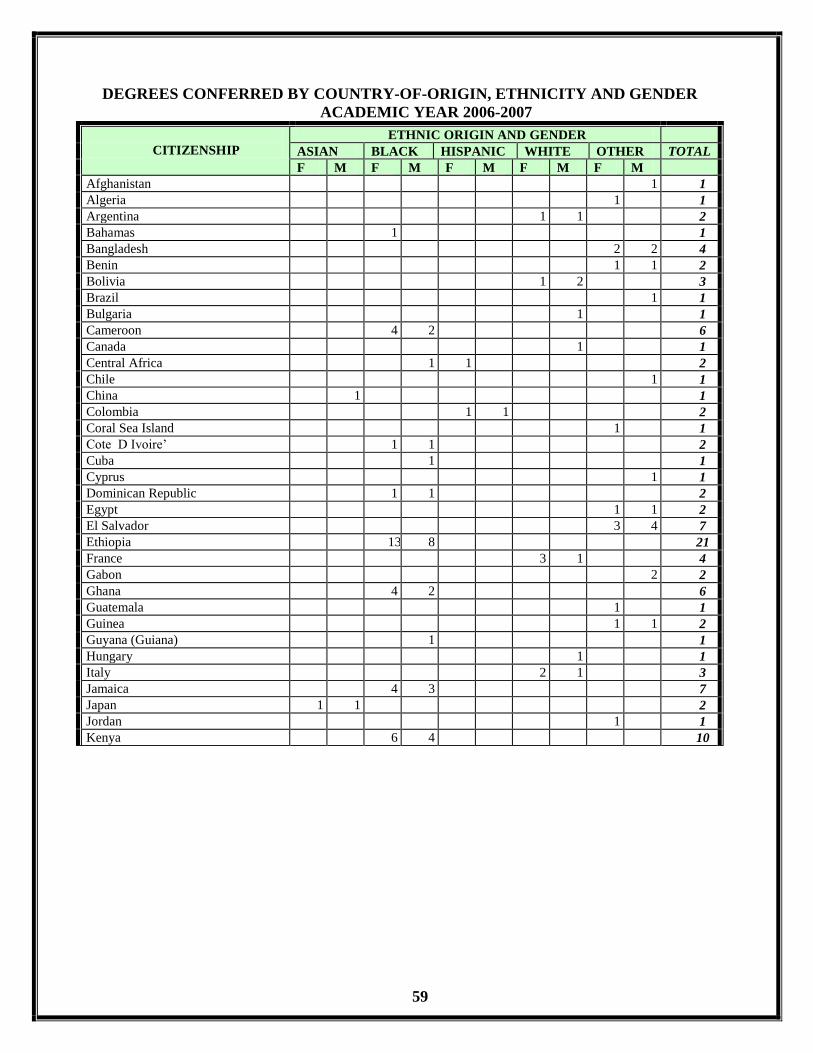
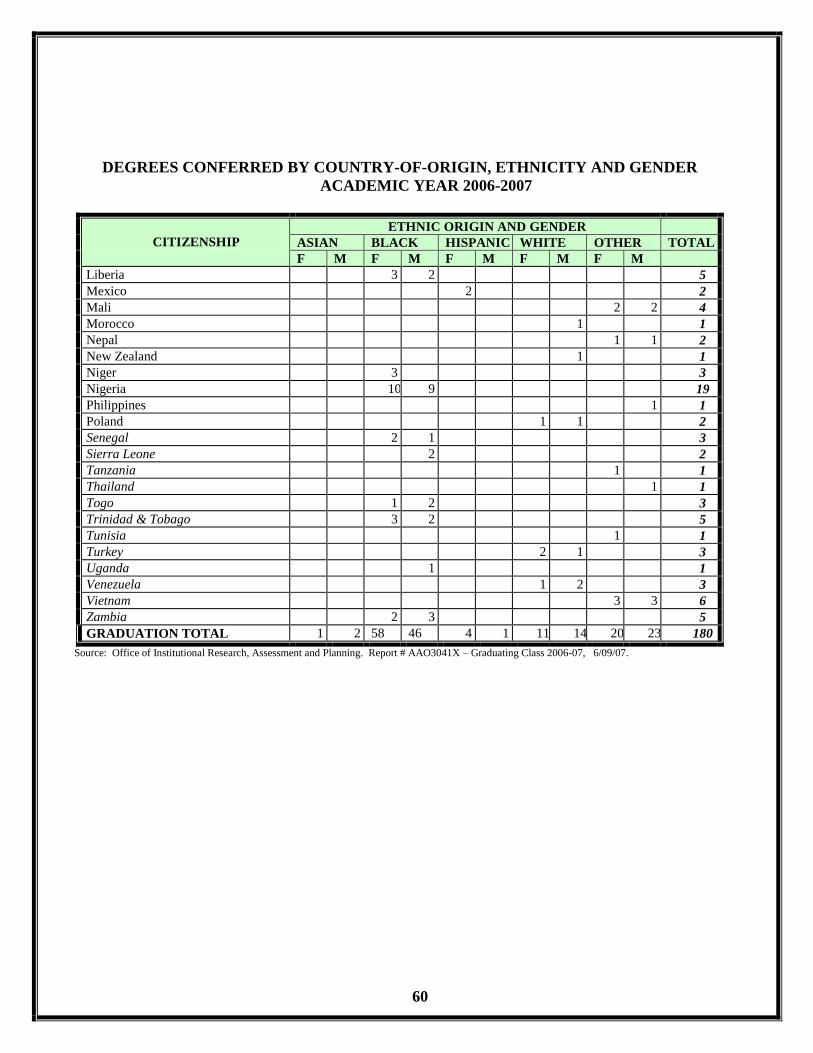
DEGREES CONFERRED BY COUNTRY-OF-ORIGIN, ETHNICITY AND GENDER
ACADEMIC YEAR 2006-2007
CITIZENSHIP
ETHNIC ORIGIN AND GENDER
ASIAN BLACK HISPANIC WHITE OTHER TOTAL
F M F M F M F M F M
Afghanistan 1 1
Algeria 1 1
Argentina 1 1 2
Bahamas 1 1
Bangladesh 2 2 4
Benin 1 1 2
Bolivia 1 2 3
Brazil 1 1
Bulgaria 1 1
Cameroon 4 2 6
Canada 1 1
Central Africa 1 1 2
Chile 1 1
China 1 1
Colombia 1 1 2
Coral Sea Island 1 1
Cote D Ivoire’ 1 1 2
Cuba 1 1
Cyprus 1 1
Dominican Republic 1 1 2
Egypt 1 1 2
El Salvador 3 4 7
Ethiopia 13 8 21
France 3 1 4
Gabon 2 2
Ghana 4 2 6
Guatemala 1 1
Guinea 1 1 2
Guyana (Guiana) 1 1
Hungary 1 1
Italy 2 1 3
Jamaica 4 3 7
Japan 1 1 2
Jordan 1 1
Kenya 6 4 10
60
DEGREES CONFERRED BY COUNTRY-OF-ORIGIN, ETHNICITY AND GENDER
ACADEMIC YEAR 2006-2007
CITIZENSHIP
ETHNIC ORIGIN AND GENDER
ASIAN BLACK HISPANIC WHITE OTHER TOTAL
F M F M F M F M F M
Liberia 3 2 5
Mexico 2 2
Mali 2 2 4
Morocco 1 1
Nepal 1 1 2
New Zealand 1 1
Niger 3 3
Nigeria 10 9 19
Philippines 1 1
Poland 1 1 2
Senegal 2 1 3
Sierra Leone 2 2
Tanzania 1 1
Thailand 1 1
Togo 1 2 3
Trinidad & Tobago 3 2 5
Tunisia 1 1
Turkey 2 1 3
Uganda 1 1
Venezuela 1 2 3
Vietnam 3 3 6
Zambia 2 3 5
GRADUATION TOTAL 1 2 58 46 4 1 11 14 20 23 180
Source: Office of Institutional Research, Assessment and Planning. Report # AAO3041X – Graduating Class 2006-07, 6/09/07.

61
DEGREES CONFERRED BY COUNTRY-OF-ORIGIN AND ETHNICITY
ACADEMIC YEAR 2006-07
Source: Office of Institutional Research, Assessment and Planning. Report # AAO3041X – Graduating Class. 6/18/07
Hispanic
2.8%
White
13.9%
Other
23.8%
Asian
1.7%
Black
57.8%
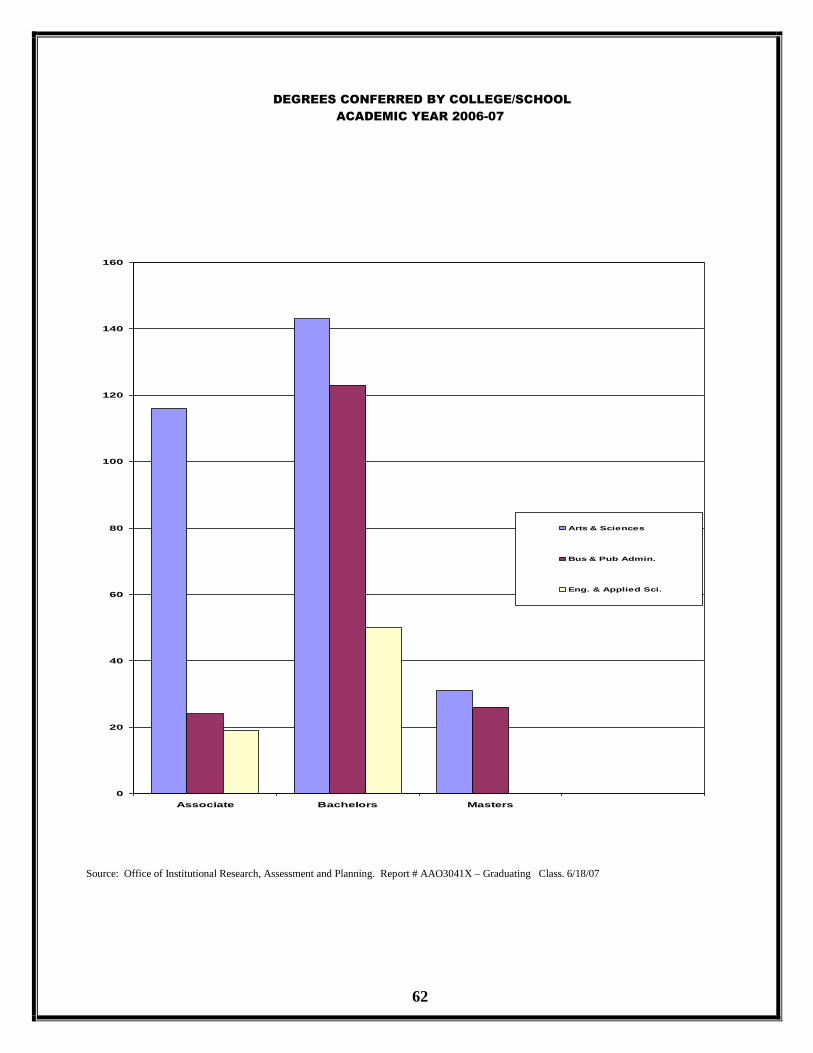
62
DEGREES CONFERRED BY COLLEGE/SCHOOL
ACADEMIC YEAR 2006-07
Source: Office of Institutional Research, Assessment and Planning. Report # AAO3041X – Graduating Class. 6/18/07
0
20
40
60
80
100
120
140
160
Associate Bachelors Masters
Arts & Sciences
Bus & Pub Admin.
Eng. & Applied Sci.
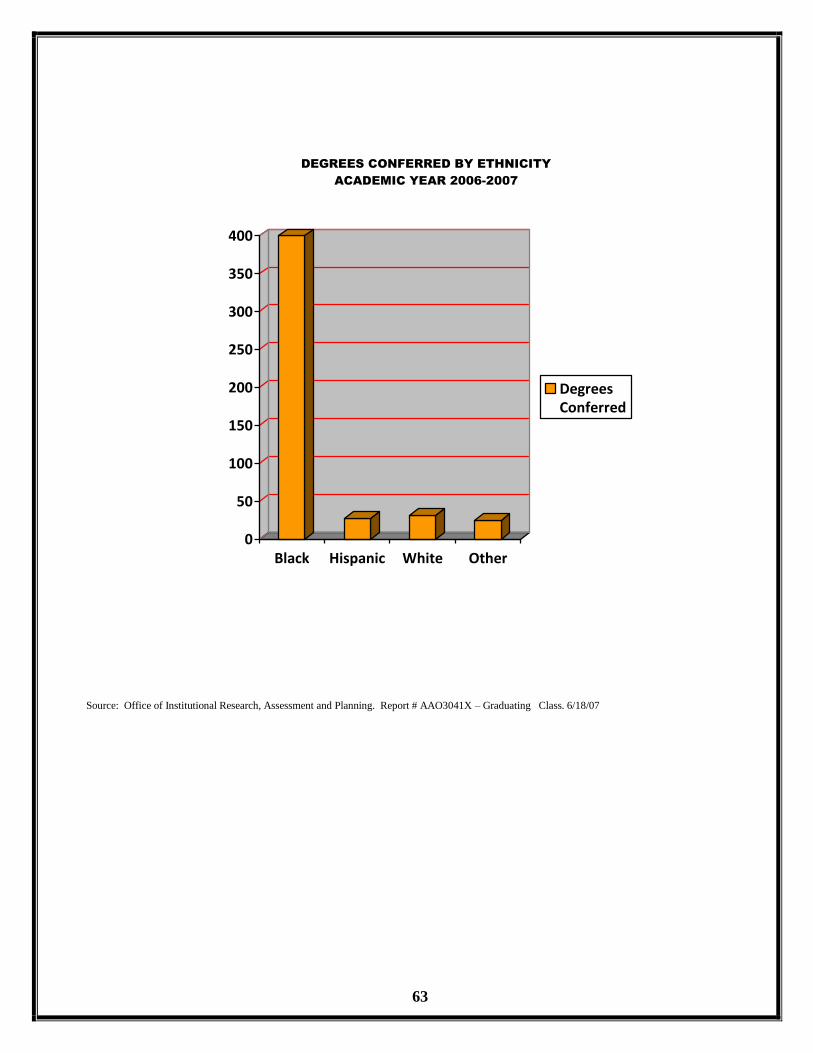
63
DEGREES CONFERRED BY ETHNICITY
ACADEMIC YEAR 2006-2007
0
50
100
150
200
250
300
350
400
Black Hispanic White Other
DegreesConferred
Source: Office of Institutional Research, Assessment and Planning. Report # AAO3041X – Graduating Class. 6/18/07

64
DEGREES CONFERRED BY GENDER
ACADEMIC YEAR 2006-07
104
43
162
144
3025
0
20
40
60
80
100
120
140
160
180
Associate Bacelors Masters
Female
Male
Source: Office of Institutional Research, Assessment and Planning. Report # AAO3041X – Graduating Class. 6/18/07
65
SECTION VIII
UDC FACULTY
FALL 2006
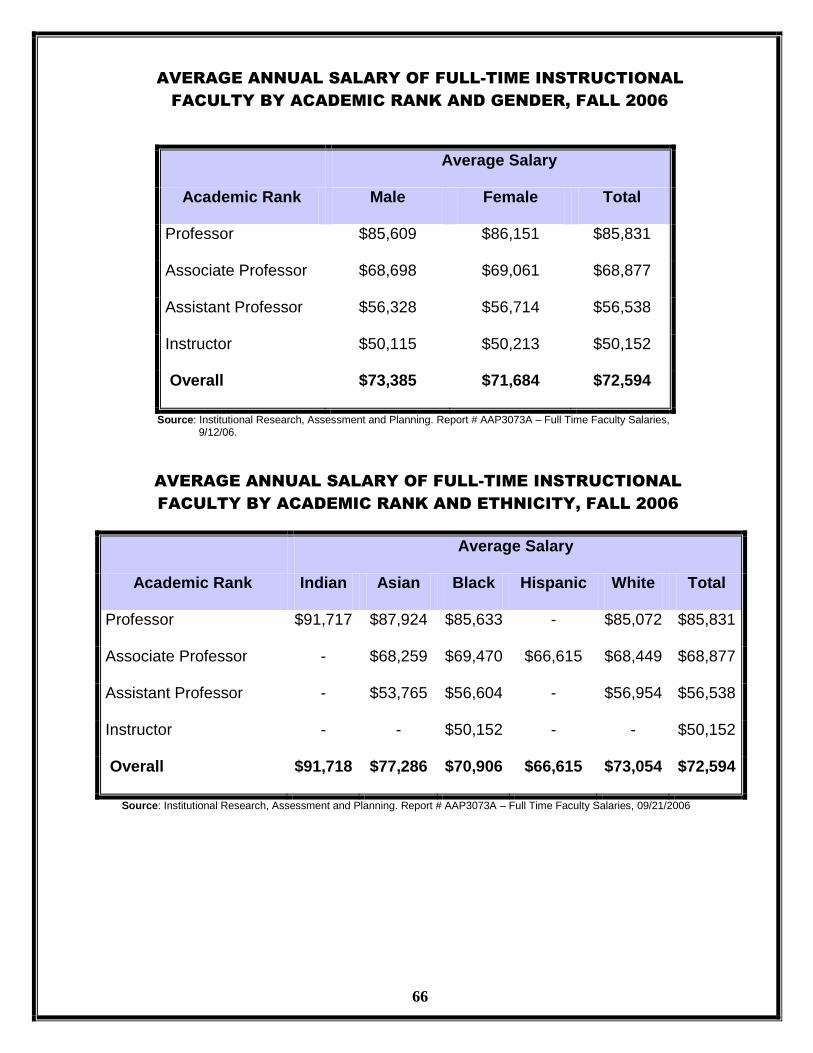
66
AVERAGE ANNUAL SALARY OF FULL-TIME INSTRUCTIONAL
FACULTY BY ACADEMIC RANK AND GENDER, FALL 2006
Academic Rank
Average Salary
Male Female Total
Professor $85,609 $86,151 $85,831
Associate Professor $68,698 $69,061 $68,877
Assistant Professor $56,328 $56,714 $56,538
Instructor $50,115 $50,213 $50,152
Overall $73,385 $71,684 $72,594
Source: Institutional Research, Assessment and Planning. Report # AAP3073A – Full Time Faculty Salaries, 9/12/06.
AVERAGE ANNUAL SALARY OF FULL-TIME INSTRUCTIONAL
FACULTY BY ACADEMIC RANK AND ETHNICITY, FALL 2006
Academic Rank
Average Salary
Indian Asian Black Hispanic White Total
Professor $91,717 $87,924 $85,633 - $85,072 $85,831
Associate Professor - $68,259 $69,470 $66,615 $68,449 $68,877
Assistant Professor - $53,765 $56,604 - $56,954 $56,538
Instructor - - $50,152 - - $50,152
Overall $91,718 $77,286 $70,906 $66,615 $73,054 $72,594
Source: Institutional Research, Assessment and Planning. Report # AAP3073A – Full Time Faculty Salaries, 09/21/2006
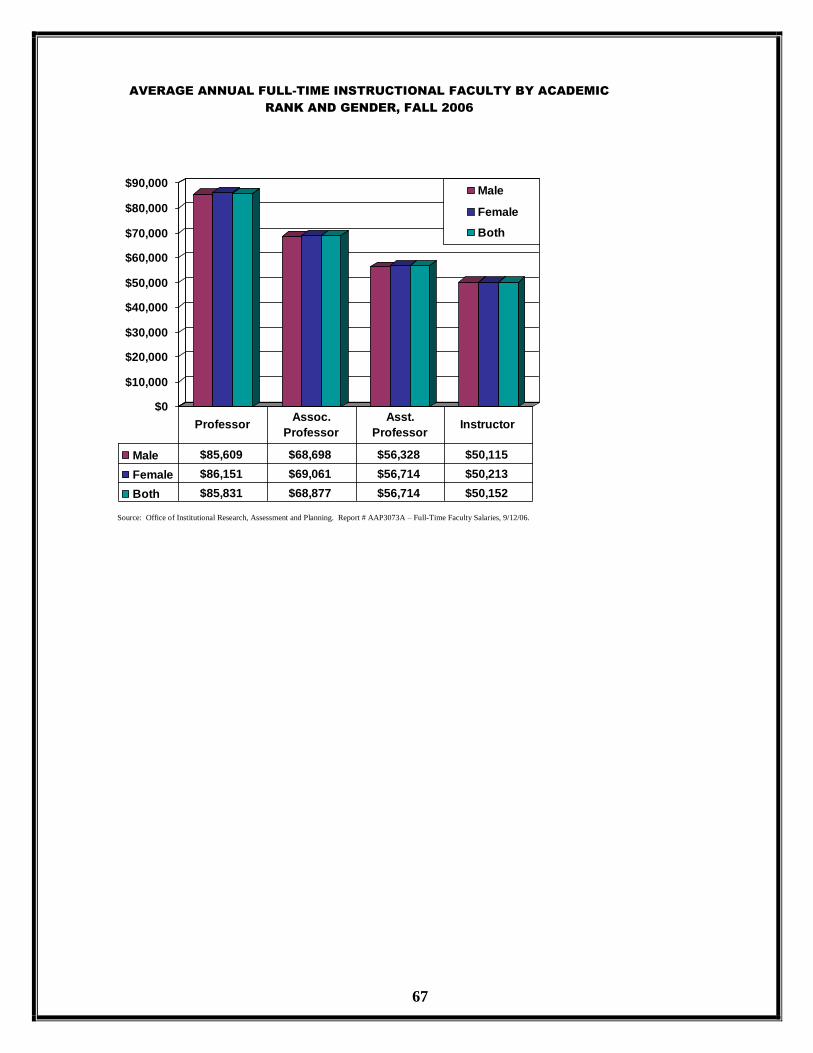
67
AVERAGE ANNUAL FULL-TIME INSTRUCTIONAL FACULTY BY ACADEMIC
RANK AND GENDER, FALL 2006
$0
$10,000
$20,000
$30,000
$40,000
$50,000
$60,000
$70,000
$80,000
$90,000Male
Female
Both
Male $85,609 $68,698 $56,328 $50,115
Female $86,151 $69,061 $56,714 $50,213
Both $85,831 $68,877 $56,714 $50,152
ProfessorAssoc.
Professor
Asst.
ProfessorInstructor
Source: Office of Institutional Research, Assessment and Planning. Report # AAP3073A – Full-Time Faculty Salaries, 9/12/06.

68
FULL-TIME INSTRUCTIONAL FACULTY BY ETHNICITY,
RANK AND GENDER, FALL 2006
Race
Academic Rank
Gender Total
Female Male
Asian
Professor 5 27.8% 13 72.2% 18 100.0% Associate Professor 6 37.5% 10 62.5% 16 100.0%
Assistant Professor 0 0.0% 2 100.0% 2 100.0%
Subtotal
11 30.6% 25 69.4% 36 100.0%
Black
Professor 24 50.0% 24 50.0% 48 100.0%
Associate Professor 23 60.5% 15 39.5% 38 100.0% Assistant Professor 21 61.8% 13 38.2% 34 100.0%
Instructor 3 37.5% 5 62.5% 8 100.0%
Subtotal
71 55.5% 57 44.5% 128 100.0%
Hispanic
Associate Professor 2 100.0% 0 0.0% 2 100.0%
Subtotal
2 100.0% 0 0.0% 2 100.0%
American-Indian
Professor 0 0.0% 3 100.0% 3 100.0% Subtotal 0 0.0% 3 100.0% 3 100.0%
White Professor 7 38.9% 11 61.1% 18 100.0% Associate Professor 6 31.6% 13 68.4% 19 100.0%
Assistant Professor 3 37.5% 5 62.5% 8 100.0% Subtotal
16 35.6% 29 64.4% 45 100.0%
Unspecified
Professor 0 0.0% 1 100.0% 1 100.0% Subtotal 0 0.0% 1 100.0% 1 100.0%
ALL
Professor 36 40.9% 52 59.1% 88 100.0% Associate Professor 37 37.5% 38 62.5% 75 100.0% Assistant Professor 24 54.5% 20 45.5% 44 100.0% Instructor 3 37.5% 5 2.5% 8 100.0% Total
100 46.5%
115 53.5%
215 100.0%
Source: Office of Institutional Research, Assessment and Planning. Report # AAP3073 – Full-Time Faculty Salaries, 9/21/06.
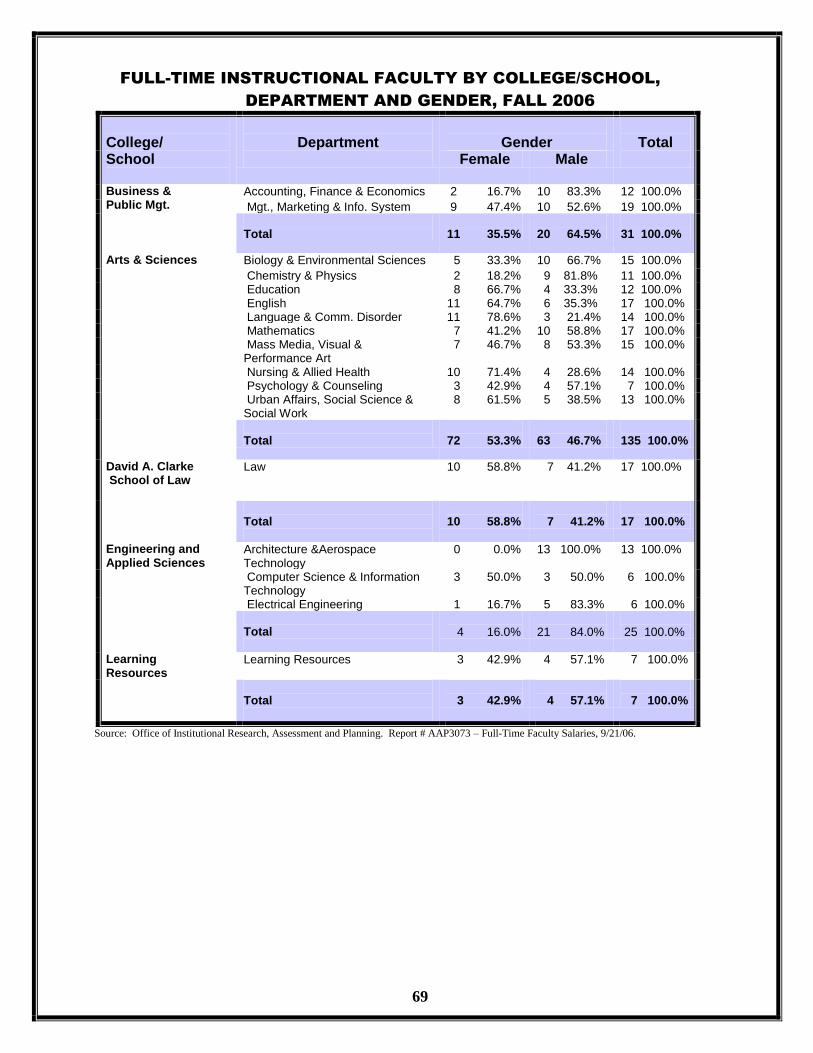
69
FULL-TIME INSTRUCTIONAL FACULTY BY COLLEGE/SCHOOL,
DEPARTMENT AND GENDER, FALL 2006
College/ School
Department
Gender
Total
Female Male
Business & Public Mgt.
Accounting, Finance & Economics 2 16.7% 10 83.3% 12 100.0%
Mgt., Marketing & Info. System 9 47.4% 10 52.6% 19 100.0% Total
11 35.5%
20 64.5%
31 100.0%
Arts & Sciences
Biology & Environmental Sciences 5 33.3% 10 66.7% 15 100.0%
Chemistry & Physics 2 18.2% 9 81.8% 11 100.0% Education 8 66.7% 4 33.3% 12 100.0% English 11 64.7% 6 35.3% 17 100.0% Language & Comm. Disorder 11 78.6% 3 21.4% 14 100.0% Mathematics 7 41.2% 10 58.8% 17 100.0% Mass Media, Visual & Performance Art
7 46.7% 8 53.3% 15 100.0%
Nursing & Allied Health 10 71.4% 4 28.6% 14 100.0% Psychology & Counseling 3 42.9% 4 57.1% 7 100.0% Urban Affairs, Social Science & Social Work
8 61.5% 5 38.5% 13 100.0%
Total
72 53.3%
63 46.7%
135 100.0%
David A. Clarke School of Law
Law
10 58.8% 7 41.2% 17 100.0%
Total
10 58.8%
7 41.2%
17 100.0%
Engineering and Applied Sciences
Architecture &Aerospace Technology
0 0.0% 13 100.0% 13 100.0%
Computer Science & Information Technology
3 50.0% 3 50.0% 6 100.0%
Electrical Engineering 1 16.7% 5 83.3% 6 100.0% Total
4 16.0%
21 84.0%
25 100.0%
Learning Resources
Learning Resources
3 42.9% 4 57.1% 7 100.0%
Total
3 42.9%
4 57.1%
7 100.0%
Source: Office of Institutional Research, Assessment and Planning. Report # AAP3073 – Full-Time Faculty Salaries, 9/21/06.
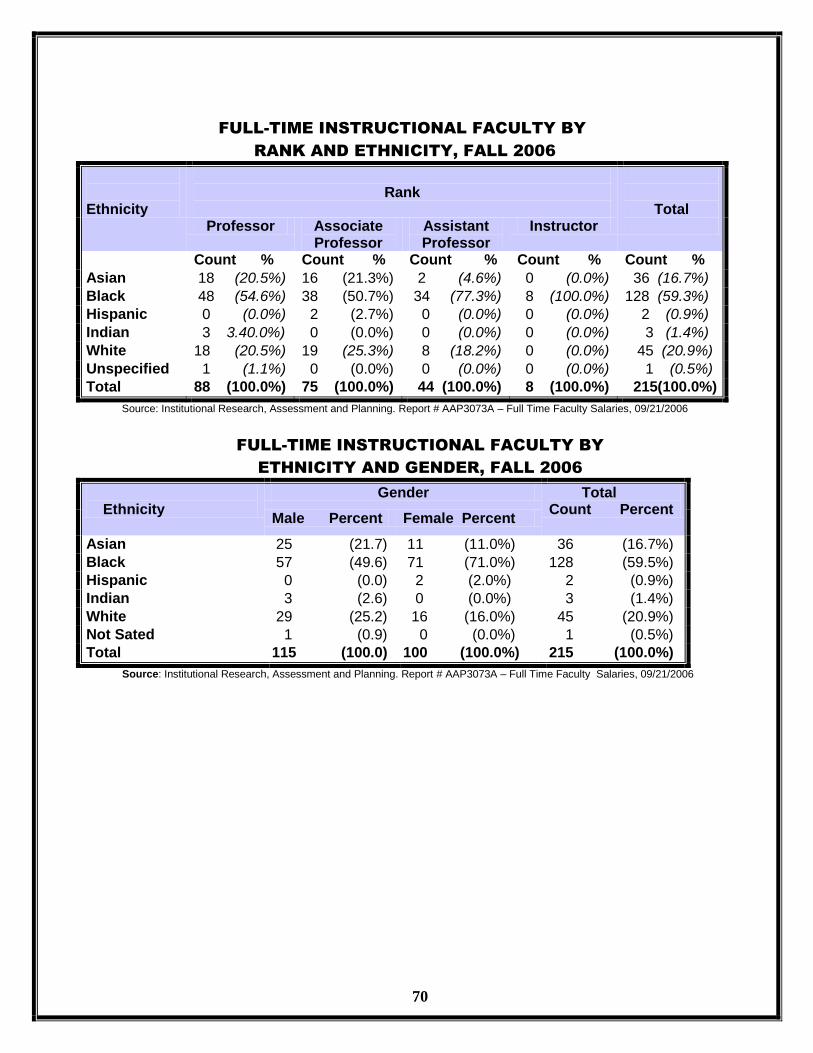
70
FULL-TIME INSTRUCTIONAL FACULTY BY
RANK AND ETHNICITY, FALL 2006
Ethnicity
Rank
Total Professor Associate
Professor Assistant Professor
Instructor
Count % Count % Count % Count % Count %
Asian 18 (20.5%) 16 (21.3%) 2 (4.6%) 0 (0.0%) 36 (16.7%)
Black 48 (54.6%) 38 (50.7%) 34 (77.3%) 8 (100.0%) 128 (59.3%)
Hispanic 0 (0.0%) 2 (2.7%) 0 (0.0%) 0 (0.0%) 2 (0.9%)
Indian 3 3.40.0%) 0 (0.0%) 0 (0.0%) 0 (0.0%) 3 (1.4%)
White 18 (20.5%) 19 (25.3%) 8 (18.2%) 0 (0.0%) 45 (20.9%)
Unspecified 1 (1.1%) 0 (0.0%) 0 (0.0%) 0 (0.0%) 1 (0.5%)
Total 88 (100.0%) 75 (100.0%) 44 (100.0%) 8 (100.0%) 215(100.0%)
Source: Institutional Research, Assessment and Planning. Report # AAP3073A – Full Time Faculty Salaries, 09/21/2006
FULL-TIME INSTRUCTIONAL FACULTY BY
ETHNICITY AND GENDER, FALL 2006
Ethnicity
Gender Total Count Percent
Male Percent Female Percent
Asian 25 (21.7) 11 (11.0%) 36 (16.7%)
Black 57 (49.6) 71 (71.0%) 128 (59.5%)
Hispanic 0 (0.0) 2 (2.0%) 2 (0.9%)
Indian 3 (2.6) 0 (0.0%) 3 (1.4%)
White 29 (25.2) 16 (16.0%) 45 (20.9%)
Not Sated 1 (0.9) 0 (0.0%) 1 (0.5%)
Total 115 (100.0) 100 (100.0%) 215 (100.0%)
Source: Institutional Research, Assessment and Planning. Report # AAP3073A – Full Time Faculty Salaries, 09/21/2006
71
SECTION IX
University of the District
Of Columbia’s Finance
Statement
September 30, 2007 and
2006
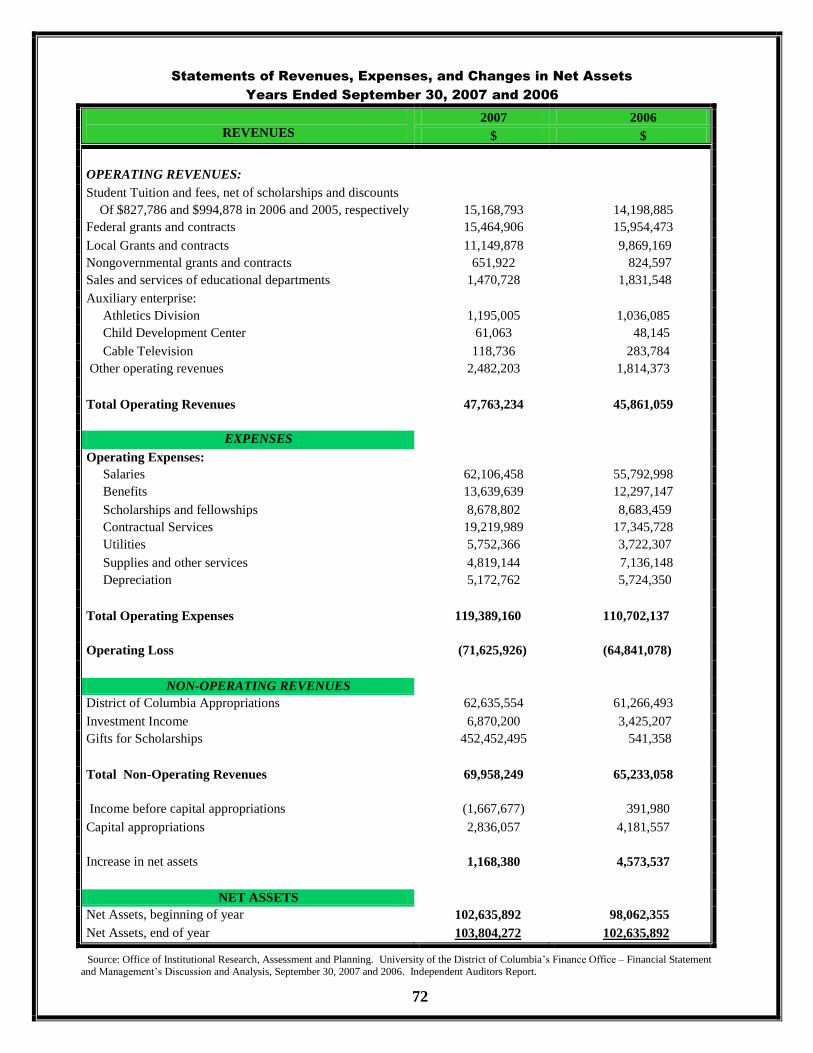
72
Statements of Revenues, Expenses, and Changes in Net Assets
Years Ended September 30, 2007 and 2006
REVENUES
2007 2006
$ $
OPERATING REVENUES:
Student Tuition and fees, net of scholarships and discounts
Of $827,786 and $994,878 in 2006 and 2005, respectively 15,168,793 14,198,885
Federal grants and contracts 15,464,906 15,954,473
Local Grants and contracts 11,149,878 9,869,169
Nongovernmental grants and contracts 651,922 824,597
Sales and services of educational departments 1,470,728 1,831,548
Auxiliary enterprise:
Athletics Division 1,195,005 1,036,085
Child Development Center 61,063 48,145
Cable Television 118,736 283,784
Other operating revenues 2,482,203 1,814,373
Total Operating Revenues 47,763,234 45,861,059
EXPENSES
Operating Expenses:
Salaries 62,106,458 55,792,998
Benefits 13,639,639 12,297,147
Scholarships and fellowships 8,678,802 8,683,459
Contractual Services 19,219,989 17,345,728
Utilities 5,752,366 3,722,307
Supplies and other services 4,819,144 7,136,148
Depreciation 5,172,762 5,724,350
Total Operating Expenses 119,389,160 110,702,137
Operating Loss (71,625,926) (64,841,078)
NON-OPERATING REVENUES
District of Columbia Appropriations 62,635,554 61,266,493
Investment Income 6,870,200 3,425,207
Gifts for Scholarships 452,452,495 541,358
Total Non-Operating Revenues 69,958,249 65,233,058
Income before capital appropriations (1,667,677) 391,980
Capital appropriations 2,836,057 4,181,557
Increase in net assets 1,168,380 4,573,537
NET ASSETS
Net Assets, beginning of year 102,635,892 98,062,355
Net Assets, end of year 103,804,272 102,635,892
Source: Office of Institutional Research, Assessment and Planning. University of the District of Columbia’s Finance Office – Financial Statement
and Management’s Discussion and Analysis, September 30, 2007 and 2006. Independent Auditors Report.

73
Statements of Cash Flows
Years Ended September 30, 2007 and 2006
STATEMENTS OF CASH FLOWS
$ $
2007 2006
CASH FLOWS FROM OPERATING ACTIVITIES
Tuition and Fees $ 15,878,524 $ 14,790,691
Grants and contracts 28,140,942 26,832,485
Payments to vendors (27,943,636) (26,543,706)
Payments to employees (73,473,144) (60,013,246)
Other payments (3,851,045 (3,179,178)
Not cash used in operating activities (61,248,359) (48,112,954)
CASH FLOWS FROM NONCAPITAL FINANCING ACTIVITIES
District of Columbia appropriations 62,635,554 61,266,493
Change in advances to/ (from) District 2,306,492 1,182,643
Gifts for scholarships 452,495 541,358
Net cash provided by non-capital financing activities 65,394,541 62,990,494
CASH FLOWS FROM CAPITAL AND RELATED FINANCING ACTIVITIES
Purchase of capital assets (1,339,075) (1,786,112)
CASH FLOWS FROM INVESTING ACTIVITIES
Proceeds from sales/maturities of long-term investments 3,287,835 6,472,099
Interest on investments 3,304,781 851,967
Purchase of investments (4,253,957) (8,043,704)
Net cash (used in ) provided by investing activities 2,338,659 (719,638)
Net increase in cash and cash equivalents 5,145,766 12,371,790
Cash and cash equivalents, beginning of year 30,404,866 18,033,076
Cash and cash equivalents, end of year $ 35,550,632 $ 30,404,866
Source: Office of Institutional Research, Assessment and Planning. University of the District of Columbia’s Finance Office – Financial Statement and Management’s Discussion and Analysis, September 30, 2007 and 2006. Independent Auditors Report.
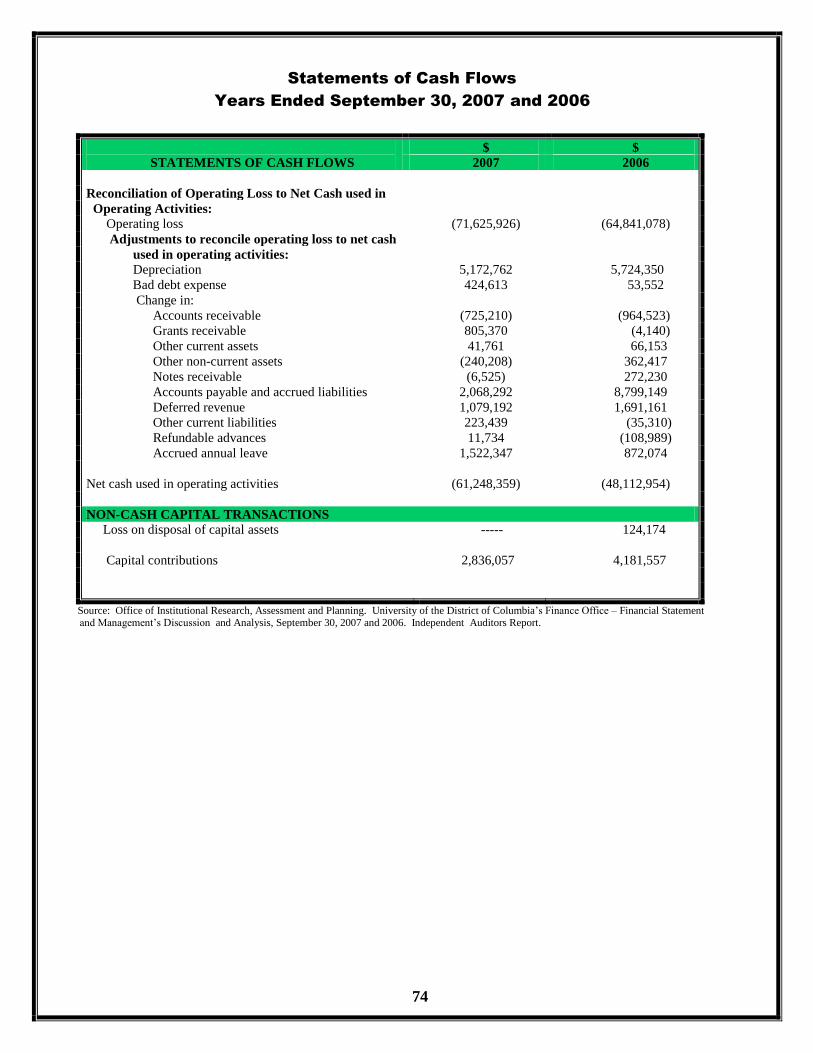
74
Statements of Cash Flows
Years Ended September 30, 2007 and 2006
STATEMENTS OF CASH FLOWS
$ $
2007 2006
Reconciliation of Operating Loss to Net Cash used in
Operating Activities:
Operating loss (71,625,926) (64,841,078)
Adjustments to reconcile operating loss to net cash
used in operating activities:
Depreciation 5,172,762 5,724,350
Bad debt expense 424,613 53,552
Change in:
Accounts receivable (725,210) (964,523)
Grants receivable 805,370 (4,140)
Other current assets 41,761 66,153
Other non-current assets (240,208) 362,417
Notes receivable (6,525) 272,230
Accounts payable and accrued liabilities 2,068,292 8,799,149
Deferred revenue 1,079,192 1,691,161
Other current liabilities 223,439 (35,310)
Refundable advances 11,734 (108,989)
Accrued annual leave 1,522,347 872,074
Net cash used in operating activities (61,248,359) (48,112,954)
NON-CASH CAPITAL TRANSACTIONS
Loss on disposal of capital assets ----- 124,174
Capital contributions 2,836,057 4,181,557
Source: Office of Institutional Research, Assessment and Planning. University of the District of Columbia’s Finance Office – Financial Statement and Management’s Discussion and Analysis, September 30, 2007 and 2006. Independent Auditors Report.