Academic Programs Annual Data Report/media/Corporate/Files/EducationCareers/... · 1 Section I:...
19
Academic Programs Annual Data Report Academic Year 2017–2018 Prepared by: Division of Professional Affairs Neil Harvison, PhD, OTR/L, FAOTA—Chief Officer American Occupational Therapy Association 4720 Montgomery Lane Suite 200 Bethesda, MD 20814-3425 301-652-AOTA (2682), ext. 2964 www.aota.org Note: The data contained in this document is self-reported by the academic programs through the annual data survey submitted to AOTA in March of each year. Copyright© 2018, by the American Occupational Therapy Association. All rights reserved.
Transcript of Academic Programs Annual Data Report/media/Corporate/Files/EducationCareers/... · 1 Section I:...
Academic Programs Annual Data Report
Academic Year 2017–2018
Prepared by: Division of Professional Affairs
Neil Harvison, PhD, OTR/L, FAOTA—Chief Officer American Occupational Therapy Association
4720 Montgomery Lane Suite 200
Bethesda, MD 20814-3425 301-652-AOTA (2682), ext. 2964
www.aota.org
Note: The data contained in this document is self-reported by the academic programs through the annual data survey submitted to AOTA in March of each year.
Copyright© 2018, by the American Occupational Therapy Association. All rights reserved.
ii
Table of Contents
Section I: Programs Number of accredited programs ............................................................................................. 1 Regional distribution of accredited programs ....................................................................... 2 Post-professional programs offered ....................................................................................... . 3
Section II: Program Formats Weekday, evening, or weekend format .................................................................................. 4 Percentage of program offered by distance education ........................................................ 5
Section III: Students Number of students currently enrolled .................................................................................. 6 Trends in enrollment ................................................................................................................ 6 Applications ............................................................................................................................... 8 Ethnicity ..................................................................................................................................... 10 Race…………………………………………………………………………………11 Gender ........................................................................................................................................ 12
Section IV: Faculty Faculty member numbers ........................................................................................................ 13 Faculty-to-student ratios .......................................................................................................... 14
Section V: Outcomes Program retention rates ............................................................................................................ 15 Program graduates ................................................................................................................... 16 Certification exam new graduate pass rates ........................................................................... 16 Program fieldwork Level II pass rates ................................................................................... 17 Employment…………………………………………………………………………17 Starting salary……………………………………………………………………….. 17 First practice area ……………………………………………………………………18

1
Section I: Programs Number of accredited programs:
OT Doctoral
OT Master’s
OTA
Accredited
20
162*
215
Candidate
26
13
15
Applicant
41
14
16
Total
87
189
246
Notes: * Of the 162 accredited master’s programs, 45 are transitioning to the doctorate and will withdraw from accreditation once the doctorate is accredited. Accredited: The academic program is accredited by ACOTE®. Candidate: The program has been granted candidate program status by ACOTE and can admit students, but has not yet completed the initial on-site evaluation that leads to granting accreditation. Applicant: The academic program has submitted a letter of intent to apply for developing program status.
Number of additional locations:
OT Doctoral
OT Master’s
OTA
Accredited
0
10
2
Candidate
0
0
1
Applicant
0
0
1
Total
0
10
4
Total number of locations (both main campus and additional locations):
OT Doctoral
OT Master’s
OTA
Total Locations
87
199
250
2
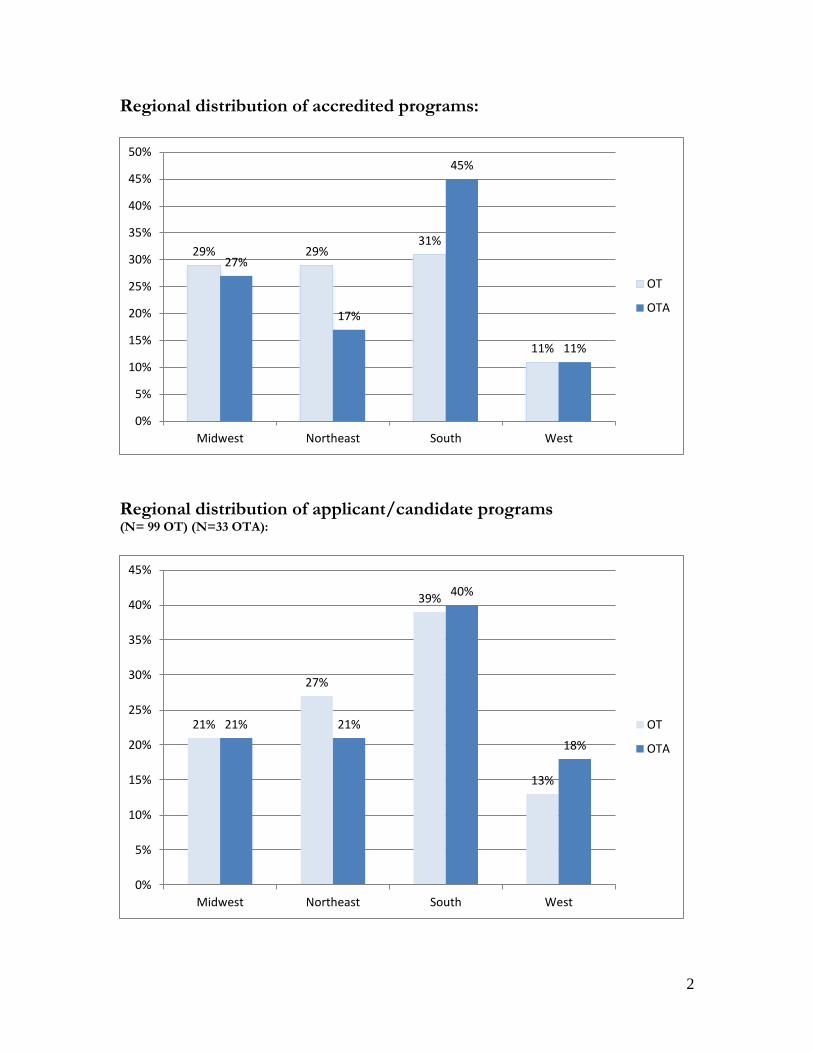
Regional distribution of accredited programs:
Regional distribution of applicant/candidate programs (N= 99 OT) (N=33 OTA):
29% 29% 31%
11%
27%
17%
45%
11%
0%
5%
10%
15%
20%
25%
30%
35%
40%
45%
50%
Midwest Northeast South West
OT
OTA
21%
27%
39%
13%
21% 21%
40%
18%
0%
5%
10%
15%
20%
25%
30%
35%
40%
45%
Midwest Northeast South West
OT
OTA

3
Post-professional programs offered at institutions housing OT programs:
Institutions currently offering a post-professional degree program for practicing OTs:
Number of Institutions
Percent
Yes
63
44%
No
105
56%
Total
168
100%
Degrees offered in post-professional programs:
Note: A number of institutions have more than one program option for practicing therapists.
14
11
38
9
0
29
0
5
10
15
20
25
30
35
40
OTM Other Masters OTD PhD ScD OtherDoctorate

4
Section II: Program Formats
Primary format:
Doctoral-degree-level programs for occupational therapy students:
Number of Programs
Percent
Weekday
19
95%
Other formats: weekend, evenings, blended
1
5%
Total
20
100%
Master’s-degree-level programs for occupational therapy students*:
Number of Programs
Percent
Weekday
148
88%
Other formats: weekend, evenings, blended
20
12%
Total
168
100%
Programs for occupational therapy assistant students*:
Number of Programs
Percent
Weekday
205
95%
Other formats: weekend, evenings, blended
10
5%
Total
215
100%
* Note: A number of programs offer multiple tracks with different formats.
5
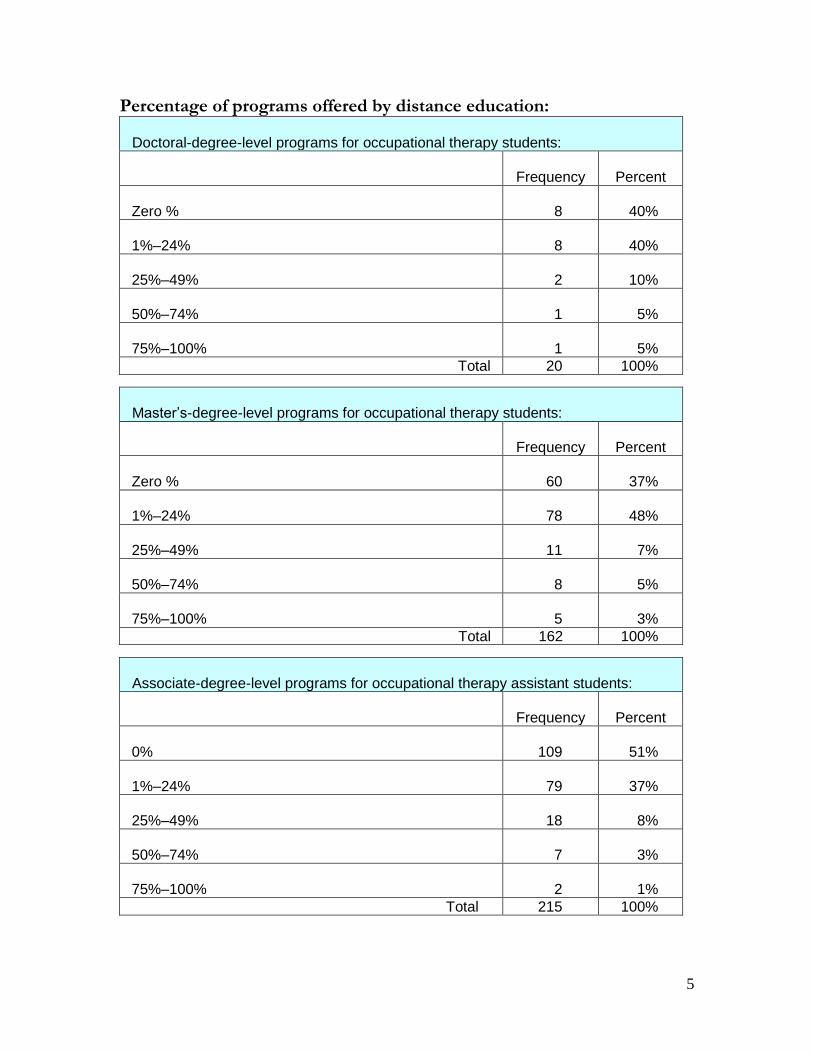
Percentage of programs offered by distance education: Doctoral-degree-level programs for occupational therapy students:
Frequency
Percent
Zero % 8 40%
1%–24% 8 40%
25%–49% 2 10%
50%–74% 1 5%
75%–100% 1 5%
Total 20 100%
Master’s-degree-level programs for occupational therapy students:
Frequency
Percent
Zero % 60 37%
1%–24% 78 48%
25%–49% 11 7%
50%–74% 8 5%
75%–100% 5 3%
Total 162 100%
Associate-degree-level programs for occupational therapy assistant students:
Frequency
Percent
0% 109 51%
1%–24% 79 37%
25%–49% 18 8%
50%–74% 7 3%
75%–100% 2 1%
Total 215 100%
6
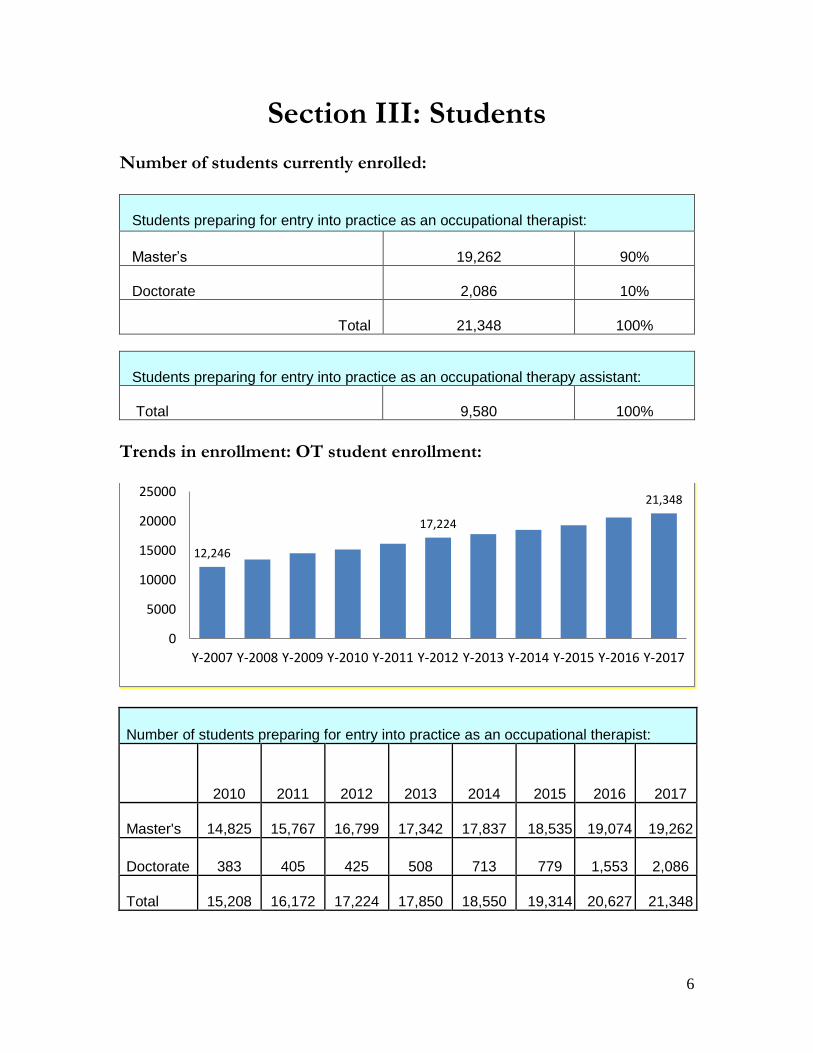
Section III: Students Number of students currently enrolled:
Students preparing for entry into practice as an occupational therapist:
Master’s 19,262 90%
Doctorate 2,086 10%
Total 21,348 100%
Students preparing for entry into practice as an occupational therapy assistant:
Total 9,580 100%
Trends in enrollment: OT student enrollment:
Number of students preparing for entry into practice as an occupational therapist:
2010
2011
2012
2013
2014 2015 2016 2017
Master's 14,825 15,767 16,799 17,342 17,837 18,535 19,074 19,262
Doctorate 383 405 425 508 713 779 1,553 2,086
Total 15,208 16,172 17,224 17,850 18,550 19,314 20,627 21,348
12,246 17,224
21,348
0
5000
10000
15000
20000
25000
Y-2007 Y-2008 Y-2009 Y-2010 Y-2011 Y-2012 Y-2013 Y-2014 Y-2015 Y-2016 Y-2017
7
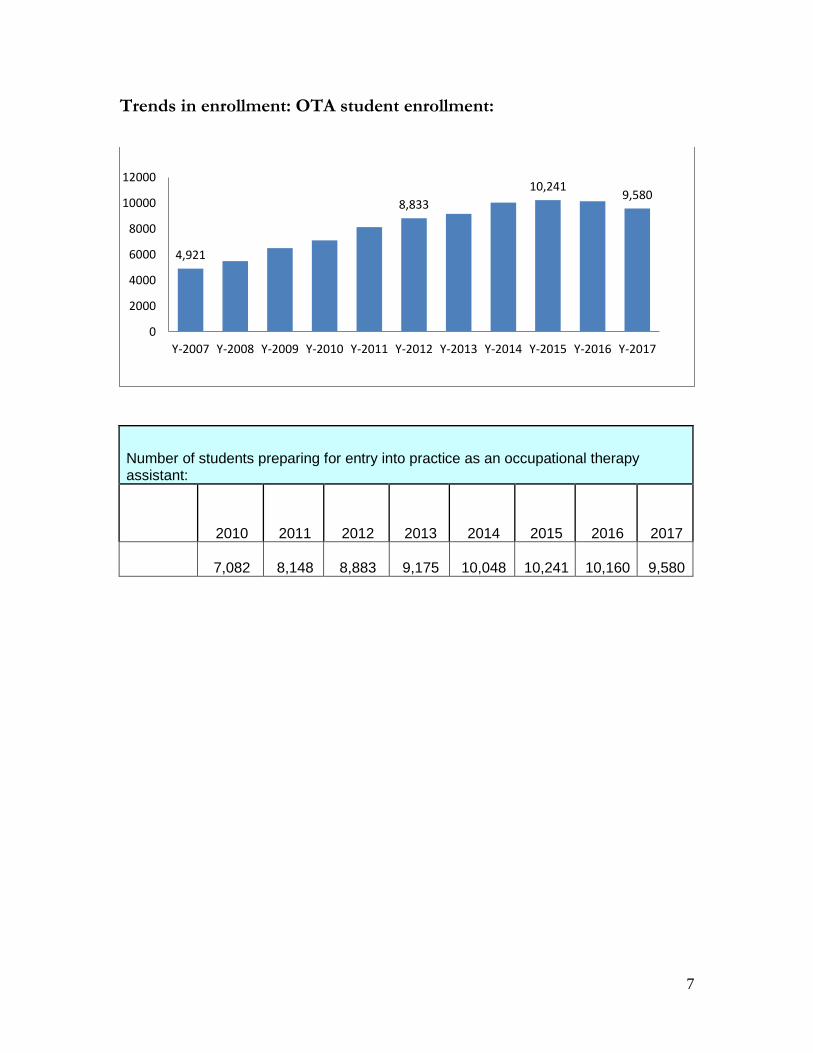
Trends in enrollment: OTA student enrollment:
Number of students preparing for entry into practice as an occupational therapy assistant:
2010 2011 2012 2013 2014 2015 2016 2017
7,082 8,148 8,883 9,175 10,048 10,241 10,160 9,580
4,921
8,833
10,241 9,580
0
2000
4000
6000
8000
10000
12000
Y-2007 Y-2008 Y-2009 Y-2010 Y-2011 Y-2012 Y-2013 Y-2014 Y-2015 Y-2016 Y-2017
8
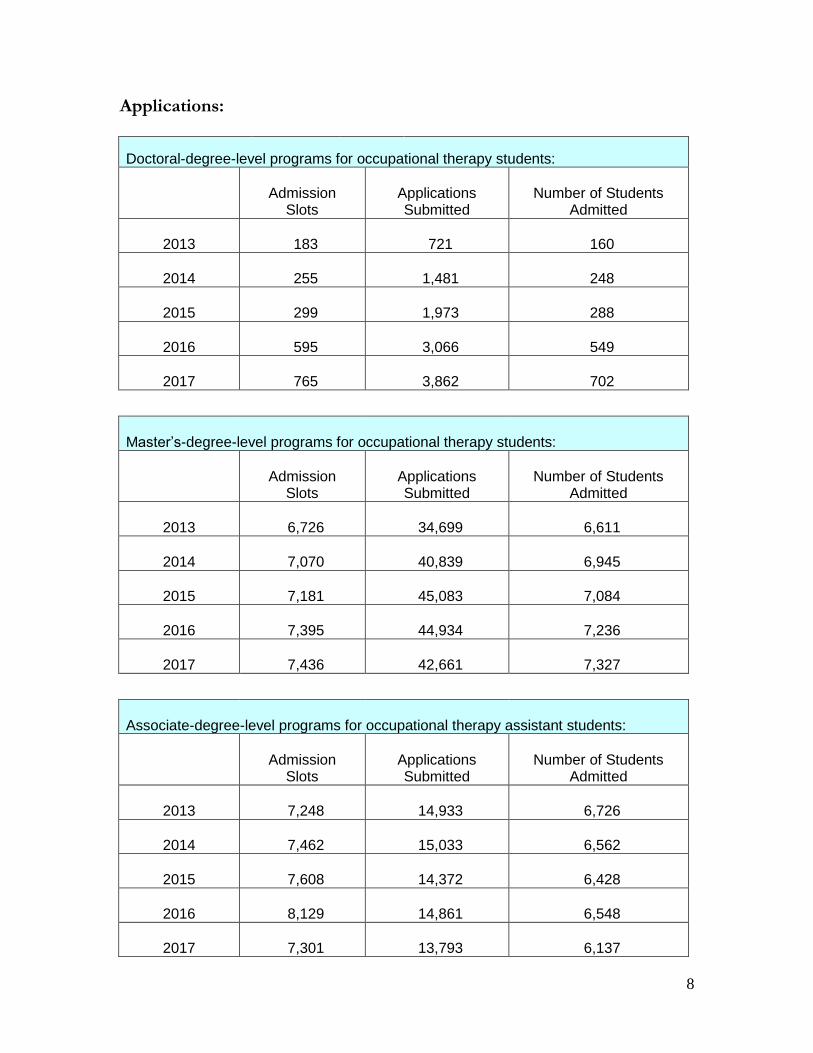
Applications:
Doctoral-degree-level programs for occupational therapy students:
Admission
Slots Applications Submitted
Number of Students Admitted
2013 183 721 160
2014 255 1,481 248
2015 299 1,973 288
2016 595 3,066 549
2017 765 3,862 702
Master’s-degree-level programs for occupational therapy students:
Admission
Slots Applications Submitted
Number of Students Admitted
2013 6,726 34,699 6,611
2014 7,070 40,839 6,945
2015 7,181 45,083 7,084
2016 7,395 44,934 7,236
2017 7,436 42,661
7,327
Associate-degree-level programs for occupational therapy assistant students:
Admission
Slots Applications Submitted
Number of Students Admitted
2013 7,248 14,933 6,726
2014 7,462 15,033 6,562
2015 7,608 14,372 6,428
2016 8,129 14,861 6,548
2017 7,301 13,793 6,137
9
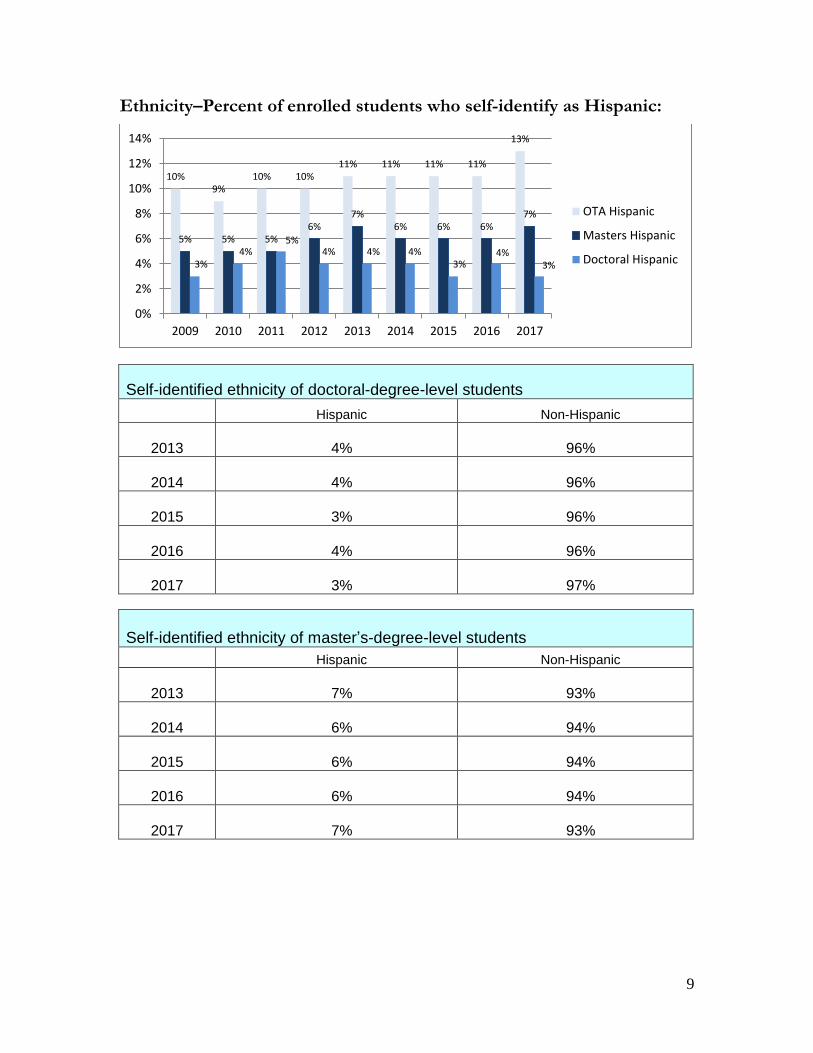
Ethnicity–Percent of enrolled students who self-identify as Hispanic:
Self-identified ethnicity of doctoral-degree-level students
Hispanic Non-Hispanic
2013 4% 96%
2014 4% 96%
2015 3% 96%
2016 4% 96%
2017 3% 97%
Self-identified ethnicity of master’s-degree-level students
Hispanic Non-Hispanic
2013 7% 93%
2014 6% 94%
2015 6% 94%
2016 6% 94%
2017 7% 93%
10% 9%
10% 10% 11% 11% 11% 11%
13%
5% 5% 5% 6%
7% 6% 6% 6%
7%
3% 4%
5% 4% 4% 4%
3% 4%
3%
0%
2%
4%
6%
8%
10%
12%
14%
2009 2010 2011 2012 2013 2014 2015 2016 2017
OTA Hispanic
Masters Hispanic
Doctoral Hispanic
10
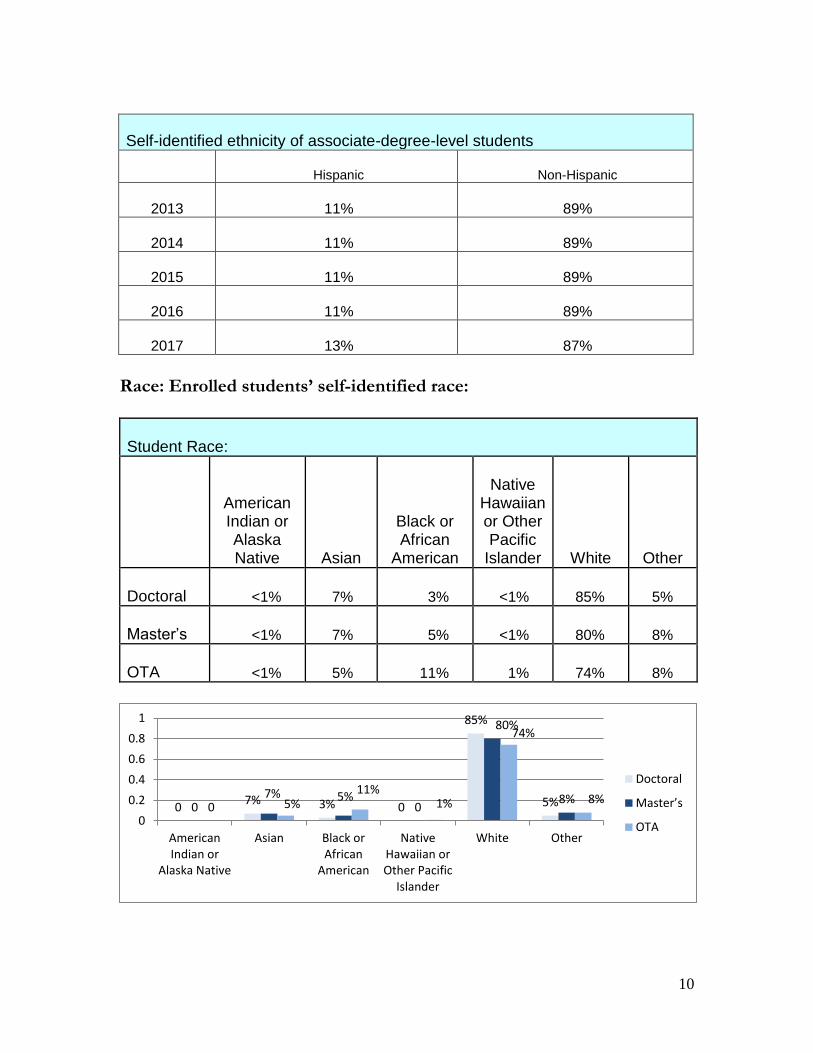
Self-identified ethnicity of associate-degree-level students
Hispanic Non-Hispanic
2013 11% 89%
2014 11% 89%
2015 11% 89%
2016 11% 89%
2017 13% 87%
Race: Enrolled students’ self-identified race: Student Race:
American Indian or Alaska Native
Asian
Black or African
American
Native
Hawaiian or Other Pacific
Islander
White
Other
Doctoral <1% 7% 3% <1% 85% 5%
Master’s <1% 7% 5% <1% 80% 8%
OTA <1% 5% 11% 1% 74% 8%
0 7% 3% 0
85%
5% 0 7% 5%
0
80%
8% 0 5%
11% 1%
74%
8%
0
0.2
0.4
0.6
0.8
1
AmericanIndian or
Alaska Native
Asian Black orAfrican
American
NativeHawaiian orOther Pacific
Islander
White Other
Doctoral
Master’s
OTA
11
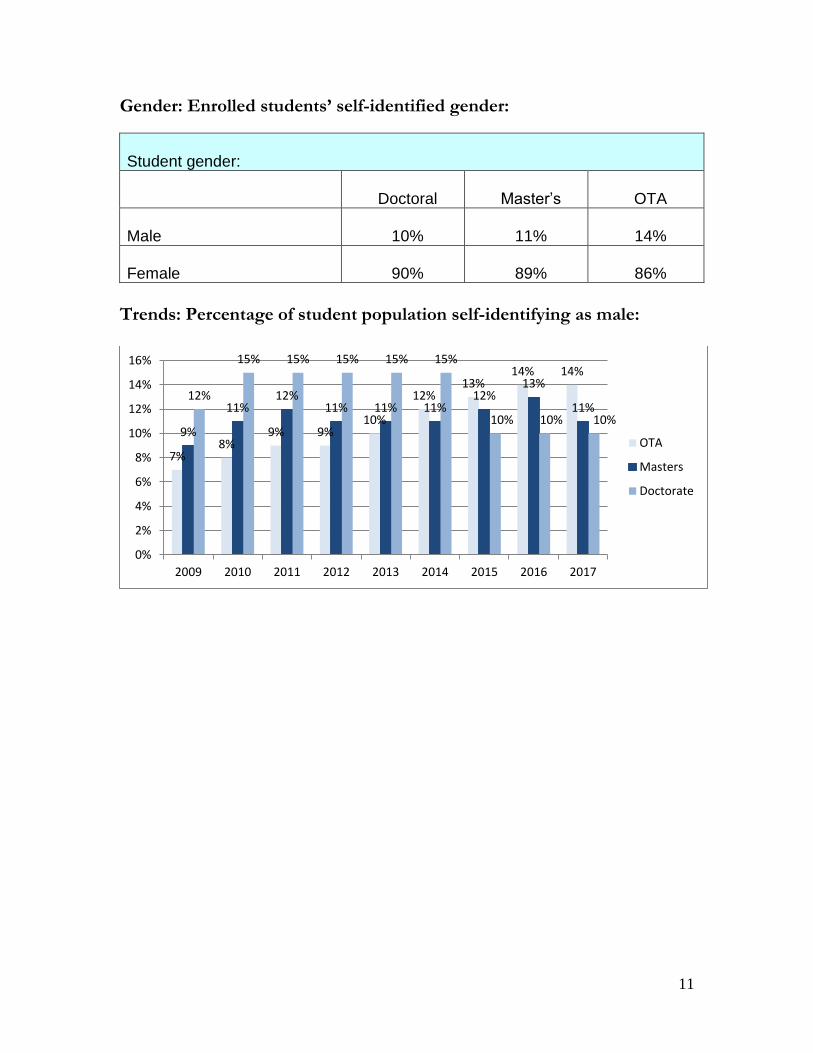
Gender: Enrolled students’ self-identified gender:
Student gender:
Doctoral
Master’s
OTA
Male
10%
11%
14%
Female
90%
89%
86%
Trends: Percentage of student population self-identifying as male:
7% 8%
9% 9% 10%
12% 13%
14% 14%
9%
11% 12%
11% 11% 11% 12%
13%
11% 12%
15% 15% 15% 15% 15%
10% 10% 10%
0%
2%
4%
6%
8%
10%
12%
14%
16%
2009 2010 2011 2012 2013 2014 2015 2016 2017
OTA
Masters
Doctorate
12
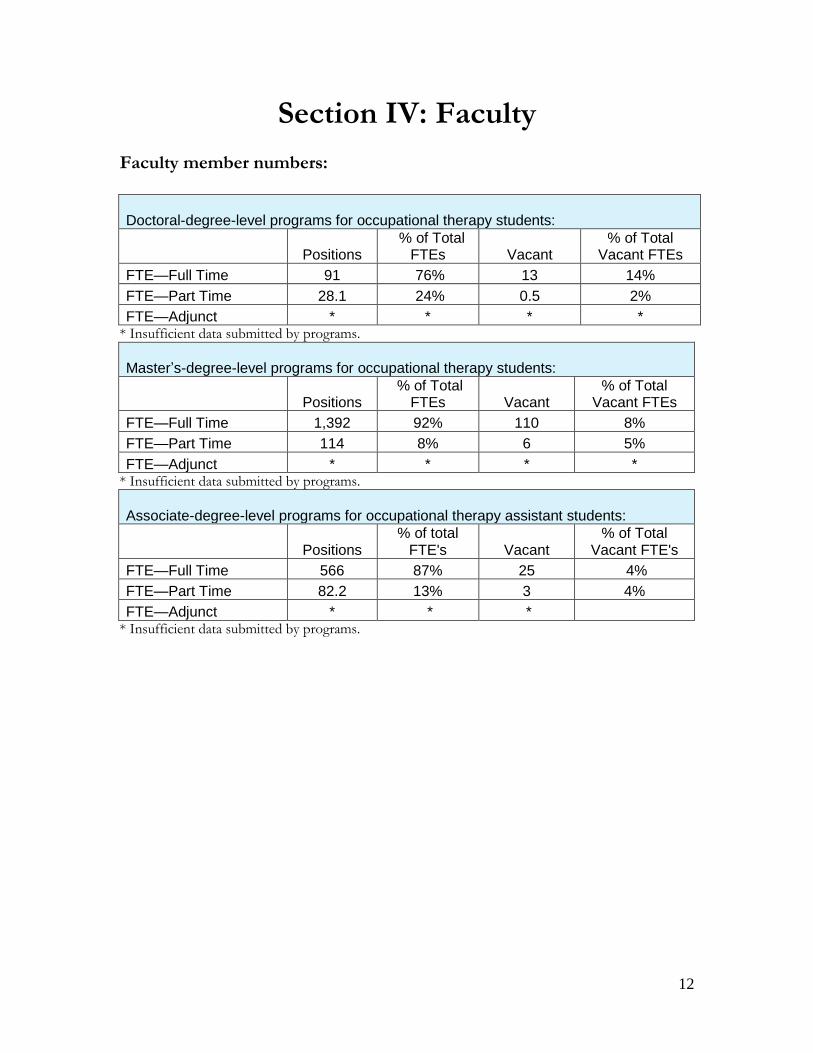
Section IV: Faculty Faculty member numbers: Doctoral-degree-level programs for occupational therapy students:
Positions % of Total
FTEs Vacant % of Total
Vacant FTEs
FTE—Full Time 91 76% 13 14%
FTE—Part Time 28.1 24% 0.5 2%
FTE—Adjunct * * * * * Insufficient data submitted by programs.
Master’s-degree-level programs for occupational therapy students:
Positions % of Total
FTEs Vacant % of Total
Vacant FTEs
FTE—Full Time 1,392 92% 110 8%
FTE—Part Time 114 8% 6 5%
FTE—Adjunct * * * * * Insufficient data submitted by programs. Associate-degree-level programs for occupational therapy assistant students:
Positions % of total
FTE's Vacant % of Total
Vacant FTE's
FTE—Full Time 566 87% 25 4%
FTE—Part Time 82.2 13% 3 4%
FTE—Adjunct * * * * Insufficient data submitted by programs.
13
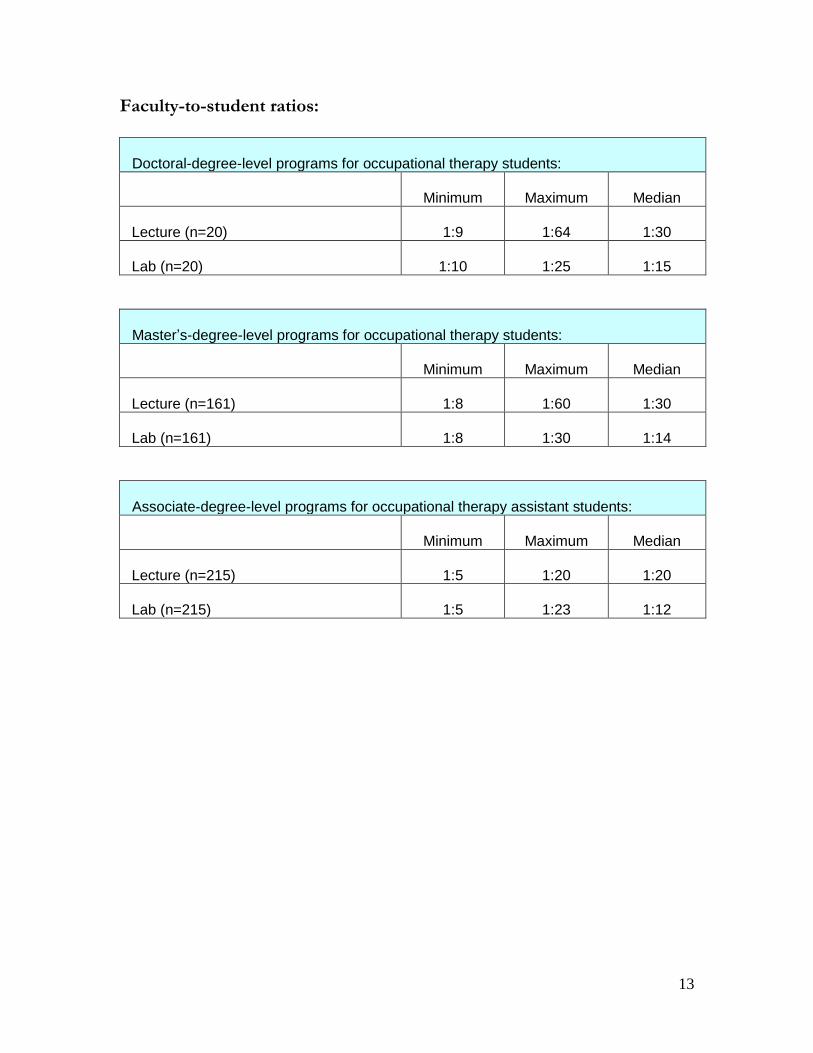
Faculty-to-student ratios:
Doctoral-degree-level programs for occupational therapy students:
Minimum
Maximum
Median
Lecture (n=20) 1:9 1:64 1:30
Lab (n=20) 1:10 1:25 1:15
Master’s-degree-level programs for occupational therapy students:
Minimum
Maximum
Median
Lecture (n=161) 1:8 1:60 1:30
Lab (n=161) 1:8 1:30 1:14
Associate-degree-level programs for occupational therapy assistant students:
Minimum
Maximum
Median
Lecture (n=215) 1:5 1:20 1:20
Lab (n=215) 1:5 1:23 1:12
14
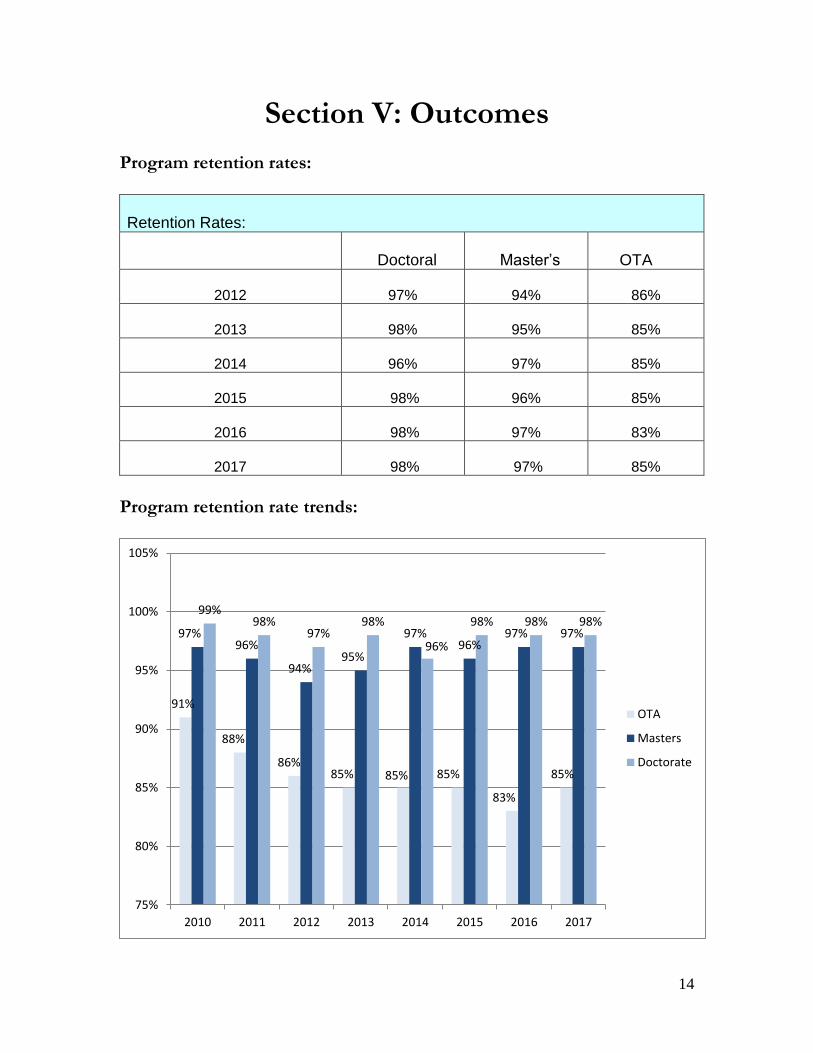
Section V: Outcomes Program retention rates:
Retention Rates:
Doctoral
Master’s
OTA
2012 97% 94% 86%
2013 98% 95% 85%
2014 96% 97% 85%
2015 98% 96% 85%
2016 98% 97% 83%
2017 98% 97% 85%
Program retention rate trends:
91%
88%
86% 85% 85% 85%
83%
85%
97% 96%
94% 95%
97% 96%
97% 97%
99% 98%
97% 98%
96%
98% 98% 98%
75%
80%
85%
90%
95%
100%
105%
2010 2011 2012 2013 2014 2015 2016 2017
OTA
Masters
Doctorate
15
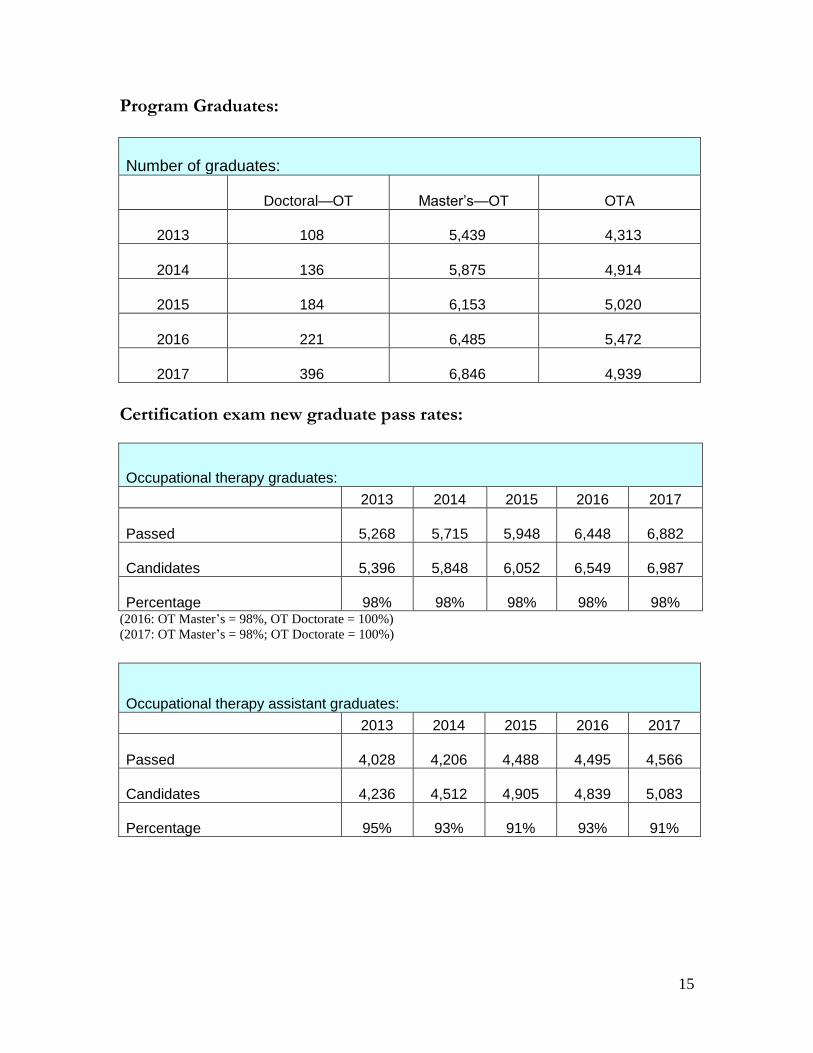
Program Graduates: Number of graduates:
Doctoral—OT Master’s—OT OTA
2013 108 5,439 4,313
2014 136 5,875 4,914
2015 184 6,153 5,020
2016 221 6,485 5,472
2017 396 6,846 4,939
Certification exam new graduate pass rates:
Occupational therapy graduates:
2013 2014 2015 2016 2017
Passed 5,268 5,715 5,948 6,448 6,882
Candidates 5,396 5,848 6,052 6,549 6,987
Percentage 98% 98% 98% 98% 98%
(2016: OT Master’s = 98%, OT Doctorate = 100%)
(2017: OT Master’s = 98%; OT Doctorate = 100%)
Occupational therapy assistant graduates:
2013 2014 2015 2016 2017
Passed 4,028 4,206 4,488 4,495 4,566
Candidates 4,236 4,512 4,905 4,839 5,083
Percentage 95% 93% 91% 93% 91%

16
Program fieldwork Level II pass rates: FW Level II Pass Rates:
Placements Passed %
Doctoral 1,097 1,088 99%
Master’s 13,678 13,359 98%
OTA 8,921 8,602 96%
Employment:
Employment as reported by programs:
Percent of graduates employed in OT/OTA
position within 6 months of graduation.
Number of Doctoral OT
Number of Master’s OT
Number of OTA
1%–24% 0 1 9
25%–49% 1 3 20
50%–74% 0 15 59
75%–100% 13 138 118
NOTE: A total of 6 Doctoral, 5 Master’s, and 9 OTA programs had no graduates in the reporting period.
Starting salary:
Average starting salary as reported by programs:
Average Salary Range
Number Doctoral OT
Number of Master’s OT
Number of OTA
0–$20,000 0 2 6
$20,001–$40,000 0 2 45
$40,001–$60,000 0 37 149
$60,001–$ 80,000 13 108 7
$80,001–$100,000 0 9 0
NOTE: A total of 7 Doctoral, 5 Master’s and 9 OTA programs had no graduates in the reporting period.
17
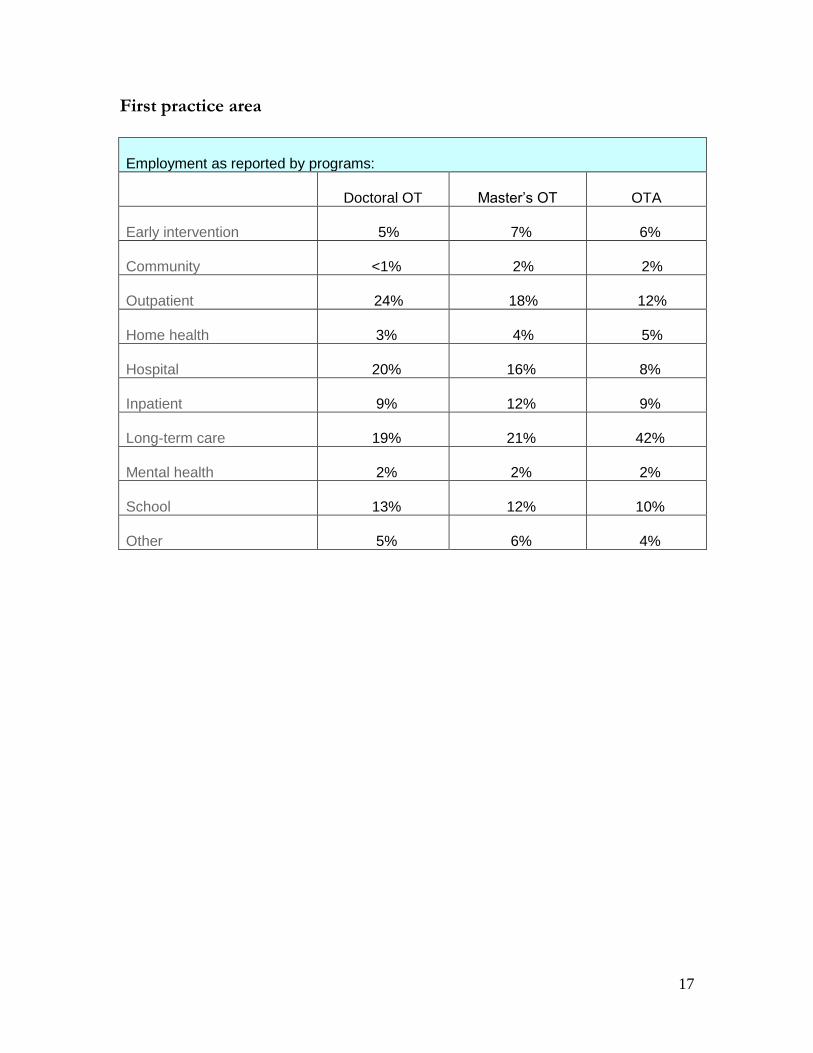
First practice area
Employment as reported by programs:
Doctoral OT
Master’s OT
OTA
Early intervention 5% 7% 6%
Community <1% 2% 2%
Outpatient 24% 18% 12%
Home health 3% 4% 5%
Hospital 20% 16% 8%
Inpatient 9% 12% 9%
Long-term care 19% 21% 42%
Mental health 2% 2% 2%
School 13% 12% 10%
Other 5% 6% 4%