Academic Program Review - Inside Higher Ed · Academic Program Review Touching the Third Rail of...
47
. Academic Program Review Touching the Third Rail of Higher Education Finance Rick Staisloff, Principal October 17, 2012
Transcript of Academic Program Review - Inside Higher Ed · Academic Program Review Touching the Third Rail of...

.
Academic Program Review
Touching the Third Rail of Higher Education Finance
Rick Staisloff, Principal
October 17, 2012

rpkGROUP. All rights reserved.
Webinar Objectives
Use strategic cost and demand analysis for improved academic program decision making Learn how to implement program review best
practice Create a change agenda that supports strategic
reallocation
rpkGROUP. All rights reserved.
Managing the New Normal
Mission
Market Margin
3

rpkGROUP. All rights reserved.
Mission, Market and Margin
Living at the Intersection of Mission, Market and Margin:
Three Questions
What are we good at? (Mission)
What do people want? (Market)
How do we bring these together in a way that is true to our mission and generates resources? (Margin)

rpkGROUP. All rights reserved.
How should we respond to the external and internal environment?
1. Know where your economic engines are
2. Focus on mission/market/margin opportunities
3. Have the courage to reallocate

rpkGROUP. All rights reserved.
Academic Portfolio Analysis
For successful academic portfolio analysis, institutions must be clear about the rules of the game– How assessment will occur– How the data and analysis will be used
Data can only be used effectively when seen in comparison to an appropriate benchmark group

rpkGROUP. All rights reserved.
Academic Portfolio Analysis - Tools
Net Revenue
Cost Structures
Student Demand and Yield
Scorecards
Business Plan Pro Formas

rpkGROUP. All rights reserved.
Getting to Net Revenue
An understanding of net revenue is an essential component of determining return on investment
Represents a key cultural shift in the move from “spending” to “investing”
Calculating net revenue requires:– Right General Ledger Structure
– Cost Center Based Budgeting

rpkGROUP. All rights reserved.
Net Revenue – Sample AnalysisNet Revenue Modeling - By Division
UndergraduatePT
Undergraduate Accelerated Graduate Institutes Total
Revenue 15,686,486 2,481,446 3,999,994 10,266,637 464,207 32,898,770
Tuition Discounting 5,656,577 40,026 0 876,158 0 6,572,761
Discounted Revenue 10,029,909 2,441,420 3,999,994 9,390,479 464,207 26,326,009
Total Discount % 36.06% 1.61% 0.00% 8.53% 0.00% 19.98%
UndergraduatePT
Undergraduate Accelerated Graduate Institutes Total
Discounted Revenue 10,029,909 2,441,420 3,999,994 9,390,479 464,207 26,326,009
Direct Costs 8,284,316 1,277,669 1,554,435 2,874,851 347,933 14,339,204
Net Revenue 1,745,593 1,163,751 2,445,559 6,515,628 116,274 11,986,805
Net Revenue % 17% 48% 61% 69% 25% 46%
UndergraduatePT
Undergraduate Accelerated Graduate Institutes Total
Discounted Revenue 10,029,909 2,441,420 3,999,994 9,390,479 464,207 26,326,009
Total Direct and Allocated Cost 9,954,583 2,366,828 3,149,668 7,858,580 347,933 23,677,592Net Revenue 75,326 74,592 850,326 1,531,899 116,274 2,648,417
Net Revenue % - FY 2010 0.8% 3.1% 21.3% 16.3% 10.1%
Net Revenue % - FY 2009 2.1% 18.8% 28.8% 25.0% 16.5%
Net Revenue % - FY 2008 5.5% 23.0% 20.0% 25.0% 16.0%

rpkGROUP. All rights reserved.
Net Revenue – Sample AnalysisNet Revenue Modeling - By Division
Undergraduate
Revenue 15,686,486
Tuition Discounting 5,656,577
Discounted Revenue 10,029,909
Total Discount % 36.06%
Undergraduate
Discounted Revenue 10,029,909
Direct Costs 8,284,316
Net Revenue 1,745,593
Net Revenue % 17%
Undergraduate
Discounted Revenue 10,029,909
Total Direct and Allocated Cost 9,954,583
Net Revenue 75,326
Net Revenue % - FY 2010 0.8%
Net Revenue % - FY 2009 2.1%
Net Revenue % - FY 2008 5.5%
The undergraduate program appears profitable when measuring gross revenue
But is barely breaking even when measuring net revenue

rpkGROUP. All rights reserved.
Net Revenue – Pitfalls to Avoid
Remember that you are creating a model, and that no model is perfect Failed attempts at calculating net revenue typically
result from over complication of allocation formulas –keep it simple

rpkGROUP. All rights reserved.
Getting to Net Revenue
Cross Subsidies: – Almost all institutions have subsidized academic
programs – Cross subsidies are not bad, however institutions need
to be more transparent about where they occur– When determining the appropriateness of a subsidy,
institutions should consider: Program’s relation to mission How long the subsidy should occur Amount of the subsidy

rpkGROUP. All rights reserved.
Understanding Academic Cost Structures
1. Question - Are departmental costs higher or lower than the benchmark group?Metric - Cost per unit - Student Credit Hour and Full-time equivalent
2. Question – Is the department more or less efficient?Metric - Throughput – Student credit hours generated by each faculty member

rpkGROUP. All rights reserved.
Sample Metric - Direct Instructional Expenditure per FTE Student
NationalNorm
+$12,000
+$10,000
+ $8,000
+$6,000
+$4,000
+$2,000
-$2,000
-$4,000
-$6,000
-$8,000
-$10,000
-$12,000
Bio
Bus
EDU
Nursing
Psych
CommChem
English
Music
History
ForeignLang
RelStudy
Philos
Computer
HealthPhy Ed
More efficient than market standardMore efficient than market standard
Less efficient than market standardLess efficient than market standard
Math
Source: CND Delaware Instructional Cost Study14 Source: Delaware Instructional Cost StudyUsed by permission rpk GROUP

rpkGROUP. All rights reserved.
Sample Metric - Direct Instructional Expenditure per FTE Student
NationalNorm
+$12,000
+$10,000
+ $8,000
+$6,000
+$4,000
+$2,000
-$2,000
-$4,000
-$6,000
-$8,000
-$10,000
-$12,000
Bio
Bus
EDU
Nursing
Psych
CommChem
English
Music
History
ForeignLang
RelStudy
Philos
Computer
HealthPhy Ed
More efficient than market standardMore efficient than market standard
Less efficient than market standardLess efficient than market standard
Math
Source: CND Delaware Instructional Cost Study15 Source: Delaware Instructional Cost StudyUsed by permission rpk GROUP
Departments are compared to similar departments nationally, not to each other

rpkGROUP. All rights reserved.
Sample Metric - Direct Instructional Expenditure per FTE Student
NationalNorm
+$12,000
+$10,000
+ $8,000
+$6,000
+$4,000
+$2,000
-$2,000
-$4,000
-$6,000
-$8,000
-$10,000
-$12,000
Bio
Bus
EDU
Nursing
Psych
CommChem
English
Music
History
ForeignLang
RelStudy
Philos
Computer
HealthPhy Ed
More efficient than market standardMore efficient than market standard
Less efficient than market standardLess efficient than market standard
Math
Source: CND Delaware Instructional Cost Study16Source: Delaware Instructional Cost Study
Used by permission rpk GROUP
The distance from the normed line determines whether departments are more or less expensive

rpkGROUP. All rights reserved.
Sample Metric - Direct Instructional Expenditure per FTE Student
NationalNorm
+$12,000
+$10,000
+ $8,000
+$6,000
+$4,000
+$2,000
-$2,000
-$4,000
-$6,000
-$8,000
-$10,000
-$12,000
Bio
Bus
EDU
Nursing
Psych
CommChem
English
Music
History
ForeignLang
RelStudy
Philos
Computer
HealthPhy Ed
More efficient than market standardMore efficient than market standard
Less efficient than market standardLess efficient than market standard
Math
Source: CND Delaware Instructional Cost Study17Source: Delaware Instructional Cost Study
Used by permission rpk GROUP
English is less cost effective
Nursing is more cost effective

rpkGROUP. All rights reserved.
Cost Effectiveness
Once they determine the relative cost effectiveness, institutions can identify departments for additional focus and drill down to determine why cost structures vary. Key areas of focus for the drill down include:
– Labor Costs as a % of Total Department Costs– Mix of Full-time and Part-time faculty– Mix of faculty rank– Average SCH taught by FTE faculty (throughput)– Average class size

rpkGROUP. All rights reserved.
Sample Metric - Student Credit Hours per FTE Faculty
NationalNorm
+ 45
+30
+15
-20
-50
-80
-110
-140
-170
Bio
Bus
Edu
Nursing
Psych
Comm
Chem English
Music
Comp Sci
History
ForeignLang
Math RelStudy
Philos
Arts
HealthPhy Ed
Source: Delaware Instructional Cost Study19
More efficient than market standardMore efficient than market standard
Less efficient than market standardLess efficient than market standard
Used by permission rpk GROUP

rpkGROUP. All rights reserved.
Student Credit Hours per FTE Faculty
NationalNorm
+ 45
+30
+15
-20
-50
-80
-110
-140
-170
Bio
Bus
Edu
Nursing
Psych
Comm
Chem English
Music
Comp Sci
History
ForeignLang
Math RelStudy
Philos
Arts
HealthPhy Ed
Source: Delaware Instructional Cost Study20
More efficient than market standardMore efficient than market standard
Less efficient than market standardLess efficient than market standard
Used by permission rpk GROUP
Departments are compared to similar departments nationally, not to each other

rpkGROUP. All rights reserved.
Student Credit Hours per FTE Faculty
NationalNorm
+ 45
+30
+15
-20
-50
-80
-110
-140
-170
Bio
Bus
Edu
Nursing
Psych
Comm
Chem English
Music
Comp Sci
History
ForeignLang
Math RelStudy
Philos
Arts
HealthPhy Ed
Source: Delaware Instructional Cost Study21
More efficient than market standardMore efficient than market standard
Less efficient than market standardLess efficient than market standard
Used by permission rpk GROUP
Nursing and Education generate more SCH per FTE Faculty

rpkGROUP. All rights reserved.
Tapping Into Student Demand
Which programs house most of the institution’s students?
How well am I responding to market demand?– Current academic portfolio– Untapped opportunities
What is my student yield, particularly within high demand programs?

rpkGROUP. All rights reserved.
0
500
1000
1500
2000
2500
3000
3500
4000
4500
Computer Information Systems 145English 148Graphic Design 149Safety Management 162Marketing 182Social Work 184Elem Ed Early Childhood (B-3) 211Accountancy 236Physical Education 286Psychology 295Management 296Elementary Education (1-6) 342Biology 375Nursing 622Criminal Justice 662
UG
Stu
dent
s in
Maj
ors
Undergraduate Students by Major - Fall 2011

rpkGROUP. All rights reserved.
What Drives Student Activity?
NursingBiology
Religious Studies
Pharmacy
Education Business
Communication Arts
English
Modern Foreign Language
Philosophy
Psychology
Math
1,903
904
786
813
1,2271,330
873
6,991
861
799
798
667
4%
35%
4%
4%
4%
3%
9%
4%
4%
7% 6%
4%
CHMHIS CST
ARTPHYMUS POL HSV
PED
24

rpkGROUP. All rights reserved.
What Drives Activity?
NursingBiology
Religious Studies
Pharmacy
Education Business
Communication Arts
English
Modern Foreign Language
Philosophy
Psychology
Math
1,903
904
786
813
1,2271,330
873
6,991
861
799
798
667
4%
35%
4%
4%
4%
3%
9%
4%
4%
7% 6%
4%
CHMHIS CST
ARTPHYMUS POL HSV
PED
25
Total Credit Hrs by Department

rpkGROUP. All rights reserved.
What Drives Activity?
NursingBiology
Religious Studies
Pharmacy
Education Business
Communication Arts
English
Modern Foreign Language
Philosophy
Psychology
Math
1,903
904
786
813
1,2271,330
873
6,991
861
799
798
667
4%
35%
4%
4%
4%
3%
9%
4%
4%
7% 6%
4%
CHMHIS CST
ARTPHYMUS POL HSV
PED
26
% of Total Credit Hrs Generated –By Department

rpkGROUP. All rights reserved.
What Drives Activity?
NursingBiology
Religious Studies
Pharmacy
Education Business
Communication Arts
English
Modern Foreign Language
Philosophy
Psychology
Math
1,903
904
786
813
1,2271,330
873
6,991
861
799
798
667
4%
35%
4%
4%
4%
3%
9%
4%
4%
7% 6%
4%
CHMHIS CST
ARTPHYMUS POL HSV
PED
Anchor4 Programs = 57%
Core8 Programs = 32%
Other9 Programs = 11%Each 2% or <
27

rpkGROUP. All rights reserved.
Top 12 programs account for89% of credit hours
What Drives Activity?
NursingBiology
Religious Studies
Pharmacy
Education Business
Communication Arts
English
Modern Foreign Language
Philosophy
Psychology
Math
1,903
904
786
813
1,2271,330
873
6,991
861
799
798
667
4%
35%
4%
4%
4%
3%
9%
4%
4%
7% 6%
4%
CHMHIS CST
ARTPHYMUS POL HSV
PED
Anchor4 Programs = 57%
Core8 Programs = 32%
Other9 Programs = 11%Each 2% or <
28
rpkGROUP. All rights reserved.
Demand in the Market
In order to drive revenue from tuition and fees (and indirectly from auxiliaries), we must understand student demand in the market. The following analysis assesses the highest level of
student interest – at the time of inquiry.

rpkGROUP. All rights reserved.
90% of prospects originate from the top 12 majors
10,681
6,374
5,895
5,377
4,476
4,316
4,093
3,627
2,786
2,267
1,805
1,217
0 2000 4000 6000 8000 10000 12000
Bio
Bus
Chem
Nurs
Psy
Educ
Pl.Sc
Com
Art
Crim
Engl
Engin
30
Total prospects by major
Median 1,169
30
Demand – What Do People Want?

rpkGROUP. All rights reserved.
Demand in the Market
Student demand can also be measured at the point of application, acceptance and attendance. By tracking student demand, we can determine how
well we are capturing the market that is already aware of the University, and the programs and majors that are attracting student attention.

rpkGROUP. All rights reserved.
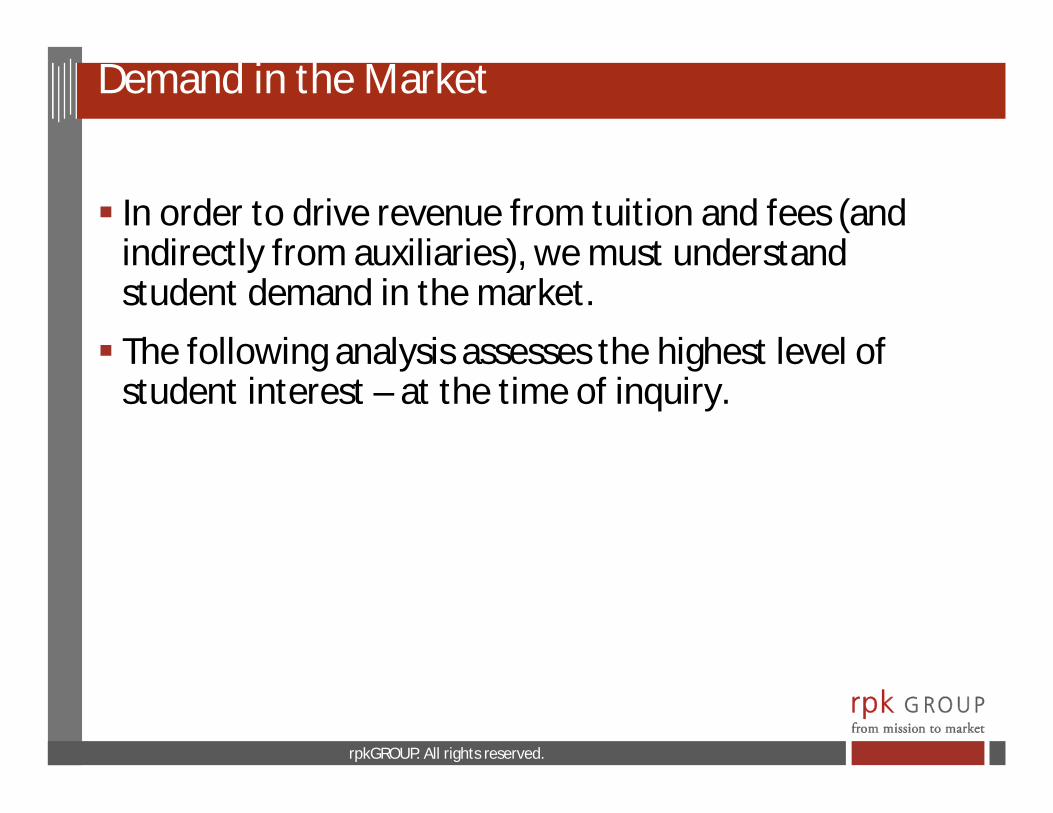
Student Yield
Student yield indicates what percentage of interested students actually end up attending the University. As with demand, yield can be measured at various
milestones in the enrollment process – inquiry, application, acceptance and attendance
rpkGROUP. All rights reserved.
Yield – Percentage of Accepted Students Who Attend
33
Median33%

rpkGROUP. All rights reserved.
# of Prospects vs. Yield (accepted to enrolled)High # Prospects/Low Yield High # Prospects/High Yield
Low # Prospects/Low Yield Low # Prospects/High Yield
Median Yield33%
Median #Prospects
1,169
Bio
High10,681
Low162
Bus
EDU
NursingPsych
Pol SciComm Art
Chem
CriminEnglish
Engin
Comp SciInternat
History
High55%
Mod ForLang
Math
RadiolPhysics
RelStudyPhilos
Econ
Elevate Yield
Maximize
34
Low0%

rpkGROUP. All rights reserved.
# of Prospects vs. Yield (accepted to enrolled)High # Prospects/Low Yield High # Prospects/High Yield
Low # Prospects/Low Yield Low # Prospects/High Yield
Median Yield33%
Median #Prospects
1,169
Bio
High10,681
Bus
EDU
NursingPsych
Pol SciComm Art
Chem
CriminEnglish
Engin
Comp SciInternat
High55%
Mod ForLang
Math
RadiolPhysics
RelStudyPhilos
Econ
Elevate Yield
Maximize
35
Low0%
Ideally, Universities will maximize the number of high demand and high yield programs

rpkGROUP. All rights reserved.
Using Scorecards in Academic Portfolio Analysis
A review of an academic program involves multiple variables, both qualitative and quantitative

rpkGROUP. All rights reserved.
Using Scorecards in Academic Portfolio Analysis
Scorecard variables could include data such as:– Relation to mission– Market Demand– Student Yield– Retention and Graduation Rates– SCH Generation– Efficiency– Net Revenue

rpkGROUP. All rights reserved.
38
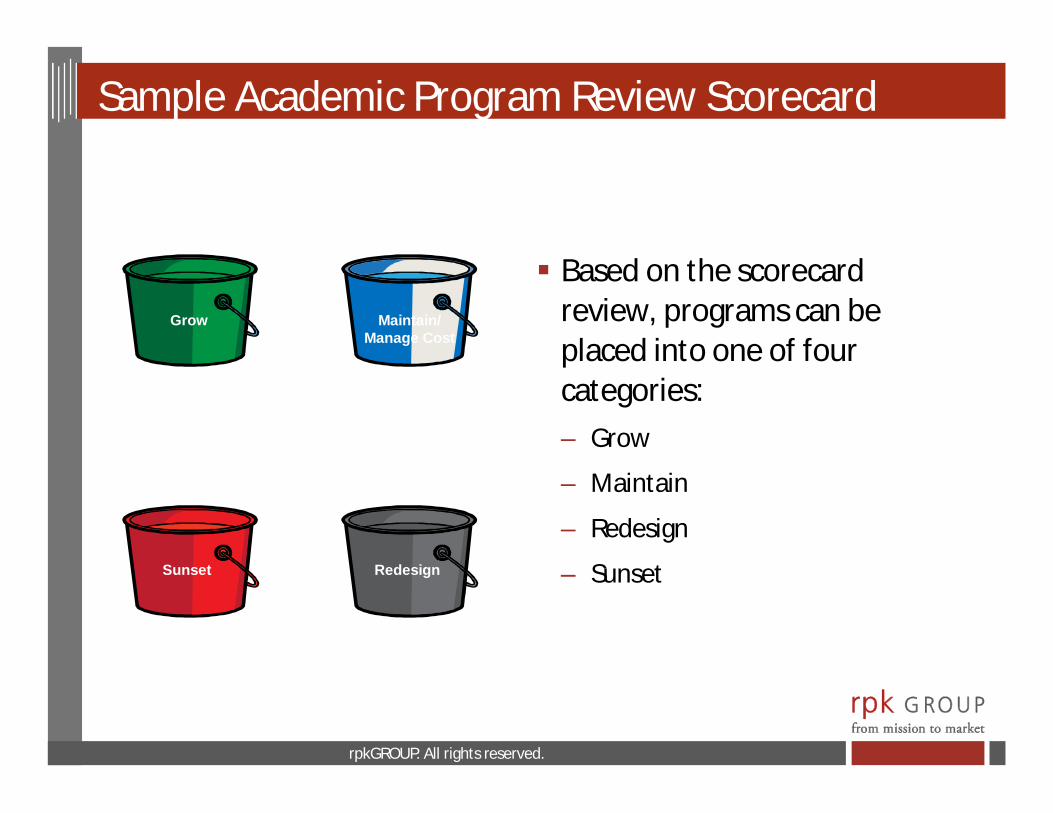
Sample Academic Program Review Scorecard
rpkGROUP. All rights reserved.
Based on the scorecard review, programs can be placed into one of four categories:– Grow
– Maintain
– Redesign
– Sunset
Grow
We willevaluate, dialogue
then organize decisions intofour buckets
Sunset Redesign
Maintain/Manage Cost
Sample Academic Program Review Scorecard

rpkGROUP. All rights reserved.
Untapped Market Opportunities
In addition to increasing yield in high demand programs, institutions must also examine new market opportunities.
Assessing the market
– Current employers
– Governmental sources
Areas of workforce shortage
Economic development agencies
It is usually easier to begin by building on existing areas of strength
Key question: Who owns business development at your institution?

rpkGROUP. All rights reserved.
Business Plan Pro Formas
A more detailed analysis of proposed or existing academic programs can be provided through the use of pro formas Pro Formas project revenue and expense activity in
order to determine start-up costs and return on investment Pro Formas also serve as an important accountability
tool

rpkGROUP. All rights reserved.
Business Plan Pro Formas
• Before financial analysis begins, programs should undergo the a review based upon:
– Relation to mission– Market analysis– Competition
– This analysis should be test externally through peer review and dialog with local employers

rpkGROUP. All rights reserved.
Business Plan – What To Include
A pro forma analysis should include the following:– At least two years of actual and three years of projected data– Enrollment– Revenue– Expense– Analysis of program start-up costs and break even requirement

rpkGROUP. All rights reserved.
Business Pro Formas – What’s In It For Me?
Pro Forma analysis benefits academic departments
– Sets an expectation for analysis. Departments must do their homework before proposing investments.
– Creates milestones throughout the process. Departments need only complete one step at a time. For example, if relation to mission, market demand and competition are not positive, there is no need to move forward with revenue and expense projections.
– Once the review is completed, the pro forma should flow easily into the budget process. In this way, resources are identified up front to support the program.
– Pro forma analysis builds accountability by projecting enrollment, setting resource requirements and the expected return on investment.
rpkGROUP. All rights reserved.
Successful Academic Portfolio Review
Communicates the rules of the game up front Is based on data Benchmarks departments/programs Includes a mix of qualitative and quantitative factors

rpkGROUP. All rights reserved.
A Strategic Finance Agenda
Assess Data
Develop Metrics
Drive Revenue
Reduce Admin and Operating Costs Streamline Academic
Program
Create Reinvestment/Innovation
Pools
Document and Communicate

rpkGROUP. All rights reserved.
To continue the dialogue . . .
Rick Staisloff, PrincipalrpkGROUP
410-591-9018
47