Academia Brasileira De Ciencias - abc.org.br · Academia Brasileira De Ciencias Enhancing Water...
50
Academia Brasileira De Ciencias Enhancing Water Management Capacity in a Changing World. Sao Paulo June 25-28 Lake Chivero: Case study of urban water supply . Issues and possibilities C.H.D. Magadza University of Zimbabwe [email protected]
Transcript of Academia Brasileira De Ciencias - abc.org.br · Academia Brasileira De Ciencias Enhancing Water...

Academia Brasileira De Ciencias
Enhancing Water Management Capacity in a Changing World.
Sao Paulo June 25-28
Lake Chivero: Case study of urban water supply.
Issues and possibilities
C.H.D. Magadza University of Zimbabwe

In a nutshell
• The Harare Municipality supplies water to close to 7 million people, i.e close to 50% of current Zimbabwe population.
• The Waterworks can only supply 60% of demand.
• 20% of produced water is lost through leakages
• 40% of consumption is paid for; i.e. 32% of production
• Lake Chivero, supplemented from Lake
Manyame, is principal source of water.

Google earth view of L. Chivero watershed with overlays
Cleveland Dam
Seke Dam
Manyame R
Mukuvisi R
Marimba R
L. Chivero
Chitungwiza City
Seke Communal
lands
Epworth informal settlement
H A R A R E C I T Y
Harahwa Dam
Dziwaresekwe T/ship

Table 1.Hydrological and morphometric features of Lake
Chivero
Full supply volume 250 x 106m3
Full supply surface area 26.30 km2
Catchment area 2227 km2
Shoreline length 74 km
Maximum depth 27.43 m
Mean depth 9.4 m
Maximum breadth 8.0 km
Mean breadth 1.68 km
Length 15.7 km
Catchment : lake area ratio 8.9
Shoreline development 4.1
Year construction 1952

Paintings by the Xan people


Hydrology

Runoff, Manyame River Half Normal Probability Plot of RUNOFF (MANYAME.STA 10v*64c)
y=0.362+2.144e-6*x+eps
Observed Value
Exp
ect
ed N
orm
al V
alu
e
-0.2
0.4
1.0
1.6
2.2
2.8
-1e5 1e5 3e5 5e5 7e5 9e5 1.1e6

-2.5
-2.0
-1.5
-1.0
-0.5
0.0
0.5
1.0
1.5
2.0
2.5
1970
1975
1980
1985
1990
1995
2000
2005
2010
Sta
nd
ard
devia
tio
ns
Year
Fig 4. Standardised annual runoff; Manyame River, with six yr moving average

0.00
0.50
1.00
1.50
2.00
2.50
3.00
3.50
4.00
1950 1960 1970 1980 1990 2000 2010
Flu
sh
ing
tim
es
Season
Fig 5. Flush rate per anumFlush
Mean Pre 1980 runoff
Mean Post 1980 runoff

Comparative run-off flow and wastewater flow into L. Chivero
0.00
0.10
0.20
0.30
0.40
0.50
0.60
0.70
0.80
0.90
1.00
1965 1970 1975 1980 1985 1990 1995 2000 2005 2010
Pro
po
rtio
n
Year
Fig 6. Proportionate flows of sewage bearing streams and Manyame runoff
Manyame Sum of tributaries 6 per. Mov. Avg. (Manyame) 6 per. Mov. Avg. (Sum of tributaries)

y = 2E-33e0.0391x
R² = 0.5967
0
5
10
15
20
25
1950 1960 1970 1980 1990 2000 2010% s
ew
ag
e o
f L
ak
e v
olu
me
Year
Fig.7. % contribution of sewage to lake volume from Ferle & Croborough sewage works

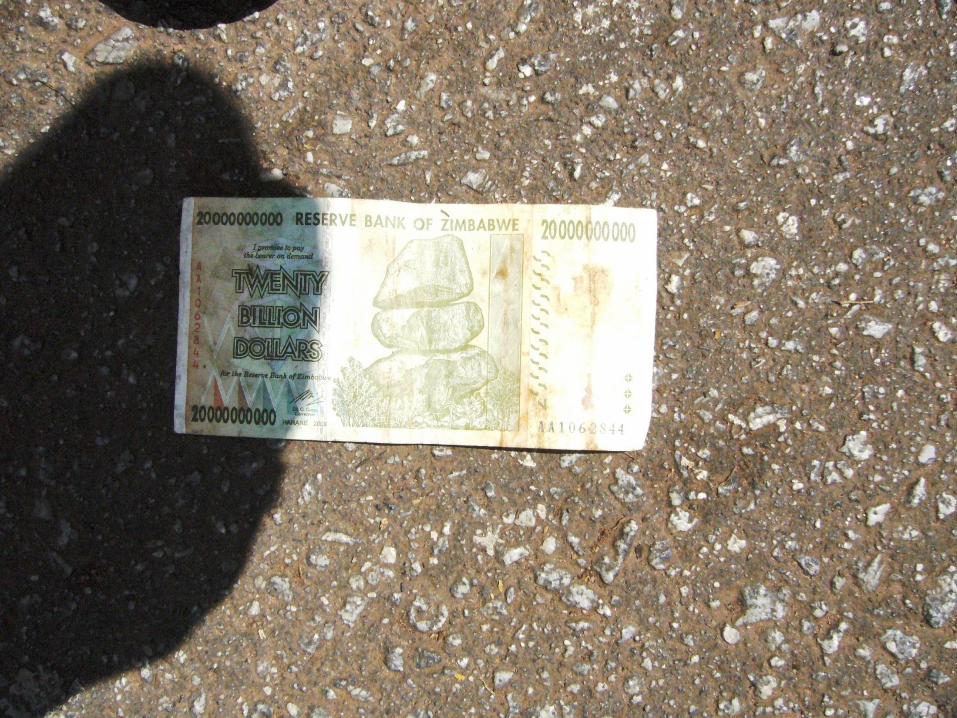
Reconstructed Harare population: doubling period ~12 years
y = 5E-60e0.0721x
R² = 0.932
0.0
1000.0
2000.0
3000.0
4000.0
5000.0
6000.0
7000.0
1920 1940 1960 1980 2000 2020
Popula
tion x
1000
Year

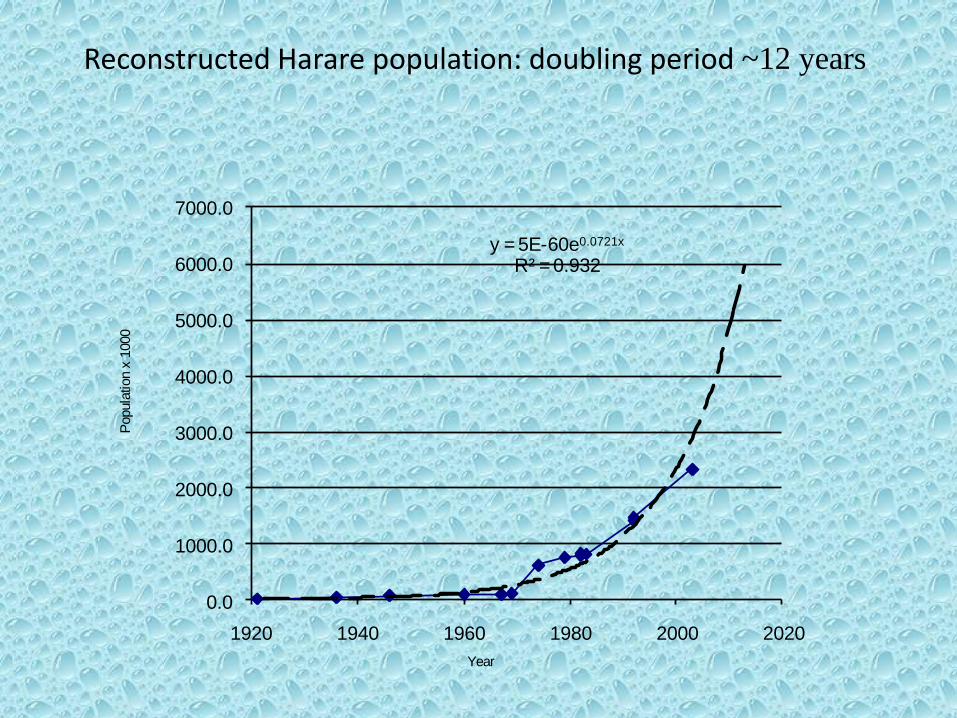
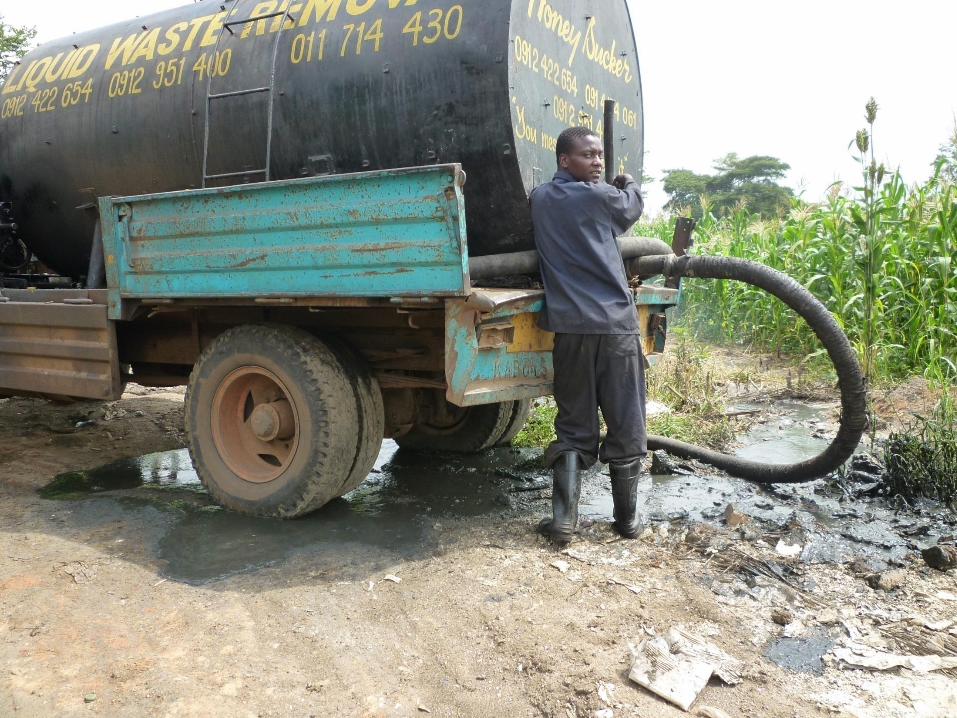
Diffuse source
Breached sewer effluent flowing along suburban road in a middle to high income area

Dog on uncollected refuse heap

The facilities

Ratio of wastewater carrying stream flows to Manyame River flow.
y = 8E-37e0.0417x
R2 = 0.2396
0.00
1.00
2.00
3.00
4.00
5.00
6.00
1970 1975 1980 1985 1990 1995 2000 2005 2010
Year
Rati
o (
Urb
an
str
eam
s/M
an
yam
e)

Untreated wastewater outflow from a sewage treatment plant, Harare

Table. 2. Waste water treatment capacity (MLd
) at some of the Manyame watershed sewage works
(excluding Chitungwiza, Ruwa and Norton)
Plant Trickle
filter
Year Activated
sludge
(BNR)
Year Ponds Year Total
capacity
Present flow
Ferle 36 1960 18 1982 144 250
18 1974
72 1998
Crowborough 36 1957 18 1982 54 120
Donnybrook 2.3 1953
-
1972
2.3 10
Marlborough 2 Post
1980
2 7
Chitunwiza 54
Total 202.3 387
Capacity deficit 441

Pressures on the Water supply Reservoirs

Table 4 Historical trend in P loading to Lake Chivero. (Magadza 2003,
Nyumbu 2012).
Variable 1967 1978 1996 2010
P concentration
(mg/l)
P load g (m2)
2.8
27.4
0.13
1.5
1.8 (Manyame)
14
2.77
27.8
P load (tonnes/pa) 685.0 39.6 350.0 697

Table 2. Phosphorus and Nitrogen export through surface runoff
from Harare suburbs. Dry season; after Mufaro 2002 Phosphorus Nitrogen
Ratio
P: N
Total export
Catchment/
Suburb Type
Tonne
km-2
Kg
Capita-1
Tonne
km-2
Kg
Capita-1
P-
tonne N- Tonne
Gwebi Low 0.02 0.04 0.16 0.42 5.81 0.99 9.31
Muwisindale Low 0.07 2.31 1.22 41.39 5.99 5.24 93.96
Kuwadzana Medium 0.08 0.17 0.47 0.96 3.89 2.88 16.75
Mukuvisi
High/
Industria
l 10.28 1.00 39.98 3.89 3.61 98.99 385.04
Marimba
High/
Industria
l 0.13 0.77 0.86 4.98 3.68 9.28 60.31
Budiriro High 2.30 0.23 13.77 1.35 9.42 22.08 132.17
Epworth High 3.38 1.11 12.20 4.00 17.95 103.12 371.88
Glenview High 0.30 0.39 1.09 1.44 6.50 30.23 111.39
Total or mean 1.62 0.56 7.53 6.38 5.69 272.81 1180.81
P loading gm-2 7.6 gm-2

Conditions in Lake Chivero

y = 0.0728e0.1865x
R² = 0.7862
0
1
2
3
4
5
61
98
8
19
89
19
90
19
91
19
92
19
93
19
94
19
95
19
96
19
97
19
98
19
99
20
00
20
01
20
02
20
03
20
04
20
05
20
06
20
07
20
08
20
09
20
10
mg
/l
Year
Fig 7. Annual mean phosphate: 2010 data after Nyumbu (2012), 1988 - 1994 Harare Minucipality, other data by author.
Mean annual
Expon. (Mean annual)

Lake Chivero from Dam wall
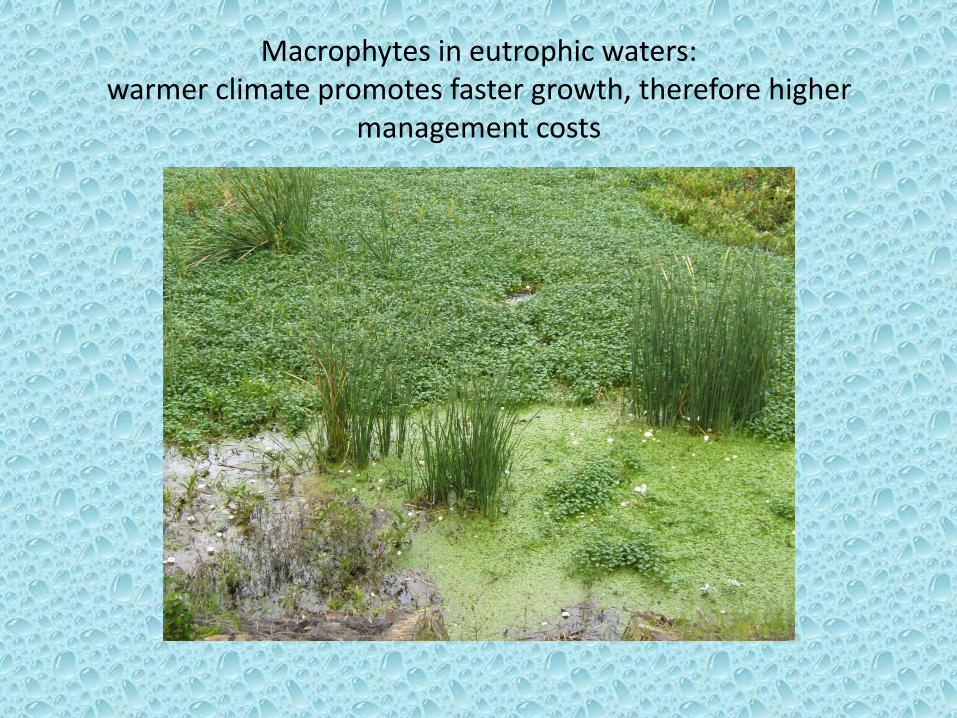
Macrophytes in eutrophic waters: warmer climate promotes faster growth, therefore higher
management costs

Algal scum, Chivero (Photo C.H.D. Magadza)

Methane bubbles from the sediments: L. Chivero

Health issues

Enteric diseases deaths
Fig 7. Enteritis deaths per thosant infectd
y = 9.2206x - 1.3779
R2 = 0.6121
0.00
20.00
40.00
60.00
80.00
100.00
120.00
1991 1992 1993 1994 1995 1996 1997 1998 1999 2000 2001
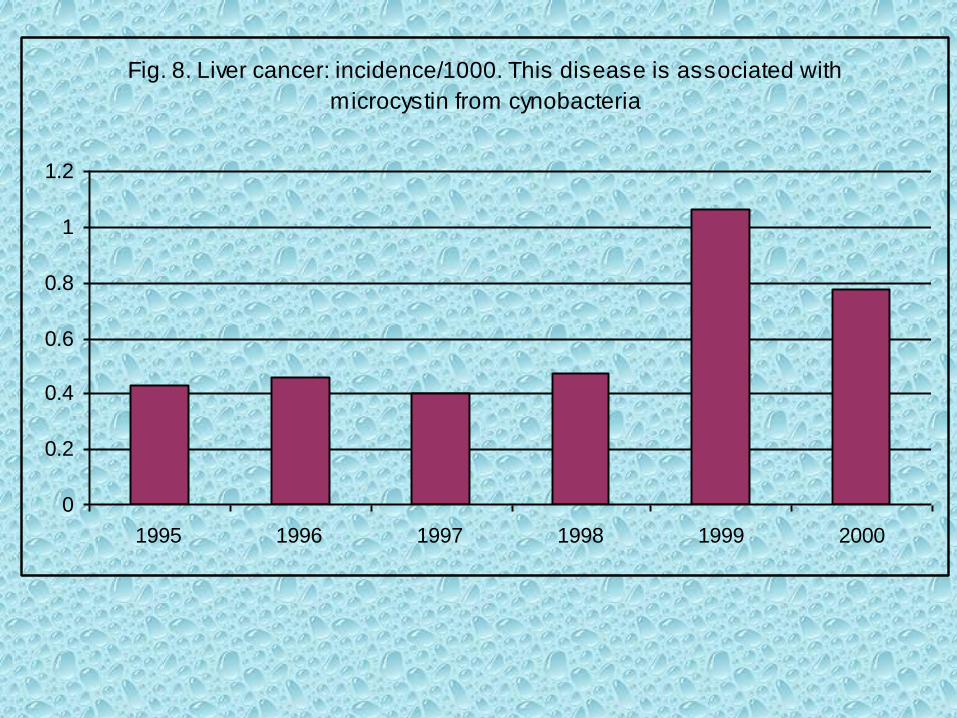
Fig. 8. Liver cancer: incidence/1000. This disease is associated with
microcystin from cynobacteria
0
0.2
0.4
0.6
0.8
1
1.2
1995 1996 1997 1998 1999 2000

Unexplored health hazards
• Health hazards associated with chlorinating water with high dissolved organic content
• Heavy metals
• Other industrial pollutants.
• Parasites

Remedies??

Technology solution
• The 1970 innovative use of BNR technology proved that it was a feasible method of eutrophication control
• The infrastructure and technical know-how is still available
• It however needs extensive investment to rehabilitate increase its capacity
• Plans for expansion of these sewage works have been completed

Secchi disc chneges following restoration measures (data from Thornton 1982, Ndebele and Magadza 2006, Magadza
unpublished. The 2003 data refer to wet period.)
0
0.2
0.4
0.6
0.8
1
1.2
1.4
1.6
1.8
2
1957-58 1970-1971 1974 -1975 1976 - 1977 1977-1978 1979-1980 2003 2006
Period
Se
cc
hi
de
pth
( c
m).
BNR Commisioning
Recovery period Deterioration

Google earth view: Ferle BNR sewage works. Green colour of reactors and
clarifiers indicate dysfunctional state.

Ecological approach
Diffuse source pollution control.

Cleveland dam: 1913

Acidic waste
Increasing diffuse source
Past sewage works

Wetlands distribution in Lake Chivero watershed: total estimated area = 40 000 ha (After Nyumbu 2012)

Time projections of lake response to three waste-water management scenarios: Top:
Business as usual. Middle: BNR technology; Bottom BNR +wetlands.
Adapted from (Nyumbu 2012

Historical, current and projected phosphorus loading on Lake Chivero
Parameter 1967 1978 1996 2010 2020
(Projections)
P
concentration
(mg/l)
P load gm-2
2.8
27.4
0.13
1.5
1.8
14
2.77
22.56
0.22
1.36
P load
(tonnes/pa)
685.0 39.6 350.0 564 34.1

CONCLUSION
Harare water supply issues 1. Declining runoff
2. Growing urban population: communal lands issues
3. Wastewater returns to supply reservoirs
4. Large diffuse source pollution component
5. Insufficient wastewater treatment capacity
6. An economic meltdown leading to dysfunctional wastewater treatment facilities
Results: 1. Hypereutrophication
2. High costs of potable water production
3. Inability to meet water demand
Consequences
1. Disease outbreaks
2. Water shortage in cities
Restoration strategy 1. The ILEC Integrated Lake Basin Management strategy.

The ILBM platform
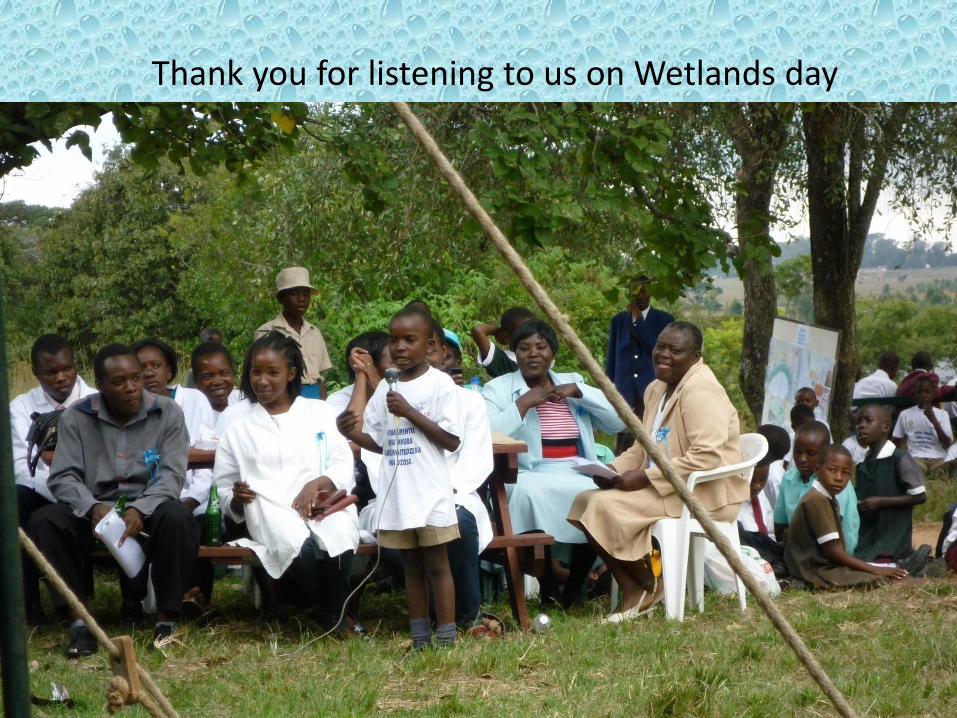
Thank you for listening to us on Wetlands day