OMZP-2youryousyo325mm o o 25 mm 25 mm o o 251ñm 25mm 2 5mm 25mm 25mm o o o o
Upload
doankhuongCategory
view
216download
1
North America Equity Research 09 March 2011
Acacia Research Corp. Initiation
Overweight ACTG, ACTG US
Out Innovating: Initiating With an Overweight
Price: $33.18
Price Target: $39.00
Applied & Emerging Technologies
Paul Coster, CFAAC
(1-212) 622-6425 [email protected]
Marija Krgovic (1-212) 622-5552 [email protected]
Mark Strouse, CFA (1-212) 622-8244 [email protected]
J.P. Morgan Securities LLC
5
15
25
35
$
Mar-10 Jun-10 Sep-10 Dec-10 Mar-11
Price Performance
YTD 1m 3m 12mAbs 37.5% 36.4% 21.6% 223.0%
Acacia Research Corp. (ACTG;ACTG US) 2010A 2011E 2012EEPS - Recurring ($) Q1 (Mar) 0.61 0.24 0.34 Q2 (Jun) (0.06) 0.61 0.76 Q3 (Sep) 0.75 0.30 0.38 Q4 (Dec) (0.11) 0.70 0.79 FY 1.18 1.84 2.27Revenues FY ($ mn) 132 170 206Bloomberg EPS FY ($) 1.46 2.00 2.41EBITDA FY ($ mn) 53 72 90EPS Reported FY ($) 0.98 1.65 2.07Source: Company data, Bloomberg, J.P. Morgan estimates.
Company DataPrice ($) 33.18Date Of Price 04 Mar 1152-week Range ($) 36.44 - 9.61Mkt Cap ($ mn) 1,124.13Fiscal Year End DecShares O/S (mn) 34Price Target ($) 39.00Price Target End Date 31 Dec 11
See page 41 for analyst certification and important disclosures. J.P. Morgan does and seeks to do business with companies covered in its research reports. As a result, investors should be aware that the firm may have a conflict of interest that could affect the objectivity of this report. Investors should consider this report as only a single factor in making their investment decision.
We are initiating coverage of Acacia Research Corp, a leading Intellectual Property (IP) licensing company, with an Overweight Rating and a Price Target of $39.00. Partnering with major technology companies, ACTG is aggregating key patent portfolios relevant to the technology and healthcare industries, yielding high-margin licensing growth. We think the IP asset class and IP licensing are important growth themes for investors, and ACTG is a first-mover, pure-play way to gain exposure to this opportunity.
• Patents, as an asset class, and licensing, as a business model, present attractive long-term investment opportunities. IP stands at the center of innovation and value-creation in the technology industry, globally. Licensing in the US has grown to a ~ $500 billion industry over the last 30 years. IP-intensive technology companies command high valuation multiples, and significant market capitalization.
• ACTG is first mover and one of the most active patent dealers, with over $420 million of licensing revenue to-date, derived from over 170 IP portfolios and control of tens of thousands of patents. Nearly 1,000 licensing agreements have been signed, recently including comprehensive agreements with large corporations.
• Acacia benefits from two trends: (1) large companies use Acacia to monetize their IP portfolios, and (2) Acacia offers large companies comprehensive protection from IP claims in key technology domains.
• The business model is attractive, yielding 50%+ gross and 30%+ operating margin, but should improve further with scale as portfolios acquired in the last 2 years are monetized, in our view. Scale and diversification should yield better visibility in time.
• We are initiating at Overweight and a Price Target of $39.00, based on 13.4 times CY12 EV/EBITDA, based on a blended group of trading comparables. At a current CY12 EV/EBITDA of 12.2 times, we think ACTG is undervalued. ACTG is suited to long-term growth-oriented tech investors, focused on y/y growth; quarterly results could be volatile.

2
North America Equity Research 09 March 2011
Paul Coster, CFA (1-212) 622-6425 [email protected]
Table of Contents Investment Thesis ....................................................................3 Risks to Our Rating and Price Target .....................................4 Company Description ..............................................................6 Financial Outlook .....................................................................6 Revenue and Margin Outlook ......................................................................................7 Summary Earnings Outlook.........................................................................................9 Balance Sheet and Cash Flow....................................................................................10 Valuation .................................................................................11 Out Innovating ........................................................................14 Patents are Temporary Monopolies ...........................................................................16 IP is the source of sustainable competitive advantage ...............................................17 IP is a strategic asset, licensing is an attractive business ...........................................20 Patent dealers and NPEs are IP-business pure-plays .................................................20 Patent aggregators create market efficiencies ............................................................24 Acacia, a patent aggregator, has first-mover advantage.............................................26 Company Overview ................................................................27 Business Model..........................................................................................................27 Management...............................................................................................................30 Competition ............................................................................31 RPX Corporation .......................................................................................................31 Intellectual Ventures ..................................................................................................33

3
North America Equity Research 09 March 2011
Paul Coster, CFA (1-212) 622-6425 [email protected]
Investment Thesis We believe patents, as an asset class, and licensing, as a business model, present attractive long-term investment opportunities. We note strong 19% outperformance over the last five years for a select group of IP-centric stocks, relative to the S&P 500, 60% over the last four years, and 36% outperformance over the past year alone (see Figure 2 on page 14). Companies that generate recurring revenues from royalty payments, such as Dolby, Rovi, and Qualcomm, can command high margins and often high valuation multiples. There are vast licensing opportunities in areas like smart phones (250,000 patents, according to RPX Corp), digital media, semiconductors, medical technology, ecommerce and other growth sectors.
Acacia is a leader in patent licensing. Acacia, with over $420 million of licensing and IP settlement revenue to-date, 170 IP portfolios, and control over tens of thousands of patents, is one of the largest most active patent dealers or non-practicing entities (NPEs) in the United States. PatentFreedom estimates that Acacia represented about 10% of all lawsuits by the larger NPEs in North America in the period 2005 through 2010. Acacia is aggregating patents in some of the most valuable technology areas, including location based services, computer power management, flash memory, telematics, digital media playback and enhancement, data storage. Owing to the scope of the firm’s patent portfolio, particularly the 40,000 patents accessible through the Renesas partnership (Hitachi-Mitsubishi-NEC JV), we believe Acacia is a company that most operating companies will choose (or have chosen - see Figure 11) to execute an agreement with an operating company.
Acacia is benefiting from two trends. First Acacia is becoming a go-to company for IP-rich operating companies that seek to monetize patent portfolios. Acacia can act as a proxy for the patent author and execute licensing agreements through subsidiaries, without fear of a counter-suit. Acacia is already doing this for Renesas and may be positioned to do so for Samsung too. Second, Acacia is beginning to enter into ‘comprehensive licensing agreements’ with large corporations that seek protection from patent claims in key technology domains so that they can proceed with unfettered execution of their product and service strategies. Acacia has already landed three such deals (comprehensive agreements are made with the parent company, Acacia Research, not subsidiaries) and expects to generate 12 such deals in the next couple of years.
Acacia’s model is already attractive, yielding ~50% gross and over 30% operating margin, but should improve further with scale and as the amount of enforcement that goes to litigation diminishes (corporations and their patent attorneys recognize Acacia's role in the market and often chose to default to licensing negotiations). We look for ACTG to grow at a revenue CAGR of about 23% of the next three years. Scale and diversification, both in terms of revenue-type (comprehensive deals .v. one-off enforcement activity) or technology domain (semiconductors .v. mobile phones) should yield improving visibility (portfolios acquisitions regularly yield meaningful revenue within 18-24 months) and mitigate some of uncertainties that relate to converting individual patents to revenues. Structured deals with large counterparties should yield forward visibility in terms of anticipated licensing renewals. The company hopes to secure about 12 such deals over the next three years, each yielding $20-$40 million of revenue for a 2-3 year term, each granting the licensee immunity to a portfolio of current and future patents in a specific domain.
Acacia Research Corp. (ACTG) Overweight
Licensing Examples:
V-Chip by TV manufacturers, $25mm
Video/Image enhancement, $70mm
Digital media transmission, 300 licensees
Sample Licensees:
AMD, Boston Scientific, Dell, Exxon, GE, HP, Hitachi, Sharp, Intel, Microsoft, Nokia, Philips, Samsung, Sony, Texas Instruments, Walt Disney, Xerox, 3M

4
North America Equity Research 09 March 2011
Paul Coster, CFA (1-212) 622-6425 [email protected]
Acacia's licenses its partners’ technology patents to large-scale operating companies, sharing revenue with the partner on a 50/50 basis. Acacia Research Inc. is a patent dealer or non-participating entity (NPE). Acacia partners with inventors and patent owners (e.g. Renesas) to commercialize their intellectual property through licensing deals with major operating companies (e.g. Oracle, Microsoft, GE, Johnson & Johnson), or occasionally, through litigation and settlement. Revenue is typically shared, 50/50. NPEs are able to assert patents without fear of counter-suit and hence be effective proxies in the market for operating companies that would otherwise avoid asserting their rights and therefore be unable to realize the full value of their R&D and their patents. Acacia also has brand awareness, resource and expertise with which to enforce patent rights, where small companies or individuals cannot afford to do so. As patent dealers grow larger, and their business more transparent, they also provide useful pricing signals for licensees, efficient one-stop-shops for securing comprehensive licensing agreements, and a more predictable outcome in patent infringement negotiations (avoiding costly, unpredictable litigation). Acacia is aligned with the interest of the patent owner, but serves a useful purpose in making the patent market more efficient.
The U.S. out-innovates the world. IP stands at the center of innovation and value-creation in the technology industry, globally. According to Deloitte & Touche, licensing in the US has grown to a ~ $500 billion industry from just ~$15 billion 25 years ago, but this represents just a fraction of the value of the $3 - $5 trillion of IP assets globally. More than 456,000 utility patents were filed with the USPTO in 2009, and major corporations regularly file thousands a year, primarily for defensive purposes, though some now treat their IP portfolios as strategic assets and – in some cases – sources of revenue and profit. The United States has experienced 8.5% CAGR growth in the value of royalty and license fee exports over the last 10 years, and regularly reports a trade surplus in this narrow context ($64.6 billion in 2009).
There are catalysts ahead. We expect Acacia to announce new 'comprehensive licensing agreements' with major corporations over the next year or two, given recent management commentary and announced comprehensive agreements. We believe these agreements could bring in $20-$40 million of revenue, each. Second, based on discussions with management, we believe Acacia is close to concluding large partnership deals that will give the firm access to thousands of patents, increasing the firm’s licensing scope. Third, we believe the firm could generate about $12 million in revenue from settlement of patent litigation with Yahoo! Finally, we believe RPX Corp's IPO could draw investor attention to this nascent space, if it proceeds as planned (see RPXC S-1 filing).
Risks to Our Rating and Price Target Patent litigation – “patent trolling” – often receives bad press, and may deter investors from owning stocks of companies that participate in the IP market.
Revenues are lumpy owing to the uncertainty of contract timing and revenue recognition associated with settlements and licensing agreements. We believe it will be very difficult to make high conviction trades in advance of quarterly results and we recommend against doing so, especially while trading volumes are quite thin and ownership narrows. We believe investors should be ready for very significant upside and downside surprises (see

5
North America Equity Research 09 March 2011
Paul Coster, CFA (1-212) 622-6425 [email protected]
Figure 1). Bear in mind too, that the company does not issue guidance for this reason of lumpiness and to avoid getting tied down in negotiations with licensees.
There are NPE competitors in the patent market, and Acacia is also competing for IP property against licensing companies that specialize in specific technology domains. Even if these different entities represent different interests, or operate with unlike business models, they do compete for ownership or control of patents and might be in a position to bid up the cost of intellectual property, increasing Acacia’s cost-base somewhat.
ACTG could require capital, which might be dilutive for shareholders. ACTG is strongly cash flow positive, and debt free, however the leadership team has expressed an interest in acquiring NPEs, patents and patent portfolios, and has created a corporate structure that will allow for off-balance sheet financing if necessary. ACTG might decide to raise equity capital to fund growth of the business, particularly if the patent market becomes more competitive.
There is a risk that regulators clamp down on NPE activity. Patent reform, sponsored by Senators Leahy, Hatch and Grassley, has failed to be enacted for several years in a row, but there remains support for the notion of first-to-file, stronger patents, and the elimination of uncertainty in litigation. These reforms can be viewed as friendly to large companies and against the interest of patent holders, but the House is wary of any reform that might undermine US competitiveness (.v. China) or job creation, and there is a community of ideological support in favor of patent systems that favor the inventor.

6
North America Equity Research 09 March 2011
Paul Coster, CFA (1-212) 622-6425 [email protected]
Company Description Acacia Research Corp is an industry leader in patent licensing with major corporations, globally. Acacia partners with patent owners, including major corporations, research labs, universities and individuals, in licensing patents to corporate users and shares the revenues on a 50/50 basis with the owner. The company owns or controls over 170 diversified patented portfolios and a strategic partnership with Renesas Electronics yields access to 40,000 patents, many related to semiconductors. Licensees of the company include many major corporations, including 3M, Boston Scientific, Dell, Exxon, GE, Hewlett Packard, IBM, LG, Microsoft, Nokia, Samsung, Sony and Walt Disney. The firm’s patent portfolios span mobile handsets, computer technology, digital video, flash memory, medical imaging, database access and optimization, ecommerce, LBS and telematics and wireless communications. The company is based in Newport Beach, California and employs 48 staff (As of Dec 31, 2010). Acacia trades on NASDAQ, under the stock symbol "ACTG”.
Financial Outlook We look for ACTG to grow EBITDA at about 28% CAGR 2010-2013, on a revenue CAGR of about 23%. Note that ACTG has about $90 million of Net Operating Loss carry forward for tax purposes, and is unlikely to pay statutory tax rate before 2014, in our view.
Acacia is benefiting from two major trends: (1) the willingness of major corporations to partner with ACTG for the purpose of monetizing their patent portfolios, and (2) the readiness of operating companies to enter into comprehensive licensing agreements to reduce the (litigation) costs of doing business in highly contested market segments. We believe Acacia’s revenue and earnings growth will be driven by the accumulation of patent portfolios, activation of revenue-generating programs associated with those portfolios in the form of one-off licensing agreements and comprehensive licensing agreements.
We are confident that ACTG is poised to grow earnings and revenue over the next several years, however investors should expect volatility on a quarterly basis owing to the difficulty in timing the outcome of litigation and licensing negotiations. ACTG's results will be lumpy and this means long-term investors should expect significant volatility. The company does not issue guidance, thus avoiding providing potential licensees with negotiating leverage around quarter-end.

7
North America Equity Research 09 March 2011
Paul Coster, CFA (1-212) 622-6425 [email protected]
Figure 1: ACTG Stock is likely to be volatile around earnings
Source: Bloomberg, JPMorgan
For 2011 we forecast PF EPS of $1.84 (up 55%) on revenue of $169.6 million (up 29% y/y), which is below consensus of $2.13 on revenue of $172.0 million. We forecast EBITDA of $71.9 million, up 36% y/y, in line with consensus.
For 2012 we forecast PF EPS of $2.27 (up 23%) on revenue of $206.4 million (up 22% y/y), which is below consensus of $2.39 on revenue of $205.5 million. We forecast EBITDA of $90.0 million, up 25% y/y, also in line with consensus.
Revenue and Margin Outlook ACTG’s business is early-stage and the revenue model is still evolving. The firm reports revenues as a single segment but, based on management commentary and recently announced contracts, we believe regular one-off licensing agreements will be gradually supplemented by comprehensive global agreements as the company grants large corporations (e.g., Microsoft, Samsung) a broader right to use Acacia's patent portfolios (including future patent acquisitions) for a term of 2 – 3 years. Whereas the one-off licensing agreements might yield revenues of less than $500,000, the comprehensive agreements could yield revenue of more than $25 million, much of it at very high margin owing to the time-value element of the deal. In addition to the above, ACTG will occasionally benefit from patent litigation (a $12 million award in a case against Yahoo! is pending).

8
North America Equity Research 09 March 2011
Paul Coster, CFA (1-212) 622-6425 [email protected]
Forecasting Methodology Acacia's business model works as follows: 1) the company acquires patents from partners and places them in operating
subsidiaries; 2) Acacia prepares the portfolio for licensing (e.g., review contracts, define
portfolios, match patents with portfolios) which takes about 18 months; 3) the company launches a portfolio-specific revenue-generating program; 4) the company episodically secures licensing agreements for the patent portfolio;
litigation is a recourse, when necessary.
Table 1: Revenue Forecast Snapshot $ in millions
FY06A FY07A FY08A FY09A FY10A FY11E FY12E Patent Portfolios Acquired 30 36 36 36 Patent Portfolios (Accum) 57 88 105 135 171 207 243 % Growth (y/y) 54.4% 19.3% 28.6% 26.7% 21.1% 17.4% Portfolios generating Initial Revenue 12 31 30 24 Licensing Programs (Accum) 20 28 48 60 91 121 145 % Revenue generating 44% 53% 58% 60% Revenue-Generating Programs (Intra period) 30 58 % Revenue generating (intra period) 50% 64% New Licensing Agreements 117 221 220 258 Licensing Agreements (Accumulated) 623 740 961 1181 1440 % Growth (y/y) 18.8% 29.9% 22.9% 21.9% Licensing Revenue (normalized) 67.3 81.8 129.6 161.4 Term Deal Premium 0.0 50.0 40.0 45.0 Total Revenue 34.8 52.6 48.2 67.3 131.8 169.6 206.4 % Growth (y/y) 77.9% 51.0% -8.3% 39.6% 95.8% 28.7% 21.7% Source: Company reports, JPMorgan estimates
Forecasting Assumptions We assume that Acacia gathers approximately 36 patent portfolios each year. Near-term, a high proportion of these new portfolios are likely to originate from analysis and conversion of the 40,000 patents held by Renesas. We believe there is upside to this rate of acquisition, particularly if the firm uses its balance sheet to start acquiring patents.
We assume that approximately 80% of these acquired patent portfolios are activated as revenue-generating portfolios after an 18 month lead-time, which is consistent with past performance. We are also assuming that 30% of the active portfolios actually generate revenue in any one quarter, typically of about $1 million.
Finally, we overlay the above with the additional assumption that Acacia will secure one comprehensive licensing agreement every six months, with an average revenue of about $20 million. The company has stated its intent to secure 12 such comprehensive licensing deals in the next couple of years, and believes the deals could be worth as much as $40 million, so our assumptions seem conservative both in terms of the number and size of these comprehensive licensing agreements. We note that Acacia landed a comprehensive deal with Samsung on March 3rd (8K filing
9
North America Equity Research 09 March 2011
Paul Coster, CFA (1-212) 622-6425 [email protected]
refers to “Acacia Research Corporation” as the signing entity, not a subsidiary) so we believe there is upside to our 1Q11 forecast.
Ultimately, revenues will depend on when licensing agreements (one-off or comprehensive) get signed. The company does not issue revenue guidance because it does not want to get tied down by quarterly targets when negotiating licensing agreement with customers - particularly around quarter end. In addition, many revenue events, such as the outcome of litigation, cannot be predicted with certainty.
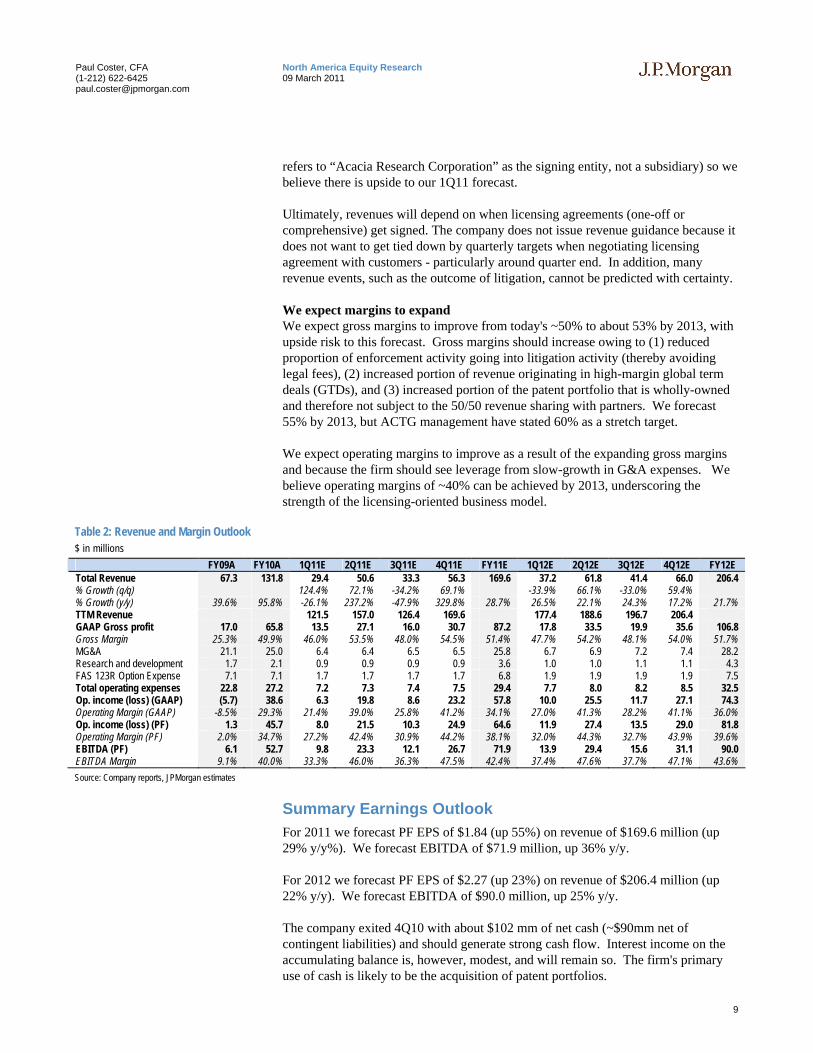
We expect margins to expand We expect gross margins to improve from today's ~50% to about 53% by 2013, with upside risk to this forecast. Gross margins should increase owing to (1) reduced proportion of enforcement activity going into litigation activity (thereby avoiding legal fees), (2) increased portion of revenue originating in high-margin global term deals (GTDs), and (3) increased portion of the patent portfolio that is wholly-owned and therefore not subject to the 50/50 revenue sharing with partners. We forecast 55% by 2013, but ACTG management have stated 60% as a stretch target.
We expect operating margins to improve as a result of the expanding gross margins and because the firm should see leverage from slow-growth in G&A expenses. We believe operating margins of ~40% can be achieved by 2013, underscoring the strength of the licensing-oriented business model.
Table 2: Revenue and Margin Outlook $ in millions
FY09A FY10A 1Q11E 2Q11E 3Q11E 4Q11E FY11E 1Q12E 2Q12E 3Q12E 4Q12E FY12E Total Revenue 67.3 131.8 29.4 50.6 33.3 56.3 169.6 37.2 61.8 41.4 66.0 206.4 % Growth (q/q) 124.4% 72.1% -34.2% 69.1% -33.9% 66.1% -33.0% 59.4% % Growth (y/y) 39.6% 95.8% -26.1% 237.2% -47.9% 329.8% 28.7% 26.5% 22.1% 24.3% 17.2% 21.7% TTM Revenue 121.5 157.0 126.4 169.6 177.4 188.6 196.7 206.4 GAAP Gross profit 17.0 65.8 13.5 27.1 16.0 30.7 87.2 17.8 33.5 19.9 35.6 106.8 Gross Margin 25.3% 49.9% 46.0% 53.5% 48.0% 54.5% 51.4% 47.7% 54.2% 48.1% 54.0% 51.7% MG&A 21.1 25.0 6.4 6.4 6.5 6.5 25.8 6.7 6.9 7.2 7.4 28.2 Research and development 1.7 2.1 0.9 0.9 0.9 0.9 3.6 1.0 1.0 1.1 1.1 4.3 FAS 123R Option Expense 7.1 7.1 1.7 1.7 1.7 1.7 6.8 1.9 1.9 1.9 1.9 7.5 Total operating expenses 22.8 27.2 7.2 7.3 7.4 7.5 29.4 7.7 8.0 8.2 8.5 32.5 Op. income (loss) (GAAP) (5.7) 38.6 6.3 19.8 8.6 23.2 57.8 10.0 25.5 11.7 27.1 74.3 Operating Margin (GAAP) -8.5% 29.3% 21.4% 39.0% 25.8% 41.2% 34.1% 27.0% 41.3% 28.2% 41.1% 36.0% Op. income (loss) (PF) 1.3 45.7 8.0 21.5 10.3 24.9 64.6 11.9 27.4 13.5 29.0 81.8 Operating Margin (PF) 2.0% 34.7% 27.2% 42.4% 30.9% 44.2% 38.1% 32.0% 44.3% 32.7% 43.9% 39.6% EBITDA (PF) 6.1 52.7 9.8 23.3 12.1 26.7 71.9 13.9 29.4 15.6 31.1 90.0 EBITDA Margin 9.1% 40.0% 33.3% 46.0% 36.3% 47.5% 42.4% 37.4% 47.6% 37.7% 47.1% 43.6% Source: Company reports, JPMorgan estimates
Summary Earnings Outlook For 2011 we forecast PF EPS of $1.84 (up 55%) on revenue of $169.6 million (up 29% y/y%). We forecast EBITDA of $71.9 million, up 36% y/y.
For 2012 we forecast PF EPS of $2.27 (up 23%) on revenue of $206.4 million (up 22% y/y). We forecast EBITDA of $90.0 million, up 25% y/y.
The company exited 4Q10 with about $102 mm of net cash (~$90mm net of contingent liabilities) and should generate strong cash flow. Interest income on the accumulating balance is, however, modest, and will remain so. The firm's primary use of cash is likely to be the acquisition of patent portfolios.

10
North America Equity Research 09 March 2011
Paul Coster, CFA (1-212) 622-6425 [email protected]
ACTG has a net operating loss carry-forward of about $90 million, so we believe the effective tax rate will be 5% or less in the next 3 years. We are anticipating that the firm's tax rate will jump to 35%+ in 2014.
Table 3: Earnings Forecast Summary $ in millions FY10E 1Q11E 2Q11E 3Q11E 4Q11E FY11E 1Q12E 2Q12E 3Q12E 4Q12E FY12E Total Revenue 131.8 29.4 50.6 33.3 56.3 169.6 37.2 61.8 41.4 66.0 206.4 GAAP Gross profit 65.8 13.5 27.1 16.0 30.7 87.2 17.8 33.5 19.9 35.6 106.8
Gross Margin 49.9% 46.0% 53.5% 48.0% 54.5% 51.4% 47.7% 54.2% 48.1% 54.0% 51.7% Operating income (GAAP) 38.6 6.3 19.8 8.6 23.2 57.8 10.0 25.5 11.7 27.1 74.3
Operating Margin (GAAP) 29.3% 21.4% 39.0% 25.8% 41.2% 34.1% 27.0% 41.3% 28.2% 41.1% 36.0% EBITDA (PF) 52.7 9.8 23.3 12.1 26.7 71.9 13.9 29.4 15.6 31.1 90.0 EBITDA Margin 40.0% 33.3% 46.0% 36.3% 47.5% 42.4% 37.4% 47.6% 37.7% 47.1% 43.6% Interest income 0.1 0.1 0.1 0.1 0.1 0.2 0.1 0.1 0.1 0.1 0.4 Income Before Tax 38.7 6.3 19.8 8.6 23.3 58.1 10.1 25.6 11.8 27.2 74.7 Net income (loss) (GAAP) 34.0 6.5 19.2 8.6 22.5 56.8 10.0 24.7 11.6 26.3 72.7 Net income (loss) (PF) 40.9 8.1 20.8 10.2 24.1 63.2 11.7 26.4 13.3 27.9 79.4 EPS diluted (GAAP) $0.98 $0.19 $0.56 $0.25 $0.65 $1.65 $0.29 $0.71 $0.33 $0.75 $2.07 EPS diluted (pro forma) $1.18 $0.24 $0.61 $0.30 $0.70 $1.84 $0.34 $0.76 $0.38 $0.79 $2.27 Share count (diluted) 33.5 34.0 34.2 34.4 34.6 34.3 34.7 34.9 35.1 35.3 35.0
Source: Company reports, JPMorgan estimates
Balance Sheet and Cash Flow We believe ACTG may want to raise capital in the next 2-3 years to bolster the firm's growth strategy and establish a competitive advantage in the patent licensing market.
The balance sheet is already quite strong. ACTG exited 4Q10 with about $102 million of cash, no debt. The firm is cash flow positive, and should generate over $60 million of cash flow from operations in 2011, over $80 million in 2012, in our view. Credit risks are modest because the firm is collecting licensing revenue from some of the largest technology companies in the world. The cash-cycle is very attractive because there are no inventory costs and there's hardly any capital expenditure required to run this business.
That said, we note that the firm has spent less than $10 mm per annum on patent acquisitions in the last three years, and we think that is unsustainable. As the firm develops deeper domain expertise, we believe ACTG will be positioned to acquire patents at a reasonable price (relative to the related future cash flow). We expect patent acquisition activity to increase significantly, and we expect ACTG to participate in bidding for large patent portfolios that are shed by large technology operating companies.

11
North America Equity Research 09 March 2011
Paul Coster, CFA (1-212) 622-6425 [email protected]
Table 4: ACTG Balance Sheet Forecast - Snapshot FY08A FY09A FY10E FY11E FY12E ASSETS Total current assets 57.0 57.9 112.2 186.5 262.5 Property and equipment, net 0.2 0.2 0.1 0.2 0.3 Patents, net of accumulated depreciation 12.4 17.5 19.8 28.5 38.2 Total assets 73.1 78.3 134.8 217.9 303.6 LIABILITIES Total current liabilities 14.3 21.9 19.9 41.0 48.3 Total Liabilities 14.5 22.3 20.9 42.1 49.4 SHAREHOLDER'S EQUITY Total stockholders' equity 58.5 53.5 110.9 172.8 251.3 Total liabilities and stockholders' equity 73.1 78.3 134.8 217.9 303.6
Source: Company reports, JPMorgan estimates
Table 5: ACTG Cash Flow Statement - Snapshot FY08A FY09A FY10E FY11E FY12E Net Income (13.8) (5.6) 37.0 55.1 71.0 D&A and other 14.0 11.9 14.1 14.1 15.7 Changes in assets and liabilities: 8.4 7.6 (3.3) 19.7 6.8 Cash Flow from Operations 2.6 16.1 44.9 62.5 87.5 Capex (0.0) (0.1) (0.1) 0.0 0.0 Patent acquisition costs (2.1) (9.6) (8.2) (16.0) (18.0) Cash flow from Investing 5.1 (8.7) (8.1) (16.0) (18.0) Cash flow from Financing 0.1 (4.0) 14.0 0.0 0.0 Change in Cash 7.8 3.5 50.8 46.5 69.5 Free Cash Flow 2.6 16.1 44.9 62.5 87.5
Source: Company reports, JPMorgan estimates
Valuation We are initiating coverage of ACTG with an Overweight Rating and a Price Target of $39.00.
We derive our Price Target based on trading comparables. We are using three groups of companies for comparison purposes: (1) SMID Cap digital media licensing companies, such as Dolby, DTS, and Rovi, (2) SMID Cap semiconductor licensing companies such as Rambus, and Interdigital, and (3) SMID Cap market-enabling companies such as Solera and OpenTable.
The digital media licensing companies are royalty-driven businesses which share some of ACTG's end-markets and make good proxies for ACTG in our view. We acknowledge, of course, that there are fundamental differences too, including the fact that these are operating companies that invest heavily in internal R&D to create patents, and that these firms also have strong product-oriented businesses.
The semi-conductor licensing companies probably require little justification to be included in the comparables table, owing to very significant overlap in terms of business model and end-market focus. That said, it is important to note that companies like Rambus and InterDigital are largely authors (through R&D) of their

12
North America Equity Research 09 March 2011
Paul Coster, CFA (1-212) 622-6425 [email protected]
own IP portfolios, and are more focused on royalties, not one-time licensing agreements.
The market-enabling companies are good proxies for ACTG to the extent that they reflect the role performed by ACTG in creating a more efficient patent market (through aggregation). ACTG is at the center of a network of market participants in much the same way as the companies included in our defined comparables group.
Using blended multiples based on these three comparable groups, we compute a wide range of price targets from about $34 through $61, using CY12 estimates, based on P/E, EV/Revenue and EV/EBITDA multiples of 27.1x, 5.7x and 13.4x respectively.
Table 6: Trading Comparables Yield a Range of Price Targets $ in millions, except per share data
CY12E Multiples Price Targets PF EPS $2.27 P/E 27.1 $60.96 Sales $206.4 EV/Rev 5.7x $33.86 EBITDA $90.0 EV/EBITDA 13.4x $38.61 EV Adjustment $102.5 Share count 34
Source: JPMorgan estimates.
Bear in mind that ACTG is benefiting from about $90 million of NOLs, so the company is avoiding paying statutory-rate taxes through 2013, we believe. In our view, EV/EBITDA is the most appropriate valuation basis for ACTG as it eliminates the effect of the NOLs, and it eliminates the effect of the very high P/E multiples awarded to the 'market maker' subset of the comparable group. On this basis our CY12 Price Target is $39.00.
This calculated EV/EBITDA multiple of 13.4x compares favorably with the stock's recent EV/EBITDA trading range (currently trading at 12.5 times next 12 months EBITDA), however the firm only recently turned EBITDA positive and so there is not much history to go on.

13
North America Equity Research 09 March 2011
Paul Coster, CFA (1-212) 622-6425 [email protected]
Table 7: ACTG Trading Comparables $ in millions, except per share data
Acacia: Trading multiples for selected comparable companies
$ in millions, except per share data and as indicated; Financial data as of 03/04/2011
Name Ticker JPM Analyst Rating Price Mkt Cap EV P/E EV / Revenue EV / EBITDA LTG PEG (CY12)
CY10 CY11 CY12 CY10 CY11 CY12 CY10 CY11 CY12
Digital Media LicensingDolby DLB Coster Overweight $51.29 $5,761 $5,078 18.3x 17.3x 15.7x 5.4x 5.2x 4.7x 10.4x 10.4x 9.1x 15.86 0.99Rovi ROVI Auty Neutral $56.52 $6,074 $6,088 27.0x 23.7x 19.0x 11.2x 7.9x 6.8x 29.8x 17.4x 14.2x 16.20 1.17DTS DTSI Coster Underweight $46.96 $814 $718 51.6x 41.8x 30.5x 8.2x 6.9x 5.7x 24.5x 18.6x 13.8x 22.50 1.35
Mean 32.3x 27.6x 21.7x 8.3x 6.7x 5.7x 21.6x 15.5x 12.4x 18.19 1.17Median 27.0x 23.7x 19.0x 8.2x 6.9x 5.7x 24.5x 17.4x 13.8x 16.20 1.17
Semiconductor LicensingRambus RMBS N/C $20.32 $2,184 $1,794 26.1x nm na 5.5x 6.1x 6.1x 15.0x 25.0x na 47.00 naInterDigital IDCC N/C $46.22 $2,095 $1,554 13.5x 14.8x 14.4x 3.9x 4.2x 4.1x 6.0x 6.0x 6.3x 17.50 0.82Universal Display PANL N/C $41.80 $1,610 $1,545 nm nm na nm 39.0x na na na na na na
Mean 19.8x 14.8x 14.4x 4.7x 16.4x 5.1x 10.5x 15.5x 6.3x 32.25 0.82Median 19.8x 14.8x 14.4x 4.7x 6.1x 5.1x 10.5x 15.5x 6.3x 32.25 0.82
Market MakersSolera Holdings SLH Lewis Overweight $50.12 $3,531 $3,885 23.5x 20.3x 18.2x 6.0x 5.6x 5.2x 14.1x 12.9x 11.7x 14.67 1.24OpenTable OPEN N/C $89.99 $2,071 $2,029 nm 80.4x 53.5x 20.5x 13.8x 10.5x nm 36.9x 25.6x 37.52 1.43IntraLinks IL N/C $29.75 $1,555 $1,630 58.3x 56.6x 42.0x 8.8x 7.4x 6.3x 28.6x 21.5x 17.8x 20.00 2.10DealTrack Holdings TRAK N/C $20.46 $836 $643 38.6x 28.7x 23.6x 2.6x 2.0x 1.8x 17.2x 11.4x 9.0x 16.60 1.42
Mean 40.2x 46.5x 34.3x 9.5x 7.2x 5.9x 20.0x 20.7x 16.0x 22.20 1.55Median 38.6x 42.6x 32.8x 7.4x 6.5x 5.7x 17.2x 17.2x 14.8x 18.30 1.42
Overall Mean 32.1x 35.4x 27.1x 8.0x 9.8x 5.7x 18.2x 17.8x 13.4x 23.09 1.32Overall Median 26.5x 26.2x 21.3x 6.0x 6.5x 5.7x 16.1x 17.4x 12.8x 17.50 1.30
Acacia ACTG Coster Overweight $33.18 $1,227 $1,128 28.0x 18.0x 14.6x 8.6x 6.6x 5.5x 21.4x 15.7x 12.5x 32.10 0.46ACTG Premium/Discount to Mean (12.8%) (49.1%) (46.0%) 6.4% (32.1%) (3.9%) 17.4% (11.8%) (6.8%) 39.0% (65.3%)
Source: Bloomberg estimates, JPMorgan.
14
North America Equity Research 09 March 2011
Paul Coster, CFA (1-212) 622-6425 [email protected]
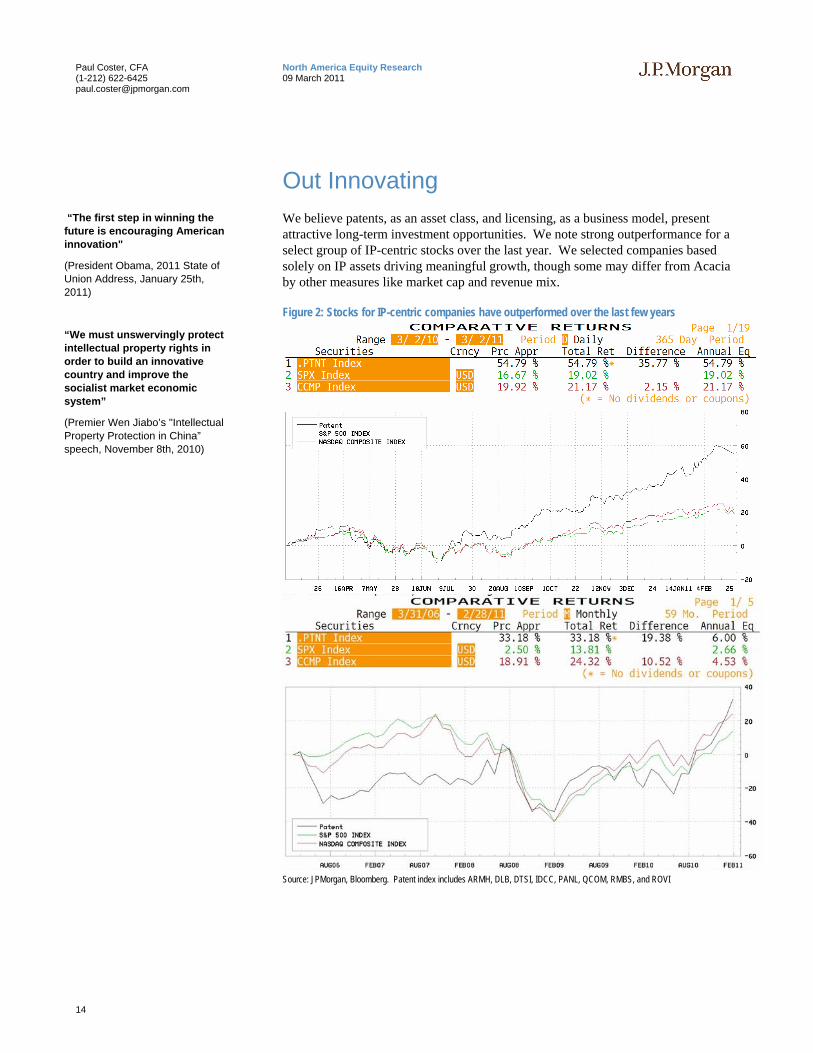
Out Innovating We believe patents, as an asset class, and licensing, as a business model, present attractive long-term investment opportunities. We note strong outperformance for a select group of IP-centric stocks over the last year. We selected companies based solely on IP assets driving meaningful growth, though some may differ from Acacia by other measures like market cap and revenue mix.
Figure 2: Stocks for IP-centric companies have outperformed over the last few years
Source: JPMorgan, Bloomberg. Patent index includes ARMH, DLB, DTSI, IDCC, PANL, QCOM, RMBS, and ROVI
“The first step in winning the future is encouraging American innovation"
(President Obama, 2011 State of Union Address, January 25th, 2011)
“We must unswervingly protect intellectual property rights in order to build an innovative country and improve the socialist market economic system”
(Premier Wen Jiabo’s "Intellectual Property Protection in China” speech, November 8th, 2010)

15
North America Equity Research 09 March 2011
Paul Coster, CFA (1-212) 622-6425 [email protected]
Patents are temporary monopolies; the bedrock of Intellectual Property. US patent law is defined in the US constitution and grants temporary monopolies to inventors, thus encouraging innovation through the realistic expectation that invention can be turned into profit for its author.
IP is the source of sustainable competitive advantage. Intellectual property, which includes patents, copyrights and trade secrets, has emerged as the source of sustainable competitive advantage for many companies, most recently in the technology and bio-pharmaceutical sectors of the economy, and a strategic consideration for governments around the world that want to promote the profit and growth of domestic companies.
IP is a strategic asset, licensing is a business Individuals and companies have become more adept at identifying, protecting and exploiting their intellectual property and an asset that previously was used to erect barriers to entry for core product and service business, has evolved into a source of revenue and profit in its own right, largely in the form of licensing. Licensing revenues have grown dramatically over the last decade.
Patent dealers and NPEs are pure-play IP businesses New business models, focused on pure licensing, have emerged. Patent dealers and non-practicing entities (NPEs), sometimes referred to as “patent trolls', are companies that are focused on securing patent licensing agreements with operating companies, but are able to sue for patent infringement when necessary, without fear of being counter-sued; a source of asymmetrical advantage that allows relative minnows to extract licensing revenue from industry giants. Some patent dealers are aggregating families of patents to create more powerful, predictable licensing streams, in IP-intensive market segments.
Patent dealers are creating efficiencies in the IP market. Inevitably the market is becoming more efficient, in part aided by fast access to better information, brokers and other market-makers, but also owing to the emergence of NPEs and licensing companies that are aggregating patents in specialized portfolios. Patent aggregators, such as Acacia and RPX Corp, are creating efficiencies as more transparent price makers that favor recurring predictable licensing revenues or subscription services over uncertain litigation, which can be costly, time-consuming and incredibly unpredictable.
Acacia is garnering first mover advantage as an IP market participant. We expect success to breed success; that successful aggregators are garnering economies of scale and scope, deep domain expertise in some of the most IP-intensive growth industries, and brand recognition from operating companies as well as inventors. We believe capital will flow to leading aggregators enabling them to build stronger IP portfolios that become the source of sustainable competitive advantage, putting these companies at the very center of value creation. We view Acacia as a leader in this space.

16
North America Equity Research 09 March 2011
Paul Coster, CFA (1-212) 622-6425 [email protected]
Patents are Temporary Monopolies A patent is the grant of a property right to the author of an invention for a finite period; akin to a temporary monopoly. In the U.S. it is issued by the United States Patent and Trademark Office (USPTO), typically for a term of 20 years from the date on which the application was filed. The property right, when granted by the USPTO, is effective in the United States only. The USPTO was founded in 1802, and is now a bureau of the US Department of Commerce. Successful patent applications that are submitted to the USPTO typically take 18 months to process. Once issued, the USPTO has no jurisdiction over questions of patent infringement and enforcement.
Patents are different from Trademarks, which are words, symbols or devices used in trade that indicate the source of the product. Patents are also different from copyright, which is a protection provided to the creators of original works of authorship, such as books, drama and music.
We are interested in “Utility” patents. Utility patents are granted to the inventor or discoverer of a new and useful process, machine, manufactured object, or composition of matter, or "useful improvements thereof" (USPTO). Utility patents are distinguished from "Design" patents, which relate to ornamental design, and “Plant” patents, which are granted to the authors or discoverers of asexually reproduced varieties of plant.
Patent law is enshrined in the Constitution of the United States, in Article 1, Section 8, which grants congress the power "To promote the Progress of Science and useful Arts, by securing for limited Times to Authors and Inventors the exclusive Right to their respective Writings and Discoveries". The first patent law was enacted in 1790, and patent laws underwent a general revision in 1952, and subsequent revision when Congress enacted the American Inventors Protection Act in 1999. Patent law specifies the subject matter and conditions for proper issuance of patents. In the U.S., the USPTO administers the law.
It’s got to be useful, novel, and non-obvious, obviously. According to the USPTO, patents can be applied to "practically everything that is made by man and the processes for making the products", so the scope is broad. That said, the patent can only be granted for things that are "useful". The inventor must also provide a complete description. The invention must also be novel, neither known or used by others in the U.S. or patented and described in a publication abroad, or sold in the U.S. one year before the patent application was made. The invention must be non-obvious to "a person having ordinary skill in the area of technology related to the invention" (USPTO).
The law specifies that a patent can only be applied for by the inventor, unless deceased, in which case the application may be made by a legal representative who administers the estate. A guardian may apply for an inventor that has gone insane (not sure how often this happens). The cost of applying for a patent at the USPTO, as of January can range from several hundred dollars (excluding legal fees), up to several thousand.
Patent infringement occurs when a person or business makes, uses, sells, a patented invention within the US, or imports a patented invention, without authority (i.e. licensed). The infringement can be indirect too, meaning that a company
Patents are limited monopolies over inventions
Patents confer negative rights
Patents may be licensed
Patents are assets that can be transferred

17
North America Equity Research 09 March 2011
Paul Coster, CFA (1-212) 622-6425 [email protected]
supplies components that are used by another entity to manufacture a product that is covered by patent. We understand that if a patent is willfully infringed, then the plaintiff's case can be strong and jury awards can be punitive if the court case is lost, leading to triple damages in some cases.
Patent infringement is not a criminal offense, and therefore must be prosecuted in civil court. If the courts finds for the plaintiff in a patent case, then the court may grant injunctive relief or damages. Aside from receiving the cost of legal fees, the plaintiff might receive injunctive relief (sales of the product must cease) and damages, often expressed as a royalty-rate on sales of the product, backdated to the start of the infringement. In some cases, damages can be doubled or trebled to penalize improper behavior (e.g. attempts at concealment, willful infringement).
The risks of going to trial, particularly in plaintiff-friendly courts, can be enormous. Facing such risk, in many cases an IP dispute does not go to court, but instead, concludes with a licensing agreement or a settlement. If the dispute does go to court, it can be very expensive, very time-consuming and the outcome can be very difficult to predict. Where complicated CE products are concerned, prior art might be defined in hundreds of patents, and determining infringement can be very difficult.
On January 25th, 2011, Senators Leahy, Hatch and Grassley introduced the patent reform legislation, which derives heavily from prior attempts at reform in 2009 and 2010. The reform proposals attempt to move US patents to a ‘first-to-file’ system (from ‘first to invent’), improve the quality of patents, and introduce certainty into IP litigation. Proponents of the bill are attempting to eliminate unnecessary IP litigation and the bill is perceived to be friendly to large companies that are typically the target of IP lawsuits. Opponents believe that some of the reforms will impede innovation by undermining the rights of the innovator, and jeopardize U.S. competitiveness in the international market. Meanwhile the House has announced a hearing that will evaluate whether patent reform will benefit job creation. The reform proposals have slipped several times, so the passage of a reform act seems unlikely in 2011-2012. If the reform does pass, it might reduce the volume of patent applications and awards, eliminate some frivolous litigation, and bring some predictability to infringement damages, which would be mildly negative for patent aggregators, in our view.
In the meantime, the USPTO is experiencing increasing volumes of patent applications, search for prior art is increasingly complicated and risky (RPX Corp estimates that 250,000 patents contribute to the making of a smartphone), and the rate of issuance is increasing. Notwithstanding proposed changes to patent law and enforcement, the environment is viewed as supportive of patent owners in part owing to the creation of a specialized appellate court for patents in 1982, and the definition of patent-specific rules in federal district courts. In addition, the ITC is a vehicle for patent enforcement. It is in this context that IP has become a source of sustainable competitive advantage for some companies, and the core business for non-practicing entities, such as Acacia.
IP is the source of sustainable competitive advantage Until the 1980s, US companies accumulated patent portfolios in a somewhat passive manner and used the patents primarily to defend their core products and services against competing companies. Licensing by companies such as IBM and AT&T was generally done on generous terms with a view to avoiding antitrust rulings (ref. “An

18
North America Equity Research 09 March 2011
Paul Coster, CFA (1-212) 622-6425 [email protected]
Empirical Analyst of Patent Litigation in the Semiconductor Industry, Hall and Ziedonis, 2007, University of California). Patents were looked on as line-of-business assets, and internal counsel was tasked with supporting product and service strategies. The firm-wide patent portfolio was not typically viewed as an asset class and the source of profit in its own right.
Figure 3: Intangibles have increased as a portion of US Companies' total assets
Source: Ocean Tomo
In the 1980s, following creation of the Court of Appeals for the Federal Circuit, US corporations became more actively assertive in their use of IP, leading to a shift towards licensing by companies such as Texas Instruments, Intel and others. Patent applications increased, patent enforcement actions increased, and patents became a source of profit to industry giants such as IBM (ref. “Burning the Ships” by Marshall Phelps), Intel, Texas Instruments, Philips and others, or a source of leverage in collaboration (e.g. Microsoft). Unsurprisingly, licensing pure-plays, such as Qualcomm (wireless) and Dolby (digital media) have emerged that command above average gross and operating margins.

19
North America Equity Research 09 March 2011
Paul Coster, CFA (1-212) 622-6425 [email protected]
Figure 4: Patent Grants by Company - Leading/Trailing Quadrant # of patents granted by time-period, logarithmic scale
Patent grants, 2009
Patent grants, 1969-2009
IBM
SamsungMicrosoft
CanonPanasonic ToshibaSonyIntel
Seiko Epson Hew lett PackardFujitsu
LG HitachiRicoh General ElectricMicronCisco NEC Fujifilm
HondaBroadcom Denso SiemensHon Hai Honey w ell Tex as InstrumentsNokia Sharp XeroxInfineonHy nix Sun Microsy temsBoeingBrother GM Mitsubishi
PhilipsSilv erbrook BoschToy otaSany oFuji XeroxSamsung SDI AT&TAlcatel LucentHitachi RenesasFreescale DupontQualcom TDK Motorola
Toky o Electron 3MTSMDelphiApplied Materials Eastman KodakApple Oly mpus
FordFujitsuSchlumbergerXilinx Nissan
EMC EricssonBaker Hughes Nortel US Nav y
100
1,000
10,000
1,000 10,000 100,000
Leading
Trailing Slipping
Catching Up
Source: USPTO, JPMorgan
The competitive advantage that IP yields for corporations, is also true of the advantage it yields nations that are net authors of patents - and this dates back hundreds of years to before the industrial revolution (Statute of Monopolies granted in England in 1623) and the early Renaissance (Republic of Venice instituted a modern patent system in 1474).
Intellectual property has consistently yielded a favorable trade balance for the United States over the last decade. The 'export' of royalties and licensing fees has grown faster than all other private services and outpaced imports by 170 bp of growth. The United States earned nearly $90 billion in royalties and fees from foreign markets in 2009.
Table 8: US Runs a Significant Trade Surplus in Royalties and License Fees $ in millions
1999 2000 2001 2002 2003 2004 2005 2006 2007 2008 2009 1999-2009
2005-2010
Exports Total Private Services 261,755 279,542 268,648 275,751 284,913 328,870 358,919 400,083 469,870 517,946 483,869 6.3% 7.8% Royalties & License Fees
39,670 43,233 40,696 44,508 46,988 56,715 64,395 70,727 84,580 93,920 89,791 8.5% 8.7%
Imports Total Private Services 180,502 203,383 200,613 206,044 218,169 252,532 270,891 305,349 335,105 365,459 334,917 6.4% 5.4% Royalties & License Fees
13,107 16,468 16,538 19,353 19,033 23,266 24,612 23,518 24,931 25,781 25,230 6.8% 0.6%
Balance Total Private Services 81,253 76,159 68,035 69,707 66,744 76,338 88,028 94,734 134,765 152,487 148,952 6.2% 14.1% Royalties & License Fees
26,563 26,765 24,158 25,155 27,955 33,449 39,783 47,209 59,649 68,139 64,561 9.3% 12.9%
Source: Bureau of Economic Analysis (www.bea.gov), Trade in Services

20
North America Equity Research 09 March 2011
Paul Coster, CFA (1-212) 622-6425 [email protected]
Unsurprisingly, the total market value of public traded companies correlates closely with patent grants, by country.
Figure 5: U.S. and Japanese companies lead patenting activity
# of patent grants, 2009
Market value o f p ubl icly traded sh ares, 2008
U .S.
Japan
Germ anyKorea, SouthT aiw an
C anadaU nited Kingdom
FranceC hinaIs rael
ItalyN etherlands
Aus traliaSw itzerland
Sw edenF inlandIndiaBelgiumAustria SingaporeDenm ark Spain C hina (HK)N orw ay
R uss iaIreland M alay s iaN ew Zealand Braz il
South AfricaM ex ico
HungaryArgentina
C zech R epublicBulgaria
Lux em bourgPoland
10
100
1,000
10,000
100,000
0.001 0.01 0.1 1 10 100
Source: USPTO, JPMorgan
IP is a strategic asset, licensing is an attractive business Licensing-oriented business models tend to yield high gross and operating margins.
Figure 6: IP-centric business models command high operating margins
17%29% 30%
38% 39% 40% 40% 47% 50%
0%
10%
20%
30%
40%
50%
60%
S&P 500 average ACTG RPX DTSI QCOM ARMH RMBS ROVI DLB
CY10A PF Operaing margin
Source: Company reports, Bloomberg
Licensing-oriented businesses tend to trade at high multiples too (see Table 7: ACTG Trading Comparables).
Patent dealers and NPEs are IP-business pure-plays Non-practicing entities (NPE) are individuals, partnerships and companies that are 100% focused on generating IP-based revenue. Unlike operating companies they do not make products or deliver services, and they therefore are able to seek out patent enforcement opportunity without fear of retaliation (counter-suit). ACTG, acting in this proxy capacity for its partners, is able to monetize a firm’s patent portfolio.

21
North America Equity Research 09 March 2011
Paul Coster, CFA (1-212) 622-6425 [email protected]
In many cases, the operating company is presented with a patent infringement claim, which may be followed by a lawsuit. For this reason, NPEs are viewed unfavorably by operating companies and by some industry observers. NPEs have been labeled “patent trolls” by some observers and market participants.
Figure 7: Schema showing relative emphasis on royalties and licensing by entity. Open SourceCommunities
NPEs &Others
NPEs that Invest in R&D
BrandedLicensing Companies
OperatingCompanies withIP Practices
OperatingCompanies
•Linux OS•Apache web server•Web Browser •Tropical Disease Institute•Wikipedia
•Apple Computer•Coke•Dell•Johnson & Johnson
•General Electric•IBM•Microsoft•Qualcomm
•ARM Holdings•Dolby•Philips•Rambus•Rovi
•Universal Display Corp•Wi-LAN, Inc
•Acacia•Intellectual Ventures•Intertrust•RPX
Low High
Source: JPMorgan
PatentFreedom, a company that provides research information on NPEs, has observed a very significant ramp in NPE lawsuits over the last decade.
Figure 8: NPE lawsuits vs. patents issued
Patents Issued
NPE Law suits
0
100
200
300
400
500
600
700
800
1998 1999 2000 2001 2002 2003 2004 2005 2006 2007
Patents Issued NPE Law suits
Source: PatentFreedom

22
North America Equity Research 09 March 2011
Paul Coster, CFA (1-212) 622-6425 [email protected]
Generally, NPE’s focus their licensing attention on large, profitable, cash-rich operating companies that are focused on massive consumer-oriented growth markets.
Table 9: Ranking of Operating Companies by Number of NPE Lawsuits Company 2004 2005 2006 2007 2008 2009 Total Apple 4 3 3 12 13 21 56 Sony 4 7 5 10 12 17 55 Dell 4 3 8 10 8 17 50 Microsoft 3 5 6 12 13 10 49 HP 6 3 5 10 11 13 48 Samsung 5 4 8 14 11 6 48 Motorola 1 6 4 12 14 9 46 AT&T 2 2 6 17 10 7 44 Nokia 2 7 3 10 9 11 42 Panasonic 6 8 4 6 5 11 40 LG - 7 3 12 9 8 39 Verizon 3 3 3 14 7 7 37 Toshiba 5 5 4 9 5 8 36 Sprint Nextel 2 3 3 11 8 7 34 Google 3 1 3 10 7 9 33 Acer 2 3 4 7 8 7 31 Time Warner 2 6 6 9 5 3 31 Deutsche Telekom - 5 2 12 5 5 29 Kyocera 3 6 3 5 5 6 28 Palm 1 3 3 5 10 6 28 Cisco - 3 - 13 6 5 27 Fujitsu 3 1 3 3 7 8 25 IBM 4 1 3 6 2 9 25 Intel 1 9 2 1 7 4 24 Source: PatentFreedom, January 1, 2010
If a patent dispute goes to trial, the outcome can be very unpredictable for the patent owner, the NPE, and the operating company (but generally favorable for the lawyers involved). Very few patents can be successfully enforced (under 5% according to our sources) and the cost of maintaining a patent registration and going to court can be very high for a small NPE or an individual. On the other hand, if a jury rules in favor of a patent owner, or an operating company sees need to settle for fear of injunction or unfavorable damage awards, the cost to the operating company can be enormous.
Table 10: Sample List of Large IP Settlements Year Plaintiff Defendant Settlement, ($mm) 2010 Johnson & Johnson Boston Scientific $1,725 2011 NVIDIA Intel $1,500 2005 Dr Gary Michelson Medtronic $1,350 1990 Polaroid Eastman Kodak $909 2004 Sun Microsystems Microsoft $900 2009 Broadcom Qualcomm $891 2004 Intergraph Microsoft $675 2006 NTP RIM $615 2005 Eolas/USC Microsoft $520 2011 Dr Bruce Safran Johnson & Johnson $482 2004 InterTrust Microsoft $440 2007 Michael Vulpe Microsoft $290 2011 Wi-LAN Broadcom, Intel, Others $70+
Source: Company reports, JPMorgan

23
North America Equity Research 09 March 2011
Paul Coster, CFA (1-212) 622-6425 [email protected]
There is a lack of a liquid market or exchange for expressing interest in, or transacting in patents. Absent a liquid, transparent market, companies lack pricing signals and engage in inefficient one-on-one negotiations and transaction bilateral agreements. There is no sharing of information, pooling of risk.
There are large differences in the perceived value of a patent, depending on the perspective of the operating company and the patent holder. Lacking pricing signals, historical price trends, nor the ability to compare pricing with other transactions, the market tends to be ignored and the parties will gravitate toward litigation.
The patent market is therefore largely adversarial and this leads to agency conflicts and inhibits the free flow of information often to the detriment of both the patent owner and the potential licensee.
RPX, a key participant in the patent market, estimates that patent claims were filed against more than 30,000 defendants between 2005 and 2010. RPX estimates the cost of defense ranging from $50,000 to 10s and 100s of millions of dollars, putting the total cost of patent litigation in the 10s of billions of dollars in the last ten years. Much of the litigation and licensing focus will be on technology segments.
Figure 9: NPEs are focused on Technology but not Exclusively
0 200 400 600 800 1000 1200 1400 1600 1800 2000
Chemicals
Retail
Energy & Env ironment
Financial Serv ice
Industrial Manufacturing
Consumer Goods
Medical Dev ices, Pharma & BioTech
Miscellaneous
Components
Consumer Electronics
Softw are Dev elopment Market
Imaging
Wireless
Computing
Softw are - Sy stems Infrastructure
Communication Serv ices
Communications Equipment
Softw are Applications Market
Semiconductor
Patent Families NPEs Litigations
Source: PatentFreedom, JPMorgan

24
North America Equity Research 09 March 2011
Paul Coster, CFA (1-212) 622-6425 [email protected]
Patent aggregators create market efficiencies In our view, patent dealers that aggregate pools of patents are creating a more efficient patent market.
Generally patent aggregators, like Acacia, are focused on deriving recurring revenues from operating companies in the form of licensing and subscription services, and one-off, unpredictable enforcement through litigation is a last resort. Because they seek recurring revenues, they need to continuously demonstrate the aggregate value of the patent portfolios to well-informed industry participants, and they are essentially guaranteeing the operating company the freedom to execute product and service business strategies without constraint (though at a cost).
Patent aggregators are also offering patent owners a way of monetizing intellectual property, with reduced risk. In the case of the individual inventor, the aggregators offer leverage; the ability to enforce the patent against multiple operating companies. In the case of operating companies, the patent aggregators can enforce patents while reducing the risk of retaliation via counter-suit by competitors.
In all cases, the patent aggregator is creating liquidity, transparency and providing price signals to all market participants. The patent aggregator is also reducing the probability of patent disputes going to litigation, which reduces litigation expense for all parties.

25
North America Equity Research 09 March 2011
Paul Coster, CFA (1-212) 622-6425 [email protected]
In our view, the emergence of patent aggregators, like ACTG, marks the creation of a more efficient intellectual property market. As the patent market becomes more effective and efficient, we should see an increased flow of licensing and subscription revenues (left side of the following diagram) and a diminished use of patent litigation (right side of the following diagram) which is unpredictable and costly (legal fees).
Figure 10: Patent Aggregators are enabling the creation of a more efficient patent market
Patent Market
Inventor University
Small Co
NPE Licensing Product & Licensing
Major Company
Acacia Technologies
RPX Corporat ion
Intellectual Ventures
Patent Consortia &
Other
OperatingCompany
OperatingCompany
OperatingCompany
OperatingCompany
OperatingCompany
Patent Holders
Royalties,LicenseFees &Subscriptions
Royalties,LicenseFees
Acquisitions,License Fees,Revenue Sharing
PatentLitigation
Injunctions,Settlements,& Damages
Injunctions,Settlements,& Damages
$$
$
Products & ServicesLegalFees
LegalFees
LegalFees
Source: JPMorgan
In time, we believe patent aggregators – whether owning patents outright or controlling them through revenue-sharing arrangements – will enable the creation of an IP market place that looks and feels similar to mature financial markets. We expect multiple business models to emerge.

26
North America Equity Research 09 March 2011
Paul Coster, CFA (1-212) 622-6425 [email protected]
Acacia, a patent aggregator, has first-mover advantage PatentFreedom estimates that Acacia is the ninth largest NPE patent owner in the United States.
Table 11: Top 20 NPEs with Large Patent Holdings NPE US Patent Publications Patent Families Intellectual Ventures 10-15k (Est) - Round Rock Research LLC 3,427 1,267 Interdigital 2,484 1,317 Wisconsin Alumni Research Foundation 1,718 1,279 IPG Healthcare 501 Limited 934 874 Tessera Technologies Inc 776 347 Rambus 774 377 Mosaid Technologies Inc 666 318 Acacia Technologies 533 328* Jerome H Lemelson 513 233 CSIRO 510 434 Scenera Research LLC 323 263 Papst Licensing GmbH 271 156 Altitude Capital Partners 263 225 Intertrust Technologies Corp 246 40 Wi-Lan 244 155 Innovative Sonic Ltd 234 165 Alliacense 224 124 Trontech Licensing Inc 191 152 Cheetah Omni LLC 187 115 Source: PatentFreedom, 2010, JPMorgan
Acacia is one of the most active NPEs in terms of litigation activity
Figure 11: Acacia is one of the most active NPEs in terms of litigations 100% = 2,162 lawsuits 2005-Present
Other64%
Catch Curv e 2%
Arriv alStar 2%
WIAV Solutions 1%
Rates Technology 2%
F&G Research 2%
Guardian Media Tech 2%
Sorensen R&D 3%
Plutus IP 3%
Millennium LP 4%
Ronald A Katz 5%
Acacia Technologies 10%
Source: PatentFreedom, 2010
We believe first-mover advantage has accrued to Acacia in form, scale, scope and brand awareness. The company has a strong balance sheet, a profitable business model, and can leverage both to acquire a larger patent portfolio, out-bidding other patent dealers and NPEs and even some operating companies. The company has
27
North America Equity Research 09 March 2011
Paul Coster, CFA (1-212) 622-6425 [email protected]
developed deep domain expertise in several market segments, which yields information advantage and pricing power in the market. The company is well known in the industry and therefore has become a go-to for operating companies and patent owners.
Company Overview Acacia Research Corp is an industry leader in patent licensing with major corporations, globally. Acacia partners with patent owners, including major corporations, research labs, universities and individuals, in licensing patents to corporate users and shares the revenues on a 50/50 basis with the owner. The company owns or controls over 170 diversified patented portfolios and a strategic partnership with Renesas Electronics yields access to 40,000 patents, many related to semiconductors. Licensees of the company include many major corporations, including 3M, Boston Scientific, Dell, Exxon, GE, Hewlett Packard, IBM, LG, Micorosoft, Nokia, Oracle, Samsung, Sony and Walt Disney. The company is based in Newport Beach, California and employs 48 staff (As of Dec 31, 2010).
Business Model Acacia acquires patent portfolios from ‘partners’, including inventors and companies. The acquired patents are placed in operating subsidiaries of Acacia Technologies, in order to legally segregate the assets. Licensing revenue is generally shared on a 50/50 basis with the inventor.
Related patents are folded into patent portfolios that address specific IP opportunities in technology, medical technology or other market segments. Patent portfolios can vary in size from a single patent through to several hundred. It typically takes about 18 months for Acacia to research the portfolio, shape it for licensing, and then go to market, at which point it is ‘revenue-generating’. Acacia has assembled 170 patent portfolios to-date, of which 91 are revenue generating.
The company has secured nearly 1,000 licensing agreements, and has generated over $420 million of revenue to-date. Licensing agreements can range from nominal amounts to 10s of millions of dollars (for comprehensive multi-year agreements). Most licensing agreements are one-off agreements that capture the economics for patents previously used and in use; the company is not equipped to execute royalty agreements, and wants to avoid these deals owing to the risk that licensees execute work-arounds.
28
North America Equity Research 09 March 2011
Paul Coster, CFA (1-212) 622-6425 [email protected]
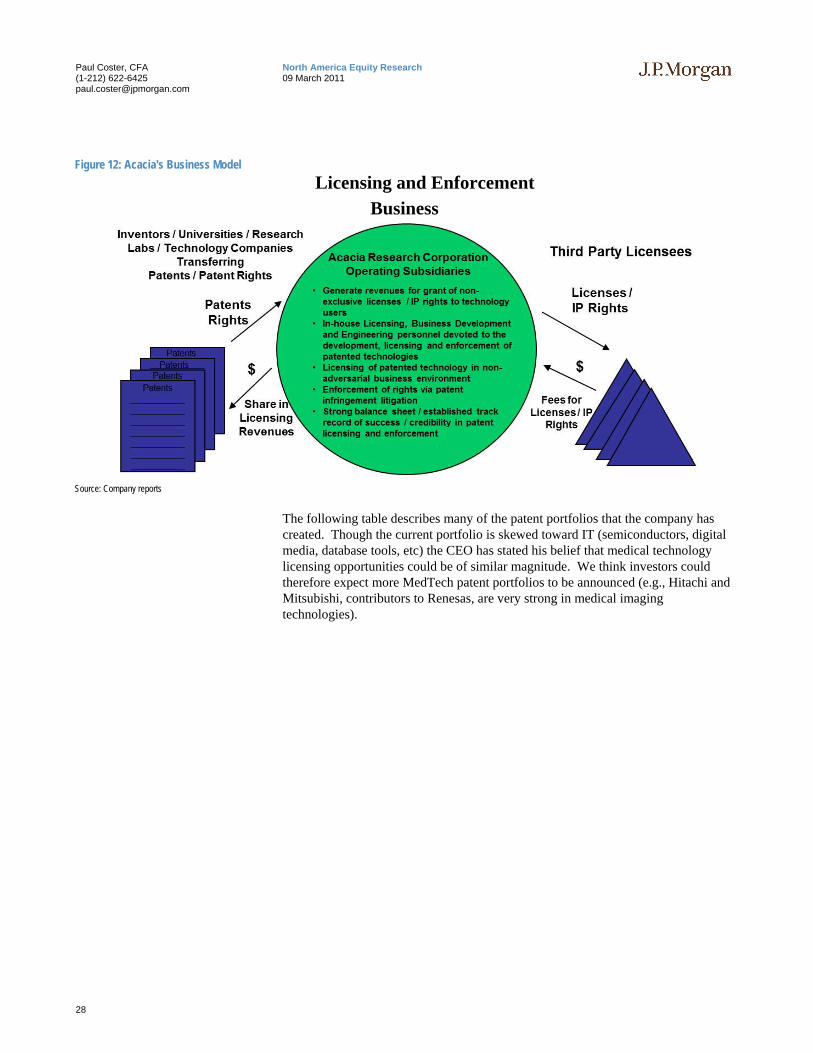
Figure 12: Acacia's Business Model Licensing and Enforcement
Business
Source: Company reports
The following table describes many of the patent portfolios that the company has created. Though the current portfolio is skewed toward IT (semiconductors, digital media, database tools, etc) the CEO has stated his belief that medical technology licensing opportunities could be of similar magnitude. We think investors could therefore expect more MedTech patent portfolios to be announced (e.g., Hitachi and Mitsubishi, contributors to Renesas, are very strong in medical imaging technologies).

29
North America Equity Research 09 March 2011
Paul Coster, CFA (1-212) 622-6425 [email protected]
Table 12: Acacia's patent portfolios cover a wide variety of applications Aligned Wafer Bonding Enterprise Content Management Optical Switching Audio Communications Fraud Detection Facilities Operation Management System Parallel Processing with Shared Memory Audio Storage and Retrieval System File Locking in Shared Storage Networks Peer to Peer Communications Audio Video Enhancement & Synchronization Flash Memory Physical Access Control Authorized Spending Accounts Fluid Flow Control and Monitoring Picture Archiving & Communication Systems Automated Notification of Tax Return Status Hearing Aid ECS Pointing Device Automated Tax Reporting Heated Surgical Blades Pop-Up Internet Advertising Biosensor High Performance Computer Architecture Portable Credit Card Processing Broadcast Data Retrieval High Quality Image Processing Portable Storage Devices with Links Child-friendly Secure Mobile Phones High Resolution Optics Product Activation Chip-Stacking Image Resolution Enhancement Projector Color Correction for Video Graphics Systems Improved Anti-Trap Safety Technology for Vehicles Purifying Nucleic Acids Compact Disk Improved Commercial Print Radio Communication with Graphics Compiler Improved Lighting Records Management Computer Architecture and Power Management Improved Memory Manufacturing Relational Database Access Computer Graphics Improved Printing Remote Management of Imaging Devices Computer Memory Cache Coherency Information Portal Software Remote Video Camera Computer Simulations Integrated Access Resource Scheduling Consumer Rewards Interactive Content in a Cable Distribution System Rule Based Monitoring Continuous TV Viewer Measuring Interactive Mapping Shape Memory Alloys Copy Protection Internet Radio Advertising Software Installation Credit Card Fraud Protection Interstitial Internet Advertising Software License Management Data Encryption Intraluminal Device Technology Spreadsheet Automation Database Access Laparoscopic Surgery Storage Technology Database Management Laptop Connectivity Surgical Catheter Database Retrieval Lighting Ballast Telematics Digital Newspaper Delivery Location Based Services Television Data Display Digital Signal Processing Architecture Manufacturing Data Transfer Television Signal Scrambling Digital Video Enhancement Medical Image Manipulation Text Auto-Completion Digital Video Production Medical Image Stabilization User Programmable Engine Control Distributed Data Management and Synchronization Medical Monitoring Vehicle Anti-Theft Parking Systems DMT® MEMS Vehicle Maintenance Document Generation Messaging Vehicle Occupant Sensing Document Retrieval Using Word Co-Occurrence Patterns Micromirror Digital Display Videoconferencing Dynamic Manufacturing Modeling Microprocessor Enhancement Virtual Computer Workspaces Ecommerce Pricing Microprocessor Memory Management Virtual Server Electronic Address List Management Mobile Computer Synchronization Website Crawling Electronic Message Advertising Multi-Dimensional Database Compression Wireless Data Electronic Securities Trading Network Monitoring Wireless Digital Messaging Embedded Broadcast Data Network Remote Access Wireless LAN Encrypted Media & Playback Devices Online Ad Tracking Workspace with Moving Viewpoint Enhanced DRAM Architecture Online Auction Guarantees Enhanced Internet Navigation Online Promotion
Source: Company reports

30
North America Equity Research 09 March 2011
Paul Coster, CFA (1-212) 622-6425 [email protected]
Management Our interactions with ACTG management have been limited to-date. That said, we are impressed by the relevance of the management team's credentials, entrepreneurial initiative, experience, and their average tenure (10.5 years, according to Bloomberg). Insiders own about 3.5% of shares outstanding, which is above the industry average (Bloomberg est. 3%), but not an overwhelming signal of aligned interests. Insider sales outpace acquisitions and the pace of selling picked up when the stock ran up to about $25 in November 2010.
Paul Ryan, Chairman and CEO Mr. Ryan has served as Chief Executive Officer since January 1997 and as Chairman since April 2000. He also served as President of the Company from January 1997 until July 2000. Prior to being named Chief Executive Officer, he was Executive Vice President and Chief Investment Officer of Acacia Research from 1996 through 1997 and Vice President, Capital Management, of Acacia Research from 1995 through 1996. He was formerly co-founder and general partner of the American Health Care Fund, L.P., held positions with Young & Rubicam, Ogilvy & Mather, and Merrill Lynch and was a private venture capital investor. Mr. Ryan holds a B.S. from Cornell University.
Clayton J.Haynes, CFO Mr. Haynes joined Acacia in April 2001 as Treasurer and Senior Vice President, Finance. In November 2001, Mr. Haynes was appointed Chief Financial Officer of Acacia Research. From 1992 to March 2001, Mr. Haynes was employed by PricewaterhouseCoopers LLP, serving as a Manager in the Business Advisory Services practice. Mr. Haynes received a B.A. from the University of California at Los Angeles and is a Certified Public Accountant.
Dooyong Lee, Executive Vice President Mr. Lee joined Acacia in 2005 as Executive Vice President. He has over 25 years of experience in patent licensing and technology management. He was previously Chief Operating Officer of Global Patent Holdings/TechSearch, which was acquired by Acacia. Prior to Global, he was President of LPS Group, a patent licensing company he founded under Information Holdings Inc. (now part of Thomson Reuters). Prior to LPS Group, he co-founded FRI, an intellectual property consulting firm, then under the sponsorship of Fish & Richardson, PC and previously was a licensing executive at AT&T Bell Laboratories/Lucent Technologies. Mr. Lee received a B.A. from Oberlin College and an M.S. from the University of California, Berkeley.
Edward J. Treska, Vice President, General Counsel & Secretary Mr. Treska joined the company in April 2004 as Vice President. He was appointed Secretary in March 2007 and General Counsel in March 2010. Mr. Treska was previously General Counsel, Director of Patents and Licensing for SRS Labs, Inc., a technology licensing company specializing in audio enhancement. Prior to joining SRS Labs, Mr. Treska practiced law at the intellectual property law firm Knobbe, Martens, Olson & Bear and was a design engineer with the TRW Space & Technology Group. Mr. Treska holds a B.S. degree in Electrical Engineering from Colorado State University and a J.D. degree from the University of San Diego School of Law.

31
North America Equity Research 09 March 2011
Paul Coster, CFA (1-212) 622-6425 [email protected]
Competition Many entities are emerging in the nascent patent market, generally intent on accumulating portfolios that yield leverage in the market, however the market is vast and very fragmented, and we think there is very little head-on competition in the market so far. Acacia’s competitors include patent dealers, NPEs, consortia and other aggregators such as Allied Security Trust, Altitude Capital Partners, Coller IP, Intellectual Ventures, Millennium Partners, Rembrandt IP Management. RPX is emerging as a subscription service, representing the interests of licensees, competing and cooperating with ACTG. There are many licensing companies that focus on royalties in specific market segments (e.g. Dolby, DTS, Rovi, Qualcomm, ARM), and there are many major corporations that have very extensive IP programs (e.g. Microsoft, IBM). These licensing and operating companies ‘compete’ with Acacia to the extent that they could bid up the cost of patents for Acacia.
We provide brief profiles for two pure-play near-peers in the patent market; RPX and Intellectual Ventures. RPX is interesting, because it can act as a counter-part to Acacia, representing the interests of the licensees. Intellectual Ventures is interesting because of its size and the contrasting manner in which it partners with inventors.
RPX Corporation RPX is emerging as a key player in the Intellectual patent market place, competing against and sometimes cooperating with NPEs such as Acacia, albeit with different objectives and approach. RPX is the leading provider of defensive patent aggregation solutions, meaning that RPX acquires and licenses patents ("patent assets") not for the purpose of asserting them, but for the purpose of providing clients with protection against infringement lawsuit and licensing claims. RPX’s clients, which include some of the world’s most prominent companies, including Cisco, Google, Nokia, Panasonic and Samsung, pay a subscription for the protection that RPX gives them against NPEs.
Table 13: RPX's Value Proposition RPX Solution Benefit to subscribers RPX proactively assesses patent assets offered for sale and acquires many that are asserted against its client base
Reduced risk of patent litigation
RPX offers clients an annual subscription to its services. Predictable cost to clients, capped at ~ $5 million per annum.
RPX shares the cost of patent portfolios over an ever widening array of clients.
Reduced expense of patent control or ownership
RPX provides ancillary monitoring and risk-assessment services, and market transparency.
Reduced overhead expenses relating to internal patent risk management
Source: Company S1 Filing
RPX is a Defensive patent aggregator
RPX recently filed an S-1.
32
North America Equity Research 09 March 2011
Paul Coster, CFA (1-212) 622-6425 [email protected]
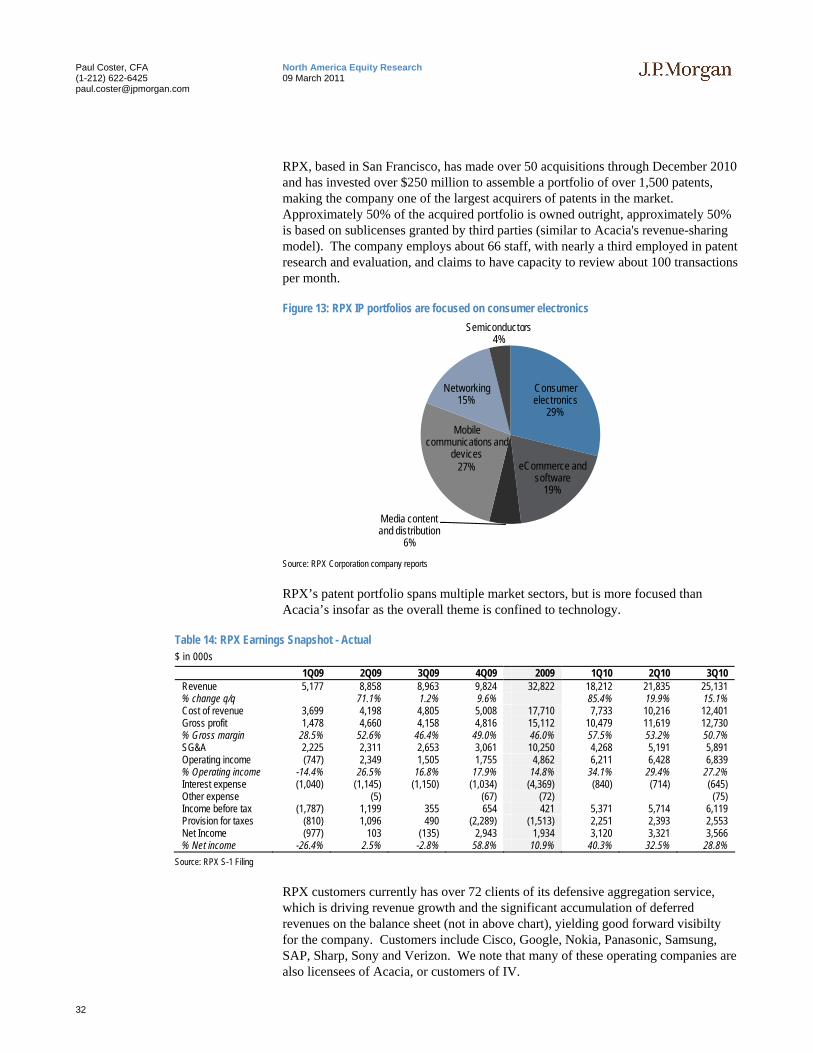
RPX, based in San Francisco, has made over 50 acquisitions through December 2010 and has invested over $250 million to assemble a portfolio of over 1,500 patents, making the company one of the largest acquirers of patents in the market. Approximately 50% of the acquired portfolio is owned outright, approximately 50% is based on sublicenses granted by third parties (similar to Acacia's revenue-sharing model). The company employs about 66 staff, with nearly a third employed in patent research and evaluation, and claims to have capacity to review about 100 transactions per month.
Figure 13: RPX IP portfolios are focused on consumer electronics
Consumer electronics
29%
eCommerce and software
19%
Media content and distribution
6%
Mobile communications and
devices27%
Networking15%
Semiconductors4%
Source: RPX Corporation company reports
RPX’s patent portfolio spans multiple market sectors, but is more focused than Acacia’s insofar as the overall theme is confined to technology.
Table 14: RPX Earnings Snapshot - Actual $ in 000s
1Q09 2Q09 3Q09 4Q09 2009 1Q10 2Q10 3Q10 Revenue 5,177 8,858 8,963 9,824 32,822 18,212 21,835 25,131 % change q/q 71.1% 1.2% 9.6% 85.4% 19.9% 15.1% Cost of revenue 3,699 4,198 4,805 5,008 17,710 7,733 10,216 12,401 Gross profit 1,478 4,660 4,158 4,816 15,112 10,479 11,619 12,730 % Gross margin 28.5% 52.6% 46.4% 49.0% 46.0% 57.5% 53.2% 50.7% SG&A 2,225 2,311 2,653 3,061 10,250 4,268 5,191 5,891 Operating income (747) 2,349 1,505 1,755 4,862 6,211 6,428 6,839 % Operating income -14.4% 26.5% 16.8% 17.9% 14.8% 34.1% 29.4% 27.2% Interest expense (1,040) (1,145) (1,150) (1,034) (4,369) (840) (714) (645) Other expense (5) (67) (72) (75) Income before tax (1,787) 1,199 355 654 421 5,371 5,714 6,119 Provision for taxes (810) 1,096 490 (2,289) (1,513) 2,251 2,393 2,553 Net Income (977) 103 (135) 2,943 1,934 3,120 3,321 3,566 % Net income -26.4% 2.5% -2.8% 58.8% 10.9% 40.3% 32.5% 28.8%
Source: RPX S-1 Filing
RPX customers currently has over 72 clients of its defensive aggregation service, which is driving revenue growth and the significant accumulation of deferred revenues on the balance sheet (not in above chart), yielding good forward visibilty for the company. Customers include Cisco, Google, Nokia, Panasonic, Samsung, SAP, Sharp, Sony and Verizon. We note that many of these operating companies are also licensees of Acacia, or customers of IV.

33
North America Equity Research 09 March 2011
Paul Coster, CFA (1-212) 622-6425 [email protected]
RPX appears to be headed to an IPO. The company filed an S-1 on January 21st and applied to list on NASDAQ under the ticker RPXC.
Intellectual Ventures Intellectual Ventures was founded in 2000 by Nathan Myhrvold (among others), previously CTO and chief strategist for Microsoft Corporation. This private company has raised more than $5 billion to invest in intellectual property (“the invention market”) acquired more than 30,000 patents in 50 technology areas, and employs more than 700 multi-disciplinary staff, tasked with identifying inventions and create a market for patents. The company works with 150 inventors and established an invention laboratory in Bellevue, Washington in 2009. Based on recent court filings, IV has earned nearly $2 billion in royalties from its patent portfolio to-date.
Areas in which IV is focused include Agriculture, Automotive, Communications, Computer Hardware, Construction, Consumer Electronics, eCommerce, Energy, Financial Services, Health Technologies, Life Sciences, Medical Devices, Nanotechnology, Physical Sciences, Security, Semiconductors and Software.
Table 15: Recent IV Litigation, Settlements and Licensing Deals Date Customer or counterparty Summary Transaction January 2011 SAP Licensed access to IV’s 30,000 patents, plus sponsored
research December 2010 Check Point, McAfee, Symantec,
and Trend Micro Filed suit for patent infringement by security-software companies
December 2010 Hynix, Elpida, Filed suit for patent infringement by DRAM and Flash companies
December 2010 Altera, Lattice Semiconductor and Microsemi.
Filed suit for patent infringement by IC manufacturers
November , 2010 HTC Licensed access to IV’s 30,000 patents, plus sponsored research
November , 2010 Samsung Licensed access to IV’s 30,000 patents, plus sponsored research
July 2010 Vlingo Vlingo bought patents for defensive use, possibly against Nuance
June 2010 Thales Thales licenses Iridium an aggregation of patents just ahead of landing a$2.1 billion contract to build 81 satellites.
February 2010 Verizon Verizon licensed a patent from IV in order to file a countersuit against TiVo
Source: IV, JPMorgan

34
North America Equity Research 09 March 2011
Paul Coster, CFA (1-212) 622-6425 [email protected]
Appendix I: International Trade Commission The United States International Trade Commission (USITC or ITC) is an independent federal agency tasked with quasi-judicial investigation of unfair trade practices including import dumping and infringement of intellectual property rights.
“The mission of the Commission is to (1) administer U.S. trade remedy laws within its mandate in a fair and objective manner; (2) provide the President, USTR, and Congress with independent analysis, information, and support on matters of tariffs, international trade, and U.S. competitiveness; and (3) maintain the Harmonized Tariff Schedule of the United States (HTS).” Source: www.usitc.gov
Section 337 Investigations are conducted by the ITC to determine whether imported goods infringe on utility and design patents, as well as trademarks. The remedy available to the Commission is to instruct US Customs to stop the import of goods into the United States, or to issue cease and desist orders against importers.
We note that the ITC has conducted about 728 investigations and that just over 50 investigations are pending or active. A scan of the pending investigations reveals that the majority relate to technologies used in consumer electronics devices, semiconductors, display technologies, communications and software.
Section 1337 of the Tariff Act of 1930 provides rules for protecting the U.S. against unfair practices in trade import.

35
North America Equity Research 09 March 2011
Paul Coster, CFA (1-212) 622-6425 [email protected]
Table 16: The 30 Most Recent ITC 337 Investigations Inv. No. Status Investigation Title 757� Pending Game Devices, Components Thereof, and Products Containing the 756� Pending Reduced Ignition Proclivity Cigarette Paper Wrappers and Products 755� Pending Starter Motors and Alternators 754� Pending Handbags, Luggage, Accessories and Packaging Thereof 753� Pending Semiconductor Chips and Products Containing Same 752� Pending Gaming and Entertainment Consoles, Related Software, and 751� Pending Turbomachinery Blades, Engines and Components Thereof 750� Pending Mobile Devices and Related Software 749� Pending Liquid Crystal Display Devices, Including Monitors, Televisions, 748� Data Storage Products and Components Thereof 747� Pending Products Containing Interactive Program Guide and Parental 746� Pending Automated Media Library Devices 745� Pending Wireless Communication Devices, Portable Music and Data 744� Pending Mobile Devices, Associated Software, and Components Thereof 743� Pending Video Game Systems and Controllers 742� Pending Digital Televisions and Components Thereof 741� Pending Liquid Crystal Display Devices, Including Monitors, Televisions, 740� Pending Toner Cartridges and Components Thereof 739� Pending Ground Fault Circuit Interrupters and Products Containing Same 738� Pending Components for Installation of Marine Autopilots with GPS or IMU 737� Pending Liquid Crystal Display Devices and Products Interoperable With 736� Pending Wind and Solar-Powered Light Posts and Street Lamps 735� Pending Flash Memory Chips and Products Containing the Same 734� Pending Adjustable-Height Beds and Components Thereof 733� Pending Flat Panel Digital Televisions and Components Thereof 732� Pending Devices Having Elastomeric Gel and Components Thereof 731� Pending Toner Cartridges and Components Thereof 730� Pending Inkjet Ink Supplies and Components Thereof 729� Semiconductor Products Made by Advanced Lithography Techniques 728� Pending Collaborative System Products and Components Thereof (II)
Source: www.usitc.gov
In addition to conducting investigations and taking remedial action, the ITC also conducts research and issues reports to Congress and the President. In November 2010, the USITC published a report assessing infringement of intellectual property by China and its effects on the U.S. economy (see: www.usitc.gov/publications/332/pub4199.pdf ).
The report concludes that IPR infringement in China "reduces market opportunities and undermines the profitability of U.S. firms". The major findings are that IPR enforcement in China is institutionally and structurally impeded, that poor enforcement leads to widespread infringement (e.g. 240,000 internet cafes use illegal copies of entertainment software), and that China's indigenous polices make it difficult for foreign firms to compete on a level playing field. For instance, the Chinese government granted over 73,000 utility model and design patents in 2009, with well over 90% of these patents being granted to domestic owners (China's State Intellectual Property Office received a total of 976,686 applications in 2009). These kinds of patents are ignored by foreign companies because they typically relate to aesthetics or applications and do not relate to inventions. Nonetheless, though
China and Hong Kong accounted for 89% of all US Customs seizures in FY2009.

36
North America Equity Research 09 March 2011
Paul Coster, CFA (1-212) 622-6425 [email protected]
viewed as worthless by most international companies, these patents allow Chinese companies to file suit against foreign importers.

37
North America Equity Research 09 March 2011
Paul Coster, CFA (1-212) 622-6425 [email protected]
Appendix II: Detailed Financial Model Figure 14: Income Statement
FY09A FY10A 1Q 11E 2Q 11E 3Q 11E 4Q 11E FY11E 1Q 12E 2Q 12E 3Q 12E 4Q 12E FY12ETotal Revenue 67.34 131.83 29.40 50.60 33.30 56.30 169.60 37.20 61.80 41.40 66.00 206.40
% Growth (q/q) 124.4% 72.1% -34.2% 69.1% -33.9% 66.1% -33.0% 59.4%% Growth (y/y) 39.6% 95.8% -26.1% 237.2% -47.9% 329.8% 28.7% 26.5% 22.1% 24.3% 17.2% 21.7%TTM Revenue 67.34 131.83 121.46 157.05 126.40 169.60 169.60 177.40 188.60 196.70 206.40
Cost of revenues 50.31 66.08 15.89 23.54 17.33 25.63 82.39 19.44 28.31 21.49 30.37 99.61
GAAP Gross profit 17.03 65.75 13.51 27.06 15.97 30.67 87.21 17.76 33.49 19.91 35.63 106.79Gross Margin 25.3% 49.9% 46.0% 53.5% 48.0% 54.5% 51.4% 47.7% 54.2% 48.1% 54.0% 51.7%
Marketing, General & Administrative 21.07 25.03 6.35 6.42 6.48 6.55 25.80 6.74 6.95 7.15 7.37 28.21Research and Consulting 1.69 2.12 0.86 0.89 0.91 0.94 3.60 0.99 1.04 1.09 1.14 4.25FAS 123R Option Expense 7.07 7.12 1.70 1.70 1.70 1.70 6.80 1.87 1.87 1.87 1.87 7.48
Total operating expenses 22.76 27.15 7.21 7.30 7.39 7.49 29.40 7.73 7.98 8.24 8.51 32.46% of Sales 33.8% 20.6% 24.5% 14.4% 22.2% 13.3% 17.3% 20.8% 12.9% 19.9% 12.9% 15.7%
O perating income (loss) (GAAP) (5.73) 38.60 6.30 19.76 8.58 23.19 57.81 10.03 25.50 11.67 27.12 74.32Operating Margin (GAAP) -8.5% 29.3% 21.4% 39.0% 25.8% 41.2% 34.1% 27.0% 41.3% 28.2% 41.1% 36.0%
O perating income (loss) (Pro forma) 1.34 45.72 8.00 21.46 10.28 24.89 64.61 11.90 27.37 13.54 28.99 81.80Operating Margin (pro forma) 2.0% 34.7% 27.2% 42.4% 30.9% 44.2% 38.1% 32.0% 44.3% 32.7% 43.9% 39.6%
EBITDA 6.10 52.74 9.79 23.27 12.10 26.73 71.88 13.93 29.42 15.60 31.07 90.02EBITDA Margin 9.1% 40.0% 33.3% 46.0% 36.3% 47.5% 42.4% 37.4% 47.6% 37.7% 47.1% 43.6%Interest income 0.15 0.14 0.05 0.05 0.06 0.07 0.24 0.08 0.09 0.10 0.11 0.38Gain on foreign currency translation 0.20 0.00Gain on investments (0.05) 0.00 0.00 0.00 0.00 0.00 0.00 0.00 0.00 0.00 0.00 0.00
Income (loss) before income taxes (GAAP) (5.42) 38.73 6.35 19.81 8.64 23.25 58.05 10.11 25.59 11.77 27.23 74.71Provision for (benefit from) income taxes 0.21 1.72 0.32 0.99 0.43 1.16 2.90 0.51 1.28 0.59 1.36 3.74Net income from non-controlling interests (5.66) (2.97) 0.42 0.42 0.42 0.42 1.70 0.42 0.42 0.42 0.42 1.70
Net income (loss) (GAAP) (11.29) 34.05 6.45 19.24 8.63 22.52 56.85 10.03 24.74 11.60 26.29 72.67Net income (loss) (PF) (4.83) 40.90 8.05 20.84 10.20 24.08 63.17 11.74 26.43 13.27 27.94 79.38EPS diluted (GAAP) ($0.38) $0.98 $0.19 $0.56 $0.25 $0.65 $1.65 $0.29 $0.71 $0.33 $0.75 $2.07EPS diluted (pro forma) ($0.16) $1.18 $0.24 $0.61 $0.30 $0.70 $1.84 $0.34 $0.76 $0.38 $0.79 $2.27Weighted average common shares outstanding - diluted 29.9 33.5 34.0 34.2 34.4 34.6 34.3 34.7 34.9 35.1 35.3 35.0
Source: Company filings, JPMorgan estimates

38
North America Equity Research 09 March 2011
Paul Coster, CFA (1-212) 622-6425 [email protected]
Figure 15: Balance Sheet FY09A FY10A 1Q 11E 2Q 11E 3Q 11E 4Q 11E FY11E 1Q 12E 2Q 12E 3Q 12E 4Q 12E FY12E
Cash and cash equivalents 51.74 102.52 104.99 120.35 130.65 149.06 149.06 161.85 182.22 196.61 218.59 218.59Short-term investments 0.00 0.00 0.00 0.00 0.00 0.00 0.00 0.00 0.00 0.00 0.00 0.00Accounts receivable, net 5.11 7.99 17.93 30.85 20.30 34.33 34.33 22.68 37.68 25.24 40.24 40.24Prepaid expenses and other current assets 1.08 1.68 2.19 2.92 2.34 3.14 3.14 2.57 3.44 2.82 3.68 3.68
Total current assets 57.93 112.18 125.10 154.12 153.29 186.52 186.52 187.10 223.34 224.66 262.51 262.51Property and equipment, net 0.16 0.14 0.15 0.16 0.18 0.20 0.20 0.22 0.24 0.26 0.29 0.29Patents, net of accumulated depreciation 17.51 19.80 22.00 24.17 26.33 28.47 28.47 30.92 33.36 35.77 38.16 38.16Investments - noncurrent 2.15 2.00 2.00 2.00 2.00 2.00 2.00 2.00 2.00 2.00 2.00 2.00Other assets, net 0.51 0.66 0.66 0.66 0.66 0.66 0.66 0.66 0.66 0.66 0.66 0.66
Total assets 78.26 134.78 149.91 181.12 182.47 217.85 217.85 220.91 259.60 263.36 303.62 303.62Accounts payable 8.01 7.10 10.63 15.75 11.60 17.15 17.15 13.01 18.95 14.38 20.32 20.32Royalties and contingent legal fees payable 12.40 12.76 16.62 22.19 17.79 23.83 23.83 19.55 26.12 21.39 27.98 27.98
Total current l iabilities 21.92 19.86 27.26 37.95 29.39 40.98 40.98 32.56 45.07 35.78 48.30 48.30Other long-term liabilities 0.37 1.07 1.07 1.07 1.07 1.07 1.07 1.07 1.07 1.07 1.07 1.07
Total Liabilities 22.29 20.93 28.33 39.02 30.46 42.05 42.05 33.63 46.14 36.85 49.37 49.37Common stock 0.03 0.04 0.04 0.04 0.04 0.04 0.04 0.04 0.04 0.04 0.04 0.04Additional paid-in capital 173.67 197.03 198.73 200.43 202.13 203.83 203.83 205.70 207.57 209.44 211.31 211.31Accumulated deficit (120.24) (86.19) (80.16) (61.34) (53.14) (31.04) (31.04) (21.44) 2.88 14.06 39.93 39.93
Total stockholders' equity 53.46 110.87 118.60 139.12 149.03 172.82 172.82 184.30 210.48 223.53 251.27 251.27Non-controlling interests in operating subsidiaries 2.51 2.98 2.98 2.98 2.98 2.98 2.98 2.98 2.98 2.98 2.98 2.98
Total l iabilities and stockholders' equity 78.26 134.78 149.91 181.12 182.47 217.85 217.85 220.91 259.60 263.36 303.62 303.62 Source: Company filings, JPMorgan estimates

39
North America Equity Research 09 March 2011
Paul Coster, CFA (1-212) 622-6425 [email protected]
Figure 16: Cash Flow Statement FY09A FY10A 1Q 11E 2Q 11E 3Q 11E 4Q 11E FY11E 1Q 12E 2Q 12E 3Q 12E 4Q 12E FY12E
Net Profit (loss) from continuing operations (5.63) 37.01 6.03 18.82 8.21 22.09 55.15 9.61 24.31 11.18 25.87 70.97Net cash provided by operating activities:Depreciation and amortization 4.76 7.02 1.79 1.81 1.83 1.84 7.27 2.03 2.05 2.06 2.08 8.22Non-cash stock based compensation 7.07 7.12 1.70 1.70 1.70 1.70 6.80 1.87 1.87 1.87 1.87 7.48Gain on investments, other 0.05 (0.03) 0.00 0.00Changes in assets and liabilities:Accounts receivable 2.33 (2.88) (9.94) (12.93) 10.55 (14.02) (26.34) 11.65 (15.00) 12.44 (15.00) (5.91)Prepaid expenses and other assets (0.11) (0.76) (0.51) (0.73) 0.58 (0.79) (1.46) 0.56 (0.86) 0.62 (0.87) (0.55)Accounts payable and accured expenses 4.86 (1.41) 3.54 5.12 (4.16) 5.55 10.05 (4.14) 5.94 (4.57) 5.94 3.17Royalties and contingent legal fees payable 1.63 0.36 3.86 5.57 (4.40) 6.04 11.07 (4.28) 6.57 (4.72) 6.58 4.15Deferred revenues 1.17 (1.51) 0.00 0.00 0.00 0.00 0.00 0.00 0.00 0.00 0.00 0.00
NET CASH PRO VIDED BY O PERATING ACTIV 16.12 44.92 6.48 19.36 14.30 22.41 62.55 17.29 24.87 18.88 26.48 87.53Purchases of property and equipment (0.07) (0.06) 0.00 0.00 0.00 0.00 0.00 0.00 0.00 0.00 0.00 0.00Sale of available-for-sale investments 1.04 0.18Patent acquisition costs (9.63) (8.22) (4.00) (4.00) (4.00) (4.00) (16.00) (4.50) (4.50) (4.50) (4.50) (18.00)
NET CASH USED IN INVESTING ACTIVITIES (8.65) (8.10) (4.00) (4.00) (4.00) (4.00) (16.00) (4.50) (4.50) (4.50) (4.50) (18.00)Distributions to noncontrolling interests in operating (3.15) (4.81) 0.00 0.00Contributions from noncontrolling interests in operat 0.00 2.39 0.00 0.00Repurchased restricted common stock (1.11) 0.00Proceeds from the exercise of stock options 0.25 16.37
NET CASH PRO VIDED BY (USED IN) FINANCIN (4.01) 13.96 0.00 0.00 0.00 0.00 0.00 0.00 0.00 0.00 0.00 0.00Change in cash and cash equivalents 3.46 50.78 2.48 15.36 10.30 18.41 46.55 12.79 20.37 14.38 21.98 69.53Free Cash Flows 16.05 44.86 6.48 19.36 14.30 22.41 62.55 17.29 24.87 18.88 26.48 87.53
Source: Company filings, JPMorgan estimates

40
North America Equity Research 09 March 2011
Paul Coster, CFA (1-212) 622-6425 [email protected]
Acacia Research Corp.: Summary Of Financials
Income Statement - Annual FY10A FY11E FY12E FY13E Income Statement - Quarterly 1Q11E 2Q11E 3Q11E 4Q11E Revenues 132 170 206 - Revenues 29 51 33 56Cost of products sold 66 82 100 - Cost of products sold 16 24 17 26Gross profit 66 87 107 - Gross profit 14 27 16 31 SG&A 25 26 28 - SG&A 6 6 6 7R&D 2 4 4 - R&D 1 1 1 1Stock based comp. 7 7 7 - Stock based comp. 2 2 2 2Non-cash charges - - - - Non-cash charges - - - -Operating Income 39 58 74 - Operating Income 6 20 9 23
EBITDA 53 72 90 - EBITDA 10 23 12 27
Other income / (expense) - - - - Other income / (expense) - - - -Pre-tax income 39 58 75 - Pre-tax income 6 20 9 23
Income taxes 2 3 4 - Income taxes 0 1 0 1Net income - GAAP 39 58 75 - Net income - GAAP 6 20 9 23Net income PF 46 64 81 - Net income PF 8 21 10 25 Diluted shares outstanding 34 34 35 - Diluted shares outstanding 34 34 34 35
EPS - GAAP 0.98 1.65 2.07 - EPS - GAAP 0.19 0.56 0.25 0.65EPS PF 1.18 1.84 2.27 - EPS PF 0.24 0.61 0.30 0.70
Balance Sheet and Cash Flow Data FY10A FY11E FY12E FY13E Ratio Analysis FY10A FY11E FY12E FY13E Cash and cash equivalents 103 149 219 - Sales growth 95.8% 28.7% 21.7% -Accounts receivable 8 34 40 - EBIT growth 3,314.5% 41.3% 26.6% -Inventories - - - - EPS growth (840.7%) 55.2% 23.2% -Other current assets 2 3 4 - Current assets 112 187 263 - Gross margin 49.9% 51.4% 51.7% -PP&E 0 0 0 - EBIT margin 34.7% 38.1% 39.6% -Long-term portfolio investments 2 2 2 - EBITDA margin 40.0% 42.4% 43.6% -Goodwill and intangibles 20 28 38 - Tax rate 4.4% 5.0% 5.0% -Total assets 135 218 304 - Net margin 34.6% 38.0% 39.4% -
Accounts payable 7 17 20 - Debt / EBITDA - - - -Deferred revenues 0 0 0 - Debt / Capital (book) - - - -Total debt - - - - Total liabilities 21 42 49 - Return on assets (ROA) 42.8% 36.5% 31.2% -Shareholders' equity 111 173 251 - Return on equity (ROE) 55.5% 45.4% 38.4% - Return on invested capital (ROIC) 156.2% 99.3% 100.6% -Net Income (including charges) 37 55 71 - D&A 7 7 8 - Enterprise value / Sales 5.8 4.2 3.1 -Change in Working Capital (6) (7) 1 - Enterprise value / EBITDA - - - -Other - - - - Free cash flow yield 5.3% 7.2% 9.8% -Cash flow from operations 45 63 88 - P/E 33.9 20.1 16.0 - Capex 0 0 0 - Free cash flow 45 63 88 -
Cash flow from investing activities (8) (16) (18) - Cash flow from financing activities 14 0 0 - Dividends - - - - Dividend yield - - - - Source: Company reports and J.P. Morgan estimates. Note: $ in millions (except per-share data). Fiscal year ends Dec

41
North America Equity Research 09 March 2011
Paul Coster, CFA (1-212) 622-6425 [email protected]
Analyst Certification: The research analyst(s) denoted by an “AC” on the cover of this report certifies (or, where multiple research analysts are primarily responsible for this report, the research analyst denoted by an “AC” on the cover or within the document individually certifies, with respect to each security or issuer that the research analyst covers in this research) that: (1) all of the views expressed in this report accurately reflect his or her personal views about any and all of the subject securities or issuers; and (2) no part of any of the research analyst’s compensation was, is, or will be directly or indirectly related to the specific recommendations or views expressed by the research analyst(s) in this report.
Important Disclosures
Important Disclosures for Equity Research Compendium Reports: Important disclosures, including price charts for all companies under coverage for at least one year, are available through the search function on J.P. Morgan’s website https://mm.jpmorgan.com/disclosures/company or by calling this U.S. toll-free number (1-800-477-0406)
0
14
28
42
56
Price($)
Mar08
Jun08
Sep08
Dec08
Mar09
Jun09
Sep09
Dec09
Mar10
Jun10
Sep10
Dec10
Mar11
Acacia Research Corp. (ACTG) Price Chart
Source: Bloomberg and J.P. Morgan; price data adjusted for stock splits and dividends.This chart shows J.P. Morgan's continuing coverage of this stock; the current analyst may or may not have covered itover the entire period.J.P. Morgan ratings: OW = Overweight, N = Neutral, UW = Underweight.
Explanation of Equity Research Ratings and Analyst(s) Coverage Universe: J.P. Morgan uses the following rating system: Overweight [Over the next six to twelve months, we expect this stock will outperform the average total return of the stocks in the analyst’s (or the analyst’s team’s) coverage universe.] Neutral [Over the next six to twelve months, we expect this stock will perform in line with the average total return of the stocks in the analyst’s (or the analyst’s team’s) coverage universe.] Underweight [Over the next six to twelve months, we expect this stock will underperform the average total return of the stocks in the analyst’s (or the analyst’s team’s) coverage universe.] J.P. Morgan Cazenove’s UK Small/Mid-Cap dedicated research analysts use the same rating categories; however, each stock’s expected total return is compared to the expected total return of the FTSE All Share Index, not to those analysts’ coverage universe. A list of these analysts is available on request. The analyst or analyst’s team’s coverage universe is the sector and/or country shown on the cover of each publication. See below for the specific stocks in the certifying analyst(s) coverage universe.
Coverage Universe: Paul Coster, CFA: Avid Technology (AVID), Coinstar Inc. (CSTR), Comverge, Inc. (COMV), Cubic Corp (CUB), DTS, Inc. (DTSI), Diebold, Incorporated (DBD), DigitalGlobe, Inc. (DGI), Dolby Laboratories, Inc. (DLB), ESCO Technologies Inc. (ESE), Echelon Corporation (ELON), Elster Group SE (ELT), EnerNOC Inc. (ENOC), FLIR Systems Inc (FLIR), Garmin Ltd. (GRMN), GeoEye, Inc. (GEOY), Itron, Inc (ITRI), Ituran Location and Control (ITRN), L-1 Identity Solutions (ID), LoJack Corp (LOJN), Logitech International (LOGI), NCR Corporation (NCR), Nice Systems (NICE), Novatel Wireless (NVTL), OmniVision Technologies (OVTI), Plantronics Inc (PLT), RealD Inc. (RLD), Sierra Wireless Inc. (SWIR), Synaptics Inc. (SYNA), TASER International Inc. (TASR), TeleCommunication Systems, Inc.

42
North America Equity Research 09 March 2011
Paul Coster, CFA (1-212) 622-6425 [email protected]
(TSYS), TeleNav, Inc. (TNAV), Trimble Navigation (TRMB), Verint Systems, Inc. (VRNT), Zebra Technologies (ZBRA), Zoran Corp (ZRAN), iRobot Corporation (IRBT)
J.P. Morgan Equity Research Ratings Distribution, as of December 31, 2010
Overweight (buy)
Neutral (hold)
Underweight (sell)
J.P. Morgan Global Equity Research Coverage 46% 42% 12% IB clients* 53% 50% 38% JPMS Equity Research Coverage 43% 49% 8% IB clients* 71% 63% 59%
*Percentage of investment banking clients in each rating category. For purposes only of FINRA/NYSE ratings distribution rules, our Overweight rating falls into a buy rating category; our Neutral rating falls into a hold rating category; and our Underweight rating falls into a sell rating category.
Valuation and Risks: Please see the most recent company-specific research report for an analysis of valuation methodology and risks on any securities recommended herein. Research is available at http://www.morganmarkets.com , or you can contact the analyst named on the front of this note or your J.P. Morgan representative.
Analysts’ Compensation: The equity research analysts responsible for the preparation of this report receive compensation based upon various factors, including the quality and accuracy of research, client feedback, competitive factors, and overall firm revenues, which include revenues from, among other business units, Institutional Equities and Investment Banking.
Other Disclosures
J.P. Morgan ("JPM") is the global brand name for J.P. Morgan Securities LLC ("JPMS") and its affiliates worldwide. J.P. Morgan Cazenove is a marketing name for the U.K. investment banking businesses and EMEA cash equities and equity research businesses of JPMorgan Chase & Co. and its subsidiaries.
Options related research: If the information contained herein regards options related research, such information is available only to persons who have received the proper option risk disclosure documents. For a copy of the Option Clearing Corporation’s Characteristics and Risks of Standardized Options, please contact your J.P. Morgan Representative or visit the OCC’s website at http://www.optionsclearing.com/publications/risks/riskstoc.pdf.
Legal Entities Disclosures U.S.: JPMS is a member of NYSE, FINRA and SIPC. J.P. Morgan Futures Inc. is a member of the NFA. JPMorgan Chase Bank, N.A. is a member of FDIC and is authorized and regulated in the UK by the Financial Services Authority. U.K.: J.P. Morgan Securities Ltd. (JPMSL) is a member of the London Stock Exchange and is authorized and regulated by the Financial Services Authority. Registered in England & Wales No. 2711006. Registered Office 125 London Wall, London EC2Y 5AJ. South Africa: J.P. Morgan Equities Limited is a member of the Johannesburg Securities Exchange and is regulated by the FSB. Hong Kong: J.P. Morgan Securities (Asia Pacific) Limited (CE number AAJ321) is regulated by the Hong Kong Monetary Authority and the Securities and Futures Commission in Hong Kong. Korea: J.P. Morgan Securities (Far East) Ltd, Seoul Branch, is regulated by the Korea Financial Supervisory Service. Australia: J.P. Morgan Australia Limited (ABN 52 002 888 011/AFS Licence No: 238188) is regulated by ASIC and J.P. Morgan Securities Australia Limited (ABN 61 003 245 234/AFS Licence No: 238066) is a Market Participant with the ASX and regulated by ASIC. Taiwan: J.P.Morgan Securities (Taiwan) Limited is a participant of the Taiwan Stock Exchange (company-type) and regulated by the Taiwan Securities and Futures Bureau. India: J.P. Morgan India Private Limited, having its registered office at J.P. Morgan Tower, Off. C.S.T. Road, Kalina, Santacruz East, Mumbai - 400098, is a member of the National Stock Exchange of India Limited (SEBI Registration Number - INB 230675231/INF 230675231/INE 230675231) and Bombay Stock Exchange Limited (SEBI Registration Number - INB010675237/INB010675237) and is regulated by Securities and Exchange Board of India. Thailand: JPMorgan Securities (Thailand) Limited is a member of the Stock Exchange of Thailand and is regulated by the Ministry of Finance and the Securities and Exchange Commission. Indonesia: PT J.P. Morgan Securities Indonesia is a member of the Indonesia Stock Exchange and is regulated by the BAPEPAM LK. Philippines: J.P. Morgan Securities Philippines Inc. is a member of the Philippine Stock Exchange and is regulated by the Securities and Exchange Commission. Brazil: Banco J.P. Morgan S.A. is regulated by the Comissao de Valores Mobiliarios (CVM) and by the Central Bank of Brazil. Mexico: J.P. Morgan Casa de Bolsa, S.A. de C.V., J.P. Morgan Grupo Financiero is a member of the Mexican Stock Exchange and authorized to act as a broker dealer by the National Banking and Securities Exchange Commission. Singapore: This material is issued and distributed in Singapore by J.P. Morgan Securities Singapore Private Limited (JPMSS) [MICA (P) 025/01/2011 and Co. Reg. No.: 199405335R] which is a member of the Singapore Exchange Securities Trading Limited and is regulated by the Monetary Authority of Singapore (MAS) and/or JPMorgan Chase Bank, N.A., Singapore branch (JPMCB Singapore) which is regulated by the MAS. Malaysia: This material is issued and distributed in Malaysia by JPMorgan Securities (Malaysia) Sdn Bhd (18146-X) which is a Participating Organization of Bursa Malaysia Berhad and a holder of Capital Markets Services License issued by the Securities Commission in Malaysia. Pakistan: J. P. Morgan Pakistan Broking (Pvt.) Ltd is a member of the Karachi Stock Exchange and regulated by the Securities and Exchange Commission of Pakistan. Saudi Arabia: J.P. Morgan Saudi Arabia Ltd. is authorized by the Capital Market Authority of the Kingdom of Saudi Arabia (CMA) to carry out

43
North America Equity Research 09 March 2011
Paul Coster, CFA (1-212) 622-6425 [email protected]
dealing as an agent, arranging, advising and custody, with respect to securities business under licence number 35-07079 and its registered address is at 8th Floor, Al-Faisaliyah Tower, King Fahad Road, P.O. Box 51907, Riyadh 11553, Kingdom of Saudi Arabia. Dubai: JPMorgan Chase Bank, N.A., Dubai Branch is regulated by the Dubai Financial Services Authority (DFSA) and its registered address is Dubai International Financial Centre - Building 3, Level 7, PO Box 506551, Dubai, UAE.
Country and Region Specific Disclosures U.K. and European Economic Area (EEA): Unless specified to the contrary, issued and approved for distribution in the U.K. and the EEA by JPMSL. Investment research issued by JPMSL has been prepared in accordance with JPMSL's policies for managing conflicts of interest arising as a result of publication and distribution of investment research. Many European regulators require a firm to establish, implement and maintain such a policy. This report has been issued in the U.K. only to persons of a kind described in Article 19 (5), 38, 47 and 49 of the Financial Services and Markets Act 2000 (Financial Promotion) Order 2005 (all such persons being referred to as "relevant persons"). This document must not be acted on or relied on by persons who are not relevant persons. Any investment or investment activity to which this document relates is only available to relevant persons and will be engaged in only with relevant persons. In other EEA countries, the report has been issued to persons regarded as professional investors (or equivalent) in their home jurisdiction. Australia: This material is issued and distributed by JPMSAL in Australia to “wholesale clients” only. JPMSAL does not issue or distribute this material to “retail clients.” The recipient of this material must not distribute it to any third party or outside Australia without the prior written consent of JPMSAL. For the purposes of this paragraph the terms “wholesale client” and “retail client” have the meanings given to them in section 761G of the Corporations Act 2001. Germany: This material is distributed in Germany by J.P. Morgan Securities Ltd., Frankfurt Branch and J.P.Morgan Chase Bank, N.A., Frankfurt Branch which are regulated by the Bundesanstalt für Finanzdienstleistungsaufsicht. Hong Kong: The 1% ownership disclosure as of the previous month end satisfies the requirements under Paragraph 16.5(a) of the Hong Kong Code of Conduct for Persons Licensed by or Registered with the Securities and Futures Commission. (For research published within the first ten days of the month, the disclosure may be based on the month end data from two months’ prior.) J.P. Morgan Broking (Hong Kong) Limited is the liquidity provider/market maker for derivative warrants, callable bull bear contracts and stock options listed on the Stock Exchange of Hong Kong Limited. An updated list can be found on HKEx website: http://www.hkex.com.hk. Japan: There is a risk that a loss may occur due to a change in the price of the shares in the case of share trading, and that a loss may occur due to the exchange rate in the case of foreign share trading. In the case of share trading, JPMorgan Securities Japan Co., Ltd., will be receiving a brokerage fee and consumption tax (shouhizei) calculated by multiplying the executed price by the commission rate which was individually agreed between JPMorgan Securities Japan Co., Ltd., and the customer in advance. Financial Instruments Firms: JPMorgan Securities Japan Co., Ltd., Kanto Local Finance Bureau (kinsho) No. 82 Participating Association / Japan Securities Dealers Association, The Financial Futures Association of Japan. Korea: This report may have been edited or contributed to from time to time by affiliates of J.P. Morgan Securities (Far East) Ltd, Seoul Branch. Singapore: JPMSS and/or its affiliates may have a holding in any of the securities discussed in this report; for securities where the holding is 1% or greater, the specific holding is disclosed in the Important Disclosures section above. India: For private circulation only, not for sale. Pakistan: For private circulation only, not for sale. New Zealand: This material is issued and distributed by JPMSAL in New Zealand only to persons whose principal business is the investment of money or who, in the course of and for the purposes of their business, habitually invest money. JPMSAL does not issue or distribute this material to members of "the public" as determined in accordance with section 3 of the Securities Act 1978. The recipient of this material must not distribute it to any third party or outside New Zealand without the prior written consent of JPMSAL. Canada: The information contained herein is not, and under no circumstances is to be construed as, a prospectus, an advertisement, a public offering, an offer to sell securities described herein, or solicitation of an offer to buy securities described herein, in Canada or any province or territory thereof. Any offer or sale of the securities described herein in Canada will be made only under an exemption from the requirements to file a prospectus with the relevant Canadian securities regulators and only by a dealer properly registered under applicable securities laws or, alternatively, pursuant to an exemption from the dealer registration requirement in the relevant province or territory of Canada in which such offer or sale is made. The information contained herein is under no circumstances to be construed as investment advice in any province or territory of Canada and is not tailored to the needs of the recipient. To the extent that the information contained herein references securities of an issuer incorporated, formed or created under the laws of Canada or a province or territory of Canada, any trades in such securities must be conducted through a dealer registered in Canada. No securities commission or similar regulatory authority in Canada has reviewed or in any way passed judgment upon these materials, the information contained herein or the merits of the securities described herein, and any representation to the contrary is an offence. Dubai: This report has been issued to persons regarded as professional clients as defined under the DFSA rules.
General: Additional information is available upon request. Information has been obtained from sources believed to be reliable but JPMorgan Chase & Co. or its affiliates and/or subsidiaries (collectively J.P. Morgan) do not warrant its completeness or accuracy except with respect to any disclosures relative to JPMS and/or its affiliates and the analyst’s involvement with the issuer that is the subject of the research. All pricing is as of the close of market for the securities discussed, unless otherwise stated. Opinions and estimates constitute our judgment as of the date of this material and are subject to change without notice. Past performance is not indicative of future results. This material is not intended as an offer or solicitation for the purchase or sale of any financial instrument. The opinions and recommendations herein do not take into account individual client circumstances, objectives, or needs and are not intended as recommendations of particular securities, financial instruments or strategies to particular clients. The recipient of this report must make its own independent decisions regarding any securities or financial instruments mentioned herein. JPMS distributes in the U.S. research published by non-U.S. affiliates and accepts responsibility for its contents. Periodic updates may be provided on companies/industries based on company specific developments or announcements, market conditions or any other publicly available information. Clients should contact analysts and execute transactions through a J.P. Morgan subsidiary or affiliate in their home jurisdiction unless governing law permits otherwise.
“Other Disclosures” last revised January 8, 2011.

44
North America Equity Research 09 March 2011
Paul Coster, CFA (1-212) 622-6425 [email protected]
Copyright 2011 JPMorgan Chase & Co. All rights reserved. This report or any portion hereof may not be reprinted, sold or redistributed without the written consent of J.P. Morgan.#$J&098$#*P