ac00207a014
-
Upload
jesse-nguyen -
Category
Documents
-
view
214 -
download
0
Transcript of ac00207a014
8/11/2019 ac00207a014
http://slidepdf.com/reader/full/ac00207a014 1/6
a40 Anal. Chem. 1990, 62, 40-845
(28) Taylor, M. D.: Carter, C. P.: Wynter, C. I . J . I no rg . Nuc l . Chem.1968, 30, 1503.
(29) Baba, H.; Kitamura, M. . Mol. Spechosc . 1972, 4 1 , 302.
S. ., Ed.: Wiley: New York, 1984; Vol 31, p 1(33) Marcus, Y. J . Solution Chem. 1984, 13 599.
(30) Sinha, S . P. In Systematics and Properties of the Lanthanides; D.Reidei Publishing: Dordrecht. 1983; p 451.
(31) Tran, C. D. Ana l . Chem. 1988, 6 0 , 182.(32) Horrocks, W . D.; Albin, M . Progress in Inorganic Chemist ry; Lippard,
RECEIVEDor review October 12, 1989. Accepted Janu ary 19,1990.
Influence of Small Amounts of Organic Solvents in AqueousSamples on Argon Inductively Coupled Plasma Spectrometry
John W. Oles ik* and Alvin W. Moore , J r.
DeDartment of Chemistrv. Venable and Ke na n Laboratories CB 3290, Universi ty of No rth CarolinaChhpel Hill, or th Caro iina 27599-3290
The presence of organlc solvents In aqueous samples Inconcentratlons as low as 0.1 % by volume had a large effecton emlsslon and fluo rescen ce signals. Both atom and Ionemission slgnals were depressed when or gan k solvents werepresent. I n contrast, Sr I 1 fluorescence Intensities wereenhanced by up o a factor of 3.5 when the sample contalned2 % (v /v ) organic solvent. More Ioqs were produced whenthe sample contalned organic solvent. How ever, the fractionsof atoms and Ions that were exclted and emitted llght de-creased. Ar and +I mlsslon lntensltles can be used as dl-agnostk signals to warn the uperator when plasma condnlonshave changed due to the presence of organlc s olvents.
Th e introduction of organic solvents into an argon ind uc-tively coupled plasma is known to affect excitation conditionsand m aximum aspiration rates for a stable plasma(1-5) . Ifthe sample contains mixtures of organic solvents, matrixmatching of the samples and calibration stand ards or internalstanda rdization is necessary(6).
Organic solvents mixed with water ap pearto have less effecton plasma stability than p ure organic solvents. For example,1 5 metha nol/25 water mixtures can be introduced intothe plasma with uptake rates of up to3 mL/min while themaximum pure methanol uptak e rate was 0.1 mL /min (2,7).
However, variations in th e concentration of organic solventsas low as 0.08 by volume can have a significant effect onemission intensities (8, 9). There fore, errors may occur ifsamples t ha t contain organic solvents are analyzed by usingaqueous calibration standards.
Th e presence of organic solvents can affect th e nebulizationprocess ( I O ) , he aerosol mass transport ra te I, 2,10, ]I), andth e vapor mass loading (2, 12-14). Neb ulizati on of organicsolvents generally produces a droplet distribution with asmaller mean droplet diameter than for water(10). Manyorganic solvents have high evaporation rates I , 3). As a resultof eithe r or both of these factors, sample mass tran spo rt ef-ficiency is enhanc ed in comp arison to aqueous sam ples.
Th e introductionof organics into th e argon plasma generallycauses a reduction in both excitation temperatures andelectron num ber densities. Blades and Caughlin 3) andBoumans an d Lux-Steiner reported( 4 ) ha t a 500-W increasein power was necessary t o match excitation conditions withorganic solvent introduction to those when aqueous sampleswere introduced. Th e extra power required for organic specieshas been suggested to be du e to changes in the enth alpy of
0003-2700/90/0362-0840 02.50/0
Table I . Instrumentation and Experimental Parameters
power supply
impedance matcherincident powergasouter gas flow rateintermediate gasflow ratecentral gas flow ratetorch
nebulizerspray chambersample pumpsample uptake ratesample Concentration
spectrometerentrance slit width
detector
laser
laser dyesspectral lines
Plasma Therm 2500W,27.12 MHz(HFP-2500D)
Plasma Therm (AMNPS-1)1.0 kWAr10.0 L/min0.9 L/min0.9 L/minPlasma Therm Low Flow (Precision
Glass Blowing of Colorado)Meinhard concentric, TR-30-A3Scott type double barrelPeristalt ic (Gilson Minipuls 3)1.1 mL/min50 ppm Sr as SrC03 n distilled
deionized water or mixturesofwater and acetone, acetonitrile, orethanol,0.1 , 0.4 , L O , or2.0 by volume
McPherson Model 2016B with 3600g/mm holographic grating100 pm for emission500 pm for fluorescenceEG& G Princeton Applied Research
Corp. OMA I11 with Model 1420intensified diode array and Model1211 high voltage pulser
Molectron UV-400 nitrogen laser,Molectron DL-300 dye laser
bis-MSB (Sr 111, Coumarin 460 (Sr I)Sr I , 460.73nmSr 11, 421.55 nm
th e carrier gas 4), nergy consumed for atomization of theorganic species, or variations in the thermal 4) r electricalconductivity (15) . The plasma impedance has been reportedto increase when organic solvent is introduced(16).
Here we report investigation of the effect of organic solventspresen t in concentrations less th an 2 by volume. A com-bination of emission and fluorescence measurem ents was usedto sepa rate changes in emission intensity d ue to excitationeffects from those caused by changes in atom or ion numb erdensities.
EXPERIMENTAL SECTIONExperimental parameters and instrumentation for measurement
of Sr I1 and Sr I em ission and fluorescence signals are listed inTable I.
The optical system used to acquire lateral emission andfluorescence images was described previously(I 7). Abel inversionwas performed on laterally resolved emission dat a using the al-
990 American Chemical Society

8/11/2019 ac00207a014
http://slidepdf.com/reader/full/ac00207a014 2/6
ANALYTICAL CHEMISTRY. VOL. 62, NO. 8, APRIL 15. 1990 841
0 5 70 75 2 0 25
Heigh t fmm ALCl
No Ace MeCNE tOH Ace MeCNEtO H
Organic 0 . 7 % 7.0%Flgure 1. Change in Sr 11 emission intensity14 mm above the loadwii when organicsoivem are present at a concentrationof 0.1% x
1.0% by voiume: Ace, ace tone; MeCN. acetonitrile;EtOH. ethanol.
gorithm of Cremers and Birkebak 18).Vertical emission profiles were acquired by using a sing le2 in.
diameter, 25 cm focal length, fused silica lens to form a n imagenear the entrance slit of the sp ectrome ter with a magnificationof 0.38. A 1 in. diameter a per tur e was used for Sr I1 measure-ments. Exposure times of16.6 and 64 ms were used for S r I1 and
Sr I measurements, respectively. Signals from100 exposures wereadded.
RESULTS AND DISCUSSIONTh e presence of 0.1 (v/v) acetone or acetonitrile produced
a 15 decrease in S r I1 emission intensity in the normalanalytical zone of th e plasma (Fig ure1 . In contrast , thepresence of 0.1 ethanol in water decreases th e S r I1 emissionintensity by only3 . When th e concentration of each of thethree organic solventsis increased to 190, arge decrea ses inS r 11 emission intensity are observed (Figure1 . Of the threesolvents ethanol produces the least severe depression inemission intensities.
Organic solvents generally have higher mass t ransp ort ratestha n water ( I ,2 , J 0 , l l ) . Increases in aqueou s aerosol mass
transpo rt ra te in inductively coupled plasma emission spec-trom etry decrease th e emission intensi ty per mass of analy teaerosol entering the plasm a (responsivity)19,20) . Th e re-sponsivity decreases most dram atically lowin the plasma. I tis likely that this is due to an increase in the number ofdesolvating droplet sl ow in the plasma 20, 21). Th e peakemission intensity also moved higher in th e plasma w hen theaerosol mass transp ort ra te was increased.
When the concentration of acetonitrile in the aqueoussample was increased, the peak S r I1 and S rI emission in-tensity moved downward in the plasma (Figure2). T h epresence of ethanol or acetone caus ed similar downward shifts.Th e shift was more pronounced for atom emission t han ionemission. Depressions in th e SrI1 emission intensity in th epresence of acetonitrile or acetone were mo re severe as t he
observation zoneis moved higher in the p lasma (Figure3).In contrast, increased mass transport of aqueous aerosolproduced larger depressions in emission resoonsivitv low inthe plasma (50). .
T h e effect of equal volume fractions of ethanol was differentf rom tha t of acetonitrile an d acetone. Th e Sr I1 emissionintensity was depressed by 38 a t 9 mm above th e load coil(ALC), 56 a t 14 mm ALC, and 68 at 19 mm ALC in th epresence 1.0 acetone. Th e magnitude of th eSr I1 emissionintensity depression dueto acetone was similarat 9 mm ALC,14 mm ALC, and 19 mm ALC. One percent ethanol byvolume depressed th e S r I1 emission intensity by30 t o 33between 9 mm ALC and 1 9 mm ALC. Th e severity of thedecrease in Sr I emission in the presence of each of th e organic
Heigh t Imm ALCl
Flgure 2. Intensity versusheight in the plasma: (a ) Sr I1 emission,(b) Sr I emission; wncentrationo f acetonitrileby volume. 0 (-)0.1 (--), 0.4 (---), 1.0 (---)and2.0 (...).
::pz; :~~,s 75
I ts * 25
50 50 j
&
h o 0 ~
0.0 0.5 7.0 r.5 s.0 0.0 0.5 l o I5 P O
I ,.ma I , , le I , ,
C d
0.0 0.8 ,.a r. P O 0.0 0,s I . 0 I S L O
x * w m c I s( *,S b I
Figure 3. Changes in Sr 11 emission intensity as the concentrationo f organic solventin the sample was changed: (a) 6 mm above theload coil, (b) 9 mm above the load coil, (c)14 mm above the load coil,(d) 19 mm above th Imd coil; 3 cetonible,( 0 ) cetone. A) thanol.
solventswas greater at 14 mm ALC th anat 9 mm ALC (Figure4).
Long and Browner 22) observed tha t th e peak analyteintensity occurred higher in the plasma when sample wasintroduced as an aqueou s aerosol than when d ry, electroth-ermally vaporized sample was used. Th e auth ors concludedth at t he location of the peak intensity depended on the dis-tance droplets mus t travel before desolvationis complete. Theresults of Bates and Olesik (20) suppo rted thi s conclusion.
We observed a downward shift in th e location of the peakintens ity when organic solvent was adde d. If the location ofpeak emission intensity is related t o th e point where desol-vation is complete, ei ther the droplets entering the plasmaare smaller in th e presence of organics or the desolvation rateis higher.
Changes in emission intensity can result from variationsin the ion (atom ) number d ensity or changes in the fractionof ions (atoms) th at emit. Therefore, we measured b oth

8/11/2019 ac00207a014
http://slidepdf.com/reader/full/ac00207a014 3/6
842 ANALYTICAL CHEMISTRY,VOL. 62, NO. , APRIL 15, 1990
.505
2 5 i
a
h o / . ,0.0 0.5 7,O 7.5 2.0
% Organic l v / v l
i125w b
UI< 25 i
h o.0 0.5 1.0 7 . 5 2.0
% Organic f v / v l
Figure 4. Changes in Sr I emission intensity as the concen trationoforganic solvent inthe sample was changed: (a) 9 mm above the loadcoil, (b) 14 mm above the load coil:B) acetonitrile,( 0 ) cetone, (A)ethanol.
emission and fluorescence inten sities. Fluorescence wassaturated so tha t prefilter and quench ing effects were mini-mized. Th e fluorescence intensity should be propo rtiona l tothe groun d-state num ber density. If th e fraction of ions(atoms) in the ground state does not change due to thepresence of organics, the fluorescence intensity should beproportional to the total ion (atom) number density.
T h e ion num ber de nsity could change because of shifts inthe ion-atom equilibrium or variations in th e total analytenumber density. If the presence of organic solvent affectedthe nebulization and aerosol modification processes, theamount of analyte entering the plasma per second couldchange. If the point where droplet desolvation an d particlevaporization are complete moves down, the analyte numberdensity at points above this could decrease as a result ofdiffusion.
Ion-atom emission intensitie s are often used to assessplasma conditions(23-26). At both 9 mm ALC and 14 mmALC the Sr I I /Sr I emission inten sity rat io changed by lessthan 20 when the concentration of organic solvent wasvaried from 0 to 2.0 (Figure 5). Therefore, based only onthe Sr I and Sr I1 emission data, it appeared the plasmaconditions did not change drastically. Th e observed de-pressions in emission intensity might be attributed to de-creases in the am oun t of sample reaching th e plasma.
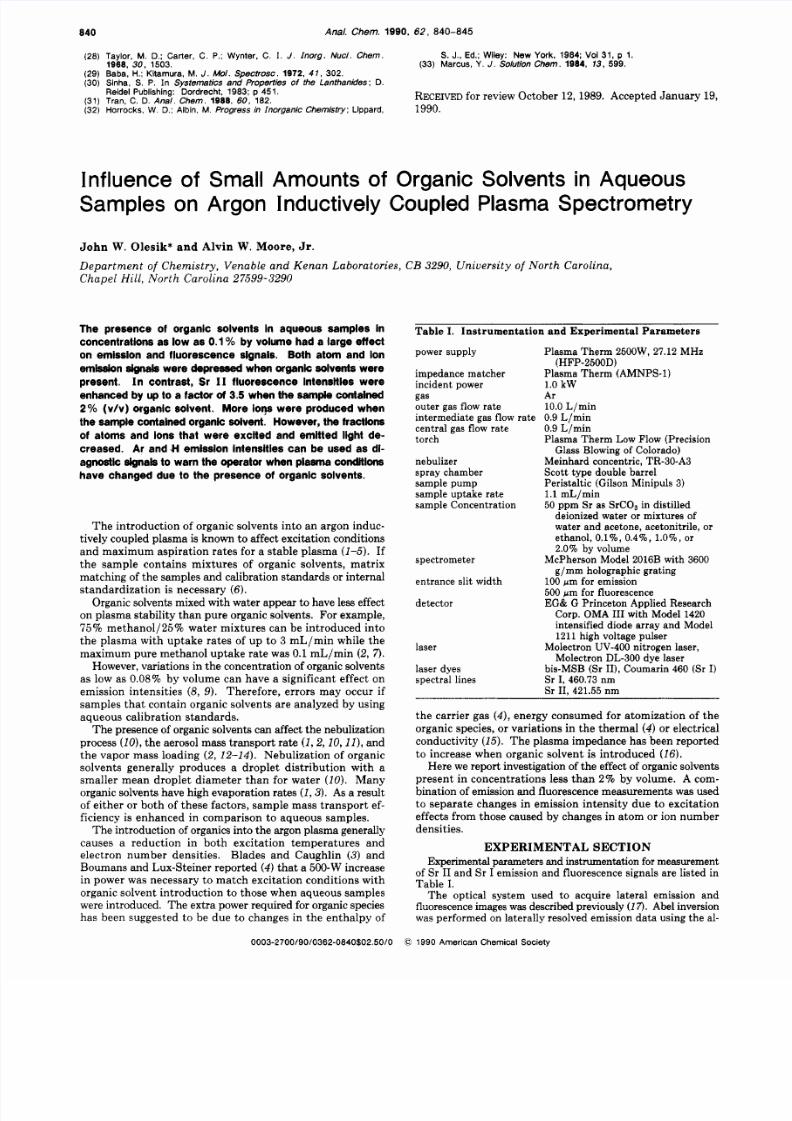
The fluorescence data show that the analyte ion numberdensity increased as organic solvent was added (Figure6).Enha ncem ents were as large as50 . Th e enhancement ofthe fluorescence intensities was larger higher in the plasma.In contrast , the Sr I fluorescence intensities decreased dra -matically when organic solvent was added (F igure7 ) .
Th e fluorescence data suggest tha t there was a shift in therelative number of ions and atoms. It appears th at there weremore ions and fewer atoms. Th e ion-to-atom fluorescenceintensity ratio increases by up to a factor of3.5 (Figure 8).However, there is an offsetting decrease in the fraction of ionsthat emit light. TheSr I1 emission intensity fell when organicsolvent was present. Sr I1 emission-to-fluorescence intensityratio (E /F ) fell by as much as a factor of5 (Figure 9a,b). At
.g 125 1 a
Ia 50
0.0 0.5 7.0 1.5 2.0
% Organic /v/vI
. 125E b
2 5 1 L0
0.0 0.5 7 . 0 7.5 2.0
% Organic v vl
F i g w e 5. Changes in relative Sr II /S rI emission intensity ratio. Theintensity values for Sr I 1 and SrI emission without organic solventwere normalized to 100: (a) 9 mm above the load coil, (b) 14 mmabove the load coil: B) acetonitrile,( 0 ) cetone, A) thanol.
a
f 60
P 4 0
b
f
'0.0 0 .5 1.0 1.5 2 0
% o r p m I / /
% o r g e m W V l % Organic /v/vl
Figure 6 . Sr I 1 luorescence (radially integrated) as the co ncentrationof organic solvent in the sample was changed: (a)6 mm above theload coil, (b) 9 m m above the load coil, (c) 14 mm abovethe load coil,(d) 19 mm above the ba d coil;(W) cetonitrile,( 0 ) cetone, A) thanol.
14 mm ALC each organic solvent caused a50 or largerdecrease in theSr I1 E / F w hen present a t a concentration of2% by volume. Among the thre e organic solvents used, eth -anol had the least severe effect on th eSr I1 E/F . The Sr IE / F decreased less in the presence of th e organic solvents thanthe Sr I1 E / F (Figure 9c). At 14 mm ALC the Sr I E / Fintensity ratio changed by less than20 in th e presence ofethanol.
Th e radially integrated data show tha t theSr atom numberdens ity decreases in th e presence of organics. Th e fractionof Sr atom s tha t is excited also falls. MoreSr ions are pro-duced when organic solvents are present. However, th efraction of Sr ions that is excited falls dramatically.
The observed behavior may be due t o a com bination ofchanges in dro plet sizeor desolvation rate, ion to atom numberdensities, and th e numb er of photons produced per atomorion. If drop lets entering the plasma are smaller, desolvation
8/11/2019 ac00207a014
http://slidepdf.com/reader/full/ac00207a014 4/6
ANALYTICAL CHEMISTRY, VOL. 62, NO.8, APRIL 15, 1990 843
0 . 0 0.5 7.0 7.5 2.0
% Organic fv/v/
725
7 00
7 5
50
2 5
b
0\
0.0 0.5 7.0 7.5 2.0
% Organic fv /v /Figure 7. Sr I fluorescence (radially integrated) as the concentrationof organic solvent in the sample was changed: (a) 9 mm abo ve theload coil, (b) 14 mm above the load coil.
4 0 0ac- 300
\ 2 0 0
Q 700
Q
*8 0
a
0.0 0.5 7.0 1.5 2.0
% Organic fv/v/
4 0 0+ 300
Q I
uk o
0.0 0.5 7.0 7.5 2.0
% Organic f v / v l
Figure 8. Relative Sr II /S r luorescence intensity ratio as thecon cen tration of organic solvent in the sample was changed: (a) 9mm above the load coil, (b) 14 m m abovethe oad coil; B) acetonitrile,(0) cetone, (A) thanol. The intensity values for SrI 1 and Sr Ifluorescence without organic solvent were normalized to 100.
should be com plete lower in th e plasma. Olesik et al.(21)showed that ion emission intensities are depressed near adesolvating water droplet while atom emission intensitiesincreased. Th is observation can only be explained by a changein the relative numb er of ions and atom s toward more atom s.Therefore, if fewer drop lets exist in the observation zone, theion/atom num ber density ratio should increase. Thi s isconsistent with the observed fluorescence behavior. Furt her,we have made initial laser light scattering measurements. Th e
0.0 0.5 1.0 7.5 2.0
% &gam0 fv/v/
O i0.0 0.5 1.0 f.5 2.0
% OrffMk fv/v/
f 2 5 C
g o0.0 0.5 7.0 f .5 2.0
% Orffanic fv/vl
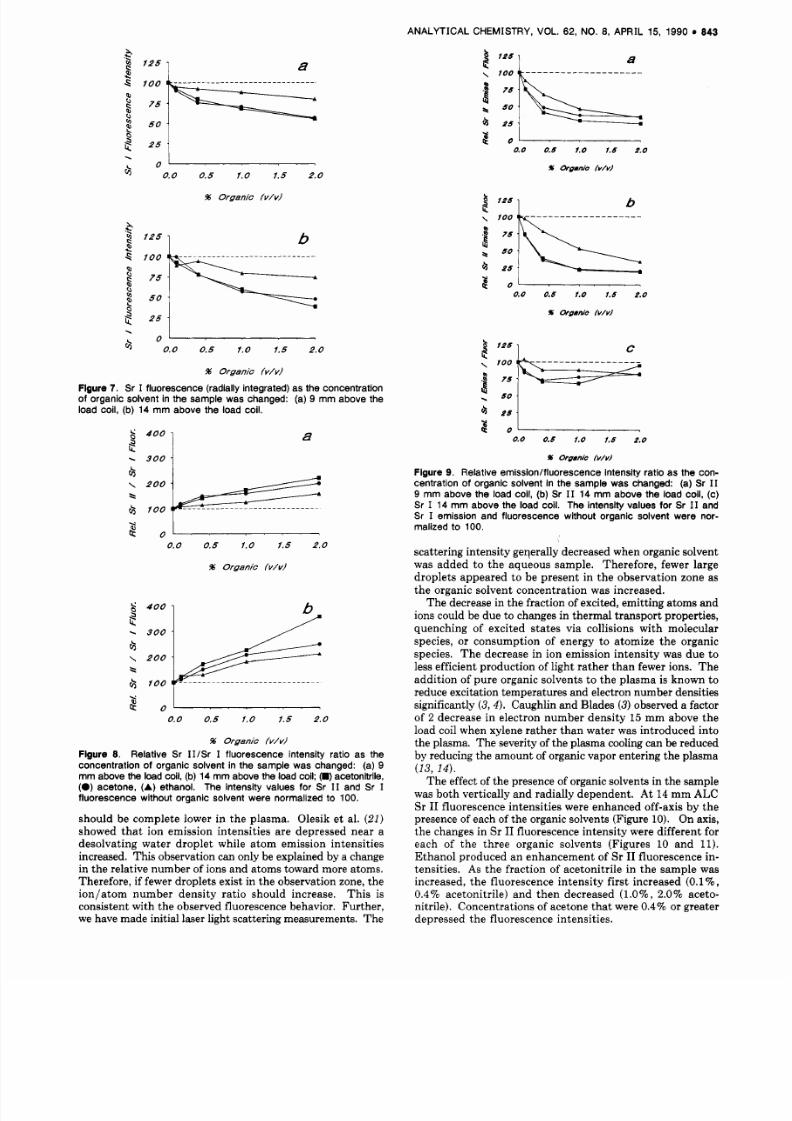
Figure 9. Relative em ission/fluorescenc e intensity ratio as the con-centra tion of organic solvent in the sample was chan ged: (a) SrI 19 m m above the load coil, (b) SrI1 14 mm above the load coil, (c)Sr I 14 mm above the load coil. The intensity values for Sr I 1 andSr I emission and fluorescence without organic solvent were nor-malized to 100.
scattering inten sity geqerally decreased w hen organic solventwas added to the aqueo us sample. Therefore, fewer largedroplets appeared to be present in the observation zone asthe organic solvent concentration was increased.
Th e decrease in the fraction of excited, emitt ing atoms andions could be due to changes in therma l trans por t properties,quenching of excited states via collisions with molecularspecies, or consump tion of energy t o atomize th e organicspecies. Th e decrease in ion emission intens ity was due toless efficient production of light rather th an fewer ions. Th eadditio n of pure organic solvents to th e plasma is known toreduce excitation temperatures and electron number densitiessignificantly( 3 , 4 ) .Caughlin and Blades 3) observed a factorof 2 decrease in electron num ber density15 mm above theload coil when xylene rather than water was introduced intoth e plasma. Th e severity of th e plasma cooling can be reducedby reducing the am oun t of organic vapor entering the plasma(13, 14) .
Th e effectof the presence of organic solvents in th e samplewas both vertically and radially depen dent. At14 mm ALCSr I1 fluorescence intensities were enhanced off-axis by thepresence of each of the organic solvents (Figu re10). On axis,the changes in SrI1 fluorescence inten sity were differen t foreach of the three organic solvents (Figures10 and 11).Ethanol produced an enhancem ent ofSr I1 fluorescence in-tensities. As the fraction of acetonitrile in th e samp le wasincreased, the fluorescence in tensity first increased(0.1 % ,0.4% acetonitrile) and then decreased(l.O , 2.0% aceto-nitrile). Concentrations of acetone tha t were0.4 or greaterdepressed th e fluorescence intensities.

8/11/2019 ac00207a014
http://slidepdf.com/reader/full/ac00207a014 5/6
844 ANALYTICAL CHEMISTRY, VOL. 62. NO. 8. APRIL 15. 1990
8000
60 00
2000
0
4000t
.h 0.0 0.5 1.0 1.5 9.0 9.6
Rad./ P w m I d
ba000
k..:....
00.0 0.6 1.0 1.5 2.0 2.6
R*.n.I POdfim d
Flgure IO. Sr I 1 radially resolved fluorescence profiles at14 mmabove the load coil: (a ) ef fe ctof acetone. (b) effect of acetonilrile,(c ) effect of ethanol: concentration of wganic solventby volume. 0(-), 0.1 (--), 0 . 4 (---), 1.0 (---)and2.0 . . .I.
\
2 140.
0.0 0.5 1.0 1.5 2.0
% Organic fv /v /Flgure 11. Sr I 1 fluorescencein the radial centerof the plasma at14 mm above the load coil: m) acetonitrik. (*)ac etone .(A) thanol.
T h e S r I1 emission intensities fell dramatically on-axis(Figure12). Ethanol produced th e smallest depression at leastpartially because it caused an increase in the ion numberdensity,BS shown by the rise in fluorescence intensity. Off-axisthe depression in emission inten sity was smaller. Increasesin ion numb er d ensity (as shown by fluorescence measure-men ts) offset the decrease in th e fraction of ions th at wereexcited an d em itted light.
Because small amounts of organic solvent can cause largedepressions in emission signals, it would be useful to havediagnostic signals to inform the instrument operator whenexcitation conditions in the plasma me affected. BothAI and
60
40
00.0 0.7 1.4 2. 2.8 3.5
8
b
I20
P 100
2 %
,*. 4 0
8 50
.f 20
3 60
00.0 0.7 1.4 2.1 2.8 3.6
Redi.1 Poli#On -1
Figure 12. Sr I 1 radially resolved emission profiles at14 mm abovethe load coil: (a ) effect of acetone,(b) effect of acetonitrile. (c ) effectof ethanol; concentration of organic solventby volume. 0 (-),0 . 1 (--), 0 . 4 (---), 1 . 0 % (---)and2.0 e..).
1 0 0 0\
2 8 0 02F
600
.
c
.V, 4 0 0 -
.
8~ 2 0 0 ~
0
0 .00
.08%
0.40%
0 .00%
H A r Sa I/Figure 13. Comparison of effect of ace toneon Ba I1 (455.40 nm).A r I (415.86 n m i and H 1486.13-nm emission in tte nwmal anaMcalzone.
H emission inte nsities were also severely affected by th epresence of organic solvent (Figur e13). There fore, each wouldhe an effective diagnostic signal. C or C, emission, whichincreases with increasing a moun tsof organic solvent, couldalso be used as a diagnostic signal.
The large depression in Ar andH intensit ies shows thatfewer atoms were excited when organic solvents were intro-duced into the plasma. Th e Ar andH emission depressionswere more severe than those observed for Sr I1 or Ba I1emission. This is most likely because Ar andH have largeexcitation energies in comparison t o the Sr I1 or Ba I1 linesobserved. Furthe r, theSr and Ba ion number densities in-crease with the addition of organic solvent. Analyte specieswith high excitation energies, such as Zn I or Zn 11, will

8/11/2019 ac00207a014
http://slidepdf.com/reader/full/ac00207a014 6/6
ANALYTICAL CHEMISTRY, VOL.62, NO. 8, APRIL 15, 1990 845
Laboratory. Th e imp ortan t contributions of Don Brewer, DonTice, Ken Vickers, Ralph C arney, Jules K elley, and Harla nMangum of th e UNC Departm ent of Chemistry InstrumentShop are recognized.
Registry No. acetone,67-64-1; acetonitrile,75-05-8; ethanol,64-17-5.
probably be m ore severely affected thanSr I1 or Ba I1 emissionas well.
CONCLUSIONS
Th e presence of small amo unt s of an organic solvent in anaqueous sample severely depressed emission intensities. Thi scan produce large errors in analysis if concentration of theorganic solvents in the calibration st and ards are not closelymatched t o th e sample. Ar and H emission intensities areuseful as diagnostic signals t o warn t he operator th at plasma
excitation conditions have been affected.Th e depression of emission intensities when organic solventsare present in the sample suggests tha t excitation temperaturesare lower. However, ion to atom emission intensity ratioschange little in the normal analytical zone(14 mm ALC).Furth er, t he ion-to-atom fluorescence intensity ratio increasesdramatically when organic solvent is present in th e sample.Increases in ion-to-atom intensity ratios are generally asso-ciated with increases in temperatu re.
Th e observed behavior is consistent with a com bination ofa cooler excitation tempe ratureor quenching, a shift in therelative numbers of ions and ato ms, and desolvation of dro-plet s lower in th e plasma. Desolvation of droplets appe arsto be com plete lower in th e plasma w hen organic solvents arepresent in th e sample.
Furth er experiments are neededto understand th e observedbehavior. Experim ents wit h a wider range of organic solventsare necessary t o identify th e physicalor chemical propertiesleading to depression of emission intensities. Measuremen tof aerosol mass transp ort ra tes and tertiary droplet size dis-tributio ns of pure aqueous solutions and solutions containingsmall fraction s of organ ic solvents isalso needed. Th e relativeimpo rtance of aerosol versus vapor loading mu st be assessed.Chan ges in the effect of th e presence of organic solvent as afunction of applied power and ce ntral gas flow rate m ust bestud ied. T h e effect of th e presence of organic solve nt onspecies with a wide range of excitatio n and ionization energiesmu st be investigated. Each of these stud ies is now underwayin our laboratories.
CKNOWLEDGMENT
Princeton Applied Research Corporation is thanke d for loanof the intensified diode array. T h e Perkin-E lmer Co rporationis acknowledged for donatio n of the IC P power supply andimpedance match er. Th e nitrogen laser pum ped dye laser wason loan from the UNC Department of Chemistry Laser
LITER TURE CITED
(1) Boorn, A. W.: Browner,R. F. In Inductively Coupled Plasma EmissionSpectroscopy, Par t 11: Boumans, P. W. J M., Ed.; Wiley-lntersci-ence: New York, 1987; Chapter6.
(2) Boorn, A. W.; Browner,R. F. Anal . Chem. 1982, 5 4 , 1402.(3) Blades, M. W.; Caughlin, B. L.Spectrochim. Acta 1985, 4 0 8 , 579.(4) Boumans, P. W. J M.; Lux-Steiner, M. Ch.Spectrochim. Acta 1982,
378 97.(5) Miyazaki, A.; Kimuira, A.; Bansho, K.; Umezaki,Y. Anal . Chim. Acta
1982, 144, 213.(6) Botto, R. I. Spectrochim. Acta 1987, 428, 181.(7) Nisaman eepong, W.: Haas, D. L.; Caruso ,J. A. Spectrochim. Acta
1985, 4 0 8 , 3.(8) Olesik,J W.; Williamsen, E.J ; Hadnagy, M. Pittsburgh Confere nce on
Analytical Chemistry and Applied Spectroscopy, New Orleans, LA,February 1988; paper 1323.
(9) Olesik,J W.; Alam , A.; Denke r.M. S., unpublished research.(10) Boorn, A. W.; Cresser, M.S.; Browner, R. F. Spectrochim. Acta
1980, 358 823.(11) Greenfield, S.; cGeachin, H. McD.; Smith, P. B.Anal. Chim Acta
1978, 8 4 , 67.(12) Maessen, F. J. M. J.; Seeverens, P. J H.; Kreuning, G. Spectrochim.
Acta 1984, 398 1171.(13) Kreuning, G.: Maessen, F.J M. J. Spectrochim. Acta 1987, 428,
6 7 7 .
(14) Kreuning , G.; Maessen, F.J. M. J. Spectrochim. Acta 1989, 4 4 8 ,367.(15) Goldfarb,V. M.; Goldfarb, H.V. Spectrochim. Acta 1985, 4 0 8 , 177.(16) Ito, T.: Kawaguchi, K.; Mizuike, A.Bunseki Kagaku 1979, 28, 648.(17) Olesik,J. W.; Williamsen, E.J Appl . Spectrosc . 1989, 43 933.(18) Cremers. C. R.; Birkebak,Appi . Opt . 1988, 5 , 1057.(19) Farino, J.; Miller,J. R.; Smith, D. D.; B rowner,R . F. Anal. Chem.
1987, 59 2303.(20) Bates, L. C.; Olesik,J. W. The Effect of Sample Aerosol Transport
Rate on Inductively Coupled Plasma Emission and Fluorescence,J .Anal . At . Spectrosc . , in press.
(21) Olesik,J. W.; Smith , L.J ; Williamsen, E.J. Anal . Chem. 1989, 61.2002.
(22) Long, S. .: Browner, R. F. Spectrochim. Acta 1988, 4 1 8 , 639.(23) Caughlin, B. L.; Blades, M. W.Spectrochim. Acta 1984, 398 1583.(24) Blades, M. W.; Caughlin. B. L.; Walker,2. H.; Burton,L. L. Prog. Anal.
A t . Spec tro sc . 1987. 10, 57.(25) Boumans, P. W. J. M.; deBoer, F. Spectrochim. Acta 1977, 328 365.(26) Furuta, F.; Nojiri,Y.; Fuwa, F. Spectrochim. Acta 1985, 4 0 8 , 423.
RECEIVEDor review September29, 1989. Accepted J anuary8,1990. This work was supported by the UNC Departmentof Chemistry, a Du Pont Young Faculty Grant, and theBiomedical Research Su ppo rt Gran t Programof the Divisionof Research Resources from th e National I nstitu tes of Health(BRSGS 07 RR07072).