Abundances in metal-rich stars - Lu
31
Abundances in metal-rich stars. Detailed abundance analysis of 47 G and K dwarf stars with [Me/H] > 0.10 dex Feltzing, Sofia; Gustafsson, B Published in: Astronomy and Astrophysics Supplement Series DOI: 10.1051/aas:1998400 1998 Link to publication Citation for published version (APA): Feltzing, S., & Gustafsson, B. (1998). Abundances in metal-rich stars. Detailed abundance analysis of 47 G and K dwarf stars with [Me/H] > 0.10 dex. Astronomy and Astrophysics Supplement Series, 129, 237-266. DOI: 10.1051/aas:1998400 General rights Copyright and moral rights for the publications made accessible in the public portal are retained by the authors and/or other copyright owners and it is a condition of accessing publications that users recognise and abide by the legal requirements associated with these rights. • Users may download and print one copy of any publication from the public portal for the purpose of private study or research. • You may not further distribute the material or use it for any profit-making activity or commercial gain • You may freely distribute the URL identifying the publication in the public portal Take down policy If you believe that this document breaches copyright please contact us providing details, and we will remove access to the work immediately and investigate your claim.
Transcript of Abundances in metal-rich stars - Lu
LUND UNIVERSITY
PO Box 117221 00 Lund+46 46-222 00 00
Abundances in metal-rich stars. Detailed abundance analysis of 47 G and K dwarf starswith [Me/H] > 0.10 dex
Feltzing, Sofia; Gustafsson, B
Published in:Astronomy and Astrophysics Supplement Series
DOI:10.1051/aas:1998400
1998
Link to publication
Citation for published version (APA):Feltzing, S., & Gustafsson, B. (1998). Abundances in metal-rich stars. Detailed abundance analysis of 47 G andK dwarf stars with [Me/H] > 0.10 dex. Astronomy and Astrophysics Supplement Series, 129, 237-266. DOI:10.1051/aas:1998400
General rightsCopyright and moral rights for the publications made accessible in the public portal are retained by the authorsand/or other copyright owners and it is a condition of accessing publications that users recognise and abide by thelegal requirements associated with these rights.
• Users may download and print one copy of any publication from the public portal for the purpose of private studyor research. • You may not further distribute the material or use it for any profit-making activity or commercial gain • You may freely distribute the URL identifying the publication in the public portalTake down policyIf you believe that this document breaches copyright please contact us providing details, and we will removeaccess to the work immediately and investigate your claim.
ASTRONOMY & ASTROPHYSICS APRIL II 1998, PAGE 237
SUPPLEMENT SERIES
Astron. Astrophys. Suppl. Ser. 129, 237-266 (1998)
Abundances in metal-rich stars?
Detailed abundance analysis of 47 G and K dwarf stars with[Me/H] > 0.10 dex
S. Feltzing1,2 and B. Gustafsson2
1 Royal Greenwich Observatory, Madingley Road, Cambridge CB3 0EZ, UK2 Astronomiska observatoriet, Box 515, S-751 20 Uppsala, Sweden
Received June 25; accepted September 26, 1997
Abstract. We have derived elemental abundances of O,Na, Mg, Al, Si, Ca, Ti, Cr, Mn, Fe, Co, Ni as well asfor a number of s-elements for 47 G and K dwarf, with[Me/H]> 0.1 dex. The selection of stars was based ontheir kinematics as well as on their uvby − β photome-try. One sample of stars on rather eccentric orbits tracesthe chemical evolution interior to the solar orbit and an-other, on circular orbits, the evolution around the solarorbit. A few Extreme Population I stars were included inthe latter sample.
The stars have −0.1 dex < [Fe/H] < 0.42 dex. Thespectroscopic [Fe/H] correlate well with the [Me/H] de-rived from uvby − β photometry. We find that the ele-mental abundances of Mg, Al, Si, Ca, Ti, Cr and Ni allfollow [Fe/H]. Our data put further constraints on mod-els of galactic chemical evolution, in particular of Cr, Mnand Co which have not previously been studied for dwarfstars with [Me/H] > 0.1 dex. The increase in [Na/Fe]and [Al/Fe] as a function of [Fe/H] found previously byEdvardsson et al. (1993a) has been confirmed for [Na/Fe].This upturning relation, and the scatter around it, areshown not to be due to a mixture of populations withdifferent mean distances to the galactic centre. We do notconfirm the same trend for aluminium, which is somewhatsurprising since both these elements are thought to beproduced in the same environments in the pre-supernovastars. Nor have we been able to trace any tendency forrelative abundances of O, Si, and Ti relative to Fe to varywith the stellar velocities, i.e. the stars present mean dis-tance to the galactic centre. These results imply that thereis no significant difference in the chemical evolution of thedifferent stellar populations for stars with [Me/H]> 0.1dex. We find that [O/Fe] continue to decline with increas-ing [Fe/H] and that oxygen and europium correlate well.
Send offprint requests to: S. [email protected]? Based on observations at the McDonald Observatory.
However [Si/Fe] and [Ca/Fe] seem to stay constant. A real(“cosmic”) scatter in [Ti/Fe] at given [Fe/H] is suggestedas well as a decreasing abundance of the s-elements rela-tive to iron for the most metal-rich dwarf stars. We dis-cuss our results in the context of recent models of galacticchemical evolution.
In our sample we have included a few very metal richstars, sometimes called SMR (super metal rich) stars. Wefind these stars to be among the most iron-rich in oursample but far from as metal-rich as indicated by theirphotometric metallicities. SMR stars on highly eccentricorbits, alleged to trace the evolution of the chemical evo-lution in the galactic Bulge, have previously been foundoverabundant in O, Mg and Si. We have included threesuch stars from the study by Barbuy & Grenon (1990).We find them to be less metal rich and the other elemen-tal abundances remain puzzling.
Detailed spectroscopic abundance analyses of K dwarfstars are rare. Our study includes 5 K dwarf stars and hasrevealed what appears to be a striking example of overi-onization. The overionization is especially prominent forCa, Cr and Fe. The origin of this apparent overionizationis not clear and we discuss different explanations in somedetail.
Key words: Galaxy: abundances — evolution — stars:abundances — late-type — fundamental parameters
1. Introduction
The time that F and G dwarf stars spend on the main-sequence span a range from 109 to several times 1010 years.This means that such stars may be used as tracers of thechemical and dynamical evolution of the Galaxy; in fact,a combination of chemical and kinematical data is a verypowerful tool for studying the galactic chemical evolution,
238 S. Feltzing and B. Gustafsson: Abundances in metal-rich stars
cf. e.g. Edvardsson et al. (1993a) and Wyse & Gilmore(1995).
Spectroscopic abundance analysis of stars have now be-come accurate enough to admit determinations of rathersmall (<∼ 0.10 dex) relative abundance differences in differ-ential studies of stellar samples of large size. These devel-opments make it possible to explore the galactic chemicalevolution in considerable detail.
Edvardsson et al. (1993a) analysed 189 F and G dwarfstars, with −1.1 dex < [Fe/H] < 0.25 dex. Accurate abun-dances were determined for a number of key elements, O,Na, Mg, Al, Si, Ca, Ti, Fe and Ni, as well as a numberof s-process elements. The abundance results combinedwith accurate velocity data enabled a detailed study ofthe chemical evolution of kinematically distinct popula-tions. Extensions of this study were made by Tomkin et al.(1995) and Woolf et al. (1995) who measured carbon andeuropium abundances, respectively, for about half of thestars in the Edvardsson et al. (1993a) sample.
The study by Edvardsson et al. (1993a) raised a num-ber of new questions concerning the most metal-rich starsin the galactic disk, not the least concerning the build-up of sodium, magnesium and aluminium. Sodium, alu-minium and, possibly, magnesium relative iron vs. [Fe/H]showed an increase for [Fe/H] > 0.0 dex (cf. Edvardssonet al. 1993a Figs. 15a-l). Are these “upturns” real? Largestar-to-star scatter was also encountered for the abun-dance of certain elements: magnesium, aluminium and ti-tanium, relative to iron at a given [Fe/H]. Could this scat-ter be reduced by using more/better abundance criteria oris the scatter intrinsic to the stellar population? One sug-gestion was that “upturns” and scatter could be due to amixing of populations with different ages and with differ-ent mean distances from the galactic centre, e.g. a mixtureof old metal-rich stars, more concentrated to the centreand young Extreme Population I stars on solar like orbits.We have therefore studied a sample of 47 metal-rich dwarfstars, with photometric metallicities [Me/H] > 0.10 dex,chosen to represent different mean perigalactic distancesand presumably different ages.
The paper is organized as follows: in Sects. 2 and 3,we describe the selection criteria of the stellar sample, theobservations and reductions, Sect. 4 contains a descrip-tion of the analysis while the errors are discussed in detailin Sect. 5. Abundance results and their interpretation interms of models of galactic chemical evolution are pre-sented in Sect. 6 and, finally, Sect. 7 contains a summaryand discussion.
2. Selection of stars
The stars have been selected to include both stars fromthe old metal-rich disk population, as well as more recentlyformed Extreme Population I dwarf stars. The sample ofstars was confined photometrically by 0.m38 < b−y < 0.m63and with δc1 and ∆m1 such that with the calibrations
of Edvardsson et al. (1993a) and Olsen (1984), solar-type dwarfs and subgiants are singled out with 4500 K≤ Teff ≤ 6000 K, 4.0 ≤ log g ≤ 4.6 and [Me/H] > 0.10 dex.Magnitude and metallicity data were taken from the cata-logues by Olsen (1983, 1993, 1994 and priv. comm.). Thesewere combined with accurate velocity data (UVW) calcu-lated by Olsen from available proper motions and unpub-lished CORAVEL radial velocities by Andersen, Mayor &Nordstrom, in the selection of programme stars.
From the catalogue we seleted 42 G and K dwarf starswith [Me/H] > 0.10 for our study. 13 of these stars haveVLSR < −50 km s−1 and/or QLSR > 60 km s−1, whereVLSR is the stellar space velocity component in the di-rection of the rotation of the Galaxy relative to the localstandard of rest (LSR) and QLSR is the total space veloc-ity relative to LSR. These stars were selected to representthe chemical evolution galactic regions different from thoserepresented by the solar orbit, in particular located moreclosely to the galactic centre. As shown in Edvardssonet al. (1993b), Fig. 1, VLSR < −50 km s−1 singles out starswith mean perigalactica less than 7 kpc. The 17 stars withQLSR < 30 km s−1 represent the chemical evolution in thegas close to the solar orbit.
Since we also wished to explore the oxygen abundancesin metal-rich disk dwarf stars on highly eccentric orbits weadded 3 additional stars from the sample of stars for whichBarbuy & Grenon (1990) found abnormally high [O/Fe]ratios (HD 37986, HD 77338, HD 87007). Moreover, we in-cluded 2 stars from Schuster & Nissen (1988) (HD 175518and HD 182572).
The total final sample contains 47 stars and has 3in common with Edvardsson et al. (1993a): HD 30562,HD 67228 and HD 144585.
3. Observations and reductions
3.1. Observations
The observations were carried out with the 2.7 m telescopeof the McDonald Observatory, University of Texas, duringtwo observing runs, March 1 − 9, 1994 and April 28 –May 2, 1994, using the 2d-coude cross dispersion echellespectrometer (Tull et al. 1995).
At the time of the observations the new 2k × 2k chip,which covers most of the visual spectrum of the observedstar in one exposure, was not yet available at the spec-trometer. The CCD-chip used has 800 × 864 pixels andcovers approximately 18 echelle orders of length 25 −35 A. Settings of the detector for the observations wereselected to enable reliable analysis of the spectral linesfrom the elements oxygen, sodium, magnesium and alu-minium, silicon, calcium, titanium, as well as chromium,iron, nickel, yttrium and europium. Many sources were uti-lized to make the selection of lines optimized for the cur-rent project, the most important being Edvardsson et al.(1993a), Morell (1994), Mackle et al. (1975), Ruland et al.
S. Feltzing and B. Gustafsson: Abundances in metal-rich stars 239
(1981). The Arcturus Atlas by Griffin (1968) and the SolarSpectrum Atlas by Delbouille et al. (1973), were carefullyinspected, in order to avoid blends and define suitable con-tinuum regions. Altogether 3 different settings of the CCDin the focal plane of the spectrometer camera were used.
The nominal spectral resolution (slit width 0.25 µm)of ∼ 100 000, was verified by observations of a thorium-argon lamp and by measuring telluric lines. This relativelyhigh resolution was judged to be important in view ofthe relatively crowded spectra, in particular for the coolerstars.
3.2. Reductions of stellar spectra
The reductions were carried out with standard IRAF1
packages for reduction and extraction of echelle spectra.The procedure adopted was: all raw frames were first cor-rected for read-out noise and bias, the flat fields added to-gether, all object frames were trimmed, the new flat fieldframes were normalized, the stellar frames were divided bythe normalized flat field, corrected for scattered light andthe one-dimensional stellar spectra extracted. Finally, thespectrum of the comparison lamp, a thorium-argon lamp,was reduced, extracted and the lines in it identified. Thecomparison spectra were used to carry out the wavelengthcalibration of the stellar spectra. A Legendre polynomialwas fitted to each stellar spectrum to define the contin-uum, using the CONTINUUM task in IRAF.
The results of this procedure for defining the contin-uum were inspected visually and judged to give good con-tinua for all the lines used in the abundance analysis; how-ever, for the strong Ca i line at 6162 A, used for checkingsurface gravities, this definition of the continuum was notsatisfactory for all stars. Instead, a blaze function was con-structed for each night by fitting a Legendre polynomial tothe spectrum of a B star observed during the night. Thestellar spectra were then divided by this blaze function.Then a low order Legendre polynomial was fitted to thestellar spectrum to rectify it. The change in continuumwas negligible for half of the stars, as compared with theresult of using CONTINUUM; this also includes half ofthe K dwarf stars.
Our spectra are generally of high quality, reaching S/Nof ∼ 200 in most cases. Some problems with fringes inthe red were encountered. The measurements of spectralline equivalent widths were done using the SPLOT task inIRAF. Karin Eriksson is gratefully thanked for carryingout almost half of the measurements. Care was exercisedto guarantee that the measurements agreed well betweenthe two operators.
1 IRAF is distributed by National Optical AstronomyObservatories, operated by the Association of Universities forResearch in Astronomy, Inc., under contract with the NationalScience Foundation, U.S.A.
3.3. Solar observations and reductions
The solar observations were performed by illuminating theslit of the spectrograph by sky light each afternoon. Thesolar spectra have ∼ 2 times higher S/N ratios than thestellar spectra. The reductions and measurements of thesolar spectra were made in the same way as for the stellarspectra.
The solar observations were used to determine “astro-physical” log gf -values. For lines, denoted by K in Table2, shifted by the difference in radial velocities between thestars and the Sun outside our solar spectral recordings,but judged to be of interest for the analyses, solar equiva-lent widths were instead obtained from the solar spectrumatlas by Kurucz et al. (1984).
4. Analysis
We have performed a standard Local ThermodynamicEquilibrium (LTE) analysis, strictly differential with re-spect to the Sun, to derive chemical abundances from themeasured equivalent widths.
4.1. Model atmospheres
We used the MARCS program, first described byGustafsson et al. (1975), to generate the model atmo-spheres. Since then, the program has been further devel-oped in various ways and updated in order to handle theline blanketing of millions of absorption lines more accu-rately, Asplund et al. (1997). The following assumptionsenter into the calculation of the models: the atmosphereis assumed to be plane-parallel and in hydrostatic equilib-rium, the total flux (including mixing-length convection)is constant, the source function is described by the Planckfunction at the local temperature with a scattering term,the populations of different excitation levels and ioniza-tion stages are governed by LTE. Since the analysis isdifferential relative to the Sun we have also used a solarmodel atmosphere calculated with the same program asthe stellar models, in spite of the fact that the empiricallyderived Holweger-Muller model better reproduces the so-lar observed limb darkening; see Blackwell et al. (1995) fora discussion of this.
4.2. Fundamental parameters of model atmospheres
The effective temperature and surface gravity for eachstar were derived from uvby − β photometry from Olsen(1983, 1993, 1994 and priv. comm.). We have used anextension of the calibration in Edvardsson et al. (1993a)and the calibration in Olsen (1984). The calibration byEdvardsson et al. (1993a) is valid for the parameter space2.58 < β < 2.72 and 0.04 < (δc1 + 0.5 · δm1) < 0.16.This translates roughly to 5600 K < Teff < 7000 K, 3.8 <log g < 4.5 and metallicity −1 dex < [Me/H] < +0.3 dex.The Edvardsson et al. (1993a) calibration was preferred
240 S. Feltzing and B. Gustafsson: Abundances in metal-rich stars
Table 1. Stellar parameters of the observed stars. The fifth column gives the spectral classification according to Olsen (1983,1993, 1994 and priv. comm.), except where indicated 1) from Eggen (1960), and 2) spectral class from Hoffleit & Jascheck(1982); the sixth and seventh columns give effective temperature and surface gravity as derived from photometry; the eightand ninth give surface gravities as derived from spectra, wings of Ca i, and parallaxes, respectively; the tenth and eleventh giveiron abundances as determined from our spectral analysis and metallicities as determined from photometry; the following fourcolumns contain the space velocity data for the stars, in km s−1 relative to the LSR, from Olsen (priv. comm.). In the lastcolumn the stellar space velocity is given
HD HR Name V Spec.class Teff loggphot loggspec loggπ [Fe/H] [M/H] ξt U V W Q
30562 1536 5.77 F8V 5876 4.00 4.00 3.9 0.19 0.14 1.4 40.8 –70.9 –10.7 82.536130 7.76 G0M 5986 4.34 4.40 4.0 0.15 0.15 1.1 –14.3 –52.5 –43.7 69.837088 8.51 G0 5856 4.26 4.35 0.10 0.31 1.8 –17.4 –12.4 –43.0 48.037216 7.84 G5M 5527 4.47 4.90 –0.02 0.17 1.1 9.8 1.0 –4.3 10.749178 8.07 G0E 5683 4.37 4.45 0.01 0.06 1.2 32.3 10.3 –10.5 35.554322 8.40 G5 5894 4.50 4.55 0.15 0.33 0.9 –20.2 –0.7 7.1 21.455693 7.18 G5M 5845 4.15 4.40 0.26 0.24 1.3 33.9 3.3 –5.0 34.467228 3176 5.30 GIVB 5831 4.14 3.90 3.6 0.16 0.22 1.4 –41.9 16.6 –9.2 46.068988 8.20 G0 5956 4.03 4.25 0.37 1.4 –94.1 –8.8 11.8 95.269582 7.56 G5 5652 4.34 4.74 0.08 0.06 1.2 –20.0 11.5 10.5 25.369830 3259 5.96 G7.5V 5484 4.30 4.95 4.5 –0.03 0.10 1.1 –41.3 –51.7 –4.4 66.371479 7.18 G0 6036 4.18 4.48 0.25 0.32 1.5 34.8 –40.4 –9.1 54.172946B 3396 7.20 G5V 5911 4.40 5.00 0.24 0.40 1.3 15.0 –18.0 –3.4 23.775782 7.08 G0 5930 3.87 3.77 0.18 0.11 1.5 12.3 –23.0 –9.1 27.776780 7.64 G5M 5869 4.30 4.80 0.21 0.30 1.3 22.3 –6.7 10.1 25.380607A 9.15 G5R 5457 4.28 0.27 0.30 1.1 –16.9 15.0 19.3 29.787646 8.07 G0 5961 4.06 4.41 0.30 0.39 1.4 21.9 –11.4 2.6 24.891204 7.82 G0 5864 4.05 4.00 0.17 0.24 1.4 –19.6 9.7 3.6 22.294835 G 058−030 9.11 K0/G0 5896 4.06 0.13 0.04 1.4 –65.1101242 7.61 G5 5790 4.28 4.68 0.07 0.19 1.3 45.2 –50.0 –2.6 67.4106156 7.92 K0 5437 4.27 4.77 0.13 0.20 1.1 –61.9 –13.0 –11.3 64.3110010 7.01 G0 5965 4.08 4.58 4.7 0.35 0.34 1.4 9.0 –14.1 –6.6 17.9117243 8.35 G0/G5III1 5902 4.01 4.36 0.24 0.33 1.0 13.2 –59.9 4.6 61.5125968 7.77 G0/G5IV-V1 5868 4.12 4.32 4.7 0.15 0.25 1.4 22.6 –89.6 –27.7 96.5126511 8.37 G5 5472 4.28 4.70 0.06 0.10 1.3 –14.5 –47.6 –9.9 50.7128987 7.24 G5 5588 4.35 5.00 0.05 0.10 0.9 14.7 2.9 –7.1 16.6130087 7.52 F5 6023 4.01 4.41 0.25 0.25 1.5 13.0 –16.6 4.9 21.7134474 8.88 G5 5375 4.46 5.06 0.16 0.33 1.0 7.7 22.8 –27.1 36.2134987 5657 23 Lib 6.47 G4V 5833 4.11 4.31 4.0 0.36 0.58 1.3 10.3 –24.9 26.9 38.1137510 5740 6.27 G0IV-V 5929 3.91 3.91 0.25 0.28 1.5 –0.2 2.0 7.6 7.9144585 5996 6.31 G4IV-V 5831 4.03 4.38 0.27 0.26 1.4 23.6 –17.5 33.6 44.6171999A 8.33 G5 5249 4.32 4.65 4.0 0.40 0.06 0.9 7.6 –61.3 –3.3 61.9175518 K0IV-V 1 5713 3.93 4.73 4.3 0.32 0.67 1.5 14.6 –99.8 12.6 101.7178911A 7272 6.73 G5R 5910 4.24 4.44 4.0 0.06 0.35 35.1 –8.8 6.0 36.7180890 8.35 G5 5530 4.23 4.53 0.14 0.09 1.5 16.9 –50.0 –9.4 53.6182572 7373 31 Aql 6.36 G8IV2 5739 3.83 4.43 4.1 0.42 0.50 1.4 –1.0 123.2183263 7.87 G5/G2IV 5837 4.05 4.40 0.15 0.22 1.5 18.6 –32.2 8.6 38.2186427 7504 16 Cyg B 6.23 G3V 5773 4.17 4.42 0.06 0.21 1.3 –27.9 –17.9 5.8 33.6187055 9.00 G5 5298 4.56 4.96 3.9 0.16 0.25 0.9 83.0 5.3 –12.7 84.1
K dwarf stars
32147 1614 6.21 K3V 4625 4.57 4.55 4.4 0.28 0.17 1.0 –11.5 –36.1 –3.7 38.061606A 7.17 K2V 4833 4.55 4.85 4.6 –0.08 0.11 1.0 –34.9 9.4 –1.0 36.1103932 6.95 K5V 4510 4.58 4.85 4.6 0.16 0.21 1.0 9.9 –59.9 0.4 60.7131977A 5568 5.72 K4V 4585 4.58 4.70 4.6 0.04 0.18 1.0 –57.2 –9.5 –26.1 63.6136834 8.26 K0 4765 4.56 4.47 4.5 0.19 0.23 1.0 9.6 –44.3 –8.7 46.2
Stars in common with Barbuy & Grenon (1990)
379863 7.37 G5/K0IV 5455 4.50 4.40 4.3 0.27 0.47 1.0773383 8.63 K0IV 5290 4.50 4.90 0.22 0.45 1.0870073 8.81 K2 5300 4.50 4.70 0.27 0.43 1.0 40.34 –42.54 –14.24
3 All stellar parameters from Barbuy & Grenon (1990).4 Barbuy, private communication.
S. Feltzing and B. Gustafsson: Abundances in metal-rich stars 241
for all stars to which it is applicable. For the three starspreviously studied by Barbuy & Grenon (1990) uvby − βphotometry is not available, and we used the stellar pa-rameters cited by them.
4.3. Surface gravity
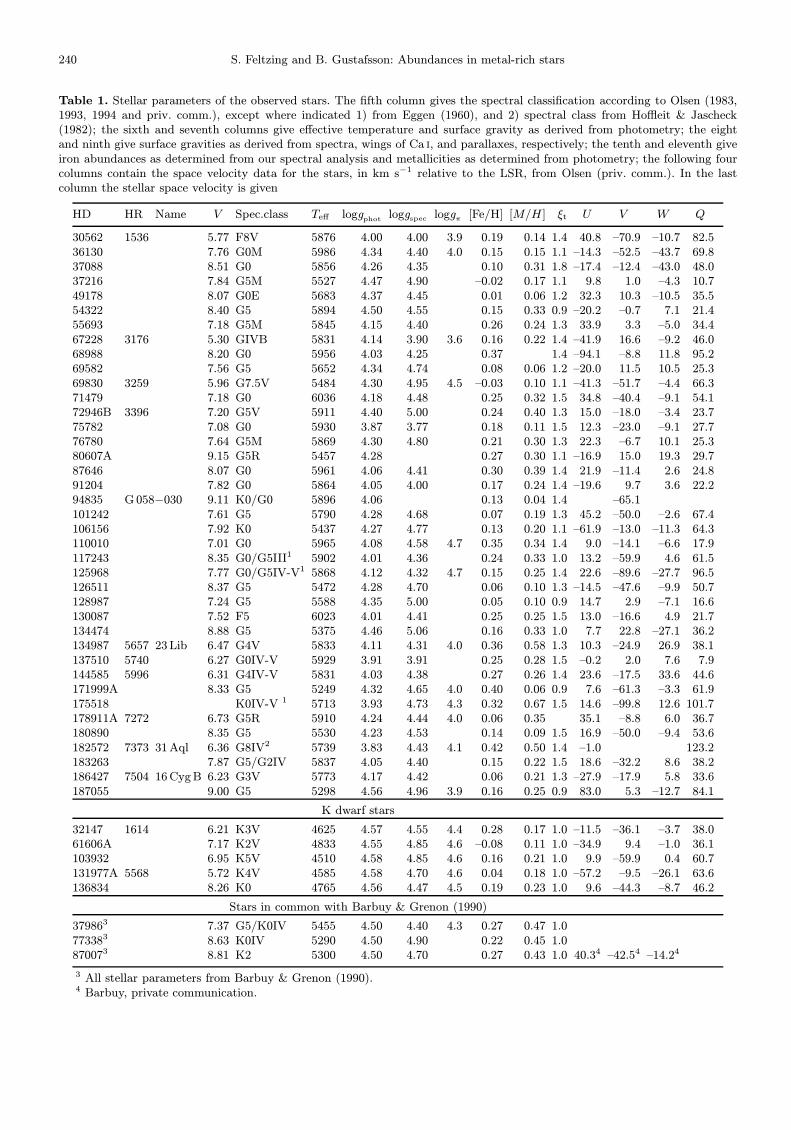
Surface gravities were derived from the c1 index, whichprimarily measures the Balmer jump and is sensitive tothe surface gravity in solar type dwarf stars. In additionto surface gravities estimated from photometry we havealso used the wings of the strong calcium line at 6162 A(see Blackwell & Willis 1977 and Edvardsson 1988), toderive surface gravities. The results are given in Table 1.For these results we are indebted to Matthias Palmer andMikael Nilsson, who carried out these laborious determi-nations. Edvardsson et al. (1993a) estimated the error insurface gravity determined from their calibration of the c1index to 0.2 dex. Olsen (1984) quotes a similar accuracyfor his calibration. For the stars with trigonometric par-allaxes in van Altena et al. (1991) we have also estimatedsurface gravities from parallaxes. This exercise was meantto be a consistency check on the photometric and spectro-scopic determinations of the surface gravities. Assumingthat the stars have masses of 0.8 M� and interpolating thebolometric corrections in the table given in Allen (1973)we derived, from the parallaxes, the surface gravities (seee.g. Gustafsson et al. 1974) shown in Fig. 1 and given inTable 12.
Fig. 1. Surface gravities derived from parallaxes vs. surfacegravities derived from photometry. The one-to-one relation isindicated by the dotted line. The error bars reflect the errorsin the parallaxes. Note the different scales on x− and y−axis
The agreement between surface gravities determinedwith the different methods is in general good. We note,
2 With the release of the Hipparcos parallaxes this can nowbe addressed in greater detail and for most of our stars. Theresults will be published elsewhere.
however, that there is in the mean an offset in the surfacegravities determined from the wings of the strong Ca i lineas compared to the surface gravities determined from pho-tometry, see Table 1, of about +0.27 dex. The reason forthis offset is not clear but, a corresponding uncertainty insurface gravity is of minor significance for the abundanceresults, see Table 3. A tendency for the trigonometric log gdetermiantions to agree closer with the photometric thanwith the spectroscopic ones may also be traced. It is in-teresting to note that the K dwarf stars in our study havelog g derived from parallaxes that are in good agreementwith those determined from photometry.
On the basis of these comparisons we found no reasonto change the surface gravities to be used in the abundanceanalysis but kept those determined from photometry.
4.4. Microturbulence parameters
We have determined microturbulence parameters, ξt, fromboth the Ca i lines and the Fe i lines for 12 of the starswith enough calcium and iron lines measured. For the de-termination from the Ca i lines, abundances from the in-dividual lines were derived with ξt ranging from 0.10 to1.90 km s−1. The microturbulence parameter for each starwas then determined as the ξt value which gave the small-est abundance scatter (the inflexion point, see e.g. Smith1981). The microturbulence parameters were also deter-mined by plotting the iron abundance versus the reducedequivalent widths, log(Wλ/λ), derived for each line. If thecorrect microturbulence parameter is used the slope of afit to the data points should be zero. Both methods agreedwell for these 12 stars.
Using the values obtained we derived a relation be-tween effective temperature, surface gravity and the mi-croturbulence parameter, which was then used to deter-mine microturbulence parameters for the rest of the stars:ξt = 4.5 10−4 Teff − 0.31 · log g and predicts, with Teff andlog g adopted, ξt values to an accuracy of ±0.1 km s−1 forthe 12 stars. This relation is valid for 3.93 < log g < 4.50and 5530 K < Teff < 6036 K. For a few stars just outsidethe validity range we extrapolated the relation to calcu-late approximative microturbulence parameters. This pro-cedure was checked to yield consistent abundances for in-dividual iron lines of different strengths. For five starsa somewhat lower microturbulence parameter was pre-ferred (HD 36130, HD 134474, HD 171999, HD 182572,HD 187055). Our relation for microturbulence parametersyield slightly higher values than the relation presented byEdvardsson et al. (1993a).
For the K dwarf stars none of the described methodsseemed to yield definite values for the microturbulenceparameter. A microturbulence parameter of 1.0 km s−1
was adopted for these stars.

242 S. Feltzing and B. Gustafsson: Abundances in metal-rich stars
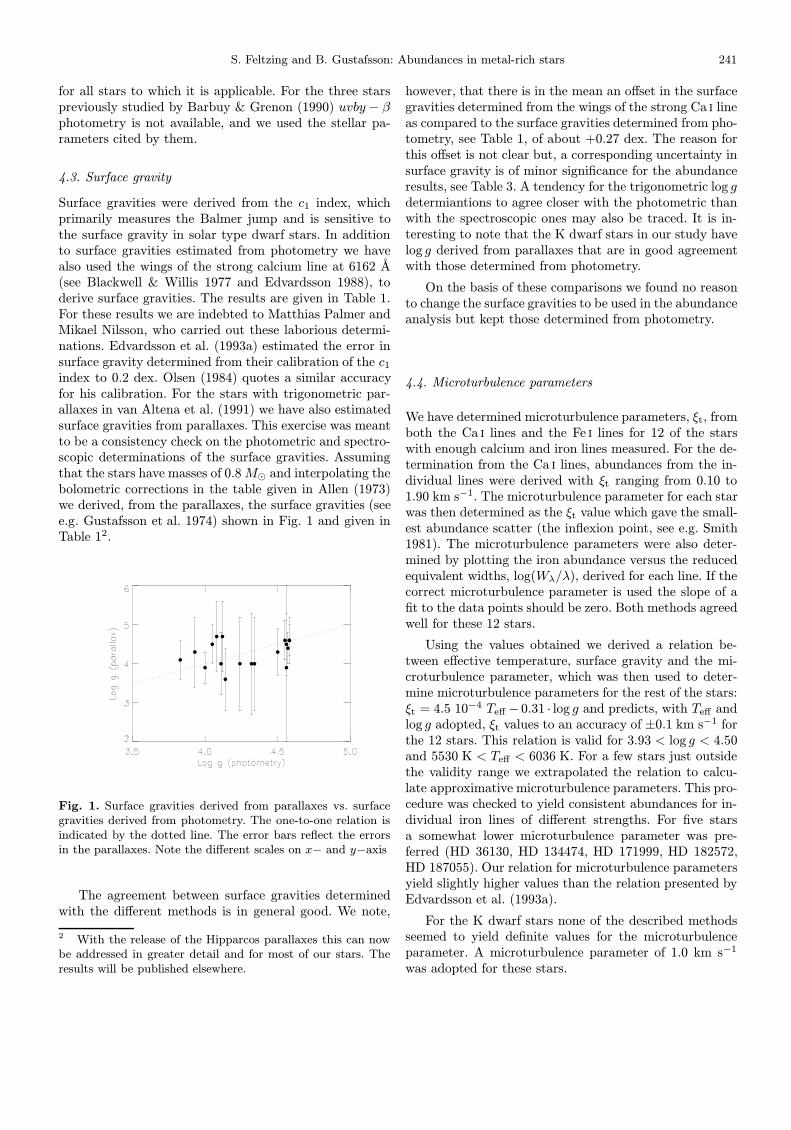
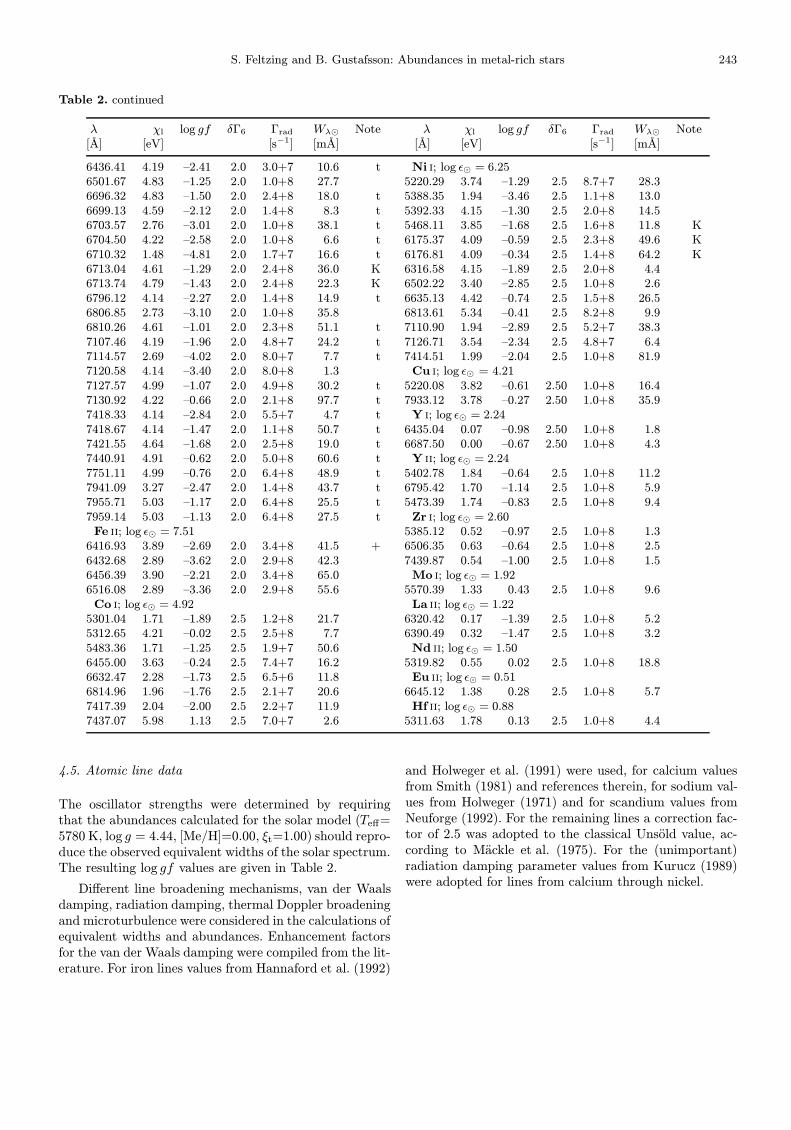
Table 2. Column 1: Wavelength as quoted in Moore et al. (1966). Column 2: Excitation energy of the lower level involved in thetransition. Column 3: Astrophysically derived oscillator strengths (based on the solar equivalent widths). Column 4: Correctionfactor to Unsold’s damping constant. Column 5: Radiative damping constant. Column 6: Equivalent width as measured in theSun. If nothing else is indicated in the 7th column observations of the daylight sky with the same spectrograph were used.Column 7: Lines used to check the excitation equilibrium are denoted by t and lines for which the solar equivalent width wasmeasured from the Kurucz et al. (1984) Solar Flux Atlas by a K, see Sect. 3.3. Cr ii and Fe ii lines excluded from the analysisof the K dwarfs stars due to possible blends are denoted by +, see Sect. 5.8. For each element the solar logarithmic abundanceis given according to in Anders & Grevesse (1989), except for iron for which the value 7.51 was used, see Holweger et al. (1991)and Biemont et al. (1991)
λ χl log gf δΓ6 Γrad Wλ� Note λ χl log gf δΓ6 Γrad Wλ� Note[A] [eV] [s−1] [mA] [A] [eV] [s−1] [mA]
O i; log ε� = 8.93 V i; log ε� = 4.006300.31 0.0 –9.84 2.5 1.0+8 4.6 6452.31 1.19 –0.81 2.5 4.0+7 8.96156.80 10.74 –0.43 2.5 1.0+8 4.1 6504.18 1.18 –0.47 2.5 3.9+7 27.06158.17 10.74 –0.65 2.5 1.0+8 2.6 V ii; log ε� = 4.007771.95 9.14 0.29 2.5 1.0+8 72.2 5303.22 2.28 –2.02 2.5 2.7+8 4.17774.18 9.14 0.14 2.5 1.0+8 61.5 5384.87 2.28 –2.50 2.5 2.7+8 1.47775.39 9.14 –0.05 2.5 1.0+8 50.9 Cr i; log ε� = 5.67Na i; log ε� = 6.33 5220.91 3.38 –1.01 2.5 8.1+7 10.9
6160.75 2.10 –1.30 2.1 1.0+8 58.8 5238.96 2.71 –1.43 2.5 2.5+8 16.76154.23 2.10 –1.62 2.1 1.0+8 37.2 5304.18 3.46 –0.79 2.5 2.5+8 14.9Mg i; log ε� = 7.58 5312.86 3.45 –0.69 2.5 2.5+8 18.5
6319.24 5.11 –2.20 2.5 1.0+8 31.7 5318.77 3.44 –0.78 2.5 2.5+8 15.77759.37 5.93 –1.76 2.5 1.0+8 17.8 5480.51 3.50 –0.90 2.5 7.4+7 11.17930.82 5.94 –1.04 2.5 1.0+8 56.6 5574.39 4.45 –0.70 2.5 6.7+7 2.5Al i; log ε� = 6.47 6630.03 1.03 –3.56 2.5 2.4+7 7.1
6696.03 3.14 –1.58 2.5 1.0+8 38.1 6636.33 4.14 –1.20 2.5 4.4+7 1.66698.67 3.14 –1.89 2.5 1.0+8 22.4 6643.00 3.84 –1.20 2.5 7.4+7 3.1Si i; log ε� = 7.55 6796.49 4.40 –0.29 2.5 1.6+8 7.3
6518.74 5.95 –1.40 2.5 1.0+8 26.6 Cr ii; log ε� = 5.677415.96 5.61 –0.80 2.5 1.0+8 93.5 5305.86 3.83 –2.09 2.5 2.6+8 24.77760.64 6.20 –1.35 2.5 1.0+8 19.4 5308.42 4.07 –1.82 2.5 2.6+8 26.9 +Ca i; log ε� = 6.36 5310.69 4.07 –2.26 2.5 2.6+8 12.9
6166.44 2.52 –1.36 5.2 1.9+7 70.4 K Mn i; log ε� = 5.396455.60 2.52 –1.41 2.3 4.7+7 58.6 5388.50 3.37 –1.69 2.5 7.1+7 5.36508.85 2.53 –2.35 2.0 4.4+7 13.7 5399.47 3.85 –0.18 2.5 9.0+7 38.16709.87 2.93 –2.76 4.5 3.8+8 2.5 5470.64 2.16 –1.38 2.5 4.0+8 58.46798.47 2.71 –2.42 3.7 1.9+7 8.7 6440.93 3.77 –1.27 2.5 7.1+7 6.3Sc i; log ε� = 3.10 7764.66 5.37 0.17 2.5 9.8+7 5.9
5484.64 1.85 0.04 1.5 1.5+8 2.2 Fe i; log ε� = 7.51Sc ii; log ε� = 3.10 5308.69 4.26 –2.43 2.0 2.1+8 7.6 t
5239.82 1.45 –0.76 1.5 1.0+8 48.5 5315.07 4.37 –1.54 2.0 1.8+8 32.5 t5318.36 1.36 –1.77 1.5 1.5+8 12.4 5223.18 3.63 –2.31 2.0 7.9+7 28.5 t6300.69 1.51 –2.00 1.5 2.3+8 6.2 5308.69 4.26 –2.43 2.0 2.1+8 7.6 t6320.84 1.50 –1.88 1.5 2.3+8 8.2 5315.07 4.37 –1.54 2.0 1.8+8 32.5 tTi i; log ε� = 4.99 5320.03 3.64 –2.54 2.0 3.1+8 19.3
5219.70 0.02 –2.25 2.5 6.0+6 26.7 K 5321.11 4.43 –1.30 2.0 1.7+8 42.0 K5299.98 1.05 –1.44 2.5 3.4+6 20.4 K 5322.04 2.28 –2.89 2.0 1.0+8 62.2 K5389.16 0.81 –2.24 2.5 8.3+7 6.7 5386.34 4.15 –1.76 2.0 2.3+8 31.6 t5471.20 1.44 –1.61 2.5 1.1+8 7.0 5395.22 4.44 –1.81 2.0 1.8+8 18.7 t5473.55 2.33 –0.83 2.5 1.1+8 5.8 5398.28 4.44 –0.81 2.0 1.9+8 70.5 t5474.23 1.46 –1.31 2.5 8.4+7 12.7 5473.16 4.19 –2.02 2.0 2.2+8 19.5 t5474.46 2.34 –0.96 2.5 1.1+8 4.3 5483.10 4.15 –1.49 2.0 2.6+8 45.5 t5490.15 1.46 –0.98 2.5 1.5+8 21.6 K 5560.22 4.43 –1.16 2.0 1.6+8 49.5 t6303.76 1.44 –1.60 2.5 1.7+8 7.8 5577.02 5.03 –1.51 2.0 6.9+8 11.7 t6312.24 1.46 –1.60 2.5 1.7+8 7.5 6165.36 4.14 –1.55 2.0 8.8+7 43.8 t7440.58 2.26 –0.76 2.5 1.4+8 9.5 6303.46 4.32 –2.59 2.0 1.9+8 5.17949.15 1.50 –1.45 2.5 2.0+6 11.3 6380.75 4.19 –1.27 2.0 7.4+7 56.9
S. Feltzing and B. Gustafsson: Abundances in metal-rich stars 243
Table 2. continued
λ χl log gf δΓ6 Γrad Wλ� Note λ χl log gf δΓ6 Γrad Wλ� Note[A] [eV] [s−1] [mA] [A] [eV] [s−1] [mA]
6436.41 4.19 –2.41 2.0 3.0+7 10.6 t Ni i; log ε� = 6.256501.67 4.83 –1.25 2.0 1.0+8 27.7 5220.29 3.74 –1.29 2.5 8.7+7 28.36696.32 4.83 –1.50 2.0 2.4+8 18.0 t 5388.35 1.94 –3.46 2.5 1.1+8 13.06699.13 4.59 –2.12 2.0 1.4+8 8.3 t 5392.33 4.15 –1.30 2.5 2.0+8 14.56703.57 2.76 –3.01 2.0 1.0+8 38.1 t 5468.11 3.85 –1.68 2.5 1.6+8 11.8 K6704.50 4.22 –2.58 2.0 1.0+8 6.6 t 6175.37 4.09 –0.59 2.5 2.3+8 49.6 K6710.32 1.48 –4.81 2.0 1.7+7 16.6 t 6176.81 4.09 –0.34 2.5 1.4+8 64.2 K6713.04 4.61 –1.29 2.0 2.4+8 36.0 K 6316.58 4.15 –1.89 2.5 2.0+8 4.46713.74 4.79 –1.43 2.0 2.4+8 22.3 K 6502.22 3.40 –2.85 2.5 1.0+8 2.66796.12 4.14 –2.27 2.0 1.4+8 14.9 t 6635.13 4.42 –0.74 2.5 1.5+8 26.56806.85 2.73 –3.10 2.0 1.0+8 35.8 6813.61 5.34 –0.41 2.5 8.2+8 9.96810.26 4.61 –1.01 2.0 2.3+8 51.1 t 7110.90 1.94 –2.89 2.5 5.2+7 38.37107.46 4.19 –1.96 2.0 4.8+7 24.2 t 7126.71 3.54 –2.34 2.5 4.8+7 6.47114.57 2.69 –4.02 2.0 8.0+7 7.7 t 7414.51 1.99 –2.04 2.5 1.0+8 81.97120.58 4.14 –3.40 2.0 8.0+8 1.3 Cu i; log ε� = 4.217127.57 4.99 –1.07 2.0 4.9+8 30.2 t 5220.08 3.82 –0.61 2.50 1.0+8 16.47130.92 4.22 –0.66 2.0 2.1+8 97.7 t 7933.12 3.78 –0.27 2.50 1.0+8 35.97418.33 4.14 –2.84 2.0 5.5+7 4.7 t Y i; log ε� = 2.247418.67 4.14 –1.47 2.0 1.1+8 50.7 t 6435.04 0.07 –0.98 2.50 1.0+8 1.87421.55 4.64 –1.68 2.0 2.5+8 19.0 t 6687.50 0.00 –0.67 2.50 1.0+8 4.37440.91 4.91 –0.62 2.0 5.0+8 60.6 t Y ii; log ε� = 2.247751.11 4.99 –0.76 2.0 6.4+8 48.9 t 5402.78 1.84 –0.64 2.5 1.0+8 11.27941.09 3.27 –2.47 2.0 1.4+8 43.7 t 6795.42 1.70 –1.14 2.5 1.0+8 5.97955.71 5.03 –1.17 2.0 6.4+8 25.5 t 5473.39 1.74 –0.83 2.5 1.0+8 9.47959.14 5.03 –1.13 2.0 6.4+8 27.5 t Zr i; log ε� = 2.60Fe ii; log ε� = 7.51 5385.12 0.52 –0.97 2.5 1.0+8 1.3
6416.93 3.89 –2.69 2.0 3.4+8 41.5 + 6506.35 0.63 –0.64 2.5 1.0+8 2.56432.68 2.89 –3.62 2.0 2.9+8 42.3 7439.87 0.54 –1.00 2.5 1.0+8 1.56456.39 3.90 –2.21 2.0 3.4+8 65.0 Mo i; log ε� = 1.926516.08 2.89 –3.36 2.0 2.9+8 55.6 5570.39 1.33 0.43 2.5 1.0+8 9.6Co i; log ε� = 4.92 La ii; log ε� = 1.22
5301.04 1.71 –1.89 2.5 1.2+8 21.7 6320.42 0.17 –1.39 2.5 1.0+8 5.25312.65 4.21 –0.02 2.5 2.5+8 7.7 6390.49 0.32 –1.47 2.5 1.0+8 3.25483.36 1.71 –1.25 2.5 1.9+7 50.6 Nd ii; log ε� = 1.506455.00 3.63 –0.24 2.5 7.4+7 16.2 5319.82 0.55 0.02 2.5 1.0+8 18.86632.47 2.28 –1.73 2.5 6.5+6 11.8 Eu ii; log ε� = 0.516814.96 1.96 –1.76 2.5 2.1+7 20.6 6645.12 1.38 0.28 2.5 1.0+8 5.77417.39 2.04 –2.00 2.5 2.2+7 11.9 Hf ii; log ε� = 0.887437.07 5.98 1.13 2.5 7.0+7 2.6 5311.63 1.78 0.13 2.5 1.0+8 4.4
4.5. Atomic line data
The oscillator strengths were determined by requiringthat the abundances calculated for the solar model (Teff=5780 K, log g = 4.44, [Me/H]=0.00, ξt=1.00) should repro-duce the observed equivalent widths of the solar spectrum.The resulting log gf values are given in Table 2.
Different line broadening mechanisms, van der Waalsdamping, radiation damping, thermal Doppler broadeningand microturbulence were considered in the calculations ofequivalent widths and abundances. Enhancement factorsfor the van der Waals damping were compiled from the lit-erature. For iron lines values from Hannaford et al. (1992)
and Holweger et al. (1991) were used, for calcium valuesfrom Smith (1981) and references therein, for sodium val-ues from Holweger (1971) and for scandium values fromNeuforge (1992). For the remaining lines a correction fac-tor of 2.5 was adopted to the classical Unsold value, ac-cording to Mackle et al. (1975). For the (unimportant)radiation damping parameter values from Kurucz (1989)were adopted for lines from calcium through nickel.
244 S. Feltzing and B. Gustafsson: Abundances in metal-rich stars
Table 3. Effects on abundance estimates for a number of elements from changes in fundamental parameters of the modelatmosphere. The resulting abundances are shown for 3 stars: HD 72946 (Teff/log g/[Fe/H]) = (5911/4.4/0.24), HD 103932(4510/4.58/0.16), and HD 110010 (5965/4.08/0.35). The first line for each star gives [X/H], X being the ion indicated in theheader, derived using a model atmosphere constructed with the stellar parameters adopted in this study. The following linescontain the differences when effective temperature or surface gravity has been changed as indicated in the first column. Notethat the changes in parameters are different, and larger, for HD 103932
ID / ∆ [O i] Na i Mg i Al i S i Ca i Ti i Cr i Cr ii Fe i Fe ii Ni i Eu ii
HD 72946 0.16 0.22 0.24 0.23 0.13 0.22 0.38 0.24 0.09 0.24 0.00 0.18 0.09+100 K +0.01 +0.04 +0.04 +0.06 +0.01 +0.06 +0.08 +0.06 –0.03 +0.05 +0.01 +0.05 0.00+0.2 dex +0.09 –0.03 –0.01 –0.01 –0.01 –0.02 0.00 0.00 +0.08 –0.01 +0.12 +0.01 +0.08
HD 103932 0.28 0.30 0.14 0.27 –0.12 +0.03 0.01 0.44 0.14 0.57 0.41 0.32+200 K +0.05 –0.08 +0.12 –0.18 +0.18 +0.24 +0.12 –0.18 –0.04 –0.32 –0.05 –0.01+0.4 dex +0.16 +0.02 –0.04 +0.10 –0.04 –0.02 +0.02 +0.19 +0.07 +0.21 +0.09 +0.15
HD 110010 –0.04 0.53 0.48 0.40 0.51 0.35 0.29 0.30 0.22 0.35 0.33 0.31 0.16+100 K +0.01 +0.05 +0.04 +0.04 +0.01 +0.06 +0.08 +0.06 +0.03 +0.06 –0.05 +0.05 0.00+0.2 dex +0.09 –0.02 –0.01 –0.02 –0.01 –0.01 0.00 0.00 +0.08 –0.01 –0.03 0.00 +0.09
5. Errors in resulting abundances
5.1. Measurement of equivalent widths and fitting ofcontinua
If we assume that the true continuum level is not wildlydifferent from the fitted continuum the error in measuredequivalent width can at the most be as large, in difficultcases, as 2 mA for weak lines, i.e.∼ 20%, and 4 − 5 mAfor stronger lines, i.e.∼ 10%. This translates to typically0.08 dex in the resulting abundance derived from a lineof strength 10 mA and 0.04 dex for a line of strength50 mA. Apart from the effects of the continuum errorsand blends, the error in derived abundances due to errorsin the measurement of the equivalent width of a line isnegligible (< 0.01 dex). In general, the lines and continuaare, due to the high S/N and high resolution, easy to fitand the errors given above should be regarded as upperlimits.
5.2. Oscillator strengths
The oscillator strengths, derived from the observed solarspectrum, can be affected by misidentification, by unde-tected blends and by errors in continuum fitting and mea-surements of equivalent widths in the solar spectrum. Asin the stellar spectra, location of the continuum is a muchlarger source of error than the actual measurement of aline. (Note, however, that the solar spectra have higherS/N, usually ∼ 400, and thus, identification of the contin-uum becomes easier as well as identification of lines. TheSun is also more metal-poor than the programme stars,which makes identification of the continuum in the Suneasier.) Using the results in Sect. 5.1 we find that errorsin log gf -values may be as large as 0.08 dex, but a morecharacteristic number is 0.04 dex.
Since we perform a purely differential analysis errorsdue to misplaced continua, neglected blends, etc. shouldpartly cancel in the first approximation and not affect the
resulting differential abundances very much, as long as westudy stars similar to the Sun.
5.3. Blends
In the selection of lines we have carefully avoided all linesthat could be subject to blending with nearby lines asgiven in Moore et al. (1966). For ions with several linesmeasured we have also looked for lines which producesabnormally high abundances as compared with the ma-jority of the lines. This led us to exclude three Fe ii linesfrom our final analyses: 6383.71, 6383.45, and 6627.32 A.
5.4. Fundamental parameters of the model atmospheres
Edvardsson et al. (1993a) estimate the error in the effec-tive temperature due to errors in b − y to range from–50 K to +100 K and the corresponding error in log gto be ±0.2 dex.
The effects of such errors in Teff and log g are ex-emplified in Table 3. As expected, abundances derivedfrom ions are most sensitive to changes in surface gravitywhile abundances derived from atoms are most sensitiveto changes in effective temperature. In general, errors inderived abundances are smaller than 0.10 dex for atomswhen varying the effective temperature by ±100 K andless than 0.02 dex when the surface gravity is varied by±0.20 dex; they are smaller than 0.02 dex for ions whenthe effective temperature is varied and less than 0.10 dexwhen the surface gravity is varied.
5.5. Photometric versus spectroscopic metallicities
For dwarf stars that are significantly more metal-rich thanthe Sun (e.g. [Me/H]≈ 0.2 dex), the metallicity used in thecalculation of the model atmosphere is important, sinceit governs the line blanketing and thus the temperaturestructure of the model atmosphere. We may expect thatfinal derived abundances are sensitive to this parameter.
S. Feltzing and B. Gustafsson: Abundances in metal-rich stars 245
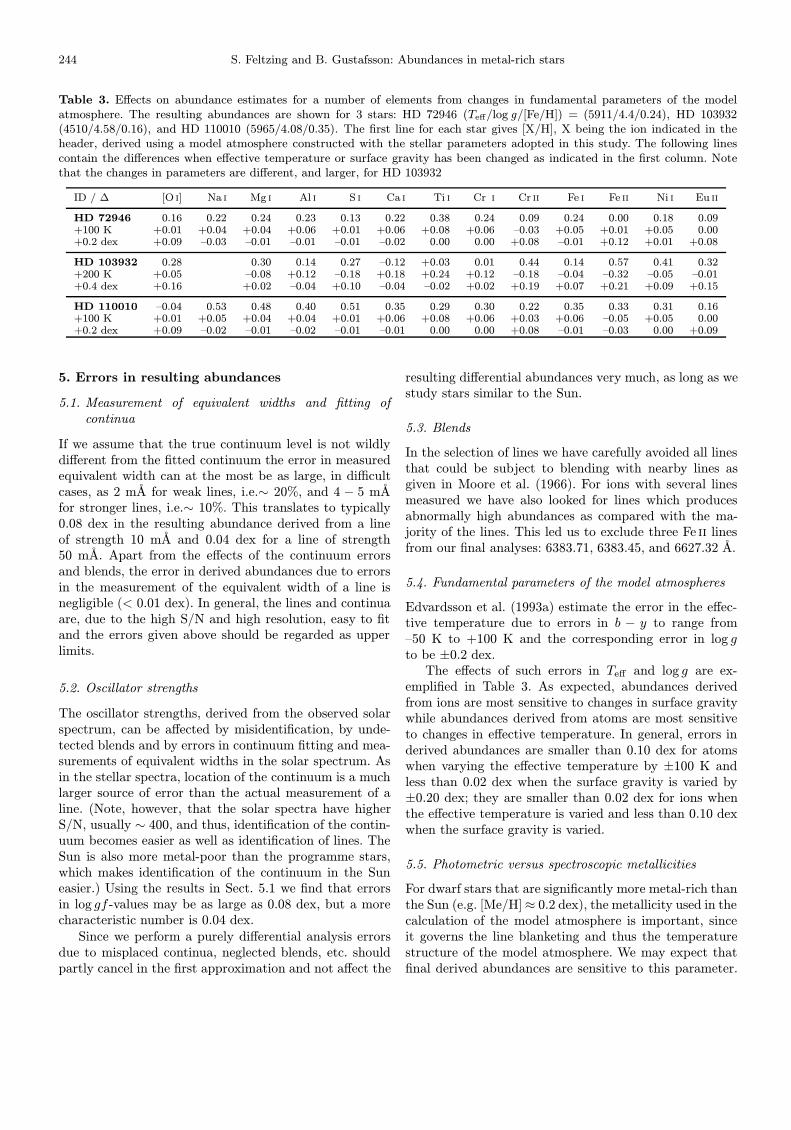
Following Edvardsson et al. (1993a) we decreased (andin a few cases increased) the metallicities to the valuesderived for [Fe/H] in a preliminary abundance analysisand reiterated the abundance determination. (We havedetermined iron abundances from lines arising from bothFe i and Fe ii. For Fe i usually more than 30 lines wereanalysed and for Fe ii three to four lines. The formal er-ror in the mean [Fe/H] derived from Fe i for a certain staris usually smaller than 0.02 dex.) In the mean we findthat we had to reduce the abundances by 0.07 dex fromthe initial photometric values, with a spread of 0.01 dex,Table 1. Apparently, our photometric metallicities tend tooverestimate the metal content in these metal-rich starsas compared to the iron abundance derived from spectralabundance analysis, Fig. 2.
Fig. 2. Metallicities determined from photometry vs. ironabundances derived in our spectral analysis. The one-to-onerelation is indicated by a dotted line and a least-square fit tothe data points, taking the error in [Fe/H] to be ±0.02 andthe error in the photometric metallicities to be ±0.1, is alsoshown, dashed line. The χ2-proabability for this fit is 0.92. Afit made without taking the errors into account is shown by along-dashed line. The stars from Barbuy & Grenon (1990), •,and HD 171999A and HD 175518, denoted by ◦ symbols, wereexcluded from the fit (see Sect. 5.5)
Usually, the differences between the metallicities es-timated from photometry, are close enough to those de-rived from spectroscopy that we have not found it nec-essary to reiterate the determination of effective temper-ature and log g. (The determination of metallicity was,however, changed according to the spectroscopic result sothat the final model used in the analysis had [Me/H] con-sistent with the resulting spectroscopic [Fe/H].) However,for some of the stars the photometry indicates rather ex-treme metallicities compared with the spectroscopic ironabundances. For HD 171999A we have only measured 6Fe i equivalent widths (since this star was only observedwith one CCD setting, see Sect. 3.1) and thus the spec-troscopically determined iron abundance is not as good as
for the other stars. However, we note that the line-to-linescatter is small, 0.03 dex. For HD 175518 it is questionableif its photometric metallicity is realistic. In any large cat-alogue there will always be a few stars with 2− 3σ errorsin the photometry. Since spectroscopic iron abundancesindicate a much lower metallicity this is most probably anexample of that.
We have studied, for HD 175518, the effects on derivedabundances if [Me/H] is lowered to 0.2 dex as indicatedby the spectroscopy, thus affecting the estimates of therest of the fundamental parameters. The lower metallicityimplies a lower effective temperature; [Me/H] = 0.22 dexcorresponds to a decrease of Teff by ∼200 K. From Table3 we see that most elements will change by ∼ 0.1 dexand thus the star will mainly move horizontally, by ∼ 0.1dex, in our relative abundance diagrams. HD 175518 isan extreme case in our sample and the abundances of theother stars and general abundance trends for the wholesample should not be affected by comparable amounts.
5.6. Effects of hyperfine structure
Some of the elements analysed are well known to be sub-ject to hyperfine structure. We have not taken this intoaccount when deriving the chemical abundances. Instead,for those elements in particular we have aimed at selectingweak enough lines, so that the neglect of hyperfine struc-ture in the abundance analysis should not affect the cal-culated equivalent widths and thus not the derived abun-dances.
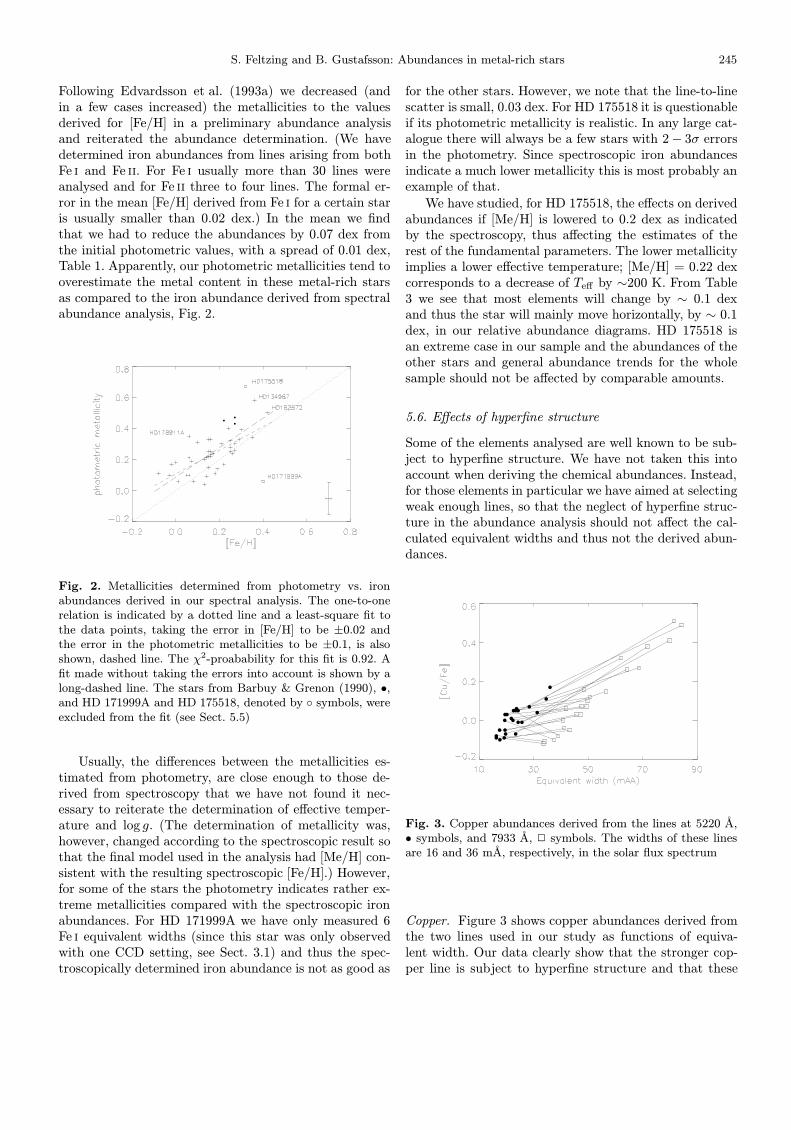
Fig. 3. Copper abundances derived from the lines at 5220 A,• symbols, and 7933 A, 2 symbols. The widths of these linesare 16 and 36 mA, respectively, in the solar flux spectrum
Copper. Figure 3 shows copper abundances derived fromthe two lines used in our study as functions of equiva-lent width. Our data clearly show that the stronger cop-per line is subject to hyperfine structure and that these
246 S. Feltzing and B. Gustafsson: Abundances in metal-rich stars
lines should be analysed using synthetic spectroscopy tak-ing the hyperfine structure splitting into account. Resultsby Summers (1994) may suggest departures from LTEin the population of levels in the copper atom. We donot, however, have enough data to make further empiricalinvestigations of such departures from LTE. We omit cop-per abundances from the following discussion.
Manganese and Cobalt. The manganese and cobalt linesused in this study are not saturated. When plotting abun-dances derived from each line as a function of equivalentwidth no distinct pattern was found; indicating that theomission of hyperfine structure in the treatment of thelines is not problematic. In many stars lines with equiv-alent widths of about 20 and 60 mA, respectively, gavemanganese abundances that are in excellent mutual agree-ment.
r- and s-process elements. The lines used to derive abun-dances for the heavy s- and r-process elements are suffi-ciently weak in our programme stars to be safely used asabundance criteria in spite of being subject to hyperfinestructure. Among the light s-process elements we note,however, that only Y ii, and maybe Y i, have lines strongenough and secure enough that derived abundances canbe used with confidence. The log gf -values for zirconiumare very uncertain because of the faintness of the lines inthe Sun.
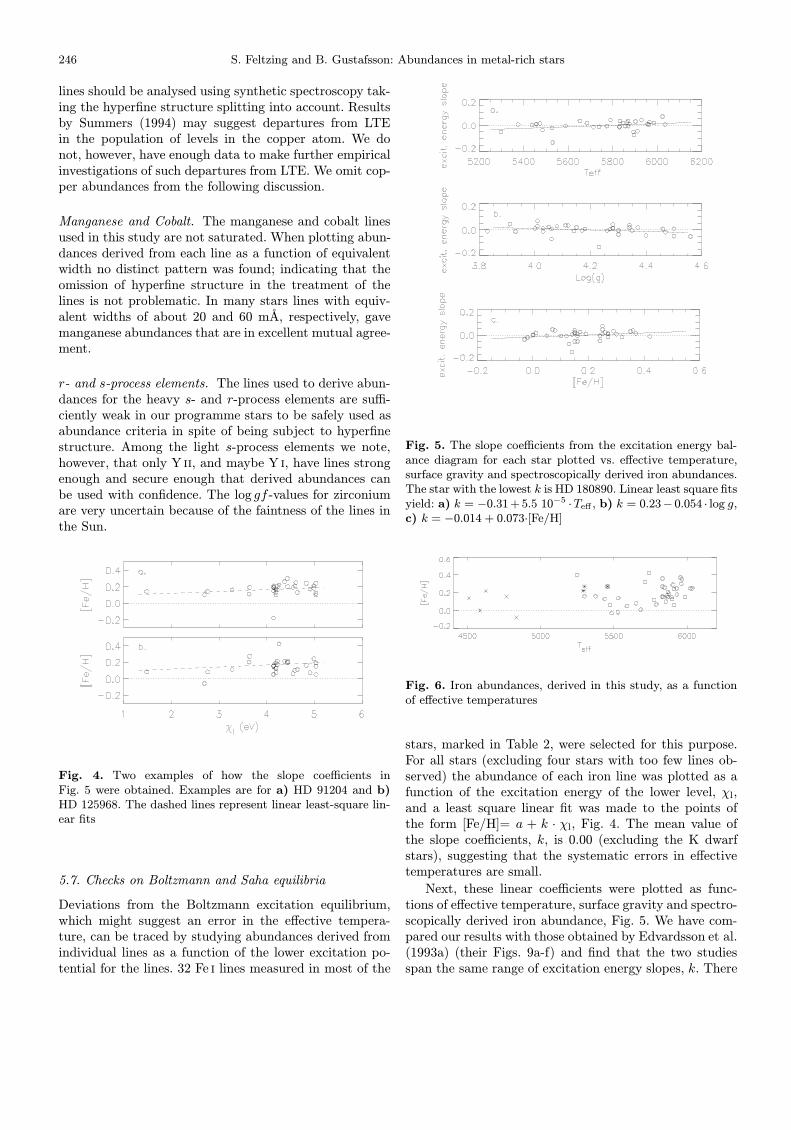
Fig. 4. Two examples of how the slope coefficients inFig. 5 were obtained. Examples are for a) HD 91204 and b)HD 125968. The dashed lines represent linear least-square lin-ear fits
5.7. Checks on Boltzmann and Saha equilibria
Deviations from the Boltzmann excitation equilibrium,which might suggest an error in the effective tempera-ture, can be traced by studying abundances derived fromindividual lines as a function of the lower excitation po-tential for the lines. 32 Fe i lines measured in most of the
Fig. 5. The slope coefficients from the excitation energy bal-ance diagram for each star plotted vs. effective temperature,surface gravity and spectroscopically derived iron abundances.The star with the lowest k is HD 180890. Linear least square fitsyield: a) k = −0.31 + 5.5 10−5 ·Teff , b) k = 0.23− 0.054 · log g,c) k = −0.014 + 0.073·[Fe/H]
Fig. 6. Iron abundances, derived in this study, as a functionof effective temperatures
stars, marked in Table 2, were selected for this purpose.For all stars (excluding four stars with too few lines ob-served) the abundance of each iron line was plotted as afunction of the excitation energy of the lower level, χl,and a least square linear fit was made to the points ofthe form [Fe/H]= a + k · χl, Fig. 4. The mean value ofthe slope coefficients, k, is 0.00 (excluding the K dwarfstars), suggesting that the systematic errors in effectivetemperatures are small.
Next, these linear coefficients were plotted as func-tions of effective temperature, surface gravity and spectro-scopically derived iron abundance, Fig. 5. We have com-pared our results with those obtained by Edvardsson et al.(1993a) (their Figs. 9a-f) and find that the two studiesspan the same range of excitation energy slopes, k. There
S. Feltzing and B. Gustafsson: Abundances in metal-rich stars 247
are small but systematic deviations from the excitationequilibrium, varying with effective temperature. A changein Teff of +100 K results in a ∆k of +0.006 dex eV−1. Thechange of excitation energy slope with surface gravity esti-mates seems to reflect the variation of surface gravity witheffective temperature (surface gravity increases as effectivetemperature decreases).
In many studies surface gravities are determined byrequiring ionization equilibrium. This is typically madeby changing the surface gravity until the iron abundancesderived from Fe i and Fe ii lines yield the same abundance.We have not, as discussed earlier, used this method. Aswe will see this has led us to discover what appears to bea case of significant overionization in K dwarf stars andan opposite smaller effect for the hotter stars (see Fig. 7).
What would the effects be if we assumed ionizationequilibrium, and adjusted the surface gravities accord-ingly? We can estimate changes in the stellar abundancesfrom the results of Table 3 and Table 11. From this we findthat half of the stars should have their surface gravitiesincreased by 0.25 − 0.35 dex to achieve ionization equi-librium for iron. This means that the the iron abundancewill change with ≈ −0.03. Abundances of other elementswill change with similar amounts but with differing signs,which means that for some elements [X/Fe] will changeby up to 0.1 dex and for others not at all. However, wenote that the oxygen abundances are very sensitive to thesurface gravity and may change by up to 0.2 dex. As acomparison we estimate the maximum error in the derivedoxygen abundance caused by incorrectly set continua tobe less than 0.1 dex.
An adjustment downwards of the gravities by about0.3 dex would increase the conflict with the gravity esti-mates from the Ca i 6162 A line wings. We consider sucha revision less probable.
5.8. K dwarf stars – overionization
Our results admit a comparison for five elements (scan-dium, vanadium, chromium, iron and yttrium) of abun-dances derived from ions to abundances derived from thecorresponding atom, as function of effective temperature,within a rather wide range of effective temperature.
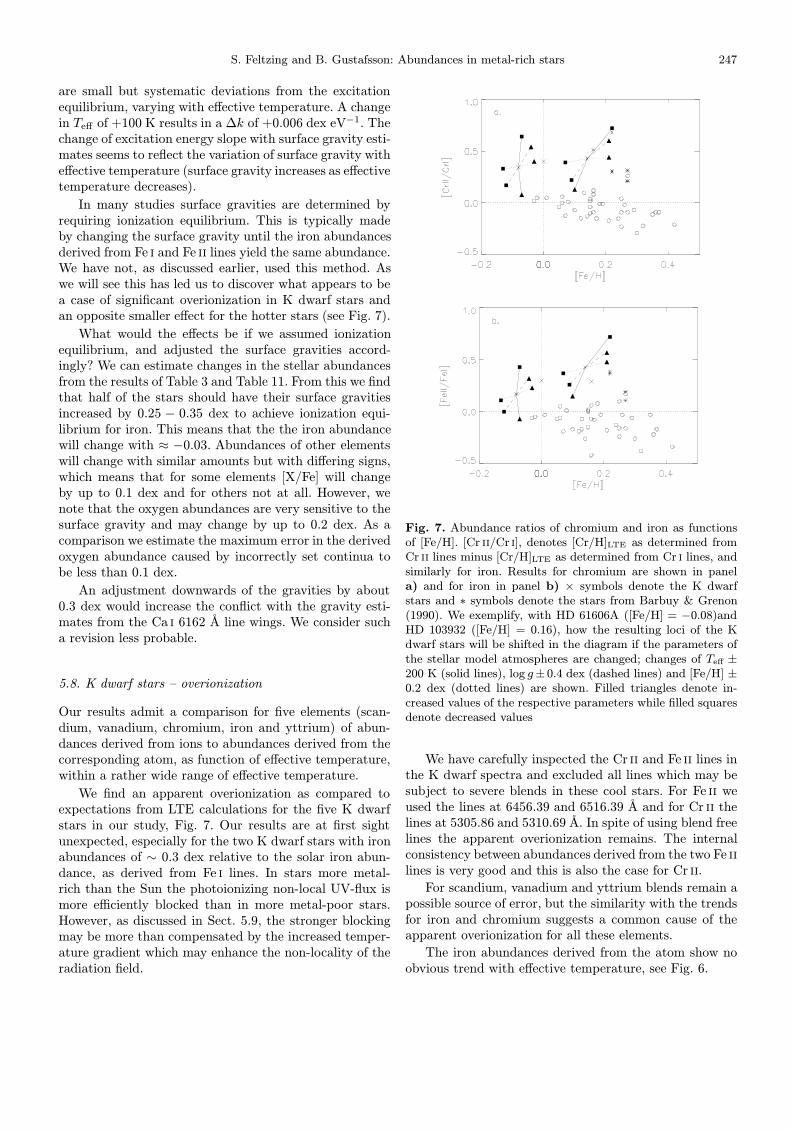
We find an apparent overionization as compared toexpectations from LTE calculations for the five K dwarfstars in our study, Fig. 7. Our results are at first sightunexpected, especially for the two K dwarf stars with ironabundances of ∼ 0.3 dex relative to the solar iron abun-dance, as derived from Fe i lines. In stars more metal-rich than the Sun the photoionizing non-local UV-flux ismore efficiently blocked than in more metal-poor stars.However, as discussed in Sect. 5.9, the stronger blockingmay be more than compensated by the increased temper-ature gradient which may enhance the non-locality of theradiation field.
Fig. 7. Abundance ratios of chromium and iron as functionsof [Fe/H]. [Cr ii/Cr i], denotes [Cr/H]LTE as determined fromCr ii lines minus [Cr/H]LTE as determined from Cr i lines, andsimilarly for iron. Results for chromium are shown in panela) and for iron in panel b) × symbols denote the K dwarfstars and ∗ symbols denote the stars from Barbuy & Grenon(1990). We exemplify, with HD 61606A ([Fe/H] = −0.08)andHD 103932 ([Fe/H] = 0.16), how the resulting loci of the Kdwarf stars will be shifted in the diagram if the parameters ofthe stellar model atmospheres are changed; changes of Teff ±200 K (solid lines), log g± 0.4 dex (dashed lines) and [Fe/H] ±0.2 dex (dotted lines) are shown. Filled triangles denote in-creased values of the respective parameters while filled squaresdenote decreased values
We have carefully inspected the Cr ii and Fe ii lines inthe K dwarf spectra and excluded all lines which may besubject to severe blends in these cool stars. For Fe ii weused the lines at 6456.39 and 6516.39 A and for Cr ii thelines at 5305.86 and 5310.69 A. In spite of using blend freelines the apparent overionization remains. The internalconsistency between abundances derived from the two Fe ii
lines is very good and this is also the case for Cr ii.
For scandium, vanadium and yttrium blends remain apossible source of error, but the similarity with the trendsfor iron and chromium suggests a common cause of theapparent overionization for all these elements.
The iron abundances derived from the atom show noobvious trend with effective temperature, see Fig. 6.
248 S. Feltzing and B. Gustafsson: Abundances in metal-rich stars
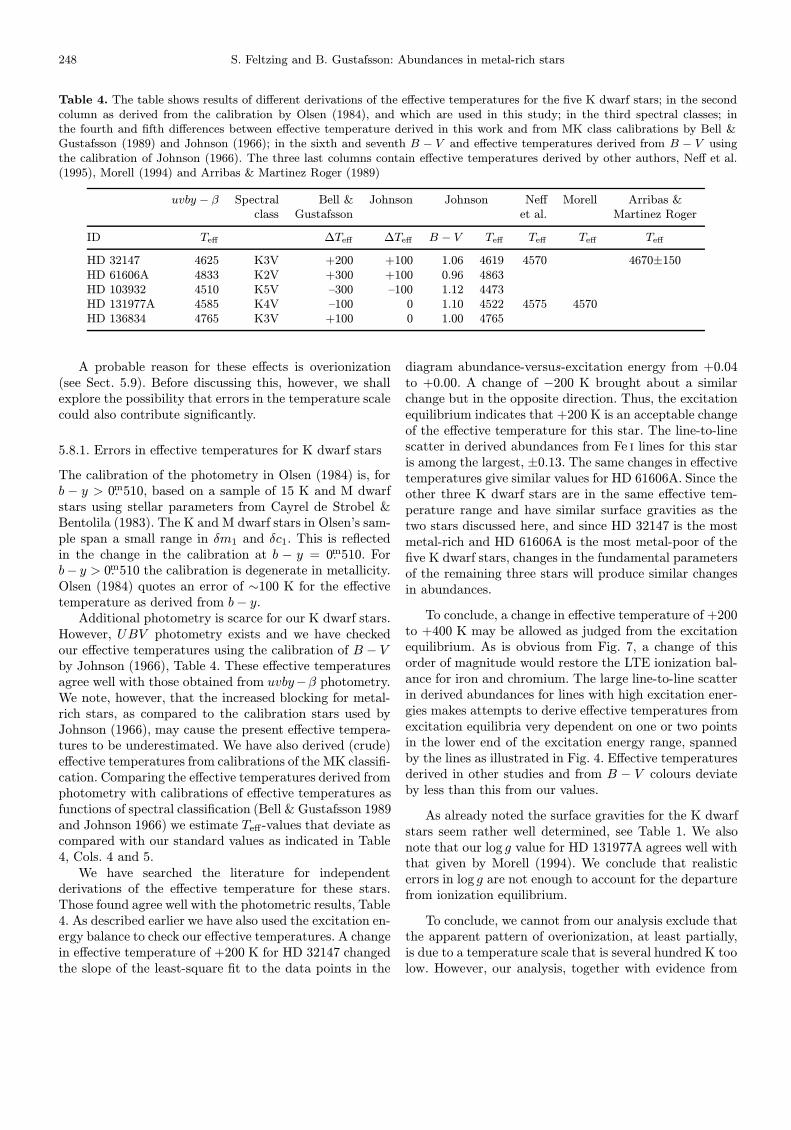
Table 4. The table shows results of different derivations of the effective temperatures for the five K dwarf stars; in the secondcolumn as derived from the calibration by Olsen (1984), and which are used in this study; in the third spectral classes; inthe fourth and fifth differences between effective temperature derived in this work and from MK class calibrations by Bell &Gustafsson (1989) and Johnson (1966); in the sixth and seventh B − V and effective temperatures derived from B − V usingthe calibration of Johnson (1966). The three last columns contain effective temperatures derived by other authors, Neff et al.(1995), Morell (1994) and Arribas & Martinez Roger (1989)
uvby − β Spectral Bell & Johnson Johnson Neff Morell Arribas &class Gustafsson et al. Martinez Roger
ID Teff ∆Teff ∆Teff B − V Teff Teff Teff Teff
HD 32147 4625 K3V +200 +100 1.06 4619 4570 4670±150HD 61606A 4833 K2V +300 +100 0.96 4863HD 103932 4510 K5V –300 –100 1.12 4473HD 131977A 4585 K4V –100 0 1.10 4522 4575 4570HD 136834 4765 K3V +100 0 1.00 4765
A probable reason for these effects is overionization(see Sect. 5.9). Before discussing this, however, we shallexplore the possibility that errors in the temperature scalecould also contribute significantly.
5.8.1. Errors in effective temperatures for K dwarf stars
The calibration of the photometry in Olsen (1984) is, forb − y > 0.m510, based on a sample of 15 K and M dwarfstars using stellar parameters from Cayrel de Strobel &Bentolila (1983). The K and M dwarf stars in Olsen’s sam-ple span a small range in δm1 and δc1. This is reflectedin the change in the calibration at b − y = 0.m510. Forb− y > 0.m510 the calibration is degenerate in metallicity.Olsen (1984) quotes an error of ∼100 K for the effectivetemperature as derived from b− y.
Additional photometry is scarce for our K dwarf stars.However, UBV photometry exists and we have checkedour effective temperatures using the calibration of B − Vby Johnson (1966), Table 4. These effective temperaturesagree well with those obtained from uvby−β photometry.We note, however, that the increased blocking for metal-rich stars, as compared to the calibration stars used byJohnson (1966), may cause the present effective tempera-tures to be underestimated. We have also derived (crude)effective temperatures from calibrations of the MK classifi-cation. Comparing the effective temperatures derived fromphotometry with calibrations of effective temperatures asfunctions of spectral classification (Bell & Gustafsson 1989and Johnson 1966) we estimate Teff-values that deviate ascompared with our standard values as indicated in Table4, Cols. 4 and 5.
We have searched the literature for independentderivations of the effective temperature for these stars.Those found agree well with the photometric results, Table4. As described earlier we have also used the excitation en-ergy balance to check our effective temperatures. A changein effective temperature of +200 K for HD 32147 changedthe slope of the least-square fit to the data points in the
diagram abundance-versus-excitation energy from +0.04to +0.00. A change of −200 K brought about a similarchange but in the opposite direction. Thus, the excitationequilibrium indicates that +200 K is an acceptable changeof the effective temperature for this star. The line-to-linescatter in derived abundances from Fe i lines for this staris among the largest, ±0.13. The same changes in effectivetemperatures give similar values for HD 61606A. Since theother three K dwarf stars are in the same effective tem-perature range and have similar surface gravities as thetwo stars discussed here, and since HD 32147 is the mostmetal-rich and HD 61606A is the most metal-poor of thefive K dwarf stars, changes in the fundamental parametersof the remaining three stars will produce similar changesin abundances.
To conclude, a change in effective temperature of +200to +400 K may be allowed as judged from the excitationequilibrium. As is obvious from Fig. 7, a change of thisorder of magnitude would restore the LTE ionization bal-ance for iron and chromium. The large line-to-line scatterin derived abundances for lines with high excitation ener-gies makes attempts to derive effective temperatures fromexcitation equilibria very dependent on one or two pointsin the lower end of the excitation energy range, spannedby the lines as illustrated in Fig. 4. Effective temperaturesderived in other studies and from B − V colours deviateby less than this from our values.
As already noted the surface gravities for the K dwarfstars seem rather well determined, see Table 1. We alsonote that our log g value for HD 131977A agrees well withthat given by Morell (1994). We conclude that realisticerrors in log g are not enough to account for the departurefrom ionization equilibrium.
To conclude, we cannot from our analysis exclude thatthe apparent pattern of overionization, at least partially,is due to a temperature scale that is several hundred K toolow. However, our analysis, together with evidence from
S. Feltzing and B. Gustafsson: Abundances in metal-rich stars 249
other studies, suggest that deviations from LTE is a moreplausible cause for the effects.
5.9. Non-LTE
No detailed study has been devoted to the non-LTE effectson abundance determinations for metal-rich dwarf stars,cooler than the Sun. A general result of the available stud-ies for solar-type stars is, however, that several differenteffects are at play and may counteract each other, and thismakes all extrapolation to the present study of metal-richdwarf stars from studies of other types of stars or studiesof other elements questionable.
Among the significant effects are (cf. Bruls et al. 1992)resonance line scattering, photon suction, ultraviolet ove-rionization, (infra)red over-recombination and optical linepumping. The resonance-line scattering effects, in whichphoton losses cause the source functions of resonance linesto drop far below the Planck function at depths greaterthan those where the line optical depth is unity, may leadto severe overestimates of abundances – e.g., Carlssonet al. (1994) find that in Li-rich cool stars the Li abun-dance may well be overestimated by a factor of 3 as aresult of this.
Photon suction may, for metal-rich cases in particu-lar, lead to overpopulation of, e.g., the ground state andthus inhibit the effects of overionization. This is the resultof a compensation of photon losses in the upper photo-sphere in resonance lines, as well as in connected laddersof transitions, by a downward population replenishmentflow from the continuum reservoir. It is of great signif-icance for atoms with a majority of corresponding ionsand with pronounced cascade ladders. For complex atomsit should be of greatest significance for the high-lying levelsthat thus can compensate population depletion processesat lower excitation energy, e.g. caused by overionization.
The ultraviolet overionization has been a major worryin analyses of late type stellar spectra for two decades.It arises because the mean intensity Jν drops belowthe Planck function Bν in the line-forming regions ofthe atmosphere on the blue side of the spectrum peak.Overionization is known to occur for Fe i in the Sunfrom levels a few electron volts below the continuum (seeRutten 1988 and references therein) and may more orless effect other metals as well (see, e.g., Baumueller &Gehren 1996; Bruls 1993). Overionization was suggestedby Auman & Woodrow (1975) to be significant for a num-ber of elements with lower ionization energies in cool stars.Major problems in modeling it are, however, the difficul-ties in predicting the ultraviolet flux of late-type stars withthe crowding of spectral lines and the possible existenceof an “unknown opacity” (cf., e.g. Gustafsson 1995), aswell as the dependence of the results of the notoriouslyuncertain collision cross sections, e.g. for collisions withH atoms (cf. Steenbock & Holweger 1984). Empirically,Mackle et al. (1975) and Ruland et al. (1980), found a ten-
dency for the low-excitation lines (χ ∼ 2 eV) of Fe i andTi i in K giant star spectra to give systematically lowerabundances than the high-excitation lines (χ ∼ 4.5 eV).The abundance difference was typically found to be 0.15dex. Subsequently, Steenbock (1985) succeeded in repro-ducing this result with statistical-equilibrium calculations.He found the effect to mainly reflect an overionization inupper layers (notably τ5000 < −2) of the atmospheres,where the low excitation lines are formed. The effect ismuch smaller in the solar spectrum, leading to system-atic errors in a differential analysis where red giants arecompared with the Sun.
For metal-rich stars, the blocking by the crowd of spec-tral lines in the ultraviolet could be expected to – at firstsight – strongly reduce the overionization effect, but thismay be compensated for by a steeper temperature gradi-ent in their atmospheres as a result of line blanketing ef-fects, as in the case of Li i, Carlsson et al. (1994), or of Ca i,Drake (1991). The latter study is particularly instructivefor judging the results of the present investigation. Drakefinds that for G and K-type stars the overionization effectson Ca i abundances increase with decreasing effective tem-perature, with increasing acceleration of gravity and withincreasing metallicity. At least the last two results mayseem contrary to intuition. They reflect the significanceof H i absorption shortwards of the Balmer discontinuity,which blocks more of the ionizing UV flux for the giantsthan for the dwarfs, and the afore-mentioned effects ofmetal-line blanketing on the temperature structure. Forthe K dwarf stars the effects on Ca i abundances may, ac-cording to Drake’s results, well result in an underestimateby a factor of two or more if LTE is assumed.
Over-recombination is important for photoionizationtransitions from levels close to the continuum (i.e. in theinfrared), since for them the angle-averaged Jν may dropbelow the local Planck function deep in the photosphere.This may produce net recombinations, and overpopulationof the upper levels.
Optical (ultraviolet) pumping occurs in strong lines,e.g. the resonance lines and is analogous to overioniza-tion in that it is driven by Jν > Bν . It is important, notthe least when it occurs in ultraviolet resonance lines andexcites the atoms to states which may be much more eas-ily photoionization due to a much richer radiation fieldsavailable at longer wavelengths, as was early suggested byAumann & Woodrow (1975). This is most important fortrace elements, and for metal-poor stars.
The complex interplay between these different mecha-nisms affects most levels of the atom, at great atmosphericdepths, for atoms where the strong lines get efficiently op-tically thin in the photosphere, i.e. for relatively rare ele-ments like the alkalis, while for the more abundant atomslike Fe and Mg the stronger, e.g. resonance, transitions arein detailed balance through most of the photosphere. Forthese, the relatively simple overionization phenomenon isprobably dominating, except for transitions very close to
250 S. Feltzing and B. Gustafsson: Abundances in metal-rich stars
the continuum for which e.g. photon suction may be sig-nificant.
In a recent study Gratton et al. (in prep.) have useddetailed statistical-equilibrium calculations to explore thedepartures from LTE for solar-type dwarfs as well as forred giants of different metallicities, and their effects onabundance determinations for O, Na, Mg, and Fe. Theseauthors find relatively small effects for stars cooler thanthe Sun for O i – LTE abundances from the IR tripletlines should be corrected downwards by less than 0.1 dexfor stars with Teff <∼ 6000 K. For Na i the subordinatelines are weakened by overionization and cascade by about0.1 dex for the solar-type dwarfs. The dominating effectfor Mg i is overionization, and the non-LTE abundancecorrections are thus generally positive. Typically the cor-rections are 0.1 dex in the dwarf stars. For Fe i, whereagain overionization is dominating the abundance correc-tions ' 0.1 dex. Most of these effects are found to begreater for Teff > 6000 K. It should be noted, however,that models for metal-rich dwarfs with Teff < 5000 K werenot included in this study.
Summing up the discussion of non-LTE we concludethat the effects on abundances are expected to be mainlydue to overionization for most of the elements. For thealkali atoms, as well as for the rare earths, more complexeffects may also be significant. Typically, errors of about0.1 dex may be expected in the differential results but thecomplexity of the interplay between different effects, andin particular the results obtained by Drake (1991) for Ca i,suggest that greater effects may be present, in particularfor the metal-rich K dwarf stars.
5.10. Collecting errors
We have shown that errors in fundamental parameters giveerrors in mean resulting abundances of less than 0.1 dex.For elemental abundances derived from several lines thismay be the dominating error, while for abundances de-rived from one single line errors due to blends and fittingof continua may be the main contributors to the overallerror. Deviations from LTE in the excitation and ioniza-tion balance may also be of importance, probably more sofor abundances based on few lines, in particular for the Kdwarf stars. We collect our best estimates of errors due todifferent sources in Table 5.
Table 5. The effects of error sources explored in this work onestimates of abundances relative to the Sun
Source of error Error in resulting relative abundance
Measurement of Wλ negligibleContinuum fitting < 0.09 dex, usually 0.05 dexTeff , log g < 0.1 dexNon-LTE effects 0.1 − 0.2 dex?Oscillator strengths <0.1 dex
5.11. Comparison of results for stars in common withother studies
The majority of our stars have not been studied beforethrough spectroscopic abundance analysis.
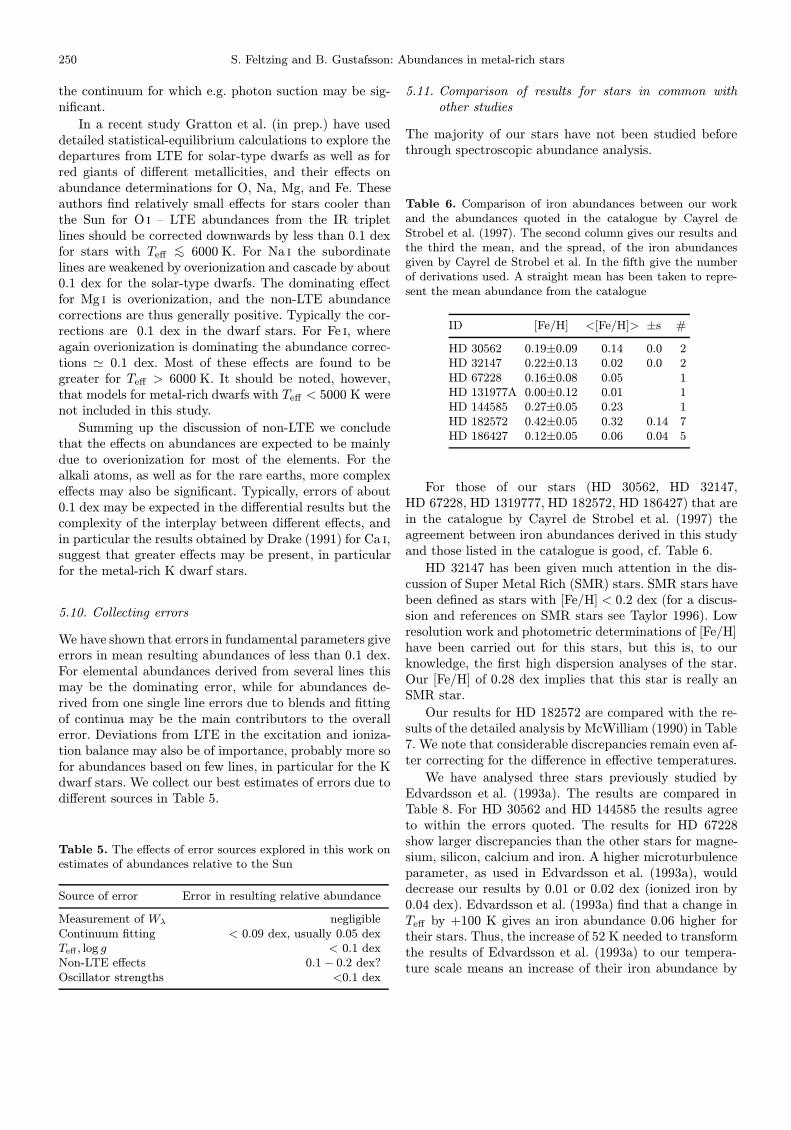
Table 6. Comparison of iron abundances between our workand the abundances quoted in the catalogue by Cayrel deStrobel et al. (1997). The second column gives our results andthe third the mean, and the spread, of the iron abundancesgiven by Cayrel de Strobel et al. In the fifth give the numberof derivations used. A straight mean has been taken to repre-sent the mean abundance from the catalogue
ID [Fe/H] <[Fe/H]> ±s #
HD 30562 0.19±0.09 0.14 0.0 2HD 32147 0.22±0.13 0.02 0.0 2HD 67228 0.16±0.08 0.05 1HD 131977A 0.00±0.12 0.01 1HD 144585 0.27±0.05 0.23 1HD 182572 0.42±0.05 0.32 0.14 7HD 186427 0.12±0.05 0.06 0.04 5
For those of our stars (HD 30562, HD 32147,HD 67228, HD 1319777, HD 182572, HD 186427) that arein the catalogue by Cayrel de Strobel et al. (1997) theagreement between iron abundances derived in this studyand those listed in the catalogue is good, cf. Table 6.
HD 32147 has been given much attention in the dis-cussion of Super Metal Rich (SMR) stars. SMR stars havebeen defined as stars with [Fe/H] < 0.2 dex (for a discus-sion and references on SMR stars see Taylor 1996). Lowresolution work and photometric determinations of [Fe/H]have been carried out for this stars, but this is, to ourknowledge, the first high dispersion analyses of the star.Our [Fe/H] of 0.28 dex implies that this star is really anSMR star.
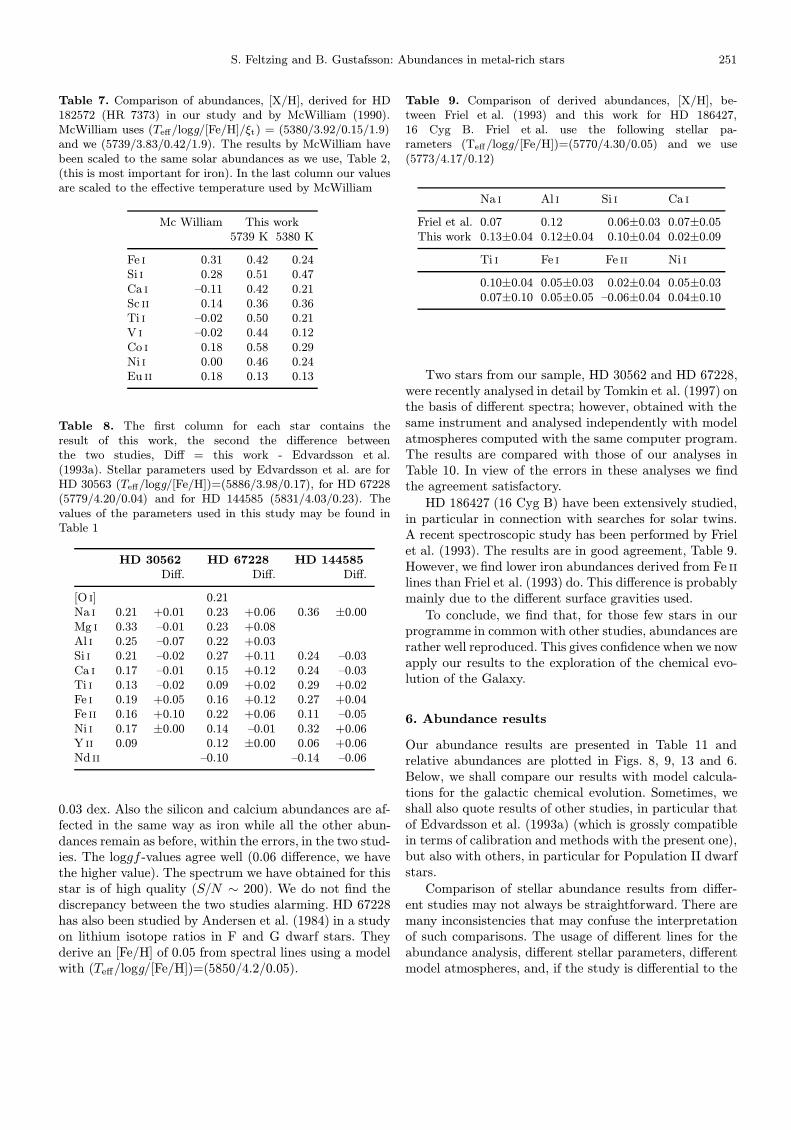
Our results for HD 182572 are compared with the re-sults of the detailed analysis by McWilliam (1990) in Table7. We note that considerable discrepancies remain even af-ter correcting for the difference in effective temperatures.
We have analysed three stars previously studied byEdvardsson et al. (1993a). The results are compared inTable 8. For HD 30562 and HD 144585 the results agreeto within the errors quoted. The results for HD 67228show larger discrepancies than the other stars for magne-sium, silicon, calcium and iron. A higher microturbulenceparameter, as used in Edvardsson et al. (1993a), woulddecrease our results by 0.01 or 0.02 dex (ionized iron by0.04 dex). Edvardsson et al. (1993a) find that a change inTeff by +100 K gives an iron abundance 0.06 higher fortheir stars. Thus, the increase of 52 K needed to transformthe results of Edvardsson et al. (1993a) to our tempera-ture scale means an increase of their iron abundance by
S. Feltzing and B. Gustafsson: Abundances in metal-rich stars 251
Table 7. Comparison of abundances, [X/H], derived for HD182572 (HR 7373) in our study and by McWilliam (1990).McWilliam uses (Teff/logg/[Fe/H]/ξt) = (5380/3.92/0.15/1.9)and we (5739/3.83/0.42/1.9). The results by McWilliam havebeen scaled to the same solar abundances as we use, Table 2,(this is most important for iron). In the last column our valuesare scaled to the effective temperature used by McWilliam
Mc William This work5739 K 5380 K
Fe i 0.31 0.42 0.24Si i 0.28 0.51 0.47Ca i –0.11 0.42 0.21Sc ii 0.14 0.36 0.36Ti i –0.02 0.50 0.21V i –0.02 0.44 0.12Co i 0.18 0.58 0.29Ni i 0.00 0.46 0.24Eu ii 0.18 0.13 0.13
Table 8. The first column for each star contains theresult of this work, the second the difference betweenthe two studies, Diff = this work - Edvardsson et al.(1993a). Stellar parameters used by Edvardsson et al. are forHD 30563 (Teff/logg/[Fe/H])=(5886/3.98/0.17), for HD 67228(5779/4.20/0.04) and for HD 144585 (5831/4.03/0.23). Thevalues of the parameters used in this study may be found inTable 1
HD 30562 HD 67228 HD 144585Diff. Diff. Diff.
[O i] 0.21Na i 0.21 +0.01 0.23 +0.06 0.36 ±0.00Mg i 0.33 –0.01 0.23 +0.08Al i 0.25 –0.07 0.22 +0.03Si i 0.21 –0.02 0.27 +0.11 0.24 –0.03Ca i 0.17 –0.01 0.15 +0.12 0.24 –0.03Ti i 0.13 –0.02 0.09 +0.02 0.29 +0.02Fe i 0.19 +0.05 0.16 +0.12 0.27 +0.04Fe ii 0.16 +0.10 0.22 +0.06 0.11 –0.05Ni i 0.17 ±0.00 0.14 –0.01 0.32 +0.06Y ii 0.09 0.12 ±0.00 0.06 +0.06Nd ii –0.10 –0.14 –0.06
0.03 dex. Also the silicon and calcium abundances are af-fected in the same way as iron while all the other abun-dances remain as before, within the errors, in the two stud-ies. The loggf -values agree well (0.06 difference, we havethe higher value). The spectrum we have obtained for thisstar is of high quality (S/N ∼ 200). We do not find thediscrepancy between the two studies alarming. HD 67228has also been studied by Andersen et al. (1984) in a studyon lithium isotope ratios in F and G dwarf stars. Theyderive an [Fe/H] of 0.05 from spectral lines using a modelwith (Teff/logg/[Fe/H])=(5850/4.2/0.05).
Table 9. Comparison of derived abundances, [X/H], be-tween Friel et al. (1993) and this work for HD 186427,16 Cyg B. Friel et al. use the following stellar pa-rameters (Teff/logg/[Fe/H])=(5770/4.30/0.05) and we use(5773/4.17/0.12)
Na i Al i Si i Ca i
Friel et al. 0.07 0.12 0.06±0.03 0.07±0.05This work 0.13±0.04 0.12±0.04 0.10±0.04 0.02±0.09
Ti i Fe i Fe ii Ni i
0.10±0.04 0.05±0.03 0.02±0.04 0.05±0.030.07±0.10 0.05±0.05 –0.06±0.04 0.04±0.10
Two stars from our sample, HD 30562 and HD 67228,were recently analysed in detail by Tomkin et al. (1997) onthe basis of different spectra; however, obtained with thesame instrument and analysed independently with modelatmospheres computed with the same computer program.The results are compared with those of our analyses inTable 10. In view of the errors in these analyses we findthe agreement satisfactory.
HD 186427 (16 Cyg B) have been extensively studied,in particular in connection with searches for solar twins.A recent spectroscopic study has been performed by Frielet al. (1993). The results are in good agreement, Table 9.However, we find lower iron abundances derived from Fe ii
lines than Friel et al. (1993) do. This difference is probablymainly due to the different surface gravities used.
To conclude, we find that, for those few stars in ourprogramme in common with other studies, abundances arerather well reproduced. This gives confidence when we nowapply our results to the exploration of the chemical evo-lution of the Galaxy.
6. Abundance results
Our abundance results are presented in Table 11 andrelative abundances are plotted in Figs. 8, 9, 13 and 6.Below, we shall compare our results with model calcula-tions for the galactic chemical evolution. Sometimes, weshall also quote results of other studies, in particular thatof Edvardsson et al. (1993a) (which is grossly compatiblein terms of calibration and methods with the present one),but also with others, in particular for Population II dwarfstars.
Comparison of stellar abundance results from differ-ent studies may not always be straightforward. There aremany inconsistencies that may confuse the interpretationof such comparisons. The usage of different lines for theabundance analysis, different stellar parameters, differentmodel atmospheres, and, if the study is differential to the
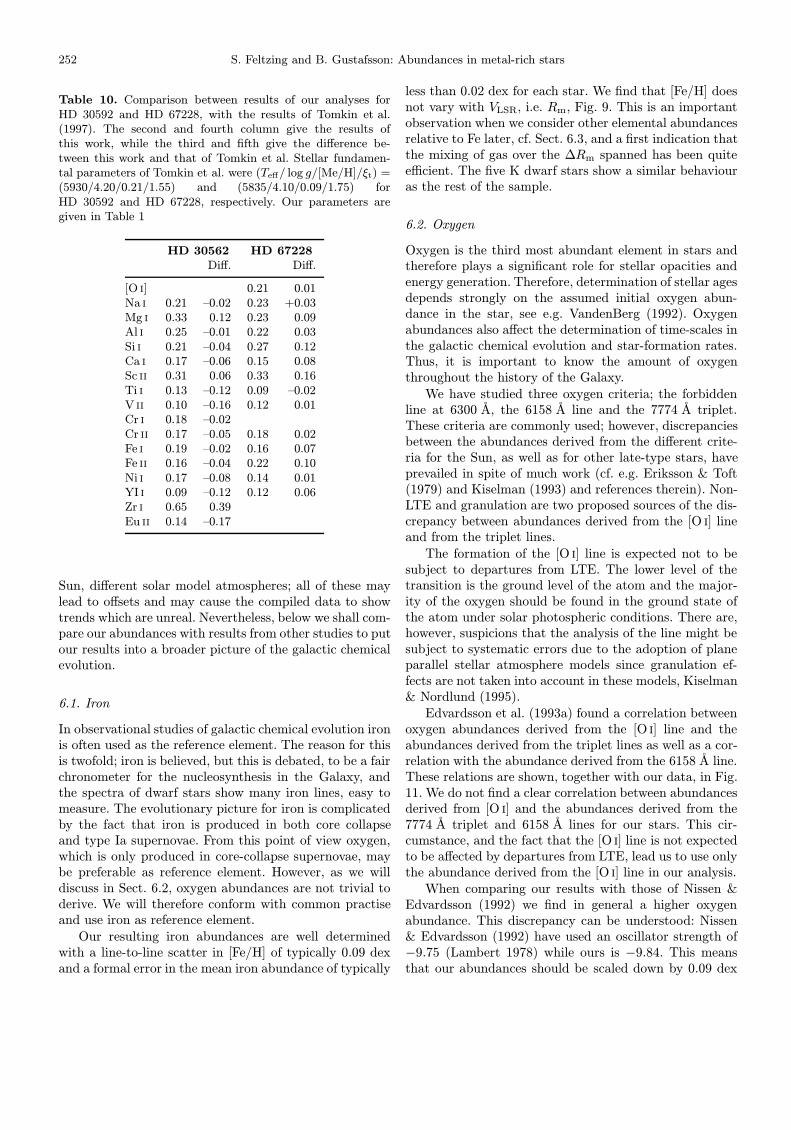
252 S. Feltzing and B. Gustafsson: Abundances in metal-rich stars
Table 10. Comparison between results of our analyses forHD 30592 and HD 67228, with the results of Tomkin et al.(1997). The second and fourth column give the results ofthis work, while the third and fifth give the difference be-tween this work and that of Tomkin et al. Stellar fundamen-tal parameters of Tomkin et al. were (Teff/ log g/[Me/H]/ξt) =(5930/4.20/0.21/1.55) and (5835/4.10/0.09/1.75) forHD 30592 and HD 67228, respectively. Our parameters aregiven in Table 1
HD 30562 HD 67228Diff. Diff.
[O i] 0.21 0.01Na i 0.21 –0.02 0.23 +0.03Mg i 0.33 0.12 0.23 0.09Al i 0.25 –0.01 0.22 0.03Si i 0.21 –0.04 0.27 0.12Ca i 0.17 –0.06 0.15 0.08Sc ii 0.31 0.06 0.33 0.16Ti i 0.13 –0.12 0.09 –0.02V ii 0.10 –0.16 0.12 0.01Cr i 0.18 –0.02Cr ii 0.17 –0.05 0.18 0.02Fe i 0.19 –0.02 0.16 0.07Fe ii 0.16 –0.04 0.22 0.10Ni i 0.17 –0.08 0.14 0.01YI i 0.09 –0.12 0.12 0.06Zr i 0.65 0.39Eu ii 0.14 –0.17
Sun, different solar model atmospheres; all of these maylead to offsets and may cause the compiled data to showtrends which are unreal. Nevertheless, below we shall com-pare our abundances with results from other studies to putour results into a broader picture of the galactic chemicalevolution.
6.1. Iron
In observational studies of galactic chemical evolution ironis often used as the reference element. The reason for thisis twofold; iron is believed, but this is debated, to be a fairchronometer for the nucleosynthesis in the Galaxy, andthe spectra of dwarf stars show many iron lines, easy tomeasure. The evolutionary picture for iron is complicatedby the fact that iron is produced in both core collapseand type Ia supernovae. From this point of view oxygen,which is only produced in core-collapse supernovae, maybe preferable as reference element. However, as we willdiscuss in Sect. 6.2, oxygen abundances are not trivial toderive. We will therefore conform with common practiseand use iron as reference element.
Our resulting iron abundances are well determinedwith a line-to-line scatter in [Fe/H] of typically 0.09 dexand a formal error in the mean iron abundance of typically
less than 0.02 dex for each star. We find that [Fe/H] doesnot vary with VLSR, i.e. Rm, Fig. 9. This is an importantobservation when we consider other elemental abundancesrelative to Fe later, cf. Sect. 6.3, and a first indication thatthe mixing of gas over the ∆Rm spanned has been quiteefficient. The five K dwarf stars show a similar behaviouras the rest of the sample.
6.2. Oxygen
Oxygen is the third most abundant element in stars andtherefore plays a significant role for stellar opacities andenergy generation. Therefore, determination of stellar agesdepends strongly on the assumed initial oxygen abun-dance in the star, see e.g. VandenBerg (1992). Oxygenabundances also affect the determination of time-scales inthe galactic chemical evolution and star-formation rates.Thus, it is important to know the amount of oxygenthroughout the history of the Galaxy.
We have studied three oxygen criteria; the forbiddenline at 6300 A, the 6158 A line and the 7774 A triplet.These criteria are commonly used; however, discrepanciesbetween the abundances derived from the different crite-ria for the Sun, as well as for other late-type stars, haveprevailed in spite of much work (cf. e.g. Eriksson & Toft(1979) and Kiselman (1993) and references therein). Non-LTE and granulation are two proposed sources of the dis-crepancy between abundances derived from the [O i] lineand from the triplet lines.
The formation of the [O i] line is expected not to besubject to departures from LTE. The lower level of thetransition is the ground level of the atom and the major-ity of the oxygen should be found in the ground state ofthe atom under solar photospheric conditions. There are,however, suspicions that the analysis of the line might besubject to systematic errors due to the adoption of planeparallel stellar atmosphere models since granulation ef-fects are not taken into account in these models, Kiselman& Nordlund (1995).
Edvardsson et al. (1993a) found a correlation betweenoxygen abundances derived from the [O i] line and theabundances derived from the triplet lines as well as a cor-relation with the abundance derived from the 6158 A line.These relations are shown, together with our data, in Fig.11. We do not find a clear correlation between abundancesderived from [O i] and the abundances derived from the7774 A triplet and 6158 A lines for our stars. This cir-cumstance, and the fact that the [O i] line is not expectedto be affected by departures from LTE, lead us to use onlythe abundance derived from the [O i] line in our analysis.
When comparing our results with those of Nissen &Edvardsson (1992) we find in general a higher oxygenabundance. This discrepancy can be understood: Nissen& Edvardsson (1992) have used an oscillator strength of−9.75 (Lambert 1978) while ours is −9.84. This meansthat our abundances should be scaled down by 0.09 dex
S. Feltzing and B. Gustafsson: Abundances in metal-rich stars 253
Table 11. Elemental abundances our programme stars. For each star and each ion the derived elemental abundance, theline-to-line scatter (the error in the mean = line-to-line scatter/
√nlines) and the number of lines used in the analysis are given.
The table is continued on the following pages. This table is only published electronically
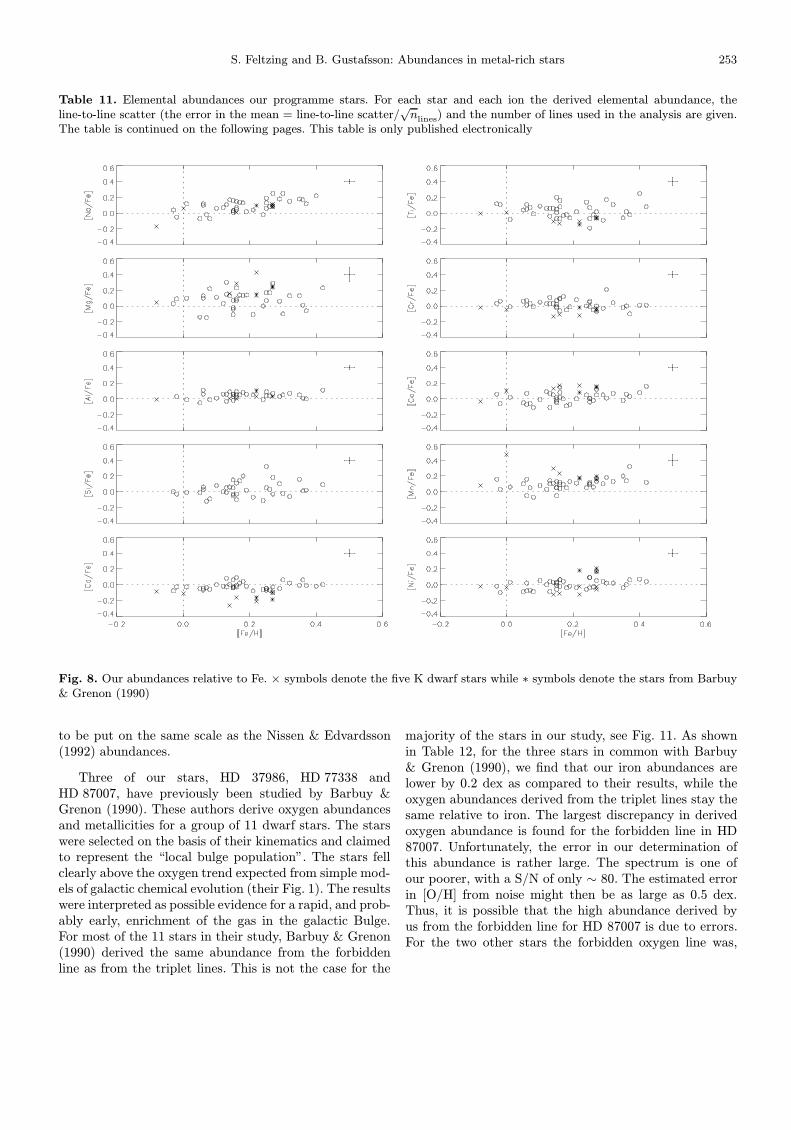
Fig. 8. Our abundances relative to Fe. × symbols denote the five K dwarf stars while ∗ symbols denote the stars from Barbuy& Grenon (1990)
to be put on the same scale as the Nissen & Edvardsson(1992) abundances.
Three of our stars, HD 37986, HD 77338 andHD 87007, have previously been studied by Barbuy &Grenon (1990). These authors derive oxygen abundancesand metallicities for a group of 11 dwarf stars. The starswere selected on the basis of their kinematics and claimedto represent the “local bulge population”. The stars fellclearly above the oxygen trend expected from simple mod-els of galactic chemical evolution (their Fig. 1). The resultswere interpreted as possible evidence for a rapid, and prob-ably early, enrichment of the gas in the galactic Bulge.For most of the 11 stars in their study, Barbuy & Grenon(1990) derived the same abundance from the forbiddenline as from the triplet lines. This is not the case for the
majority of the stars in our study, see Fig. 11. As shownin Table 12, for the three stars in common with Barbuy& Grenon (1990), we find that our iron abundances arelower by 0.2 dex as compared to their results, while theoxygen abundances derived from the triplet lines stay thesame relative to iron. The largest discrepancy in derivedoxygen abundance is found for the forbidden line in HD87007. Unfortunately, the error in our determination ofthis abundance is rather large. The spectrum is one ofour poorer, with a S/N of only ∼ 80. The estimated errorin [O/H] from noise might then be as large as 0.5 dex.Thus, it is possible that the high abundance derived byus from the forbidden line for HD 87007 is due to errors.For the two other stars the forbidden oxygen line was,
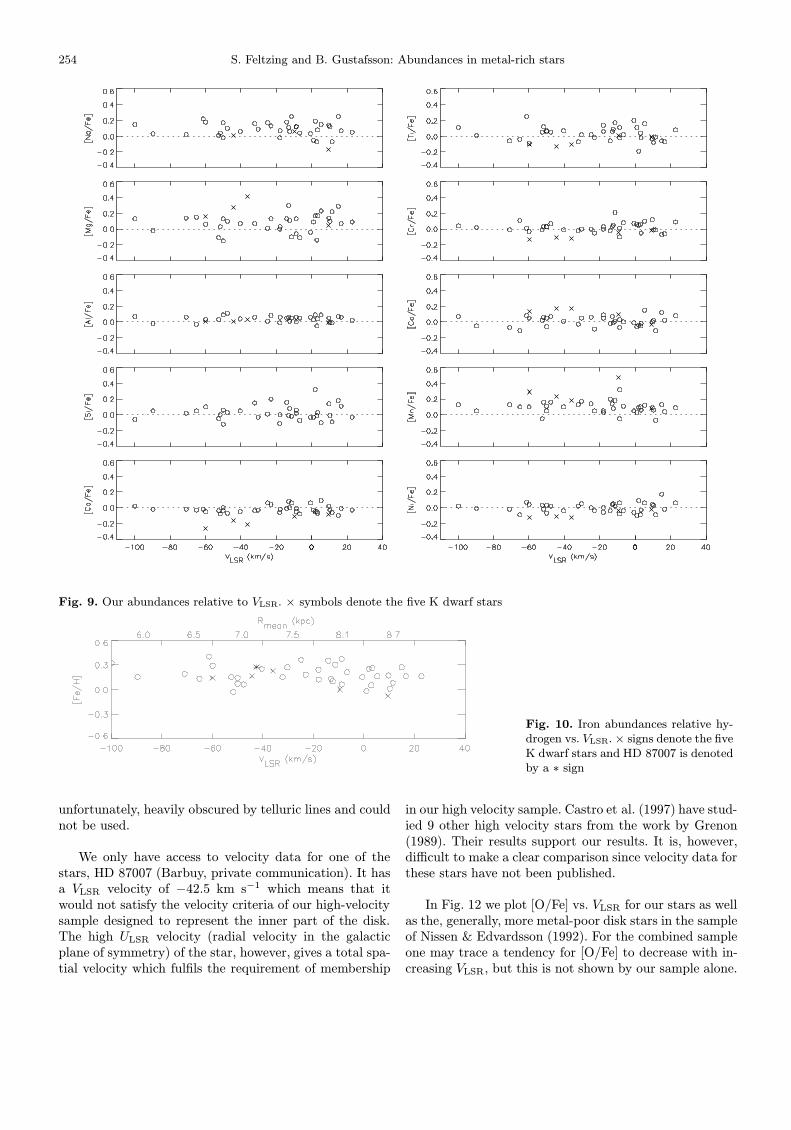
254 S. Feltzing and B. Gustafsson: Abundances in metal-rich stars
Fig. 9. Our abundances relative to VLSR. × symbols denote the five K dwarf stars
Fig. 10. Iron abundances relative hy-drogen vs. VLSR.× signs denote the fiveK dwarf stars and HD 87007 is denotedby a ∗ sign
unfortunately, heavily obscured by telluric lines and couldnot be used.
We only have access to velocity data for one of thestars, HD 87007 (Barbuy, private communication). It hasa VLSR velocity of −42.5 km s−1 which means that itwould not satisfy the velocity criteria of our high-velocitysample designed to represent the inner part of the disk.The high ULSR velocity (radial velocity in the galacticplane of symmetry) of the star, however, gives a total spa-tial velocity which fulfils the requirement of membership
in our high velocity sample. Castro et al. (1997) have stud-ied 9 other high velocity stars from the work by Grenon(1989). Their results support our results. It is, however,difficult to make a clear comparison since velocity data forthese stars have not been published.
In Fig. 12 we plot [O/Fe] vs. VLSR for our stars as wellas the, generally, more metal-poor disk stars in the sampleof Nissen & Edvardsson (1992). For the combined sampleone may trace a tendency for [O/Fe] to decrease with in-creasing VLSR, but this is not shown by our sample alone.
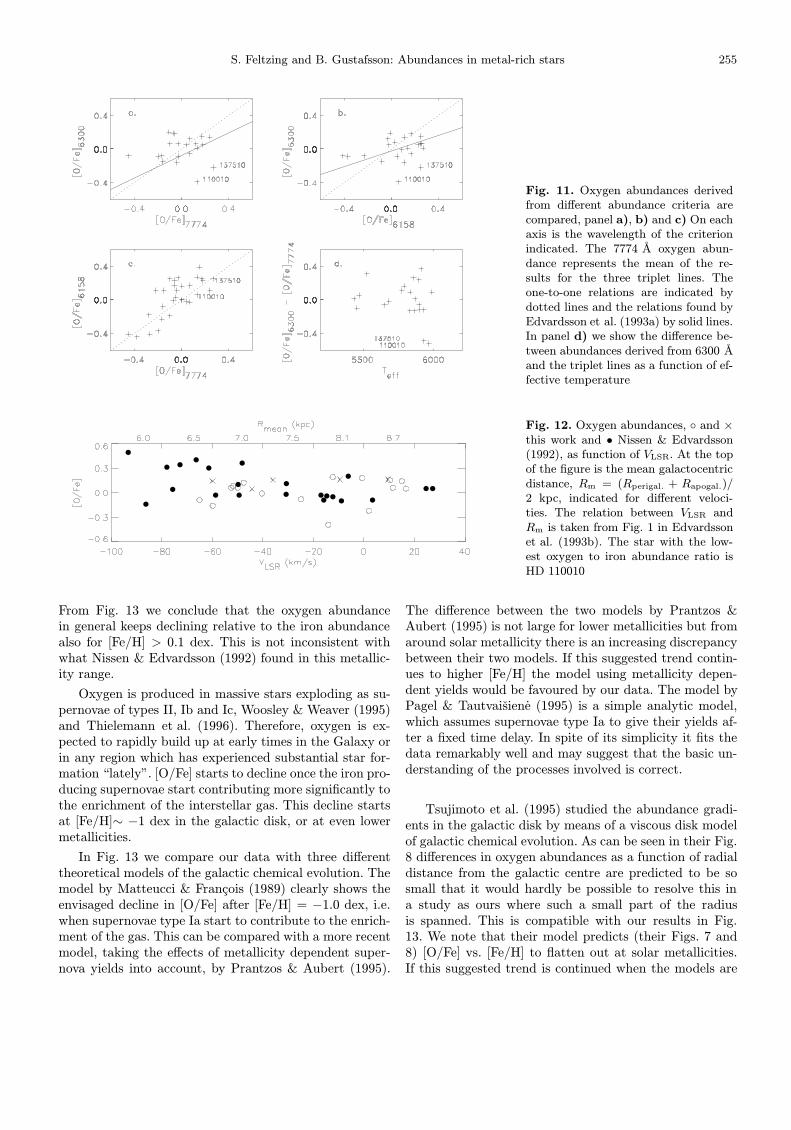
S. Feltzing and B. Gustafsson: Abundances in metal-rich stars 255
Fig. 11. Oxygen abundances derivedfrom different abundance criteria arecompared, panel a), b) and c) On eachaxis is the wavelength of the criterionindicated. The 7774 A oxygen abun-dance represents the mean of the re-sults for the three triplet lines. Theone-to-one relations are indicated bydotted lines and the relations found byEdvardsson et al. (1993a) by solid lines.In panel d) we show the difference be-tween abundances derived from 6300 Aand the triplet lines as a function of ef-fective temperature
Fig. 12. Oxygen abundances, ◦ and ×this work and • Nissen & Edvardsson(1992), as function of VLSR. At the topof the figure is the mean galactocentricdistance, Rm = (Rperigal. + Rapogal.)/2 kpc, indicated for different veloci-ties. The relation between VLSR andRm is taken from Fig. 1 in Edvardssonet al. (1993b). The star with the low-est oxygen to iron abundance ratio isHD 110010
From Fig. 13 we conclude that the oxygen abundancein general keeps declining relative to the iron abundancealso for [Fe/H] > 0.1 dex. This is not inconsistent withwhat Nissen & Edvardsson (1992) found in this metallic-ity range.
Oxygen is produced in massive stars exploding as su-pernovae of types II, Ib and Ic, Woosley & Weaver (1995)and Thielemann et al. (1996). Therefore, oxygen is ex-pected to rapidly build up at early times in the Galaxy orin any region which has experienced substantial star for-mation “lately”. [O/Fe] starts to decline once the iron pro-ducing supernovae start contributing more significantly tothe enrichment of the interstellar gas. This decline startsat [Fe/H]∼ −1 dex in the galactic disk, or at even lowermetallicities.
In Fig. 13 we compare our data with three differenttheoretical models of the galactic chemical evolution. Themodel by Matteucci & Francois (1989) clearly shows theenvisaged decline in [O/Fe] after [Fe/H] = −1.0 dex, i.e.when supernovae type Ia start to contribute to the enrich-ment of the gas. This can be compared with a more recentmodel, taking the effects of metallicity dependent super-nova yields into account, by Prantzos & Aubert (1995).
The difference between the two models by Prantzos &Aubert (1995) is not large for lower metallicities but fromaround solar metallicity there is an increasing discrepancybetween their two models. If this suggested trend contin-ues to higher [Fe/H] the model using metallicity depen-dent yields would be favoured by our data. The model byPagel & Tautvaisiene (1995) is a simple analytic model,which assumes supernovae type Ia to give their yields af-ter a fixed time delay. In spite of its simplicity it fits thedata remarkably well and may suggest that the basic un-derstanding of the processes involved is correct.
Tsujimoto et al. (1995) studied the abundance gradi-ents in the galactic disk by means of a viscous disk modelof galactic chemical evolution. As can be seen in their Fig.8 differences in oxygen abundances as a function of radialdistance from the galactic centre are predicted to be sosmall that it would hardly be possible to resolve this ina study as ours where such a small part of the radiusis spanned. This is compatible with our results in Fig.13. We note that their model predicts (their Figs. 7 and8) [O/Fe] vs. [Fe/H] to flatten out at solar metallicities.If this suggested trend is continued when the models are
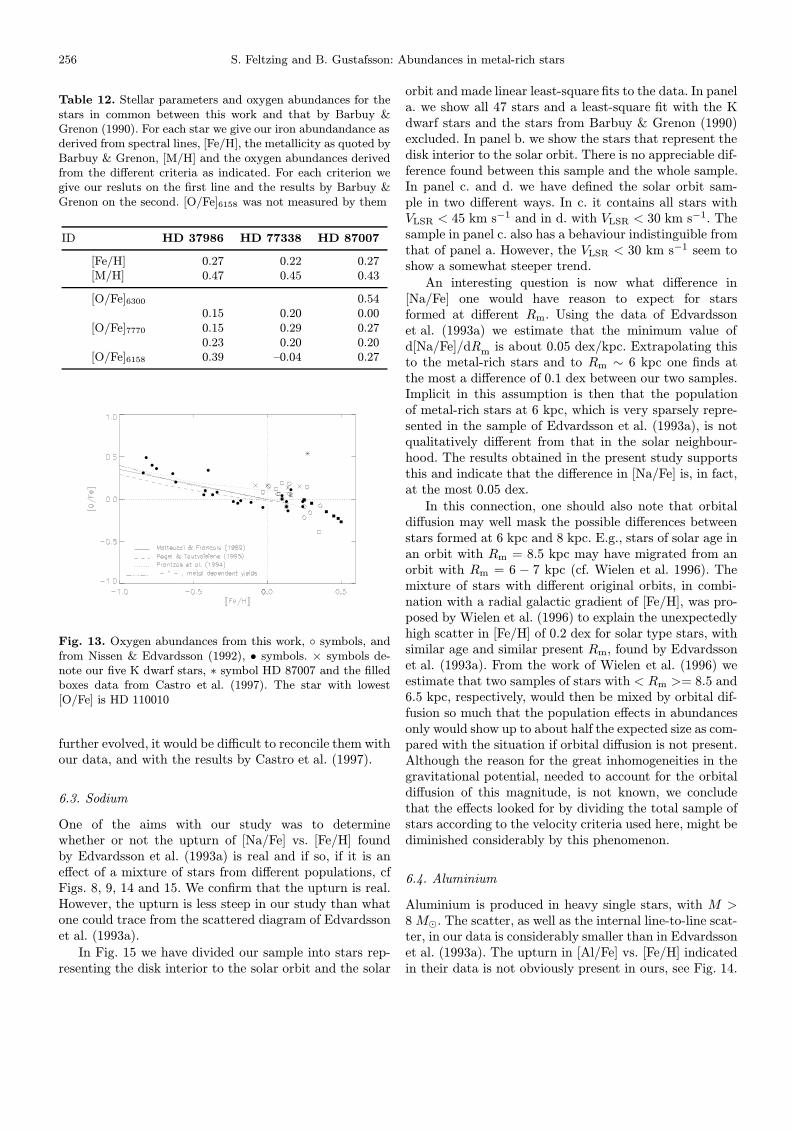
256 S. Feltzing and B. Gustafsson: Abundances in metal-rich stars
Table 12. Stellar parameters and oxygen abundances for thestars in common between this work and that by Barbuy &Grenon (1990). For each star we give our iron abundandance asderived from spectral lines, [Fe/H], the metallicity as quoted byBarbuy & Grenon, [M/H] and the oxygen abundances derivedfrom the different criteria as indicated. For each criterion wegive our resluts on the first line and the results by Barbuy &Grenon on the second. [O/Fe]6158 was not measured by them
ID HD 37986 HD 77338 HD 87007
[Fe/H] 0.27 0.22 0.27[M/H] 0.47 0.45 0.43
[O/Fe]6300 0.540.15 0.20 0.00
[O/Fe]7770 0.15 0.29 0.270.23 0.20 0.20
[O/Fe]6158 0.39 –0.04 0.27
Fig. 13. Oxygen abundances from this work, ◦ symbols, andfrom Nissen & Edvardsson (1992), • symbols. × symbols de-note our five K dwarf stars, ∗ symbol HD 87007 and the filledboxes data from Castro et al. (1997). The star with lowest[O/Fe] is HD 110010
further evolved, it would be difficult to reconcile them withour data, and with the results by Castro et al. (1997).
6.3. Sodium
One of the aims with our study was to determinewhether or not the upturn of [Na/Fe] vs. [Fe/H] foundby Edvardsson et al. (1993a) is real and if so, if it is aneffect of a mixture of stars from different populations, cfFigs. 8, 9, 14 and 15. We confirm that the upturn is real.However, the upturn is less steep in our study than whatone could trace from the scattered diagram of Edvardssonet al. (1993a).
In Fig. 15 we have divided our sample into stars rep-resenting the disk interior to the solar orbit and the solar
orbit and made linear least-square fits to the data. In panela. we show all 47 stars and a least-square fit with the Kdwarf stars and the stars from Barbuy & Grenon (1990)excluded. In panel b. we show the stars that represent thedisk interior to the solar orbit. There is no appreciable dif-ference found between this sample and the whole sample.In panel c. and d. we have defined the solar orbit sam-ple in two different ways. In c. it contains all stars withVLSR < 45 km s−1 and in d. with VLSR < 30 km s−1. Thesample in panel c. also has a behaviour indistinguible fromthat of panel a. However, the VLSR < 30 km s−1 seem toshow a somewhat steeper trend.
An interesting question is now what difference in[Na/Fe] one would have reason to expect for starsformed at different Rm. Using the data of Edvardssonet al. (1993a) we estimate that the minimum value ofd[Na/Fe]/dRm is about 0.05 dex/kpc. Extrapolating thisto the metal-rich stars and to Rm ∼ 6 kpc one finds atthe most a difference of 0.1 dex between our two samples.Implicit in this assumption is then that the populationof metal-rich stars at 6 kpc, which is very sparsely repre-sented in the sample of Edvardsson et al. (1993a), is notqualitatively different from that in the solar neighbour-hood. The results obtained in the present study supportsthis and indicate that the difference in [Na/Fe] is, in fact,at the most 0.05 dex.
In this connection, one should also note that orbitaldiffusion may well mask the possible differences betweenstars formed at 6 kpc and 8 kpc. E.g., stars of solar age inan orbit with Rm = 8.5 kpc may have migrated from anorbit with Rm = 6 − 7 kpc (cf. Wielen et al. 1996). Themixture of stars with different original orbits, in combi-nation with a radial galactic gradient of [Fe/H], was pro-posed by Wielen et al. (1996) to explain the unexpectedlyhigh scatter in [Fe/H] of 0.2 dex for solar type stars, withsimilar age and similar present Rm, found by Edvardssonet al. (1993a). From the work of Wielen et al. (1996) weestimate that two samples of stars with < Rm >= 8.5 and6.5 kpc, respectively, would then be mixed by orbital dif-fusion so much that the population effects in abundancesonly would show up to about half the expected size as com-pared with the situation if orbital diffusion is not present.Although the reason for the great inhomogeneities in thegravitational potential, needed to account for the orbitaldiffusion of this magnitude, is not known, we concludethat the effects looked for by dividing the total sample ofstars according to the velocity criteria used here, might bediminished considerably by this phenomenon.
6.4. Aluminium
Aluminium is produced in heavy single stars, with M >8 M�. The scatter, as well as the internal line-to-line scat-ter, in our data is considerably smaller than in Edvardssonet al. (1993a). The upturn in [Al/Fe] vs. [Fe/H] indicatedin their data is not obviously present in ours, see Fig. 14.
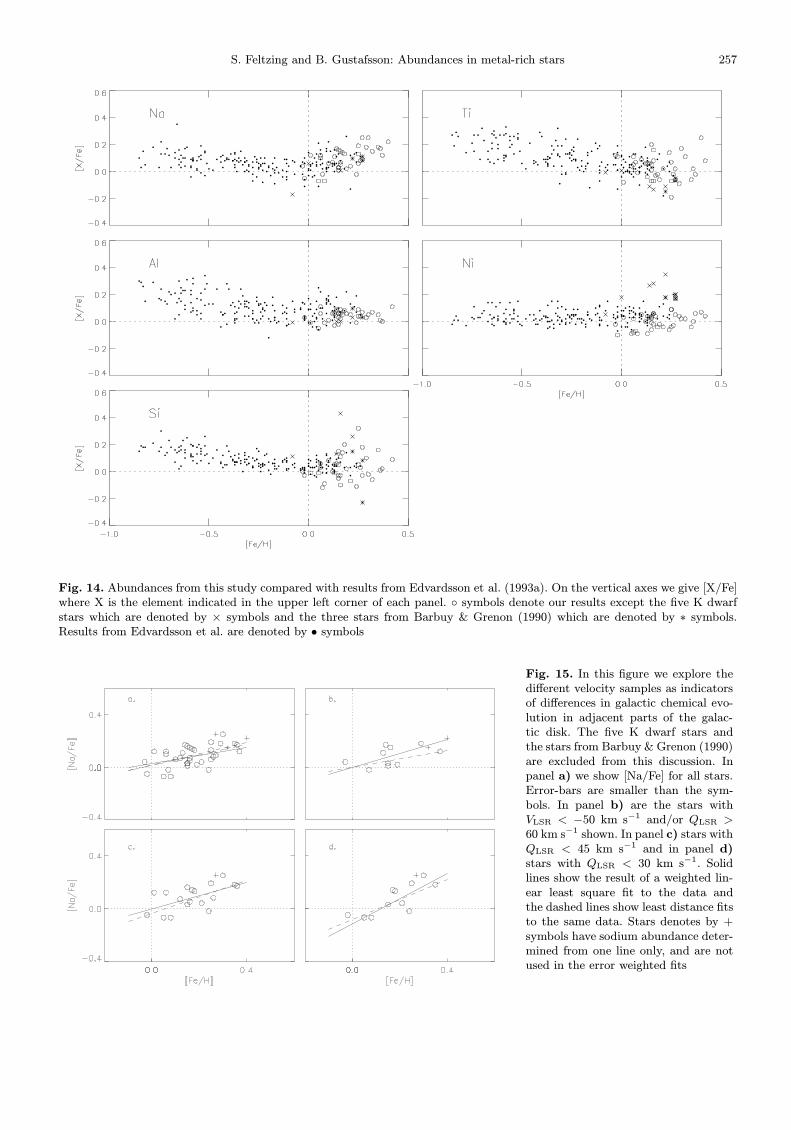
S. Feltzing and B. Gustafsson: Abundances in metal-rich stars 257
Fig. 14. Abundances from this study compared with results from Edvardsson et al. (1993a). On the vertical axes we give [X/Fe]where X is the element indicated in the upper left corner of each panel. ◦ symbols denote our results except the five K dwarfstars which are denoted by × symbols and the three stars from Barbuy & Grenon (1990) which are denoted by ∗ symbols.Results from Edvardsson et al. are denoted by • symbols
Fig. 15. In this figure we explore thedifferent velocity samples as indicatorsof differences in galactic chemical evo-lution in adjacent parts of the galac-tic disk. The five K dwarf stars andthe stars from Barbuy & Grenon (1990)are excluded from this discussion. Inpanel a) we show [Na/Fe] for all stars.Error-bars are smaller than the sym-bols. In panel b) are the stars withVLSR < −50 km s−1 and/or QLSR >
60 km s−1 shown. In panel c) stars withQLSR < 45 km s−1 and in panel d)stars with QLSR < 30 km s−1. Solidlines show the result of a weighted lin-ear least square fit to the data andthe dashed lines show least distance fitsto the same data. Stars denotes by +symbols have sodium abundance deter-mined from one line only, and are notused in the error weighted fits
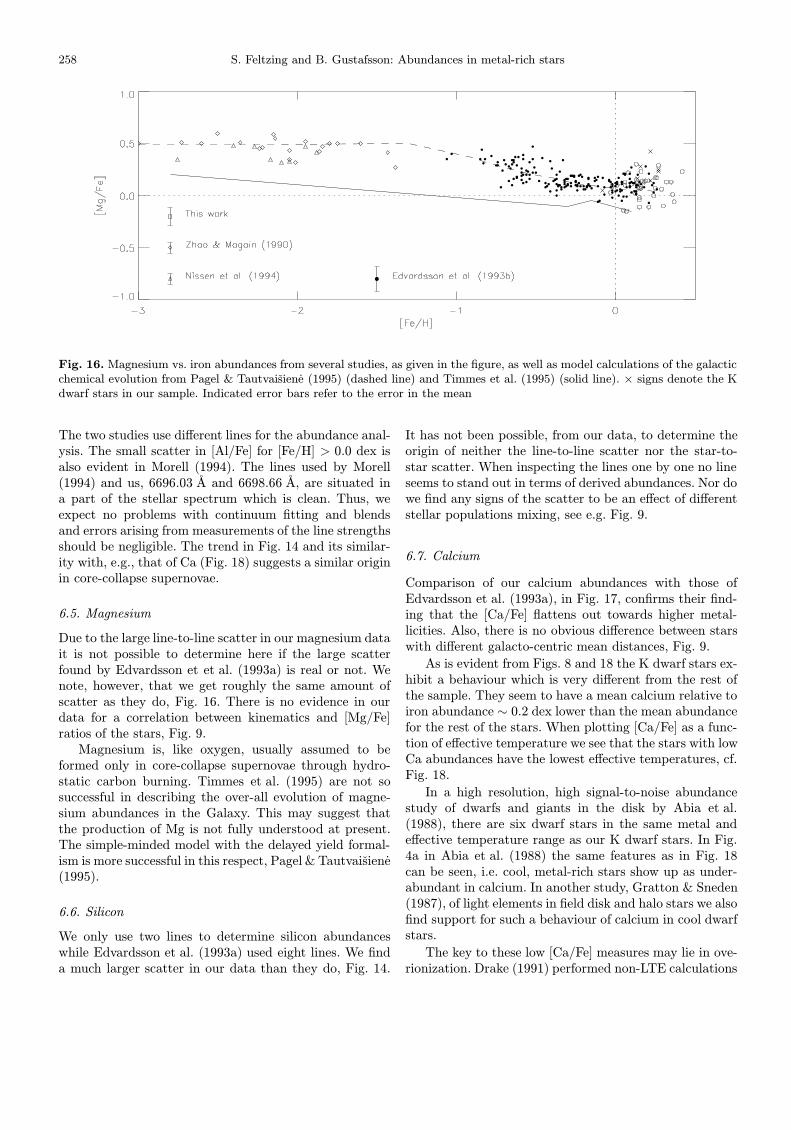
258 S. Feltzing and B. Gustafsson: Abundances in metal-rich stars
Fig. 16. Magnesium vs. iron abundances from several studies, as given in the figure, as well as model calculations of the galacticchemical evolution from Pagel & Tautvaisiene (1995) (dashed line) and Timmes et al. (1995) (solid line). × signs denote the Kdwarf stars in our sample. Indicated error bars refer to the error in the mean
The two studies use different lines for the abundance anal-ysis. The small scatter in [Al/Fe] for [Fe/H] > 0.0 dex isalso evident in Morell (1994). The lines used by Morell(1994) and us, 6696.03 A and 6698.66 A, are situated ina part of the stellar spectrum which is clean. Thus, weexpect no problems with continuum fitting and blendsand errors arising from measurements of the line strengthsshould be negligible. The trend in Fig. 14 and its similar-ity with, e.g., that of Ca (Fig. 18) suggests a similar originin core-collapse supernovae.
6.5. Magnesium
Due to the large line-to-line scatter in our magnesium datait is not possible to determine here if the large scatterfound by Edvardsson et et al. (1993a) is real or not. Wenote, however, that we get roughly the same amount ofscatter as they do, Fig. 16. There is no evidence in ourdata for a correlation between kinematics and [Mg/Fe]ratios of the stars, Fig. 9.
Magnesium is, like oxygen, usually assumed to beformed only in core-collapse supernovae through hydro-static carbon burning. Timmes et al. (1995) are not sosuccessful in describing the over-all evolution of magne-sium abundances in the Galaxy. This may suggest thatthe production of Mg is not fully understood at present.The simple-minded model with the delayed yield formal-ism is more successful in this respect, Pagel & Tautvaisiene(1995).
6.6. Silicon
We only use two lines to determine silicon abundanceswhile Edvardsson et al. (1993a) used eight lines. We finda much larger scatter in our data than they do, Fig. 14.
It has not been possible, from our data, to determine theorigin of neither the line-to-line scatter nor the star-to-star scatter. When inspecting the lines one by one no lineseems to stand out in terms of derived abundances. Nor dowe find any signs of the scatter to be an effect of differentstellar populations mixing, see e.g. Fig. 9.
6.7. Calcium
Comparison of our calcium abundances with those ofEdvardsson et al. (1993a), in Fig. 17, confirms their find-ing that the [Ca/Fe] flattens out towards higher metal-licities. Also, there is no obvious difference between starswith different galacto-centric mean distances, Fig. 9.
As is evident from Figs. 8 and 18 the K dwarf stars ex-hibit a behaviour which is very different from the rest ofthe sample. They seem to have a mean calcium relative toiron abundance ∼ 0.2 dex lower than the mean abundancefor the rest of the stars. When plotting [Ca/Fe] as a func-tion of effective temperature we see that the stars with lowCa abundances have the lowest effective temperatures, cf.Fig. 18.
In a high resolution, high signal-to-noise abundancestudy of dwarfs and giants in the disk by Abia et al.(1988), there are six dwarf stars in the same metal andeffective temperature range as our K dwarf stars. In Fig.4a in Abia et al. (1988) the same features as in Fig. 18can be seen, i.e. cool, metal-rich stars show up as under-abundant in calcium. In another study, Gratton & Sneden(1987), of light elements in field disk and halo stars we alsofind support for such a behaviour of calcium in cool dwarfstars.
The key to these low [Ca/Fe] measures may lie in ove-rionization. Drake (1991) performed non-LTE calculations
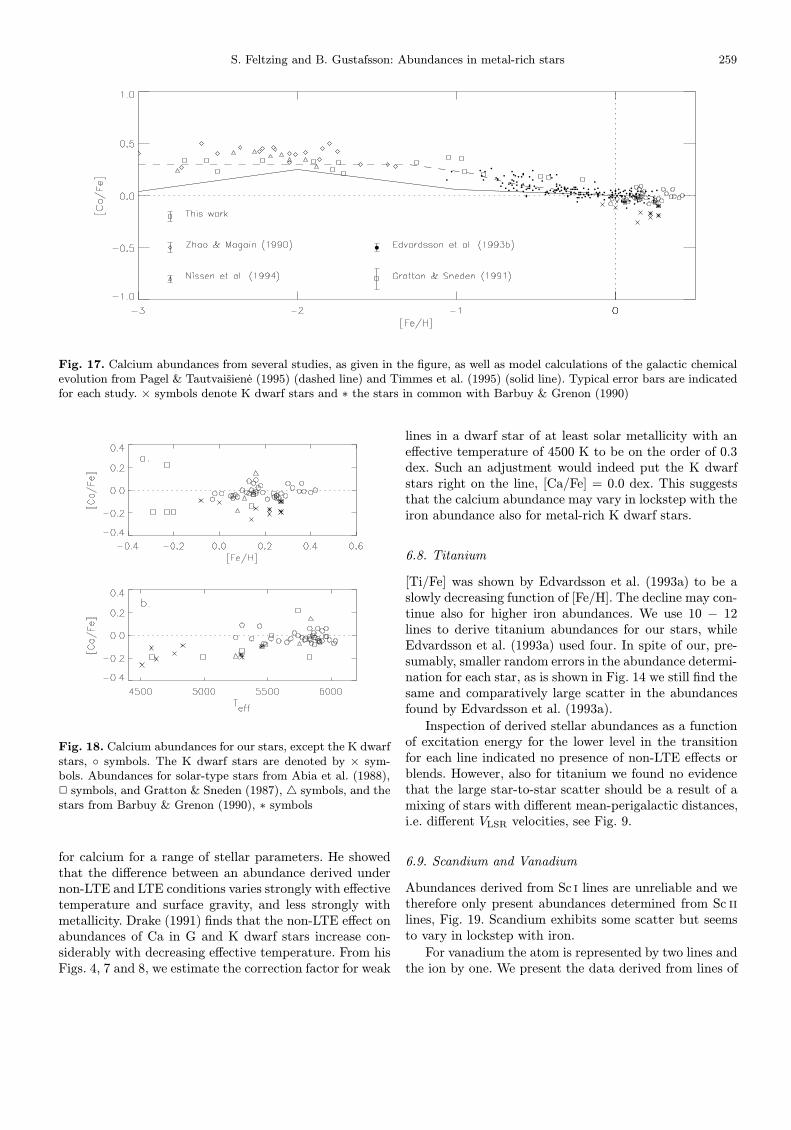
S. Feltzing and B. Gustafsson: Abundances in metal-rich stars 259
Fig. 17. Calcium abundances from several studies, as given in the figure, as well as model calculations of the galactic chemicalevolution from Pagel & Tautvaisiene (1995) (dashed line) and Timmes et al. (1995) (solid line). Typical error bars are indicatedfor each study. × symbols denote K dwarf stars and ∗ the stars in common with Barbuy & Grenon (1990)
Fig. 18. Calcium abundances for our stars, except the K dwarfstars, ◦ symbols. The K dwarf stars are denoted by × sym-bols. Abundances for solar-type stars from Abia et al. (1988),2 symbols, and Gratton & Sneden (1987), 4 symbols, and thestars from Barbuy & Grenon (1990), ∗ symbols
for calcium for a range of stellar parameters. He showedthat the difference between an abundance derived undernon-LTE and LTE conditions varies strongly with effectivetemperature and surface gravity, and less strongly withmetallicity. Drake (1991) finds that the non-LTE effect onabundances of Ca in G and K dwarf stars increase con-siderably with decreasing effective temperature. From hisFigs. 4, 7 and 8, we estimate the correction factor for weak
lines in a dwarf star of at least solar metallicity with aneffective temperature of 4500 K to be on the order of 0.3dex. Such an adjustment would indeed put the K dwarfstars right on the line, [Ca/Fe] = 0.0 dex. This suggeststhat the calcium abundance may vary in lockstep with theiron abundance also for metal-rich K dwarf stars.
6.8. Titanium
[Ti/Fe] was shown by Edvardsson et al. (1993a) to be aslowly decreasing function of [Fe/H]. The decline may con-tinue also for higher iron abundances. We use 10 − 12lines to derive titanium abundances for our stars, whileEdvardsson et al. (1993a) used four. In spite of our, pre-sumably, smaller random errors in the abundance determi-nation for each star, as is shown in Fig. 14 we still find thesame and comparatively large scatter in the abundancesfound by Edvardsson et al. (1993a).
Inspection of derived stellar abundances as a functionof excitation energy for the lower level in the transitionfor each line indicated no presence of non-LTE effects orblends. However, also for titanium we found no evidencethat the large star-to-star scatter should be a result of amixing of stars with different mean-perigalactic distances,i.e. different VLSR velocities, see Fig. 9.
6.9. Scandium and Vanadium
Abundances derived from Sc i lines are unreliable and wetherefore only present abundances determined from Sc ii
lines, Fig. 19. Scandium exhibits some scatter but seemsto vary in lockstep with iron.
For vanadium the atom is represented by two lines andthe ion by one. We present the data derived from lines of
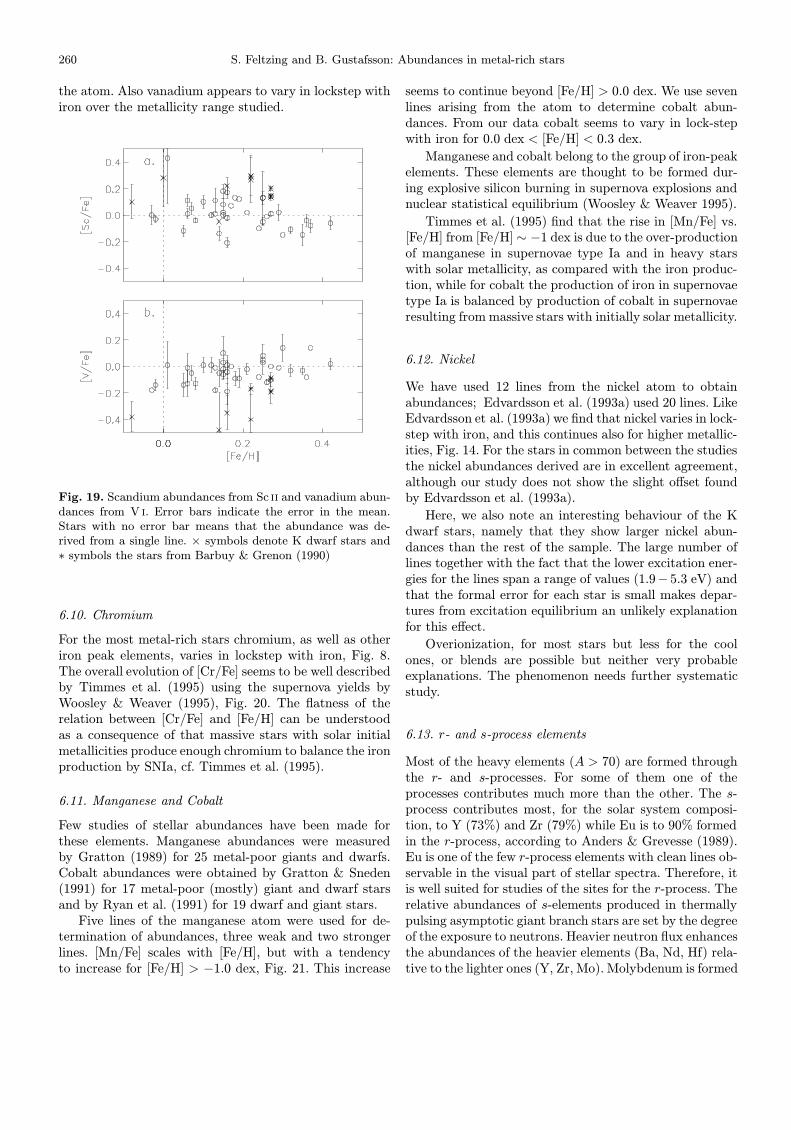
260 S. Feltzing and B. Gustafsson: Abundances in metal-rich stars
the atom. Also vanadium appears to vary in lockstep withiron over the metallicity range studied.
Fig. 19. Scandium abundances from Sc ii and vanadium abun-dances from V i. Error bars indicate the error in the mean.Stars with no error bar means that the abundance was de-rived from a single line. × symbols denote K dwarf stars and∗ symbols the stars from Barbuy & Grenon (1990)
6.10. Chromium
For the most metal-rich stars chromium, as well as otheriron peak elements, varies in lockstep with iron, Fig. 8.The overall evolution of [Cr/Fe] seems to be well describedby Timmes et al. (1995) using the supernova yields byWoosley & Weaver (1995), Fig. 20. The flatness of therelation between [Cr/Fe] and [Fe/H] can be understoodas a consequence of that massive stars with solar initialmetallicities produce enough chromium to balance the ironproduction by SNIa, cf. Timmes et al. (1995).
6.11. Manganese and Cobalt
Few studies of stellar abundances have been made forthese elements. Manganese abundances were measuredby Gratton (1989) for 25 metal-poor giants and dwarfs.Cobalt abundances were obtained by Gratton & Sneden(1991) for 17 metal-poor (mostly) giant and dwarf starsand by Ryan et al. (1991) for 19 dwarf and giant stars.
Five lines of the manganese atom were used for de-termination of abundances, three weak and two strongerlines. [Mn/Fe] scales with [Fe/H], but with a tendencyto increase for [Fe/H] > −1.0 dex, Fig. 21. This increase
seems to continue beyond [Fe/H] > 0.0 dex. We use sevenlines arising from the atom to determine cobalt abun-dances. From our data cobalt seems to vary in lock-stepwith iron for 0.0 dex < [Fe/H] < 0.3 dex.
Manganese and cobalt belong to the group of iron-peakelements. These elements are thought to be formed dur-ing explosive silicon burning in supernova explosions andnuclear statistical equilibrium (Woosley & Weaver 1995).
Timmes et al. (1995) find that the rise in [Mn/Fe] vs.[Fe/H] from [Fe/H]∼ −1 dex is due to the over-productionof manganese in supernovae type Ia and in heavy starswith solar metallicity, as compared with the iron produc-tion, while for cobalt the production of iron in supernovaetype Ia is balanced by production of cobalt in supernovaeresulting from massive stars with initially solar metallicity.
6.12. Nickel
We have used 12 lines from the nickel atom to obtainabundances; Edvardsson et al. (1993a) used 20 lines. LikeEdvardsson et al. (1993a) we find that nickel varies in lock-step with iron, and this continues also for higher metallic-ities, Fig. 14. For the stars in common between the studiesthe nickel abundances derived are in excellent agreement,although our study does not show the slight offset foundby Edvardsson et al. (1993a).
Here, we also note an interesting behaviour of the Kdwarf stars, namely that they show larger nickel abun-dances than the rest of the sample. The large number oflines together with the fact that the lower excitation ener-gies for the lines span a range of values (1.9− 5.3 eV) andthat the formal error for each star is small makes depar-tures from excitation equilibrium an unlikely explanationfor this effect.
Overionization, for most stars but less for the coolones, or blends are possible but neither very probableexplanations. The phenomenon needs further systematicstudy.
6.13. r- and s-process elements
Most of the heavy elements (A > 70) are formed throughthe r- and s-processes. For some of them one of theprocesses contributes much more than the other. The s-process contributes most, for the solar system composi-tion, to Y (73%) and Zr (79%) while Eu is to 90% formedin the r-process, according to Anders & Grevesse (1989).Eu is one of the few r-process elements with clean lines ob-servable in the visual part of stellar spectra. Therefore, itis well suited for studies of the sites for the r-process. Therelative abundances of s-elements produced in thermallypulsing asymptotic giant branch stars are set by the degreeof the exposure to neutrons. Heavier neutron flux enhancesthe abundances of the heavier elements (Ba, Nd, Hf) rela-tive to the lighter ones (Y, Zr, Mo). Molybdenum is formed
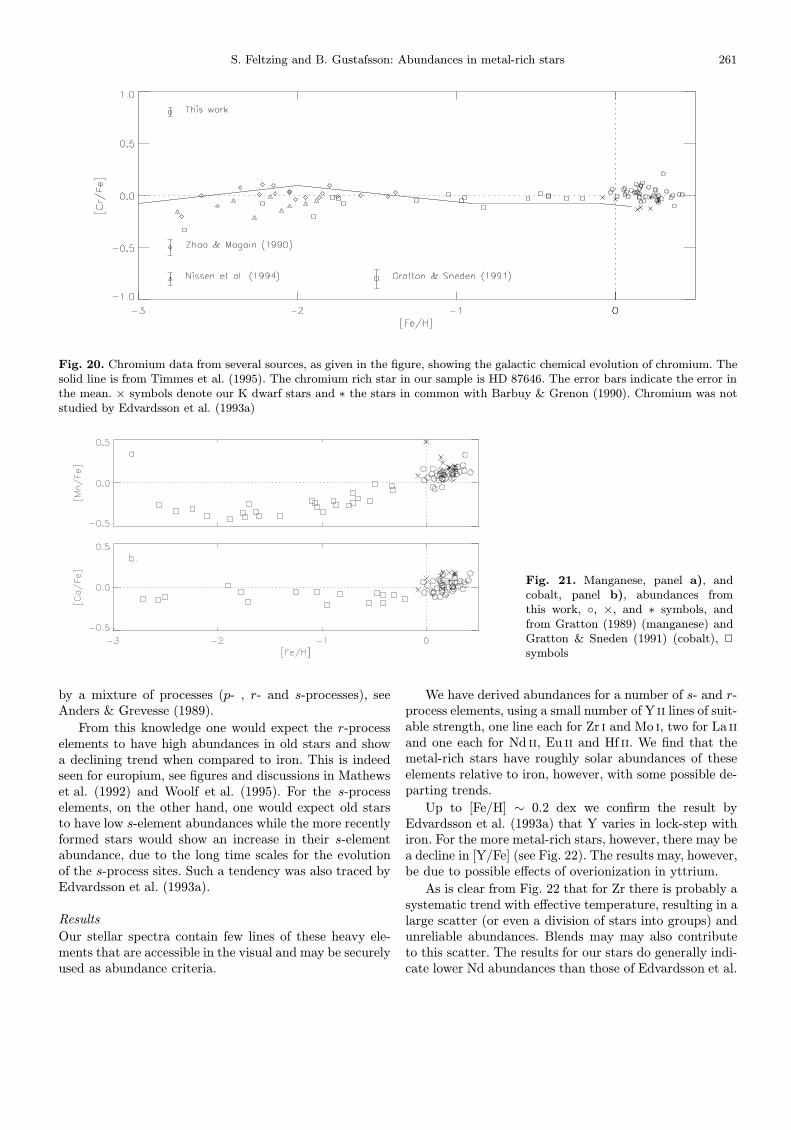
S. Feltzing and B. Gustafsson: Abundances in metal-rich stars 261
Fig. 20. Chromium data from several sources, as given in the figure, showing the galactic chemical evolution of chromium. Thesolid line is from Timmes et al. (1995). The chromium rich star in our sample is HD 87646. The error bars indicate the error inthe mean. × symbols denote our K dwarf stars and ∗ the stars in common with Barbuy & Grenon (1990). Chromium was notstudied by Edvardsson et al. (1993a)
Fig. 21. Manganese, panel a), andcobalt, panel b), abundances fromthis work, ◦, ×, and ∗ symbols, andfrom Gratton (1989) (manganese) andGratton & Sneden (1991) (cobalt), 2symbols
by a mixture of processes (p- , r- and s-processes), seeAnders & Grevesse (1989).
From this knowledge one would expect the r-processelements to have high abundances in old stars and showa declining trend when compared to iron. This is indeedseen for europium, see figures and discussions in Mathewset al. (1992) and Woolf et al. (1995). For the s-processelements, on the other hand, one would expect old starsto have low s-element abundances while the more recentlyformed stars would show an increase in their s-elementabundance, due to the long time scales for the evolutionof the s-process sites. Such a tendency was also traced byEdvardsson et al. (1993a).
Results
Our stellar spectra contain few lines of these heavy ele-ments that are accessible in the visual and may be securelyused as abundance criteria.
We have derived abundances for a number of s- and r-process elements, using a small number of Y ii lines of suit-able strength, one line each for Zr i and Mo i, two for La ii
and one each for Nd ii, Eu ii and Hf ii. We find that themetal-rich stars have roughly solar abundances of theseelements relative to iron, however, with some possible de-parting trends.
Up to [Fe/H] ∼ 0.2 dex we confirm the result byEdvardsson et al. (1993a) that Y varies in lock-step withiron. For the more metal-rich stars, however, there may bea decline in [Y/Fe] (see Fig. 22). The results may, however,be due to possible effects of overionization in yttrium.
As is clear from Fig. 22 that for Zr there is probably asystematic trend with effective temperature, resulting in alarge scatter (or even a division of stars into groups) andunreliable abundances. Blends may may also contributeto this scatter. The results for our stars do generally indi-cate lower Nd abundances than those of Edvardsson et al.
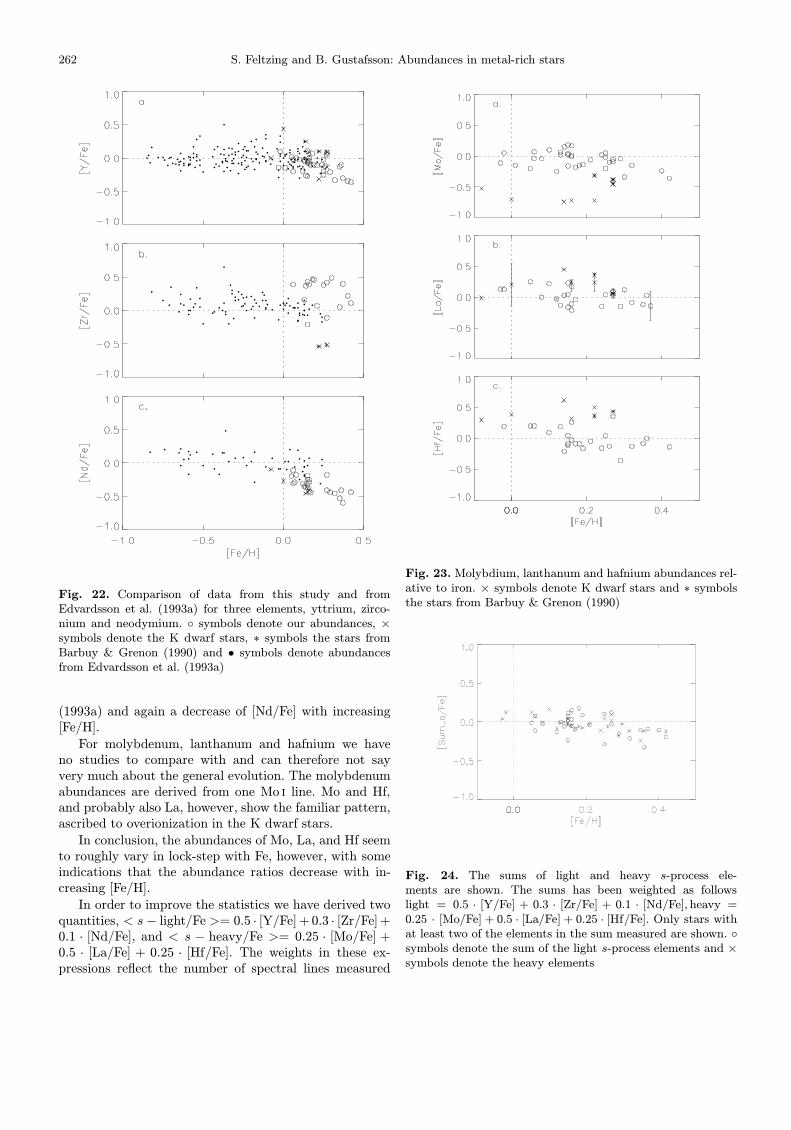
262 S. Feltzing and B. Gustafsson: Abundances in metal-rich stars
Fig. 22. Comparison of data from this study and fromEdvardsson et al. (1993a) for three elements, yttrium, zirco-nium and neodymium. ◦ symbols denote our abundances, ×symbols denote the K dwarf stars, ∗ symbols the stars fromBarbuy & Grenon (1990) and • symbols denote abundancesfrom Edvardsson et al. (1993a)
(1993a) and again a decrease of [Nd/Fe] with increasing[Fe/H].
For molybdenum, lanthanum and hafnium we haveno studies to compare with and can therefore not sayvery much about the general evolution. The molybdenumabundances are derived from one Mo i line. Mo and Hf,and probably also La, however, show the familiar pattern,ascribed to overionization in the K dwarf stars.
In conclusion, the abundances of Mo, La, and Hf seemto roughly vary in lock-step with Fe, however, with someindications that the abundance ratios decrease with in-creasing [Fe/H].
In order to improve the statistics we have derived twoquantities, < s− light/Fe >= 0.5 · [Y/Fe] + 0.3 · [Zr/Fe] +0.1 · [Nd/Fe], and < s − heavy/Fe >= 0.25 · [Mo/Fe] +0.5 · [La/Fe] + 0.25 · [Hf/Fe]. The weights in these ex-pressions reflect the number of spectral lines measured
Fig. 23. Molybdium, lanthanum and hafnium abundances rel-ative to iron. × symbols denote K dwarf stars and ∗ symbolsthe stars from Barbuy & Grenon (1990)
Fig. 24. The sums of light and heavy s-process ele-ments are shown. The sums has been weighted as followslight = 0.5 · [Y/Fe] + 0.3 · [Zr/Fe] + 0.1 · [Nd/Fe],heavy =0.25 · [Mo/Fe] + 0.5 · [La/Fe] + 0.25 · [Hf/Fe]. Only stars withat least two of the elements in the sum measured are shown. ◦symbols denote the sum of the light s-process elements and ×symbols denote the heavy elements
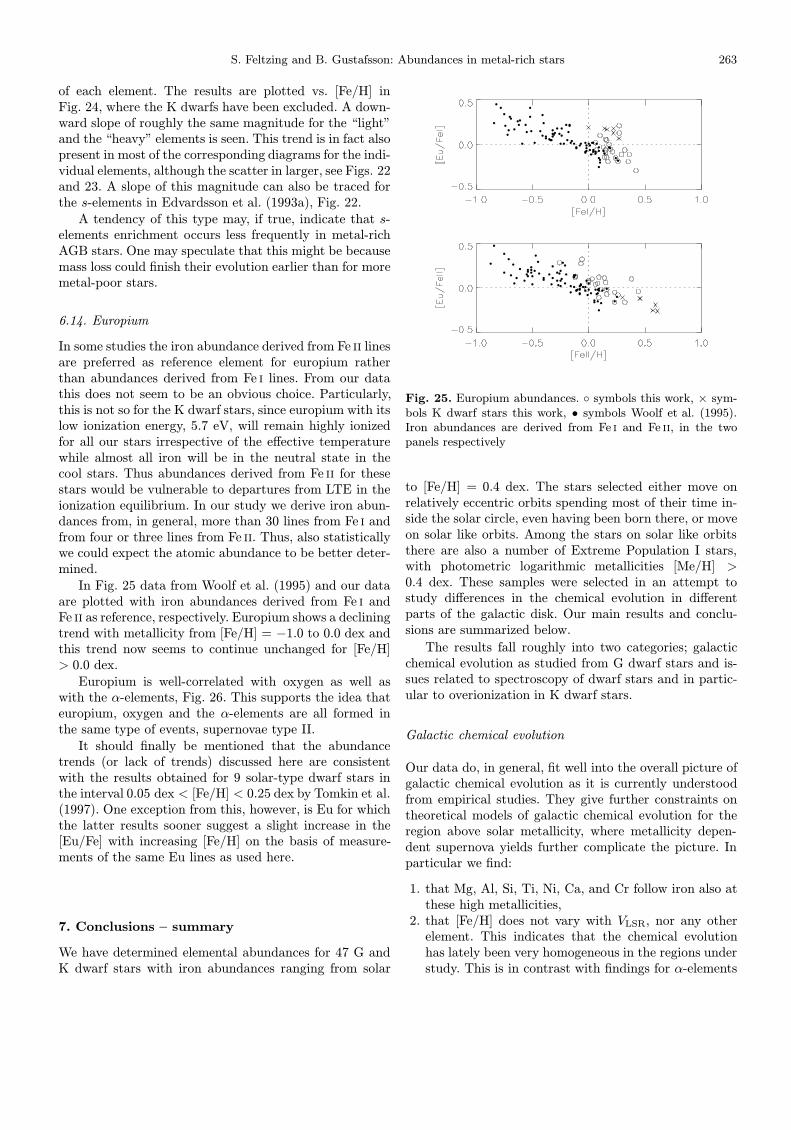
S. Feltzing and B. Gustafsson: Abundances in metal-rich stars 263
of each element. The results are plotted vs. [Fe/H] inFig. 24, where the K dwarfs have been excluded. A down-ward slope of roughly the same magnitude for the “light”and the “heavy” elements is seen. This trend is in fact alsopresent in most of the corresponding diagrams for the indi-vidual elements, although the scatter in larger, see Figs. 22and 23. A slope of this magnitude can also be traced forthe s-elements in Edvardsson et al. (1993a), Fig. 22.
A tendency of this type may, if true, indicate that s-elements enrichment occurs less frequently in metal-richAGB stars. One may speculate that this might be becausemass loss could finish their evolution earlier than for moremetal-poor stars.
6.14. Europium
In some studies the iron abundance derived from Fe ii linesare preferred as reference element for europium ratherthan abundances derived from Fe i lines. From our datathis does not seem to be an obvious choice. Particularly,this is not so for the K dwarf stars, since europium with itslow ionization energy, 5.7 eV, will remain highly ionizedfor all our stars irrespective of the effective temperaturewhile almost all iron will be in the neutral state in thecool stars. Thus abundances derived from Fe ii for thesestars would be vulnerable to departures from LTE in theionization equilibrium. In our study we derive iron abun-dances from, in general, more than 30 lines from Fe i andfrom four or three lines from Fe ii. Thus, also statisticallywe could expect the atomic abundance to be better deter-mined.
In Fig. 25 data from Woolf et al. (1995) and our dataare plotted with iron abundances derived from Fe i andFe ii as reference, respectively. Europium shows a decliningtrend with metallicity from [Fe/H] = −1.0 to 0.0 dex andthis trend now seems to continue unchanged for [Fe/H]> 0.0 dex.
Europium is well-correlated with oxygen as well aswith the α-elements, Fig. 26. This supports the idea thateuropium, oxygen and the α-elements are all formed inthe same type of events, supernovae type II.
It should finally be mentioned that the abundancetrends (or lack of trends) discussed here are consistentwith the results obtained for 9 solar-type dwarf stars inthe interval 0.05 dex < [Fe/H] < 0.25 dex by Tomkin et al.(1997). One exception from this, however, is Eu for whichthe latter results sooner suggest a slight increase in the[Eu/Fe] with increasing [Fe/H] on the basis of measure-ments of the same Eu lines as used here.
7. Conclusions – summary
We have determined elemental abundances for 47 G andK dwarf stars with iron abundances ranging from solar
Fig. 25. Europium abundances. ◦ symbols this work, × sym-bols K dwarf stars this work, • symbols Woolf et al. (1995).Iron abundances are derived from Fe i and Fe ii, in the twopanels respectively
to [Fe/H] = 0.4 dex. The stars selected either move onrelatively eccentric orbits spending most of their time in-side the solar circle, even having been born there, or moveon solar like orbits. Among the stars on solar like orbitsthere are also a number of Extreme Population I stars,with photometric logarithmic metallicities [Me/H] >0.4 dex. These samples were selected in an attempt tostudy differences in the chemical evolution in differentparts of the galactic disk. Our main results and conclu-sions are summarized below.
The results fall roughly into two categories; galacticchemical evolution as studied from G dwarf stars and is-sues related to spectroscopy of dwarf stars and in partic-ular to overionization in K dwarf stars.
Galactic chemical evolution
Our data do, in general, fit well into the overall picture ofgalactic chemical evolution as it is currently understoodfrom empirical studies. They give further constraints ontheoretical models of galactic chemical evolution for theregion above solar metallicity, where metallicity depen-dent supernova yields further complicate the picture. Inparticular we find:
1. that Mg, Al, Si, Ti, Ni, Ca, and Cr follow iron also atthese high metallicities,
2. that [Fe/H] does not vary with VLSR, nor any otherelement. This indicates that the chemical evolutionhas lately been very homogeneous in the regions understudy. This is in contrast with findings for α-elements
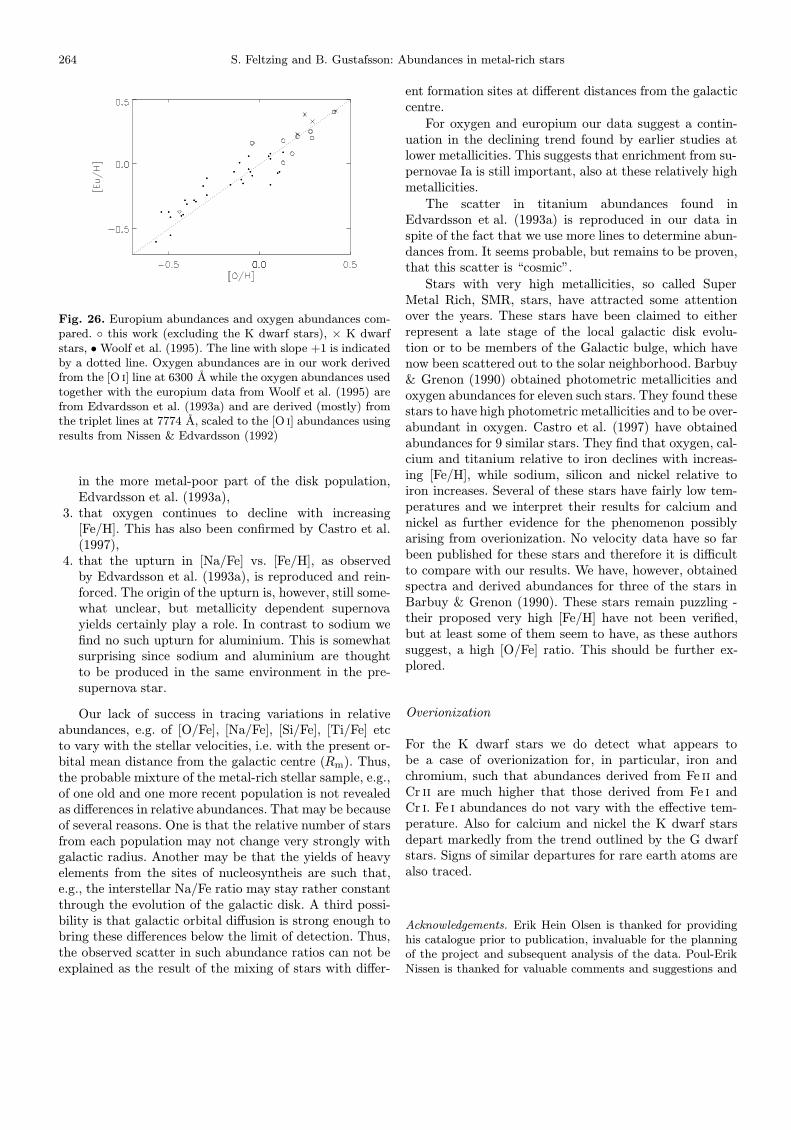
264 S. Feltzing and B. Gustafsson: Abundances in metal-rich stars
Fig. 26. Europium abundances and oxygen abundances com-pared. ◦ this work (excluding the K dwarf stars), × K dwarfstars, •Woolf et al. (1995). The line with slope +1 is indicatedby a dotted line. Oxygen abundances are in our work derivedfrom the [O i] line at 6300 A while the oxygen abundances usedtogether with the europium data from Woolf et al. (1995) arefrom Edvardsson et al. (1993a) and are derived (mostly) fromthe triplet lines at 7774 A, scaled to the [O i] abundances usingresults from Nissen & Edvardsson (1992)
in the more metal-poor part of the disk population,Edvardsson et al. (1993a),
3. that oxygen continues to decline with increasing[Fe/H]. This has also been confirmed by Castro et al.(1997),
4. that the upturn in [Na/Fe] vs. [Fe/H], as observedby Edvardsson et al. (1993a), is reproduced and rein-forced. The origin of the upturn is, however, still some-what unclear, but metallicity dependent supernovayields certainly play a role. In contrast to sodium wefind no such upturn for aluminium. This is somewhatsurprising since sodium and aluminium are thoughtto be produced in the same environment in the pre-supernova star.
Our lack of success in tracing variations in relativeabundances, e.g. of [O/Fe], [Na/Fe], [Si/Fe], [Ti/Fe] etcto vary with the stellar velocities, i.e. with the present or-bital mean distance from the galactic centre (Rm). Thus,the probable mixture of the metal-rich stellar sample, e.g.,of one old and one more recent population is not revealedas differences in relative abundances. That may be becauseof several reasons. One is that the relative number of starsfrom each population may not change very strongly withgalactic radius. Another may be that the yields of heavyelements from the sites of nucleosyntheis are such that,e.g., the interstellar Na/Fe ratio may stay rather constantthrough the evolution of the galactic disk. A third possi-bility is that galactic orbital diffusion is strong enough tobring these differences below the limit of detection. Thus,the observed scatter in such abundance ratios can not beexplained as the result of the mixing of stars with differ-
ent formation sites at different distances from the galacticcentre.
For oxygen and europium our data suggest a contin-uation in the declining trend found by earlier studies atlower metallicities. This suggests that enrichment from su-pernovae Ia is still important, also at these relatively highmetallicities.
The scatter in titanium abundances found inEdvardsson et al. (1993a) is reproduced in our data inspite of the fact that we use more lines to determine abun-dances from. It seems probable, but remains to be proven,that this scatter is “cosmic”.
Stars with very high metallicities, so called SuperMetal Rich, SMR, stars, have attracted some attentionover the years. These stars have been claimed to eitherrepresent a late stage of the local galactic disk evolu-tion or to be members of the Galactic bulge, which havenow been scattered out to the solar neighborhood. Barbuy& Grenon (1990) obtained photometric metallicities andoxygen abundances for eleven such stars. They found thesestars to have high photometric metallicities and to be over-abundant in oxygen. Castro et al. (1997) have obtainedabundances for 9 similar stars. They find that oxygen, cal-cium and titanium relative to iron declines with increas-ing [Fe/H], while sodium, silicon and nickel relative toiron increases. Several of these stars have fairly low tem-peratures and we interpret their results for calcium andnickel as further evidence for the phenomenon possiblyarising from overionization. No velocity data have so farbeen published for these stars and therefore it is difficultto compare with our results. We have, however, obtainedspectra and derived abundances for three of the stars inBarbuy & Grenon (1990). These stars remain puzzling -their proposed very high [Fe/H] have not been verified,but at least some of them seem to have, as these authorssuggest, a high [O/Fe] ratio. This should be further ex-plored.
Overionization
For the K dwarf stars we do detect what appears tobe a case of overionization for, in particular, iron andchromium, such that abundances derived from Fe ii andCr ii are much higher that those derived from Fe i andCr i. Fe i abundances do not vary with the effective tem-perature. Also for calcium and nickel the K dwarf starsdepart markedly from the trend outlined by the G dwarfstars. Signs of similar departures for rare earth atoms arealso traced.
Acknowledgements. Erik Hein Olsen is thanked for providinghis catalogue prior to publication, invaluable for the planningof the project and subsequent analysis of the data. Poul-ErikNissen is thanked for valuable comments and suggestions and
S. Feltzing and B. Gustafsson: Abundances in metal-rich stars 265
for taking time to teach SF how to most efficiently reduceechelle spectra. Pierre Magain is thanked for compiling andsharing the individual line-to-line scatter for the studies fromhis and Zhao’s work. Bengt Edvardsson is thanked for provid-ing programs for the photometric calibration and commentsduring the work.
Karin Eriksson carried out a substantial fraction of all themeasurements of equivalent widths and Matthias Palmer andMikael Nilsson the determinations of surface gravities from thestrong 6162 A Ca i line. We are much indebted to all three forthese contributions.
The Swedish Royal Academy of Sciences is gratefullythanked for giving SF a grant to travel to the U.S.A. and thusbeing able to partake in the observational work at McDonaldObservatory. This work was carried out while BG held theBeatrice Tinsley visiting professorship at the University ofTexas, which is also gratefully acknowledged. The ObservingCommittee at McDonald Observatory generously granted ob-serving time.
References
Abia C., Rebolo R., Beckman J.E., Crivallari L., 1988, A&A206, 100
Allen C.W., 1973, Astrophysical quantities. The Athlone PressAndersen J., Gustafsson B., Lambert D.L., 1984, A&A 136, 65Anders E., Grevesse N., 1989, Geochim. Cosmochim. Acta 53,
197Arribas S., Martinez Roger C., 1989, A&A 215, 305Asplund M., Gustafsson B, Kiselman D., Eriksson K., 1997,
A&A 318, 521Aumann J.R., Woodrow J.E.J., 1975, ApJ 197, 163Barbuy B., Grenon M., 1990, in Bulges of Galaxies,
ESO/CTIO workshop, Jarvis B.J., Terndrup D.M. (eds.),p. 83
Baumueller D., Gehren T., 1996, A&A 307, 961Bell R.A., Gustafsson B., 1989, MNRAS 236, 653Biemont E., Baudoux M., Kurucz R.L., Ansbacher W.,
Pinnington E.H., 1991, A&A 249, 539Blackwell D.E., Willis R.B., 1977, MNRAS 180, 169Blackwell D.E., Lynas-Gray A.E., Smith G., 1995, A&A 296,
217Bruls J.H.M.J., 1993, A&A 269, 509Bruls J.H.M.J., Rutten R.J., Shchukina N.G., 1992, A&A 265,
237Carlsson M., Rutten R.J., Bruls J.H.M.J., Shchukina N.G.,
1994, A&A 288, 860Cayrel de Strobel G., Bentolia C., 1983, A&A 119, 1Cayrel de Strobel G., Soubiran C., Friel E.D., Ralite N.,
Francois P., 1997, A&AS 124, 299Castro S., Rich R.M, Grenon M., Barbuy B., McCarthy J.K.,
1997, AJ 114, 376Delbouille L., Neven L., Roland G., 1973, Photometric atlas of
the solar spectrum from λ3000 to λ10000Drake J.J., 1991, MNRAS 251, 369Edvardsson B., 1988, A&A 190, 148Edvardsson B., Andersen J., Gustafsson B., et al., 1993a, A&A
275, 101
Edvardsson B., Gustafsson B., Nissen P.E., et al., 1993b, inPanchromatic View of Galaxies, Hensler G., Theis Ch. &Gallagher J. (eds.), p. 401
Eggen O.J., 1960, MNRAS 120, 430Eriksson K., Toft S.C., 1979, A&A 71, 178Friel E., Cayrel de Strobel G., Chmielewski Y., et al., 1993,
A&A 274, 825Gratton R.G., 1989, A&A 208, 171Gratton R.G., Sneden C., 1987, A&A 178, 179Gratton R.G., Sneden C., 1991, A&A 241, 501Grenon M, 1989, Astrophys. Space Sci. 156, 29Griffin R.F., 1968, Photometric atlas of the spectrum of
Arcturus, λλ3600 − 8825 A, Cambridge PhilosophicalSociety
Gustafsson B., 1995, in Astrophysical Applications of PowerfulNew Databases, ASP Conf Ser. 78, Adelman S.J. & WieseW.L. (eds.), p. 347
Gustafsson B, Kjaergaard P., Andersen S., 1974, A&A 34, 99Gustafsson B., Bell R.A., Eriksson K., Nordlund A., 1975,
A&A 42, 407Hannaford P., Lowe R.M., Grevesse N., Noels A., 1992, A&A
259, 301Hoffleit D., Jascheck C., 1982, The Bright Star Catalogue, Yale
University ObservatoryHolweger H., 1971, A&A 10, 128Holweger H., Bard A., Kock A., Kock M., 1991, A&A 249, 545Johnson H.L., 1966, ARA&A 4, 193Kiselman D., 1993, Thesis (Uppsala University) and A&A 275,
269Kiselman D., Nordlund A., 1995, A&A 302, 578Kurucz R.L., 1989, Magnetic tapes with atomic line data for
Ca through Ni (private communication)Kurucz R., Furenlid I., Brault J., Testerman L., 1984,
Solar Flux Atlas from 296 to 1300 nm, National SolarObservatory, Sunspot, New Mexico
Lambert D.D., 1978, MNRAS 182, 249Mackle R., Holweger H., Griffin R., Griffin R., 1975, A&A 38,
239Mathews G.J., Bazan G., Cowan J.J., 1992, ApJ 391, 719Matteucci F., Francois P., 1989, MNRAS 239, 885McWilliam A., 1990, ApJS 74, 1075Moore C.E., Minnaert M.J.G., Houtgast J., 1966, The solar
spectrum 2935 A to 8770 A, National Bureau of StandardsMonograph 61
Morell O., 1994, PhD Thesis, Acta Universitas UpsaliensisISBN 91-554-3322-7
Neff J.E., O’Neal D., Saar S.H., 1995, ApJ 452, 879Neuforge C., 1992, in Origin and Evolution of the Elements,
Prantzos N., Vangioni-Flam E., Casse M. (eds.), p. 63Nissen P.E., Edvardsson B., 1992, A&A 261, 255Nissen P.E., Gustafsson G., Edvardsson B., Gilmore G., 1994,
A&A 285, 440Olsen E.H., 1983, A&AS 54, 55Olsen E.H., 1984, A&AS 57, 443Olsen E.H., 1993, A&AS 102, 89Olsen E.H., 1994, A&AS 106, 257Pagel B.E.J., Tautvaisiene G., 1995, MNRAS 276, 505Prantzos N., Aubert O., 1995, A&A 302, 69Ruland F., Holweger H., Griffin R., Griffin R., Biehl D., 1980,
A&A 92, 70
266 S. Feltzing and B. Gustafsson: Abundances in metal-rich stars
Ruland F., Griffin R., Griffin R., Biehl D., Holweger H., 1981,A&AS 42, 391
Rutten R.J., 1988, in Physics of Formation of Fe II LinesOutside LTE, Viotti R., Vittone A., Friedjung M. (eds.),IAU Coll. 94. Reidel Publ. Company, p. 185
Schuster W.J., Nissen P.E., 1988, A&AS 73, 225Smith G., 1981, A&A 103, 351Steenbock W., 1985, in Cool stars with Excess of Heavy
Elements, Jaschek M. & Keenan P.C. (eds.). D. Reidel Publ.Company, p. 231
Steenbock W., Holweger H., 1984, A&A 130, 319Summers K., 1994, Undergraduate thesis at the Astronomical
Observatory, Uppsala UniversityTaylor B.J., 1996, ApJS 102, 105Thielemann K-F., Nomoto K., Hashimoto M., 1996, ApJ 460,
408Timmes F.X., Woosley S.E., Weaver T.A., 1995, ApJS 98, 617
Tomkin J., Woolf V.M., Lambert D.L., Lemke M., 1995, AJ109, 2204
Tomkin J., Edvardsson B., Lambert D.L., Gustafsson B., 1997,A&A (in press)
Tsujimoto T., Yoshii Y., Nomoto K., Shigeyama T., 1995, A&A302, 704
Tull T.G., MacQueen P.J., Sneden C., Lambert D.L., 1995,PASP 107, 251
VandenBerg D.A., 1992, ApJ 391, 685van Altena W.F, Truen-Liang Lee J., Hoffleit D., 1991,
Yale Trigonometric Parallaxes Preliminary. Yale, UniversityObservatory
Wielen R., Fuchs B., Dettbarn C., 1996, A&A 314, 438Woolf V.M., Tomkin J., Lambert D.L., 1995, ApJ 453, 660Woosley S.E., Weaver T.A., 1995, ApJS 101, 181Wyse R., Gilmore G., 1995, AJ 110, 2771Zhao G., Magain P., 1990, A&A 238, 242
![Determining element abundances of [WC]-type Central Stars ...ftp/helgetodt/hydef-tuebingen07-todt.pdf · also happen very late (VLTP), after entering the White Dwarf cooling track.](https://static.fdocuments.in/doc/165x107/5e42b609e4f6bc06de643c79/determining-element-abundances-of-wc-type-central-stars-ftphelgetodthydef-tuebingen07-todtpdf.jpg)


![arXiv:0707.2857v1 [astro-ph] 19 Jul 2007homepage.univie.ac.at/manuel.guedel/papers/XEST/scelsi2/XEST_AA... · L. Scelsi et al.: Coronal abundances in Taurus-Auriga X-raybright stars](https://static.fdocuments.in/doc/165x107/5b5b38f77f8b9a01748d97ce/arxiv07072857v1-astro-ph-19-jul-l-scelsi-et-al-coronal-abundances-in.jpg)
