ABUNDANCE DISTRIBUTION AND BREEDING SEASON HABITAT ...
101
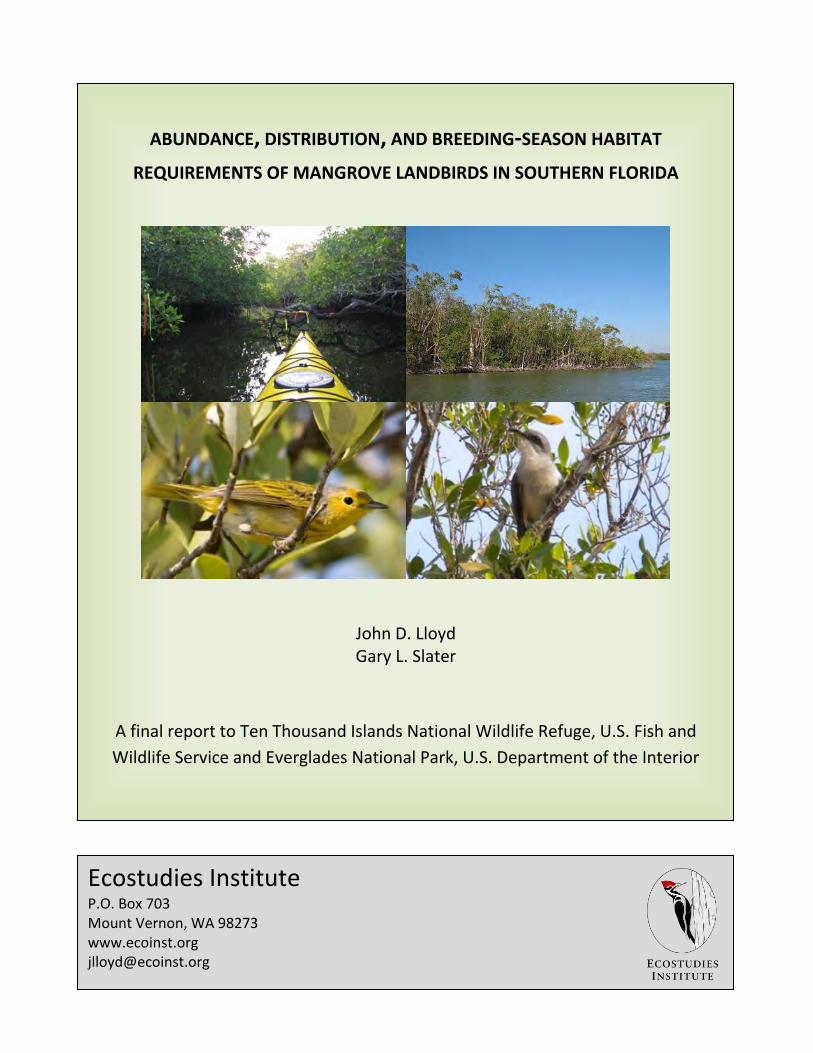
ABUNDANCE, DISTRIBUTION, AND BREEDING-SEASON HABITAT REQUIREMENTS OF MANGROVE LANDBIRDS IN SOUTHERN FLORIDA John D. Lloyd Gary L. Slater A final report to Ten Thousand Islands National Wildlife Refuge, U.S. Fish and Wildlife Service and Everglades National Park, U.S. Department of the Interior Ecostudies Institute P.O. Box 703 Mount Vernon, WA 98273 www.ecoinst.org [email protected]
Transcript of ABUNDANCE DISTRIBUTION AND BREEDING SEASON HABITAT ...
ABUNDANCE, DISTRIBUTION, AND BREEDING-SEASON HABITAT
REQUIREMENTS OF MANGROVE LANDBIRDS IN SOUTHERN FLORIDA
John D. Lloyd Gary L. Slater
A final report to Ten Thousand Islands National Wildlife Refuge, U.S. Fish and
Wildlife Service and Everglades National Park, U.S. Department of the Interior
Ecostudies Institute P.O. Box 703 Mount Vernon, WA 98273 www.ecoinst.org [email protected]

2
ACKNOWLEDGMENTS
This work was funded through grants from Florida Fish and Wildlife Conservation Commission, Ten
Thousand Islands National Wildlife Refuge, Everglades National Park , and Biscayne National Park. We
gratefully acknowledge the support and assistance provided by our agency collaborators, especially Elsa
Alvear (Biscayne National Park), Sonny Bass and Mark Parry (Everglades National Park), Terry Doyle (US
Fish and Wildlife Service), Joyce Palmer (Ten Thousand Islands National Wildlife Refuge), Karl Miller
(Florida Fish and Wildlife Conservation Commission), Anne Morkill (Florida Keys National Wildlife
Refuges), and our field technicians, including Lauren Vander Lind, Lauren Solomon, Cameron Kovach,
Rachel Frieze, and Steve Mullin.
Cover photos by: John Lloyd (kayak), Steve Mullin (Mangrove Cuckoo), and Marc Ryckaert (mangrove island) and Laura Gooch (Cuban Yellow Warbler) via Wikimedia Commons.

3
TABLE OF CONTENTS
ACKNOWLEDGMENTS ........................................................................................................................................................... 2
TABLE OF CONTENTS ............................................................................................................................................................ 3
EXECUTIVE SUMMARY ......................................................................................................................................................... 4
INTRODUCTION ....................................................................................................................................................................... 6
METHODS ................................................................................................................................................................................... 7
Study area ................................................................................................................................................. 7
Establishing survey points ........................................................................................................................ 8
Bird surveys ............................................................................................................................................ 10
Statistical analyses .................................................................................................................................. 11
Abundance and distribution of mangrove landbirds. ........................................................................ 11
Habitat associations of mangrove landbirds. ..................................................................................... 13
A long-term monitoring protocol for mangrove landbirds. ............................................................... 14
RESULTS .................................................................................................................................................................................... 18
Abundance and distribution of mangrove landbirds. ........................................................................ 18
Habitat associations of mangrove landbirds. ..................................................................................... 21
A long-term monitoring protocol for mangrove landbirds. ............................................................... 22
DISCUSSION ............................................................................................................................................................................. 24
Abundance and distribution of mangrove landbirds. ........................................................................ 24
Habitat associations of mangrove landbirds. ..................................................................................... 25
A long-term monitoring protocol for mangrove landbirds. ............................................................... 28
Research and management priorities. ............................................................................................... 35
TABLES ...................................................................................................................................................................................... 36
FIGURES ..................................................................................................................................................................................... 41
LITERATURE CITED ............................................................................................................................................................. 73
Appendix A. Total number of individuals counted, by species. ......................................................................... 75
Appendix B. Representative photographs of the study area. ............................................................................. 79
Appendix C. Species accounts. ......................................................................................................................................... 89

4
EXECUTIVE SUMMARY
-
-
-
-
-
- - -
-
-
-

5
-
-
-
- -
-

6
INTRODUCTION
– –
– -
-
–
7
-
-
–
-
–
-
-
METHODS
Study area
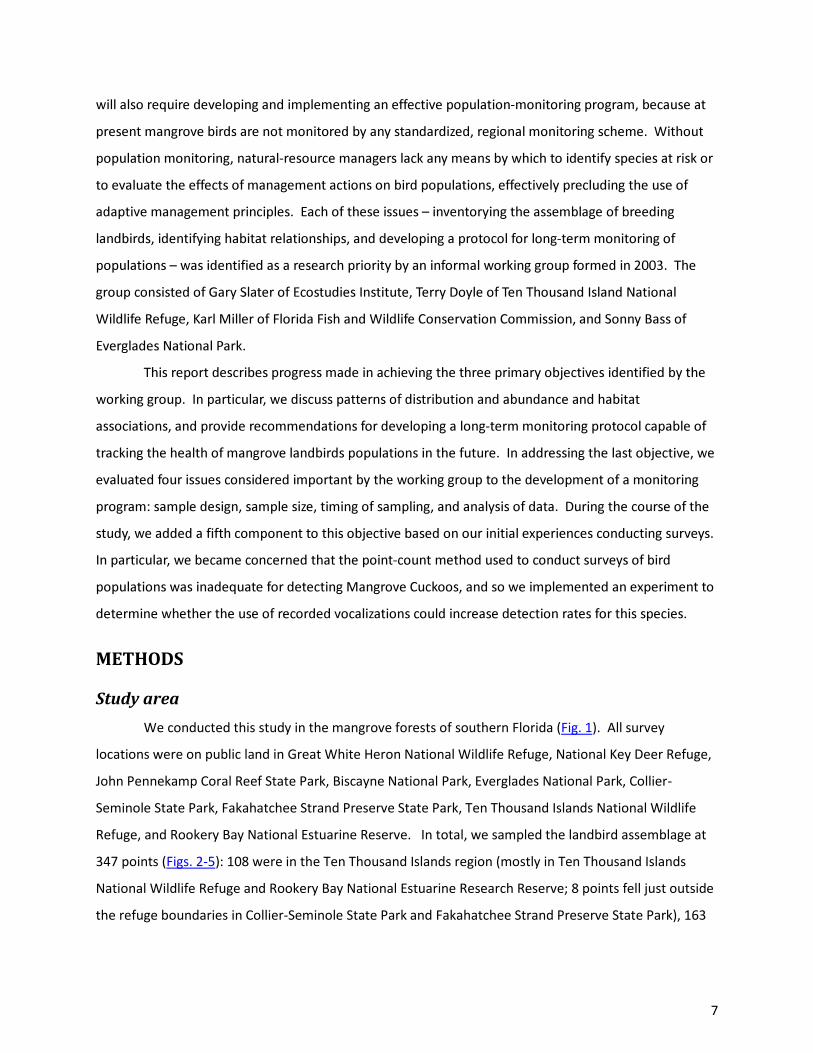
We conducted this study in the mangrove forests of southern Florida (Fig. 1). All survey
locations were on public land in Great White Heron National Wildlife Refuge, National Key Deer Refuge,
John Pennekamp Coral Reef State Park, Biscayne National Park, Everglades National Park, Collier-
Seminole State Park, Fakahatchee Strand Preserve State Park, Ten Thousand Islands National Wildlife
Refuge, and Rookery Bay National Estuarine Reserve. In total, we sampled the landbird assemblage at
347 points (Figs. 2-5): 108 were in the Ten Thousand Islands region (mostly in Ten Thousand Islands
National Wildlife Refuge and Rookery Bay National Estuarine Research Reserve; 8 points fell just outside
the refuge boundaries in Collier-Seminole State Park and Fakahatchee Strand Preserve State Park), 163

8
in Everglades National Park, 37 in Biscayne National Park, 11 in John Pennekamp Coral Reef State Park,
and 38 in Great White Heron National Wildlife Refuge and the National Key Deer Refuge.
-
-
-
-
Establishing survey points
We began the study in 2008 by establishing 87 points at which to conduct bird surveys. We
established these points systematically in mangrove forests in Everglades National Park and Biscayne
National Park, placing points in locations accessible by foot, kayak, or power boat. Points were located
along tidal creeks, hiking trails, and on islands in Florida Bay. Points were separated from one another
by at least 350 m. We also required that the area within a 150-m radius around each point have > 50%
cover by mangrove vegetation (red mangrove, black mangrove, white mangrove, or buttonwood, alone
or as mixed-species assemblages).

9
We established 152 new survey points during 2009, adding to the 87 established in 2008, using a
general randomized tessellation stratified (GRTS) survey design (Stevens and Olsen 2004). First, we
defined the sampling frame using the Florida mangroves shapefile created by the Florida Fish and
Wildlife Commission (available for download at the Florida Geographic Data Library;
http://www.fgdl.org). This shapefile was based on land-use and land-cover data from Florida’s water
management districts. We laid a systematic grid of points throughout the polygons containing
mangrove vegetation. Each point in this grid represented a potential survey location. There were 9,654
points in the grid; points were separated from each other by 500 m. We then used S-Draw (T. L.
McDonald, unpublished software; available at http://www.west-inc.com) to generate a GRTS sample of
1,000 potential survey points.
We then applied two decision rules to determine which of the 1,000 potential points would be
included in the survey. Beginning with the point drawn first, we applied the first decision rule:
1) Is the point accessible?
a) Yes; the selected point is along an existing trail, on a navigable creek <50 m wide, or
on an island that can be surveyed on foot. Consider further.
b) No; the point is not accessible. Discard and move to the next selected point.
Points for which we answered “Yes” to the first decision rule were used as the midpoint of a route of up
to 10 points, each separated by 350 m. A route was defined as a series of points, each directly
accessible from at least one other point in the route, that followed a navigable creek or series of
navigable creeks or that followed an existing trail. When the selected point was on an island, additional
points were added as space allowed, although many islands contain routes consisting of only the single
point selected in the GRTS draw. Once all potential routes were identified, we then applied a second
decision rule:
2) Does the area within a 150-m radius of the point contain at least 50% mangrove vegetation
based on existing land cover data, inspection of high-resolution digital orthophotos, and physical
inspection of the site?
a) Yes; survey points along the route.
b) No; discard route.
This process defined our sampling frame, and thus the entity about which we can draw inference. The
sampling frame for this study can be described as: all areas in south Florida containing mangrove
vegetation that are within 150 m (the width of our survey area around each point) of a navigable creek

10
<50 m wide, islands containing mangrove vegetation on which observers can move on foot, and areas
containing mangrove vegetation that are within 150 m of an existing trail.
In addition, in 2009, we added 108 existing points at Ten Thousand Islands National Wildlife
Refuge that had been surveyed during previous years by Terry Doyle. Although these points were not
randomly selected during the GRTS draw, we included them in our sample because they provide
continuity with existing, baseline data.
Bird surveys
We surveyed bird populations at each of the 347 points in the study area, although not every
point was surveyed in each year. We surveyed the original 87 points in 2008, 347 points in 2009, 325
points in 2010, and 331 points in 2011. Reasons for omitting points in 2010 and 2011 included the time
required to access them (Johnston Key and Horseshoe Key), the determination that the points did not
meet our criteria for coverage by mangrove vegetation (Oil Pad Road in Ten Thousand Islands National
Wildlife Refuge), and various logistical issues that prevented us from reaching the points (e.g., points on
Big Torch Key were flooded in 2010). Some points were surveyed more than once in each year; when
that occurred, we based analyses on average counts. In 2008, we conducted 122 surveys between 1
May and June 4. In 2009, we conducted 445 surveys from 25 April until 21 June. In 2010, we conducted
423 surveys from 26 April to 28 June. In 2011, we conducted 433 surveys from 1 May to 22 June. The
range of dates during which we conducted surveys was based on the experience of other biologists who
had conducted bird surveys in mangrove forests in Florida (T. Doyle, USFWS, personal communication)
and on our own observations of when singing activity was at its peak (see Results, Optimal seasonal
timing of surveys).
Surveys began at sunrise and continued for up to 3 hours. Observers were given the discretion
to end surveys earlier if they observed that singing rates were declining (e.g., due to elevated air
temperatures) or if their perceived ability to detect birds was declining, for example due to increasing
wind speeds. Surveys were not conducted in inclement weather (e.g., moderate or heavy rain) or when
average wind speed was in excess of 12 km per hour. Surveys consisted of a ten-minute count period,
during which observers recorded the first detection of each individual and assigned that detection to
one of ten 1-minute intervals. Once an individual was detected, it was not recorded in subsequent
intervals. Observers also assigned each detection to one of five distance bands: 0-25 m from the survey
point, 25.1-50 m, 50.1-100m, 100.1 m-150m, and > 150 m.

11
Statistical analyses
Abundance and distribution of mangrove landbirds.
We generated estimates of abundance in 4 ways. First, we estimated the mean number of
detections per point per species. We used a non-parametric bootstrap routine to estimate the variance
and 95% confidence intervals around estimated means. Second, we estimated the mean number of
detections at points where a species was detected at least once, and estimated the variance and 95%
confidence intervals using a non-parametric bootstrap routine. Summarizing the average number of
detections at points where a species was detected at least once eliminated the distorting effect of
averaging across points that either did not include suitable habitat or that were outside of the
geographic distribution of a species. Neither of these methods accounts for the imperfect detectability
of individual birds, so we also estimated average abundance for each species after correcting for
detectability using removal models and distance sampling.
We used Program SURVIV to implement the removal models of Farnsworth et al. (2002). As
applied to point counts, removal models estimate abundance based on the decline in the number of
new individuals detected through time. In the case of our study, the decline was measured as the
number of new individuals recorded in each of the one-minute intervals that composed a point count.
In theory, the probability of detection generated from removal models reflects both the probability that
an individual is available for detection (e.g., by singing or making itself visible to an observer), given that
it is present, and the probability that an individual available for detection is detected by an observer
(e.g., the observer hears and correctly identifies a singing bird) (Nichols et al. 2008). In estimating
detectability, we used all detections, both visual and aural. Visual detections accounted for only 8.3% of
all detections. We did not estimate detectability for species with <99 detections because the results
were unreliable (e.g., confidence intervals for detectability that included large, negative values).
We used Akaike’s Information Criteria (AIC) to select between models Mc, which assumes that
individuals of a species differ in their likelihood of detection (i.e., it assumes individual heterogeneity in
detectability) and M, which assumes all individuals of a species have the same likelihood of detection
(Farnsworth et al. 2002). We also used AIC to compare the same models when detections were grouped
into 5, 2-minute intervals. The model with the lowest AIC was used to estimate the probability of
detection, . We then used to calculate the total number of individuals estimated to have occurred
within the area surveyed (i.e., the total number counted as adjusted for ). We divided the estimated
total number of individuals in the survey area by the total area surveyed to calculate density. In
estimating density, we excluded uninhabitable space such as open water, buildings, or roads from our

12
estimate of the total area surveyed, and so our estimates of density accounted for differences among
points in the amount of potentially habitable areas included within the count circle (see Habitat
associations of mangrove landbirds for details on methods). We also estimated average abundance per
point, calculated as the total number of individuals per species divided by the number of surveys
conducted. Standard errors for density estimates were calculated using the formula in Farnsworth et al.
(2002). Standard errors for the estimates of the total number of individuals and per-point abundance
were calculated using the formula in Nichols et al. (2000).
We also used distance sampling to generate estimates of abundance corrected for detectability.
We used multiple-covariate distance sampling (Marques et al. 2007) as implemented in Program
Distance (Thomas et al. 2010) to estimate the probability of detection, density, and to determine the
effect of covariates on detectability. We considered two covariates: date of the survey and time of the
survey. We also attempted to fit models with habitat and observer as covariates, but found that the
likelihoods for these more complex models could not be estimated. We began with a simple model
without covariates, one in which detectability declines with distance as a half-normal function, generally
a useful model for the analysis of point-transect data (Buckland et al. 2001). We also evaluated models
with a hazard-rate key function, but found that they rarely converged, and so analyses were conducted
with the half-normal function. Building on the initial model, we added covariates one at a time,
stopping when the more complex model failed to converge. For example, we began with a model
describing detectability as a half-normal function. To this model, we added a covariate for the effect of
date and then, in a separate model, an effect of time of day. If these models converged, we created a
fourth model with both date and time of day as covariates. We checked for convergence by comparing
the log-likelihood of the model with covariates to the model without covariates; the simple model,
nested within the more complex model, should always have a log-likelihood greater than or equal to the
more complex model.
We assessed the degree of support for each converged model using AIC, as adjusted for small
sample size (AICc) (Burnham and Anderson 2002). We used only the best-supported model for
inference. In general, multi-model inference (i.e., using parameter estimates averaged among
competing models) is thought to better address uncertainty in model selection, but in practice estimates
produced by distance sampling are robust to model definition and little is gained by using model-
averaged estimates (J. Lloyd, personal observation).
All of the estimates of abundance and density, whether corrected for detectability or not, are
based primarily on detections of vocalizing individuals that we assume were defending territories or

13
advertising their presence to conspecifics of the opposite sex. For some species (e.g., Black-whiskered
Vireos, White-eyed Vireos [Vireo griseus], Yellow Warblers, and Prairie Warblers) most of our detections
were of singing males. For these species, the estimates of abundance and density presented in the
report probably pertain only to territorial males, and do not include the females paired with these
males, nor do they include silent, non-territorial individuals of either sex (i.e., floaters). For other
species (e.g., Gray Kingbird, Red-bellied Woodpecker [Melanerpes carolinus] , Great Crested Flycatcher
[Myiarchus crinitus], and perhaps Mangrove Cuckoo), both sexes share a vocal repertoire and so our
detections may reflect the abundance of both males and females. If both sexes vocalize at equal rates
(unknown for any of the species in the study), then the estimates of abundance and density probably
provide an estimate of the size of the breeding population at any given survey point. In sum, the
parameter estimated by the measures of abundance and density presented in this report may vary
among species (e.g., number of local territorial males vs. number of local breeding individuals), and so
caution is needed in comparing results across species.
Habitat associations of mangrove landbirds.
We examined habitat associations in two ways. First, we used a purely subjective approach, in
which we examined the distribution of each species relative to gross differences in the environment at
each point (e.g., inland points near the marsh ecotone vs. points along major tidal rivers). Using this
approach, we were able to search for broad patterns in all species, not just those with sample sizes
sufficient to permit a more rigorous quantification of habitat relationships. Second, for a subset of
species, we attempted to quantify relationships between abundance and vegetation cover using
generalized additive models. To describe vegetation cover, we began by using high-resolution aerial
photos to identify homogenous patches of vegetation within the 150-m radius survey area around each
point. We then visited each point and then circumnavigated each patch – either on foot or by boat –
and assigned each patch to one of 8 vegetation types. We also visually estimated maximum canopy
height to the nearest meter in each patch. Vegetation types included 7 forest types and one shrub type.
Forest types included: red-mangrove forest (closed-canopy patches with >75% cover by red mangrove),
black-mangrove forest (closed-canopy patches with >75% cover by black mangrove), white-mangrove
forest (closed-canopy patches with >75% cover by white mangrove), mixed-mangrove forest (closed-
canopy patches with > 2 species, neither of which covered >75% of the stand area), buttonwood
woodland (open canopy woodland with >75% cover by buttonwood), black-mangrove woodland (open
canopy woodland with >75% cover by black mangrove), and tropical-hardwood forest (closed-canopy
forest dominated by hardwoods). We also quantified the percentage of area covered by scrub

14
mangrove (any pure or mixed-association of mangroves with a canopy height < 2 m). Finally, we
quantified the area covered by open water and by non-vegetated surfaces, including roads, buildings,
and trails.
We used generalized additive models to explore the relationship between abundance of each
species within the 150-m patch, as corrected for detectability (estimated using removal models), and
the percentage of the survey area covered by each of the 8 different vegetation types and open water.
We also included as predictors the maximum canopy height in the survey area and the average canopy
height of all vegetation patches in the survey area.
In fitting the generalized additive models, we assumed a Poisson distribution of errors, which is
generally appropriate for count data. We examined plots of residuals to address the assumptions of the
generalized additive models; in no case did we find significant departures from assumptions and so we
made no effort to transform data or use alternative error distributions. As a smoothing term in the
models, we used thin-plate regression splines with a ridge penalty added that allowed terms with little
relationship to bird abundance to be smoothed to zero and thus effectively eliminated from the model.
This allowed us to simplify our models and eliminate non-significant predictor variables. We used
estimated P-values of terms that remained in the model to interpret the significance of any relationship
between abundance and our predictor variables. All analyses were conducted in R using the package
mgcv (Wood 2003).
A long-term monitoring protocol for mangrove landbirds.
Under this objective, we considered four issues of general importance in developing a
population-monitoring scheme: sampling design, sample size, timing of sampling, and data analysis. We
also considered a fifth issue of importance to mangrove landbirds in particular, namely how to survey
for Mangrove Cuckoos efficiently. To address the issue of sampling design, we evaluated GRTS, an
approach used often in the design of monitoring programs (see Methods - Establishing survey points). In
the Discussion, we present our opinions on the challenges and potential benefits of using this approach.
As reported in Methods - Estimating bird abundance we used two different methods, distance sampling
and removal models, to analyze count data collected during surveys. Results from both methods are
presented under Results - Estimating bird abundance, and in the Discussion, we provide a qualitative
review of the merits of both approaches. Detailed methods for the remaining issues addressed under
this objective are presented below.

15
Optimal number of points to survey
An important consideration in developing a scheme to monitor trends in abundance is sample
size: how many points must be sampled, and how often must they be sampled, in order to estimate
trends at the desired level of precision? To address this issue, we examined the statistical power – in
this case, the probability of detecting a change in abundance over time, given that a change has
occurred – of three different monitoring scenarios. In each scenario, the trend of interest was a 50%
decline over a 20-year period, an arbitrary but widely accepted goal for landbird monitoring programs
(Butcher et al. 1993, Bart et al. 2004). In one scenario, we examined the probability of detecting this
trend, at a significance level of α = 0.05, as a function of the number of points surveyed, with the
assumption that each point was surveyed annually. In the second scenario, we assumed that each point
was surveyed every other year, and in the final scenario we assumed that points were surveyed only
every 5 years. We chose these scenarios to reflect what we felt was a reasonable range of resource
investment, from a relatively labor-intensive annual survey to a survey conducted only twice a decade.
For all scenarios, the starting value was set to the average abundance of Black-whiskered Vireo (0.36
birds per point), a moderately abundant mangrove specialist.
Although statistical power can often be estimated analytically, for more complicated analyses,
such as those typically used to estimate population trends, there is no analytical solution for calculating
power. In these cases, power can only be estimated via simulation. To do so, we began by formulating
a linear model (yi = a +b*t, where yi is the number of individuals at time i, a is the intercept or number of
individuals at time 0, b is the slope of the trend, and t is time) that described the trend of interest; in this
case, a 50% decline over 20 years. We then created a simulated time series by drawing a value for each
yi from a Poisson distribution with a mean value equal to the value of yi estimated from the linear model.
The simulated time series therefore had a mean trend as defined by the linear model, but with
individual values for each year that reflected random variation (e.g., as might be due to sampling error
or random, inter-annual changes in the number of individuals present at a point). We considered the
effect of changing sample size by incrementally changing the number of time series (i.e., the number of
simulated survey points) in each simulated data set. We then analyzed each simulated data set using
generalized linear mixed models, where time was considered as a fixed effect and sampling point was
analyzed as a random effect. This mirrors the approach used to estimate real trends in the 2000-2008
count data from Ten Thousand Islands National Wildlife Refuge (Lloyd and Doyle 2011). We assumed a
first-order autoregressive correlation structure, such that the within-group errors of adjacent points in
the time series were correlated. We repeated the process of simulation and analysis 500 times (in
16
preliminary analyses, we ran up to 2,000 simulations and found that estimated power remained
constant after 500 simulations), storing the P-value from each analysis and then estimating statistical
power as the proportion of simulations that yielded P ≤0.05.
Optimal seasonal timing of surveys
The composition of a local bird assemblage will change markedly over the course of a year.
Large changes are possible even within a breeding season due to births, deaths, and movement in and
out of the area. Apparent changes in the composition of local assemblages can also occur due to
behavioral changes, for example the decline in singing rate that often occurs in later stages of nesting.
The goal of most point-count surveys is to provide a snapshot of the number of individuals present at a
location at a given time, and to do so the timing of each survey should correspond to the period when
the most individuals are the most active. Surveys that are conducted too early may miss some late
arrivals or inadvertently sample migrating individuals, whereas surveys that are conducted too late may
count post-breeding wanderers or may fail to detect individuals busy with raising nestlings or caring for
fledglings. At the same time, an overly narrow sampling window reduces the number of points that can
be sampled per observer and may therefore limit overall sample size. We examined the nature of this
tradeoff by plotting the total number of detections by species for each day that surveys were
conducted. To aid in the visualization of general patterns in these data, we calculated and plotted one-
week moving averages of the number of individuals counted.
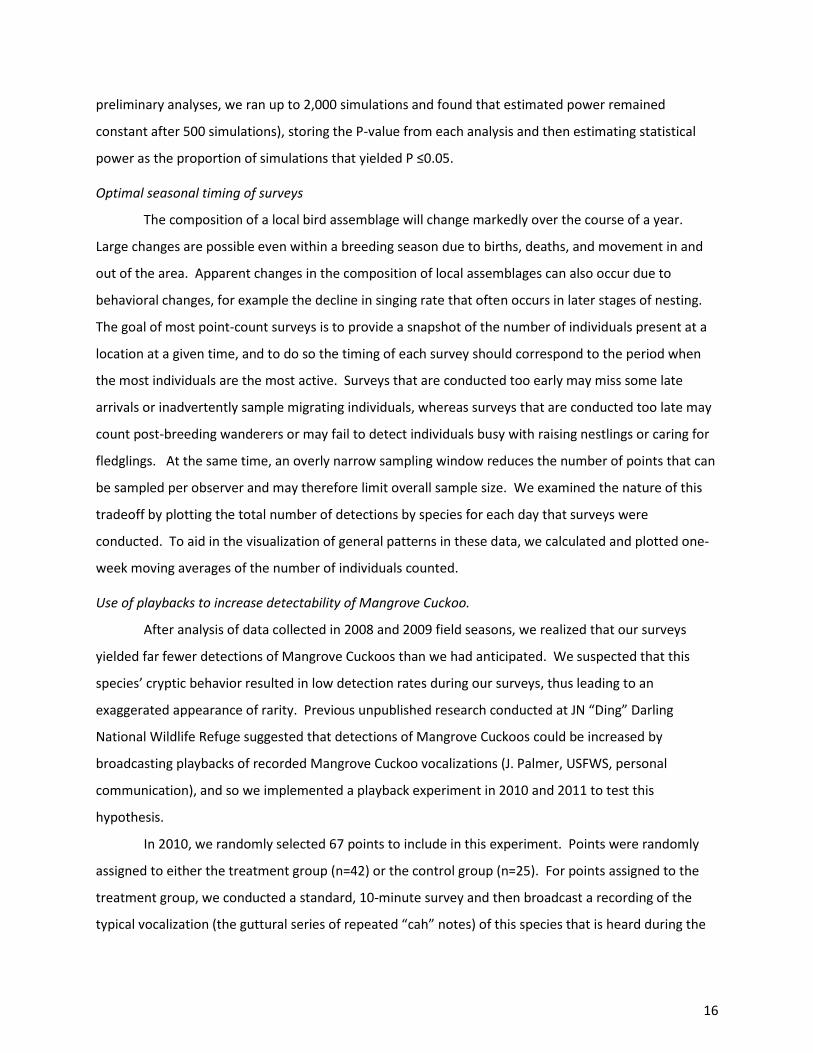
Use of playbacks to increase detectability of Mangrove Cuckoo.
After analysis of data collected in 2008 and 2009 field seasons, we realized that our surveys
yielded far fewer detections of Mangrove Cuckoos than we had anticipated. We suspected that this
species’ cryptic behavior resulted in low detection rates during our surveys, thus leading to an
exaggerated appearance of rarity. Previous unpublished research conducted at JN “Ding” Darling
National Wildlife Refuge suggested that detections of Mangrove Cuckoos could be increased by
broadcasting playbacks of recorded Mangrove Cuckoo vocalizations (J. Palmer, USFWS, personal
communication), and so we implemented a playback experiment in 2010 and 2011 to test this
hypothesis.
In 2010, we randomly selected 67 points to include in this experiment. Points were randomly
assigned to either the treatment group (n=42) or the control group (n=25). For points assigned to the
treatment group, we conducted a standard, 10-minute survey and then broadcast a recording of the
typical vocalization (the guttural series of repeated “cah” notes) of this species that is heard during the

17
breeding season. The function of this vocalization is unknown, but that it is limited to the breeding
season argues for a role in territorial defense and advertisement. The recording lasted for 8 seconds, at
which point we then listened quietly for 52 seconds. This process was repeated 4 more times, for a total
survey period of 5 minutes. During the survey period, we sat quietly in one place and noted the
presence of any Mangrove Cuckoo heard or seen. At control points, the initial 10-minute point count
was followed by 5 minutes of quietly listening and looking for Mangrove Cuckoos. No playbacks were
used at control points.
In 2011, we used the same procedures, but selected points in a somewhat different fashion. As
in 2010, we drew from existing survey points, but we narrowed the set of possible points by drawing
from only those points at which ≥1 Mangrove Cuckoo had been detected during the 2008-2010 survey
of mangrove landbirds. The change in methodology from 2010 to 2011 was done because a preliminary
power analysis indicated that a large sample size (n>500) would be required to achieve desired
statistical power given the number of points at which no cuckoos were detected. We suspected that a
low response rate was partly due to the fact that many of the points that we included in 2010 were not
inhabited by Mangrove Cuckoos (e.g., due to a lack of suitable habitat). Increasing the power of the
experiment required eliminating, to the extent possible, points at which cuckoos were absent. We do
not understand cuckoo habitat requirements sufficiently to predict where they occur based on habitat,
so as an alternative we used the presence of cuckoos in previous years as a surrogate that allowed us to
predict where they might occur in 2011. Of the points at which ≥1 Mangrove Cuckoo had been
detected, we randomly selected 43 points to include in this study. As in 2010, we randomly allocated
points to the treatment group (n=21) or the control group (n=22). Points surveyed in 2010 were not
surveyed again in 2011. Thus, our total sample size was N=110. In both years, we conducted all surveys
between 0600 and 1000 during May and June, putatively the peak breeding season for Mangrove
Cuckoos in Florida (Hughes 1997). All survey locations were accessed by boat, usually a kayak but
sometimes a motor boat.
We compared the frequency of responses between treatment and control points using a
generalized linear model. We assumed a binomial distribution of errors and used the logit link
function. In addition to the main predictor of interest - a dummy variable indicating whether a playback
was used at the point – we also included several covariates that we thought might independently
influence the probability of detecting a Mangrove Cuckoo. First, we included the date on which each
point was visited, because we suspected that the propensity of Mangrove Cuckoos to vocalize
spontaneously or to respond to broadcasts of recorded vocalizations might vary seasonally as a function

18
of what, if any, breeding activities were underway. Second, because the sample of points included in
this experiment was drawn without knowledge of whether Mangrove Cuckoos were present, we also
included a dummy variable that indicated whether any Mangrove Cuckoos had been detected that year
at the point during surveys conducted as part of the separate study of mangrove landbirds. We
assumed that a positive response to either the control or treatment was more likely at points at which
individuals had been detected during the current year. Similarly, we also assumed that the presence of
Mangrove Cuckoos in previous years was also likely a positive indicator of garnering a response during
the experiment, and so we also included a dummy variable indicating whether any Mangrove Cuckoos
had been detected at the point in surveys conducted during previous years (because of how we chose
points in 2011, all points surveyed in that year had the same value for the dummy variable). All analyses
were conducted using R, version 2.12.2.
RESULTS
Abundance and distribution of mangrove landbirds.
We detected a total of 80 species during our surveys (Appendix A), including 31 landbird species
that breed in south Florida and 8 landbirds that winter in south Florida but breed further north or that
pass through Florida during spring migration. All of the 31 landbird species that we detected that breed
in south Florida probably nest at least occasionally in the mangroves, with the possible exception of
Boat-tailed Grackle, which we detected in mangroves only once. We were able to generate estimates
of detectability for species with ≥90 detections. The numbers of detections for all species appear in
Appendix A.
The landbird assemblage was dominated numerically by species that are abundant in a variety
of habitats across south Florida (Table 1). Of the 4 most abundant and widespread species, only the
Prairie Warbler is restricted to mangrove forests. A second group – Red-winged Blackbird (Agelaius
phoeniceus), Great Crested Flycatcher, Pileated Woodpecker (Dryocopus pileatus), American Crow
(Corvus brachyrhynchos), Black-whiskered Vireo, and White-crowned Pigeon – consisted of species that
were either widespread but somewhat less abundant, such as Great Crested Flycatcher, or locally
common but narrowly distributed, such as White-crowned Pigeon (Table 1). The remaining species in
Table 1 were detected in much lower numbers, although, as with the preceding group, in some cases
the apparently low number of detections reflected a narrow distribution within the study area rather
than overall scarcity (e.g., Yellow Warbler).

19
Uncorrected counts were strongly correlated with abundance estimates adjusted for
detectability using removal models (r = 0.99, 95% CI = 0.96 -0.99, P < 0.001; Table 1). We had few
problems fitting removal models to our data. Most of the detections were recorded during the first 3
minutes of each survey, and 75% were recorded within the first 5 minutes; the only notable outlier from
this relationship was Mangrove Cuckoo (Fig. 6). The accumulation rate for Mangrove Cuckoo detections
fell outside of the 95% confidence interval for all other species, indicating a relatively low rate of
detectability. Distance sampling generated very different results than those produced by the removal
models (Table 2). Model fit was adequate in 10 of the 16 species considered (Table 2). We found no
commonalities among the species in which model fit to the data was poor; some showed evidence of
detections clustered close to the observer, whereas some showed far more detections at greater
distances than expected under the model. Overall, detectability estimates appeared unreasonably low.
For example, estimated detectability for White-eyed Vireo and Prairie Warbler seemed low given that
we observed both species vocalizing loudly and frequently. As a result, we suspect that abundance
estimates generated by distance sampling were biased high, and so we based our interpretations on the
estimates produced by removal models. We note, however, that we lack any independent measure of
abundance against which to compare the different approaches for adjusting raw counts for
detectability, and so we cannot rule out the possibility that estimates produced by distance sampling are
in fact more accurate than those based on removal models.
Overall patterns of abundance are, in some cases, confounded with patterns of distribution. For
species with a limited distribution in the study area, average abundance when present (Table 3) is much
greater than abundance averaged across all points. We identified three main patterns of distribution:
species that were widespread and found at points throughout the study area, species with a southerly
distribution that were restricted mostly to the Florida Keys and islands of Florida Bay, and species with a
northerly distribution that were restricted mostly to the mainland mangrove forests and 10,000 Islands
region. Widespread species included Red-bellied Woodpeckers, Northern Cardinal (Cardinalis
cardinalis), Prairie Warbler, Black-whiskered Vireo, Great Crested Flycatcher, and Mangrove Cuckoo
(Figs. 7-12). With the exception of Mangrove Cuckoo, which was found at very low abundance, all of
these species were abundant in addition to being widespread. In general, each of these species was
found at roughly similar levels of abundance in all of the areas sampled (Table 4). Except for Mangrove
Cuckoo, all of these species were abundant when present (Table 3).
Species with a more southerly distribution within the study area included Red-winged Blackbird,
White-crowned Pigeon, Gray Kingbird, Yellow Warbler, Common Yellowthroat (Geothlypis trichas), and
20
Common Grackle (Quiscalus quiscula) (Figs. 13-18). Some of these species – notably, White-crowned
Pigeon, Gray Kingbird, and Yellow Warbler – have global distributions centered on the West Indies, so
we assume that their prevalence in the southern portion of the study area reflects a combination of
proximity to recent colonization sources (e.g., Yellow Warblers) and the distribution of suitable habitat
conditions within the study area. Other members of this group, including Red-winged Blackbird,
Common Yellowthroat, and Common Grackle, are more temperate in their geographic affiliation, and
their greater abundance at southerly points likely reflects habitat preferences. In particular, open,
marshy vegetation, which all of these species prefer in other parts of their range, is widespread in the
Keys and on many of the islands in Florida Bay. Support for this hypothesis was also evident in the
occurrence of these species at inland points near the transition from mangrove to freshwater marsh
(e.g., Common Yellowthroat, Fig. 17). Three species in this group – Red-winged Blackbird, Yellow
Warbler, and White-crowned Pigeon – were quite abundant when present (Table 3).
Four species had distributions centered on the northern portion of the study area (Figs. 19-22):
White-eyed Vireo, American Crow, Carolina Wren (Thryothorus ludovicianus), and Pileated Woodpecker.
Each of these species is distributed widely in other habitats across south Florida, and probably only used
mangroves under certain conditions (e.g., Pileated Woodpeckers only occur in those forests where
large-diameter trees are widespread). Both Pileated Woodpecker and American Crow were fairly
common when present; Carolina Wren tended to occur at relatively low abundance wherever it
occurred (Table 3).
Mourning Doves exhibited a unique distributional pattern, reaching their greatest abundance in
the far south of the study area and the far north of their study area. Abundant in the Keys, they were
mostly absent from Biscayne National Park and Everglades National Park, reappearing again at relatively
high abundance in the Ten Thousand Islands region (Table 4; Fig. 23).
Four species were detected that did not fit into any of these broad distributional groupings,
primarily because they were detected very infrequently. This group included Eastern Towhee (Pipilo
erythrophthalmus), Blue Jay (Cyanocitta cristata), Northern Flicker (Colaptes auratus), and Downy
Woodpecker (Picoides pubescens) (Appendix A). Blue Jay, Northern Flicker, and Downy Woodpecker are
probably only occasional residents or casual visitors to mangrove forests. Eastern Towhees present a
more interesting case, as they were consistently found at points in Hell’s Bay, suggesting the existence
of a small, perhaps remnant, population in the mangroves. Robertson and Kushlan (1974), citing a
communication from J. B Edscorn, mention that Eastern Towhees may have “sparse breeding
populations” in the mangroves, perhaps alluding to the population of birds at Hell’s Bay.

21
Habitat associations of mangrove landbirds.
Red-mangrove forest was the dominant vegetation type at 50.3% of points, and averaged 50.3%
cover (95% CI = 45.2% – 55.4%) (see Appendix B for photos). Mixed-mangrove forest was the dominant
cover type at 28.4% of points, with an average cover of 30.2% (95% CI =25.7% – 34.7%). None of the
other cover types was dominant at >5% of points, and none had an average cover of >5%. Open water
covered 0 – 70% of the survey area at points. The average percent cover by water was 17.8% (95% CI =
16.2% – 19.5%). The distribution of cover types was not even across the study area, although red-
mangrove forest was dominant at some points in every region. Mixed-mangrove forest dominated at
least some points in all regions except in the Keys. Black-mangrove forest was dominant only at points
on islands in Florida Bay. Tropical hardwoods were a significant component of vegetation cover only at
sites in the interior of Everglades National Park, including the Canepatch area, Lane’s Bay, and Hell’s Bay.
Extensive buttonwood and black-mangrove woodlands were found only near the Snake Bight and
Rowdy Bend trails. Scrub mangrove was limited primarily to the Keys. Canopy height was greatest in
the forest along the major rivers of the southwest coast, averaging 11.3 m (95% CI = 10.8 m – 11.8 m).
Intermediate heights were observed on the islands of Florida Bay (9.4 m, 95% CI = 9.0 m – 9.8 m) and at
Ten Thousand Islands (9.0 m, 95% CI = 8.7 m – 9.4 m). Lower values were observed at interior sites in
Everglades National Park (8.1 m, 95% CI = 7.5 m – 8.6 m), at Biscayne National Park (7.7 m, 95% CI = 6.9
m – 8.5 m), and finally in the Keys, where the lowest average canopy heights were observed (6.6 m, 95%
CI = 5.8 m – 7.0 m).
We focused our quantitative modeling efforts on 5 mangrove specialists: White-crowned
Pigeon, Gray Kingbird, Black-whiskered Vireo, Prairie Warbler, and Yellow Warbler. We did not attempt
to model habitat relationships for Mangrove Cuckoo because we were concerned that the low
detectability of this species may have resulted in a large number of false absences. False absences can
produce biased estimates of the association between abundance and vegetation cover.
Abundance of White-crowned Pigeons was significantly associated with the extent of red-
mangrove forest (P<0.001), black-mangrove forest (P=0.01), buttonwood (P=0.004), maximum canopy
height (P<0.001), and scrub mangrove (P<0.001) (Fig. 24). The model that included only these terms
explained 27% of the variation in counts of White-crowned Pigeons. Variation in Gray Kingbird
abundance was significantly associated with the extent of black-mangrove forest (P<0.001), maximum
canopy height (P<0.001), scrub mangrove (P<0.001) (Fig. 25). The model that included only these terms
explained 19% of the variation in the number of Gray Kingbirds counted at a point. Black-whiskered
Vireo abundance was related to the extent of black-mangrove forest (P<0.001), scrub mangrove

22
(P<0.001), and tropical hardwoods (P=0.004) (Fig. 26). The reduced model explained 13.5% of the
observed variation in counts of Black-whiskered Vireos. Yellow Warbler abundance was related to only
one variable: the extent of black-mangrove forest (P<0.001) (Fig. 27). The model with this single term
explained 76% of the observed variation in Yellow Warbler counts. Prairie Warbler abundance was
associated with variation in the extent of black-mangrove forest (P < 0.001), tropical hardwoods (P<
0.001), and maximum canopy height (P<0.001) (Fig. 28). The model with these terms explained 28% of
the variation in counts of Prairie Warblers.
For three of the species in this analysis – White-crowned Pigeon, Gray Kingbird, and Yellow
Warbler – the habitat relationships described above reflect in part their narrow distribution. That is,
features more common at the northern end of the study area (e.g., tall canopied stands of red
mangrove) may appear to be selected against simply because those features are not found in the Keys
or on the islands of Florida Bay. To address this issue, we also conducted the analyses considering only
those points within the Keys and Florida Bay. White-crowned Pigeon abundance was related to red-
mangrove forest (P<0.001) and black-mangrove forest (P<0.001), but the nature of the relationships
differed from those described in the analysis of all points in the study area (Fig. 29). The model applied
to the reduced data set explained a similar amount of variance in White-crowned Pigeon abundance
(29%). We could not estimate the relationship between White-crowned Pigeons and canopy height or
extent of scrub mangrove due to the small sample size of the restricted data set. For Gray Kingbirds,
none of the predictor variables were significant when only the reduced data set was analyzed – all terms
were smoothed to zero, producing a null model. For Yellow Warblers, the analysis of the reduced data
set produced the same result – abundance increased as a non-linear function of the extent of black-
mangrove forest – as generated from the analysis of the complete data et.
A long-term monitoring protocol for mangrove landbirds.
Optimal number of points to survey
For a moderately abundant species (Black-whiskered Vireos, 0.36 birds per point), surveying
points every 5 years was generally more efficient than annual or biennial sampling (Fig. 30). Achieving
80% power to detect a 50% decline over 20 years, at α = 0.05, required sampling approximately 50
points annually, 100 points biennially, or 150 points every 5 years. Over a 5-year period, annual and
biennial sampling at this level required 1.7 times as much effort as quinquennial sampling.

23
Optimal seasonal timing of surveys
The six species of landbirds limited primarily to mangroves showed similar detection rates over
the course of our surveys (Fig. 31). Detections were low in late April, rose through May and early June,
and began declining in late June. One-week moving averages for White-crowned Pigeons and Yellow
Warblers were flat across the season. Black-whiskered Vireos exhibited 3 peaks in detection rate, with
two smaller peaks occurring in early May and mid-June, and one larger amplitude peak occurring in late
May. The moving average for detection rate of Prairie Warblers was flat throughout much of May, and
declined slowly through June. Moving averages of detection rates for Mangrove Cuckoos and Gray
Kingbirds were highest in mid- to late May, with Gray Kingbirds showing a slightly earlier peak than
Mangrove Cuckoos, and then declined modestly throughout the remainder of the survey season.
Use of playbacks to increase detectability of Mangrove Cuckoo
We conducted 42 playback and 21 control experiments in 2010 and 25 playback and 22 control
experiments in 2011. We surveyed control points between 9 May and 23 June in 2010 and 7 May and
June 15 in 2011. We surveyed experimental points between 9 May and 26 June in 2010 and 7 May and
22 June in 2011. The median date on which control points were surveyed was 27 May and 16 May in
2010 and 2011, respectively. The median date on which experimental points were surveyed was 9 June
and 23 May in 2010 and 2011, respectively. We detected Mangrove Cuckoos at 14 of the 67 treatment
points (20.9%) and at 1 of the 44 control points (2.3%). This difference was highly significant: using a
playback (P=0.01) increased the likelihood of detecting a Mangrove Cuckoo. We never recorded a
response by >1 bird at any point; males and females are not distinguishable by sight, so we do not know
the sex of birds responding to the playback. The average time of response was 131 s (range: 20 s – 267
s). All of the birds detected during the experiment were first detected within 50 m of the observer. Of
the other predictors, only the presence of Mangrove Cuckoos at the point in past years was significantly
related to the probability of detecting a Mangrove Cuckoo (P = 0.05). Detections of cuckoos during
other surveys conducted in the same year was unrelated to the probability of detecting a cuckoo during
the experiment (P = 0.5) as was the date on which the experiment was conducted (P = 0.74).

24
DISCUSSION
Abundance and distribution of mangrove landbirds.
Patterns of abundance of mangrove landbirds.
The assemblage of mangrove landbirds was dominated numerically by a group of 4 species that
are both abundant (>1 individual per point) and widespread in their distribution: Red-bellied
Woodpecker, Northern Cardinal, Prairie Warbler, and White-eyed Vireo. Of this group, only the Prairie
Warbler is endemic to mangroves; the remaining 3 species are common in a variety of habitats
throughout the eastern United States. A second group was composed of species found at slightly lower
average abundances (c.a. 0.4-0.8 individuals/point). This group included Great Crested Flycatcher,
Pileated Woodpecker, American Crow, and Black-whiskered Vireo, which were widespread and
moderately abundant throughout the study area, and Red-winged Blackbird and White-crowned Pigeon,
which were more localized in their distribution but very abundant where present. Of the species in this
group, only Black-whiskered Vireo and White-crowned Pigeon depend on mangroves for habitat. The
remaining species in the mangrove landbird assemblage were relatively uncommon (<0.2
individuals/point). With the exception of Yellow Warblers and Gray Kingbirds, which had very limited
ranges but were abundant when present, the species in this group were never found in great numbers.
Some were probably only occasional or transient inhabitants of the mangroves, such as Blue Jays and
Downy Woodpeckers. Others were more closely associated with adjacent habitat types, such as
Carolina Wrens, which were generally found further inland at the transition from mangroves to
freshwater marsh.
The most enigmatic of the uncommon members of the assemblage was the Mangrove Cuckoo,
which, despite being dependent on mangroves for habitat, was both local and inconsistent in its
distribution (i.e., it was rarely counted at the same point in different years) and present only in low
numbers where it occurred. Passive surveys undercounted the true number of this species, and our
effort to account for detectability probably did not address undercounting because the removal models
(or, for that matter, distance sampling) do not account for birds present but unavailable for detection
(i.e., individuals that did not vocalize during the count). This suggests that the estimates of abundance
presented in this report are substantial underestimates of the true abundance of Mangrove Cuckoos.
Patterns of distribution of mangrove landbirds.
The relatively narrow strip of Florida’s southern coastline covered by mangroves marks both a
northward and southward front: several temperate species reach their southern range limit in the

25
mangroves of peninsular Florida, and several West Indian species reach their northern range limit in the
Keys and islands of Florida Bay. The former group includes Carolina Wren, White-eyed Vireo, Eastern
Towhee, Pileated Woodpecker, and American Crow, and in the latter are Yellow Warbler and White-
crowned Pigeon (we detected Gray Kingbird only in the Keys, but it is also known to occur as far north as
the Carolinas). Mourning Doves may represent both situations. Birds in the Keys may belong to
northernmost populations of Z. m. macroura and individuals in the Ten Thousands Islands region may
belong to the widespread temperate subspecies Z. m. carolinensis (Aldrich and Duvall 1958). In the case
of Yellow Warbler, and perhaps Mourning Doves, the observed distribution probably reflects the recent
history of colonization from the south. There are no obvious habitat factors limiting the northward
spread of Yellow Warblers, and so over time we might expect to see Yellow Warblers breeding beyond
Florida Bay. Species like Pileated Woodpecker and White-crowned Pigeon are probably limited by the
distribution of key habitat features. In the case of Pileated Woodpeckers, the presence of large snags in
which to nest likely acts as a limiting factor. White-crowned Pigeons, on the other hand, are likely
limited to Florida Bay and the Keys by the joint distribution of predator-free islands and poisonwood
(Metopium toxiferum), a key food species. Why the remaining species appear to hit a north or south
range limit in the mangroves is unclear, but range limits might generally reflect the gradual retreat of
temperate species and the slow expansion of tropical species.
Red-bellied Woodpecker, Northern Cardinal, and Prairie Warbler were essentially ubiquitous
and not obviously limited by habitat or larger biogeographic processes (e.g., ongoing range expansion).
Members of this group were detected in all regions of the study area and at >75% of all survey points,
and were typically found at relatively high density. No obvious distributional breaks were apparent for
Great Crested Flycatcher, Black-whiskered Vireo, Red-shouldered Hawk, and Mangrove Cuckoo, either,
although species in this group were found at somewhat lower densities and at far fewer points. Given
the difficulty of detecting Mangrove Cuckoos, we are hesitant to draw conclusions about the distribution
of this species in the mangroves, as continued surveys would likely reveal a very different pattern of
occupancy. Finally, both Common Yellowthroat and Red-winged Blackbird were found throughout the
study area but at only a small percentage of survey points. Distributions of both species overlapped
extensively, and were likely driven by their shared preference for shrubby marshes.
Habitat associations of mangrove landbirds.
In previous reports, we have noted that existing, spatially explicit data were inadequate for
quantifying habitat associations of mangrove landbirds. For example, the Florida Land Cover data
classified most of our points into a single class, mixed-mangrove forest. Not only does this preclude any

26
meaningful analysis of the relationship between bird abundance and vegetation type, but it also appears
to be incorrect at the scale of our measurements; in direct field sampling, we found that most of our
points were dominated by red-mangrove forest. This does not indicate that the Florida Land Cover data
are erroneous, but rather highlights the problem of downscaling remotely sensed data. In addition to
these methodological challenges, use of the land-cover types to examine habitat associations may be
undesirable for other reasons. For example, the Florida Land Cover database did not distinguish among
some mangrove forests that are substantially different when viewed from the ground. The database
classifies some of the short red mangrove that fringe the Florida Bay islands as dwarf mangrove,
presumably because of their short stature, even though these narrow patches of fringing mangrove are
quite different ecologically from the extensive stands of stunted red mangrove that occur further inland
and that are more closely aligned with conventional definitions of the dwarf mangrove forest type (e.g.,
Lugo and Snedaker 1974).
Given these problems, we conducted field sampling of vegetation conditions in 2011 to identify
bird-vegetation relationships. The advantage of this approach was that it allowed us to address some of
the concerns about the accuracy of the Florida Land Cover data for the scale at which our study was
conducted. The disadvantage of developing models based on field-sampled vegetation cover was that it
did not allow us to predict abundance of mangrove landbirds at points that we did not sample because
we have no information on vegetation cover outside of our sample points. These concerns were
unwarranted because the resulting models were relatively uninformative. The models were of little use
in elucidating relationships between birds and vegetation structure because the results were unduly
influenced by the distribution of uncommon cover types and because the results were scale-dependent
and tended to reflect broad differences in vegetation structure among different regions of the study
area.
As an example of the effect of uncommon vegetation types on the relationships, two species,
Black-whiskered Vireo and Prairie Warbler, showed negative relationships with tropical hardwoods.
However, this relationship almost certainly reflected a quirk in our data set, whereby the only locations
with substantial cover by hardwoods were inland sites near the marsh ecotone in the Canepatch area of
Everglades National Park. It is likely that Black-whiskered Vireo and Prairie Warbler avoid these inland
sites for other reasons (e.g., extensive areas of open marsh offer few nesting and foraging
opportunities), not because they avoid tropical hardwoods per se. Indeed, Black-whiskered Vireos are
relatively abundant in hardwood hammocks in the Keys. As such, we suspect that the relationship we
have described is spurious both for Black-whiskered Vireo and Prairie Warbler.

27
The problem of potential confounding between large-scale differences in vegetation cover and
geographic range limits of birds was more widespread. For example, White-crowned Pigeon, Gray
Kingbird, and Yellow Warbler all showed positive relationships with three habitat variables that
exhibited a distinct latitudinal gradient: black-mangrove forest, canopy height, and extent of scrub
mangrove. Black-mangrove forest was most extensive on the islands of Florida Bay, scrub mangrove
was most extensive in the Keys, and canopy height was lowest in the Keys. White-crowned Pigeon, Gray
Kingbird, and Yellow Warbler all have distributions centered on Florida Bay and the Keys, raising the
question of whether the relationships with the habitat variables were simply a reflection of the
geographic distribution of the birds. In two cases, the relationships derived from an analysis of the
complete data set were quite different from those derived from the analysis of points within the Keys
and Florida Bay (that is, excluding points beyond the current range limits of the three bird species). For
White-crowned Pigeon, the relationship with black-mangrove forest switched sign, from positive at the
larger scale to negative when considering only those points within their range. White-crowned Pigeons
showed a positive relationship with buttonwood when considering all points within the study area, and
no relationship when the analysis was limited to the Keys and Florida Bay. The relationship with red-
mangrove forest was consistent regardless of the scale of analysis. For Gray Kingbird, none of the
variables were significant predictors of abundance when the analysis was limited to the Keys and islands
of Florida Bay, whereas this species showed significant relationships with black-mangrove forest, canopy
height, and scrub mangrove when modeling was applied to points from across the study area. The
habitat models for White-crowned Pigeons and Gray Kingbirds that were based on all of the points in
the study area are therefore unreliable, and probably reflected latitudinal differences in vegetation
structure that corresponded with the distribution of both species. Only Yellow Warblers showed a
consistent relationship regardless of scale, suggesting that this species does seek out black-mangrove
forests.
Given the difficulties that we had in creating habitat models with vegetation cover as a
predictor, we suggest that future investigations focus on more intensive descriptions of habitat use, for
example by delineating individual home ranges and identifying those features of vegetation structure
and composition that distinguish home ranges from unoccupied areas. In the meantime, our qualitative
descriptions of distribution may prove useful in identifying broad patterns and generating hypotheses
about habitat use among mangrove landbirds. In Appendix C, we provide a brief description of our
findings for each mangrove landbird.

28
A long-term monitoring protocol for mangrove landbirds.
We considered four general elements important in designing a long-term monitoring protocol:
sample design, or how survey points are identified; sample size; timing of sampling; and analysis of data,
in particular how to account for imperfect detection of birds. We also addressed a fifth issue specific to
this study, namely whether detection rates of Mangrove Cuckoos could be increased through the use of
recorded vocalizations.
Designing a sampling network
We found that a GRTS sampling design has several useful features. This approach generates a
spatially balanced sampling network while maintaining a non-zero probability of inclusion for every
possible point, thus allowing for straightforward estimates of variance while avoiding the potential
problems of purely random sampling designs (e.g., spatial clustering). This method also allows for
additional points to be incorporated at a later date, which may be useful if the scope or intensity of
monitoring changes. However, implementing GRTS was not without its difficulties. The most obvious
shortcoming is that the GRTS sample included many points that did not meet our accessibility rule. This
required drawing a much larger GRTS sample than needed (1,000 points, when only approximately 10%
could be used) and manually discarding all those that were not accessible. This problem could be
overcome by better defining the sampling frame within the GIS so that the grid of possible points only
included accessible areas. However, doing so would require spatially explicit information that is
currently unavailable. For example, we had no way to limit the sampling frame to navigable creeks <50
m wide, as existing data do not identify the width of water features. Thus, many of the points drawn in
the GRTS sample were along large watercourses, which we did not wish to sample or along creeks so
small that they could not be accessed by kayak. Conversely, many navigable creeks were not identified
in existing spatial data sets, and thus would not have been included in the sampling frame if, for
example, we had delineated the sampling frame based on creeks identified in available GIS coverages.
In sum, for the GRTS approach to be efficient, the sampling frame must be thoroughly and carefully
defined; if all possible limitations on the sampling frame cannot be defined a priori, then extensive post-
processing screening of the GRTS sample will be required.
In defining the appropriate sampling frame, long-term monitoring programs, such as that being
piloted in this study, need to balance the importance of statistical rigor with the realities of data
collection. In the case of mangrove forests, the most significant problem is that many areas are simply
not accessible except by extraordinary means. For example, we found that accessing a single point on
some of the small islands in the lower Keys required 3-4 hours, which precludes doing more than a

29
single survey in a morning. Thus, although it is possible to sample randomly from all mangrove forests in
south Florida, doing so comes at the expense of sample size. As such, assuming that resources are not
unlimited, there is a trade-off between the extent of the sampling frame – that is, the area about which
we wish to draw inference – and the power to detect trends in population size or to describe habitat
associations. Before any long-term monitoring program is adopted, potential users of the data should
agree on a suitable sampling frame. In other words, is it sufficient to sample accessible areas, or must
we take extraordinary measures to reach inaccessible locations away from creeks or trails? To help
answer this question, it may be useful to invest in additional research to determine the extent to which
counts conducted along accessible features produce biased estimates of abundance and distribution.
Concerns about the nature of the sampling frame might be mitigated if it was determined that counts
from points along creeks or trails produced similar estimates of abundance as counts conducted at
points in the mangrove interior.
Optimal number of points to survey
Of the various monitoring scenarios that we considered, the most efficient approach was to
sample every 5 years. We estimated that sampling 150 points every 5 years would yield approximately
80% power to detect a 50% decline over 20 years at α = 0.05; sampling 200 points every 5 years would
yield approximately 90% power to detect this trend. In contrast, annual and biennial sampling required
approximately 1.7 times as much effort. Under either annual or biennial sampling, achieving the desired
power required conducting approximately 250 points over a 5-year period. This is fewer points than
currently surveyed, which suggests that a subset of the points that we have established would make a
suitable sampling frame for a long-term monitoring effort.
However, the power analysis assumes that every point has a non-zero probability of yielding at
least 1 individual of the focal species. For many of the species in this study, a random sample of 150
points – or worse, 50 points – would likely include a non-negligible number of points where the species
never occurred. This scenario would result in a realized power much lower than predicted by the power
analysis. The results of the power analysis should therefore be viewed as the minimum number needed
within a properly defined sampling frame. A poorly designed sampling frame will require many more
points than predicted here.
Our power analysis was based on a trend that started with an average abundance equal to that
observed for Black-whiskered Vireos from 2008-2011. As such, a monitoring program based around the
findings of this analysis should be suitable for detecting trends in most of the mangrove-dependent
species in Florida, assuming that the sampling frame is appropriately described. Trends in abundance of

30
Mangrove Cuckoos, however, would almost certainly not be estimated with sufficient precision under a
monitoring program designed around more commonly encountered species. A monitoring program
capable of detecting trends in this species, given its rarity and spotty distribution, would require either
adopting methods to increase detectability or surveying a large number of points and perhaps adopting
a more refined sampling frame so as to avoid sampling areas of non-habitat. Until we have a better
understanding of the habitat needs of this species, we would not recommend designing a range-wide
monitoring program around Mangrove Cuckoos. Instead, more intensive monitoring in the few areas
where it appears to be more common, such as the Ten Thousand Islands area or Biscayne National Park,
might provide some early warning of population declines. For example, Lloyd and Doyle (2011) were
able to document significant declines in Mangrove Cuckoos over an 8-year period at Ten Thousand
Islands National Wildlife Refuge based on surveys conducted at 101 points. Using call-playback surveys
across a broader area might also be useful, as long as doing so is compatible with generating estimates
of abundance for other focal species.
Optimal seasonal timing of surveys
In designing this study, we relied on anecdotal information provided by Terry Doyle (USFWS) to
define the appropriate time of year in which to conduct surveys. In his experience, surveys conducted
between 1 May and 15 June were most useful because singing rates were high, wintering birds and most
passage migrants had departed, and migratory breeders like Black-whiskered Vireos had returned. Our
results support this conclusion. For some species, detections were relatively consistent over the course
of the season; for others, detections tended to peak in mid-May to early June. As such, surveys
conducted from 1 May to 15 June would encompass the apparent peak of singing activity in the
mangroves. If a longer survey season were required, extending the season later into June would be
preferable to starting earlier in April, as counts were generally low in late April but remained relatively
high into the end of June.
Analyzing survey data
Identifying the best sampling methodology is difficult because much of our assessment is, by
necessity, based on theoretical considerations or our own opinion. We recommend continued use of
removal models (or similar methods) and do not recommend that future survey and monitoring efforts
take the time to estimate the distance to each detection. Removal models did not require problematic
assumptions about the spatial distribution of individuals relative to the observer (as is the case with
distance sampling) and generated estimates of detectability that in our opinion were reasonable,

31
although much of our confidence in the results of the removal models is based largely on their close
correlation with uncorrected estimates of abundance. We recognize the circular nature of this
argument (i.e., that a method producing estimates close to uncorrected values is preferable).
Nonetheless, it reflects our general concern that existing methods for estimating detectability are
burdened with assumptions that are difficult to test and, if not met, may result in biased estimates.
A ten-minute count period worked well with the removal models. We found, averaging across
species, that nearly 75% of detections were recorded in the first 5 minutes of a survey. This suggests
that the duration of the survey period could be reduced from 10 minutes to 5 minutes with a
proportionally smaller loss of sample size. However, the benefit of doing so is likely small because travel
time accounts for the majority of field time. Most locations in the mangroves are difficult to access and
doing so requires substantial effort and time. On average, the travel time between subsequent points is
10 minutes, so that 20 minutes elapses from the start of one survey to the beginning of the next. Given
a 2-hour survey period, reducing the survey duration to 5 minutes would allow 2 extra points to be
surveyed; in other words, a halving of survey time would yield a 25% increase in the number of points
that could be sampled. In many cases, the gain in number of points sampled would be null; for example,
travel time between points on islands in Florida Bay is as long as 40 minutes, and so any reduction in
survey duration is unlikely to allow any more points to be visited on a given day. Unless points are
closely spaced and easy to access, we suggest maintaining a ten-minute count period.
In previous reports, we have used distance sampling to estimate abundance and correct for
imperfect detectability of birds during our surveys. Although the analysis of distance data is relatively
straightforward, and the method is well supported in certain situations, it relies heavily on the
assumption that individual birds are distributed at random in regards to the observer. This assumption
can be met by placing survey points randomly. In this survey, points were not placed randomly, but
instead were placed along features accessible by boat or foot, primarily tidal creeks and hiking trails. If
vegetation structure changes along the edge of creeks or trails, which it almost certainly does, then birds
may not be distributed at random in regards to the observer and estimates produced by distance
sampling will be biased. Similarly, birds will not be distributed at random in regards to the observer
when large areas of open water are present in the survey area, because individuals that are detected
will generally be recorded when they are singing from a perch within the mangroves. Distance sampling
is therefore poorly suited to our study area on theoretical grounds. From a purely subjective standpoint,
the estimates of detectability generated by distance sampling seemed too low, and the resulting
estimates of density too high. Of course, we have no way of knowing the actual detectability of

32
different species in the mangrove, but we have difficulty believing that a relatively loud and vocal
species such as White-eyed Vireo would be detected only 19% of the time that it sings, or that Northern
Cardinals and Red-bellied Woodpeckers were detected less than half of the time that they were present
and singing.
Determining how best to address the problem of imperfect detectability presents a significant
challenge. As pointed out by Johnson (2008), every method used to correct for variation in detectability
relies on a number of assumptions, few of which can be evaluated. As a consequence, estimates of
abundance that have been corrected for detectability are not necessarily closer to the true value of
abundance than are uncorrected counts; indeed, in some cases, corrected counts may be more biased
than uncorrected counts (Efford and Dawson 2009). Unfortunately, in extensive studies such as ours,
we rarely know the true value of abundance, and thus have no way to evaluate whether our efforts to
correct for detectability are improving our estimates. Nonetheless, we suggest that future surveys
employ removal models, or some similar approach, and avoid distance sampling unless a strong
argument can be made to counter the associated theoretical problems. We also recommend that future
surveys report unadjusted counts, which will allow comparisons among studies using different methods
and, ultimately, may be the best use of the data (Grant et al. 2010).
Use of playbacks to increase detectability of Mangrove Cuckoos
The final issue regarding sampling methodology concerns the low detectability of Mangrove
Cuckoos. As an apparently rare and declining (Lloyd and Doyle 2011) species, survey and monitoring
efforts need to adequately describe the abundance and distribution of Mangrove Cuckoos. Mangrove
Cuckoos are easy to detect when they vocalize – they are relatively loud and their calls are unmistakable
– but they seem to vocalize infrequently. When they do not vocalize they are difficult to detect because,
like most birds in the mangroves, they spend most of their time within the dense vegetation and so are
seen only rarely. It is unlikely that correcting for detectability using removal models – or any other
approach, for that matter – addresses the undercounting, because the detectability correction does not
account for individuals that are present but not available for detection. Our experiment with the use of
recorded playbacks indicated that broadcasting vocalizations produced a substantial gain in detection
rate, presumably because the recordings stimulated individuals present, but otherwise undetectable, to
vocalize in response. Assuming that our control and treatment points contained an equal number of
individuals, which we attempted to ensure by randomizing application of the treatment, playbacks
increased detection rate by ten-fold. As such, any future survey or monitoring effort should incorporate
playbacks because doing so will produce more accurate estimates of abundance and distribution. One

33
risk of doing so is that the use of a recorded playback may also change vocalization patterns in other
species, which would require that all future results be adjusted for detectability in order to allow
comparisons with our data set. We do not know whether other species increase or decrease their rate
of vocalization when exposed to playbacks of Mangrove Cuckoos, but it would be worthwhile to
evaluate this possibility before adopting playbacks into any future, multi-species survey and monitoring
effort.
Summary
Although we have identified several technical challenges in implementing an efficient
monitoring program for mangrove birds, the greatest obstacle may be the lack of institutional sponsors
and associated funding. A comprehensive, dedicated program for monitoring mangrove landbirds will
require personnel to maintain and update a database, conduct surveys, analyze data, and prepare
reports and publications. A coordinator would likely be necessary to ensure data quality and provide
outreach so that potential users are aware of the data and able to access it. Ultimately, implementing a
long-term monitoring program for mangrove landbirds will require a consistent source of funding,
whether that funding comes in the form of administration approval for agency biologists to conduct the
work or more directly in the form of grants or contracts.
At least two options for keeping tabs on populations of mangrove landbirds exist even if a
dedicated, range-wide monitoring program cannot be implemented in the short-term. First, individual
administrative units (e.g., Ten Thousand Island National Wildlife Refuge or Biscayne National Park) with
the interest and resources can pursue monitoring on a smaller scale. As evidence by Lloyd and Doyle
(2011), even local and small-scale monitoring programs can be useful in providing early warning of
problems that may eventually reach populations throughout the mangroves. The advantage of this
approach is that it allows some level of monitoring even if a range-wide program proves unviable and
allows for more local control over the objectives of the effort (e.g., monitoring can be tailored to
examine the response of populations to local management actions). The potential disadvantages are
that it can lead to data that are not comparable between different sites and can result in many small,
independent efforts, none of which have sufficient power to detect biologically important trends range-
wide. If individual agencies or organizations pursue small-scale monitoring efforts, we encourage them
at the very least to adopt a unified approach to conducting surveys. Based on our findings, we
recommend using counts of at least 6 minutes duration, with detections tallied into 1-minute intervals.
Recording detections for 6 minutes yields 75% of the detections gleaned from 10-minute counts at 60%
of the effort, an important consideration if time is limited. However, any gain in efficiency achieved by

34
reducing survey duration may be entirely negligible when travel time to and among points is large.
Intervals can be merged during analysis, but retaining 1-minute intervals provides maximum flexibility.
A second approach is to use existing monitoring tools to the fullest extent possible to address
the need for long-term monitoring. The Breeding Bird Survey (BBS), a roadside survey of North American
avifauna managed by the U.S. Geological Survey (USGS), has been a valuable monitoring tool for many
breeding birds in Florida. Each 24.5 mile randomly placed BBS route consists of 50 3-minute counts,
each 0.5 mile apart. Surveys are conducted by volunteers once a year during the breeding season (1
May-15 June in Florida), and birds seen or heard within the 3 minutes at each point count location are
totaled on a data sheet. The BBS is an unlimited distance point count survey. Detailed information on
survey methods, observer training, and data submission and use can be found at
http://www.pwrc.usgs.gov/bbs/. Florida currently has 92 BBS routes. Of these, 20 are nonrandom
routes (‘900” series) established to monitor birds on public lands. The USGS does not include data from
900 series routes in its annual trend analysis; however, data are managed and available for other users.
Nonrandom routes can be established by providing the USGS stop descriptions, stop coordinates, a
route map, and assurance that the route will be consistently run. Nonrandom routes can consist of
disjunct sections and include portions conducted by boat (personal communication, Keith L. Pardieck,
BBS National Coordinator). Once the route is established, the Florida BBS coordinator can assign an
observer.
Roadside surveys of avian populations may not adequately sample some habitats (Betts et al.
2007) and this is especially true of mangrove and coastal hardwood hammock in South Florida. Only 4
active BBS routes in Monroe and Miami-Dade counties (#s 25-135, 25-180, 25-283, and 25-907) include
portions of these habitats. Four other routes located in coastal South Florida were discontinued
primarily because increased traffic made surveys unsafe. We recommend that additional nonrandom
900 series BBS routes be established where possible, particularly in Collier County, to better monitor
avifauna in mangrove and hardwood hammock on a regional scale. The flexibility of nonrandom routes
would facilitate surveys in these relatively inaccessible habitats. If necessary, remote sensing (Landsat
land-cover files and GIS applications) could be used to delineate a sample area and select potential
routes or arrays of points on public lands in coastal southern Florida. Managers of public land or
volunteers could be recruited to conduct surveys.
Despite the challenges that face any effort to craft and implement a long-term monitoring
program for mangrove landbirds, there are many good reasons to do so. Florida’s mangroves host a
unique avifauna. Many of the breeding species occur nowhere else in North America. Despite the

35
reputation for elusiveness and rarity associated with this group of birds, only Mangrove Cuckoos appear
truly uncommon. Some of the mangrove-dependent species are widespread and abundant, and most
are abundant in at least some parts of the mangroves. Nonetheless, recent declines of Mangrove
Cuckoos and Black-whiskered Vireos in the Ten Thousand Islands area (Lloyd and Doyle 2011) should
warn against any complacency that comes with a better understanding of the distribution and
abundance of mangrove landbirds. Substantial downward changes in population size appear to be
underway, at least in the northern part of the mangroves, but whether these changes are cyclical or
reflect the deterministic outcome of ongoing environmental changes is unknown. In either case, some
form of population monitoring is needed both to understand the scope and extent of the problems
facing mangrove landbirds and as a necessary prelude to implementing conservation efforts.
Information gleaned thus far and presented in this report can be used as a first step towards that goal.
Research and management priorities.
Establish and implement a multi-agency strategy to monitor trends in abundance and
distribution of mangrove landbirds.
Determine the extent of bias associated with conducting surveys along trails and creeks, for
example by comparing abundance estimates with estimates generated from points placed at
varying distances from a vegetation edge.
Document habitat associations of mangrove landbirds using individual-based study designs.
Predict climate-change effects on mangrove landbirds using habitat- or niche-based models and
develop mitigation strategies as needed.
Determine whether the use of playbacks to increase detectability of Mangrove Cuckoo changes
detectability of other focal species.
Document natural history (e.g., nesting ecology, seasonal movements, and molt patterns) of
poorly known species, especially Mangrove Cuckoo.

36
TABLES

37
Table 1. Probability of detection ( ; ±S.E.); average number counted per survey (±S.E); estimated average abundance (±S.E), corrected for detectability; estimated average density (no. birds/ha; ±S.E), corrected for detectability; and percent of points present.
Species Average
count
Abundance Density % present
Red-bellied Woodpecker 0.78 (0.03) 1.66 (0.04) 2.13 (0.05) 0.30 (0.010) 96.9
Northern Cardinal 0.80 (0.04) 1.36 (0.05) 1.69 (0.05) 0.23 (0.009) 92.4
Prairie Warbler 0.75 (0.05) 1.12 (0.03) 1.49 (0.06) 0.23 (0.013) 83.2
White-eyed Vireo 0.89 (0.02) 1.05 (0.03) 1.18 (0.03) 0.19 (0.004) 75.1
Red-winged Blackbird 0.83 (0.04) 0.72 (0.04) 0.87 (0.04) 0.11 (0.005) 36.1
Great Crested Flycatcher 0.69 (0.08) 0.54 (0.04) 0.78 (0.05) 0.11 (0.010) 68.6
American Crow 0.67 (0.11) 0.44 (0.03) 0.66 (0.02) 0.05 (0.007) 44.8
Pileated Woodpecker 0.75 (0.05) 0.39 (0.02) 0.52 (0.04) 0.04 (0.003) 56.9
Black-whiskered Vireo 0.66 (0.13) 0.31 (0.03) 0.46 (0.03) 0.07 (0.011) 41.2
White-crowned Pigeon 0.72 (0.10) 0.33 (0.03) 0.46 (0.01) 0.06 (0.006) 21.3
Keys & Florida Bay 1.50 (0.04) 1.89 (0.13) 0.29 (0.041) 83.3
Common Yellowthroat 0.71 (0.12) 0.07 (0.02) 0.10 (0.02) 0.01 (0.002) 13.2
Red-shouldered Hawk 0.76 (0.11) 0.13 (0.01) 0.17 (0.02) 0.01 (0.002) 31.7
Yellow Warbler 0.69 (0.17) 0.10 (0.01) 0.15 (0.01) 0.02 (0.003) 11.2
Keys & Florida Bay 0.59 (0.04) 0.64 (0.08) 0.08 (0.021) 38.8
Mangrove Cuckoo 0.58 (0.14) 0.09 (0.01) 0.15 (0.02) 0.03 (0.005) 24.9
Gray Kingbird 0.73 (0.10) 0.15 (0.02) 0.20 (0.01) 0.03 (0.003) 19.1
Keys & Florida Bay 0.63 (0.05) 0.85 (0.06) 0.15 (0.021) 83.3
Carolina Wren 0.83 (0.08) 0.12 (0.01) 0.14 (0.01) 0.02 (0.001) 27.2
Mourning Dove 0.87 (0.09) 0.10 (0.01) 0.11 (0.01) 0.01 (0.001) 16.0
Keys & Florida Bay 0.31 (0.05) 0.36 (0.03) 0.05 (0.001) 44.6
Common Grackle - 0.06 (0.01) - - 14.0
All landbirds combined1 0.76 (0.02) 8.98 (0.05) 11.81 (0.02) 1.67 (0.036) 1 Includes the 18 species listed in this table, plus the additional 13 mangrove landbirds with too few detections to estimate density.

38
Table 2. Estimated abundance (number of birds in the 150-m radius circle around a survey point) based on distance sampling conducted at points surveyed between 2008 and 2011.
Species Average
abundance
95%
confidence
interval
Probability
of detection
95% confidence
interval
White-eyed Vireo 5.04a 4.76-5.33 0.19 0.18-0.20
Prairie Warbler 3.76a 3.34-4.12 0.27 0.25-0.28
Red-bellied Woodpecker 3.20 2.84-3.20 0.42 0.41-0.44
Northern Cardinal 2.63a 2.49-2.70 0.44 0.42-0.46
White-crowned Pigeon 0.12 0.09-0.15 0.26 0.23-0.29
Keys & Florida Bay 2.06 1.56-2.70
Great Crested Flycatcher 1.35a 1.28-1.49 0.38 0.33-0.43
Black-whiskered Vireo 1.14 0.92-1.35 0.26 0.23-0.30
Gray Kingbird 0.06 0.04-0.08 0.27 0.21-0.35
Keys & Florida Bay 0.99 0.71-1.42
Yellow Warbler 0.04 0.03-0.06 0.33 0.25-0.43
Keys & Florida Bay 0.78a 0.64-0.92
American Crow 0.36 0.28-0.43 0.72 0.57-0.90
Common Yellowthroat 0.36 0.21-0.50 0.20 0.15-0.26
Carolina Wren 0.24 0.14-0.36 0.28 0.20-0.38
Pileated Woodpecker 0.23a 0.21-0.28 0.74 0.68-0.81
Common Grackle 0.23 0.14-0.36 0.19 0.13-0.27
Mourning Dove 0.14 0.07-0.21 0.46 0.34-0.62
Mangrove Cuckoo 0.11 0.07-0.18 0.51 0.35-0.76
a Abundance estimate was generated from a model showing a significant lack of fit to the data.

39
Table 3. Average number of individuals of selected mangrove landbird species (excluding those with <100 detections) detected per point from 2008-2011, excluding points at which the species was never detected. Data were collected in a 150-m radius around 354 points in mangrove vegetation in southern Florida.
Species Average no.
detected per point
95% confidence interval
Red-winged Blackbird 1.94 1.78-2.09
Red-bellied Woodpecker 1.81 1.61-2.01
White-eyed Vireo 1.47 1.37-1.60
Northern Cardinal 1.41 1.33-1.49
Prairie Warbler 1.36 1.25-1.46
Yellow Warbler 1.32 0.97-1.67
White-crowned Pigeon 1.30 1.02-1.55
Great Crested Flycatcher 0.83 0.76-0.90
Black-whiskered Vireo 0.83 0.72-0.93
American Crow 0.82 0.73-0.91
Pileated Woodpecker 0.82 0.76-0.89
Gray Kingbird 0.74 0.61-0.88
Common Yellowthroat 0.67 0.52-0.82
Mourning Dove 0.53 0.41-0.62
Carolina Wren 0.50 0.43-0.56
Common Grackle 0.39 0.27-0.51
Mangrove Cuckoo 0.38 0.33-0.41
Red-shouldered Hawk 0.37 0.33-0.42

40
Table 4. Average number (and 95% confidence intervals) of individuals of mangrove landbirds detected per survey point from 2008-2011 within each of the 5 administrative areas included in the study. Confidence intervals were estimated using a non-parametric bootstrap routine. Areas are organized from northernmost (TTINWR) to southernmost (FKNWR).
Species TTINWRa ENPb BNPc FDEPd FKNWRe
Red-bellied Woodpecker 1.57 (1.31-1.76)
1.97 (1.81-2.11)
0.62 (0.48-0.75)
1.54 (1.18-1.95)
1.38 (1.10-1.68)
Northern Cardinal 1.02 (0.89-1.16)
1.54 (1.40-1.67)
1.02 (0.83-1.21)
1.31 (0.94-1.71)
1.93 (1.64-2.22)
White-eyed Vireo 1.53 (1.39-1.68)
1.24 (1.12-1.37)
0.12 (0.04-0.23)
0.31 (0.30-0.33)
0.08 (0.02-0.15)
Prairie Warbler 1.09 (0.93-1.25)
0.86 (0.75-0.96)
1.12 (0.93-1.34)
2.03 (1.77-2.39)
2.04 (1.71-2.35)
Pileated Woodpecker 0.61 (0.50-0.71)
0.62 (0.53-0.71)
0.04 (0.01-0.09)
0.03 (0-0.08)
0.01 (0-0.03)
Great Crested Flycatcher 0.58 (0.47-0.71)
0.88 (0.78-0.99)
0.04 (0.01-0.08)
0.20 (0.08-0.35)
0.38 (0.22-0.55)
Red-winged Blackbird 0.04 (0.01-0.10)
0.44 (0.31-0.56)
0.83 (0.59-1.08)
2.56 (2.09-3.01)
2.58 (2.14-3.02)
American Crow 0.17 (0.11-0.24)
0.81 (0.71-0.91)
0.03 (0.01-0.06)
0.02 (0-0.05)
0.02 (0-0.06)
Black-whiskered Vireo 0.38 (0.27-0.51)
0.27 (0.21-0.34)
0.11 (0.04-0.19)
0.09 (0.02-0.16)
1.19 (0.96-1.44)
White-crowned Pigeon 0 0.04 (0.02-0.06)
0.38 (0.20-0.57)
1.92 (1.25-2.68)
0.99 (0.71-1.32)
Carolina Wren 0.12 (0.06-0.18)
0.11 (0.08-0.15)
0.02 (0-0.06)
0 0
Mangrove Cuckoo 0.05 (0.02-0.09)
0.06 (0.04-0.08)
0.19 (0.10-0.28)
0.03 (0-0.06)
0.06 (0-0.14)
Gray Kingbird 0 0.05 (0.03-0.08)
0.22 (0.12-0.33)
0.40 (0.22-0.62)
0.51 (0.34-0.72)
Common Yellowthroat 0 0.16 (0.11-0.22)
0.01 (0-0.02)
0.02 (0-0.05)
0.14 (0.05-0.25)
Yellow Warbler 0 0.23 (0.16-0.31)
0 0.02 (0-0.06)
0.32 (0.13-0.55)
Common Grackle 0.07 (0.01-0.16)
0.01 (0-0.03)
0.08 (0.03-0.13)
0.05 (0.01-0.11)
0.26 (0.14-0.42)
Mourning Dove 0.23 (0.13-0.33)
0 0.02 (0-0.04)
0.40 (0.25-0.60)
0.39 (0.26-0.53)
a Ten Thousand Islands National Wildlife Refuge b Everglades National Park c Biscayne National Park d Florida Department of Environmental Protection, specifically John Pennekamp Coral Reef State Park e Great White Heron National Wildlife Refuge and National Key Deer Refuge, collectively the Florida Keys National Wildlife Refuges

41
FIGURES
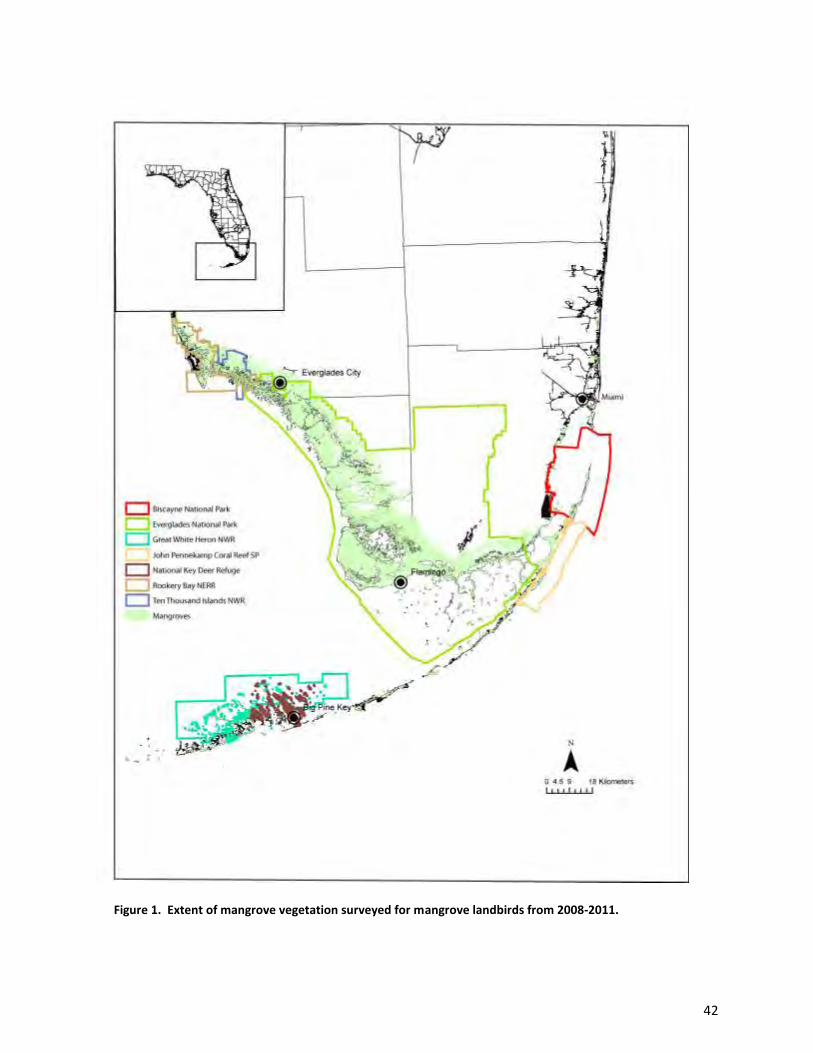
42
Figure 1. Extent of mangrove vegetation surveyed for mangrove landbirds from 2008-2011.

43
Figure 2. Location of points surveyed in Everglades National Park for mangrove landbirds in
2008-2011.

44
Figure 3. Location of points surveyed in Ten Thousand Islands National Wildlife Refuge
(inclusive of Rookery Bay National Estuarine Research Reserve, and including parts of
Collier-Seminole State Park and Fakahatchee Strand Preserve State Park) for mangrove
landbirds in 2008-2011.
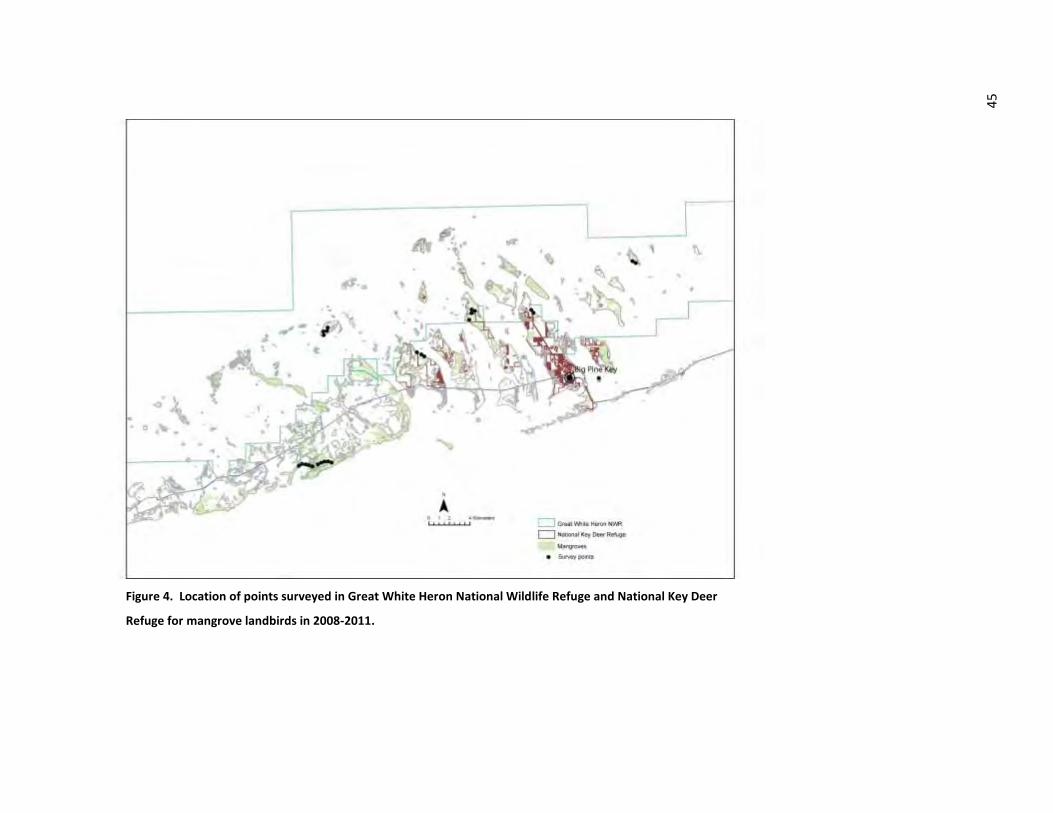
Figure 4. Location of points surveyed in Great White Heron National Wildlife Refuge and National Key Deer
Refuge for mangrove landbirds in 2008-2011.
45

46
Figure 5. Location of points surveyed at Biscayne National Park and John Pennekamp Coral Reef
State Park for mangrove landbirds in 2008-2011.

47
Figure 6. Accumulation of detections as a function of time elapsed during a survey. The dotted line shows the
average accumulation rate of all species; the solid black lines are 95% confidence limits. The solid gray line
shows the accumulation rate for Mangrove Cuckoo.
0
0.1
0.2
0.3
0.4
0.5
0.6
0.7
0.8
0.9
1
1 2 3 4 5 6 7 8 9 10
Pro
prt
ion
of
det
ect
ion
s
Survey interval

48
Figure 7. Surveys points where at least one Red-bellied Woodpeckers was detected (blue circles) and
survey points at which no detections were recorded (red triangles) during 10-minute point-count surveys
conducted from 2008-2011. Green shading is extent of mangroves.
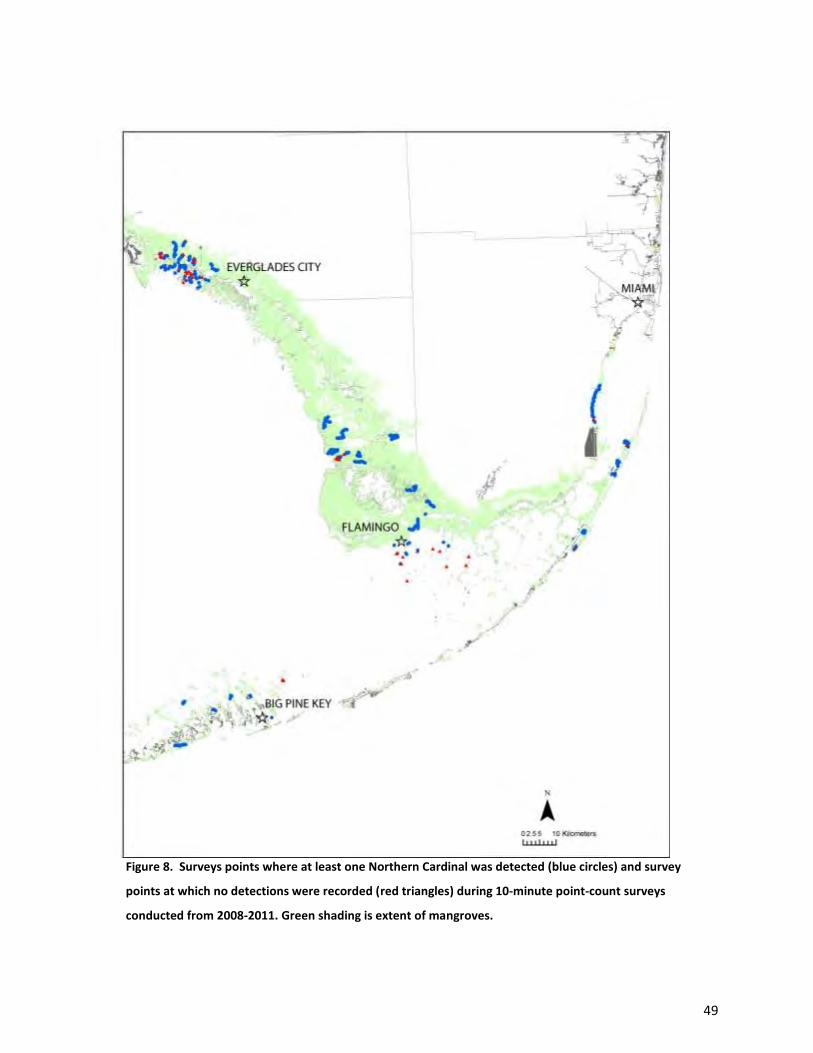
49
Figure 8. Surveys points where at least one Northern Cardinal was detected (blue circles) and survey
points at which no detections were recorded (red triangles) during 10-minute point-count surveys
conducted from 2008-2011. Green shading is extent of mangroves.

50
Figure 9. Surveys points where at least one Prairie Warbler was detected (blue circles) and survey points at
which no detections were recorded (red triangles) during 10-minute point-count surveys conducted from
2008-2011. Green shading is extent of mangroves.

51
Figure 10. Surveys points where at least one Black-whiskered Vireo was detected (blue circles) and survey
points where none were recorded (red triangles) during 10-minute point-count surveys conducted from
2008-2011. Green shading is extent of mangroves.

52
Figure 11. Surveys points where at least one Great Crested Flycatcher was detected (blue circles) and
survey points where none were recorded (red triangles) during 10-minute point-count surveys
conducted from 2008-2011. Green shading is extent of mangroves.

53
Figure 12. Surveys points where at least one Mangrove Cuckoo was detected (blue circles) and survey
points at which no detections were recorded (red circles) during 10-minute point-count surveys conducted
from 2008-2011. Green shading is extent of mangroves.

54
Figure 13. Surveys points where at least one Red-winged Blackbird was detected (blue circles) and survey
points at which no detections were recorded (red triangles) during 10-minute point-count surveys
conducted from 2008-2011. Green shading is extent of mangroves.

55
Figure 14. Surveys points where at least one White-crowned Pigeon was detected (blue circles) and survey
points where none were recorded (red triangles) during 10-minute point-count surveys conducted from
2008-2011. Green shading is extent of mangroves.

56
Figure 15. Surveys points where at least one Gray Kingbird was detected (blue circles) and survey points at
which no detections were recorded (red triangles) during 10-minute point-count surveys conducted from
2008-2011. Green shading is extent of mangroves.

57
Figure 16. Surveys points where at least one Yellow Warbler was detected (blue circles) and survey points
at which no detections were recorded (red triangles) during 10-minute point-count surveys conducted
from 2008-2011. Green shading is extent of mangroves.

58
Figure 17. Surveys points where at least one Common Yellowthroat was detected (blue circles) and survey
points where none were recorded (red triangles) during 10-minute point-count surveys conducted from
2008-2011. Green shading is extent of mangroves.

59
Figure 18. Surveys points where at least one Common Grackle was detected (blue circles) and survey points
at which no detections were recorded (red triangles) during 10-minute point-count surveys conducted from
2008-2011. Green shading is extent of mangroves.

60
Figure 19. Surveys points where at least one White-eyed Vireo was detected (blue circles) and survey points
at which no detections were recorded (red triangles) during 10-minute point-count surveys conducted from
2008-2011. Green shading is extent of mangroves.
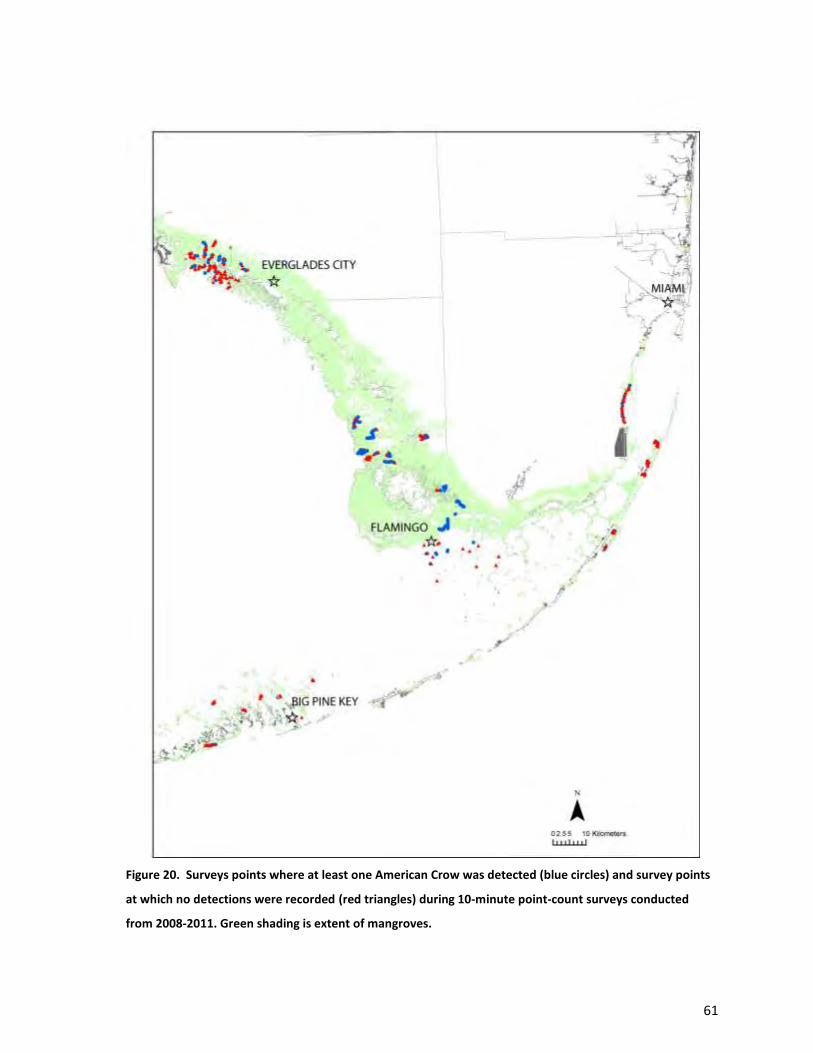
61
Figure 20. Surveys points where at least one American Crow was detected (blue circles) and survey points
at which no detections were recorded (red triangles) during 10-minute point-count surveys conducted
from 2008-2011. Green shading is extent of mangroves.

62
Figure 21. Surveys points where at least one Carolina Wren was detected (blue circles) and survey points
at which no detections were recorded (red triangles) during 10-minute point-count surveys conducted
from 2008-2011. Green shading is extent of mangroves.

63
Figure 22. Surveys points where at least one Pileated Woodpecker was detected (blue circles) and survey
points at which no detections were recorded (red triangles) during 10-minute point-count surveys
conducted from 2008-2010. Green shading is extent of mangroves.

64
Figure 23. Surveys points where at least one Mourning Dove was detected (blue circles) and survey points
at which no detections were recorded (red triangles) during 10-minute point-count surveys conducted
from 2008-2011. Green shading is extent of mangroves.

65
Figure 24. Vegetation features that were significantly related to variation in the number of White-crowned
Pigeons counted at points in the mangroves of south Florida during 2008-2011. Solid lines are the mean
response; dotted lines are 95% confidence limits.
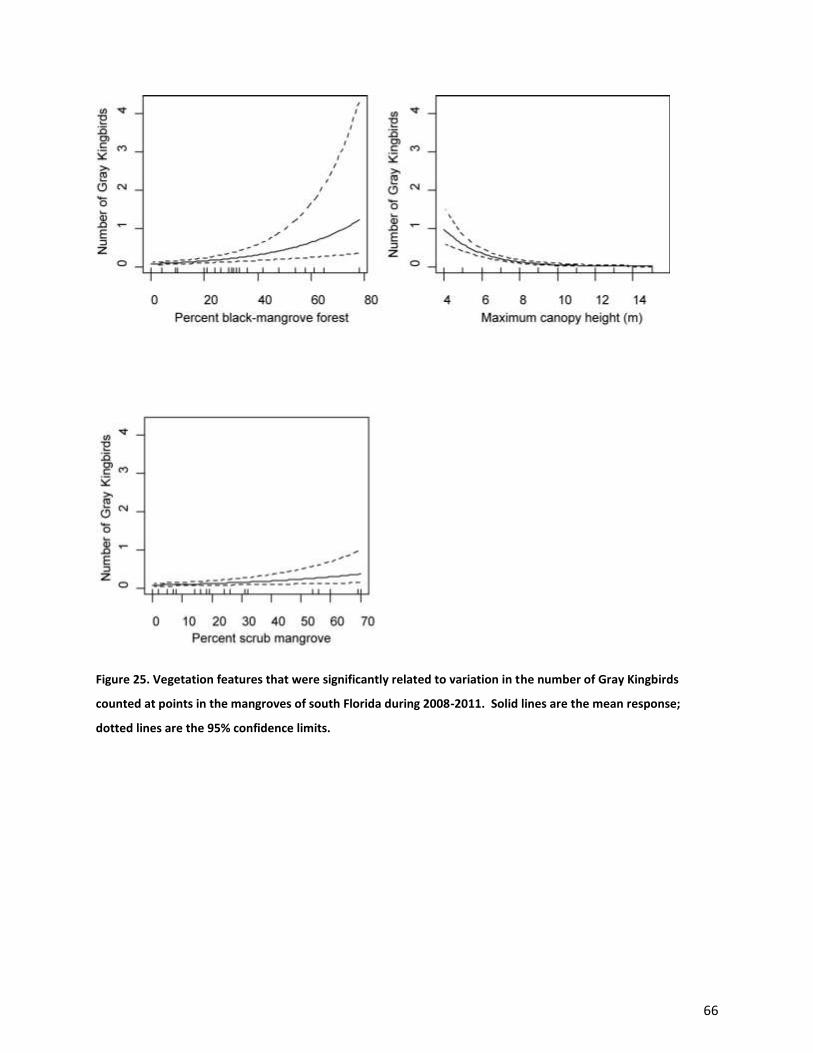
66
Figure 25. Vegetation features that were significantly related to variation in the number of Gray Kingbirds
counted at points in the mangroves of south Florida during 2008-2011. Solid lines are the mean response;
dotted lines are the 95% confidence limits.

67
Figure 26. Vegetation features that were significantly related to variation in the number of Black-whiskered
Vireos counted at points in the mangroves of south Florida during 2008-2011. Solid lines are the mean
response; dotted lines are the 95% confidence limits.

68
Figure 27. Vegetation features that were significantly related to variation in the number of Yellow Warblers
counted at points in the mangroves of south Florida during 2008-2011. Solid line is the mean response; dotted
lines are the 95% confidence limits.

69
Figure 28. Vegetation features that were significantly related to variation in the number of Prairie Warblers
counted at points in the mangroves of south Florida during 2008-2011. Solid lines show the mean response;
dotted lines are the 95% confidence limits.

70
Figure 29. Vegetation features that were significantly related to variation in the number of White-crowned
Pigeons counted at points in the mangroves of Florida Bay and the Florida Keys during 2008-2011. Solid lines
show the mean response; dotted lines are 95% confidence limits.

71
Figure 30. Statistical power to detect a 50% decline in abundance over a 20-year period as a function of
sampling frequency (every year, every other year, or every 5 years) and the number of survey points sampled
per survey event.
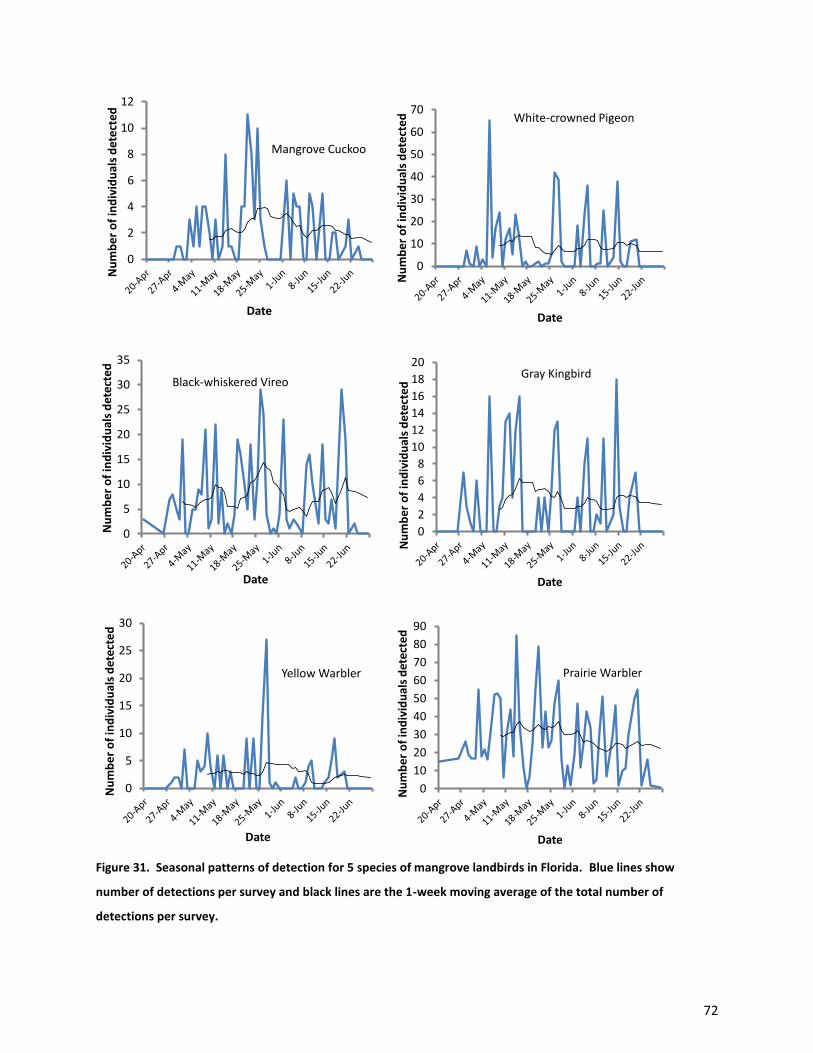
72
Figure 31. Seasonal patterns of detection for 5 species of mangrove landbirds in Florida. Blue lines show
number of detections per survey and black lines are the 1-week moving average of the total number of
detections per survey.
0
10
20
30
40
50
60
70
Nu
mb
er o
f in
div
idu
als
det
ecte
d
Date
White-crowned Pigeon
0
2
4
6
8
10
12
14
16
18
20
Nu
mb
er o
f in
div
idu
als
det
ecte
d
Date
Gray Kingbird
0
5
10
15
20
25
30
35
Nu
mb
er o
f in
div
idu
als
det
ecte
d
Date
Black-whiskered Vireo
0
5
10
15
20
25
30
Nu
mb
er
of
ind
ivid
ual
s d
etec
ted
Date
Yellow Warbler
0
10
20
30
40
50
60
70
80
90
Nu
mb
er o
f in
div
idu
als
det
ecte
d
Date
Prairie Warbler
0
2
4
6
8
10
12N
um
be
r o
f in
div
idu
als
det
ecte
d
Date
Mangrove Cuckoo

73
LITERATURE CITED
ALDRICH, J. W., and A. J. DUVALL. 1958. Distribution and migration of races of the Mourning Dove. Condor 60: 108-128.
AMERICAN ORNITHOLOGISTS' UNION [AOU]. 1983. Check-list of North American Birds. American Ornithologists' Union, Washington, D. C.
BANCROFT, G. T., A. M. STRONG, AND M. CARRINGTON. 1995. Deforestation and its effects on forest-nesting birds in the Florida Keys. Conservation Biology 9:835-844.
BARRANTES, G. 1998. Reproductive activity of birds in a mangrove swamp in Northwest Costa Rica. Revista de Biologia Tropical 46:1163-1166.
BART, J., K. P BURNHAM, E. H. DUNN, C. M. FRANCIS, AND C. J. RALPH. 2004. Goals and strategies for estimating trends in landbird abundance. Journal of Wildlife Management 68:611-626.
BETTS, M. G., D. MITCHELL, A. W. DIAMOND, AND J. BETY. 2007. Uneven rates of landscape change as a source of bias in roadside wildlife surveys. Journal of Wildlife Management 71:2266-2273.
BOND, J. 1930. The resident West Indian warblers of the genus Dendroica. Proceedings of the Academy of Natural Sciences of Philadelphia 82: 329-337.
BUCKLAND, S. T., D. R. ANDERSON, K. P. BURNHAM, J. L. LAAKE, D. L. BORCHERS, AND L. THOMAS. 2001. Introduction to distance sampling. Oxford University Press, Oxford, UK.
BUERKLE, C. 1999. The historical pattern of gene flow among migratory and nonmigratory populations of prairie warblers (Aves: Parulinae). Evolution 53: 1915-1924.
BUERKLE, C. A. 2000. Morphological variation among migratory and non-migratory populations of Prairie Warblers. The Wilson Bulletin 112:99–107.
BURNHAM, K. P., and D. R. ANDERSON. 2002. Model selection and multimodel inference: a practical information-theoretic approach Springer Science+Business Media, Inc., New York.
BUTCHER, G. S., B. PETERJOHN, AND C. J. RALPH. 1993. Overview of national bird population monitoring programs and databases. Pages 192-203 in D. M. Finch and P. W. Stangel, eds. Status and management of neotropical migratory birds. U. S. Department of Agriculture, U. S. Forest Service, Rocky Mountain Research Station, Ft Collins, Colorado.
COX, J. 2006. Trends in breeding distributions based on Florida's Breeding Bird Altas Project. Pages 71-140 in R.F. Noss, ed. The breeding birds of Florida. Florida Ornithological Society, Gainesville, Fl.
DIAMOND, A. W. 1980. Ecology and species turnover of the birds of Little Cayman. Atoll Research Bulletin 241:141-164.
EFFORD, M. G., and D. K. DAWSON. 2009. Effect of distance-related heterogeneity on population size estimates from point counts. Auk 126: 100-111.
FARNSWORTH, G. L., K. H. POLLOCK, J. D. NICHOLS, T. R. SIMONS, J. E. HINES, and J. R. SAUER. 2002. A removal model for estimating detection probabilities from point-count surveys. The Auk 119: 414-425.
GRANT, T. A., E. M. MADDEN, T. L. SHAFFER, and J. S. DOCKENS. 2010. Effects of prescribed fire on vegetation and passerine birds in Northern mixed grass prairie. Journal of Wildlife Management 74: 1841-1851.
GREENE, E. R. 1942. Golden warbler nesting in lower Florida Keys. Auk 59:114-114. HOWELL, A. H. 1930. Description of a new subspecies of the Prairie Warbler, with remarks on two other
unrecognized Florida races. Auk 47: 41-43. HUGHES, J. M. [online]. 1997. Mangrove Cuckoo (Coccyzus minor).
<http://bna.birds.cornell.edu.bnaproxy.birds.cornell.edu/bna/species/299> (2 November 2010). JOHNSON, D. 2008. In defense of indices: the case of bird surveys. Journal of Wildlife Management 72:
857-868. LLOYD, J. D., and G. L. Slater. 2011. Influence of fire and water regimes on pineland bird assemblages.
Natural Areas Journal 31:270-282.

74
LLOYD, J. D., and T. DOYLE. 2011. Abundance and population trends of mangrove landbirds in southwest Florida. Journal of Field Ornithology 82:132-139.
LUGO, A. E., and S. C. SNEDAKER. 1974. The ecology of mangroves. Annual review of ecology and systematics 5: 39-64.
MARQUES, T. A., L. THOMAS, S. G. FANCY, and S. T. BUCKLAND. 2007. Improving estimates of bird density using multiple-covariate distance sampling. Auk 124: 1229-1243.
NICHOLS, J. D., J. E. HINES, J. R. SAUER, F. W. FALLON, J. E. FALLON, AND P. J. HEGLUND. 2000. A double-observer approach for estimating detection probability and abundance from point counts. Auk 117:393-408.
ODUM, W. E., C. C. MCIVOR, and T. J. SMITH III. 1982. The ecology of the mangroves of south Florida: a community profile. U.S. Fish and Wildlife Service, Office of Biological Services, Washington, D. C.
PRATHER, J. W., AND A. CRUZ. 1995. Breeding biology of Florida Prairie Warblers and Cuban Yellow Warblers. Wilson Bulletin 107:475-484.
R DEVELOPMENT CORE TEAM. 2010. R: A language and environment for statistical computing. Available at: http://www.R-project.org.
RICH, T. D., C. J. BEARDMORE, H. BERLANGA, P. J. BLANCHER, M. S. W. BRADSTREET, G. S. BUTCHER, D. W. DEMAREST, E. H. DUNN, W. C. HUNTER, E. E. IÑIGO-ELIAS, J. A. KENNEDY, J. A. KENNEDY, A. M. MARTELL, A. O. PANJABI, D. N. PASHLEY, K. V. ROSENBERG, C. M. RUSTAY, J. S. WENDT, and T. C. WILL. 2004. Partners in Flight North American Landbird Conservation Plan Cornell Lab of Ornithology, Ithaca, New York.
ROBERTSON, W. B., JR., AND J. A. KUSHLAN. 1974. The southern Florida avifauna. Miami Geological Society, Miami, Fl.
ROBERSTON, W.B., JR., AND G. E. WOOLFENDEN. 1992. Florida bird species: an annotated list. Florida Ornithological Society, Gainesville, Fl.
SIMARD, M., K. ZHANG, V. H. RIVERA-MONROY, M. S. ROSS, P. L. RUIZ, E. CASTANEDA-MOYA, R. R. TWILLEY, and E. RODRIGUEZ. 2006. Mapping height and biomass of mangrove forests in everglades national park with SRTM elevation data. Photogrammetric engineering and remote sensing 72: 299-311.
SNEDAKER, S. C. 1989. Overview of ecology of mangroves and information needs for Florida Bay. Bulletin of Marine Science 44: 341-347.
STEVENS, D. L., and A. R. OLSEN. 2004. Spatially balanced sampled of natural resources. Journal of the American Statistical Association 99: 262-278.
STEVENSON, H. M., AND B. H. ANDERSON. 1994. The birdlife of Florida. University Press of Florida, Gainesville, Fl.
THOMAS, L., S. T. BUCKLAND, E. A. REXSTAD, J. L. LAAKE, S. STRINDBERG, S. L. HEDLEY, J. R. B. BISHOP, T. A. MARQUES, and K. P. BURNHAM. 2010. Distance software: design and analysis of distance sampling surveys for estimating population size. Journal of Applied Ecology 47: 5-14.
WOOD, S.N. 2003. Thin-plate regression splines. Journal of the Royal Statistical Society (B) 65(1):95-114. WOOLFENDEN, G. E. , AND W. B. ROBERTSON, JR. 2006. Sources and post-settlement changes. Pages 5-70 in
R.F. Noss, ed. The breeding birds of Florida. Florida Ornithological Society, Gainesville, Fl. U. S. FISH AND WILDLIFE SERVICE [USFWS]. 2008. Birds of conservation concern 2008 United States
Department of Interior, Fish and Wildlife Service, Division of Migratory Bird Management, Arlington, VA.
U.S. FISH AND WILDLIFE SERVICE [USFWS]. 1999. South Florida multi-species recovery plan U.S Department of Interior, Fish and Wildlife Service, Atlanta, Georgia.

75
Appendix A. Total number of individuals counted, by species.
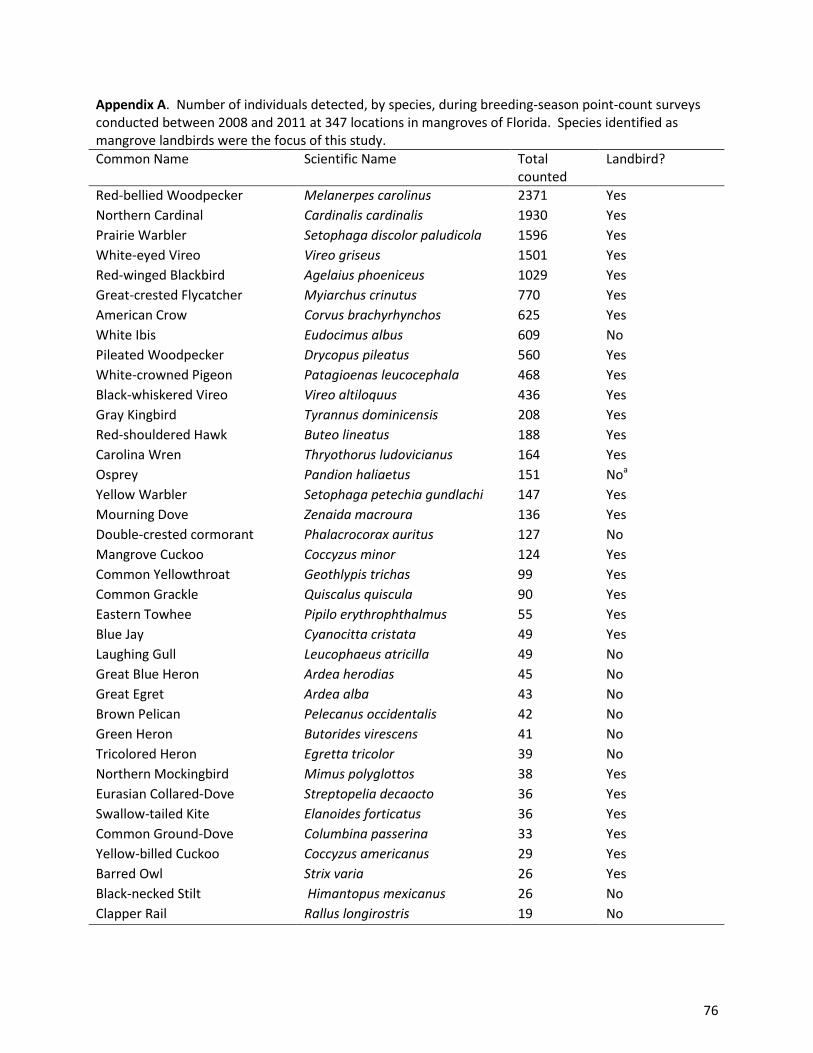
76
Appendix A. Number of individuals detected, by species, during breeding-season point-count surveys conducted between 2008 and 2011 at 347 locations in mangroves of Florida. Species identified as mangrove landbirds were the focus of this study.
Common Name Scientific Name Total counted
Landbird?
Red-bellied Woodpecker Melanerpes carolinus 2371 Yes
Northern Cardinal Cardinalis cardinalis 1930 Yes
Prairie Warbler Setophaga discolor paludicola 1596 Yes
White-eyed Vireo Vireo griseus 1501 Yes
Red-winged Blackbird Agelaius phoeniceus 1029 Yes
Great-crested Flycatcher Myiarchus crinutus 770 Yes
American Crow Corvus brachyrhynchos 625 Yes
White Ibis Eudocimus albus 609 No
Pileated Woodpecker Drycopus pileatus 560 Yes
White-crowned Pigeon Patagioenas leucocephala 468 Yes
Black-whiskered Vireo Vireo altiloquus 436 Yes
Gray Kingbird Tyrannus dominicensis 208 Yes
Red-shouldered Hawk Buteo lineatus 188 Yes
Carolina Wren Thryothorus ludovicianus 164 Yes
Osprey Pandion haliaetus 151 Noa
Yellow Warbler Setophaga petechia gundlachi 147 Yes
Mourning Dove Zenaida macroura 136 Yes
Double-crested cormorant Phalacrocorax auritus 127 No
Mangrove Cuckoo Coccyzus minor 124 Yes
Common Yellowthroat Geothlypis trichas 99 Yes
Common Grackle Quiscalus quiscula 90 Yes
Eastern Towhee Pipilo erythrophthalmus 55 Yes
Blue Jay Cyanocitta cristata 49 Yes
Laughing Gull Leucophaeus atricilla 49 No
Great Blue Heron Ardea herodias 45 No
Great Egret Ardea alba 43 No
Brown Pelican Pelecanus occidentalis 42 No
Green Heron Butorides virescens 41 No
Tricolored Heron Egretta tricolor 39 No
Northern Mockingbird Mimus polyglottos 38 Yes
Eurasian Collared-Dove Streptopelia decaocto 36 Yes
Swallow-tailed Kite Elanoides forticatus 36 Yes
Common Ground-Dove Columbina passerina 33 Yes
Yellow-billed Cuckoo Coccyzus americanus 29 Yes
Barred Owl Strix varia 26 Yes
Black-necked Stilt Himantopus mexicanus 26 No
Clapper Rail Rallus longirostris 19 No

77
Appendix A. Continued.
Common Name Scientific Name Total counted
Mangrove landbird?
Turkey Vulture Cathartes aura 18 No
Brown-headed Cowbird Molothrus ater 15 Yes
American Redstart Setophaga ruticilla 14 Nob
Gray Catbird Dumetella carolinensis 14 Nob
Northern Flicker Colaptes auratus 12 Yes
Little Blue Heron Egretta caerulea 11 No
Snowy Egret Egretta thula 10 No
Downy Woodpecker Picoides pubescens 7 Yes
Roseate Spoonbill Platalea ajaja 7 No
Fish Crow Corvus ossifragus 6 Yes
Greater Yellowlegs Tringa melanoleuca 5 No
Spotted Sandpiper Actitis macularius 5 No
Yellow-crowned Night-Heron Nyctanassa violacea 5 No
Bald Eagle Haliaeetus leucocephalus 4 Noa
Black-and-white Warbler Mniotilta varia 4 Nob
Common Nighthawk Chordeiles minor 4 Noc
Anhinga Anhinga anhinga 3 No
Great White Heron Ardea herodias occidentalis 3 No
Killdeer Charadrius vociferous 3 No
Magnificent Frigatebird Fregata magnificens 3 No
Purple Martin Progne subis 3 No
Royal Tern Thalasseus maximus 3 No
Wilson's Plover Charadrius wilsonia 3 No
American Coot Fulica americana 2 No
Black-bellied Plover Pluvialis squatarola 2 No
Black-crowned Night-heron Nycticorax nycticorax 2 No
Indigo Bunting Passerina cyanea 2 Nob
Northern Waterthrush Seiurus noveboracensis 2 Nob
Ring-billed Gull Larus delawarensis 2 No
Reddish Egret Egretta rufescens 2 No
Barn Swallow Hirundo rustica 1 Nob
Belted Kingfisher Megaceryle alcyon 1 Nob
Black Vulture Coragyps atratus 1 No
Boat-tailed Grackle Quiscalus major 1 Yes
Least Tern Sterna antillarum 1 No
Northern Bobwhite Colinus virginianus 1 Noc
Northern Parula Parula americana 1 Nob
Red-tailed Hawk Buteo jamaicensis 1 Nob
Worm-eating Warbler Helmitheros vermivorus 1 Nob

78
Appendix A. Continued.
Common Name Scientific Name Total counted
Mangrove landbird?
Willet Tringa semipalmata 1 No
American White Pelican Pelecanus erythrorhynchos 1 No
European Starling Sturnus vulgaris 1 No
Wood Stork Mycteria americana 1 No a These raptors were not included in analyses because most individuals were detected flying over survey points,
and so cannot be clearly associated with any particular survey location, and because their wide-ranging nature raises the risk of counting the same individual multiple times at different survey locations. b These landbirds were not included in analyses because they use the mangroves only during the winter or as a
stopover site during northward migration. c These resident landbirds were not included in analyses because their use of the mangroves is likely incidental,
based on habitat requirements (e.g., ground-nesting Common Nighthawks and Northern Bobwhite are unlikely to be residents in the mangroves).

79
Appendix B. Representative photographs of the study area.

80
Photograph 1. Tall, closed-canopy red-mangrove (Rhizophora mangle) forest on Pumpkin Key in the Ten
Thousand Islands region of southwest Florida. Trees in the foreground are approximately 6 m in height; the
taller trees in the background are approximately 15 m in height.

81
Photograph 2. A black-mangrove (Avicennia germinans) dominated shrubland on Lower Sugarloaf Key, Florida.
Canopy height is approximately 2 m.
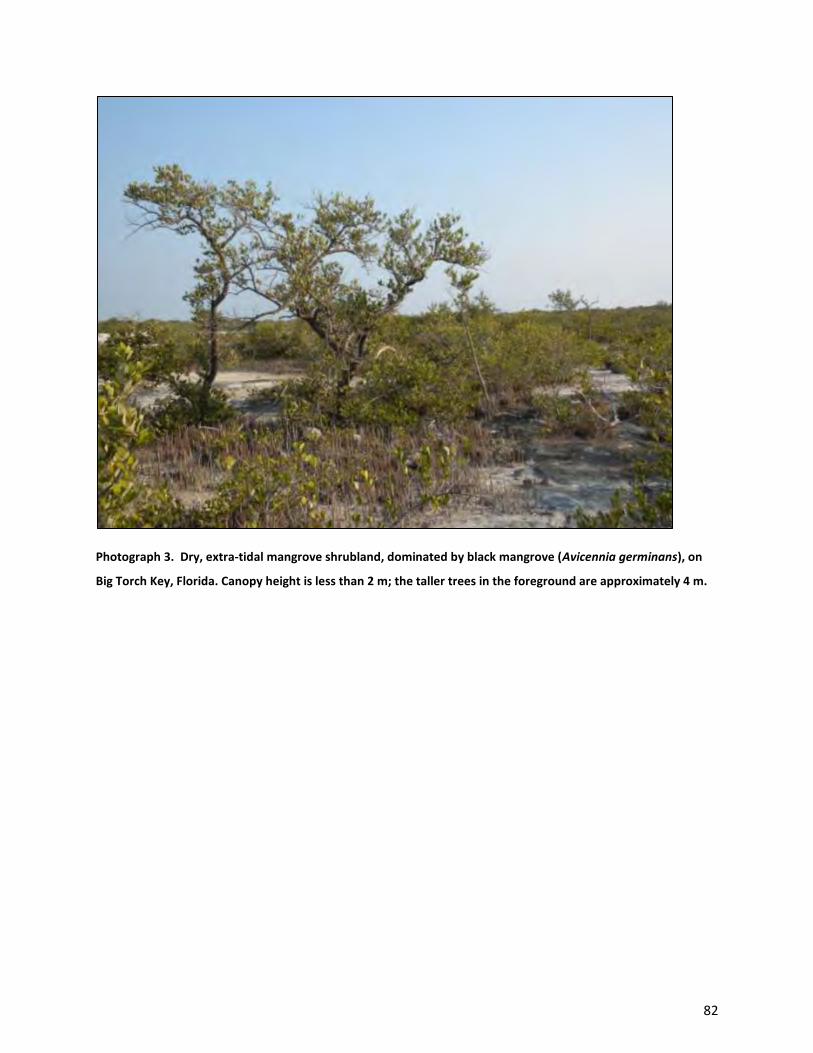
82
Photograph 3. Dry, extra-tidal mangrove shrubland, dominated by black mangrove (Avicennia germinans), on
Big Torch Key, Florida. Canopy height is less than 2 m; the taller trees in the foreground are approximately 4 m.

83
Photograph 4. The ecotone between freshwater marsh and mangrove forest in the Canepatch area of
Everglades National Park, Florida.
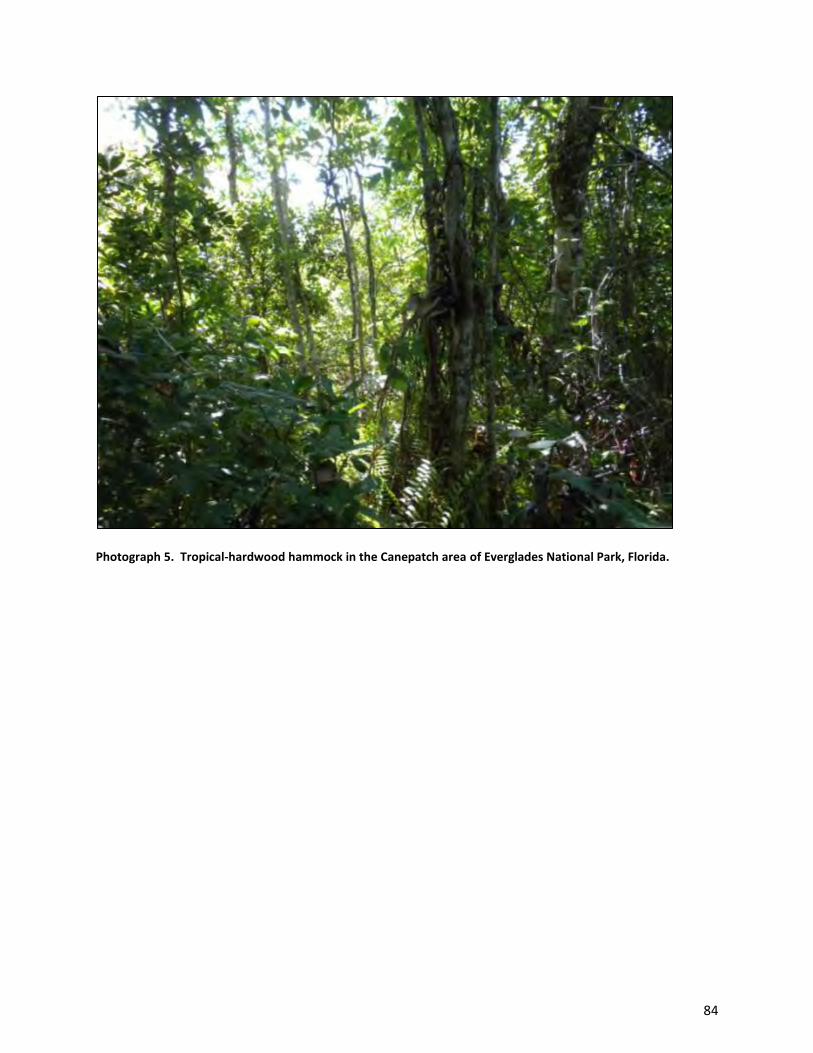
84
Photograph 5. Tropical-hardwood hammock in the Canepatch area of Everglades National Park, Florida.

85
Photograph 6. A large canopy gap in a tall, mixed-mangrove forest along Broad River, Everglades National Park,
Florida.

86
Photograph 7. Open-canopied, black-mangrove woodland next to the Snake Bight trail in Everglades National
Park, Florida. These forests are not subject to daily tidal inundation and the understory is primarily Batis
maritima.
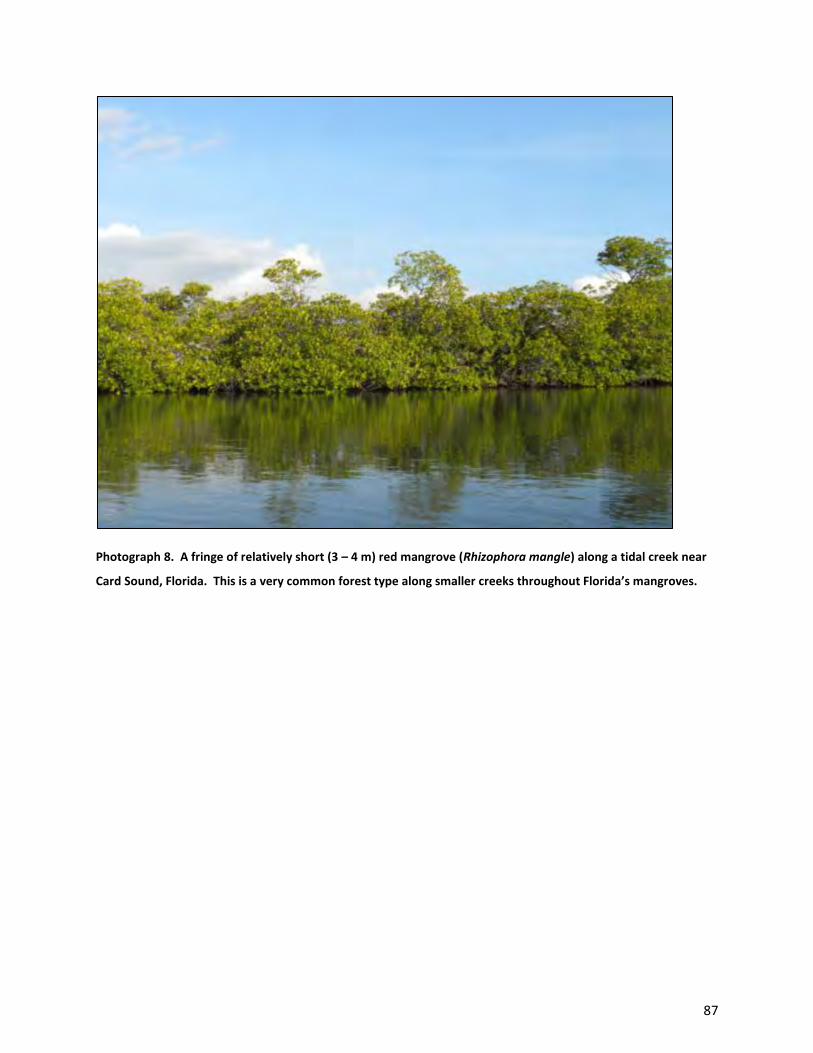
87
Photograph 8. A fringe of relatively short (3 – 4 m) red mangrove (Rhizophora mangle) along a tidal creek near
Card Sound, Florida. This is a very common forest type along smaller creeks throughout Florida’s mangroves.

88
Photograph 9. Short red-mangrove (Rhizophora mangle) forest at Hell’s Bay, with paurotis palm (Acoelorrhaphe
wrightii) rising in the background.
89
Appendix C. Species accounts.
Red-shouldered Hawk. Red-shouldered Hawks were detected throughout the mangroves, including on
the small islands of Florida Bay, although we detected them only rarely in the Keys (two detections of
lone individuals in the lower Keys, and a handful on Key Largo). They showed little evidence of a
preference for one mangrove type over another.
White-crowned Pigeon. In Florida, White-crowned Pigeons breed primarily on the small mangrove
islands of Florida Bay, less often on the mainline Florida Keys, and forage and roost in hardwood forests
on the lower peninsula and mainline Keys. To avoid disturbing nesting individuals, we eliminated any
survey points that fell on islands with known nesting colonies, and so many of the birds detected during
our surveys were likely found while foraging or roosting. Indeed, we found White-crowned Pigeons at
highest densities in the lower Keys and on upper Key Largo, both of which have areas of upland
hardwood forest. We found them at lower densities in John Pennekamp Coral Reef State Park, on the
mangrove islands of Florida Bay, and along the south coast of the peninsula along the Snake Bight and
Rowdy Bend trails in Everglades National Park. Birds detected along the south coast of the peninsula
were likely using the hardwoods that occur along Snake Bight and, to a lesser extent, Rowdy Bend.
Individual birds were detected at inland sites in Everglades National Park at West Lake and in Hell’s Bay.
One notable record occurred far inland at the Canepatch area of Everglades National Park, which falls at
the ecotone between mangrove and freshwater marsh but which also supports relatively large patches
of hardwood hammock. Stevenson and Anderson (1994) suggested that a breeding population may
once have occurred in the Ten Thousand Islands region, but we recorded no detections at any of the 108
points that we surveyed in that region (Terry Doyle also failed to record any detections of White-
crowned Pigeons when surveying these same points from 1999-2008).
Eurasian Collared-Dove. Eurasian Collared-Dove is a recent arrival to Florida, colonizing the state in the
late 1970s or early 1980s from populations established earlier in the Bahamas (Woolfenden and
Robertson 2006). This species appears to use mangroves incidentally and was detected only in
mangroves adjacent to developed areas. Individuals were detected at two points in the narrow fringe of
mangroves along Biscayne Bay in Biscayne National Park, at two points on Big Pine Key, at one point on
Big Torch Key, at two points in the Card Sound area, and at two points in John Pennekamp Coral Reef
State Park. Given its habitat of foraging for seeds on the ground, this species is unlikely to be found in
mangroves except along edges or in dry, extra-tidal forests.

90
Mourning Dove. Two subspecies of Mourning Dove occur within the study area: Zenaida macroura
carolinensis, the widespread form of the eastern United States, and Z. m. macroura, a West Indian form
with a North American distribution apparently limited to the Florida Keys (Aldrich and Duvall 1958).
Stevenson and Anderson (1994) reported that this species was rare or absent in the Keys until the 1940s
or 1950s, but that more recently it had increased in numbers throughout the Keys. Our findings
corroborate this suggestion: Mourning Doves reached their greatest abundance in the Keys, with both
density and the frequency of occurrence declining to the north. We found a large gap in the distribution
of this species, beginning on the islands of Florida Bay and continuing into most of Biscayne National
Park and Everglades National Park, including the southwest coast. In the Ten Thousand Islands region,
Mourning Doves were again found in relatively high densities.
We found Mourning Doves at points surrounded by extensive mangrove forest, unlike Eurasian-
Collared Doves, which were found primarily at points adjacent to uplands or developed areas. For
example, this species was detected regularly in the Ten Thousand Islands region, which is largely
undeveloped and supports large stands of mangrove forest. However, Mourning Doves in this region
avoided most of the offshore keys, instead using mangrove forests further inland along the tidal rivers
that drain into the various inland bays. Thus, individuals may be using the mangroves for nesting but
travelling farther afield to find open, dry areas suitable for foraging. A similar segregation of nesting and
foraging habitat might explain the use of mangrove forests in the Keys, where most patches of
mangroves were within a relatively short distance of areas more suitable for a ground-foraging bird. As
a caveat, we have no direct evidence that Mourning Doves nest in mangroves.
The split distribution that we observed –higher densities in the south and north of the study
area, but absent from the middle – might also reflect the current distribution of the two subspecies that
occur in Florida. Without body-size measurements, we are unable to determine whether the individuals
in the Keys and the Ten Thousand Islands region represent macroura and carolinensis, respectively, but
data in Aldrich and Duvall (1958) and Stevenson and Anderson (1994) would suggest that this is the
case. If the Keys population is composed of individuals of macroura, then the high densities of
individuals in that region may reflect a growing population of this recent colonist. The absence of
individuals on apparently suitable islands in Florida Bay and along the extra-tidal buttonwood and black-
mangrove forests of the south coast of the Peninsula may then reflect a temporary gap as the Keys
population gradually extends its range northward. To the north, the population in the Ten Thousand

91
Islands region may be composed of individuals of carolinensis, perhaps less suited to the increasingly
tropical (and perhaps arid) conditions further south.
Common Ground-Dove. Neither Stevenson and Anderson (1994) nor Robertson and Kushlan (1974)
identify mangroves as habitat for this species, although Common Ground-Doves nest in mangroves in
other parts of their range (e.g., Costa Rica, Barrantes [1998]; but not in mangroves on Little Cayman,
Diamond [1980]). In Florida, Common Ground-Doves are a permanent resident throughout the state.
We found them scattered throughout every region of our study area, from Lower Sugarloaf Key, through
the islands of Florida Bay, along the southwest coast, and into the Ten Thousand Islands. Individuals
were always detected as pairs or lone individuals, and at only two points – one in the fringing forests of
Biscayne Bay and one on Lower Sugarloaf Key – did we detect individuals in more than one year. The
lack of consistent detections at any survey point complicates interpretation of our data, as does the
extended breeding season of this species (Stevenson and Anderson 1994). Were the individuals that we
detected breeding at the survey location, or simply wandering individuals using the mangroves in a
transient fashion?
Yellow-billed Cuckoo. Yellow-billed Cuckoos breed throughout Florida, including in forest edges in the
Keys (Stevenson and Anderson 1994). We recorded no detections of this species until 2011, when we
detected 29 individuals at 19 different survey points, clustered in the Keys and the southwest coast of
Everglades National Park. Detections were noted only in late May and June of 2011. Given the
apparently extended migration period of this species (Stevenson and Anderson 1994), coupled with the
lack of any previous records during our surveys, we suspect that all of the detections of Yellow-billed
Cuckoos reflected late, northward migrants.
Mangrove Cuckoo. Robertson and Woolfenden (1992) and Stevenson and Anderson (1994) both argued
that the species was a permanent resident based on increasing numbers of winter sightings beginning
in the mid-1950s. Robertson and Kushlan (1974), Robertson and Woolfenden (1992), and Woolfenden
at al. (2006) further suggested that this species had expanded its range in recent years, especially into
interior locations of the southern peninsula.
We detected Mangrove Cuckoos throughout the study area, with the exception of the islands of
Florida Bay, the dry buttonwood forests of the south coast of the peninsula, and the interior mangrove
shrublands of Everglades National Park (e.g., Hell’s Bay). This species was never detected in great

92
numbers, with the highest densities occurring in the Ten Thousand Islands region and on the northern
end of Key Largo near Card Sound. We found intermediate densities of Mangrove Cuckoos in the lower
Keys; in the tall, riverine forests along the southwest coast; and along the edge of Biscayne Bay.
Biscayne Bay appears to support a relatively robust population; although densities were not especially
high, 19 of the 25 points surveyed in those forests supported at least one Mangrove Cuckoo during the
course of our surveys. Outside of the Ten Thousand Islands region, the only other locations with
consistent detections of Mangrove Cuckoos were along Broad River (detections at 7 of 11 survey points)
and Harney River (6 of 15 survey points yielded Mangrove Cuckoos).
Red-bellied Woodpecker. Red-bellied Woodpeckers are a year-round resident throughout the state of
Florida (Stevenson and Anderson 1994). Red-bellied Woodpeckers were abundant and ubiquitous
during the course of our study and were found in every type of mangrove forest that we surveyed. The
only apparent limiting factor for this species is the availability of trees large enough to support a nest
cavity.
Downy Woodpecker. Downy Woodpeckers are locally common in interior forests of Florida, but have
not been reported from mangroves. This species either maintains a small, isolated breeding population
in the mangroves of the southwest coast of the peninsula, or is an incidental visitor in this same region.
We detected a total of 7 individuals (one pair and 5 singletons) at 6 points, one of which was along
Wood River, just south of the junction of Wood River and Broad River, and the remaining 6 of which
were in the Devil’s Fingers area of Everglades National Park. Two of the detections came in 2009, and
the other 5 were recorded in 2011. Interestingly, Tufted Titmice, which commonly co-occur with Downy
Woodpeckers in the inland forests of southern Florida (e.g., Lloyd and Slater 2011), were once reported
to occur along Wood River (Robertson and Kushlan 1974, Stevenson and Anderson 1994), although none
were detected during our surveys.
Northern Flicker. Northern Flickers are breeding residents throughout the state, including the Keys
(Stevenson and Anderson 1994, Bancroft et al. 1995). In winter, resident birds are supplemented by
migrants from northerly breeding populations. We detected only a handful of Northern Flickers, with 9
of the 12 observations occurring in the narrow strip of mangroves that border Biscayne Bay. The
mangrove forests along Biscayne Bay are adjacent to several roads and variety of other vegetation types
93
(e.g., developed areas and agricultural land) that were probably more suitable for this species, which
forages primarily on the ground.
Pileated Woodpecker. Pileated Woodpeckers are a fairly common resident of Florida and are found in a
variety of forest types, including mangroves (Stevenson and Anderson 1994). Robertson and
Woolfenden (1992), Stevenson and Anderson (1994), Woolfenden and Robertson (2006), and Cox (2006)
all noted a southward decline in the abundance of this species, with relatively few detections in the
Keys, especially the lower Keys.
We found Pileated Woodpeckers in every region of the study area, including on two of the small
islands of Florida Bay (Joe Kemp Key and Murray Key). Based on estimated densities, the core areas for
this species were in the Ten Thousands Islands region and the riverine forests of the southwest coast.
We detected single individuals or pairs occasionally throughout the Keys as far south as Big Torch Key.
Changes in the prevalence of large trees and abundance of snags likely explain the pattern of
distribution of Pileated Woodpeckers in the mangroves. Mangrove forests in the Ten Thousand Island
region and along the large rivers of the southwest coast contained many tall, large-diameter trees and
snags and thus probably allowed for a greater density of nesting pairs. Further south, especially in the
Keys, we noted fewer trees large enough to support nesting cavities for this species.
Great Crested Flycatcher. Great Crested Flycatchers breed throughout the state, although rarely in the
Keys, and winter in the southern portion of the state (Robertson and Woolfenden 1992). Nests are built
in cavities; according to Stevenson and Anderson (1994:425), “almost any cavity or any height will
serve”. Great Crested Flycatchers were widespread and found at intermediate densities through much
of the study area. The distribution of this species was fairly even, with pockets of high density found in
all regions except for Biscayne Bay and the upper Keys. Contrary to the situation described by
Robertson and Woolfenden (1992) and Stevenson and Anderson (1994), Great Crested Flycatchers were
detected regularly and frequently in the lower Keys, especially on Big Torch Key. This may reflect a
continuation of the southward advance of this species, first described by Robertson and Kushlan (1974).
The paucity of records of Great Crested Flycatchers in the dense, relatively short forests of the upper
Keys and Biscayne Bay may reflect a lack of foraging and nesting habitat in these areas. Bancroft et al.
(1995) suggested that the distribution of Great Crested Flycatchers in the Keys might be driven by the
availability of nest sites. Indeed, Red-bellied Woodpeckers, which are probably the most important

94
excavator of cavities used for nesting by Great Crested Flycatchers, showed a similar pattern of
distribution wherein densities were lowest along Biscayne Bay and in the upper Keys.
Gray Kingbird. Gray Kingbirds are breeding migrants found in coastal areas, and in some inland cities,
throughout the state (Stevenson and Anderson 1994, Cox 2006). They have a prolonged migration
period, with some fall departures occurring as late as December, only several months before the earliest
northward-moving individuals begin arriving in the state (Stevenson and Anderson 1994). Overall, Gray
Kingbirds were found at relatively low densities, and even with their limited range they never occurred
in great numbers (average density within the portion of the study area occupied = 0.10 individuals per
ha [95% CI = 0.07 – 0.12]). Although small numbers of Gray Kingbirds breed much further north, Gray
Kingbirds were largely restricted to the Keys and the islands of Florida Bay. The two detections at inland
points, both at Lane Bay in Everglades National Park, were of a pair and an individual seen on the same
day in mid-May, 2009, and may have been migrating individuals. Gray Kingbirds – like Great Crested
Flycatchers and Red-bellied Woodpeckers – were absent from Biscayne Bay despite occurring in high
densities nearby on the north end of Key Largo. Why the fringing forests along Biscayne Bay are avoided
by Gray Kingbirds is unclear, but is presumably related to forest structure; given that this species nests in
city parking lots in nearby Homestead, it is unlikely that the lack of records along Biscayne Bay reflects
the extent of human-related disturbance in these forests. Gray Kingbirds were also absent from the tall,
mostly closed-canopy, riverine forests along the southwest coast and in the Ten Thousand Islands
region.
White-eyed Vireo. Two weakly differentiated subspecies of White-eyed Vireo – the widespread Vireo
griseus griseus and V. g. maynardi in the Keys and south coast of the peninsula – breed in Florida, and a
third may winter in or migrate through the state (V. g. noveboracensis) (Stevenson and Anderson 1994).
White-eyed Vireos nest in a variety of vegetation types, with the common thread being the presence of
a dense understory of shrubs. Along the coast of Florida, White-eyed Vireos are associated with stands
of red mangrove, which presumably share structural characteristics with the shrubby woodlands that
this species occupied inland and further north (Stevenson and Anderson 1994). White-eyed Vireos were
abundant and widespread in the mangroves. Densities were greatest in the Ten Thousand Islands
region, but we also detected large numbers of individuals at inland sites in Everglades National Park,
including at Hell’s Bay, Lane Bay, and Canepatch. Based on the map in Stevenson and Anderson (1994),
individuals in the Ten Thousands Islands region would belong to griseus, whereas individuals further
95
south in Everglades National Park would belong to maynardi. Further south, densities declined
substantially, and we detected individuals only sporadically and in small numbers in the lower Keys.
Dense, shrubby stands of mangrove were common throughout the Keys, and on the islands of Florida
Bay, and so the scarcity of White-eyed Vireos in the southern part of the region is somewhat puzzling
and not obviously related to the availability of habitat. White-eyed Vireos in Florida Bay and the Keys
are at the far southern edge of their breeding range, and so the low densities that we observed may
reflect a lack of adaptation to the environmental conditions – perhaps the increased aridity – present in
much of the Keys.
Black-whiskered Vireo. Black-whiskered Vireos are a West Indian species thought to have colonized
Florida in the 1800s (Stevenson and Anderson 1994). Outside of Florida, they are found in a variety of
forests; in the state, they are limited to mangrove forests and tropical hammocks. Robertson and
Woolfenden (1992) and Woolfenden and Robertson (2006) argued for a northward and inland range
expansion among Black-whiskered Vireos in recent decades. We found little evidence of extensive use of
inland mangroves, but otherwise Black-whiskered Vireos were evenly distributed in most regions of the
study area. Behind the Florida Prairie Warbler, Black-whiskered Vireo was the second most abundant
species of the mangrove specialists. The only regions with consistently low densities of Black-whiskered
Vireos were Biscayne Bay and the upper Keys.
Blue Jay. Robertson (1955) and Robertson and Kushlan (1974) suggested that Blue Jays in southern
Florida had adapted to the loss of their primary habitat – pine rocklands – by becoming birds of forest
edge and suburbia. Perhaps accompanying this shift in habitat utilization, Blue Jays were also reported
to have expanded their range in the past century to include parts of the Keys thought to have been
previously unoccupied (Robertson and Woolfenden 1992, Woolfenden and Robertson 2006). Not noted
as an inhabitant of mangroves, we detected 49 Blue Jays at 19 different survey points, 3 in the Ten
Thousand Islands Region and 16 in Biscayne Bay and the upper Keys (near Card Sound and in John
Pennekamp Coral Reef State Park). At 5 of these points – 2 at Biscayne Bay and 3 in John Pennekamp
Coral Reef State Park – individuals were detected in 2 or more years. All of the other detections were of
lone individuals or pairs detected on a single occasion. With the exception of the points in the Ten
Thousand Islands Region, all of the mangroves in which we detected Blue Jays had areas of commercial,
residential, or agricultural development nearby. Given this, and the mostly irregular nature of the

96
detections, we believe that Blue Jays are either occasional, incidental visitors to the mangroves or a very
uncommon nesting species in mangroves adjacent to suburban development.
American Crow. American Crows nest during the dry season, typically January through March, and so
our surveys fell well outside the breeding season of this species (Stevenson and Anderson 1994).
American Crows are considered largely a species of inland habitats, except for an association,
presumably predatory, with nesting colonies of waterbirds in Florida Bay (Robertson and Kushlan 1974).
Historically, American Crows were considered absent from the Keys (Robertson and Kushlan 1974),
although more recently they have been described as occasional stragglers to the region (Robertson and
Woolfenden 1992, Stevenson and Anderson 1994). We found American Crow to be an abundant
member of the mangrove landbird assemblage, but with a fairly patchy distribution. American Crows
reached their greatest densities in inland areas along the south coast, especially along the Snake Bight
and Rowdy Bend trails, Hell’s Bay, and Lane Bay. American Crows occur regularly along the main road
through Everglades National Park, usually feeding on roadkill, and so some of the elevated densities that
we observed in surrounding areas may reflect the subsidies inadvertently provided by the road and the
cluster of development in Flamingo. American Crows were detected frequently, albeit in lower
numbers, in the large forests of the southwest coast and in the Ten Thousand Islands region. As
reported by previous authors, American Crows were largely absent from the Keys and Biscayne Bay. We
detected lone individuals at 5 different points, with the southernmost record coming from Lower
Sugarloaf Key.
Fish Crow. Considered the “city crow” of southern Florida, Fish Crows are common throughout much of
northern and central Florida but are restricted to the coasts and cities of south Florida (Stevenson and
Anderson 1994). Robertson and Woolfenden (1992) reported that Fish Crows were an irregular visitor
to the Keys, but noted the possibility that a small resident population might exist in the lower Keys. We
detected only 6 Fish Crows; 3 at 2 different points in John Pennekamp Coral Reef State Park, 2 at 2
different points along Biscayne Bay, and 1 on Clive Key in Florida Bay. Unlike American Crows, Fish
Crows breed during the period in which we conducted our surveys, so the records reported here could
reflect breeding individuals. However, absent evidence of breeding, we consider Fish Crows to be an
occasional visitor to and possible rare breeder in the mangroves of south Florida.
97
Carolina Wren. Found virtually anywhere in the eastern United States where dense, shrubby
vegetation exists, Carolina Wren is common throughout much of Florida (Robertson and Woolfenden
1992, Stevenson and Anderson 1994). Carolina Wrens are uncommon in the southern peninsula and the
Keys, apparently breeding south of Key Largo only on rare occasions (Robertson and Woolfenden 1992).
Our findings portray Carolina Wren as a continental species reaching the edge of its range in the
mangroves; they were neither widespread nor abundant even where present, and had a distribution
limited primarily to the northern half of the study area. In the Ten Thousand Islands region, where this
species reached its greatest density, individuals were absent from the keys and were found only at
inland locations along the major tidal rivers (e.g., Blackwater River). We detected 4 individuals at 3
points on Key Largo, but found no individuals at any points further south in the Keys.
Northern Mockingbird. We detected only 38 Northern Mockingbirds (Appendix A) at 15 different
points. Individuals were detected at six points around Biscayne Bay, seven points around Card Sound, at
one point on Cudjoe Key, and at one point on Big Pine Key. Similar patterns of distribution were noted
for other species associated with settled areas (e.g., Eurasian Collared-Dove), and so we assume that the
presence of Northern Mockingbirds in the mangroves is largely incidental.
Common Yellowthroat. Common Yellowthroats breed throughout North America in areas with low,
dense vegetation. Resident breeding populations in Florida are supplemented by winter migrants which
begin arriving in September and which linger as late as May (Stevenson and Anderson 1994). During the
winter, Common Yellowthroats are found throughout the state, including the Keys, but breeding
populations are thought to occur no further south than southern mainland (Stevenson and Anderson
1994). Common Yellowthroats were neither abundant nor widespread in the mangroves. They
exhibited a unique pattern of distribution that probably reflects their closer association with habitats
other than mangroves. Pockets of high density were noted at several inland locations in Everglades
National Park – not surprising given the association that this species has with freshwater marsh – and in
the lower Keys. Detections of lone individuals were recorded at points scattered throughout all other
regions of the study area with the exception of the Ten Thousand Islands area, where none were
detected. The presence of Common Yellowthroats in the lower Keys is somewhat unexpected, given the
presumed lack of breeding populations south of the mainland (e.g., Stevenson and Anderson 1994).
However, reported migration dates for wintering individuals extend well into May (Stevenson and
Anderson 1994), and so we cannot rule out the possibility that the individuals we detected in the Keys

98
were winter migrants. Indeed, most of the detections from the Keys were from late April or early May,
and later surveys at these same points yielded no detections. For example, on 30 April 2009, 5
individuals were counted at a point on Horseshoe Key in Great White Heron National Wildlife Refuge; 5
weeks later none were counted at this point. However, another point on Horseshoe Key yielded 2
individuals on 30 April 2009 and one individual on 26 May 2009. The persistence of at least one
individual through the spring is suggestive of an attempt at breeding. Overall, however, Common
Yellowthroats appear to be only an occasional and opportunistic inhabitant of the mangroves, with a
distribution limited largely to mangroves found near inland marshes.
Yellow Warbler. Cuban Yellow Warblers, presumably colonists from either the Bahamas or Cuba, were
first discovered in the state when a pair was found nesting in 1941 in Great White Heron National
Wildlife Refuge (Greene 1942). At least in Florida, they nest exclusively in mangroves (Stevenson and
Anderson 1994, Prather and Cruz 1995). Since their discovery, Yellow Warblers have spread up the Keys
and northward through Florida Bay. According to unpublished sources cited by Robertson and
Woolfenden (1992) and Stevenson and Anderson (1994), the breeding range extends into Collier County
on the Gulf side and to the north end of Biscayne Bay on the Atlantic side of the peninsula. However,
we found no evidence that Cuban Yellow Warblers have extended their range to include the mainland.
Because of their limited distribution within the study area, overall density of Cuban Yellow
Warblers was relatively low. Within the Keys and the islands of Florida Bay, however, we found them at
much higher densities: 0.65 individuals per ha (95% CI = 0.60 – 0.70). Indeed, when present, they were
one of the most abundant species detected. Cuban Yellow Warblers reached their greatest densities on
the small islands of Florida Bay. We detected this species on every surveyed island in Florida Bay with
the exception of Big Key, which was surveyed twice in 2011. We also found Cuban Yellow Warblers at
high density at some points in the lower Keys, although they were also absent from many points on the
mainline keys, including Cudjoe Key and Big Torch Key. Further north, we found them at low density in
the short red mangrove forests at John Pennekamp Coral Reef State Park and around Card Sound. We
recorded only one individual on the mainland, a singing male detected during a single survey along the
Snake Bight Trail in Everglades National Park in 2009. Yellow Warblers were not detected in Biscayne
Bay, the southwest coast of Everglades National Park, and the Ten Thousand Islands region. Individuals
probably wander north of Florida Bay on occasion, but we found no evidence that this species has
expanded its regular breeding range to the extent suggested by Robertson and Woolfenden (1992) or
Stevenson and Anderson (1994). Bird surveys of the 108 points that we surveyed in the Ten Thousand

99
Islands region have been conducted annually since 1999, and Yellow Warblers have never been detected
during that time (Terry Doyle, USFWS, unpublished data). Based on our data, Cuban Yellow Warblers
are limited primarily, if not exclusively, to the Keys and to the islands of Florida Bay; records of breeding
individuals further northward would be of note and should be carefully examined to rule out the
possibility that individuals are migrants belonging to one of the more northerly subspecies in the aestiva
group, which are uncommon spring migrants (Stevenson 1957, Stevenson and Anderson 1994).
Prairie Warbler. The endemic subspecies of Prairie Warbler that inhabits Florida’s mangrove was first
described by Howell (1930). Believed to have diverged in the late Pleistocene (c.a. 70,000 years ago;
Buerkle [1999]) from a common ancestor shared with the nominate subspecies, Setophaga discolor
discolor, Florida Prairie Warblers differ from their northern cousins both morphologically – they are
larger and have longer patches of white on the outermost 3 retrices (Buerkle 2000) – and behaviorally,
in that they are non-migratory. The recorded range of Florida Prairie Warbler extends further north
than any of the other mangrove specialists, from Pasco County on the Gulf side to Volusia County on the
Atlantic coast (Robertson and Woolfenden 1992, Stevenson and Anderson 1994). Nesting occurs
primarily, but perhaps not exclusively, in coastal mangrove forests (Stevenson and Anderson 1994,
Prather and Cruz 1995).
Florida Prairie Warblers were by far the most common and widespread mangrove specialist in
our surveys. They occurred in every region of the study area without any apparent regard for variation
in the structure of the mangroves. They were as common in the tall mixed forests of the Ten Thousand
Islands region as they were on the small islands of Florida Bay or in the short-statured red mangrove
shrublands of the lower Keys. The only areas where they were relatively uncommon were inland sites
near the marsh/mangrove ecotone.
Eastern Towhee. Eastern Towhees are a relatively common species in a variety of upland forests in
Florida (Stevenson and Anderson 1994). Robertson and Kushlan (1974), citing unpublished
observations, suggested a small population might exist in the mangroves of the southwest coast. Our
data support this observation. We detected a relatively small number of individuals of this species, but
all 55 detections came at the same 9 points in Hell’s Bay, Everglades National Park. Multiple individuals
were present at each of these points in every year of the study, suggesting the presence of a very small
but persistent breeding population. Eastern Towhees are a common breeding resident of the pine
rocklands at Long Pine Key, Everglades National Park, which is <25 km distant. Although the short red

100
mangroves that predominate in Hell’s Bay may be structurally similar to the shrubby forest edges
occupied elsewhere by this species, the presence of persistent stand water would seem to pose a
challenge for a ground-foraging species like Eastern Towhee. Additional observations on habitat use and
behavior in this population would be of great interest.
Northern Cardinal. In Florida, Northern Cardinals are common throughout the state, including the Keys
(Robinson and Woolfenden 1992). In the present study, Northern Cardinal was the second most
abundant and frequently encountered species in the mangroves. Northern Cardinals inhabited almost
every region of the study area and showed no obvious preference for one vegetation type over another.
The islands of Florida Bay most distant from the mainland were the only areas where we did not detect
any individuals.
Red-winged Blackbird. A gregarious species of marsh, prairie, and forest edge, Red-winged Blackbirds
are abundant in suitable habitat throughout Florida (Stevenson and Anderson 1994). We found Red-
winged Blackbirds at high densities when they occurred, which is to be expected given the semi-colonial
nesting habits of this species. Densities were greatest in the Keys and on the islands of Florida Bay, all of
which were inhabited save for Big Key. The open, prairie-like depressions at the center of many of the
islands in Florida Bay apparently offer attractive breeding habitat for this species. Red-winged
Blackbirds were far less common on the mainland, reaching intermediate densities at the most inland
sites and in the narrow forests along Biscayne Bay. They were absent from the extensive forests along
the southwest coast and much of the Ten Thousand Islands region, with the exception of a few points at
the ecotone between freshwater marsh and the mangroves. The use of mangroves by Red-winged
Blackbirds appears to be restricted to the drier, shorter, and more open forests and shrublands of the
Keys and to areas with extensive forest edge, especially where freshwater marsh or open prairie abuts
mangrove forest. Anecdotal evidence in support of this pattern is evident from the J.N. “Ding” Darling
National Wildlife Refuge in Sanibel, where a once robust breeding population disappeared after a large
area of freshwater marsh was allowed to revert to mangrove forest (Joyce Palmer, USFWS, personal
communication).
Common Grackle. Within their range, Common Grackles breed nearly anywhere that offers suitable
nest sites, from the boreal forest of northern Canada through the pine forests and suburban plantings of
south Florida. Although not noted in Robertson and Kushlan (1974) as a resident of mangroves, we

101
found Common Grackles throughout the study area, albeit at low densities and with a rather patchy
distribution. Detections of Common Grackles were concentrated in the lower Keys and on the islands of
Florida Bay, presumably because mangroves in these areas are patchier and offer more edge habitat. As
with Red-winged Blackbirds, Common Grackles were not detected in the large, extensive mangrove
forests of the southwest coast.
Brown-headed Cowbird. Brown-headed Cowbirds are a recent addition to the avifauna of Florida, and
since their arrival have spread southward throughout the peninsula (Robertson and Woolfenden 1992,
Woolfenden and Robertson 2006). Breeding has not been confirmed on the Keys (Robertson and
Woolfenden 1992). We detected relatively few Brown-headed Cowbirds, although they were spread
over most of the study area. Six detections occurred at 5 different points along Biscayne Bay. Single
detections were noted at Rowdy Bend; Clive, Frank, and Palm keys in Florida Bay; Turtle and Tripod keys
in the Ten Thousand Islands region; and, perhaps most significantly, at 2 points on north Key Largo near
Card Sound.