ABSTRACT - Web viewWord Count: 200. INTRODUCTION. ... Clostridium difficile, are particularly...
42
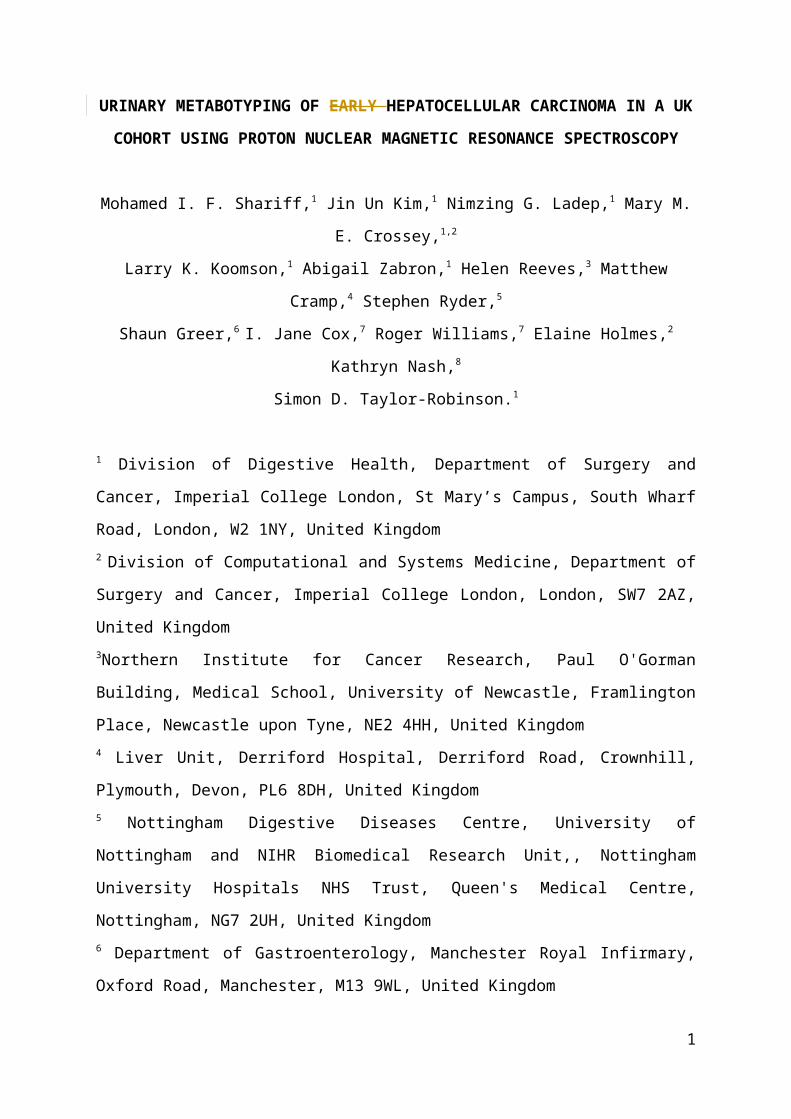
URINARY METABOTYPING OF EARLY HEPATOCELLULAR CARCINOMA IN A UK COHORT USING PROTON NUCLEAR MAGNETIC RESONANCE SPECTROSCOPY Mohamed I. F. Shariff, 1 Jin Un Kim, 1 Nimzing G. Ladep, 1 Mary M. E. Crossey, 1,2 Larry K. Koomson, 1 Abigail Zabron, 1 Helen Reeves, 3 Matthew Cramp, 4 Stephen Ryder, 5 Shaun Greer, 6 I. Jane Cox, 7 Roger Williams, 7 Elaine Holmes, 2 Kathryn Nash, 8 Simon D. Taylor-Robinson. 1 1 Division of Digestive Health, Department of Surgery and Cancer, Imperial College London, St Mary’s Campus, South Wharf Road, London, W2 1NY, United Kingdom 2 Division of Computational and Systems Medicine, Department of Surgery and Cancer, Imperial College London, London, SW7 2AZ, United Kingdom 3 Northern Institute for Cancer Research, Paul O'Gorman Building, Medical School, University of Newcastle, Framlington Place, Newcastle upon Tyne, NE2 4HH, United Kingdom 4 Liver Unit, Derriford Hospital, Derriford Road, Crownhill, Plymouth, Devon, PL6 8DH, United Kingdom 5 Nottingham Digestive Diseases Centre, University of Nottingham and NIHR Biomedical Research Unit,, Nottingham University Hospitals NHS Trust, Queen's Medical Centre, Nottingham, NG7 2UH, United Kingdom 6 Department of Gastroenterology, Manchester Royal Infirmary, Oxford Road, Manchester, M13 9WL, United Kingdom 1
Transcript of ABSTRACT - Web viewWord Count: 200. INTRODUCTION. ... Clostridium difficile, are particularly...
URINARY METABOTYPING OF EARLY HEPATOCELLULAR CARCINOMA IN
A UK COHORT USING PROTON NUCLEAR MAGNETIC RESONANCE
SPECTROSCOPY
Mohamed I. F. Shariff,1 Jin Un Kim,1 Nimzing G. Ladep,1 Mary M. E. Crossey,1,2
Larry K. Koomson,1 Abigail Zabron,1 Helen Reeves,3 Matthew Cramp,4 Stephen Ryder,5
Shaun Greer,6 I. Jane Cox,7 Roger Williams,7 Elaine Holmes,2 Kathryn Nash,8
Simon D. Taylor-Robinson.1
1 Division of Digestive Health, Department of Surgery and Cancer, Imperial College London,
St Mary’s Campus, South Wharf Road, London, W2 1NY, United Kingdom2 Division of Computational and Systems Medicine, Department of Surgery and Cancer,
Imperial College London, London, SW7 2AZ, United Kingdom3Northern Institute for Cancer Research, Paul O'Gorman Building, Medical School,
University of Newcastle, Framlington Place, Newcastle upon Tyne, NE2 4HH, United
Kingdom4 Liver Unit, Derriford Hospital, Derriford Road, Crownhill, Plymouth, Devon, PL6 8DH,
United Kingdom5 Nottingham Digestive Diseases Centre, University of Nottingham and NIHR Biomedical
Research Unit,, Nottingham University Hospitals NHS Trust, Queen's Medical Centre,
Nottingham, NG7 2UH, United Kingdom6 Department of Gastroenterology, Manchester Royal Infirmary, Oxford Road, Manchester,
M13 9WL, United Kingdom7 The Foundation for Liver Research, Institute of Hepatology, 69-75 Chenies Mews, London
WC1E 6HX, United Kingdom 8 Liver Unit, Southampton General Hospital, Tremona Rd, Southampton, Hampshire SO16
6YD, United Kingdom
Word Count: 4675
Number of Figures and Tables: 5
Category: Original article
1
List of Abbreviations:
1H NMR Proton nuclear magnetic resonanceAFP Alpha-fetoproteinALT Alanine transaminaseBCLC Barcelona Clinic Liver CancerBMI Body mass indexHBV Hepatitis B VirusHCC Hepatocellular carcinomaHCV Hepatitis C VirusHIV Human immunodeficiency virusINR International normalized ratioNASH Non-alcoholic steatohepatitisPCA Principal component analysisPLS-DA Partial least squares discriminant analysisSEER Surveillance epidemiology and end resultsSTOCSY Statistical total correlation spectroscopyTSP Trimethyl-silyl phosphateUS Ultrasonography
Conflict of Interest: None
Financial support: This study was partially funded by a grant from the Association of Physicians
of Great Britain and Ireland. MIFS and NGL were supported by personal grants from the Royal
College of Physicians of London, the University of London and the Trustees of the London Clinic,
London, UK. MMEC was supported by a Fellowship from the Sir Halley Stewart Trust (Cambridge,
United Kingdom).
2
ABSTRACT
Background: Discriminatory metabolic profiles have been described in urinary 1H nuclear
magnetic resonance (NMR) spectroscopy studies of African patients with hepatocellular
carcinoma (HCC). This study aimed to assess similarities in a UK cohort where there is a
greater etiological diversity. Methods: Urine from cirrhosis and HCC patients was analyzed
using a 600 MHz 1H NMR system. Multivariate analysis and median group MR spectra
comparison identified metabolite alterations between groups. Metabolite identification was
achieved through literature reference and statistical total correlation spectroscopy. Diagnostic
accuracy was compared to serum alpha-fetoprotein (AFP). Results: Of the 52 patients
recruited, 13 samples from HCC and 25 from cirrhosis patients were selected. At 200 IUmL -1,
diagnostic sensitivity of AFP was 27%. Multivariate analysis of urinary spectra generated
diagnostic models with a sensitivity/specificity of 53.6%/96%. p-cresol sulfate (p=0.04),
creatinine (p=0.03), citrate (p=0.21) and hippurate (p=0.52) were reduced in the HCC
patients. Carnitine (p=0.31) and formate (p=0.44) were elevated. Conclusions: Diagnostic
sensitivity was lower than previous African studies, but still outperformed serum AFP.
Reduced creatinine, citrate and hippurate and elevated carnitine are comparable with the
African studies. p-Cresol sulphate alteration is a novel finding and may indicate an altered
sulfonation capacity of the liver in patients with HCC.
Word Count: 200
3

INTRODUCTION
Hepatocellular carcinoma (HCC) is the commonest primary liver cancer and the second
global cause of cancer mortality. Although the heaviest disease burden is in sub-Saharan
Africa and Eastern Asia1, recent evidence suggests HCC incidence is rising in previously
low-risk countries such as the United Kingdom2.
The 5-year mortality for HCC in the developed world is poor3. The Surveillance
Epidemiology and End Results (SEER) database from the United States documents a 9.9%
HCC 5-year survival, compared to over 60% for all tumors4. The current HCC surveillance
guidelines in the developed world recommend 6-monthly hepatic ultrasonography (US) in
patients with cirrhosis, but requirement for serum alpha-fetoprotein (AFP) measurement has
been dropped, owing to poor sensitivity and specificity of this test5,6. However, a
retrospective SEER-database based study between1994-2001 reported 6-monthly regular
surveillance rates of only 17% in patients over 65 years with cirrhosis7. This highlights
problems concerning patient attendance under surveillance, in particular those that live
greater distances from medical centers.
“Metabonomics”, the study of metabolic responses to physiological, drug and disease stimuli,
may be utilized to identify profiles of biomarkers that characterize HCC. The most common
metabonomic technique is proton nuclear magnetic resonance (1H NMR) spectroscopy8.
Previous 1H NMR studies performed in Nigerian, Egyptian and Gambian patients have
identified a number of altered metabolites in the urine, implicating changes in hepatic
function according to Warburg’s hypothesis of altered metabolism9-11. Applying this theory, a
simple, non-invasive test that identifies tumor profiles from the urine would be invaluable for
4
cirrhosis patients, potentially allowing surveillance in the community by local general
practitioners or even patients themselves.
The etiological variation of HCC patients in the UK is greater than African patients,
including viral hepatitis, alcohol and non-alcoholic steatohepatitis (NASH). The collection of
samples in the UK also allowed detailed patient and disease demographics to be collated.
The main aims of this study were to identify tumor-specific urinary metabolite changes in
patients with early HCC of varying etiology .and to compare findings to previous African
studies with larger tumors, caused solely by viral hepatitis.
5

MATERIALS AND METHODS
Patient Selection
Patients were recruited at six hospital sites around the United Kingdom: London, Manchester,
Newcastle, Nottingham, Plymouth and Southampton. All subjects gave written, informed
consent, in accordance with local Research Ethics Committee approval (LREC reference no.
06/Q041/10).
HCC was diagnosed with two confirmatory imaging modalities and cirrhosis with
histological and/or radiological confirmation. Tumor staging was according to the Barcelona
Clinic Liver Cancer (BCLC) staging system5, based upon tumor size and multiplicity, patient
performance status, presence or absence portal vein invasion, presence or absence of portal
hypertension and Child-Pugh scores of liver function12,13. Patients with cirrhosis were graded
according to the Child-Pugh score. Participant height, weight, medical, drug, smoking and
alcohol intake history were recorded. A 24-hour dietary history was also recorded, paying
attention to foodstuffs known to produce prominent nuclear magnetic resonance (NMR)
signals, such as vanilla (vanillin) and vinegar (acetic acid). Exclusion criteria included those
patients not meeting the diagnostic criteria cited above for HCC and cirrhosis, those patients
with HCC who had undergone curative resection or transplant, patients co-infected with
human immunodeficiency virus (HIV) and those samples identified as outliers on principal
component analysis.
Sample collection
15 mL of random, non-fasted urine were collected into preservative-free universal containers
and placed immediately on ice and centrifuged within 2hr at 4 ºC, 1000 rpm for 10 min. The
6

supernatant was then transferred as 2 mL aliquots into 2 mL microvial tubes and stored at -80
ºC until analysis.
Sample preparation
Urine samples were thawed at room temperature and 400 μL were transferred to 1.5 mL
microvial tube to which 200 μL of phosphate buffer solution (pH 7.4), containing 1 mM
trimethyl silyl phosphate (TSP), sodium azide 3 mM (as a bacterial biocidal agent to inhibit
bacterial growth and contamination) and D2O 20%. Samples were centrifuged for 5 min at
13,000 rpm and 550 μL of supernatant were transferred to 5 mm NMR tubes (Norell,
Landisville, New JerseyNJ, USA).
Proton nuclear magnetic resonance spectroscopy
Samples were run in random non-grouped order under automation on a Bruker DRX-600
NMR system operating at 600.44 Hz 1H frequency (Bruker Biospin, Rheinstetten, Germany).
The system was tuned, matched and frequency locked to deuterated hydrogen as the nucleus
of interest. A representative sample was utilized to set shim gradients to ensure a
homogenous magnetic field across the sample, a 90º pulse length and water suppression
offset parameters14. Spectra were acquired at 300 K using a one-dimensional (1-D) noesypr1d
pulse sequence with water presaturation during relaxation delay (RD) and mixing time (tm)
using the following pulse program: -RD-90º_t-90º-tm-90º-acquire; where RD = 2.0 s and tm =
0.1 s. For each sample, 128 FIDs were collected into 32,000 data points with a spectral width
of 20 ppm. A line broadening function of 0.3Hz was applied prior to Fourier transformation.
Spectra were manually phased, baseline corrected and referenced to TSP at 0 ppm using
TOPSPIN v2.0 (Bruker Biospin, Rheinstetten, Germany). Spectral peaks were assigned with
reference to the literature 15-17.
7
Spectral processing
Proton NMR spectra were exported to MATLAB R2010 (MathWorks, Natick,
MassachusettsMA, U.S.A) and to avoid influence on analyses from water suppression
aberration, the water region from 4.5 ppm – 6 ppm was excluded. Spectra were aligned to
negate the effect of pH dependent variation in metabolite resonances which may occur
despite sample buffering. To remove the effect of differential urine concentrations, data were
normalized using median fold-change normalization. Median spectra for both clinical groups
were generated to allow direct visual comparison of average spectra and allow the selection
of regions that were visually divergent, in addition to those identified by multivariate
analysis, for peak integration.
Statistical Total Correlation Spectroscopy (STOCSY)
Using in-house software, developed at Imperial College London, the spectral database was
interrogated for correlated peaks across the whole spectrum. Peaks that co-varied with high
correlation were identified by input of one peak region of interest. Correlation factors varied
from 0 – 1. This method was utilized to identify unknown peaks to extract the total spectrum
for an individual metabolite.
Multivariate and univariate statistical analysis
Full resolution data were used for analyses. Data matrices were generated in MATLAB
containing ppm variables as columns and sample identities as rows. After water exclusion,
this amounted to a matrix of 28,238 variables and 43 observations. This matrix was exported
to SIMCAP-12 (Umetrics, Umea, Sweden) for multivariate analysis and variables from 0.2 –
10.0 ppm were used for analysis, thus removing any influence from variation in TSP
8

concentration between samples. Data were mean-centered and principal component analysis
(PCA) was performed first to model variation and identify outliers. Pareto-scaled data and
unit variance data were also generated, but both tended to model noise rather than signal.
Therefore, only mean-centered data were used for further analysis. After outliers were
identified and excluded, partial least squares discriminant analysis (PLS-DA) was performed
to identify the discriminant strength of the model and to generate a loadings plot from which
metabolites could be identified which contributed to differences between groups. In
SIMCAP-12, PLS-DA models were generated through seven-fold cross validation. In this
method, every 7th sample is excluded (1st, 7th, 14th, 21st and so on), a model generated from the
remaining samples and the excluded “training set” predicted back into the model. This was
repeated for all the samples (grouping the 2nd, 9th, 16th and 3rd, 10th, 17th and so on) until all the
samples have been excluded once. The results were averaged to produce a model that was
externally cross-validated.
Spectral peaks that were most contributory to PLS-DA models and those peaks that appeared
divergent on comparison of median spectra were selected for peak integration. Comparison of
integrals was performed using GraphPad Prism (La Jolla, CaliforniaCA, USA) using Mann-
Whitney non-parametric tests of significance, as normal Gaussian distribution could not be
assumed (, p-values of <0.05 were considered significant).
9
RESULTS
Subject recruitment, exclusion and demographics
A total of 51 patients were recruited: 19 with HCC and 32 with cirrhosis. From the HCC
cohort, two patients were excluded as they had undergone curative liver transplantation or
hepatic resection prior to sample collection; one patient was excluded as they were co-
infected with HIV and a further three samples were excluded on PCA analysis (see below).
The total number of HCC samples after exclusions was therefore 13. From the cirrhosis
cohort, four patients were excluded owing to insufficient radiological or biopsy evidence of
cirrhosis status and two samples were excluded following PCA, leaving a total of 25. Median
ages were similar in both groups: 61 yrs for HCC and 58 yrs for cirrhosis patients. There
were proportionally more males in the HCC group (85% versus 56%) but this was not
statistically significant (p=0.26). Body mass indices were comparable, 25.9 kg/m2 in the HCC
group and 27.3 kg/m2 in the cirrhosis group, again the difference not reaching significance (p
= 0.23) (Table 1). All patients studied were ethnically Caucasian and born in the United
Kingdom or in Europe.
There were greater numbers of Child’s-Pugh grade A patients in the cirrhosis group (74%
versus 40%), but cumulatively, grade A + B patients accounted for the majority of patients in
both groups: 70% in the HCC cohort and 91% in the cirrhosis cohort. The liver disease
etiologies of both HCC and cirrhosis patients were hepatitis C virus (HCV) (6; 6), hepatitis B
virus (HBV) (3; 3), alcohol (2; 9), NASH (0; 2), hemochromatosis (1; 1), HCV + alcohol (1;
2), HBV + alcohol (0; 0), NASH + alcohol (0; 1), idiopathic (0; 1), respectively.
10

Disease stages of HCC are displayed in Table 2. Three tumors were BCLC stage A, five
grade C and two grade D. The tumor sizes ranged from a single 1cm lesion (BCLC stage A)
to a multifocal tumor with a combined diameter of 8cm (BCLC stage D). Three tumors could
not be staged owing to insufficient data.
AFP, biochemical and liver function test results are detailed in the supplementary results
(supplementary Tables 1 and 2). Median AFP levels were significantly higher in the HCC
group (18.1 IU mL-1 versus 4.6 IU mL-1,). Using an AFP cut-off level of 20 IU mL-1,
sensitivity and specificity were 45% and 95%, respectively and at 200 IU mL-1, were 27%
and 100%, confirming the poor sensitivity of AFP for HCC in this cohort.
The median serum biochemistry profiles of serum creatinine, alanine transaminase (ALT),
bilirubin and international normalized ratio (INR) were similar, with the exception of
albumin which was lower in the HCC group, compared to the patients with cirrhosis (30 gL -1
and 35 gL-1, respectively).
Multivariate statistical analysis
The initial PCA scatter demonstrated two HCC and one cirrhosis outlying samples,
positioned outside the Hotelling’s T2 limit (see supplementary results: supplementary Figure
2). Examination of the NMR spectra of these samples identified significant glycosuria in one
HCC sample, which affected further analysis. The cirrhosis and remaining HCC outlying
samples displayed dominant resonances at 1.18 ppm (triplet) and 3.65 ppm (quadruplet),
which corresponded to ethanol resonances (see supplementary results: supplementary Figure
3).
11
Following exclusion of these three datasets, PCA identified further significantly outlying
samples (see supplementary results: supplementary Figure 4). Two outliers in this analysis
revealed heavy influence from glucose metabolites. One of these patients, although not
formally diagnosed as diabetic, had a high capillary glucose level (18.2 mmolL-1) at the time
of sampling. The other had no documented diagnosis of diabetes. These samples were
excluded and a third PCA scatter plot was generated with R2 and Q2 values of 0.51 and 0.31,
respectively (see supplementary results: supplementary Figure 5).
To identify discriminatory metabolites between the two groups, PLS-DA was performed (see
supplementary results: supplementary Figure 6). In a two component model, model fitting
was poor (R2 = 0.48) with negative Q2 values, suggesting that, as a predictive tool, the model
would be poorly predictive. The misclassification matrix from the PLS-DA predicted 7 as
HCC and 6 as cirrhosis in the HCC group, and predicted 1 as HCC and 24 as cirrhosis in the
cirrhosis group, resulting in a diagnostic sensitivity of HCC of 53.6% and specificity of 96%.
The most influential variables, from PLS-DA loadings plot and visual comparison of median
spectra are summarized in Table 3.
Univariate statistical analysis
Influential metabolite peak integrals are displayed in Table 3 and Figure 1. Metabolites
elevated in the urine of patients with HCC were carnitine (3.24 ppm, p=0.31) and formate
(8.5 ppm, p=0.44), although neither result reaching significance. Urinary metabolites reduced
in patients with HCC included citrate double doublet (2.56 ppm and 2.68 ppm, p=0.21 and
p=0.25, respectively) and both the aliphatic and aromatic resonances of hippurate (3.97 ppm,
p=0.52 and 7.56 ppm, p=0.69), neither of these results reaching significance. Peaks at 2.35
ppm (p=0.06) and 7.21 ppm (p=0.04) were significantly reduced in patients with HCC and
12

were identified as arising from the same metabolite when a STOCSY analysis was
performed. This metabolite was identified as p-cresol sulfate from the literature 15, the
resonance at 2.35 representing the methyl signal and that at 7.21, the aromatic signal. A
comparison of the median spectral integrals of the 7.21 ppm region is displayed in Figure 2a.
Finally, urinary creatinine was found to be reduced in patients with HCC, at both the
creatinine methyl singlet at 3.05 ppm (p=0.26) and significantly, at the methylene singlet at
4.06 ppm (p=0.03) (Figure 2b).
13
DISCUSSION
This is the first reported study to identify HCC-specific urinary 1H NMR markers in a
closely-matched group of patients with early HCC of differing etiology. Similar to the studies
of Gambian, Nigerian and Egyptian patient cohorts, reduced urinary creatinine, citrate and
hippurate and elevated carnitine levels were found in patients with HCC in our study, in
comparison to those with cirrhosis, albeit not to levels of statistical significance9-11. The study
presented here also identified significant reductions in urinary p-cresol sulfate, a metabolite
which was not discriminatory in previous studies.
Although this is a small study in relative terms, study patients were well matched, the
majority being Child-Pugh stage A and B. In these patients, serum AFP, the most widely used
marker for HCC, displayed poor diagnostic sensitivity (27%) at a cut-off of 200 IU mL -1,
while urinary multivariate analysis, despite displaying poor fitting and predictive parameters,
produced a superior sensitivity (53.6%). Diagnostic specificity was similar for both tests
(100% for AFP and 96% for multivariate models). These results do not compare as well as
the published West African, Nigerian and Egyptian urinary 1H NMR studies, which displayed
multivariate model sensitivities and specificities approaching >90%9-11. The reasons for
poorer discrimination in this UK cohort are probably multifactorial. First, the cohorts for this
study were small, but they were intentionally selected to be well matched, both for
demographic and physical status and for etiology of liver disease. No healthy control group
was included as the metabolic profiles of healthy patients have been shown to be very
different to those of diseased groups, which may be due to global metabolic and hepatic
function rather than tumor-specific changes. Furthermore, the stage of the tumors tended to
be more advanced in the Nigerian and Egyptian cohorts, compared to the UK cohort. It is
therefore possible that the close matching of cirrhosis and HCC patients, with ≥70% in both
14

groups being Child-Pugh stage A or B, resulted in higher similarity of spectra. Certainly,
BMI was similar in both groups, so it is unlikely that cancer cachexia, which may have been
a prominent factor in causing altered spectral profiles in the Nigerian and Egyptian groups,
had a great influence on discriminatory profiles in this study. Nevertheless, PLS-DA and
median MR spectral comparison identified a number of spectral regions elevated or reduced
in the HCC compared to the cirrhosis cohorts.
The metabolic alterations that we observed in this study may be partially explained by the
Warburg phenomenon, where rapidly proliferating cancer cells with increased energy
requirements preferentially switch to glycolysis with little oxidative phosphorylation with
potentially a series of measurable alternative energy intermediates in the plasma and urine18 .
Therefore of note, urinary citrate levels (2.56 ppm and 2.68 ppm, p=0.21 and p=0.25,
respectively) were reduced in the HCC cohort, although not to a level of significance. This
finding is similar to that of the previous Egyptian studies10 and may represent a repression of
oxidative phosphorylation in the mitochondria, as predicted by the Warburg hypothesis18,19.
In addition, a previous study in Sprague-Dawley rats, by Bollard and colleagues, observed
reduced urinary citrate after partial hepatectomy, which they proposed to be a marker of
heightened energy demand and cellular stress, as would be the case in patients with HCC20.
Urinary creatinine was reduced in patients with HCC, the methylene (CH2) singlet at 4.06
ppm significantly reduced (p=0.03), while the methyl singlet (CH3) at 3.05 ppm, non-
significantly reduced (p=0.26). Similar findings were present in both previous West African
and Egyptian cohorts of patients9-11. Chen and colleagues, using HILIC and RPLC MS, also
observed reduced urinary creatinine levels in HCC subjects21. Creatinine is a breakdown
15
product of creatine phosphate in muscle and is eliminated from the body by glomerular
filtration and partial tubular excretion. Renal impairment will cause a rise in serum creatinine
and a concomitant rise in urine creatinine. Serum creatinine levels were similar in both
groups, so is unlikely to have contributed to urinary differences. Lower total body creatinine
may be due to reduced muscle mass. Although the BMI of each group was non-significantly
different (HCC = 25.9 kg/m2 and cirrhosis = 27.25 kg/m2, p=0.23) it may be that the slight
difference in weight is due to reduced muscle mass in HCC patients, which is reflected in
lower urinary creatinine levels. A study of urinary creatinine in a US population observed
that lower muscle mass was a major contributing factor to lower urinary creatinine levels22.
Formate (8.5 ppm, p=0.44) was non-significantly elevated in the HCC group and was not
identified as a discriminatory metabolite in West African or Egyptian groups in the past.
Formate is produced from the folate cycle in hepatic embryonic cells. Similar to the
observable rise in other embryonic glycoproteins, such as AFP, elevated formate is the
consequence of hepatocyte tumorigenesis23.
Urinary hippurate levels (3.97 ppm, p=0.52 and 7.56ppm, p=0.69), an aromatic acyl glycine,
that is formed by conjugation of benzoate with glycine in liver and kidney mitochondria24,
was non-significantly reduced in the urine of patients with HCC. Hippurate was similarly
reduced in the urine of the Egyptian cohort of HCC patients. The gut microbiota play a key
role in hippurate homeostasis through metabolizing aromatic compounds to form benzoate
and modulating hippurate urinary excretion25,26. It is possible that the decreased hepatic
function, as evidenced by higher Child-Pugh scores in patients with HCC translates into less
efficient benzoate conjugation and subsequently lower urinary hippurate excretion levels. In
this way, hippurate may be seen as a surrogate marker of hepatic function. Alternatively,
16

Williams and colleagues described that alteration in urinary hippurate in Crohn’s disease was
due to the alteration in the gut microbiota27. This may be suggestive of an interaction between
microbiotal modulation and HCC tumorigenesis. Alterations in the urinary level of this
metabolite have also been reported in inflammatory bowel disease28 and pneumonia29,
questioning its specificity for a particular disease.
Urinary p-cresol sulfate was significantly reduced in the HCC cohort at 7.21 ppm (p=0.04).
This corresponded to the aromatic resonances of the molecule. The methyl group, on the
benzene ring, resonated at 2.35 ppm, and comparative median values approached significance
(p=0.06). This finding was not evident in the Nigerian and Egyptian groups. p-cresol is a
product of colonic bacterial metabolism of tyrosine. Certain bacteria, such as Clostridium
difficile, are particularly high producers. Sulfonation to p-cresol sulfate occurs in the liver.
Clayton and colleagues in 2008, observed that healthy human subjects with high pre-test
urinary p-cresol sulfate levels sulfonated acetaminophen (paracetamol) to the less toxic
acetaminophen glucuronide to a lesser extent than those with lower pre-test p-cresol sulfate
levels15. This was proposed to be due to the competitive inhibition of p-cresol sulfonation in
the presence of acetaminophen (paracetamol). This study was performed in healthy patients,
so it is not possible to surmise whether this would translate in higher likelihood of drug-
induced liver toxicity, although sulfonation of hepatically-metabolized drugs is a common
occurrence and it is possible that p-cresol sulfate is a surrogate marker of liver function,
lower levels reflecting reduced sulfonation in those patients with HCC and worse liver
function. Furthermore, there is accumulating evidence towards the role of microbiota in
hepatic disease progression, the so called “microbiota-liver axis”. Chassaing and colleagues
have pointed out that microbiota may be significant sources of inflammatory agents that
contribute to both gastrointestinal and hepatic diseases30 . The It changes in p-cresol,
17

therefore, may be an indication of a primary dysfunction of host microbiota, leading to less
tyrosine metabolism, or a responsive change in the gut microbialotal environment, secondary
to liver disease.may also suggest an alteration in the host microbiota, causing a reduction in
p-cresol production.
CONCLUSIONS
This is the first urinary 1H NMR spectroscopy metabolic profiling study of HCC to be
performed in a UK population. Overall, the findings provide further insight into the metabolic
pathogenesis of liver disease and HCC and corroborate some of the findings highlighted in
earlier studies in Nigerian, Egyptian and Gambian cohorts9,10. Similarities include reduced
urinary creatinine, citrate and hippurate and raised carnitine, albeit not to significant level.
This study has also identified p-cresol sulfate as a discriminatory urinary metabolite in this
UK cohort, significantly reduced in patients with HCC compared to those with cirrhosis. The
explanation for this is not clear but may be due to altered liver function or to a change in the
microbiome-host interaction. Larger cohort numbers are required for validation of these data.
Study of the host microbiome is also warranted..
Acknowledgements: All authors acknowledge the support of the National Institute for
Health Research Biomedical Research Center at Imperial College London for infrastructure
support. MMEC and SDT-R hold grants from the United Kingdom Medical Research
Council.
18

REFERENCES
References
1. El-Serag, H. B. Epidemiology of viral hepatitis and hepatocellular carcinoma. Gastroenterology 2012, 142, 1264-1273.e1.
2. Khan, S. A.; Taylor-Robinson, S. D.; Toledano, M. B.; Beck, A.; Elliott, P.; Thomas, H. C. Changing international trends in mortality rates for liver, biliary and pancreatic tumours. J. Hepatol. 2002, 37, 806-813.
3. European Association for Study of Liver EASL Clinical Practice Guidelines: management of hepatitis C virus infection. J. Hepatol. 2014, 60, 392-420.
4. National Cancer Institute Surveillance, Epidemiology, and End Results Program. http://seer.cancer.gov (accessed 09/29, 2015).
5. Bruix, J.; Sherman, M.; American Association for the Study of Liver Diseases Management of hepatocellular carcinoma: an update. Hepatology 2011, 53, 1020-1022.
6. European Association For The Study Of The Liver EASL–EORTC clinical practice guidelines: management of hepatocellular carcinoma. J. Hepatol. 2012, 56, 908-943.
7. Davila, J. A.; Morgan, R. O.; Richardson, P. A.; Du, X. L.; McGlynn, K. A.; El-Serag, H. B. Use of surveillance for hepatocellular carcinoma among patients with cirrhosis in the United States. Hepatology 2010, 52, 132-141.
8. Nicholson, J. K.; Lindon, J. C. Systems biology: Metabonomics. Nature 2008, 455, 1054-1056.
9. Shariff, M. I.; Ladep, N. G.; Cox, I. J.; Williams, H. R.; Okeke, E.; Malu. et al. Characterization of urinary biomarkers of hepatocellular carcinoma using magnetic resonance spectroscopy in a Nigerian population. J. Proteome Res. 2010, 9, 1096-1103.
10. Shariff, M. I.; Gomaa, A. I.; Cox, I. J.; Patel, M.; Williams, H. R.; Crossey, M. M. et al. Urinary metabolic biomarkers of hepatocellular carcinoma in an Egyptian population: a validation study. J. Proteome Res. 2011, 10, 1828-1836.
11. Ladep, N. G.; Dona, A. C.; Lewis, M. R.; Crossey, M. M.; Lemoine, M.; Okeke, E. et al. Discovery and validation of urinary metabotypes for the diagnosis of hepatocellular carcinoma in West Africans. Hepatology 2014, 60, 1291-1301.
12. Child, C. G.; Turcotte, J. G. Surgery and portal hypertension. Major Probl. Clin. Surg. 1964, 1, 1-85.
13. Pugh, R. N.; Murray-Lyon, I. M.; Dawson, J. L.; Pietroni, M. C.; Williams, R. Transection of the oesophagus for bleeding oesophageal varices. Br. J. Surg. 1973, 60, 646-649.
19

14. Beckonert, O.; Keun, H. C.; Ebbels, T. M.; Bundy, J.; Holmes, E.; Lindon, J. C.; Nicholson, J. K. Metabolic profiling, metabolomic and metabonomic procedures for NMR spectroscopy of urine, plasma, serum and tissue extracts. Nat. Protoc. 2007, 2, 2692-2703.
15. Clayton, T. A.; Baker, D.; Lindon, J. C.; Everett, J. R.; Nicholson, J. K. Pharmacometabonomic identification of a significant host-microbiome metabolic interaction affecting human drug metabolism. Proc. Natl. Acad. Sci. U. S. A. 2009, 106, 14728-14733.
16. Holmes, E.; Foxall, P. J.; Spraul, M.; Farrant, R. D.; Nicholson, J. K.; Lindon, J. C. 750 MHz 1H NMR spectroscopy characterisation of the complex metabolic pattern of urine from patients with inborn errors of metabolism: 2-hydroxyglutaric aciduria and maple syrup urine disease. J. Pharm. Biomed. Anal. 1997, 15, 1647-1659.
17. Wishart, D. S.; Tzur, D.; Knox, C.; Eisner, R.; Guo, A. C.; Young, N.; Cheng, D. et al. HMDB: the Human Metabolome Database. Nucleic Acids Res. 2007, 35, D521-6.
18. Warburg, O.; Posener, K.; Negelein, E. Ueber den stoffwechsel der tumoren. Biochem. Z. 1924, 152, 319-344.
19. Warburg, O. The effect of hydrogen peroxide on cancer cells and on embryonic cells. Acta Unio Int. Contra. Cancrum 1958, 14, 55-57.
20. Bollard, M. E.; Contel, N. R.; Ebbels, T. M.; Smith, L.; Beckonert, O.; Cantor, G. H. et al. NMR-based metabolic profiling identifies biomarkers of liver regeneration following partial hepatectomy in the rat. J. Proteome Res. 2010, 9, 59-69.
21. Chen, J.; Wang, W.; Lv, S.; Yin, P.; Zhao, X.; Lu, X. et al. Metabonomics study of liver cancer based on ultra performance liquid chromatography coupled to mass spectrometry with HILIC and RPLC separations. Anal. Chim. Acta 2009, 650, 3-9.
22. Barr, D. B.; Wilder, L. C.; Caudill, S. P.; Gonzalez, A. J.; Needham, L. L.; Pirkle, J. L. Urinary creatinine concentrations in the U.S. population: implications for urinary biologic monitoring measurements. Environ. Health Perspect. 2005, 113, 192-200.
23. Brumm, C.; Schulze, C.; Charels, K.; Morohoshi, T.; Klöppel, G. The significance of alpha‐fetoprotein and other tumour markers in differential immunocytochemistry of primary liver tumours. Histopathology 1989, 14, 503-513.
24. Schachter, D.; Taggart, J. V. Benzoyl coenzyme A and hippurate synthesis. J. Biol. Chem. 1953, 203, 925-934.
25. Nicholson, J. K.; Holmes, E.; Wilson, I. D. Gut microorganisms, mammalian metabolism and personalized health care. Nat. Rev. Microbiol. 2005, 3, 431-438.
26. Rechner, A. R.; Kuhnle, G.; Bremner, P.; Hubbard, G. P.; Moore, K. P.; Rice-Evans, C. A. The metabolic fate of dietary polyphenols in humans. Free Radic. Biol. Med. 2002, 33, 220-235.
20

27. Williams, H. R.; Cox, I. J.; Walker, D. G.; Cobbold, J. F.; Taylor-Robinson, S. D.; Marshall, S. E.; Orchard, T. R. Differences in gut microbial metabolism are responsible for reduced hippurate synthesis in Crohn's disease. BMC Gastroenterol. 2010, 10, 108-230X-10-108.
28. Williams, H. R.; Cox, I. J.; Walker, D. G.; North, B. V.; Patel, V. M.; Marshall, S. E. et al. Characterization of inflammatory bowel disease with urinary metabolic profiling. Am. J. Gastroenterol. 2009, 104, 1435-1444.
29. Slupsky, C. M.; Cheypesh, A.; Chao, D. V.; Fu, H.; Rankin, K. N.; Marrie, T. J. et al. Streptococcus pneumoniae and Staphylococcus aureus pneumonia induce distinct metabolic responses. J. Proteome Res. 2009, 8, 3029-3036.
30. Chassaing, B.; Etienne‐Mesmin, L.; Gewirtz, A. T. Microbiota‐liver axis in hepatic disease. Hepatology. 2014, 59, 328-339.
21
TABLES
Table 1. UK patient demographics.
Characteristic HCC Cirrhosis p-value
N 13 25
Median age (range) (years) 61 (29 – 82) 58 (28 – 79) 0.55a
Male n (%) 11 (85%) 14 (56%) 0.26b
Median body mass index (kg/m2) 25.9 27.3 0.23a
Child-Pugh A 4 (40%) 17 (74%)
Child-Pugh B 3 (30%) 4 (17%)
Child-Pugh C 1 (10%) 2 (9%)
Non-cirrhotic 2 (20%) 0
Unknown due to insufficient data 3 2
Key: aMann-Whitney test for non-parametric data, bFisher’s exact test for categorical data.
Table 2. Barcelona Clinic Liver Cancer stages of hepatocellular carcinoma.
Stage Number
A 3 (30%)
B 0
C 5 (50%)
D 2 (20%)
Unknown due to insufficient data 3 (30%)
Total 13
Serum biochemical analysis
22

Table 3. Discriminatory metabolites comparison between subject cohorts.
Discriminatory metabolite HCC median
(arbitrary units)
Cirrhosis median
(arbitrary units)
p-values
↑ Carnitine (3.24 ppm) 1.16 x 10⁷ 9.37 x 10⁶ 0.31
↑ Formate (8.5 ppm) 6.36 x 10⁶ 3.13 x 10⁶ 0.44
↓ Citrate doublet (2.56 ppm) 4.65 x 10⁷ 7.33 x 10⁷ 0.21
↓ Citrate doublet (2.68 ppm) 5.39 x 10⁷ 7.20 x 10⁷ 0.25
↓ Hippurate (3.97 ppm) 4.25 x 10⁷ 4.68 x 10⁷ 0.52
↓ Hippurate (7.56 ppm) 3.94 x 10⁶ 4.45 x 10⁶ 0.69
↓ p-cresol sulphate (2.35 ppm) 1.15 x 10⁷ 2.61 x 10⁷ 0.06*
↓ p-cresol sulphate (7.21 ppm) 6.68 x 10⁶ 1.32 x 10⁷ 0.04*
↓ Creatinine methyl (3.05 ppm) 4.50 x 10⁸ 5.01 x 10⁸ 0.26
↓ Creatinine methylene (4.06 ppm) 2.83 x 10⁸ 3.62 x 10⁸ 0.03*
p-values calculated using Mann-Whitney tests of significance.
FIGURES
23

Figure 1. Median value scatter plots of discriminatory variables.
p-values calculated using Mann-Whitney tests of significance.
24

Figure 1. continued.
25
Figure 2a. Comparison of median spectra of creatinine (4.06 ppm).
26

Figure 2b. Comparison of median spectra of p-cresol sulphate (7.21 ppm).
27