Abstract - University Of Illinois · Cecco, Sinead F arrington, Diego T onelli, Cheng-Jun Lin,...
161
Transcript of Abstract - University Of Illinois · Cecco, Sinead F arrington, Diego T onelli, Cheng-Jun Lin,...

2007 Christopher Phillip Marino

MEASUREMENT OF THE CP ASYMMETRY IN SEMIMUONIC B DECAYSPRODUCED IN PP COLLISIONS AT pS = 1:96 TEVBYCHRISTOPHER PHILLIP MARINOB.S., University of Memphis, 2000B.A., University of Memphis, 2000M.S., University of Illinois at Urbana-Champaign, 2002
DISSERTATIONSubmitted in partial ful�llment of the requirementsfor the degree of Do tor of Philosophy in Physi sin the Graduate College of theUniversity of Illinois at Urbana-Champaign, 2007Urbana, IllinoisDo toral Committee:Professor Mats Selen, ChairProfessor Kevin Pitts, Dire tor of Resear hProfessor John Sta kProfessor Matthias Grosse Perdekamp

Abstra tWe measure the asymmetry between positive and negative same-sign muon pairs originatingfrom semileptoni de ays of pairs of B hadrons. Low transverse momentum dimuon pairs areevaluated to determine B hadron ontent using a log likelihood �t to two-dimensional impa t pa-rameter signi� an e templates. Corre tions are made for asymmetries arising from the dete tor,trigger, and hadrons whi h are re onstru ted as muons. Using 1.1 million muon pairs from data orresponding to an integrated luminosity of 1.6 fb�1, we �nd 210,000 same-sign muon pairswith both muon andidates oming from B de ays. After orre tions, we measure a semileptoni asymmetry from neutral B mixing of ASL = 0:0080� 0:0090(stat)� 0:0068(syst). This asym-metry an be interpreted as a onstraint on the omplex phase of the CKM matrix element Vtsby using the B0 neutral mixing ontribution measured at the B fa tories. We measure the CPviolating asymmetry from Bs mixing to be AsSL = 0:020� 0:028.
ii

For by Him all things were reated, both in the heavens and on earth, visible and invisible... Heis before all things, and in Him all things hold together.
iii
A knowledgmentsI would like to thank Vya heslav Krutelyov for his assistan e in determining the trigger eÆ ien iesfor our spe i� requirements in this analysis. Thanks to Alberto Annovi, Stefano Torre andPaolo Giromini for providing Herwig templates and other ross- he ks of this analysis. I alsothank Jonathan Lewis, Paolo Giromini, Petar Maksimovi , Sandro De Ce o, Sinead Farrington,Diego Tonelli, Cheng-Jun Lin, Manfred Paulini, and Mar o Res igno who provided thoughtfulassistan e in evaluating and he king the analysis methods. Thanks to Mike Kasten, JonathanLewis, Tom Wright, and Simone Donati for helping to ommission the Tra k Trigger Upgradeproje t.I appre iate the University of Illinois for giving me the opportunity and experien e of om-pleting this do toral thesis. Thanks to Wendy Wimmer, Donna Guzy, Rene Dunham, and TonyaAyers for helping me to navigate all the details of funding and university requirements. Thanksto Professor Jim Wolfe for helping me manage a very ne essary semester o� without gettingo� tra k. I would also like to thanks fellow grad students Andrea Esler, Peter Doksus, UlyssesGrundler, Jim Kraus, Ed Rodgers, Ali e Bridgeman, Sarah Budd, and Greg Thompson for theirhelp and sympathy in lasswork, analysis resear h, hardware ommisioning and maintaining san-ity. This thesis was also supported in part by the United States Department of Energy undergrant DE-FG02-91ER40677.I would like to thank my advisor, Kevin Pitts, for all the time, insight and en ouragementhe invested in my resear h at the University of Illinois. I would ertainly never have survivedthe diÆ ulties of a large ollaboration and learning so many new things all at on e without hisdire tion, steadiness, and pra ti ality. It his ertainly to his redit to have advised one who knewso little about elementary parti le physi s and omputer programming to the ompletion of adissertation whi h drew so heavily on both.Thanks to Anyes Ta�ard who helped me get on my feet in understanding CDF software andiv

data, and who also provided so mu h assistan e with the XTRP and Tra k Trigger Upgrade.Thanks to Heather Gerberi h for many enjoyable talks and rallying round to help me ompletethe �nal pie es of the analysis and do umentation. I also appre iate Olga Norniella taking overthe XTRP maintanen e so I ould write this thesis.My family has been a great support in the pro ess of oming to and surviving graduates hool. Despite the fa t that they rarely had any idea what I was talking about, they listenedto my progess, and they en ouraged and prayed for me. My mom and dad have providedwisdom, perspe tive, and joy. My daughter Ruth while not a tually ontributing materially, andsometimes depriving me of mu h needed sleep has, however, been a sour e of delight, pride, andmotivation for eÆ ien y.My lovely bride Damaris has been a great strength, a faithful prayer, and a loving en our-ager. She has endured mu h un ertainty, many inopportune XTRP pages, and an often aptioushusband. I truly appre iate her belief in my abilities, her patien e with me, and her ful�llmentof her promise to share all my sorrows and all my joys.
v

Table of ContentsList of Tables . . . . . . . . . . . . . . . . . . . . . . . . . . . . . . . . . . . . . . . ixList of Figures . . . . . . . . . . . . . . . . . . . . . . . . . . . . . . . . . . . . . . . xiChapter 1 Introdu tion . . . . . . . . . . . . . . . . . . . . . . . . . . . . . . . . 11.1 Fundamental Parti les . . . . . . . . . . . . . . . . . . . . . . . . . . . . . . . . . 11.2 The Standard Model . . . . . . . . . . . . . . . . . . . . . . . . . . . . . . . . . . 21.3 The CKM Matrix . . . . . . . . . . . . . . . . . . . . . . . . . . . . . . . . . . . . 31.4 Neutral Meson Mixing . . . . . . . . . . . . . . . . . . . . . . . . . . . . . . . . . 71.4.1 B Meson Mixing . . . . . . . . . . . . . . . . . . . . . . . . . . . . . . . . 71.4.2 Mixing Formalism . . . . . . . . . . . . . . . . . . . . . . . . . . . . . . . 71.4.3 Time-integrated Mixing Parameter . . . . . . . . . . . . . . . . . . . . . . 101.5 CP Violation . . . . . . . . . . . . . . . . . . . . . . . . . . . . . . . . . . . . . . 111.5.1 CP Violation in K Mesons . . . . . . . . . . . . . . . . . . . . . . . . . . 121.5.2 CP Violation in B Mesons . . . . . . . . . . . . . . . . . . . . . . . . . . 121.5.3 CP Violating Phase of Vts . . . . . . . . . . . . . . . . . . . . . . . . . . . 131.6 bb Pair Produ tion . . . . . . . . . . . . . . . . . . . . . . . . . . . . . . . . . . . 15Chapter 2 Experimental Apparatus . . . . . . . . . . . . . . . . . . . . . . . . . 172.1 The Tevatron . . . . . . . . . . . . . . . . . . . . . . . . . . . . . . . . . . . . . . 172.1.1 Proton Produ tion . . . . . . . . . . . . . . . . . . . . . . . . . . . . . . . 172.1.2 Antiproton A umulation . . . . . . . . . . . . . . . . . . . . . . . . . . . 182.1.3 Collisions and Luminosity . . . . . . . . . . . . . . . . . . . . . . . . . . . 192.2 CDF Dete tor . . . . . . . . . . . . . . . . . . . . . . . . . . . . . . . . . . . . . . 202.2.1 Dete tor Overview . . . . . . . . . . . . . . . . . . . . . . . . . . . . . . . 212.2.2 Coordinate System . . . . . . . . . . . . . . . . . . . . . . . . . . . . . . . 222.2.3 Tra king Systems . . . . . . . . . . . . . . . . . . . . . . . . . . . . . . . . 232.2.4 Muon Systems . . . . . . . . . . . . . . . . . . . . . . . . . . . . . . . . . 282.2.5 Other Dete tor Components . . . . . . . . . . . . . . . . . . . . . . . . . . 312.3 CDF Trigger System . . . . . . . . . . . . . . . . . . . . . . . . . . . . . . . . . . 322.3.1 Level 1 . . . . . . . . . . . . . . . . . . . . . . . . . . . . . . . . . . . . . 342.3.2 Level 2 . . . . . . . . . . . . . . . . . . . . . . . . . . . . . . . . . . . . . 362.3.3 Level 3 . . . . . . . . . . . . . . . . . . . . . . . . . . . . . . . . . . . . . 37Chapter 3 Tra k Trigger Upgrade . . . . . . . . . . . . . . . . . . . . . . . . . . 383.1 Motivation . . . . . . . . . . . . . . . . . . . . . . . . . . . . . . . . . . . . . . . 383.2 XTRP . . . . . . . . . . . . . . . . . . . . . . . . . . . . . . . . . . . . . . . . . . 383.3 Run 2A Two Tra k Trigger . . . . . . . . . . . . . . . . . . . . . . . . . . . . . . 393.4 Three Tra k Trigger Board . . . . . . . . . . . . . . . . . . . . . . . . . . . . . . 413.4.1 Three Tra k pT Mapping . . . . . . . . . . . . . . . . . . . . . . . . . . . 42vi

3.4.2 Three Tra k � Mapping . . . . . . . . . . . . . . . . . . . . . . . . . . . . 423.5 Transverse Mass . . . . . . . . . . . . . . . . . . . . . . . . . . . . . . . . . . . . 453.6 Summary . . . . . . . . . . . . . . . . . . . . . . . . . . . . . . . . . . . . . . . . 45Chapter 4 Analysis Strategy and Data Sele tion . . . . . . . . . . . . . . . . . 464.1 Introdu tion . . . . . . . . . . . . . . . . . . . . . . . . . . . . . . . . . . . . . . . 464.2 Target Physi s Pro ess . . . . . . . . . . . . . . . . . . . . . . . . . . . . . . . . . 474.3 Strategy Overview . . . . . . . . . . . . . . . . . . . . . . . . . . . . . . . . . . . 484.4 Triggered Data Sample . . . . . . . . . . . . . . . . . . . . . . . . . . . . . . . . 494.5 Cosmi Ray Finding . . . . . . . . . . . . . . . . . . . . . . . . . . . . . . . . . . 504.6 Events Sele tion . . . . . . . . . . . . . . . . . . . . . . . . . . . . . . . . . . . . 504.6.1 Trigger Obje t Con�rmation . . . . . . . . . . . . . . . . . . . . . . . . . 524.6.2 Signal �� Kinemati Distributions . . . . . . . . . . . . . . . . . . . . . . 53Chapter 5 Impa t Parameter Fitting . . . . . . . . . . . . . . . . . . . . . . . . 595.1 Impa t Parameter Signi� an e . . . . . . . . . . . . . . . . . . . . . . . . . . . . 595.2 Templates Modeling �� Sour es . . . . . . . . . . . . . . . . . . . . . . . . . . . . 615.2.1 Monte Carlo Distributions . . . . . . . . . . . . . . . . . . . . . . . . . . . 615.2.2 Prompt Distribution . . . . . . . . . . . . . . . . . . . . . . . . . . . . . 615.2.3 Data and Monte Carlo Comparisons . . . . . . . . . . . . . . . . . . . . . 645.3 Likelihood Fitter . . . . . . . . . . . . . . . . . . . . . . . . . . . . . . . . . . . . 665.4 Fit Quality . . . . . . . . . . . . . . . . . . . . . . . . . . . . . . . . . . . . . . . 695.5 Fit Results . . . . . . . . . . . . . . . . . . . . . . . . . . . . . . . . . . . . . . . 765.6 Robustness of Results . . . . . . . . . . . . . . . . . . . . . . . . . . . . . . . . . 765.6.1 Fit Variations . . . . . . . . . . . . . . . . . . . . . . . . . . . . . . . . . . 845.6.2 Data Sub-samples . . . . . . . . . . . . . . . . . . . . . . . . . . . . . . . 855.6.3 Fit-less Asymmetry Estimate . . . . . . . . . . . . . . . . . . . . . . . . . 865.6.4 Robustness Summary . . . . . . . . . . . . . . . . . . . . . . . . . . . . . 86Chapter 6 Asymmetry Corre tions . . . . . . . . . . . . . . . . . . . . . . . . . 886.1 Fake Muons Within the BB Sample . . . . . . . . . . . . . . . . . . . . . . . . . 886.1.1 Hadron Charge Asymmetry . . . . . . . . . . . . . . . . . . . . . . . . . . 886.1.2 D� Re onstru tion . . . . . . . . . . . . . . . . . . . . . . . . . . . . . . . 896.1.3 Cal ulation of Fake Rates . . . . . . . . . . . . . . . . . . . . . . . . . . . 896.1.4 The Fake Asymmetry Corre tion . . . . . . . . . . . . . . . . . . . . . . . 996.2 Instrumentation Corre tions . . . . . . . . . . . . . . . . . . . . . . . . . . . . . . 1016.2.1 Dete tor Dimuon Asymmetry . . . . . . . . . . . . . . . . . . . . . . . . . 1016.2.2 Single Muon Chamber Asymmetry . . . . . . . . . . . . . . . . . . . . . . 1036.2.3 COT Asymmetry Che ks . . . . . . . . . . . . . . . . . . . . . . . . . . . 1046.2.4 Trigger Charge Asymmetry . . . . . . . . . . . . . . . . . . . . . . . . . . 1046.3 Symmetri Ba kground Contributions to the BB Fra tion . . . . . . . . . . . . . 1056.3.1 Multiple Heavy Flavor Produ tion . . . . . . . . . . . . . . . . . . . . . . 1076.3.2 Sequential De ays . . . . . . . . . . . . . . . . . . . . . . . . . . . . . . . 107Chapter 7 Asymmetry Results . . . . . . . . . . . . . . . . . . . . . . . . . . . . 1087.1 Appli ation of Measured Corre tions . . . . . . . . . . . . . . . . . . . . . . . . . 1087.2 Systemati Error Evaluation . . . . . . . . . . . . . . . . . . . . . . . . . . . . . . 1097.3 Extra tion of Physi s Quantities . . . . . . . . . . . . . . . . . . . . . . . . . . . 1107.4 Result Synopsis . . . . . . . . . . . . . . . . . . . . . . . . . . . . . . . . . . . . . 112Chapter 8 Con lusions . . . . . . . . . . . . . . . . . . . . . . . . . . . . . . . . . 115Appendix A Glossary . . . . . . . . . . . . . . . . . . . . . . . . . . . . . . . . . 117vii

Appendix B CDF Author List . . . . . . . . . . . . . . . . . . . . . . . . . . . . 119Appendix C Impa t Parameter Signi� an e . . . . . . . . . . . . . . . . . . . . 125Appendix D Monte Carlo Samples . . . . . . . . . . . . . . . . . . . . . . . . . 126D.1 Pythia/Evtgen Samples . . . . . . . . . . . . . . . . . . . . . . . . . . . . . . . 126D.2 FakeEvent Samples . . . . . . . . . . . . . . . . . . . . . . . . . . . . . . . . . . . 127Appendix E Further Analysis Che ks . . . . . . . . . . . . . . . . . . . . . . . . 128E.1 Additional Kinemati Pro�les . . . . . . . . . . . . . . . . . . . . . . . . . . . . . 128E.2 Toy Experiments . . . . . . . . . . . . . . . . . . . . . . . . . . . . . . . . . . . . 128Appendix F Time-integrated Mixing Parameter . . . . . . . . . . . . . . . . . 136Referen es . . . . . . . . . . . . . . . . . . . . . . . . . . . . . . . . . . . . . . . . . 142Author's Biography . . . . . . . . . . . . . . . . . . . . . . . . . . . . . . . . . . . 146
viii

List of Tables1.1 Elementary building blo ks of matter. . . . . . . . . . . . . . . . . . . . . . . . . 21.2 Fundamental for e arriers of the Standard Model . . . . . . . . . . . . . . . . . 32.1 Me hani al summary of the sensor layout for the SVX-II layers. Ea h layer hasan a tive length of 72.4 mm . . . . . . . . . . . . . . . . . . . . . . . . . . . . . 272.2 Physi s parameters for the various CDF muon systems. . . . . . . . . . . . . . . 303.1 Di�eren es between the Two Tra k Board (2TT), the Three Tra k Board run intwo tra k emulation mode (3TT v0) and the Three Tra k board run in transversemass mode (3TT v1). These di�eren es are des ribed in detail in the text. . . . . 413.2 pT mapping from XFT to the Three Tra k Board. The table shows the pT valuesfor XFT pT bins 0-47, whi h orrespond to negatively harged tra ks. Positively harged tra ks are quanti�ed in bins 48-95, with 48 being high pT and 95 beingthe lowest pT (i.e.The 0-47 pT ordering is ipped for 48-95.) [46℄ The Two Tra kBoard used the pT binning provided by the XFT with no translation. . . . . . . 433.3 Corre tion in going from �SL6 to �0. For ea h range of XFT pT bins, we orre tfor tra k urvature in going from �SL6 provided by the XFT to �0 used in thetrigger lookups for 3TT v1. The bin orre tion listed here is using the 9-bit �resolution (= 1:25Æ). . . . . . . . . . . . . . . . . . . . . . . . . . . . . . . . . . . 444.1 Event sele tion for pairs of muon tra ks and stubs . . . . . . . . . . . . . . . . . 525.1 Fit results. All numbers listed in per ent. Given errors re e t statisti al un er-tainty only. . . . . . . . . . . . . . . . . . . . . . . . . . . . . . . . . . . . . . . . 765.2 Correlation oeÆ ients for ea h parameter in the minimization. Ea h data sub-sample is independent from the others. . . . . . . . . . . . . . . . . . . . . . . . . 835.3 E�e ts of Template and Fitting Variations . . . . . . . . . . . . . . . . . . . . . . 856.1 Fake rates measured in the hadron subsamples of � and PT . Un ertainties are onthe order of .03% - .05%. . . . . . . . . . . . . . . . . . . . . . . . . . . . . . . . 986.2 Fake Muon Corre tion Cases and Weights . . . . . . . . . . . . . . . . . . . . . . 1026.3 Ratios of CMUP a eptan e for �+ and �� over subsets of transverse momentum. 1036.4 Level 1 trigger eÆ ien y asymmetry . . . . . . . . . . . . . . . . . . . . . . . . . 1057.1 Systemati Un ertainties . . . . . . . . . . . . . . . . . . . . . . . . . . . . . . . . 110E.1 Toy Experiment Results: ea h experiment ontains 300k opposite-sign events and200k same-sign events split evenly between �+�+ and ����subsets. . . . . . . . 135F.1 Additional prompt (fake hadron) ba kground �t results. All numbers listed inper ent. . . . . . . . . . . . . . . . . . . . . . . . . . . . . . . . . . . . . . . . . . 139ix

F.2 �0 onstraint �t results. All numbers listed in per ent. . . . . . . . . . . . . . . 139
x

List of Figures1.1 Triangle representation of the unitarity of the CKM Matrix using � and � fromthe Wolfenstein parameterization. . . . . . . . . . . . . . . . . . . . . . . . . . . 41.2 Experimental onstraints on the �� � plane as of the 2006 PDG. . . . . . . . . 61.3 The time domain plot of BsBs os illations. Five bins of proper de ay time modulothe observed os illation period 2�=�ms. . . . . . . . . . . . . . . . . . . . . . . 81.4 One of the lowest order Feynman diagrams ontributing to Bs mixing. Also on-tributing is the box diagram with W and quark sides transposed. The pro essesare identi al for B0 mixing. . . . . . . . . . . . . . . . . . . . . . . . . . . . . . . 91.5 A ombined �t showing the results of a measurement ��s using Bs ! J= �de ays onstrained by the allowed ontours in the ��s � �s plane as determinedby the D0 measurement of AsCP . . . . . . . . . . . . . . . . . . . . . . . . . . . . 141.6 Feynman diagrams for leading order bb produ tion pro esses. Flavor reationthrough qq annihilation and gluon fusion. . . . . . . . . . . . . . . . . . . . . . . 151.7 Feynman diagrams for two next-to-leading order bb produ tion pro esses: avorex itation (a) and gluon splitting(b). . . . . . . . . . . . . . . . . . . . . . . . . 162.1 The a elerator omplex at Fermilab as used for the olle tion, a eleration, and ollision of protons and antiprotons. . . . . . . . . . . . . . . . . . . . . . . . . . 182.2 Tevatron peak instantaneous luminosity averaged between CDF and D0 from April2001 to July 2007. In reases re e t the beam division upgrades in storage, oolingand transfer of antiprotons. . . . . . . . . . . . . . . . . . . . . . . . . . . . . . . 212.3 One half of the CDF-II dete tor from an elevation view. The various sub-dete torsystems are symmetri both azimuthally and forward-ba kward. . . . . . . . . . 222.4 One quadrant of the CDF dete tor tra king layout whi h is en losed by the solenoidand the forward alorimetry. . . . . . . . . . . . . . . . . . . . . . . . . . . . . . 242.5 COT layout: 1/6 of an endplate(left), and wires in a super ell(right). . . . . . . 252.6 Layout of the sili on dete tors: side-view of the dete tors not drawn to s ale (left),and end-view of the dete tors entered around the beamline (right). . . . . . . . 272.7 Muon dete tor overage in � and � for the CDF muon hambers. . . . . . . . . 292.8 Digram of the data a quisition system for the CDF-II trigger. . . . . . . . . . . 342.9 Various trigger paths for output from the major dete tor omponents in the CDFLevel 1 and Level 2 trigger systems. . . . . . . . . . . . . . . . . . . . . . . . . . 363.1 An example of the \two tra ks per wedge" limitation in going from the XTRPDataboards to the Two/Three Tra k board. In this ase, there are three XFTtra ks in a single 15Æ wedge. Although the middle tra k of the three has higherpT , only the outer two tra ks (the two 5GeV tra ks) are sent to the tra k triggerboard. Only four-layer XFT tra ks above 2GeV are used in this algorithm. . . . 40xi

4.1 Triggered events meeting the sele tion requirements are in luded in these plotswith the d0 of ea h muon along one axis. The top plot does not in lude the Æ� osmi reje tion, and osmi ray events are visible along the d10 = d20 diagonal.The bottom plot shows the same data after the osmi reje tion. . . . . . . . . . 514.2 Signal dimuon andidate kinemati distributions for all muon andidate pairs pass-ing analysis uts: (top) PT of both muons, and (bottom) PT pro�le over d0 range.(The pro�le is the average d0 for all pairs in a parti ular PT bin.) . . . . . . . . . 544.3 Signal dimuon andidate kinemati distributions for all muon andidate pairs pass-ing analysis uts (does not in lude same-sign pairs in the � mass region): (top)Invariant mass, and (bottom) Invariant mass pro�le over d0 range. (The pro�le isthe average d0 for all pairs in a parti ular mass bin.) . . . . . . . . . . . . . . . . 554.4 Signal dimuon andidate kinemati distributions for all muon andidate pairs pass-ing analysis uts: (top)Æ(�) and (bottom) Æ(Z0) between the pair. . . . . . . . . 564.5 (top) Proje tion of impa t parameter distribution, and (bottom) Distribution ofimpa t parameter error for all muon andidate pairs passing analysis uts. . . . . 574.6 Dimuon andidate impa t parameter signi� an e distribution for all same-sign andopposite-sign pairs passing analysis uts. One muon andidate is plotted alongea h axis. . . . . . . . . . . . . . . . . . . . . . . . . . . . . . . . . . . . . . . . . 585.1 Example of a typi al tra k impa t parameter from B de ay. . . . . . . . . . . . 605.2 1D Proje tions of the dimuon d0=�(d0) templates for ea h of the following tem-plates: (a)both muons originate from a B hadron, (b)one muon is from B and oneis a prompt tra k, (b)both muons originate from a C hadron, and where (d)onemuon is from C and one is a prompt tra k. . . . . . . . . . . . . . . . . . . . . . 625.3 Dimuon d0=�(d0) templates for ea h of the following templates: (a)both muonsoriginate from a B hadron, (b)one muon is from B and one is a prompt tra k,(b)both muons originate from a C hadron, and where (d)one muon is from C andone is a prompt tra k. . . . . . . . . . . . . . . . . . . . . . . . . . . . . . . . . . 635.4 �! �+�� invariant mass region. Events shown meet the same kinemati sele tionas the dimuon events in the asymmetry measurement, but are used instead tomodel muons from prompt sour es. . . . . . . . . . . . . . . . . . . . . . . . . . 655.5 1D Proje tion of the dimuon d0 template where both muons are prompt (derivedfrom �! �� data) . . . . . . . . . . . . . . . . . . . . . . . . . . . . . . . . . . . 665.6 Comparison of (a)d0 errors and (b)d0=�(d0) for data (blue) and MC (red) upsilons.All distributions are normalized to unit area. . . . . . . . . . . . . . . . . . . . . 675.7 Comparison of PT distributions for muons from B hadron de ays in MC (points)and data (histogram). . . . . . . . . . . . . . . . . . . . . . . . . . . . . . . . . . 685.8 Two-dimensional impa t parameter signi� an e distributions for PP (top) and�+�� (bottom) dimuon pair data. . . . . . . . . . . . . . . . . . . . . . . . . . . 705.9 Two-dimensional impa t parameter signi� an e distributions for �+�+ (top) and���� (bottom) dimuon pair data. . . . . . . . . . . . . . . . . . . . . . . . . . . 715.10 Opposite-sign (top) and ombined same-sign (bottom) �tted proje tions of outputfra tions ompared to data on log and linear s ale . . . . . . . . . . . . . . . . . 725.11 Ea h graph represents the �3� s an of the free parameters after minimization foropposite sign: PP ,BB, and PB. All show good paraboli minimums. . . . . . . 735.12 Ea h graph represents the �3� s an of the free parameters after minimization for�+�+: PP ,BB, and PB. All show good paraboli minimums. . . . . . . . . . . 745.13 Ea h graph represents the �3� s an of the free parameters after minimization for����: PP ,BB, and PB. All show good paraboli minimums. . . . . . . . . . . 755.14 The top plot is a omparison of the total �tted omponent ontribution omparedto the data (y-proje tion) for �+�� �t on a linear s ale. The bottom plot is the�+�� data minus the total �t in ea h proje ted bin divided by the un ertainty. 77xii

5.15 The top plot is a omparison of the total �tted omponent ontribution omparedto the data (x-proje tion) for �+�� �t on a log s ale. The bottom plot is the�+�� data minus the total �t in ea h proje ted bin divided by the un ertainty. 785.16 The top plot is a omparison of the total �tted omponent ontribution omparedto the data (y-proje tion) for �+�+ �t on a linear s ale. The bottom plot is the�+�+ data minus the total �t in ea h proje ted bin divided by the un ertainty. 795.17 The top plot is a omparison of the total �tted omponent ontribution omparedto the data (x-proje tion) for �+�+ �t on a log s ale. The bottom plot is the�+�+ data minus the total �t in ea h proje ted bin divided by the un ertainty. 805.18 The top plot is a omparison of the total �tted omponent ontribution omparedto the data (y-proje tion) for ���� �t on a linear s ale. The bottom plot is the���� data minus the total �t in ea h proje ted bin divided by the un ertainty. 815.19 The top plot is a omparison of the total �tted omponent ontribution omparedto the data (x-proje tion) for ���� �t on a log s ale. The bottom plot is the���� data minus the total �t in ea h proje ted bin divided by the un ertainty. 826.1 D� �D0 �tted mass di�eren e before �nal event sele tion. . . . . . . . . . . . . 906.2 PT distributions for (a)K+, (b)K�, ( )�+ and (d)�� before D0 mass �tting . . 916.3 PT distributions for (a)K+, (b)K�, ( )�+ and (d)�� whi h are re onstru ted asmuons before D0 mass �tting . . . . . . . . . . . . . . . . . . . . . . . . . . . . . 926.4 D0 signal and ba kground mass �ts for all �� andidates passing the dimuonanalysis tra k sele tion requirements (top) and only those andidates whi h arere onstru ted as a CMUP muon (bottom). The ombined �t, and the signal andba kground �ts are all displayed. . . . . . . . . . . . . . . . . . . . . . . . . . . 946.5 D0 signal and ba kground mass �ts for all �+ andidates passing the dimuonanalysis tra k sele tion requirements (top) and only those andidates whi h arere onstru ted as a CMUP muon (bottom). The ombined �t, and the signal andba kground �ts are all displayed. . . . . . . . . . . . . . . . . . . . . . . . . . . 956.6 D0 signal and ba kground mass �ts for all K� andidates passing the dimuonanalysis tra k sele tion requirements (top) and only those andidates whi h arere onstru ted as a CMUP muon (bottom). The ombined �t, and the signal andba kground �ts are all displayed. . . . . . . . . . . . . . . . . . . . . . . . . . . 966.7 D0 signal and ba kground mass �ts for all K+ andidates passing the dimuonanalysis tra k sele tion requirements (top) and only those andidates whi h arere onstru ted as a CMUP muon (bottom). The ombined �t, and the signal andba kground �ts are all displayed. . . . . . . . . . . . . . . . . . . . . . . . . . . 976.8 Comparison of normalized PT distributions from pions and kaons in the D� datameeting analysis requirements (points) and in the B Monte Carlo used for BBtemplate (histogram). . . . . . . . . . . . . . . . . . . . . . . . . . . . . . . . . . 986.9 A omparison of the PT spe trum of the kaons faking CMUP muons from theD� data (histogram) to the MC fake kaons whi h use the analysis data muon PTspe trum (points). . . . . . . . . . . . . . . . . . . . . . . . . . . . . . . . . . . . 1006.10 Ratio of K+=K� passing sele tion uts from the D� data used in the fake rate al ulation. . . . . . . . . . . . . . . . . . . . . . . . . . . . . . . . . . . . . . . . 1056.11 Level 1 CMU muon trigger eÆ ien y as a fun tion of 1/PT for �+ (red, boxes)and �� (blue, triangles). . . . . . . . . . . . . . . . . . . . . . . . . . . . . . . . 1067.1 This result shown in the �s-��s plane. The lines represent the entral value, thegreen region is the 68% allowed ontour. . . . . . . . . . . . . . . . . . . . . . . 114C.1 The fra tional ontributions as determined by the likelihood �t are sta ked and ompared to the ombined same-sign dimuon data set. . . . . . . . . . . . . . . 125xiii

E.1 Signal dimuon kinemati distributions for all muon andidates pairs passing anal-ysis uts: (top)Z0 pro�le over d0 and (bottom)Æ(Z0). . . . . . . . . . . . . . . . 129E.2 Signal dimuon kinemati distributions for all muon andidates pairs passing anal-ysis uts: (top)� pro�le over d0 and (bottom)Æ(�). . . . . . . . . . . . . . . . . . 130E.3 Signal dimuon kinemati distributions for all muon andidates pairs passing anal-ysis uts: (top)� pro�le over d0 and (bottom)Æ(�). . . . . . . . . . . . . . . . . . 131E.4 Pull distributions for �+�� �tting of BB, PB, PP , and CC. . . . . . . . . . . 132E.5 Pull distributions for �+�+ �tting of BB, PB, PP , and CC. . . . . . . . . . . 133E.6 Pull distributions for ���� �tting of BB, PB, PP , and CC. . . . . . . . . . . 134E.7 Pull distribution for the �tted raw asymmetry . . . . . . . . . . . . . . . . . . . . 135F.1 Normalized OS(histogram) and SS(points) proje tion of data . . . . . . . . . . . 138F.2 Fit results for ross- he k ontaining an additional prompt (fake hadron) ba k-ground. . . . . . . . . . . . . . . . . . . . . . . . . . . . . . . . . . . . . . . . . . 140F.3 Fit results for ross- he k onstraining �0 . . . . . . . . . . . . . . . . . . . . . . 141
xiv

Chapter 1Introdu tionThe study of b quark physi s began with dis overy of the � meson at Fermi National LaboratoryA elerator (Fermilab) in Batavia, Illinois in 1977 [1℄. The b quark is unique and interestingin that it is both massive and omparatively long-lived. Measured to be on the order of 100times heavier than the similar d quark, and nearly 5 times as massive as a proton, the b annotde ay within its quark family, i.e. to the more massive top. Thus it must de ay via the weakintera tion, generally to harm, giving it a long, observable lifetime.B mesons are bound states of a b quark and a lighter quark. B de ays an provide informationabout �ve of nine elements of the Cabibbo-Kobayashi-Maskawa (CKM) matrix whi h governs avor- hanging weak de ays, and CP violation is expe ted to be large for a number of B de aymodes some of whi h have now been observed. This thesis presents a measurement of CPasymmetry in B de ays. This measurement helps onstrain a omplex phase of CKM matrixelement whi h has not been well probed. A value in onsistent with zero would be an indi ationof CP violation beyond the physi s of des ribed by the Standard Model.1.1 Fundamental Parti lesThough questions and theories on erning the fundamental building blo ks of matter date topthe an ient Greek philosophers, the modern subje t of elementary parti le physi s is said tohave begun with J.J. Thompson's observation of the ele tron in 1897. During the followingde ades new parti les were dis overed - mostly in osmi ray experiments - and the theory ofquantum ele trodynami s was developed by Dira . This theory laid the theoreti al foundationto an understanding of elementary parti le physi s and predi ted the existen e of antimatterwhi h was observed shortly thereafter. In the 1950s parti le a elerators and new dete tors werebeing developed. Even more new parti les were dis overed leading to un ertainty as to whether1

so many ould be really fundamental. In 1961, Murray Gell-Mann and George Zweig organizedthe known baryons in a way that suggested they were all omposed of a few true, as of yetunobserved, fundamental parti les whi h Gell-Mann named quarks [2℄. Like Dira 's predi tionof the positron, the quark theory predi ted the existen e of a new baryon, the �, and it wasdis overed several years later. After this, the existen e of additional quarks were observed, thetheory of quantum ele trodynami s(QED) [3℄ was expanded to in lude the weak intera tion,and quantum hromodynami s(QCD) [4℄, governing strong intera tions, was developed. Theseideas and dis overies ame together to form the Standard Model of parti le physi s whi h hasbeen highly su essful in des ribing almost all experimental observations in elementary parti lephysi s. The Standard Model has survived years of pre ision testing at the highest availableenergies, and in 1995 the top quark it predi ted was observed at Fermilab.1.2 The Standard ModelThe Standard Model of parti le physi s des ribes all matter as onstru ted from twelve elemen-tary parti les - six quarks and six leptons. These quarks and leptons are fermions with spin valuesof 12 . They an be grouped into three generations or families as is shown in Table 1.1 whi h liststheir properties. The leptons ea h arry integral ele tri harge, 0 or 1, while the quarks arry afra tional harge of either + 23 or � 13 (in units of the harge of the ele tron, e). Ea h parti le hasa orresponding antiparti le with the same mass and lifetime but opposite harge and magneti moment.Parti le Charge 1st generation 2nd generation 3rd generationquarks + 23 up, u harm, top, t� 13 down, d strange, s bottom, bleptons �1 ele tron, e muon, � tau, �0 ele tron neutrino, �e muon neutrino, �� tau neutrino, ��Table 1.1: Elementary building blo ks of matter.Intera tions between parti les are governed by nature's four fundamental for es. The ele tro-magneti for e and the weak for e an be des ribed by a quantum �eld theory with lo al gauge2

invarian e. The uni�ed ele troweak model, QED, and a orresponding gauge theory des ribingthe strong for e, QCD, form the basis for Standard Model intera tions. For es are mediated by arriers alled gauge bosons whi h arise from the framework of the gauge theories; the arriersare listed in Table 1.2. Gravity, the weakest of the fundamental for es is not des ribed by theStandard Model be ause no su h theory has yet been established for gravity.For e Carrier Spin/ParityEle tromagneti photon, 1�Weak W� 1�Z0 1+Strong gluon, g 1�Table 1.2: Fundamental for e arriers of the Standard ModelIn addition to the omission of gravity, other questions persist despite the overwhelming su essof the Standard Model. For example, the origin of mass, and the existen e of neutrino mass hasnot been des ribed by the Standard Model. Also, there is no me hanism to fully a ount for theasymmetry of matter and antimatter evident in our universe - as dis ussed further in Se tion 1.5- providing motivation to sear h for CP asymmetry beyond the Standard Model.1.3 The CKM MatrixThe quark mixing matrix found in the Standard Model Lagrangian, alled the Cabibbo-Kobayashi-Maskawa(CKM) matrix, VCKM is a 3 � 3 unitary matrix [5, 6℄. The CKM matrix representsweak eigenstates whi h are rotated avor eigenstates, and the matrix elements are the intera tion ouplings of the weak boson W� to the quarks,VCKM = 0BBBB� Vud Vus VubV d V s V bVtd Vts Vtb 1CCCCA : (1.1)The CKM matrix is parameterized using the four free parameters determined by its unitarity. Astandard parameterization hoi e uses three mixing angles �12, �13, and �23 and a omplex phaseresponsible for CP violation, Æ. Using the abbreviations sij = sin �ij and ij = os �ij the CKMmatrix an be written as [7℄, 3

VCKM = 0BBBB� 12 13 s12 13 s13e�iÆ�s12 23 � 12s23s13e�iÆ 12 23 � s12s23s13e�iÆ s23 13s12s23 � 12 23s13e�iÆ � 12s23 � s12 23s13e�iÆ 23 13 1CCCCA : (1.2)Another parameterization was suggested by Wolfenstein [8℄. This representation is motivatedby experimental eviden e that the matrix elements were on the order of di�erent powers of theCabibbo angle, � . The parameters A,�,�, and � are free inputs determined by experiment whereVCKM = 0BBBB� 1� �2=2 � A�3(�� i�)�� 1� �2=2 A�2A�3(1� �� i�) �A�2 1 1CCCCA+O(�4): (1.3)The Wolfenstein parameterization is an approximation but is orre t to the order �4 where� = sin(� ) ' 0:22 [9℄. Figure 1.1 shows the most ommonly used triangle onstru ted using theWolfenstein parameterization and the unitarity ondition given by equation 1.4 [10℄.VudV �ub + V dV � b + VtdV �tb = 0 (1.4)
Figure 1.1: Triangle representation of the unitarity of the CKM Matrix using � and � from theWolfenstein parameterization. 4

The CKM matrix is essential to understanding ele troweak b physi s, and in parti ular itmakes parti le-antiparti le os illations possible [11℄. One major goal of avor physi s to measureand onstrain the CKM elements whi h de�ne fundamental Standard Model parameters. Currentexperimental onstraints on the CKM parameters in the unitary triangle plane are shown inFigure 1.2. The un ertainty for all of the measurements displayed in Figure 1.2 is dominatedby theoreti al rather than experimental un ertainty with the ex eption of sin 2�. A number ofexperiments have measured sin 2�, but the most pre ise ones have ome re ently from the Bfa tories [12℄. In Figure 1.2 the ombined world average of sin 2� pla es a onstraint on theCKM angle � whi h is shown as a shaded ray with its un ertainty along the right triangle side.Here � = �1 = arg��V dV � bVtdV �tb � (1.5)as shown in Figure 1.1. Similarly, the world average measured values of the neutral B mixing massdi�eren es1, �md and �ms are displayed as an annulus in Figure 1.2 with their un ertainties onstraining the length on the same side of the unitary triangle [13℄.Lifting the onstraints of the Standard Model in reases the parameters whi h would des ribethe various mixing measurements. One standard example is that of a fourth generation. If thereare fundamental and unobserved quarks and leptons, there is no reason for the urrent CKMmatrix to be unitary. By ombining a number of measurements in manner shown in Figure 1.2,CKM unitarity an be over- onstrained giving an indi ation of the existen e of physi s beyondthe Standard Model.In regard to onstraining the CKM matrix, this dissertation is on erned primarily with the omplex phase of Vts. In the Standard Model this is expe ted to be very small and does noteven appear to the order �3 in the ommonly used Wolfenstein CKM parameterization. However,from the full parameterization it an be seen that a omplex phase is expe ted, and ontributionsfrom beyond the Standard Model may ause the phase to be larger than expe tations. Sin e the omplex phase of Vts is poorly onstrained it is a promising pla e to sear h for new physi s.1Des ribed in Se tion 1.45

-1.5
-1
-0.5
0
0.5
1
1.5
-1 -0.5 0 0.5 1 1.5 2
sin 2β
sol. w/ cos 2β < 0(excl. at CL > 0.95)
excluded at CL > 0.95
γ
γ
α
α
∆md
∆ms & ∆md
εK
εK
|Vub/Vcb|
sin 2β
sol. w/ cos 2β < 0(excl. at CL > 0.95)
excluded at CL > 0.95
α
βγ
ρ
η
excluded area has CL > 0.95
Figure 1.2: Experimental onstraints on the �� � plane as of the 2006 PDG.6

1.4 Neutral Meson MixingIn 1956, Lande at Brookhaven found the long lived weak eigenstate kaon predi ted by thequantum-me hani al mixing developed by Gell-Mann and Pais the previous year [9, 14, 15℄.In addition to neutral kaon mixing, B0B0 and B0sB0s meson pairs also os illate, where B0 = jbdiand B0s = jbsi. Neutral D meson mixing, expe ted to be very small in the Standard Model, wasthought for some time to be absent entirely or perhaps too small to be observable due to theCabibbo suppression of the D meson os illation pro esses but not of D meson de ay pro esses[10, 16℄. However, the some re ent publi ations suggest eviden e for D0�D0 os illations [17, 18℄.1.4.1 B Meson MixingNeutral B mesons have been observed by several high energy experiments and measured to veryhigh pre ision [10℄. Bs mesons have been known to os illate very qui kly for sometime, buthad not until re ently been measured. In 2006 D0 reported the �rst bound on the Bs mixingfrequen y [19℄, and a few months later CDF observed Bs os illations and measured jVtsj withhigh experimental pre ision [20℄. The magnitude of B meson avor mixing was an importantparameter to measure for theoreti al aspe ts of the Standard Model, and its determination wasone of the major goals of the Tevatron Run II physi s program. In the CDF measurement of Bsmixing frequen y (shown in Figure 1.3), only the magnitude of CKM element jVtsj is determinedand the omplex phase due to CP violation is not onstrained.1.4.2 Mixing FormalismAs in the neutral kaon system, the o� diagonal matrix elements ause avor hanging and givenonzero ontributions for B0 ! B0 and B0s ! B0s. Se ond-order W -ex hange pro esses areresponsible for neutral this mixing in the Standard Model (see example in Figure 1.4). Mixingprobability is derived by de�ning eigenstates of a standard mixing Hamiltonian de�ned asM� i2�and allowing them to evolve in time as in [9, 21℄. The states are identi�ed as heavy, H , and light,L. jBHi = p jB0i � q jB0ijBLi = p jB0i+ q jB0i (1.6)7

[ps]sm∆/πDecay Time Modulo 20 0.05 0.1 0.15 0.2 0.25 0.3 0.35
Fitt
ed A
mpl
itude
-2
-1
0
1
2
data
cosine with A=1.28
CDF Run II Preliminary -1L = 1.0 fb
Figure 1.3: The time domain plot of BsBs os illations. Five bins of proper de ay time modulothe observed os illation period 2�=�ms.8

Figure 1.4: One of the lowest order Feynman diagrams ontributing to Bs mixing. Also on-tributing is the box diagram with W and quark sides transposed. The pro esses are identi al forB0 mixing.This is the most general hara terization of B0 mixing eigenstates2, but of interest is the limitq = p = 1p2 where CP is invariant3 and the ve tors are normalized. In luding de ay probabilityand phase time dependen e in a state initially B0, at time t the state is de�ned asj(t)i = 1p2 (e�imLt�t=2�L jBLi + e�imHt�t=2�H jBHi ) (1.7)where mL, and mH are masses of ea h state, and �L, �H are the lifetimes. Now the probabilityof mixing an be found by taking jhB0j(t)ij2. De�ning �m = mH �mL and � = (�H +�L)=2,where �H is the de ay width equal to 1=�H , we haveProb(B0 ! B0; t) = 12e��t[1� os(�mt)℄ (1.8)This equation in ludes the assumptions that CP violation in the mixing is small and thelifetime di�eren e �� = �H � �L is negligible. In the Standard Model ��=� for the Bd systemis expe ted to be below 1%, but is predi ted to be on the order of 10% for ��s=�s [10℄. Underthese assumptions, we an write�m = 2jM12j; �� = 2<(M12��12)jM12j : (1.9)2Bd mixing will be used ex lusively for now, but the Bs formalism is identi al.3CP violation will be addressed in the following se tion, but is predi ted to be small by the Standard Modeland existing measurements. 9

Then using the theoreti al al ulation for the dispersive part of the box diagram in theapproximation that the t quark dominates [22℄, the o�-diagonal element of the mass matrix isM12 = �G2Fm2W �BmB0BB0f2B012�2 S0� m2tm2W � (V �tdVtb)2 (1.10)where GF is the Fermi onstant, mW and mt the masses of the W boson and top quark, andmB0 , fB0 , and BB0 are the mass, weak de ay onstant and bag parameter of the B0 mesonrespe tively. The S0(x) is a known fun tion well approximated by 0.784x0:76, and �B is a QCD orre tion on the order of 0.6 [9, 10℄. Equations 1.9 and 1.10 an be ombined to relate the massdi�eren e to the CKM matrix elements,�md = G2Fm2W �BmB0BB0f2B06�2 S0� m2tm2W � jV �tdVtbj2: (1.11)The derivation of the mass di�eren e for B0s mixing, �ms is the same.1.4.3 Time-integrated Mixing Parameter�d is de�ned as the parameter resulting from the mixing probability being integrated over alltime. Using integration by parts �d an be simpli�ed to a form ontaining the ratio of the massdi�eren e between the weak eigenstates, �md, and average widths of the weak eigenstates, �d.The exponential de ay term ensures that �d is non-zero for �md 6= 0, and we �nd�d = x2d2(1 + x2d) : (1.12)Here xd = �md=�d, and this de�nition of �d is important for evaluating CKM matrix el-ements. �d an also be de�ned in terms of leptons produ ed through the de ay of a mixed Bhadron ompared to all leptons produ ed from b de ay�d = �(B0 ! B0 ! �+X)�(B ! �X) : (1.13)The formalism is the same to �nd the time-integrated mixing parameter for Bs mixing, �s.Averaging over avors, as both Bd and Bs are produ ed, �04 is de�ned as follows4The time-integrated mixing parameter is also ommonly referred to as �, but we have reserved � and � asthe time-integrated mixing probabilities for neutral B and B hadrons respe tively. �0 then is 12 (�+ �).10

�0 = fd � �d + fs � �s: (1.14)Here fd and fs are the fra tions of produ ed Bd and Bs mesons, and �s is the orrespondingvalue for B0s mixing. This leptoni de ay de�nition of �0 is parti ularly signi� ant as �0 annotbe measured dire tly, but produ ed lepton pairs are easily olle ted for analysis. In the ase of nomixing, a BB pair will produ e a pair of oppositely signed leptons through semileptoni de ay.However, a B or B whi h mixes will produ es a lepton of the same sign as its partner. Therefore,the measurable quantity of interest in the determination of a BB mixing magnitude is the ratio,R, of like-sign lepton pairs to the opposite sign lepton pairs all produ ed by b de ay. There arefour possibilities for a bb de ay5.1. b mixes (prob. �0) and �b de ays normally (prob. 1� �0) produ ing like signs2. b de ays normally (prob. 1� �0) and �b mixes (prob. �0) produ ing like signs3. b mixes (prob. �0) and �b mixes (prob. �0) produ ing opposite signs4. b de ays normally (prob. 1��0) and �b de ays normally (prob. 1��0) produ ing oppositesigns.For a sample of muons from only bb semileptoni de ays �0 is related to R in the followingway: R = N(�+�+) +N(����)N(���+) = 2�0(1� �0)�20 + (1� �0)2 (1.15)1.5 CP ViolationThe eviden e of the physi al universe establishes a large matter-antimatter asymmetry. Charge-Parity (CP ) violation is one of the ne essary onditions for baryogenesis, or the generation ofthis asymmetry [23℄, and there are a number of models to des ribe CP violation [16, 24℄. CPviolation an be des ribed in the Standard Model in terms of the CKM parameters [6℄. The omplex phase of the Yukawa ouplings in the CKM matrix a urately a ounts for the CP5In this dis ussion we are ignoring the ontribution to same-sign muon pairs from sequential de ays (dis ussedin Se tion 6.3) for simpli ity. However, this is not a negligible ontribution, and a more omplete dis ussion ofthe issues and orre tions in a measurement of �0 are dis ussed in Appendix F.11

violation observed in the K and B meson systems des ribed below, but fails to a ount to the osmologi al asymmetry by several orders of magnitude [10℄.1.5.1 CP Violation in K MesonsCP violation was �rst observed in K meson de ays [25℄. The weak eigenstates had originallybeen thought to be CP eigenstates as well, but KL with CP = �1 was observed to de ay to atwo pion �nal state with CP = +1. Sin e this was observed in the ontext of mixing it is indire tCP violation arising from the weak K eigenstates being an admixture of CP eigenstates to adegree quanti�ed by the parameter � [26℄. Dire t CP violation, that is arising from the de aypro ess itself, has also been observed in the kaon system [27℄ but o urs at a level 3 orders ofmagnitude less than indire t CP violation.1.5.2 CP Violation in B MesonsThe Standard Model predi ted value for �B , the is on the order of 10�3 [10℄, but other theoreti almodels suggest a greater value, as in [28℄. Also, dire t CP violation whi h is expe ted to dominatein the B meson system [26℄, has been observed [29, 30℄.The strong intera tion produ es pairs of b quarks and anti-quarks in high energy ollisions.There is a large semileptoni bran hing ratio for B hadron de ays; nearly 11% of B hadronsprodu ed will de ay in the following way,b! W � ! ���� : (1.16)Muons are also a lean signature on whi h events an be easily triggered. We expe t to �nd pairsof semileptoni de ays of these quarks where b ! �� and b ! �+ ex ept when mixing o urs.By looking at events where only one b mixes, we an look for any residual asymmetry that maybe eviden e of CP violation.A sample of same-sign muon pairs provides a onstraint on the CP violating parameter �B ,whi h is de�ned as (1 � q=p)=(1 + q=p), where q=p = 1 is the limit for CP invarian e from themixing formalism. CP violation in B mixing results in di�erent probabilities for B and B givingrise to an asymmetry of like sign dilepton events. For dimuons, the number of �+�+ would bedi�erent than the number of ���� for a sample of data where one of the B mesons has undergone12

mixing. This is de�ned as the CP violating harge asymmetry, ACP , and it is related to �B inthe following way:ACP = N(�+�+)�N(����)N(�+�+) +N(����) = 8(1� �)D �fd�d Re�d1 + j�dj2 + fs�s Re�s1 + j�sj2� (1.17)D = 2�(1� �) + 2fseqf�2 + (1� �)2gHere, �d;s is the parameter �B for Bd;s mixing. While the B fa tories have already made goodmeasurements of �d in dimuon events [31℄, �s must be determined at the Tevatron.1.5.3 CP Violating Phase of VtsCKM matrix element Vts ontains a omplex phase whi h is suppressed by the �4, where � isthe Cabibbo angle. Vts = � os �12 sin �23 � sin �12 os �23 sin �13e�iÆ (1.18)Standard Model(SM) plus existing measurements predi ts CP violation in BsBs mixing atthe order of 10�4. A measurement larger than this ould indi ate CP violation from new physi spro esses. In 2006 D; made the �rst high pre ision measurement, the results of their measure-ment are shown in Figure 1.5 [32℄. This analysis uses a omplimentary approa h.A method using the experimental determined results from the B fa tories for the ACP fromBd mixing and the best known values for mixing probabilities and fragmentation fra tions isoutlined in [33℄ to extra t AsCP .We an then use the relation [34℄,AsCP = ��s�Ms tan�s; (1.19)to relate the extra ted asymmetry to the CP violating phase of in Bs mixing, �s, where [35℄�s = arg��VtbV �tsV bV � s � : (1.20)13

Figure 1.5: A ombined �t showing the results of a measurement ��s using Bs ! J= � de ays onstrained by the allowed ontours in the ��s��s plane as determined by the D0 measurementof AsCP .
14

1.6 bb Pair Produ tionProtons are not fundamental parti les, and simple proton model in ludes two u quarks and oned quark. The proton is known, however, to also ontain gluons by whi h the proton is heldtogether, and sea quarks in addition to the three valen e quarks. Sea quarks are qq pairs, generallighter quarks whi h an be produ ed from gluon splitting but annihilate ba k to a gluon. All ofthese onstituents are referred to as partons, and all arry a fra tion of the proton momentumand an play a role in pp QCD intera tions.In pp ollisions, like those at the Tevatron bb pairs an be produ ed via several pro esses.Feynman diagrams for the leading order QCD intera tions are shown in Figure 1.6 and arereferred to as avor reation pro esses. However, for in lusive b produ tion in the kinemati range of interest for a urate re onstru tion of the B hadron de ay produ ts, avor reationa ounts for less than 35% of bb pair produ tion [36℄.q
q
g
b
b
g
g
g
b
b
g
g
b
b
b
g
g
b
b
b
Figure 1.6: Feynman diagrams for leading order bb produ tion pro esses. Flavor reation throughqq annihilation and gluon fusion.Next-to-leading order (NLO) bb produ tion in ludes the avor reation pro esses with gluon15

g
g
b
g
b
g
g
b
b
g
Figure 1.7: Feynman diagrams for two next-to-leading order bb produ tion pro esses: avorex itation (a) and gluon splitting(b).radiation in the �nal state. Also, in luded in NLO pro esses are avor ex itation whi h is thedominant pro ess for in lusive produ tion of b quarks with a transverse momentum > 5 GeV inthe entral dete tor, and gluon splitting whi h is only a signi� ant mode of produ tion at lowtransverse momentum. Feynman diagrams for these bb produ tion pro esses are shown in Figure1.7. For the dataset used in this analysis where both the b and b are required to be entral6, thedominant produ tion me hanism is avor reation.
6The term entral here refers to parti les boosted in the transverse dire tion relative to the olliding protonbeams and re onstru ted in the entral part of the dete tor. See Se tion 2.2.16

Chapter 2Experimental ApparatusThe data studied in this dissertation is produ ed at the Fermilab Tevatron a elerator and ol-le ted by the Run II Collider Dete tor at Fermilab (CDF-II). This hapter provides an overviewof the a elerator and dete tor whi h have been more fully do umented elsewhere. It also de-s ribes in some detail the major dete tor omponents and the trigger system essential to theanalysis.2.1 The TevatronThe Tevatron at Fermilab is urrently the world's highest energy parti le physi s ollider. TheTevatron a elerator omplex produ es proton and antiproton beams whi h are ollided at 1.96TeV enter of mass energy. The Tevatron is a ir ular syn hrotron 2 km in diameter. It employsnearly 800 dipole and about 200 quadrapole super ondu ting magnets kept at a temperatureof 4.3 K by large s ale ryogeni ooling with liquid helium. The ma hine holds 36 bun hesof protons(p) and antiprotons(p) spa ed 396 ns apart. The radio-frequen y(RF) bu kets usedto a elerate the parti les de�ne these bun hes. On e the beams are inje ted and a elerated, ollisions are allowed to o ur at two points in the main ring, and the dete tors CDF-II and D0are lo ated at these points. Figure 2.1 shows the various parts of the a elerator omplex usedfor the produ tion, storage and olliding of the beams.2.1.1 Proton Produ tionThe reation of a proton beam begins with hydrogen gas ontained in the Co k roft-Waltonpre-a elerator. Ele tri al dis harges ionize the gas reating H� ions whi h are subsequentlyseparated from other parti le spe ies by a magneti �eld and a elerated to 750 keV by the diode- apa itor voltage multiplier. The separation and a eleration o urs every 66 ms to segment the17
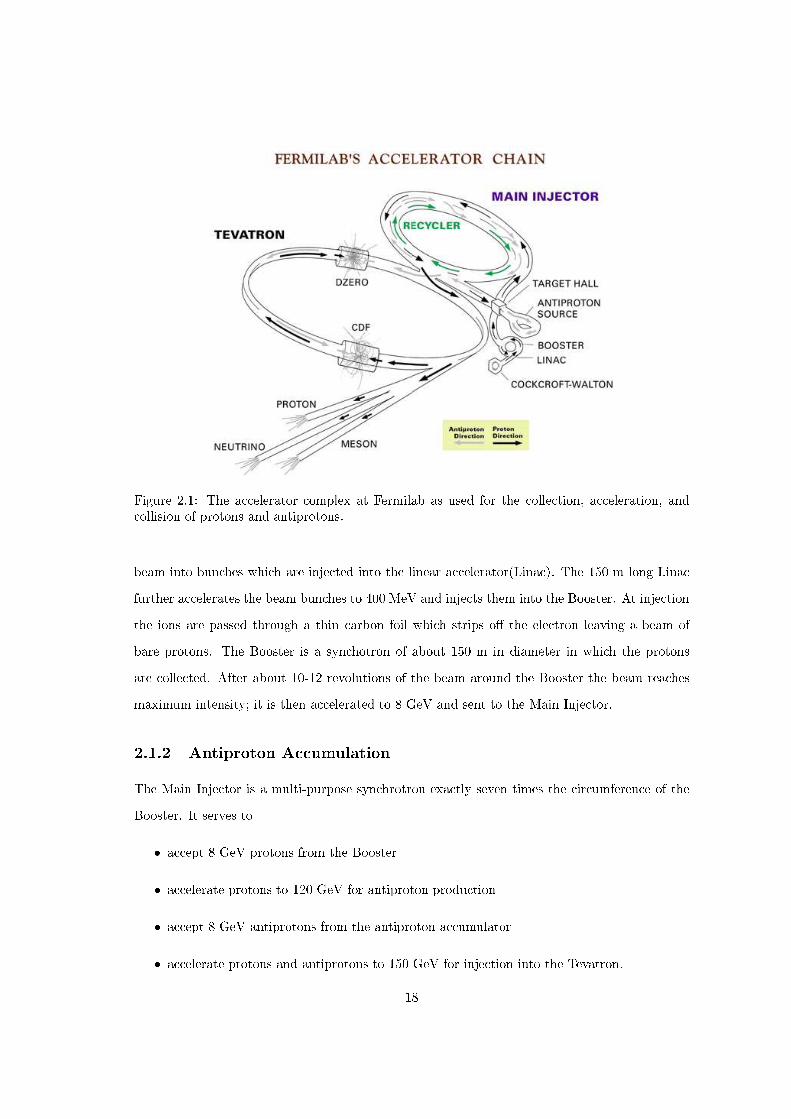
Figure 2.1: The a elerator omplex at Fermilab as used for the olle tion, a eleration, and ollision of protons and antiprotons.beam into bun hes whi h are inje ted into the linear a elerator(Lina ). The 150 m long Lina further a elerates the beam bun hes to 400 MeV and inje ts them into the Booster. At inje tionthe ions are passed through a thin arbon foil whi h strips o� the ele tron leaving a beam ofbare protons. The Booster is a syn hotron of about 150 m in diameter in whi h the protonsare olle ted. After about 10-12 revolutions of the beam around the Booster the beam rea hesmaximum intensity; it is then a elerated to 8 GeV and sent to the Main Inje tor.2.1.2 Antiproton A umulationThe Main Inje tor is a multi-purpose syn hrotron exa tly seven times the ir umferen e of theBooster. It serves to� a ept 8 GeV protons from the Booster� a elerate protons to 120 GeV for antiproton produ tion� a ept 8 GeV antiprotons from the antiproton a umulator� a elerate protons and antiprotons to 150 GeV for inje tion into the Tevatron.18

The �rst two fun tions are performed during ollider a umulation mode and the se ond twoduring ollider inje tion mode. In a umulation mode the Main Inje tor re eives a set of 84 protonbun hes (about 5 �1012 protons) from the Booster every 2 se onds. The protons are a eleratedto 120 GeV and then dire ted toward the Target Hall where they are ollided with ni kel alloytarget. The resulting shower of parti les is fo used into a parallel beam by a ylindri al lithiumlens. This beam whi h has a similar bun h stru ture as the in ident proton beam is passedthrough a pulsed dipole magnet. The magneti �eld separates the negatively harged parti leswith about 8 GeV of kineti energy. About 20 antiprotons are produ ed for every 106 protonson target, and these are olle ted in the Antiproton Sour e. In the Antiproton Sour e theantiprotons are de-bun hed into a ontinuous beam adiabati ally through RF manipulations andtheir range of momentum is redu ed through sto hasti ooling. The beams are also narrowed inthese pro esses whi h minimize any a ompanying beam loss. The antiprotons are a umulatedin the Antiproton Sour e until a suÆ ient sta k has been a quired for ollisions in the Tevatron,a pro ess whi h takes around 10-20 hours.Sin e 2004, an additional Re y ler Ring lo ated in the same tunnel as the Main Inje tor hasprovided additional storage of antiprotons. Limiting the sta k size in the Antiproton Sour eallows an optimization of antiproton a umulation rate. This rate is the largest limiting fa torin Tevatron running.2.1.3 Collisions and LuminosityIn order to reate ollisions, antiproton a umulation is stopped and the Main Inje tor(MI)swit hes to ollider inje tion mode. Seven sets of protons are re eived from the Booster, anda elerated to 150 GeV in the MI. They are oales ed into a single bun h before being inje tedinto the Tevatron. The pro ess is repeated every 12 se onds until 36 proton bun hes of about 3�1011 p are loaded into the Tevatron. Twelve bun hes ea h separated by 21 RF bu kets (396 ns)are grouped together into three trains of bun hes. The trains have a larger separation of 139 RFbu kets, and these gaps provide the spa e needed to insert antiprotons without disturbing theprotons and to safely the abort the beam. Antiprotons are extra ted from the Antiproton sour eand the Re y ler and are inje ted in sets of four oales ed bun hes ea h of about 6 �1010p until36 bun hes are ir ulating in the Tevatron. The antiproton bun h spa ing is a mirror image ofthe proton spa ing and ir les the Tevatron in the opposite dire tion sharing the same magnet19

and va uum systems. Ele trostati separators minimize beam intera tions allowing ea h beamto be ontrolled independently in their heli al orbits. The Tevatron RF system then a eleratesboth beams until they have an energy of 980 GeV. At this energy, a single parti le ir les theTevatron in 21 �s at 0.9999996 .On e the beams are fully a elerated they an be brought into ollisions by the fo usingquadrapole magnets. The two ollider dete tors CDF and D0 are built around the ollisionpoints. Quadrapoles installed on either side of ea h dete tor redu e the spatial distribution ofthe beam to maximize the probability of pp intera tions. The Tevatron ollider performan e isevaluated in terms of the instantaneous luminosity, L, whi h is the oeÆ ient between the rateof pro ess and its ross-se tion, �.rate [eventss ℄ = L [ 1 m2s ℄� � [ m2℄ (2.1)The instantaneous luminosity for pp ollisions an be approximated asL = fNBNpNp2�(�2p + �2p) �H(���� ); (2.2)where f is the frequen y of revolution, NB is the number of bun hes, Np=p is the number ofprotons/antiprotons, and �p=p is the beam size for protons/antiprotons at the intera tion point.There is a orre tion fa tor, H , whi h depends on the bun h shape and rossing angle of thebeams. The instantaneous luminosity degrades exponentially over time as parti les are lost dueto beam-beam intera tions and ollisions. During ideal operation the beam will be intentionallydumped after 15-20 hours of re ording ollisions and repla ed with a new store of antiprotonswhi h have been olle ted in the meantime. One the most important aspe ts of Run II hasbeen the improvements in higher instantaneous and integrated luminosity through more eÆ ientstoring, ooling and, and transferring of antiprotons. Figure 2.2 shows the improvement of theTevatron's peak luminosities during Run II.2.2 CDF Dete torThe CDF Dete tor referred to throughout this thesis is in fa t the CDF-II Dete tor and representsa substantial upgrade in many aspe ts over the CDF Dete tor used in Run I. A brief overview of20

Figure 2.2: Tevatron peak instantaneous luminosity averaged between CDF and D0 from April2001 to July 2007. In reases re e t the beam division upgrades in storage, ooling and transferof antiprotons.the dete tor is given followed by a fuller des ription of the omponents relevant to this analysis. Adetailed des ription of the entire dete tor and trigger an be found the Te hni al Design Reportsof the CDF-II dete tor [37℄. It was designed and built and it is operated and maintained by theCDF ollaboration, a team of several hundred physi ists and engineers representing more than60 universities in more than a dozen ountries. In June 2001, the �rst data was re orded withthe CDF-II dete tor.2.2.1 Dete tor OverviewIn order to take advantage of the full s ope of physi s in a hadron ollider environment, theCDF dete tor is not geared to any one parti ular physi s measurement. As a multi-purposedete tor it is optimized to extra t the essential properties of all types of parti les produ edin pp ollisions. As seen in the ross-se tion of the dete tor shown in Figure 2.3, the CDFdete tor onsists of a olle tion of tra king systems en losed in a solenoidal magneti �eld, anele tromagneti (EM) alorimeter, a hadroni alorimeter, and a muon dete tion system thatin ludes several drift hambers and steel shielding. Charged parti le momentum and displa ement21

an be determined from the tra king systems, but neutral parti les pass through undete ted. Theenergy of photons, however, an still be measured by the EM alorimeter whi h also measuresele tron energy. Hadron energy is measured in the hadroni alorimeter. The muons, whi h areminimally ionizing, will onstitute the majority of parti les dete ted in the outer drift hambers.
Figure 2.3: One half of the CDF-II dete tor from an elevation view. The various sub-dete torsystems are symmetri both azimuthally and forward-ba kward.2.2.2 Coordinate SystemCDF uses a oordinate system with the origin at the B0 beam intera tion point. The z-axis isde�ned to be parallel to beamline pointing in the dire tion of proton ir ulation. The y-axis pointsverti ally upward, and the x-axis radially outward from the Tevatron's enter. The x�y plane isreferred to as the transverse plane. Sin e, the pp olliding beams are unpolarized, the observedphysi s and thus the dete tor design are azimuthally symmetri . Therefore, it is onvenient touse ylindri al geometry(r; �; z) to des ribe the oordinate system. The plane de�ned by theradius, r, and the azimuthal angle, � is also transverse. The term longitudinal is used to referto the z-axis. Additionally, the polar angle � from a polar oordinate system (r; �; �) is used to22

des ribe position relative to the origin along the beamline.In pp ollisions, not all of the enter of mass energy is absorbed in the intera tion. Anyparti ular parton inside the proton arries a only a fra tion of the proton's momentum, thus olliding partons in general have unequal longitudinal omponents of momenta. This e�e tresults in the enter of mass system being boosted along the longitudinal dire tion. Therefore,in su h environments it is ustomary to use a longitudinal variable whi h is invariant under su hboosts. This quantity, alled the rapidity, is given byY = 12 ln[E + p os(�)E � p os(�) ℄; (2.3)where E is the parti le's energy and p is it's momentum. Rapidity transforms linearly, a ordingto Y 0 = Y + tanh�1 � under a boost � so that Y is invariant. Pra ti ally, this expression isapproximated by the pseudo-rapidity, �, whi h is the massless or ultra-relativisti limit of Y andrequires only momentum information.� = 12 ln[p+ pzp� pz ℄ = � ln[tan(�2)℄ (2.4)Given the azimuthal symmetry and rapidity invarian e, the dete tor omponents are seg-mented in � and � wherever possible allowing kinemati distributions to be more simply ana-lyzed. The following se tions des ribe the sub-dete tors more expli itly, giving emphasis to the omponents used for this analysis.2.2.3 Tra king SystemsCharged parti les an be tra ked in the dete tor by �nding the ionized parti les they reateas they pass through the dete tor's material. By lo alizing the ionization in lusters of hitsthe parti le's traje tory an be re onstru ted ele troni ally. Three-dimensional harged parti letra king is a hieved through a system of three inner sili on dete tors, a large outer drift hamber,and a super ondu ting solenoid. The 1.4 T magneti �eld from the solenoid auses the hargedparti les to urve providing momentum information as they travel through the 1.4 meters of thetra king systems. Figure 2.4 displays the CDF tra king system layout for an r� z ross-se tion.The tra king system is symmetri in �. 23

COT
0
.5
1.0
1.5
2.0
0 .5 1.0 1.5 2.0 2.5 3.0
END WALLHADRONCAL.
SVX II5 LAYERS
30
3 00
SOLENOID
INTERMEDIATE SILICON LAYERS
CDF Tracking Volume
= 1.0
= 2.0
EN
D P
LUG
EM
CA
LOR
IME
TER
EN
D P
LUG
HA
DR
ON
CA
LOR
IME
TER
= 3.0
n
n
n
m
mFigure 2.4: One quadrant of the CDF dete tor tra king layout whi h is en losed by the solenoidand the forward alorimetry.
24

Central Outer Tra kerThe Central Outer Tra ker (COT) [38℄ parti lesis a ylindri al multi-wire open- ell drift hamber.It provides harged parti le tra king in the region of jzj < 155 m and of radii between 44 and132 m. The COT ontains 96 sense wire layers whi h are arranged radially into eight super-layers. Ea h super-layer is divided into � ells ea h of whi h has 12 sense wires. As the driftdistan e is approximately the same for all eight super-layers, the number of ells per super-layerin reases from 168 up to 480 moving out radially. The entire COT ontains 30,240 sense wiresof 40 �m diameter and made of gold plated Tungsten. Four super-layers employ sense wiresoriented parallel to the beam, for a measurement of hit oordinates in the r � � plane. Theseare alternated radially with stereo super-layers whose wires are strung at a small stereo angle(�2Æ) with respe t to the beam. This layout provides an a urate measurement of transversemomentum, but less a urate information in the r� z plane for the z- omponent of momentum.The super-layers also ontain potential wires and are divided by athode �eld panels reating anele tri �eld throughout. Figure 2.5 shows the layout of the COT from an endplate.
Figure 2.5: COT layout: 1/6 of an endplate(left), and wires in a super ell(right).The COT is �lled with a 50:50 Argon-Ethane gas mixture whi h fun tions as the a tive25

medium. Charged that travel through the hamber leave a trail of ionized ele trons in the gas.Ele trons drift toward the sense wires at a Lorentz angle of 35Æ being in both the hamber'sele tri �eld and the magneti �eld whi h immerses the whole tra king volume. The super ellsare tilted by 35Æ away from the radial so that the ionization ele trons drift in the � dire tion.The ele tri �eld very lose to the sense wires is large, and when ele trons get near a wire thea eleration auses further ionization resulting in a � 104 ampli� ation. The r � � position ofthe parti le with respe t to the sense wire is inferred from the arrival time of the ele tri al signal.The re orded position points are later pro essed by pattern re ognition software re onstru tinga heli al tra k. The parti le heli es are des ribed by the following parameters:� C, urvature of the helix, inversely proportional to pT� d0, impa t parameter, distan e to the beam from point of losest approa h� �0, azimuthal oordinate of the pT ve tor from point of losest approa h� z0, z oordinate of the pT ve tor from point of losest approa h� ot �, slope of helix step versus diameter.Parti les whi h have j�j < 1 pass through all eight COT super-layers.Sili on Vertex Dete tor IIThe a urate measurement of tra ks lose to the beamline is essential for many CDF physi sanalyses. In this work a pre ise determination of impa t parameters is needed to identify Bhadron de ay produ ts. Sili on mi ro-strip dete tors whi h were pioneered for a hadron olliderenvironment at CDF during Run I perform this fun tion.Sili on strip dete tors are ideal for pre ision measurements lose to the beam for two reasons.The sili on is able to sustain the high radiation doses hara teristi of this region. In addition,the semi- ondu ting small band-gap sili on is ideal for providing fast ele troni ir uit readoutand an be �nely segmented for high pre ision measurements of position. A sili on tra kingdete tor is omposed of �nely spa ed sili on strips a ting as reverse-biased p� n jun tions. Thep-type (p+) sili on strips are implanted on an n-type (n�) sili on substrate with a distan e ofabout 60 �m between them. On the opposite side n-type (n+) sili on is deposited and may alsobe segmented. When a harged parti le passes through the substrate it auses ele tron-hole pair26

ionization. Ele trons drift toward the n+ side and holes toward the p+ strips. Charge depositionwill be read out on one or more strips produ ing a lo alized signal. The p side strips provide hitsgiving r�� position information, and the n side, if segmented, an provide z position information.The Sili on VerteX dete tor II (SVX-II) [39℄ is built in three ylindri al barrels ea h 29 mlong. Ea h barrel is made of �ve on entri layers of double-sided sili on sensors and dividedinto twelve wedges alled ladders. Table 2.1 shows the stereo angle, radial position and stripinformation for the SVX-II layers. Four sili on sensors are sta ked longitudinally in ea h ladderand the readout ele troni s are mounted at both ends. The ladders have some azimuthal overlapat the edges for alignment purposes. The impa t parameter resolution, essential to this analysis,is also onsidered a measure of SVX-II performan e; it is about 35 �m.Layer r � � strips Stereo strips Stereo angle r � � pit h Stereo pit h A tive width0 256 256 90Æ 60 �m 141 �m 15.3 mm1 384 576 90Æ 62 �m 126 �m 23.8 mm2 640 640 +1.2Æ 60 �m 60 �m 38.3 mm3 768 512 90Æ 60 �m 141 �m 46.0 mm4 896 896 -1.2Æ 65 �m 65 �m 58.2 mmTable 2.1: Me hani al summary of the sensor layout for the SVX-II layers. Ea h layer has ana tive length of 72.4 mm
Figure 2.6: Layout of the sili on dete tors: side-view of the dete tors not drawn to s ale (left),and end-view of the dete tors entered around the beamline (right).27

Layer 00 and Intermediate Sili on LayerThe innermost sili on dete tor, Layer 00 (L00) is made of single-sided sili on sensors pla eddire tly on the beamline at a radius of 2 m. It provides full azimuthal and jzj < 47 mlongitudinal overage. Not all early CDF data has usable L00 hit information, but L00 hasbeen orre tly aligned and alibrated for use in mu h of the later data. It helps to re overthe degradation in resolution due to multiple s attering from the ooling system and readoutele troni s of the entral system. No L00 hits were used in the �nal tra k sele tion for thisanalysis.The Intermediate Sili on Layer (ISL) is a double-sided sili on dete tor segmented into 12wedges like the SVX-II. It onsists of one entral layer at a radius of 23 m to provide an inter-mediate position measurement between the SVX-II and the Central outer tra ker. Additionally,two layers at radii of 20 m and 29 m in the region of 1.0� j�j � 2.0 provide forward tra kinginformation. The ISL strips have a 1.2Æ stereo angle.Figure 2.6 shows the overage of the sili on dete tor subsystems.2.2.4 Muon SystemsMuons being over 200 times more massive than ele trons undergo far less bremsstrahlung ra-diation. Unlike pions(�) and kaons(K) they are not subje t to strong intera tions with nu leiin matter. Therefore, a muon reated in ollisions with enough energy will pass through the alorimeter systems with minimal ionizing intera tions. This property of muons is exploited inthe CDF dete tor by pla ing the muon systems radially outside the alorimetry. Additionalsteel absorbers are also used to further redu e the han e of other parti les rea hing the muon hambers.Four systems of drift hambers and s intillation ounters are used in the dete tion of muonsand over a range of j�j < 1:5 [40℄:� CMU - Central MUon dete tor� CMP - Central Muon uPgrade� CMX - Central Muon eXtension� IMU - Intermediate MUon dete tor. 28

Figure 2.7 shows the overage of the muon dete tors and Table 2.2 summarizes their designparameters. The s intillation ounters, CSP and CSX, help suppress ba kgrounds from out-of-time intera tions for the CMP and CMX hambers respe tively.- CMX - CMP - CMU
φ
η
0 1-1 ���������������������������������������������������������������������������������������������������������������������������������������������������������������������������������������������������
������������������������������������������������������������������������������������������������������������������������������������������������������������������������������������������������������������������������������������������������������������������������������������������������������������������������������������������������������������������������������������������������������������������������������������������������������������������������������������������������������������������������������������������������������������������������������������������������������������������������������������������������������������������������������������������������������������������������������
����������������������������������������������������������������������������������������������������������������������������������������������������������������������������������������������
������������������������������������������������������������������������������������������������������������������������������������������������������������������������������������������������������������������������������������������������������������������������������������������������������������������������������������������������������������������������������������������������������������������������������������������������������������������������������������������������������������������������������������������������������������������������������������������������������������������������������������������������������������������������������������������������������������
������������������������������ - IMU
Figure 2.7: Muon dete tor overage in � and � for the CDF muon hambers.The muon drift hambers like the COT employ sense wires parallel to the beamline and are�lled with a 50:50 Argon-Ethane gas mixture. Muon andidates are identi�ed as tra k segmentsin the hambers and are alled muon stubs. A muon stub is mat hed with a tra k measured bythe COT to redu e ba kground from noise in the ele troni s and from hadrons whi h manage torea h the muon hambers.While heavy material shielding redu es the number of hadrons faking muons in the dete tors,it in reases the e�e ts of multiple Coulomb s attering. Coulomb s attering is the elasti s atteringof a point-like parti le (muon in this ase) on a massive harge (nu lei of the material), and29

CMU CMP CMX IMUCoverage in pseudo-rapidity j�j < 0:6 j�j < 0:6 0:6 < j�j < 1:0 1 < j�j < 1:5Number of drift tubes 2304 1076 2208 1728Number of s intillation ounters - 269 324 864Pion intera tion length 5.5 7.8 6.2 - 10 6.2 - 20Minimum � pT 1.4 GeV 2.2 GeV 1.4 - 2.0 GeV 1.4 - 3.0 GeVMultiple s attering resolution 12 m/pT 15 m/pT 13 m/pT 13-25 m/pTTable 2.2: Physi s parameters for the various CDF muon systems.many small angle de e tions may ontribute before the muon rea hes the dete tor. This e�e t ompli ates the tra k-stub mat hing, but the mismat h distribution is Gaussian and an bea ounted for.CMUThe Central MUon dete tor (CMU) is lo ated right around the outside of the hadroni alorime-try at a radius of 347 m from the beamline. The CMU is segmented into 24 wedges of 15Æin �, but only 12.6Æ of ea h wedge is a tive instrumentation leaving a 2.4Æ between ea h wedgeand an azimuthal a eptan e of 84 %. The CMU is also divided into an East(positive �) andWest (negative �)halves with a overage of j�j < 0:6. Ea h wedge is further segmented into three4.2Æ modules ea h of four layers of four drift ells. The sense wires in the drift ells are made ofstainless steel and kept at +2325 V. They are o�set by 2 mm in alternating layers to improve hitresolution - about 250 �m in the r�� plane and about 1 mm in z. The timing information fromthe drift ells is used to re onstru t a muon stub. Muons of pT > 1.4 GeV an rea h the CMU.CMPThe Central Muon uPgrade (CMP) is a se ond set of muon drift hambers pla ed behind 60 m of additional steel absorbers. This material provides an extra 2.3 pion intera tion lengthsto further limit the probability of hadroni pun h-through to the CMP. The CMP hambers aresingle wire drift tubes whi h are re tangular in shape (2.5 m � 15 m). They are 640 m longand on�gured in four layers with alternate half- ell staggering. The overall shape of the CMP isthat of a re tangular box around the entral dete tor. It is the only major dete tor omponentwhi h is not azimuthally symmetri , and thus its overage in j�j varies as a fun tion of � asseen in Figure 2.7. Muons of pT > 2.2 GeV an rea h the CMP. The CMU and CMP have a30

large overlap in overage and are often used together; the same s intillators are used for bothdete tors, CMP helps to over to CMU � gaps and the CMU overs the CMP � gaps. However,the sample of muons whi h register a stub in both dete tors is the least ontaminated by fakemuons and are referred to as CMUP muons. Only CMUP muons are used for this analysis.2.2.5 Other Dete tor ComponentsThis se tions provides a brief overview of the remaining major dete tor omponents. Thesesystems are at most indire tly involved in the data and analysis presented in this dissertation.CalorimetryThe CDF alorimetry is omposed of several systems of ele tromagneti (EM) and hadroni s in-tillator sampling alorimeters whi h are segmented in a uniform pattern of proje tive towers.The tower geometry provides an even segmentation in � and � pointing ba k to the intera tionregion. Ea h alorimetry subsystem is uniform in � and all �ve subsystems ombined provide overage for EM obje ts and hadrons out to j�j < 3.6:� Central Ele tromagneti (CEM), j�j < 1.1� Central Hadron (CHA), j�j < 0.9� Wall Hadron (WHA), 0.7 < j�j < 1.3� Plug Ele tromagneti (PEM), 1.1 < j�j < 3.6� Plug Hadron (WHA), 0.7 < j�j < 1.3The alorimetry has a segmentation of 0.1 in � and 15Æ in �, ex ept for the plug alorimeterbetween 1.1 < j�j < 2.1 where the � wedges are 7.5Æ. The alorimeters use an a tive mediumof polystyrene based s intillators whi h are alternated with absorber material. CEM and PEMuse lead sheets for absorber material, while the CHA and WHA use steel and the PHA usesiron. As a parti le traverses a layer of absorber material and intera ts with the nu lei, it's energyis redu ed and it produ es a parti le shower as it is stopped. The a tive medium is used todetermine the energy of a shower. The total energy deposited in the s intillator at all layersdetermines the energy of the in ident parti le. The EM alorimetry intera ts with ele trons viaBremsstrahlung radiation and photons through onversions until there is not enough energy for31

more of these intera tions. Hadroni showers are produ ed by hadrons intera ting with nu leivia the strong intera tion. Shower maximum dete tors are embedded in the EM dete tors atabout 6 radiation lengths to help di�erentiate between ele trons and photons.Time of FlightThe Time of Flight dete tor (TOF) [42℄ is a ylindri al array of 216 s intillating bars ea h about300 m in length and with a 4 m � 4 m ross se tion. It is lo ated just between the COTand the Solenoid at a radius of about 140 m. The TOF system is designed to help identifylow momentum harged hadrons by measuring the arrival time of the parti le with respe t tothe bun h rossing time. This time is dependent on the parti le's mass and espe ially helps todi�erentiate pions and kaons.Cherenkov Luminosity CountersThe Cherenkov Luminosity Counters (CLC) [41℄ are used to measure the instantaneous luminosity(L) of ollisions at CDF. The luminosity an be inferred from the equation�� fBC = �pp �L (2.5)where the Tevatron bun h rossing frequen y (fBC) is known from the RF system, the inelasti pp ross se tion (�pp) is know to about 4% un ertainty, and the average number of interationsper bun h rossing (�) is measured by the CLC. The CLC is omposed of two assemblies of48 oni al isobutane �lled Cherenkov ounters. They are pla ed in the forward and ba kwardregions at 3.7 < j�j < 4.7. Ex ellent timing resolution allows the CLC to di�erentiate betweenbeam losses whi h are typi ally out of time and parti les from pp intera tions. The CLC anmeasure the luminosity with a total un ertainty of less than 6%.2.3 CDF Trigger SystemIn order to a quire useful data from the CDF dete tor a trigger system is ne essary due to theoverwhelming ba kground of inelasti pp inherent in a hadron ollider environment. The nominal rossing rate is 1.7 MHz though this is averaged over the beam abort gaps. The instantaneousrate during for bun h trains is 2.5 MHz, and at luminosities of � 1032s�1 m�1 there are about32
2 intera tions per rossing. Storing dete tor readout from every rossing (about 200 kbytes)would require the ability to re ord about 500 Gbytes/s. This rate is not only unattainable with urrent te hnology, it would also result in an unwieldy and largely uninteresting dataset. TheCDF trigger system addresses these issues by using partial dete tor readout to examine everyevent and applying physi s algorithms to sele t events determined to be the most interesting.At the beginning of Run II, CDF had the apa ity to write out events at a rate of approxi-mately 75 Hz. This apa ity has in reased to a rate of 150 Hz at the time of writing; however,this still requires the elimination of 99.994% of ollision events. The redu tion is a omplishedby the trigger in three-levels, narrowing the sele tion with additional information at ea h level.The general goal is to a ept as many interesting events as possible while keeping the deadtimeat 5% or less. The deadtime is a measure of inability to readout interesting events be ause allthe available slots for events passing to the next level are full.At the �rst level of the trigger only rough algorithms are used, and not all the dete tor omponents (parti ularly the Sili on sub-dete tors) are read out. The front end ele troni s havea pipeline of 42 lo k y les (132 ns) during whi h the �rst level de ision must be made. Therate of events passed to the se ond level is around 25 kHz. Events not sele ted are ignored anddrop out of the pipeline. The next level in orporates additional information in luding readoutfrom the Sili on dete tors and redu es the rate to 900 Hz. Level 1 and 2 triggering me hanismsare hardware based and use ustom ele troni s. Level 3 is a software based trigger algorithmimplemented on a farm of about 500 omputers. It has almost all the information available inthe o�ine re onstru tion. Figure 2.8 shows the data ow of the CDF trigger system.Ea h subset of data is lassi�ed a ording to its spe i� trigger paths. Several higher leveltriggers may use a ommon Level 1 trigger with tighter onstraints on di�erent measurablequantities. The trigger path is de�ned by the trigger requirements met at all three levels, and on�rming the trigger path o�ine is important to many analyses. Con�rmation eliminates the ontribution of volunteer events, events whi h may met the requirements for the higher leveltrigger of interest but have not passed the asso iated Level 1 trigger. This analysis on�rms thetrigger sele tion for every event in the o�ine analysis.33

L2 trigger
Detector
L3 Farm
MassStorage
L1 Accept
Level 2:Asynchronous 2 stage pipeline~20µs latency300 Hz Accept Rate
L1+L2 rejection: 20,000:1
7.6 MHz Crossing rate132 ns clock cycle
L1 trigger
Level1:7.6 MHz Synchronous pipeline5544ns latency<50 kHz Accept rate
L2 Accept
L1 StoragePipeline:42 Clock Cycles Deep
L2 Buffers: 4 Events
DAQ Buffers
PJW 10/28/96
Dataflow of CDF "Deadtimeless" Trigger and DAQ
Figure 2.8: Digram of the data a quisition system for the CDF-II trigger.2.3.1 Level 1The Level 1 trigger (L1) is a syn hronous system of ustom ele troni hardware designed toanalyze every event and produ e an a ept or reje t de ision. This must be done on the order of5 �s, before the bu�ers storing the data must be leared, and at a rate of 25 MHz. L1 de isionsare made based on partial information from the COT (only the 4 axial superlayers are usedfor two-dimensional tra ks), the alorimeters (total energy and some single tower information),and muon systems (stubs in the CMU, CMP, and CMX). The eXtremely Fast Tra ker (XFT)performs a rough tra k re onstru tion and passes the tra ks to the extrapolation unit (XTRP).The XTRP pro esses the tra ks and feeds the three L1 subpro ess: L1 CAL, L1 TRACK, and L134

MUON. L1 MUON and L1 CAL also in orporate the information available from the alorimetryand muon systems respe tively to trigger on muon, ele tron, and photon obje ts, on jets, andon total transverse energy or missing transverse energy. The L1 TRACK triggers events basedonly on tra king algorithms. All three subpro esses report de isions to the Global Level 1 systemwhi h a epts or reje ts ea h event. A epted events are bu�ered for Level 2 analysis.XFTThe XFT [44℄ pro esses tra ks from the axial superlayers of the COT, only in the r�� plane, intime for ea h L1 de ision. It reports the pT and a good approximation of the tra k's � positionfrom the angle of the pT in superlayer 6. The pattern re ognition is based on pre-de�ned patternsof COT hits oming from the beamline. The XFT is apable of re onstru ting tra ks with pT >1.5 GeV with an eÆ ien y of around 95% and a fake rate of only a few per ent. The angularsegmentation is 1.25Æ, but the XFT a hieves a resolution of � 5 mrad. The momentum resolutionis �pT =pT = 0.016pT . The XFT reports all re onstru ted tra ks to the extrapolation unit to bepro essed for L1 triggers. Re ently, a on�rmation bit from Stereo superlayers was added to L1XFT pro essing. This addition has made it possible to redu e the number of fake XFT tra kswhi h had sharply risen with luminosity in reases.XTRP and L1 TRACKThe extrapolation unit (XTRP) [43℄ re eives re onstru ted tra k information from ea h of theparallel XFT pro essors. Based on the azimuthal position and transverse momentum of a tra kand a ounting for multiple s attering the XTRP then roughly identi�es the areas in the muondete tors and alorimetry whi h should be he ked for hits. Mat hing hits would on�rm aL1 muon or ele tron. This extrapolation information is passed to the L1 CAL and L1 MUONsubpro esses.Some XTRP tra ks are also passed a ross the ba kplane of the ele troni s rate to the L1TRACK pro essor whi h is also lo ated in the rate. The L1 TRACK an a ept two tra ks per15Æ � wedge of the XFT. It also only a epts tra ks with pT > 2.0 GeV and a maximum of 9 tra ksper event. Various L1 tra k-only triggers are formed with two-tra k topologies orresponding toprimarily heavy avor physi s pro esses. The L1 tra k board �rmware examines all ombinationsof two tra ks for every trigger in ea h event. Chapter 3 des ribes the hardware upgrade proje t35

ompleted to the L1 tra k board as a part of this thesis resear h at CDF.RUN II TRIGGER SYSTEM
Detector Elements
GLOBAL LEVEL 1
L1 CAL
COT
XFT
MUON
MUONPRIM.
L1MUON
L2 CAL
CAL
XTRP
L1TRACK
SVX
SVT
CES
XCES
PJW 9/23/96
GLOBAL LEVEL 2 TSI/CLK
Figure 2.9: Various trigger paths for output from the major dete tor omponents in the CDFLevel 1 and Level 2 trigger systems.2.3.2 Level 2A diagram of the de ision pro ess from the dete tor through Level 2 is shown in Figure 2.9. Level2 is an asyn hronous ombination of hardware and software triggers whi h pro esses events inthe order they are a epted by Level 1. Level 2 also in orporates additional information from the36

shower max drift hambers in the entral EM alorimeter(CES) and the axial hits from the SVX-II dete tor. This additional information is ombined with the Level 1 information to produ eLevel 2 obje ts. There are several areas in whi h de isions are improved at Level 2 to redu e the25 kHz Level 1 rate to 900 Hz. Information from the CES drasti ally redu es the ele tron rateby removing fake ele trons. Better � and pT resolution from the SVX allow tighter mat hingand high pT thresholds for many muon, ele tron, and jet triggers. A pre ise measurement of thetra k impa t parameter, d0, greatly enhan es the ability of tra k triggers to identify heavy avor.Sili on Vertex TriggerThe Sili on Vertex Trigger (SVT) [45℄ is one of CDF's most powerful tools. It is espe ially e�e tiveat identifying heavy avor hadroni de ays whi h would otherwise be nearly impossible due tothe inelasti ba kground. The SVT ombines the data from the XTRP and the SVX dete torto identify displa ed tra ks indi ative of B hadron de ays. The impa t parameter resolution ofthe SVT is about 35 �m, similar to the resolution available o�ine. This displa ement resolutionallows identi� ation of tra ks whose origination point is in onsistent with the primary intera tionregion.A typi al event is pro essed by Level 2 in about 20-30 �s. In order for the SVT to readoutthe SVX dete tor information and pro ess it in that time, the intrinsi wedge stru ture of theSVX and XTRP is exploited. Ea h of the 15Æ wedges is pro essed in parallel with the XTRPtra k information being extrapolated inward to SVX dete tor. In order to a hieve the ne essaryresolution the SVT requires hits in all four axial SVX layers asso iated with the XTRP seedtra k.2.3.3 Level 3The �nal level of the CDF trigger involves the redu tion of rate from about 600-900 Hz downto about 100-150 Hz. The riteria for Level 3 triggers are similar to their Level 2 ounterpartsbut involve the full event re onstru tion. The output for ea h event passing the Level 2 triggeris readout via opti al �bers from all the sub dete tors and sent to one of about 500 ommer ial omputers running LINUX. This PC farm ontains the Level 3 trigger software. An event whi his a epted at Level 3 is then written to mass storage.37

Chapter 3Tra k Trigger UpgradeThis hapter provides a te hni al des ription of an upgrade to the CDF trigger system. The tra k-only based trigger sele tion is enhan ed by the repla ement of the dedi ated tra k trigger ir uitboard. The tra k trigger provides important data parti ularly from hadroni de ays of heavy avored mesons ontributing, for example, to the observation of Bs os illations [20℄, the dis overyof new B baryon states [47℄, and the observation of new Bs de ay modes [48℄. The followinginformation is not essential to the CP asymmetry result, but it is in luded for ompleteness, andis intended primarily for trigger experts.3.1 MotivationThe tra k trigger upgrade was designed to in orporate additional information at Level 1(L1) fortra k-only trigger de isions. Additionally, the new trigger board was designed to a ept up tonine eligible tra ks per event rather than the previous maximum of six tra ks. These hanges weresigni� ant be ause the L1 tra k triggers be ome the basis for SVT triggers at Level 2, and thesetriggers are essential to hadroni B analysis in luding Bs mixing. Also, the in reased maximumnumber of tra ks addressed the on ern that as the luminosity in reased over the ourse of RunII the events with 7 or more tra ks would in rease to a point were the two triggers would auseuna eptable deadtime in the trigger.3.2 XTRPThe XTRP Data Boards operate syn hronously as part of the Level 1 trigger system [37, 43℄.Ea h Data Board a epts COT tra ks from two XFT linkers [44℄ and extrapolates the tra ksto the muon, time-of- ight and alorimetry systems. Additionally, the Level 1 Tra k Trigger38

board within the XTRP generates trigger de isions based upon XFT tra ks. The Tra k Triggerpasses the trigger de isions dire tly to Level 1 trigger de ision rate. The tra k trigger upgradeproje t was intended to redu e the rate of automati Level 1 tra k triggers and to in rease theinformation available for tra k triggers.3.3 Run 2A Two Tra k TriggerThe XTRP system re eives XFT tra ks for ea h bun h rossing. Ea h XTRP Data Board re eivesinformation from two adja ent XFT linkers (with one linker per 15Æ wedge). The Data Boardsperform alorimetry and muon extrapolation, in addition to passing a subset of XFT tra ksa ross the VME ba kplane to the Two Tra k Board. For a tra k to be passed to the Two Tra kBoard, it must pass a prede�ned threshold (typi ally 2:04GeV) and be a four-layer XFT tra k.The Two Tra k Board an re eive at most two tra ks from a single 15Æ wedge. If more thantwo tra ks are eligible, then the two \outer" tra ks (�min and �max) are sent to the Two Tra kBoard. This sele tion o urs regardless of tra k momentum. An example of this is shown inFigure 3.1.The Two Tra k Board has onboard logi to evaluate up to 6 tra ks. If more than 6 tra ks areeligible for onsideration, then the Two Tra k board generates an \auto-a ept" for all triggers.This indi ates that the event should be a epted, and also indi ates that the Two Tra k Boarddid not evaluate all possible tra k ombinations. This trigger is referred to as the \L1 SEVEN"trigger, indi ating that there were at least seven tra ks eligible to be evaluated by the Two Tra kBoard. The L1 SEVEN trigger table pT option sets the prede�ned threshold for tra ks eligibleto be passed to the Tra k Trigger Board. In the ase where there are three tra ks in one wedge,only two of those tra ks ount toward the total, sin e only two tra ks are sent to the Two Tra kBoard.The tra king information available in the Two Tra k Board is� XFT pT (7-bits)� short tra k bit (1-bit) unused� \global �" (9 bits).The transverse momentum information is identi al to binning provided by the XFT. Although39

Figure 3.1: An example of the \two tra ks per wedge" limitation in going from the XTRPDataboards to the Two/Three Tra k board. In this ase, there are three XFT tra ks in a single15Æ wedge. Although the middle tra k of the three has higher pT , only the outer two tra ks (thetwo 5GeV tra ks) are sent to the tra k trigger board. Only four-layer XFT tra ks above 2GeVare used in this algorithm.the Two Tra k Board is able to handle tra ks with hits in only 3 of the 4 COT axial superlayers,operationally this was never utilized. The azimuthal information utilized in the Two Tra k Boardis the XFT �SL6 whi h is the azimuthal angle of the tra k at COT superlayer 6 as measured bythe XFT. In the Two Tra k Board, the � granularity is 1:25Æ.The Two Tra k Trigger Board performs trigger lookups for ea h possible tra k pair. Thelookups for pT and � are performed separately, so it is not possible to implement algorithmsbased upon pT /Æ� orrelations.The Two Tra k Trigger outputs 16 distin t trigger bits. One bit is prede�ned as the auto-a ept bit, leaving 15 other programmable one or two-tra k triggers.The Two Tra k Trigger Board (2TT) was used as the L1 tra king trigger from the beginningof Run II until De ember 2004 when the Tra k Trigger Upgrade had been fully ommissioned forphysi s data and was installed for operation.40

3.4 Three Tra k Trigger BoardThe Three Tra k Trigger Board (3TT) was originally motivated as a devi e that would retainthe two tra k fun tionality but allow triggers involving tra k triplets. The Three Tra k Boardalso allows for more tra k ombinations, so up to 9 tra ks an be evaluated within a single event.Events with more than 9 tra ks are auto-a epted on what is referred to as the \L1 TEN" trigger.The ability to handle events with higher tra k multipli ity was motivated by the anti ipatedin rease in instantaneous luminosity from the Tevatron.After the initial testing of the prototype 3TT board, a test with data from pp ollisionswas attempted at low luminosity. In analyzing the beam test data a logi aw was dis overedwhi h was preventing the upgrade from repli ating the 2TT. In analyzing potential solutions wedetermined that the two tra k fun tionality ould be repli ated only by abandoning the tra ktriplet triggers or undertaking a massive rewiring of the boards. Additionally, we determinedthat by implementing a two-tra k board design the additional pro essing power ould be used tomake triggers with transverse mass apabilities. The availability of transverse mass informationat L1 was deemed more important than triggering on three-tra k ombinations. The de isionwas made to modify the prototype board to be an enhan ed two tra k trigger board.The basi operation of the Three Tra k Board is identi al to the Two Tra k Board. It a eptsXFT tra ks from the XTRP Data Boards and generates up to 16 Level 1 tra k trigger de isions.The primary di�eren es between the 2TT and 3TT are summarized in Table 3.1. As men-tioned above, the number of tra ks whi h �re the auto-a ept has in reased. In addition, thebinning of pT and � information has hanged. 2TT 3TT v0 3TT v1auto-a ept(# tra ks) > 6 > 9 > 9pT bins 96 62 62� �SL6 �SL6 �0� bins 288 63 63transverse mass no no yesTable 3.1: Di�eren es between the Two Tra k Board (2TT), the Three Tra k Board run intwo tra k emulation mode (3TT v0) and the Three Tra k board run in transverse mass mode(3TT v1). These di�eren es are des ribed in detail in the text.Following the ne essary board and �rmware modi� ations the new Three Tra k Board wasretested. After several su essful runs with ollisions produ ed usable data, the 3TT was ommis-41

sioned in De ember of 2004. The Three Tra k Board has been run in two di�erent on�gurations.From the ompletion of its ommissioning in De ember 2004 through May 2005, the Three Tra kboard was run in a \two tra k emulation" mode, where all of the existing single and two-tra ktriggers were repli ated in the Three Tra k board. The only di�eren e in operation is the auto-a ept threshold. Note that all of the two-tra k pT and Æ�SL6 uts are along bin boundaries, sothe pT and Æ� binning di�eren es did not modify any of the two tra k trigger uts. We refer tothis period of running as 3TT v0. On e the additional �rmware modi� ations had been testedand implemented, transverse mass apability be ame available in the 3TT. This period of runningis referred to as 3TT v1, and it spans physi s runs from June 2005 through urrent running.3.4.1 Three Tra k pT MappingIn order to perform trigger de isions on as many as 36 tra k ombinations, it is ne essary to ompress the pT and � binning. In the 3TT, we take the 7-bit XFT pT information and ompressit to 6 bits. This ompression is performed by dropping the pT bins for pT < 2GeV and ompressing the high pT bins into a single pT > 10GeV bin. This allows us to retain the existingXFT pT granularity in 2-9GeV range, where it is most important. This mapping is shown inTable 3.2.The Three Tra k pT binning des ribed here is used in both 3TT v0 and 3TT v1 running.3.4.2 Three Tra k � MappingThe tra k � information passed from the XTRP Databoards to the Three Tra k Board has thesame 9-bit resolution (1:25Æ) that was utilized in the Two Tra k Board.In the Three Tra k Board, for ea h tra k pair, we al ulate a Æ� = �2 � �1. We insure that0Æ < Æ� < 180Æ. We then drop the least signi� ant Æ� bit. This hanges the Æ� granularity from1:25Æ to 2:5Æ.Sin e all existing two-tra k triggers fall on 2:5Æ boundaries, this hange had no a�e t onexisting triggers. All opening angles greater than 155Æ are mapped into the 155Æ bin. This isa eptable be ause all two-tra k triggers either have no opening angle ut or else they require anopening angle less than 135Æ.42

pT bin XFT pT 3TT pT0 -1.52 01 -1.57 02 -1.63 03 -1.68 04 -1.75 05 -1.81 06 -1.88 07 -1.96 08 -2.04 -2.049 -2.13 -2.1310 -2.23 -2.2311 -2.34 -2.3412 -2.46 -2.4613 -2.59 -2.5914 -2.74 -2.7415 -2.91 -2.9116 -3.05 -3.0517 -3.15 -3.1518 -3.25 -3.2519 -3.37 -3.3720 -3.49 -3.4921 -3.62 -3.6222 -3.76 -3.7623 -3.92 -3.92
pT bin XFT pT 3TT pT24 -4.09 -4.0925 -4.27 -4.2726 -4.47 -4.4727 -4.68 -4.6828 -4.92 -4.9229 -5.19 -5.1930 -5.49 -5.4931 -5.82 -5.8232 -6.19 -6.1933 -6.62 -6.6234 -7.11 -7.1135 -7.68 -7.6836 -8.35 -8.3537 -9.14 -9.1438 -10.11 -10.1139 -11.29 -10.1140 -12.80 -10.1141 -14.77 -10.1142 -17.45 -10.1143 -21.33 -10.1144 -27.43 -10.1145 -38.40 -10.1146 -64.00 -10.1147 -99999 -10.11Table 3.2: pT mapping from XFT to the Three Tra k Board. The table shows the pT valuesfor XFT pT bins 0-47, whi h orrespond to negatively harged tra ks. Positively harged tra ksare quanti�ed in bins 48-95, with 48 being high pT and 95 being the lowest pT (i.e.The 0-47 pTordering is ipped for 48-95.) [46℄ The Two Tra k Board used the pT binning provided by theXFT with no translation.43

XFT pT bin range � bin orre tion0� 3 +64� 8 +59� 12 +413� 19 +320� 28 +229� 38 +139� 56 057� 66 �167� 75 �276� 82 �383� 86 �487� 91 �592� 95 �6Table 3.3: Corre tion in going from �SL6 to �0. For ea h range of XFT pT bins, we orre t fortra k urvature in going from �SL6 provided by the XFT to �0 used in the trigger lookups for3TT v1. The bin orre tion listed here is using the 9-bit � resolution (= 1:25Æ).Æ� in 3TT v0In two-tra k emulation phase of the 3TT, the Æ� values utilized were all based upon XFT �SL6.Æ� in 3TT v1To utilize Æ� information to al ulate transverse mass, we need Æ�0. In the 3TT v1 implementa-tion, all Æ� values used for two-tra k triggers are Æ�0.The Æ�0 al ulation is performed on the tra ks before the pT and � ompression. As it omesonto the Three Tra k Board, a �0 for ea h tra k is al ulated based upon �SL6 and pT . Thetranslation used is summarized in Table 3.3. On e we have �0 for ea h tra k, we then al ulateÆ�0 for ea h tra k pair, and then drop the least signi� ant Æ�0 bit.Therefore, in 3TT v1, the Æ�0 granularity is in 2:5Æ steps. We again use the Æ�0 = 155Æ binto signify 155Æ < Æ�0 < 180Æ.Tra ks originating from adja ent XFT linkers (Æ�SL6 = 1:25Æ ignoring mini-�) are assigneda dedi ated Æ�0(bin) = 63, whi h is then used to veto the tra k-pair. This implements the\adja ent linker ut" in the Three Tra k Board that vetoes trigger pairs from adja ent XFTlinkers. Note that this implementation does not a�e t tra ks from non-adja ent linkers that havesmall values of Æ�0. This implementation was spe i� ally hosen to preserve the ability to havean eÆ ient �! K+K� trigger. 44

3.5 Transverse MassWith Æ�0 available in the same lookup RAM as the pT of the two tra ks, we are now able toimplement a transverse mass trigger at Level 1. The transverse mass formula used assumes thetra ks are massless: mT =p2pT (1)pT (2)[1� os(Æ�0)℄;where pT (1) and pT (2) are the pT values of the two tra ks.With the pT and Æ�0 binning used in the Three Tra k Board, the al ulated transverse masshas the following limits:� mT (min) = 0GeV when Æ�0 = 0 (whi h means Æ�0 < 2:5Æ)� mT (max) = 19:7GeV when Æ�0 = 155Æ and pT (1) = pT (2) = 10:11GeV.Obviously the high end has very poor resolution, but it is not the region of interest for mTtriggers. This trigger is designed for B ! h+h�0 (mT � 5GeV) and �! K+K� (mT � 1GeV).3.6 SummaryThe Tra k Trigger Upgrade has been a valuable ontribution to the in reased trigger apabilitiesof Run IIb. It has in reased not only the multipli ity of tra ks whi h an be handled by the CDFtwo tra k triggers, but has made available transverse mass information previously unavailable atthe lowest level triggers.
45

Chapter 4Analysis Strategy and DataSele tion4.1 Introdu tionTo date, CP violation in the B system has only been observed in fully re onstru ted modes atthe e+e� B fa tories. Although the fully re onstru ted �nal states are quite lean, they su�erfrom low yields due to bran hing ratios and dete tor a eptan e. A omplementary te hniquefor sear hing for CP violation at the Tevatron is to perform an in lusive analysis. This in lusivete hnique has the bene�t of high statisti al pre ision thanks to large semileptoni B bran hingratios. In addition, the sample is integrated over all weakly de aying B spe ies produ ed at theTevatron. The hallenge in this te hnique is that any CP violating e�e ts are diluted by large ontributions from known CP onserving pro esses.Our goal is to measure the CP asymmetry:
ACP = N(�+�+)�N(����)N(�+�+) +N(����) (4.1)where N(�+�+) is the number of events with b ! �+X and b ! �+X , and N(����) is thenumber of events with b! ��X and b! ��X .In the Standard Model, b quarks will hadronize with other quarks to form the followingmesons whi h have a bran hing ratio to ����X of about 11%: B;B�; Bs. Additionally, 10% ofb quarks will form b-baryons whi h have a bran hing ratio to ����X of about 9%. In additionto these dire t semimuoni de ays, all these hadrons an produ e �+ by way of harm hadronswhi h de ay semimuoni ally. Neutral B mesons an produ e �+ by os illating before undergoinga semimuoni de ay.� Dire t, b! B;! ��X 46
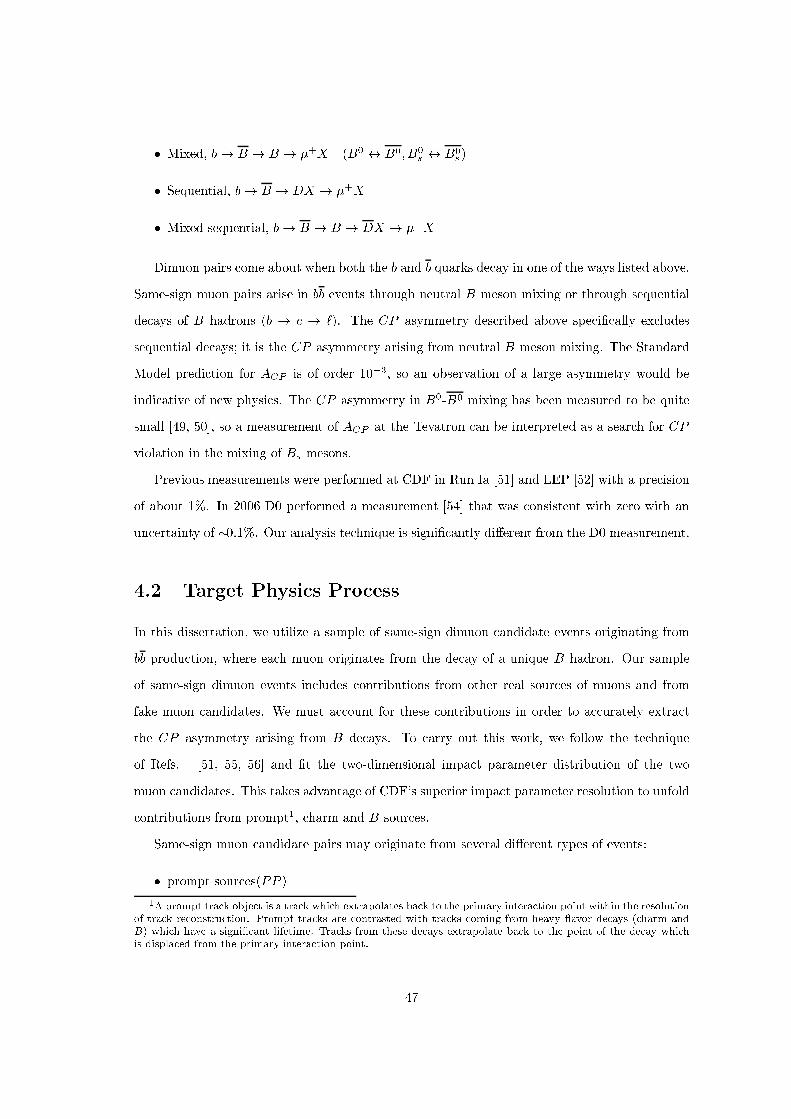
� Mixed, b! B ! B ! �+X (B0 $ B0; B0s $ B0s )� Sequential, b! B ! DX ! �+X� Mixed sequential, b! B ! B ! DX ! ��XDimuon pairs ome about when both the b and b quarks de ay in one of the ways listed above.Same-sign muon pairs arise in bb events through neutral B meson mixing or through sequentialde ays of B hadrons (b ! ! `). The CP asymmetry des ribed above spe i� ally ex ludessequential de ays; it is the CP asymmetry arising from neutral B meson mixing. The StandardModel predi tion for ACP is of order 10�3, so an observation of a large asymmetry would beindi ative of new physi s. The CP asymmetry in B0-B0 mixing has been measured to be quitesmall [49, 50℄, so a measurement of ACP at the Tevatron an be interpreted as a sear h for CPviolation in the mixing of Bs mesons.Previous measurements were performed at CDF in Run Ia [51℄ and LEP [52℄ with a pre isionof about 1%. In 2006 D0 performed a measurement [54℄ that was onsistent with zero with anun ertainty of �0.1%. Our analysis te hnique is signi� antly di�erent from the D0 measurement.4.2 Target Physi s Pro essIn this dissertation, we utilize a sample of same-sign dimuon andidate events originating frombb produ tion, where ea h muon originates from the de ay of a unique B hadron. Our sampleof same-sign dimuon events in ludes ontributions from other real sour es of muons and fromfake muon andidates. We must a ount for these ontributions in order to a urately extra tthe CP asymmetry arising from B de ays. To arry out this work, we follow the te hniqueof Refs. [51, 55, 56℄ and �t the two-dimensional impa t parameter distribution of the twomuon andidates. This takes advantage of CDF's superior impa t parameter resolution to unfold ontributions from prompt1, harm and B sour es.Same-sign muon andidate pairs may originate from several di�erent types of events:� prompt sour es(PP )1A prompt tra k obje t is a tra k whi h extrapolates ba k to the primary intera tion point within the resolutionof tra k re onstru tion. Prompt tra ks are ontrasted with tra ks oming from heavy avor de ays ( harm andB) whi h have a signi� ant lifetime. Tra ks from these de ays extrapolate ba k to the point of the de ay whi his displa ed from the primary intera tion point. 47

{ one real prompt muon, and one K or � re onstru ted as a muon (a fake muon andi-date){ two fake muon andidates� BB hadron pairs where ea h meson de ays semileptoni ally to a muon (BB){ one B meson de ays after mixing (e.g. b! B ! B ! �+X){ one B meson de ays sequentially, b! ! �X� one muon andidate from a semileptoni B or C de ay is present and a prompt muon andidate of the same harge is found(PB and PC).It is interesting to note that there are no signi� ant prompt sour es of same-sign dimuon events.In addition, sin e harm mixing is known to be quite small, events annot ontribute realsame-sign dimuons. Both PP and CC an ontribute to the same-sign dimuon data when atleast one re onstru ted muon andidate is a hadron from prompt or harm sour es respe tivelywhi h fakes a muon.Using a sample of data enri hed in muons from semileptoni B de ays, a template �ttingmethod based on impa t parameter signi� an e (d0=�(d0)) is used to identify the fra tion of BBin same-sign pairs. This method takes advantage of the longer lifetime of B hadrons omparedto other sour es of real muons. The �tting is performed separately for the �+�+ and ���� ase in order to orre t for asymmetries introdu ed by varying muon fake rates and any dete toror trigger asymmetries. Any residual di�eren e in the number of �+�+ and ���� pairs is themeasured CP asymmetry. This is omplimentary to measurements of CP violation in ex lusivede ay modes. Assuming the standard model, CP violation expe ted in BB mixing may beobserved, while a large observation of ACP would indi ate physi s beyond the standard model.4.3 Strategy OverviewThe sele ted trigger provides a large dimuon event olle tion enri hed in muons from B de ays.Initial data sele tion allows the elimination of obvious ba kgrounds su h as osmi rays andsequential dimuons where both muons ome from a single b quark via two sequential semileptoni de ays. The trigger path and initial analysis uts are des ribed in Se tion 4.4 and following.These signal dimuon events still ontain prompt and harm ontributions. Chapter 5 des ribes48

the dimuon d0=�(d0) �tting method used to extra t the fra tion of �+�+ and ���� events thatare from b events. The additional analysis omponents are orre tions to the raw asymmetryof the �tted �+�+ and ���� numbers. Some of the dimuon events �tted to be of B origin infa t ontain a kaon or pion from a B de ay whi h fakes a muon in the dete tor. The signi� antasymmetry introdu ed by these events must be measured as a orre tion and is dis ussed inChapter 6. Finally, the dete tor or event trigger may introdu e a +=� asymmetry whi h mustalso be applied as a orre tion. This evaluation is also des ribed in Se tion 6.4.4 Triggered Data SampleThe dimuon data used for this dissertation was olle ted between Mar h 1, 2002 and January 30,2007 and it orresponds to an integrated luminosity of 1:65 fb�1. Events are presele ted fromCDF stored data a ording to the trigger path. The sele tion riteria for the trigger used are:� At Level 1: Two muons with hits in the CMU hambers are required. These stubs mustextrapolate to tra ks with at least 1.5 GeV of transverse momentum.� At Level 2: At least one of the Level 1 muons must have a orresponding CMP stub andat least 3.0 GeV of transverse momentum.� At Level 3: Both muons are required to have CMP stubs and be of PT � 3:0 GeV.Additionally{ The �X between ea h CMP stub and its orresponding COT tra k, �X mp, must be< 40 m{ �X mu < 20 m{ The invariant mass of the two muon tra ks � 5:0 GeVThere are several advantages of this trigger. First, it is in lusive in that it imposes no opposite harge requirement in ontrast to other dimuon triggers used for targeting various resonan es.Se ond, the invariant mass ut prevents both muons oming from the same b, sin e the b hadronmass is < 5 GeV. In addition to sele tion based on the event trigger only events whi h omefrom data lassi�ed as good for physi s2 for the CMU, CMP, SVX, and COT dete tors is used.2The good for physi s lassi� ation is made on subsets of ea h data store whi h are taken ontinually by thetrigger system. The rew on shift in the ontrol room verify that all of the trigger system is fun tioning properly49

4.5 Cosmi Ray FindingInherent in the triggering pro ess, the bun h stru ture of beams reates timing stru ture for ollisions. This timing an be exploited to reje t most osmi rays not oin ident with beam ollisions. The dete tor's front-end ele troni s are syn hronized with the Tevatron lo k y lesto a omplish this osmi reje tion. There are still osmi events oin ident or nearly oin identwith ollisions that must be removed from the data passing the trigger. A muon from a osmi ray intera tion passing through the dete tor will look very like a displa ed opposite-sign dimuonevent. We examined further timing-related osmi reje tion tools whi h are available in CDFanalysis software [57℄, but found that not all the osmi s were eliminated by applying these uts.We were also on erned about potentially higher reje tion of OS events.A simple reje tion ut based on the angle between the trigger muons, Æ�, was a tually found tobe eÆ ient by another CDF analysis group using dimuon data [56℄. Therefore, we tag osmi raysby a sele tion of muon pairs where Æ� � 3:135 radians. The Æ� method removes the remaining osmi rays from the opposite-sign sample while retaining over 99% of the signal events. Everyevent with a osmi tag is vetoed both from the analysis data and the � ! �+�� data usedin the prompt (PP ) template. Figure 4.1 shows the removal of osmi rays in the OS dimuondataset.4.6 Events Sele tionMost events in the sele ted dataset have two and only two 3 GeV CMUP muon andidates,however in ases where there are more, every pair is evaluated against the following uts. Bothtrigger muon tra ks were required to have at least 3 COT segments with � 5 hits per segmentfor both axial and stereo superlayers(SL). In addition the muon andidates were required to haveat least 3 r � � SVX hits, and no L00 hits are used. The absolute Z0 value of ea h muon tra kwere required to be less than 60 m and the absolute value of the di�eren e between the tra kswas required to be less than 5 m. The impa t parameter of ea h tra k, d0 is required to be atmost 3 mm, and the signi� an e, d0=�(d0) at most 623. These Z0 and d0 sele tion uts help toand the sub dete tors are alibrated and a tive. A sampling of the data is pro essed immediately and monitoredto verify standard distributions.3As will be seen later, the signi� an e distribution drops extremely rapidly for the data, so evenly in reasinguneven bin sizes are used for the �tting to maximize the pre ision at low signi� an e and statisti s at highsigni� an e. Signi� an e being a number of standard deviations, 62 was the integer value nearest to the pointwhere the the statisti s in the 2-dimensional bins were too small to use. Of the data passing the other analysis50

(cm)0d0 0.05 0.1 0.15 0.2 0.25 0.3
(cm
)0d
0
0.05
0.1
0.15
0.2
0.25
0.3
(cm)0d0 0.05 0.1 0.15 0.2 0.25 0.3
(cm
)0d
0
0.05
0.1
0.15
0.2
0.25
0.3
Figure 4.1: Triggered events meeting the sele tion requirements are in luded in these plots withthe d0 of ea h muon along one axis. The top plot does not in lude the � osmi reje tion, and osmi ray events are visible along the d10 = d20 diagonal. The bottom plot shows the same dataafter the osmi reje tion. 51

eliminate tra ks not oming form the primary intera tion region and pairs not oming from thesame primary vertex. Finally, only pairs for whi h the invariant mass of the trigger tra ks was �5 GeV= 2 were sele ted to eliminate ontributions where both muons ome from a single b quarkin a sequential de ay hain. Additionally, for opposite-sign pairs, the mass region whi h in ludesthe upsilon resonan es is ex luded. These event sele tion riteria are summarized in Table 4.1.More than one muon andidate pair meeting these riteria an be found in some events. In this ase all pairs are analyzed.Axial hits � 3 SL with � 5 hitsStereo hits � 3 SL with � 5 hitsSili on r � � hits � 3jZ0j � 60 mjÆZ0j � 5 mM�� � 5 GeVd0 � 0.3 md0=�(d0) � 62ex luded M� (OS only) 9.12 GeV �M�� � 10.5 GeVTable 4.1: Event sele tion for pairs of muon tra ks and stubsAfter applying these uts about 1.1 million pairs remain:� 655,669 �+�� pairs� 235,085 �+�+ pairs� 205,158 ���� pairsThese uts are also used for the � ! �+�� sample utilized for the (PP ) template with theex eption of the invariant mass uts. The PP data sele tion is des ribed in se tion 5.2.2.4.6.1 Trigger Obje t Con�rmationEa h muon andidate pair sele ted for the analysis is initially subje ted to the prerequisite ofbeing in an event meeting all the CDF trigger requirements des ribed in Se tion 4.4. Additionally,an examination is made of all L1 tra k information and L1 hit information in the muon hambersasso iated with muon andidate pairs passing the analysis uts. This on�rmation is meant toverify that ea h sele ted muon andidate pair meets the L1 trigger requirements. There werefound to be about 3% of the sele ted muon andidate pairs not meeting the L1 trigger sele tion,sele tion requirements only around 1.5% of the muon andidate pairs fall outside of 62 sigma.52

meaning that while two muon andidates in the event do pass the trigger, they are not the samemuon andidates passing the analysis sele tion uts. All these pairs are dis arded sin e we orre tfor the measured trigger eÆ ien y asymmetry as des ribed in Se tion 6.2.4.4.6.2 Signal �� Kinemati DistributionsFigures 4.2 - 4.4 shows some indi ative distributions of kinemati variables in the sample ofsele ted signal dimuon data. In addition to looking for normal distributions of individual muon andidates su h as PT , orrelated dimuon quantities are examined, parti ularly variables onwhi h analysis uts are made su h as invariant mass, and Æ(Z0). Also, pro�les of some kinemati variables over a range of impa t parameter are examined sin e the impa t parameter distributionis used to separate BB ontributions from other dimuon sour es.One of the most signi� ant data histograms is the 2D impa t parameter whi h is used todetermine the fra tions of the sour es produ ing muon andidate pairs as des ribed in the nextse tion. Figures 4.6 and 4.5 show the 2D impa t parameter histogram for all the pairs passingthe analysis uts, the x-proje tion of the impa t parameter histogram, and the distribution ofimpa t parameter errors for ea h pair. The muon order has been randomized.
53

(GeV)TP5 10 15 20 25
Num
ber
of E
vent
s
310
410
510
-1CDF Run II Preliminary, L = 1.6 fb
Profile for Selected Events(GeV)TP5 10 15 20 25
) 0(dσ/ 0d
4.0
4.5
5.0
5.5
6.0
-1CDF Run II Preliminary, L = 1.6 fb
Figure 4.2: Signal dimuon andidate kinemati distributions for all muon andidate pairs passinganalysis uts: (top) PT of both muons, and (bottom) PT pro�le over d0 range. (The pro�le isthe average d0 for all pairs in a parti ular PT bin.)54

OS Dimuon Invarinat Mass6 8 10 12 14 16 18 20
Num
ber
of E
vent
s
310
410
-1CDF Run II Preliminary, L = 1.6 fb
Mass Profile for Selected Events6 8 10 12 14 16 18 20
) 0(dσ/ 0d
0
1
2
3
4
5
6
7
-1CDF Run II Preliminary, L = 1.6 fb-1CDF Run II Preliminary, L = 1.6 fb
Figure 4.3: Signal dimuon andidate kinemati distributions for all muon andidate pairs passinganalysis uts (does not in lude same-sign pairs in the � mass region): (top) Invariant mass, and(bottom) Invariant mass pro�le over d0 range. (The pro�le is the average d0 for all pairs in aparti ular mass bin.) 55

) φ(δ0.0 0.5 1.0 1.5 2.0 2.5 3.0
Num
ber
of E
vent
s
0
10000
20000
30000
40000
50000
60000
70000
80000
90000
-1CDF Run II Preliminary, L = 1.6 fb
(Z0) δ0.0 0.5 1.0 1.5 2.0 2.5 3.0 3.5 4.0 4.5 5.0
Num
ber
of E
vent
s
310
410
510
610
-1CDF Run II Preliminary, L = 1.6 fb-1CDF Run II Preliminary, L = 1.6 fb
Figure 4.4: Signal dimuon andidate kinemati distributions for all muon andidate pairs passinganalysis uts: (top)Æ(�) and (bottom) Æ(Z0) between the pair.56

)0(dσ/0d0 10 20 30 40 50 60
Num
ber
of E
vent
s
310
410
510
-1CDF Run II Preliminary, L = 1.6 fb-1CDF Run II Preliminary, L = 1.6 fb
)0(dσ0.000 0.005 0.010 0.015 0.020 0.025 0.030
Num
ber
of E
vent
s
1
10
210
310
410
510
-1CDF Run II Preliminary, L = 1.6 fb-1CDF Run II Preliminary, L = 1.6 fb
Figure 4.5: (top) Proje tion of impa t parameter distribution, and (bottom) Distribution ofimpa t parameter error for all muon andidate pairs passing analysis uts.57

)0(dσ/0d
0102030405060)0(dσ/0
d
0 10 20 30 40 50 60
Nu
mb
er o
f E
ven
ts
1
10
210
310
410
-1CDF Run II Preliminary, L = 1.6 fb
Figure 4.6: Dimuon andidate impa t parameter signi� an e distribution for all same-sign andopposite-sign pairs passing analysis uts. One muon andidate is plotted along ea h axis.58

Chapter 5Impa t Parameter FittingThis hapter des ribes the method by whi h dimuon andidate pairs oming from bb produ tion an be isolated. The fra tion of these signal pairs is measured with respe t to the whole dimuondataset.5.1 Impa t Parameter Signi� an eThe impa t parameter, the distan e of losest approa h to the ollision point, of a muon providesa good way to identify muons originating from heavy avor. Prompt tra ks in the absen e ofa measurement resolution and failed pattern re ognition would have impa t parameters of 0,but these e�e ts ause a Gaussian smearing and some small non-Gaussian tails respe tively.Additionally, tra ks from B hadrons will on average have a mu h longer impa t parameter thanprompt tra ks due to their longer lifetime. Figure 5.1 shows a depi tion of a typi al tra k impa tparameter from a B de ay.Sin e a large fra tion of events with muons fromB de ays would be lost separating prompt and harmmuons fromB muons by utting on impa t parameter, a binned negative log likelihood �t isperformed using two-dimensional impa t parameter signi� an e templates with one muon plottedalong ea h dimension to determine the B ontent. The 2D method allows the identi� ation of PBand PC fra tions where only one muon omes from longer lived heavy avor. While there is no ontribution expe ted from to the same-sign real dimuon sample, a CC omponent is in ludedin the same-sign �ts for ases where a hadron from a de ay fakes a muon. The 2D templates are onstru ted by randomly sele ting values from the appropriate d0=�(d0) distributions. The BBtemplate uses the 1-dimensional distributions for muons oming from B for ea h axis, and PBtemplate sele ts one axis from the B distribution and one from the P distribution. The Minuitfun tion minimization and error analysis program as implemented in the ROOT framework is59

Figure 5.1: Example of a typi al tra k impa t parameter from B de ay.used to perform the �tting [61℄.Be ause of poor �t quality in the tail of the impa t parameter distribution (see Figure C.1 inAppendix A) the template �tting method was modi�ed to in orporate the di�erent un ertainty inthe impa t parameter measurement on a tra k by tra k basis. The impa t parameter signi� an e,d0=�(d0), is essentially a measure of how signi� antly di�erent ea h tra k's impa t parameteris from zero. Again, the longer lived heavy avor has high impa t parameter signi� an e, butwithout the smearing e�e t of di�eren es in impa t parameter measurement error. Ea h d0=�(d0)template has variable binning to maximize the resolution in the low signi� an e region with highstatisti s. Thirty-one bins on ea h axis run from a signi� an e of 0-62�. As dis ussed in Se tion4.6, only 1.5% of the total data passing the other sele tion uts are beyond 62� in signi� an e,and the statisti s population of the distribution in that range is insuÆ ient for �tting.60

5.2 Templates Modeling �� Sour esTwo dimensional templates were onstru ted to model the signal dimuon andidate pairs omingfrom BB and andidate pairs oming from ea h ba kground pro ess.5.2.1 Monte Carlo DistributionsImpa t parameter signi� an e templates were built from 1-dimensional distributions for muons oming from B, C, and P sour es. The B distribution is reated using Pythia Monte Carlo(MC)(see Appendix D for des ription of MC samples). In Evtgen1 we are for ing the b quark in bbevents to de ay to a muon while the b quark de ays freely. Nearly 90% of hadrons ontaingb quarks de ay to a �nal state without a muon. Both de ays need to ontain a muon for ana urate template whi h models signal events. So, for ing one muon de ay boosts the eventstatisti s by redu ing the ne essary pro essing time. We investigated whether any bias mightbe introdu ed by for ing the muon de ays for bb events and found no eviden e that the impa tparameter signi� an e was a�e ted in this way. Only events ontaining a muon with PT � 2.8and j�j � 0:8 were used. The dete tor and trigger response is then simulated for these events.Using the simulated MC events like the sele ted data, pairs of two trigger CMUP muonsmeeting the same analysis uts used for muons in the data are required. BB mixing is turned o�in Monte Carlo. MC events whi h ontain quark produ tion are also analyzed in nearly thesame manner to reate the C impa t parameter signi� an e distribution. The two di�eren es forthe distribution are that any events ontaining any b quark produ tion are ex luded from the harm templates and there were no for ed muon de ays.5.2.2 Prompt DistributionIt is diÆ ult to properly model a prompt impa t parameter distribution where dete tor responseand resolution play so signi� ant a role. Therefore, the d0=�(d0) template a ounting for aseswhere muons originate from prompt sour es is onstru ted from data in the mass range whi his ex luded from the main analysis. Figure 5.4 shows the upsilon mass region used to onstru tthe distribution of prompt muons. Events for the PP template meet all the same analysis utsas normal data events ex ept they are required to have 9.12 GeV < M�� < 10.5 GeV. Dimuon1Evtgen is a spe ial event generator for more a urately handling B de ays. See also Appendix D.61

) 0(dσ/0d0 10 20 30 40 50 60
310
410
µµ →BB
) 0(dσ/0d0 10 20 30 40 50 60
210
310
410
510
µµ →BP
) 0(dσ/0d0 10 20 30 40 50 60
210
310
410
510
µµ →CC
) 0(dσ/0d0 10 20 30 40 50 60
210
310
410
510
µµ →CP
Figure 5.2: 1D Proje tions of the dimuon d0=�(d0) templates for ea h of the following templates:(a)both muons originate from a B hadron, (b)one muon is from B and one is a prompt tra k,(b)both muons originate from a C hadron, and where (d)one muon is from C and one is a prompttra k.62

σ/0d0 10 20 30 40 50 60
σ/ 0d
0
10
20
30
40
50
60
BB template
σ/0d0 10 20 30 40 50 60
σ/ 0d
0
10
20
30
40
50
60
BP template
σ/0d0 10 20 30 40 50 60
σ/ 0d
0
10
20
30
40
50
60
CC template
σ/0d0 10 20 30 40 50 60
σ/ 0d
0
10
20
30
40
50
60
CP template
Figure 5.3: Dimuon d0=�(d0) templates for ea h of the following templates: (a)both muonsoriginate from a B hadron, (b)one muon is from B and one is a prompt tra k, (b)both muonsoriginate from a C hadron, and where (d)one muon is from C and one is a prompt tra k.63

impa t parameters for events in the �(1S) and �(2S) narrow mass ranges, 9.31 < M�� < 9.61GeV and 9.91 < M�� < 10.13 GeV respe tively, are saved for the PP template. Events meetingthe identi al uts are used for ba kground subtra tion in the following mass regions:� 9.12<M�� < 9.27 GeV� 9.65<M�� < 9.91 GeV� 10.13<M�� < 10.24 GeVThe 2D d0=�(d0) plot resulting for this ba kground subtra tion is a very pure sample of realprompt dimuons. A 1D proje tion of the �nal template used for �tting the prompt fra tion isshown in Figure 5.5; the long tail models mis-measured prompt tra ks.5.2.3 Data and Monte Carlo ComparisonsA number of omparisons were made between various kinemati aspe ts of the Monte Carlosamples used to build impa t parameter signi� an e templates and muon pairs from the data.The MC templates used in the analyses were determined to model dimuon pairs orre tly; twoof the ross he ks are brie y des ribed below.Upsilon d0 DistributionsA set of �(1s) events was produ ed in Monte Carlo for the purpose of ross- he king the PPtemplate sin e it is produ ed di�erently than the other templates and for the purpose of examininghow well the MC simulates the d0 error distribution. The �(d0) has a slightly longer tail in thedata - a mean of 0.0227 �m versus 0.0219 �m from the Monte Carlo - but the distributionsare satisfa torily onsistent. Of more interest is the (d0)=�(d0) whi h is also longer in the data(a mean of 2.01 versus 1.46 in MC). This e�e t is possibly due to pattern re ognition failuresnot modeled in the MC or ba kground subtra tion in the data. However, substituting the MCtemplate as the PP input in the �tter as a ross- he k (see Se tion 5.6.1) a�e ted only the PPand PC balan e by a few per ent and left the BB ontribution un hanged.Muon PT DistributionsAdditionally, a omparison is made between the PT distributions of single muons used in the BBMC template and data. Muons from same sign pairs in data with d0 > 0.09 m are used to insure64

Invariant Mass in Upsilon Region (GeV)9.0 9.2 9.4 9.6 9.8 10.0 10.2 10.4
Num
ber
of E
vent
s
2000
4000
6000
8000
10000
12000
14000
16000
18000
-1CDF Run II Preliminary, L = 1.6 fb-1CDF Run II Preliminary, L = 1.6 fb
Figure 5.4: �! �+�� invariant mass region. Events shown meet the same kinemati sele tionas the dimuon events in the asymmetry measurement, but are used instead to model muons fromprompt sour es.65

) 0(dσ/0d0 10 20 30 40 50 60
1
10
210
310
410
µµ →PP
Figure 5.5: 1D Proje tion of the dimuon d0 template where both muons are prompt (derivedfrom �! �� data)a high purity of muons from B de ays for this omparison. Figure 5.7 shows the omparison ofthe distributions are in good kinemati agreement.5.3 Likelihood FitterWhile the �+�� omponent fra tions are not needed for the ACP measurement, it is desirableto �t all three datasets together in order to examine their relative ontributions. For instan e,in pairs with one real muon from heavy avor and a se ond fake muon from a prompt sour e,the probability that the ombination is same-sign should be the same as the probability that the ombination is opposite sign. This requires the assumption that the two re onstru ted muons areun orrelated, it makes no statement about the relationship between �+�+ and ���� sour es.We also expe t the ratio of all same-sign to all opposite-sign BB dimuons to give a reasonablevalue for the time-integrated mixing parameter, and the same-sign CC to be signi� antly smallerthan the opposite-sign CC.There are nine free parameters in the �t. The �+��, �+�+, and ���� fra tions of PP ,BB,and PB. The fra tion of pairs from CC for ea h dataset is de�ned to be 1�fBB�fPP �fPB66

0 0.005 0.01 0.015 0.02 0.025 0.03
-510
-410
-310
-210
-110
0 10 20 30 40 50 60
-410
-310
-210
-110
Figure 5.6: Comparison of (a)d0 errors and (b)d0=�(d0) for data (blue) and MC (red) upsilons.All distributions are normalized to unit area.67

(GeV)µ of CMUP T P4 6 8 10 12 14 16 18 20
0
0.02
0.04
0.06
0.08
0.1 for data versus MCT PµNormalized Distribution of
Figure 5.7: Comparison of PT distributions for muons from B hadron de ays in MC (points) anddata (histogram).
68

where fXY is the fra tion for ea h free parameter omponent. The PC omponents are set tozero in the default �t. If the PC omponents were allowed to oat freely in the �t they wouldreturn negative values. We in lude two ross- he ks whi h hold PC omponents proportional totheir respe tive PB fra tions.The quantity minimized for ea h set of data is of the form given by equation 5.1 where theindi es i; j run over all 2-D impa t parameter signi� an e bins. The number of pairs in a bin isgiven by N�+��(ij) for the data and NBB(ij) for ea h omponent distribution. The fra tion ofthe BB omponent is represented by fBB , et . The likelihood fun tion is the same for the �+�+and ���� ases as well:Xi Xj N�+��(ij) � log(fij)� fijfij = NBB(ij) � fBB +NPB(ij) � fPB +NPP (ij) � fPP +NCC(ij) � fCC : (5.1)There are no bounds pla ed on the parameters. The onstraint that fra tions total 100%,built into the de�nition of fCC is to fa ilitate a physi al output, but we used no other onstraintsin the default �t. Where onstraints are used in the ross- he ks, a �2 penalty term is added tothe negative log likelihood for the other onstraints listed above. For example, when the numberof PB same sign pairs should be equal to the number of PB opposite sign pairs within statisti s,the penalty term is (PBOS�PBSS)2jPBOS+PBSSj .5.4 Fit QualitySin e the negative log likelihood is the quantity being minimized for this �t, there is no exa tmeasure of �t quality [62℄. One he k of �t quality is to use the �tted fra tions to s ale ea h omponent template and ompare the sum of the resulting template histograms to the dataplot. The poor �t quality found at high d0 when this he k was performed led to hangingthe �tted quantity from d0 to d0 signi� an e (see Appendix C). After the data was �tted byimpa t parameter signi� an e the quality of �t de�ned by the omparison of proje tions of the omponents times �tted fra tions to the data improves markedly for the ombined same-signsample though still not quite as good as the opposite-sign sample, see Figure 5.10.69

σ/0d0 10 20 30 40 50 60
σ/ 0d
0
10
20
30
40
50
60
-1, CDF Run II Preliminary, L = 1.6 fbµµ →Upsilon
σ/0d0 20 40 60
σ/ 0d
0
10
20
30
40
50
60
-1 pairs, CDF Run II Preliminary, L = 1.6 fb-µ+µ
Figure 5.8: Two-dimensional impa t parameter signi� an e distributions for PP (top) and �+��(bottom) dimuon pair data. 70

σ/0d0 20 40 60
σ/ 0d
0
10
20
30
40
50
60
-1 pairs, CDF Run II Preliminary, L = 1.6 fb+µ+µ
σ/0d0 20 40 60
σ/ 0d
0
10
20
30
40
50
60
-1 pairs, CDF Run II Preliminary, L = 1.6 fb-µ-µ
Figure 5.9: Two-dimensional impa t parameter signi� an e distributions for �+�+ (top) and���� (bottom) dimuon pair data. 71

Another measure used to quantify the �t quality is a �2 variable onstru ted from the bin-by-bin omparison of the �t parameters to the data in ea h bin. In this ase the �+�+ and ���� ontributions are smaller than the �+��, but the ombined �t quality is �2=DOF 2 = 4.20. This�2=DOF is large due to the fa t that it onsiders only simple Gaussian errors on the data, andno un ertainty for template statisti s or �t parameter error. It is used to quantify the relative�t quality of the various ross- he ks.Finally we performed a s an of �3� around the minimum of ea h parameter after the opti-mization. This he k demonstrates that the parameter minimization is well behaved. The results an be found in Figures 5.11 to 5.13.
0 10 20 30 40 50 600
10000
20000
30000
40000
50000
60000
70000
0 10 20 30 40 50 600
10000
20000
30000
40000
50000
60000
70000Y-proj Profiles
OS Data [444218]PP [72731 +/- 1241]BB [270051 +/- 1185]BP [5665 +/- 605]CC [88462 +/- 2259]CP [7194 +/- 1631]
Fitted fractions OS (y-proj)
0 10 20 30 40 50 60
310
410
0 10 20 30 40 50 60
310
410
X-proj ProfilesOS Data [444218]PP [72731 +/- 1241]BB [270051 +/- 1185]BP [5665 +/- 605]CC [88462 +/- 2259]CP [7194 +/- 1631]
Fitted fractions OS (x-proj)
0 10 20 30 40 50 600
5000
10000
15000
20000
25000
30000
35000
40000
0 10 20 30 40 50 600
5000
10000
15000
20000
25000
30000
35000
40000Y-proj Profiles
SS Data [256307]PP [63015 +/- 1035]BB [180200 +/- 766]BP [5734 +/- 611]CP [7214 +/- 1635]
Fitted fractions SS (y-proj)
0 10 20 30 40 50 60
310
410
0 10 20 30 40 50 60
310
410
X-proj ProfilesSS Data [256307]PP [63015 +/- 1035]BB [180200 +/- 766]BP [5734 +/- 611]CP [7214 +/- 1635]
Fitted fractions SS (x-proj)
Figure 5.10: Opposite-sign (top) and ombined same-sign (bottom) �tted proje tions of outputfra tions ompared to data on log and linear s ale2degrees of freedom72

Number of muon pairs140 142 144 146
310×
Val
ue o
f Lik
elih
ood
-6886.866
-6886.865
-6886.864
-6886.863
-6886.862
-6886.861
-6886.860
310×
Number of muon pairs140 142 144 146
310×
Val
ue o
f Lik
elih
ood
-6886.866
-6886.865
-6886.864
-6886.863
-6886.862
-6886.861
-6886.860
310×-µ+µPP parameter for
Number of muon pairs286 288 290 292 294
310×
Val
ue o
f Lik
elih
ood
-6886.866
-6886.865
-6886.864
-6886.863
-6886.862
-6886.861
-6886.860
-6886.859
310×
Number of muon pairs286 288 290 292 294
310×
Val
ue o
f Lik
elih
ood
-6886.866
-6886.865
-6886.864
-6886.863
-6886.862
-6886.861
-6886.860
-6886.859
310×-µ+µBB parameter for
Number of muon pairs35000 40000 45000
Val
ue o
f Lik
elih
ood
-6886.866
-6886.865
-6886.864
-6886.863
-6886.862
-6886.861
310×
Number of muon pairs35000 40000 45000
Val
ue o
f Lik
elih
ood
-6886.866
-6886.865
-6886.864
-6886.863
-6886.862
-6886.861
310×-µ+µPB parameter for
Figure 5.11: Ea h graph represents the �3� s an of the free parameters after minimization foropposite sign: PP ,BB, and PB. All show good paraboli minimums.73

Number of muon pairs56000 57000 58000 59000
Val
ue o
f Lik
elih
ood
-6886.866
-6886.865
-6886.864
-6886.863
-6886.862
-6886.861
-6886.860
310×
Number of muon pairs56000 57000 58000 59000
Val
ue o
f Lik
elih
ood
-6886.866
-6886.865
-6886.864
-6886.863
-6886.862
-6886.861
-6886.860
310×+µ+µPP parameter for
Number of muon pairs86000 87000 88000 89000
Val
ue o
f Lik
elih
ood
-6886.866
-6886.865
-6886.864
-6886.863
-6886.862
-6886.861
-6886.860
-6886.859310×
Number of muon pairs86000 87000 88000 89000
Val
ue o
f Lik
elih
ood
-6886.866
-6886.865
-6886.864
-6886.863
-6886.862
-6886.861
-6886.860
-6886.859310×
+µ+µBB parameter for
Number of muon pairs34000 36000 38000 40000
Val
ue o
f Lik
elih
ood
-6886.866
-6886.865
-6886.864
-6886.863
-6886.862
-6886.861
310×
Number of muon pairs34000 36000 38000 40000
Val
ue o
f Lik
elih
ood
-6886.866
-6886.865
-6886.864
-6886.863
-6886.862
-6886.861
310×+µ+µPB parameter for
Figure 5.12: Ea h graph represents the �3� s an of the free parameters after minimization for�+�+: PP ,BB, and PB. All show good paraboli minimums.74

Number of muon pairs42000 43000 44000 45000 46000
Val
ue o
f Lik
elih
ood
-6886.866
-6886.865
-6886.864
-6886.863
-6886.862
-6886.861
-6886.860
310×
Number of muon pairs42000 43000 44000 45000 46000
Val
ue o
f Lik
elih
ood
-6886.866
-6886.865
-6886.864
-6886.863
-6886.862
-6886.861
-6886.860
310×-µ-µPP parameter for
Number of muon pairs83000 84000 85000 86000 87000
Val
ue o
f Lik
elih
ood
-6886.866
-6886.865
-6886.864
-6886.863
-6886.862
-6886.861
-6886.860
-6886.859
310×
Number of muon pairs83000 84000 85000 86000 87000
Val
ue o
f Lik
elih
ood
-6886.866
-6886.865
-6886.864
-6886.863
-6886.862
-6886.861
-6886.860
-6886.859
310×-µ-µBB parameter for
Number of muon pairs32000 34000 36000
Val
ue o
f Lik
elih
ood
-6886.866
-6886.865
-6886.864
-6886.863
-6886.862
-6886.861
310×
Number of muon pairs32000 34000 36000
Val
ue o
f Lik
elih
ood
-6886.866
-6886.865
-6886.864
-6886.863
-6886.862
-6886.861
310×-µ-µPB parameter for
Figure 5.13: Ea h graph represents the �3� s an of the free parameters after minimization for����: PP ,BB, and PB. All show good paraboli minimums.75

5.5 Fit ResultsTable 5.1 lists the per entages and errors that are the returned values of ea h parameter. These orrespond to the templates des ribed above as omponents of the �+��, �+�+, and ����signal data. All three �ts are performed simultaneously. PC omponents are set to zero sin ethey would otherwise return large negative values. This e�e t is primarily due to the overlapbetween CC and PC templates, and the in lusion of CC templates to the same-sign �tting. omponent opposite-sign (�+��) same-sign (�+�+) same-sign (����)PP 21.29 � 0.17 28.58 � 0.28 25.21 � 0.30BB 42.90 � 0.19 45.31 � 0.32 50.42 � 0.35PB 6.78 � 0.28 16.95 � 0.48 17.66 � 0.53CC 29.03 � 0.38 9.16 � 0.64 6.71 � 0.70# BB 281,252 106,519 103,143Table 5.1: Fit results. All numbers listed in per ent. Given errors re e t statisti al un ertaintyonly.The total same-sign sample is around 50% b�b, with the majority of the remainder of thesample oming from PP sour es in agreement with previous measurements of this type. Thelarger opposite-sign sample shows a lower b�b purity, and has a more signi� ant � omponent.From the b�b fra tions reported in Table 5.1, we �nd 106,519� 739 �+�+ dimuons and 103,449� 711 ���� dimuons of b�b origin. These yields orrespond to a raw asymmetry ofAraw = 0:0146� 0:0049 (5.2)Proje tions of the data ompared to the proje tions of ea h template weighted by its �ttedfra tion are shown in Figures 5.14 and 5.15 for �+��, Figures 5.16 and 5.17 for �+�+, andFigures 5.18 and 5.19 for ���� data. The orrelation matrix is shown in Table 5.2.5.6 Robustness of ResultsSeveral groups of he ks were performed to investigate the stability or robustness of the �ttedresults under variations of the template shapes and methods. Additionally, ross- he ks onthe asymmetry result for sub-samples of the data are examined, as is a ross- he k whi h isindependent of �tted fra tions. 76

)0(dσ/0d0 20 40 60
Num
ber
of E
vent
s
0
20
40
60
80
100
310×
)0(dσ/0d0 20 40 60
Num
ber
of E
vent
s
0
20
40
60
80
100
310×-1CDF Run II Preliminary, L = 1.6 fb
Y-projectionOS Data [655669]PP [139600 +/- 1124]BB [281252 +/- 1260]BP [44447 +/- 1834]CC [190369 +/- 2493]
)0(dσ/0d0 10 20 30 40 50 60
, OS
dat
a (y
-pro
j)σ
(dat
a-fit
)/
-4
-2
0
2
4
6
8
-1CDF Run II Preliminary, L = 1.6 fb-1CDF Run II Preliminary, L = 1.6 fb
Figure 5.14: The top plot is a omparison of the total �tted omponent ontribution omparedto the data (y-proje tion) for �+�� �t on a linear s ale. The bottom plot is the �+�� dataminus the total �t in ea h proje ted bin divided by the un ertainty.77

)0(dσ/0d0 20 40 60
Num
ber
of E
vent
s
210
310
410
510
)0(dσ/0d0 20 40 60
Num
ber
of E
vent
s
210
310
410
510
-1CDF Run II Preliminary, L = 1.6 fb
X-projectionOS Data [655669]PP [139600 +/- 1124]BB [281252 +/- 1260]BP [44447 +/- 1834]CC [190369 +/- 2493]
)0(dσ/0d0 20 40 60
, OS
dat
a (x
-pro
j)σ
(dat
a-fit
)/
-4
-2
0
2
4
6
8
-1CDF Run II Preliminary, L = 1.6 fb-1CDF Run II Preliminary, L = 1.6 fb
Figure 5.15: The top plot is a omparison of the total �tted omponent ontribution omparedto the data (x-proje tion) for �+�� �t on a log s ale. The bottom plot is the �+�� data minusthe total �t in ea h proje ted bin divided by the un ertainty.78

)0(dσ/0d0 10 20 30 40 50 60
Num
ber
of E
vent
s
0
5000
10000
15000
20000
25000
30000
35000
40000
)0(dσ/0d0 10 20 30 40 50 60
Num
ber
of E
vent
s
0
5000
10000
15000
20000
25000
30000
35000
40000
-1CDF Run II Preliminary, L = 1.6 fb
Y-projectionplus-plus Data [235085]PP [67195 +/- 666]BB [106519 +/- 739]BP [39839 +/- 1118]CC [21532 +/- 1497]
)0(dσ/0d0 10 20 30 40 50 60
(dat
a-fit
)/er
ror,
++
dat
a (y
-pro
j)
-2
0
2
4
6
8
-1CDF Run II Preliminary, L = 1.6 fb-1CDF Run II Preliminary, L = 1.6 fb
Figure 5.16: The top plot is a omparison of the total �tted omponent ontribution omparedto the data (y-proje tion) for �+�+ �t on a linear s ale. The bottom plot is the �+�+ dataminus the total �t in ea h proje ted bin divided by the un ertainty.79

)0(dσ/0d0 20 40 60
Num
ber
of E
vent
s
210
310
410
)0(dσ/0d0 20 40 60
Num
ber
of E
vent
s
210
310
410
-1CDF Run II Preliminary, L = 1.6 fb
X-projectionplus-plus Data [235085]PP [67195 +/- 666]BB [106519 +/- 739]BP [39839 +/- 1118]CC [21532 +/- 1497]
)0(dσ/0d0 20 40 60
(dat
a-fit
)/er
ror,
++
dat
a (x
-pro
j)
-2
0
2
4
6
8
-1CDF Run II Preliminary, L = 1.6 fb-1CDF Run II Preliminary, L = 1.6 fb
Figure 5.17: The top plot is a omparison of the total �tted omponent ontribution omparedto the data (x-proje tion) for �+�+ �t on a log s ale. The bottom plot is the �+�+ data minusthe total �t in ea h proje ted bin divided by the un ertainty.80

)0(dσ/0d0 10 20 30 40 50 60
Num
ber
of E
vent
s
0
5000
10000
15000
20000
25000
30000
)0(dσ/0d0 10 20 30 40 50 60
Num
ber
of E
vent
s
0
5000
10000
15000
20000
25000
30000
-1CDF Run II Preliminary, L = 1.6 fb
Y-projectionminus-minus Data [205158]PP [51723 +/- 620]BB [103449 +/- 711]BP [36225 +/- 1079]CC [13762 +/- 1433]
)0(dσ/0d0 10 20 30 40 50 60
(dat
a-fit
)/er
ror,
- -
dat
a (y
-pro
j)
-2
0
2
4
6
-1CDF Run II Preliminary, L = 1.6 fb-1CDF Run II Preliminary, L = 1.6 fb
Figure 5.18: The top plot is a omparison of the total �tted omponent ontribution omparedto the data (y-proje tion) for ���� �t on a linear s ale. The bottom plot is the ���� dataminus the total �t in ea h proje ted bin divided by the un ertainty.81

)0(dσ/0d0 20 40 60
Num
ber
of E
vent
s
210
310
410
)0(dσ/0d0 20 40 60
Num
ber
of E
vent
s
210
310
410
-1CDF Run II Preliminary, L = 1.6 fb
X-projectionminus-minus Data [205158]PP [51723 +/- 620]BB [103449 +/- 711]BP [36225 +/- 1079]CC [13762 +/- 1433]
)0(dσ/0d0 20 40 60
(dat
a-fit
)/er
ror,
- -
dat
a (x
-pro
j)
-2
0
2
4
6
8
-1CDF Run II Preliminary, L = 1.6 fb-1CDF Run II Preliminary, L = 1.6 fb
Figure 5.19: The top plot is a omparison of the total �tted omponent ontribution omparedto the data (x-proje tion) for ���� �t on a log s ale. The bottom plot is the ���� data minusthe total �t in ea h proje ted bin divided by the un ertainty.82

OS PP OS BB OS PB ++ PP ++BB ++ PB �� PP �� BB �� PBOS BB 0.519 - - - - - - - -OS PB -0.066 -0.311 - - - - - - -OS CC -0.678 -0.521 -0.559 - - - - - -+ +BB 0.000 0.000 0.000 0.500 - - - - -+ + PB 0.000 0.000 0.000 -0.081 -0.302 - - - -+ + CC 0.000 0.000 0.000 -0.650 -0.506 -0.578 - - -��BB 0.000 0.000 0.000 0.000 0.000 0.000 0.509 - -�� PB 0.000 0.000 0.000 0.000 0.000 0.000 -0.084 -0.311 -�� CC 0.000 0.000 0.000 0.000 0.000 0.000 -0.645 -0.500 -0.582Table 5.2: Correlation oeÆ ients for ea h parameter in the minimization. Ea h data subsample is independent from the others.
83

5.6.1 Fit VariationsTable 5.3 summarizes the BB fra tions, measured asymmetry and un ertainty for the default �tand a number of variations. Also shown is a goodness-of-�t relative to the default �t. The �2used for goodness-of-�t omparison is onstru ted from the bin-by-bin omparison of the sum of omponents weighted by �t parameter to the data onsidering only simple Gaussian errors on thedata. No un ertainty for template statisti s or �t parameter error is in luded. The ratio is usedto quantify the �t quality of the various ross- he ks relative to the default �t and not absolutegoodness of �t. The results demonstrate a onsisten y in the asymmetry and un ertainty evenwhen BB fra tions may be shifted.The variations an be des ribed as follows:� 1-3, The PB and PC templates have a sizable overlap, so �t 1 examines them underthe onditions where only PC is used instead of only the PB. In �ts 2 and 3 they are onstrained to be proportional to ea h other.� 4-6, The dependen e of the �t on the onstraints des ribed in Se tion 5.3 is probed, as wellas the e�e t of dis arding the last bins on ea h axis.� 7,8, The PP template is the only one extra ted from data. Here we examine two otherprompt possibilities. MC upsilon templates in the pla e of data upsilons, and adding anadditional prompt template omprised only of fake muons.� 9-16, The MC generated templates are repla ed with s aled templates making them longeror shorter impa t parameter distributions.� 17, All pairs in whi h a muon had large d0 error are removed.� 18, All pairs with a large �(Z0) are removed.� 19, Only pairs with 5 Sili on hits are onsidered.� 20, Same-sign data from the � mass region is ex luded from the �t.� 21, All impa t parameter errors for muons is the data are in reased by 30%.� 22, Used templates made from Herwig Monte CarloThese variations are treated as ross- he ks, but their behavior ontributes to our determi-nation of the overall �tting systemati un ertainty.84
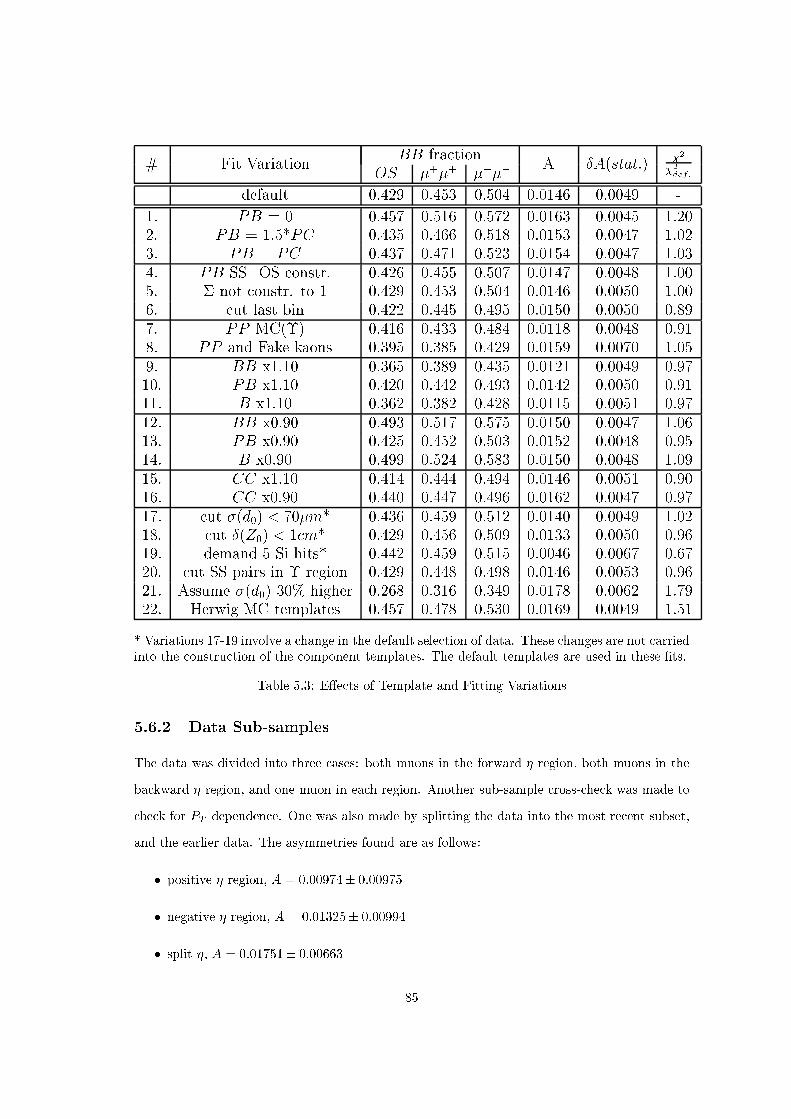
# Fit Variation BB fra tion A ÆA(stat:) �2�2def:OS �+�+ ����default 0.429 0.453 0.504 0.0146 0.0049 -1. PB = 0 0.457 0.516 0.572 0.0163 0.0045 1.202. PB = 1.5*PC 0.435 0.466 0.518 0.0153 0.0047 1.023. PB = PC 0.437 0.471 0.523 0.0154 0.0047 1.034. PB SS=OS onstr. 0.426 0.455 0.507 0.0147 0.0048 1.005. � not onstr. to 1 0.429 0.453 0.504 0.0146 0.0050 1.006. ut last bin 0.422 0.445 0.495 0.0150 0.0050 0.897. PP MC(�) 0.416 0.433 0.484 0.0118 0.0048 0.918. PP and Fake kaons 0.395 0.385 0.429 0.0159 0.0070 1.059. BB x1.10 0.365 0.389 0.435 0.0121 0.0049 0.9710. PB x1.10 0.420 0.442 0.493 0.0142 0.0050 0.9111. B x1.10 0.362 0.382 0.428 0.0115 0.0051 0.9712. BB x0.90 0.493 0.517 0.575 0.0150 0.0047 1.0613. PB x0.90 0.425 0.452 0.503 0.0152 0.0048 0.9514. B x0.90 0.499 0.524 0.583 0.0150 0.0048 1.0915. CC x1.10 0.414 0.444 0.494 0.0146 0.0051 0.9016. CC x0.90 0.440 0.447 0.496 0.0162 0.0047 0.9717. ut �(d0) < 70�m* 0.436 0.459 0.512 0.0140 0.0049 1.0218. ut Æ(Z0) < 1 m* 0.429 0.456 0.509 0.0133 0.0050 0.9619. demand 5 Si hits* 0.442 0.459 0.515 0.0046 0.0067 0.6720. ut SS pairs in � region 0.429 0.448 0.498 0.0146 0.0053 0.9621. Assume �(d0) 30% higher 0.268 0.316 0.349 0.0178 0.0062 1.7922. Herwig MC templates 0.457 0.478 0.530 0.0169 0.0049 1.51* Variations 17-19 involve a hange in the default sele tion of data. These hanges are not arriedinto the onstru tion of the omponent templates. The default templates are used in these �ts.Table 5.3: E�e ts of Template and Fitting Variations5.6.2 Data Sub-samplesThe data was divided into three ases: both muons in the forward � region, both muons in theba kward � region, and one muon in ea h region. Another sub-sample ross- he k was made to he k for PT dependen e. One was also made by splitting the data into the most re ent subset,and the earlier data. The asymmetries found are as follows:� positive � region, A = 0:00974� 0:00975� negative � region, A = 0:01325� 0:00994� split �, A = 0:01751� 0:00663 85

� both muons Pt < 4.2 GeV, A = 0:00961� 0:00816� both muons Pt > 4.2 GeV, A = 0:01639� 0:01098� muons split in Pt, A = 0:01812� 0:00726� data before Sept. 2005, A = 0:00751� 0:00723� data after Sept. 2005, A = 0:02039� 0:006625.6.3 Fit-less Asymmetry EstimateIn order to test whether the �tting te hnique might introdu e any asymmetry, we examined the�+�+ and ���� data in a region that is mostly BB. The region hosen for onsideration isthe one where both muons have an impa t parameter signi� an e greater than 9.5�. The BBtemplate has 7.2% of its events in this region. While there are no prompt events, the PC, PB,CC templates have 0.1%, 0.2%, 0.8% of their events is this region respe tively. This gives arough estimate that around 88% of the events in this region are BB. Fitting the same-sign datafrom 9.5� to 62� also returns a value > 90% BB. Counting �+�+ and ���� data in this regionyields 16,350 pairs with an asymmetry of A : 0:0142� 0:0078. Thus, there is in this same-signsubset whi h is approximately BB an asymmetry on the order of 1-2% whi h does not appearto be an artifa t of the �tting te hnique.5.6.4 Robustness SummaryBased on the �t variations, sub-samples, and �t-less asymmetry estimate, we �nd the �t to bestable and onsistent under variation. The only �t variation whi h gives any signi� ant deviationof the raw asymmetry is the one whi h demands two extra hits in the sili on dete tor. Thisdoes not raise a very great on ern be ause of the onsisten y of the other he ks and be ausethis represents a signi� ant hange in sele tion riteria whi h is not modeled in the templates.The �t quality appears to be better than the default, but this e�e t is primarily from the lossof statisti s. The higher statisti al error helps to hide any underlying systemati un ertaintyfrom the template shape. In a tuality, the di�eren e in sele tion riteria between the data andtemplates is a large sour e of un ertainty. The sub-samples with the largest variation are theearly and later olle ted data. But both samples are onsistent with the default �t within one86

standard deviation. From the asymmetry variation in Table 5.3 a systemati un ertainty of 0.002is assessed for the template shape and �tting. This un ertainty is dis ussed further in Se tion7.2.
87

Chapter 6Asymmetry Corre tionsOn e the same-sign dimuon sample from BB sour es is isolated, it must be orre ted for anyknown asymmetri ontributions to measure the CP asymmetry. Se tion 6.1 dis usses an asym-metri ontribution arising from hadrons in B de ays whi h are re onstru ted as muon andi-dates. Se tion 6.2 outlines the examination of any asymmetries whi h might be introdu ed bythe dete tor systems or the CDF trigger in the pro ess of data olle tion.6.1 Fake Muons Within the BB SampleThere is a signi� ant ontribution of real bb de ays where at least one of the CMUP muon andi-dates is not a real muon. A pion or kaon from a hadroni b de ay has only a very small probabilityto pun h-through the alorimeters and other material in front of the muon hambers. However,there are about �ve times more kaons and pions meeting the sele tion requirements produ ed inB de ays than are muons. Thus, pun h-though hadrons an be a signi� ant ba kground. Sim-ilarly, kaons and pions from B de ays may de ay in ight produ ing a muon with a traje toryindistinguishable from the original hadron. In both ases, these hadrons are a tually of bb originand largely irredu ible as a ba kground sin e their signature as a CMUP muon andidate is thesame as the signature of real signal muons.6.1.1 Hadron Charge AsymmetryThe nu lear ross se tion of K+ hadrons is di�erent than that of K� hadrons1. As a result,about 50% more K+ hadrons rea h the CMP and are re onstru ted as muon andidates. Thisasymmetri e�e t must be orre ted for in the same-sign dimuon sample a ording to the prob-abilities that muon andidates in the �tted �+�+ and ���� totals are really hadrons instead of1The nu lear ross se tion of �+ and �� are also unequal, but this is a mu h smaller e�e t and in previousanalyses has been negle ted. Corre tions are made for both pions and kaons in this analysis.88

muons. The orre tion is made by assessing the relative probabilities that a �, �, or K, wouldbe produ ed in B meson de ays, would meet the analysis kinemati requirements, and would bere onstru ted as a CMUP muon andidate.6.1.2 D� Re onstru tionIn order to assess an a urate value for the very low rate at whi h K�, K+, ��, and �+ parti lesare re onstru ted as CMUP muon andidates, a large, very pure sample of ea h of the hadronsis needed. The pro ess2 D�+ ! D0 �+soft, D0 ! K� �+ is olle ted by the CDF tra k triggerand an be used to identify ea h of the hadrons by the harge of the soft pion. About 4 millionD�+ ! D0 �+soft, D0 ! K� �+ andidate events are re onstru ted from the two-tra k triggerdata using the standard analysis sele tion found in [63℄. Sele ted tra k pairs with an invariantmass around the D0 mass are �tted to form a de ay vertex where the �t quality is required to be�2 < 15. Soft pion andidate tra ks are then added to form a D� vertex �t where the �t quality isrequired to be �2 < 40. Events are sele ted with a mass di�eren e 0.144 GeV < m(D�)�m(D0)< 0.147 GeV, giving a fairly pure olle tion of D� ! D0 �+soft. The mass di�eren e distributionfrom the vertex �tting re onstru tion before �nal event sele tion is shown in Figure 6.1.Kaons and pions identi�ed from the D0 de ays in this initial dataset are then required to meetsele tion riteria similar to the dimuon analysis sele tion. Tra ks must have PT > 3.0 GeV, atleast 3 sili on r� � hits, and the j�j < 0.6 to be onsidered as possible CMUP muon andidates.The andidate tra ks are then examined for mat hing muon hits in the CMU and CMP. If theseK+, K�, �+, or �� tra ks are re onstru ted as CMUP muon andidates then they have pun hedthrough the alorimeter into the muon hambers or have de ayed in ight to a real muon and are alled fakes. Figure 6.2 shows the transverse momentum distributions for ea h spe ies of hadronmeeting the sele tion requirements and Figure 6.3 shows the subsample of hadrons re onstru tedas CMUP muon andidates. There are over 800,000 events in our data sample whi h meet these riteria for ea h of the hadrons.6.1.3 Cal ulation of Fake RatesIn order to determine whi h hadrons de�nitely ame from a D0 de ay and remove ba kgroundwhi h may alter the orre t fake rates, the samples are �t for the D0 mass between 1.80 and 1.922Both the pro ess and its harge onjugate are meant throughout even though only one is written expli itly.89

(GeV)0 - D*Mass difference D0.135 0.140 0.145 0.150 0.155 0.160
Num
ber
of E
vent
s
0
500
1000
1500
2000
2500
310×
-1CDF Run II Preliminary, L = 1.6 fb
Figure 6.1: D� �D0 �tted mass di�eren e before �nal event sele tion.90

(GeV)T P+K4 6 8 10 12 14 16 18 20
Num
ber
of E
vent
s
0
10000
20000
30000
40000
50000
60000
70000
80000
90000
-1CDF Run II Preliminary, L = 1.6 fb-1CDF Run II Preliminary, L = 1.6 fb
(GeV)T P-K4 6 8 10 12 14 16 18 20
Num
ber
of E
vent
s
0
10000
20000
30000
40000
50000
60000
70000
80000
90000
-1CDF Run II Preliminary, L = 1.6 fb-1CDF Run II Preliminary, L = 1.6 fb
(GeV)T P+π4 6 8 10 12 14 16 18 20
Num
ber
of E
vent
s
0
10000
20000
30000
40000
50000
60000
70000
80000
90000
-1CDF Run II Preliminary, L = 1.6 fb-1CDF Run II Preliminary, L = 1.6 fb
(GeV)T P-π4 6 8 10 12 14 16 18 20
Num
ber
of E
vent
s
0
10000
20000
30000
40000
50000
60000
70000
80000
90000
-1CDF Run II Preliminary, L = 1.6 fb-1CDF Run II Preliminary, L = 1.6 fb
Figure 6.2: PT distributions for (a)K+, (b)K�, ( )�+ and (d)�� before D0 mass �tting91

(GeV)T Pµ fakes +K4 6 8 10 12 14 16 18 20
Num
ber
of E
vent
s
0
50
100
150
200
250
300
350
-1CDF Run II Preliminary, L = 1.6 fb-1CDF Run II Preliminary, L = 1.6 fb
(GeV)T Pµ fakes -K4 6 8 10 12 14 16 18 20
Num
ber
of E
vent
s
0
50
100
150
200
250
300
-1CDF Run II Preliminary, L = 1.6 fb-1CDF Run II Preliminary, L = 1.6 fb
(GeV)T Pµ fakes +π4 6 8 10 12 14 16 18 20
Num
ber
of E
vent
s
0
50
100
150
200
250
300
350
-1CDF Run II Preliminary, L = 1.6 fb-1CDF Run II Preliminary, L = 1.6 fb
(GeV)T Pµ fakes -π4 6 8 10 12 14 16 18 20
Num
ber
of E
vent
s
0
50
100
150
200
250
300
-1CDF Run II Preliminary, L = 1.6 fb-1CDF Run II Preliminary, L = 1.6 fb
Figure 6.3: PT distributions for (a)K+, (b)K�, ( )�+ and (d)�� whi h are re onstru ted asmuons before D0 mass �tting92

GeV. A double Gaussian is used with one for the D0 peak and one for the ba kground in themass region. The full sample of sele ted hadrons from D� de ays is �t �rst. Then the sample ofhadrons whi h are re onstru ted as muon andidates are �t applying the same signal shape in thefull sample �t. The signal normalization and ba kground shape and normalization are allowedto oat in the se ond �t. Figures 6.4 - 6.7 show the D0 �ts for D�+ ! D0 �+soft, D0 ! K� �+events whi h pass the uts and the D0 peaks for tra ks re onstru ted as muon andidates forea h of the four hadron spe ies.The fake rate is measured for ea h spe ies as follows; the errors are omputed using thestatisti al errors from the �t added in quadrature with a 5% ba kground shape systemati :� K+ Fakes: 2660, Rate: 0.0061 � 0.0003� K� Fakes: 1661, Rate: 0.0040 � 0.0003� �+ Fakes: 946, Rate: 0.0024 � 0.0002� �� Fakes: 745, Rate: 0.0018 � 0.0002Examining Kinemati Dependen eAdditionally, subsamples of the data were examined for strong � or PT dependen ies. Table 6.1lists the muon fake rate for three PT regions and �ve � regions. The PT dependen e suggeststhat the fake orre tion will be sensitive to di�eren es in the muon PT spe tra between D andB de ays. Therefore a omparison was made of the PT spe trum of hadrons from D� data usedin the fake al ulation to the spe trum expe ted from B de ays in from the BB Monte Carlosample. As seen in Figure 6.8, no signi� ant dis repan ies between the samples was found.Kaon Monte Carlo Cross- he kA Monte Carlo sample of kaons was produ ed using FakeEvent3 with the same PT spe trum ofCMUP muons in the dimuon analysis data. This MC sample was used as a ross he k thatthe fake asymmetry measured in the D� events valid in the dimuon analysis data. Figure 6.9shows that the PT spe trum of kaons faking CMUP muons is in good agreement with the MCgenerated kaons using the dimuon data PT spe trum. We also veri�ed that the ratio of K+=K�3FakeEvent is single parti le generator. The CDF dete tor and trigger are also simulated for studies usingFakeEvent, see Appendix D. 93

(GeV)-π Mass for reconstructed 0D1.82 1.84 1.86 1.88 1.90 1.92
Num
ber
of E
vent
s
5000
10000
15000
20000
25000
-1CDF Run II Preliminary, L = 1.6 fb
(GeV)µ faking -π Mass for 0D1.82 1.84 1.86 1.88 1.90 1.92
Num
ber
of E
vent
s
10
20
30
40
50
60
70
80
-1CDF Run II Preliminary, L = 1.6 fb
Figure 6.4: D0 signal and ba kground mass �ts for all �� andidates passing the dimuon analysistra k sele tion requirements (top) and only those andidates whi h are re onstru ted as a CMUPmuon (bottom). The ombined �t, and the signal and ba kground �ts are all displayed.94

(GeV)+π Mass for reconstructed 0D1.82 1.84 1.86 1.88 1.90 1.92
Num
ber
of E
vent
s
5000
10000
15000
20000
25000
-1CDF Run II Preliminary, L = 1.6 fb
(GeV)µ faking +π Mass for 0D1.82 1.84 1.86 1.88 1.90 1.92
Num
ber
of E
vent
s
10
20
30
40
50
60
70
80
90
100
-1CDF Run II Preliminary, L = 1.6 fb
Figure 6.5: D0 signal and ba kground mass �ts for all �+ andidates passing the dimuon analysistra k sele tion requirements (top) and only those andidates whi h are re onstru ted as a CMUPmuon (bottom). The ombined �t, and the signal and ba kground �ts are all displayed.95

(GeV)- Mass for reconstructed K0D1.82 1.84 1.86 1.88 1.90 1.92
Num
ber
of E
vent
s
0
5000
10000
15000
20000
25000
-1CDF Run II Preliminary, L = 1.6 fb
(GeV)µ faking - Mass for K0D1.82 1.84 1.86 1.88 1.90 1.92
Num
ber
of E
vent
s
0
20
40
60
80
100
120
-1CDF Run II Preliminary, L = 1.6 fb
Figure 6.6: D0 signal and ba kground mass �ts for allK� andidates passing the dimuon analysistra k sele tion requirements (top) and only those andidates whi h are re onstru ted as a CMUPmuon (bottom). The ombined �t, and the signal and ba kground �ts are all displayed.96

(GeV)+ Mass for reconstructed K0D1.82 1.84 1.86 1.88 1.90 1.92
Num
ber
of E
vent
s
0
5000
10000
15000
20000
25000
30000
-1CDF Run II Preliminary, L = 1.6 fb
(GeV)µ faking + Mass for K0D1.82 1.84 1.86 1.88 1.90 1.92
Num
ber
of E
vent
s
0
20
40
60
80
100
120
140
160
180
200
-1CDF Run II Preliminary, L = 1.6 fb
Figure 6.7: D0 signal and ba kground mass �ts for allK+ andidates passing the dimuon analysistra k sele tion requirements (top) and only those andidates whi h are re onstru ted as a CMUPmuon (bottom). The ombined �t, and the signal and ba kground �ts are all displayed.97
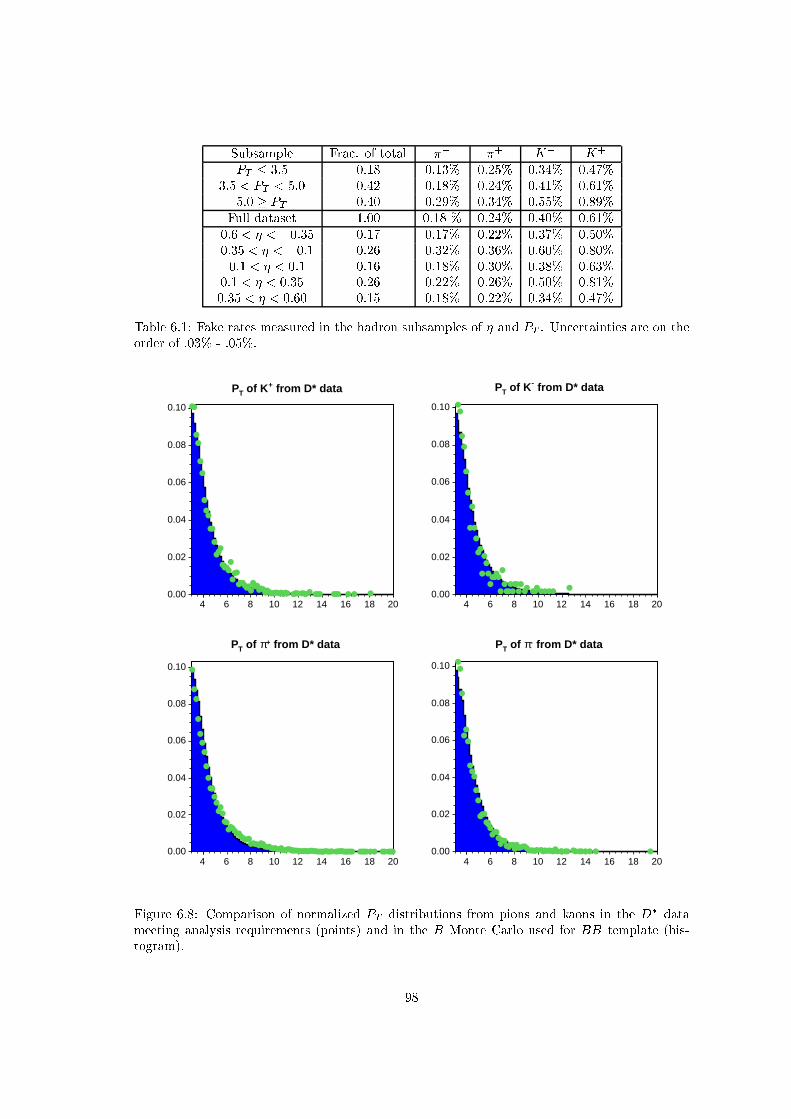
Subsample Fra . of total �� �+ K� K+PT � 3:5 0.18 0.13% 0.25% 0.34% 0.47%3:5 < PT < 5:0 0.42 0.18% 0.24% 0.41% 0.61%5:0 � PT 0.40 0.29% 0.34% 0.55% 0.89%Full dataset 1.00 0.18 % 0.24% 0.40% 0.61%�0:6 < � < �0:35 0.17 0.17% 0.22% 0.37% 0.50%�0:35 < � < �0:1 0.26 0.32% 0.36% 0.60% 0.80%�0:1 < � < 0:1 0.16 0.18% 0.30% 0.38% 0.63%0:1 < � < 0:35 0.26 0.22% 0.26% 0.50% 0.81%0:35 < � < 0:60 0.15 0.18% 0.22% 0.34% 0.47%Table 6.1: Fake rates measured in the hadron subsamples of � and PT . Un ertainties are on theorder of .03% - .05%.
4 6 8 10 12 14 16 18 200.00
0.02
0.04
0.06
0.08
0.10
from D* data+ of KTP
4 6 8 10 12 14 16 18 200.00
0.02
0.04
0.06
0.08
0.10
from D* data- of KTP
4 6 8 10 12 14 16 18 200.00
0.02
0.04
0.06
0.08
0.10
from D* data+π of TP
4 6 8 10 12 14 16 18 200.00
0.02
0.04
0.06
0.08
0.10
from D* data-π of TP
Figure 6.8: Comparison of normalized PT distributions from pions and kaons in the D� datameeting analysis requirements (points) and in the B Monte Carlo used for BB template (his-togram). 98

muon fake rates in the MC are in good agreement with the D� measurement where the errorsare statisti al.� Ratio of K+=K� fake rate from D� = 1.60 � 0.06� Ratio of K+=K� fake rate for MC = 1.54 � 0.02These he ks against the Monte Carlo and dimuon data give on�den e that the fake ratesmeasured for the hadrons in the D� sample are a urate within their un ertainties and valid foruse in the asymmetry orre tion. The measured fake rates are then used in ombination withother normalizing probabilities des ribed below to �nd the overall orre tion to the same-signdimuon totals.6.1.4 The Fake Asymmetry Corre tionIn order to orre t the total number of dimuon pairs found for the fake ontribution, the ratio ofkaons and pions per muon in b de ays meeting the analysis uts is needed. The sample of MC bbpairs used to onstru t the BB and PB templates provides a total number of kaons, pions, andmuons from b de ays4 meeting the requirements. The results found were 17,145 kaons, 38,569pions and 10,584 muons, whi h orrespond to ratios of� �� = 3:64� 0:04, and� K� = 1:50� 0:02,where the errors are statisti al. A 10% systemati un ertainty to ea h ratio of hadrons to muonsis assessed be ause of un ertainty in the bran hing ratios for B hadron de ays.Additionally, for the fake rate orre tion only muons whi h are re onstru ted as CMUP muon andidates with the analysis �X uts are onsidered. This CMUP a eptan e orresponds to thefake rates al ulated for the hadrons as it is the probability of a real muon being re onstru tedas a muon andidate, and it is 0.59 where the un ertainty is negligible.The various probabilities and rates were ombined and weighted in the following way:� Every possibility is onsidered for ea h being re onstru ted as a CMUPmuon andidate(�+,��, �+, ��, K+, K�)4Only de ays whi h are not for ed to a muon are used.99

4 6 8 10 12 14 16 18 20
-410
-310
-210
-110
of Kaons reconstructed as CMUP muonsTP
Figure 6.9: A omparison of the PT spe trum of the kaons faking CMUP muons from the D�data (histogram) to the MC fake kaons whi h use the analysis data muon PT spe trum (points).100

� Ea h of the 36 ases is weighted a ording to 5 probabilities{ Probability to �nd a tra k from B de ays meeting the analysis kinemati requirementsfor both parti les- Assessed from the ratios K/� and �/� in BB MC{ Probability to be re onstru ted as a CMUP muon andidate for both parti les- Fake rates from D� data- Muon rates from CMUP a eptan e study{ Charge orrelation for the pair(i.e. �+K� is more likely than �+K+ due to BB orrelation- We used 10% dilution (systemati un ertainty �100%)- Two hadron ases, a very small ontribution, are assessed a 1% dilution- The dimuon orrelation does not a�e t the fake rate. The number used in Table6.2 returns the observed ratio of same-sign/opposite-sign pairs� Ea h ontribution is normalized so that the total number of �tted dimuons from BB isre overed� 462,558 is total number used and re e ts the removal of same-sign pairs in the � massregionTable 6.2 summarizes all the probabilities for every ase and weights the the total number ofBB pairs.Summing the total number of �+�+ and ���� pairs whi h in lude at least one hadron andmultiplying by a fa tor of 1.158 to a ount for the in lusion of same-sign pairs in the � massregion being used for the asymmetry, we �nd a ontamination of 7,382 �+�+ and 5,130 ����pairs from fake muons.6.2 Instrumentation Corre tions6.2.1 Dete tor Dimuon AsymmetryThe muon hamber same-sign dimuon a eptan e is the greatest on ern for any systemati asymmetry introdu ed by the dete tor and trigger as the CMP geometry is not axially symmetri .101

Case CMUP CMUP Corr. P(B ! X) P(B ! X) Total�+�+ 0.5898 0.5898 0.39 0.1596 0.1596 85251�+K+ 0.5898 0.00609 0.45 0.1596 0.2586 1651�+�+ 0.5898 0.00243 0.45 0.1596 0.5818 1482�+�� 0.5898 0.5898 0.61 0.1596 0.1596 134043�+K� 0.5898 0.004 0.55 0.1596 0.2586 1325�+�� 0.5898 0.00181 0.55 0.1596 0.5818 1349���+ 0.5898 0.5898 0.61 0.1596 0.1596 134043��K+ 0.5898 0.00609 0.55 0.1596 0.2586 2018���+ 0.5898 0.00243 0.55 0.1596 0.5818 1811���� 0.5898 0.5898 0.39 0.1596 0.1596 85251��K� 0.5898 0.004 0.45 0.1596 0.2586 1084���� 0.5898 0.00181 0.45 0.1596 0.5818 1104K+�+ 0.00609 0.5898 0.45 0.2586 0.1596 1651K+K+ 0.00609 0.00609 0.49 0.2586 0.2586 30K+�+ 0.00609 0.00243 0.49 0.2586 0.5818 27K+�� 0.00609 0.5898 0.55 0.2586 0.1596 2018K+K� 0.00609 0.004 0.51 0.2586 0.2586 21K+�� 0.00609 0.00181 0.51 0.2586 0.5818 21K��+ 0.004 0.5898 0.55 0.2586 0.1596 1325K�K+ 0.004 0.00609 0.51 0.2586 0.2586 21K��+ 0.004 0.00243 0.51 0.2586 0.5818 18K��� 0.004 0.5898 0.45 0.2586 0.1596 1084K�K� 0.004 0.004 0.49 0.2586 0.2586 13K��� 0.004 0.00181 0.49 0.2586 0.5818 13�+�+ 0.00243 0.5898 0.45 0.5818 0.1596 1482�+K+ 0.00243 0.00609 0.49 0.5818 0.2586 27�+�+ 0.00243 0.00243 0.49 0.5818 0.5818 24�+�� 0.00243 0.5898 0.55 0.5818 0.1596 1811�+K� 0.00243 0.004 0.51 0.5818 0.2586 18�+�� 0.00243 0.00181 0.51 0.5818 0.5818 19���+ 0.00181 0.5898 0.55 0.5818 0.1596 1349��K+ 0.00181 0.00609 0.51 0.5818 0.2586 21���+ 0.00181 0.00243 0.51 0.5818 0.5818 19���� 0.00181 0.5898 0.45 0.5818 0.1596 1104��K� 0.00181 0.004 0.49 0.5818 0.2586 13���� 0.00181 0.00181 0.49 0.5818 0.5818 13Table 6.2: Fake Muon Corre tion Cases and Weights102

In order to quantify this e�e t, we examine Monte Carlo events produ ed with FakeEvent that ontain muons with PT above 2.8 GeV and have j�j < 0.8. Sele ting only events with a goodtra k that has PT > 3.0 GeV and have j�j < 0.6 we measure the eÆ ien y/a eptan e for themuons being properly re onstru ted as CMUP muons. The events are divided by harge and intoseveral PT bins of about 500,000 events ea h. Binomial errors are used to al ulate un ertaintyin the a eptan e fra tions. The results whi h are listed in Table 6.3 show a ratio of +=� eventsthat is in onsistent with 1 only for the PT bin between 3.6 and 4.3 GeV.Pt bin (GeV) pos. muons neg. muons Ratio +/-tra ks below 3.6 0.59057 � 0.00031 0.59041 � 0.00031 1.00026 � 0.00074tra ks from 3.6 - 4.3 0.62767 � 0.00033 0.62663 � 0.00033 1.00167 � 0.00074tra ks from 4.3 - 6.0 0.63426 � 0.00030 0.63389 � 0.00030 1.00059 � 0.00068tra ks above 6.0 0.63888 � 0.00032 0.63838 � 0.00032 1.00079 � 0.00072whole dataset 0.62170 � 0.00016 0.62122 � 0.00016 1.00076 � 0.00036Table 6.3: Ratios of CMUP a eptan e for �+ and �� over subsets of transverse momentum.A orre tion fa tor of a+=a� = 1:00076�0:00036 is be applied to a ount for the asymmetriesintrodu ed by the dete tor a eptan e, eÆ ien y, and o�ine re onstru tion. The un ertainty onthis orre tion is treated as a systemati un ertainty of the asymmetry measurement. The triggerasymmetry is measured separately (see Se tion 6.2.4).6.2.2 Single Muon Chamber AsymmetryFor a single muon of PT greater than 3 GeV the eÆ ien y of the CMU and CMP muon hambersis expe ted to be identi al for �+ and �� sin e the tra k urvature is small. As a ross- he kof this assumption, we examine the CMU muon hamber hit information in the dimuon dataset.This he k essentially veri�es that there is no dete tor asymmetry whi h is not modeled and orre ted in the MC measurement des ribed in Se tion 6.2.1.Any harge asymmetry in eÆ ien y an be understood as a higher probability to miss hitsand should then appear in the ratio of muon andidates with 3-hits to those with 4-hits. Theratios of 3-hit CMU muon stubs to 4-hit CMU muon stubs for positive muons is measured tobe 0.18315 � 0.00035 where the un ertainty is statisti al. The �+ ratio is onsistent with themeasured ratio for negative muons of 0.18251 � 0.00035. The ratio of positive to negative 3 to4 CMU hit ratios is 1.0035 � 0.0027, and no additional orre tion or systemati un ertainty isassessed. 103

6.2.3 COT Asymmetry Che ksIt is worthy of note that we are only onsidering triggered tra ks for this measurement. Thusthe XFT did �nd all of these tra ks and any XFT trigger bias is a ounted for in Se tion 6.2.4.An additional COT bias that does not appear in the trigger seems implausible. However, two ross- he ks were explored to verify that no obvious harge bias was being introdu ed by COTtra king in the dimuon data.The �rst he k examined the Pythia BB Monte Carlo events for muons with PT >3.0GeV and j�j � 0.6 whi h were not re onstru ted as tra ks. There are more �� in these eventsfrom the for ed de ays, so the ratio of unre onstru ted muons to re onstru ted muons was used.There were 103 sele ted �+ whi h were not re onstru ted as tra ks out of 221,181 sele ted �+ orresponding to a ratio of (4.7 � 0.4) �10�4. There were 746 sele ted �� whi h were notre onstru ted as tra ks out of 1,553,663 sele ted �� orresponding to a ratio of (4.8 � 0.2)�10�4.Additionally, the D� data was used for a se ond ross- he k. Kaon tra ks passing the sele tion uts for the fake rate al ulation were examined by PT binning. The ratio of K+=K� showedonly statisti al variation from 1 over the range of PT from 3 to 20 GeV (see Figure 6.10). Noadditional orre tion or systemati un ertainty is assessed from these he ks for COT asymmetry.6.2.4 Trigger Charge AsymmetryUsing the measured values of the CDF trigger eÆ ien y from [64℄, the �+=�� trigger asymmetry an be al ulated. An example of the eÆ ien y for the Level 1 trigger on CMU muons whi h isbinned by 1=PT and separated by harge from [64℄ is shown in Figure 6.11. Table 6.4 summarizesthe di�eren es in eÆ ien y by PT bins over the whole dataset used in this analysis. Ea h binis weighted a ording to the muon PT spe trum used in the BB template. The PT spe trumweighting is in good agreement with the weighting a ording to the dimuon analysis data. Themeasured di�eren e in eÆ ien y is �0:00101� 0:00059. The asymmetry orre tion due to thesingle trigger eÆ ien y is then �trig+ =�trig� = 0:99899� 0:00059.104

/ ndf 2χ 81.41 / 98Prob 0.887p0 0.000881± 0.001129 p1 0.0043± 0.9919
(GeV)TP4 6 8 10 12 14 16 18 20
- t
o K
+R
atio
of
K
0.4
0.6
0.8
1.0
1.2
1.4
1.6
1.8
2.0
/ ndf 2χ 81.41 / 98Prob 0.887p0 0.000881± 0.001129 p1 0.0043± 0.9919
Figure 6.10: Ratio of K+=K� passing sele tion uts from the D� data used in the fake rate al ulation.6.3 Symmetri Ba kground Contributions to the BBFra tionThe physi s of interest for this analysis is that in whi h ea h muon is a dire t de ay produ t of adi�erent B hadron, but both b quarks in those hadrons are orrelated by pair produ tion. Somephysi s ontributions to the dimuon sample do not arise from this s enario but are indistinguish-able from the signal pro ess by impa t parameter. However, in both ases dis ussed below the ontributions are symmetri and thus they merely dilute rather than bias any CP asymmetryPt bin (GeV) �(�+) �(��) �(�) Un ert. Weight(W) W* �(�) W*Un ert.3.0 - 3.6 .977 .977 0.000 0.001 0.28 0.00000 0.000283.6 - 4.0 .980 .979 -0.001 0.001 0.14 -0.00014 0.000144.0 - 5.3 .980 .981 0.001 0.001 0.29 0.00029 0.000295.3 - 7.7 .982 .985 0.003 0.002 0.18 0.00054 0.000367.7 - 10.0 .984 .986 0.002 0.002 0.06 0.00012 0.00012above 10 .982 .986 0.004 0.005 0.05 0.00020 0.00025 ombined - - - - 1.00 0.00101 0.00059Table 6.4: Level 1 trigger eÆ ien y asymmetry105

Figure 6.11: Level 1 CMU muon trigger eÆ ien y as a fun tion of 1/PT for �+ (red, boxes) and�� (blue, triangles).106

measured in the B system. The orre ted ACP an be adjusted for these ontributions to yielda true semileptoni (SL) CP asymmetry ASL.6.3.1 Multiple Heavy Flavor Produ tionWe expe t a small ontribution of dimuon pairs passing the analysis uts whi h fall under the lassi� ation of multiple heavy avor produ tion. These pairs ontain a muon from a b or b de ayof given harge and a se ond muon from another b or quark whi h is not pair produ ed withthe �rst b quark. There is no harge bias introdu ed by these pairs sin e it is equally likely thata se ond muon of the same harge as the �rst is positive or negative.6.3.2 Sequential De aysSome same-sign dimuon pairs with high impa t parameter signi� an e will in lude a muon se-quential de ay. Sequential de ays are de�ned as muons originating from daughters of b quarkswhi h de ayed hadroni ally. These pairs should not ontribute asymmetri ally. In order to orre t the same-sign total to yield an e�e tive asymmetry or to ompare the same-sign andopposite-sign totals, the fra tion of muons identi�ed to be B de ay muons that are sequentialde ays must be measured and removed.
107

Chapter 7Asymmetry ResultsThis hapter des ribes the method of applying orre tions to the measured raw asymmetry toextra t physi s quantities whi h an be ompared to Standard Model predi tions and ombinedwith other measurements. The determination of systemati un ertainty to the analysis results isalso summarized.7.1 Appli ation of Measured Corre tionsThe measured raw asymmetry is Araw = 0:0146� 0:0049 before applying any orre tions and onsidering only statisti al un ertainty. The asymmetry orre ted for instrumentation bias isrelated to the raw asymmetry in the following way:
A orr = N++true �N��trueN++true +N��true ; Araw = N++obs �N��obsN++obs +N��obs (7.1)where the raw asymmetry is onstru ted of observed number of muon andidate pairs Nobs, andthe orre ted asymmetry of true number of pairs, Ntrue. The true number takes into a ount theloss of real same-sign muon pairs from B hadron de ays be ause of trigger eÆ ien y or dete tora eptan e whi h is less than 100%. With two un orrelated muon andidates in ea h pair, thetrue number of same-sign dimuons is related to the observed number by the squared orre tionsfor both the single muon trigger eÆ ien y and the dete tor a eptan e for a single muon. InEquation 7.2, � is used to represent the produ t of both orre tion fa tors.N++true = N++pass +N++fail108

N++obs = N++true � �2+N++fail = N++true � 2�+(1� �+) +N++true � (1� �+)2 (7.2)The relationships found in equation 7.2 also holds true for N(����), but the orre tion fa tor�+ 6= ��. Sin e Nobs is the observed number of dimuons from �tting the data,A orr = N++obs ( 1�2+ )�N��obs ( 1�2� )N++obs ( 1�2+ ) +N��obs ( 1�2� ) = N++obs �N��obs ( �+�� )2N++obs +N��obs ( �+�� )2 (7.3)Using (a+=a�)2 = 1:0015 � 0:0007 from se tion 6.2.1, and (�trig+ =�trig� )2 = 0:9980 � 0:0012from se tion 6.2.4, we apply the orre tion (�+=��)2 = 0:9995�0:0014 to equation 7.3. Using thevalues of Nobs before they have been orre ted for fake muons we �nd A orr = 0:0149� 0:0049where the un ertainty is still only the statisti al un ertainty.Finally, the true BB asymmetry must be orre ted for the physi al asymmetry introdu ed byhadrons whi h are re onstru ted as muon andidates. The orre ted asymmetry, after removingthese hadrons from B de ays as des ribed in Se tion 6.1, is measured to be ABB = 0:0044�0:0049.This asymmetry for real muons from all bb events and is still not orre ted for the symmetri ba kgrounds des ribed in Se tion 6.3.7.2 Systemati Error EvaluationSystemati un ertainty from fake asymmetry orre tion is measured by varying ea h hadronfake rate - K+;K�; �+, and �� - by 1� to �nd ÆA for the orre tion. Additionally, the ratiosof hadrons to muons and harge orrelation ea h are varied by 1� and all ÆAs are summed inquadrature. The total measured systemati un ertainty from the fake orre tion is ÆA = 0:0028.Systemati un ertainty for the single muon trigger eÆ ien y and dete tor a eptan e orre -tions are evaluated as twi e the un ertainty on ea h orre tion, sin e ea h is squared for dimuonpairs. The systemati un ertainty of the asymmetry due to the trigger eÆ ien y is ÆA = 0:0012as derived in Se tion 6.2.4. It is ÆA = 0:0007 for the dete tor a eptan e as des ribed in Se tion6.2.1.To assess a systemati un ertainty from possible bias in the �tting te hnique, we look at the109

variation in raw asymmetry from the robustness he ks listed in Table 5.3. A signi� ant majorityof the he ks returns a value for the asymmetry that is within 0.2% of the nominal value. Whilenot an exhaustive he k, the variations shown in Table 5.3 represent a variety of possible �tting on�gurations in all of the relevant quantities. Therefore, we estimate a �tting un ertainty basedon the �t variations of 0.2%. Table 7.1: Systemati Un ertaintiesSour e of Un ertainty ÆAFake muon orr. 0.0028Trigger eÆ ien y orr. 0.0012Dete tor a eptan e orr. 0.0007Fitting Un ertainty 0.0020Total 0.00377.3 Extra tion of Physi s QuantitiesThe semileptoni asymmetry is obtained by removing the ontribution of CP symmetri ba k-grounds des ribed in Se tion 6.3. We measure the fra tion of these ba kgrounds to be fWS =0:102� 0:015, where this fra tion is all wrong-sign ontributions of a single muon B de ay. Thisin ludes multiple heavy avor produ tion, but is primarily sequential de ays. There is also asmall ontribution of right-sign sequential de ays from the ase where the virtual W from theb! transition de ays hadroni ally to harm rather than semimuoni ally and the harm de aysto a muon. For dimuon events we �nd the following fra tions:� fDD = 0:768� 0:019, two dire t muon de ays� fDS = 0:183� 0:027, one sequential de ay resulting in a wrong-sign muon� fRSDS = 0:039� 0:004, one dire t de ay, and one sequential de ay resulting in a right-signmuon� fSS = 0:010� 0:002, two sequential de ays resulting in two wrong-sign muonsThus N(�+�+) and N(����) an be de�ned as follows where � is the mixing probability forB, � is the mixing probability for B, and �0 = 12 (�+ �):110

N(�+�+) = NBBf(fDD + fRSDS )�(1� �0) + 12fDS [1� 2�0(1� �0)℄ + fSS�(1� �0)gN(����) = NBBf(fDD + fRSDS )�(1� �0) + 12fDS [1� 2�0(1� �0)℄ + fSS�(1� �0)g(7.4)ABB = N(�+�+)�N(����)N(�+�+) +N(����) = (fDD + fRSDS � fSS)(�� �)(1� �0)(fDD + fRSDS + fSS)(�+ �) + fDS [1� 2�0(1� �0)℄ (7.5)We now use the de�nition of �0 and divide through by 2�0(1 � �0) to obtain the followingrelation between the physi s asymmetry from CP violation in mixing, (���)=(�+�), and ABB :
ABB = (fDD + fRSDS � fSS)� [����+� ℄fDD + fRSDS + fSS + fDS 1�2�0(1��0)2�0(1��0) (7.6)Using the world average �0 = 0:127� 0:006 [10℄, and the fra tions measured above we �ndA��SL = (�� �)(�+ �) = (1:83� 0:15)�ABB (7.7)whi h yields
A��SL = 0:0080� 0:0090(stat)� 0:0068(syst): (7.8)The world's best measurement of the same-sign dimuon harge asymmetry was made by D0,A��SL = �0:0053� 0:0025(stat)� 0:0018(syst) [54℄.We an also onstrain the Bs ontribution to A��SL by following the strategy outlined in[32℄. Using the B fa tory measurements of AdSL = �0:0005� 0:0056, and world averages of thequantities fsZs = 0:110� 0:012 and fdZd = 0:150� 0:004, we an extra t AsSL from Equation111

7.91.A��SL = (fdZd)AdSL + (fsZs)AsSLfdZd + fsZs (7.9)We �nd the following, where the systemati error is our measured systemati and there is anadditional ontribution to the un ertainty that arises from the inputs fs, Zs, fd, Zd, and AdSL.
AsSL = 0:020� 0:021(stat)� 0:016(syst)� 0:009(inputs); (7.10)We an then use the relation [34℄: AsSL = ��s�ms tan�s (7.11)to extra t an allowed ontour in the (�s,��s) plane. Using �Ms = 17:8 � 0:1 ps�1, the 68% ontour is shown in Fig. 7.1. This result an be ombined with CDF measurements of ��s asa onstraint to extra t an allowed range for �s. The most urrent CDF ��s measurement with�s �xed to 0 in Bs ! J=� de ays is [66℄��s = 0:08� 0:06: (7.12)7.4 Result SynopsisWe have measured the same-sign dimuon asymmetry from de ays of bb produ tion using pairs ofmuon andidates with PT > 3 GeV and an invariant mass of at least 5 GeV. Muon andidate pairsmeeting sele tion requirements were �tted to signal and ba kground templates to determine thefra tion of BB hadron pairs using the impa t parameter signi� an e of both muon tra ks as anindi ation of lifetime. Corre tions were made for measured asymmetries from the dete tor, event1fd and fs are the fra tions for Bd and Bs mesons as dis ussed in Se tion 1.4.3. Zd and Zs are mixing relatedweights as des ribed in [33℄. Quantitatively, ASL = 0:6AdSL + 0:4AsSL sin e Bs mixes faster than Bd but moreBd are produ ed in ollisions 112

trigger, and hadrons from B de ays whi h were re onstru ted as muon andidates. Removingthe symmetri ba kgrounds dominated by sequential de ays we �nd a semileptoni asymmetryofA��SL = 0:0080� 0:0113: (7.13)This measurement an be interpreted as a determination of the CP asymmetry from Bs mixingusing known values for the Bd mixing and the weights of ontribution to the overall asymmetry:AsSL = 0:0200� 0:0283: (7.14)The value of AsSL taken with the re ent measurements of Bs mass di�eren e, �ms and de aywidth di�eren e ��s provides a onstraint on the omplex mixing phase of Bs mixing, �s. We�nd no eviden e for CP violating physi s beyond the Standard Model in Bs mixing, however,some new physi s ontribution to �s is not ruled out.
113

-0.5
-0.4
-0.3
-0.2
-0.1
0
0.1
0.2
0.3
0.4
0.5
-3 -2 -1 0 1 2 3φs (radians)
∆Γs (
ps-1
)
CDF Run II Preliminary
Figure 7.1: This result shown in the �s-��s plane. The lines represent the entral value, thegreen region is the 68% allowed ontour.114

Chapter 8Con lusionsThis measurement of CP asymmetry in Bs mixing is onsistent with Standard Model expe ta-tions. It provides a se ond pre ision determination of AsSL, and sin e the Tevatron is urrentlythe only pla e to study Bs hadrons, it is the only available on�rmation of the D0 analysis. Anapproa h omplimentary to the D0 analysis is used by isolating the signal fra tion in the dimuondata by �tting the impa t parameter. We have also orre ted for pions whi h an ontribute tothe hadron asymmetry orre tion at the same level as kaons.The greatest diÆ ulty en ountered in this dissertation resear h and perhaps the area in whi hthere is the most room for future improvement is the high rate of hadrons from heavy avorwhi h are re onstru ted as muon andidates. The orre tion for hadrons from B de ays wasthe most ompli ated part of the analysis and ontributed the largest systemati un ertaintyto the asymmetry. Additionally, the e�e t of the high fake rates was present also in the harmde ays. Previous analyses did not even onsider ontributions to same-sign muon andidate pairswhere both muon andidates ome from harm [51, 54℄, but we found that negle ting hadroni fakes from harm introdu ed a signi� ant asymmetry. Another CDF analysis using a dimuondata sele tion from the same trigger found similarly high fake rates relative to Run I [56℄. Forthis measurement to be made more a urately, the sele tion riteria may need to be tightenedin areas that ould yield a higher muon purity. At the analysis level the �X threshold for themuon mat hing ould be de reased. Another option might be raising the PT threshold whi h hasthe added bene�t of redu ing the fra tion sequential de ays that must be removed. Also, sin ethe dimuon trigger used in this analysis has been pres aled1 for higher luminosity, it is worth onsidering su h hanges to the trigger sele tion.Other improvements might be made in a future asymmetry measurement to de rease thestatisti al un ertainty. Obviously, CDF is ontinuing to olle t additional data and the high1A trigger pres ale reje ts a ertain fra tion of events whi h otherwise meet the sele tion riteria in order to onserve bandwidth for triggers with a lower ross-se tion.115

Tevatron luminosities will qui kly provide in reased statisti al power. But, signi� ant improve-ment an be a hieved with the urrent data by in reasing the muon a eptan e. Muon andidates olle ted with triggers involving the CMX sub dete tor ould provide in reased j�j a eptan e,but would require areful determination of the asso iated hadron fake rates. Additionally, ele -trons are just as valid a sour e of semileptoni B de ays as muons and have a similarly largebran hing ratio. Using ele tron andidates would of ourse introdu e additional ba kground onsiderations su h as photon onversions. Ele trons would also require high pre ision deter-minations of hadron fakes and any asymmetri e�e ts in the alorimeters. From a te hni alaspe t, an ele tron based CP asymmetry measurement is almost a ompletely di�erent analysis.However, it ould have omparable statisti al power and ould potentially be ombined with themuon analysis to in lude e� events. The addition of ee and e� data would e�e tively triple thestatisti al powerFinally, the dimuon dataset is a ri h sour e for studying b quark physi s. As dis ussedin Appendix F, most of the ne essary pie es for a measurement of the time-integrated mixingparameter � are in pla e. A better isolation of the relative ba kground fra tions and a morepre ise determination of the sequential fra tion would likely be all that is ne essary to measure� given more statisti s. Su h a measurement would help to understand the di�eren e betweenthe CDF measurement of � in Run I relative to those made in e+e� ollisions [10, 55℄, and helpto onstrain the values of fragmentation fra tions for B hadrons. Another soon to be publishedCDF analysis [56℄ uses similarly isolated dimuon data from BB de ays to measure ross-se tion of orrelated bb produ tion. This measurement would also improve with in reased lepton a eptan eand muon andidate purity.
116

Appendix AGlossaryACP: Charge asymmetry introdu ed by CP violation in neutral B mixing.ASL: ACP measured in in lusive semileptoni B de ays.AsSL: ASL measured in semileptoni Bs mixing de ays.BB: Sample of muon pairs where both muon andidates are from B hadron de ays.CC: Sample of muon pairs where both muon andidates are from C hadron de ays.CDF: Collider Dete tor at Fermilab.CLC: Cherenkov Luminosity Counter.CKM: Cabibbo-Kobayashi-Maskawa matrix des ribing quark avor hanging transitions.CMP: Central Muon uPgrade.CMU: Central MUon Dete tor.CMX: Central Muon eXtension.COT: Central Outer Tra ker.CP: Charge-ParityL1: Level 1 of the CDF Trigger.L2: Level 2 of the CDF Trigger.L3: Level 3 of the CDF Trigger.MI: Main Inje tor.MC: Monte Carlo.OS: Opposite-sign muon pair sample.PB, PC, and PP: Sample of muon pairs where one muon andidate is from a prompt sour e,and the se ond muon omes from a B hadron, a C hadron, or prompt sour e respe tively.RF: Radio-frequen y.SL: Semileptoni ; heavy avor de ays whi h produ e both hadrons and leptons.SM: Standard Model of parti le physi s 117

SS: Same-sign muon pair sampleSVT: Sili on Vertex Trigger.SVX: Sili on VerteX Tra ker.XFT: eXtremely Fast Tra ker.XTRP: eXTRaPolation Unit.
118

Appendix BCDF Author ListCDF Default Author List from July 2006 to January 2007:A. Abulen ia,23 J. Adelman,13 T. Aolder,10 T. Akimoto,55 M.G. Albrow,16 D. Ambrose,16 S.Amerio,43 D. Amidei,34 A. Anastassov,52 K. Anikeev,16 A. Annovi,18 J. Antos, 1 M. Aoki,55 G.Apollinari,16 J.-F. Arguin,33 T. Arisawa,57 A. Artikov,14 W. Ashmanskas,16 A. Attal,8 F.Azfar,42 P. Azzi-Ba hetta,43 P. Azzurri,46 N. Ba hetta,43 W. Badgett,16 A.Barbaro-Galtieri,28 V.E. Barnes,48 B.A. Barnett,24 S. Baroiant,7 V. Barts h,30 G. Bauer,32 F.Bedes hi,46 S. Behari,24 S. Belforte,54 G. Bellettini,46 J. Bellinger,59 A. Belloni,32 D.Benjamin,15 A. Beretvas,16 J. Beringer,28 T. Berry,29 A. Bhatti,50 M. Binkley,16 D. Bisello,43R.E. Blair,2 C. Blo ker,6 B. Blumenfeld,24 A. Bo i,15 A. Bodek,49 V. Boisvert,49 G. Bolla,48A. Bolshov,32 D. Bortoletto,48 J. Boudreau,47 A. Boveia,10 B. Brau,10 L. Brigliadori,5 C.Bromberg,35 E. Brubaker,13 J. Budagov,14 H.S. Budd,49 S. Budd,23 S. Budroni,46 K. Burkett,16G. Busetto,43 P. Bussey,20 K. L. Byrum,2 S. Cabrera,15 M. Campanelli,19 M. Campbell,34 F.Canelli,16 A. Canepa,48 S. Carrillo,17 D. Carlsmith,59 R. Carosi,46 S. Carron,33 M. Casarsa,54A. Castro,5 P. Catastini,46 D. Cauz,54 M. Cavalli-Sforza,3 A. Cerri,28 L. Cerrito,30 S.H.Chang,27 Y.C. Chen, 1 M. Chertok,7 G. Chiarelli,46 G. Chla hidze,14 F. Chlebana,16 I. Cho,27K. Cho,27 D. Chokheli,14 J.P. Chou,21 G. Choudalakis,32 S.H. Chuang,59 K. Chung,12 W.H.Chung,59 Y.S. Chung,49 M. Ciljak,46 C.I. Ciobanu,23 M.A. Cio i,46 A. Clark,19 D. Clark,6 M.Co a,15 G. Compostella,43 M.E. Convery,50 J. Conway,7 B. Cooper,35 K. Copi ,34 M.Cordelli,18 G. Cortiana,43 F. Cres ioli,46 C. Cuen a Almenar,7 J. Cuevas,11 R. Culbertson,16J.C. Cully,34 D. Cyr,59 S. DaRon o,43 S. D'Auria,20 T. Davies,20 M. D'Onofrio,3 D.Dagenhart,6 P. de Barbaro,49 S. De Ce o,51 A. Deisher,28 G. De Lentde ker,49 M. Dell'Orso,46F. Delli Paoli,43 L. Demortier,50 J. Deng,15 M. Deninno,5 D. De Pedis,51 P.F. Derwent,16 C.Dionisi,51 B. Di Ruzza,54 J.R. Dittmann,4 P. DiTuro,52 C. D�orr,25 S. Donati,46 M. Donega,19 P.119

Dong,8 J. Donini,43 T. Dorigo,43 S. Dube,52 J. Efron,39 R. Erba her,7 D. Errede,23 S. Errede,23R. Eusebi,16 H.C. Fang,28 S. Farrington,29 I. Fedorko,46 W.T. Fedorko,13 R.G. Feild,60 M.Feindt,25 J.P. Fernandez,31 R. Field,17 G. Flanagan,48 A. Foland,21 S. Forrester,7 G.W.Foster,16 M. Franklin,21 J.C. Freeman,28 I. Furi ,13 M. Gallinaro,50 J. Galyardt,12 J.E.Gar ia,46 F. Garberson,10 A.F. Gar�nkel,48 C. Gay,60 H. Gerberi h,23 D. Gerdes,34 S. Giagu,51P. Giannetti,46 A. Gibson,28 K. Gibson,47 J.L. Gimmell,49 C. Ginsburg,16 N. Giokaris,14 M.Giordani,54 P. Giromini,18 M. Giunta,46 G. Giurgiu,12 V. Glagolev,14 D. Glenzinski,16 M.Gold,37 N. Golds hmidt,17 J. Goldstein,42 G. Gomez,11 G. Gomez-Ceballos,11 M. Gon harov,53O. Gonz�alez,31 I. Gorelov,37 A.T. Goshaw,15 K. Goulianos,50 A. Gresele,43 M. Griths,29 S.Grinstein,21 C. Grosso-Pil her,13 R.C. Group,17 U. Grundler,23 J. Guimaraes da Costa,21 Z.Gunay-Unalan,35 C. Haber,28 K. Hahn,32 S.R. Hahn,16 E. Halkiadakis,52 A. Hamilton,33 B.-Y.Han,49 J.Y. Han,49 R. Handler,59 F. Happa her,18 K. Hara,55 M. Hare,56 S. Harper,42 R.F.Harr,58 R.M. Harris,16 M. Hartz,47 K. Hatakeyama,50 J. Hauser,8 A. Heijboer,45 B.Heinemann,29 J. Heinri h,45 C. Henderson,32 M. Herndon,59 J. Heuser,25 D. Hidas,15 C.S.Hill,10 D. Hirs hbuehl,25 A. Ho ker,16 A. Holloway,21 S. Hou,1 M. Houlden,29 S.-C. Hsu,9 B.T.Human,42 R.E. Hughes,39 U. Husemann,60 J. Huston,35 J. In andela,10 G. Introzzi,46 M. Iori,51Y. Ishizawa,55 A. Ivanov,7 B. Iyutin,32 E. James,16 D. Jang,52 B. Jayatilaka,34 D. Jeans,51 H.Jensen,16 E.J. Jeon,27 S. Jindariani,17 M. Jones,48 K.K. Joo,27 S.Y. Jun,12 J.E. Jung,27 T.R.Junk,23 T. Kamon,53 P.E. Kar hin,58 Y. Kato,41 Y. Kemp,25 R. Kephart,16 U. Kerzel,25 V.Khotilovi h,53 B. Kilminster,39 D.H. Kim,27 H.S. Kim,27 J.E. Kim,27 M.J. Kim,12 S.B. Kim,27S.H. Kim,55 Y.K. Kim,13 N. Kimura,55 L. Kirs h,6 S. Klimenko,17 M. Klute,32 B. Knuteson,32B.R. Ko,15 K. Kondo,57 D.J. Kong,27 J. Konigsberg,17 A. Korytov,17 A.V. Kotwal,15 A.Kovalev,45 A.C. Kraan,45 J. Kraus,23 I. Krav henko,32 M. Kreps,25 J. Kroll,45 N. Krumna k,4M. Kruse,15 V. Krutelyov,10 T. Kubo,55 S. E. Kuhlmann,2 T. Kuhr,25 Y. Kusakabe,57 S.Kwang,13 A.T. Laasanen,48 S. Lai,33 S. Lami,46 S. Lammel,16 M. Lan aster,30 R.L. Lander,7 K.Lannon,39 A. Lath,52 G. Latino,46 I. Lazzizzera,43 T. LeCompte,2 J. Lee,49 J. Lee,27 Y.J. Lee,27S.W. Lee,53 R. Lef�evre,3 N. Leonardo,32 S. Leone,46 S. Levy,13 J.D. Lewis,16 C. Lin,60 C.S.Lin,16 M. Lindgren,16 E. Lipeles,9 A. Lister,7 D.O. Litvintsev,16 T. Liu,16 N.S. Lo kyer,45 A.Loginov,36 M. Loreti,43 P. Loverre,51 R.-S. Lu,1 D. Lu hesi,43 P. Lujan,28 P. Lukens,16 G.Lungu,17 L. Lyons,42 J. Lys,28 R. Lysak,1 E. Lytken,48 P. Ma k,25 D. Ma Queen,33 R.Madrak,16 K. Maeshima,16 K. Makhoul,32 T. Maki,22 P. Maksimovi ,24 S. Malde,42 G.120

Man a,29 F. Margaroli,5 R. Marginean,16 C. Marino,25 C.P. Marino,23 A. Martin,60 M.Martin,24 V. Martin,20 M. Mart��nez,3 T. Maruyama,55 P. Mastrandrea,51 T. Masubu hi,55 H.Matsunaga,55 M.E. Mattson,58 R. Mazini,33 P. Mazzanti,5 K.S. M Farland,49 P. M Intyre,53 R.M Nulty,29 A. Mehta,29 P. Mehtala,22 S. Menzemer,11 A. Menzione,46 P. Merkel,48 C.Mesropian,50 A. Messina,51 T. Miao,16 N. Miladinovi ,6 J. Miles,32 R. Miller,35 C. Mills,10 M.Milnik,25 A. Mitra,1 G. Mitselmakher,17 A. Miyamoto,26 S. Moed,19 N. Moggi,5 B. Mohr,8 R.Moore,16 M. Morello,46 P. Movilla Fernandez,28 J. M�ulmenst�adt,28 A. Mukherjee,16 Th.Muller,25 R. Mumford,24 P. Murat,16 J. Na htman,16 A. Nagano,55 J. Naganoma,57 S. Nahn,32I. Nakano,40 A. Napier,56 V. Ne ula,17 C. Neu,45 M.S. Neubauer,9 J. Nielsen,28 T. Nigmanov,47L. Nodulman,2 O. Norniella,3 E. Nurse,30 S.H. Oh,15 Y.D. Oh,27 I. Oksuzian,17 T. Okusawa,41R. Oldeman,29 R. Orava,22 K. Osterberg,22 C. Pagliarone,46 E. Palen ia,11 V. Papadimitriou,16A.A. Paramonov,13 B. Parks,39 S. Pashapour,33 J. Patri k,16 G. Pauletta,54 M. Paulini,12 C.Paus,32 D.E. Pellett,7 A. Penzo,54 T.J. Phillips,15 G. Pia entino,46 J. Piedra,44 L. Pinera,17 K.Pitts,23 C. Plager,8 L. Pondrom,59 X. Portell,3 O. Poukhov,14 N. Pounder,42 F. Prokoshin,14 A.Pronko,16 J. Proudfoot,2 F. Pto hos,18 G. Punzi,46 J. Pursley,24 J. Radema ker,42 A.Rahaman,47 N. Ranjan,48 S. Rappo io,21 B. Reisert,16 V. Rekovi ,37 P. Renton,42 M.Res igno,51 S. Ri hter,25 F. Rimondi,5 L. Ristori,46 A. Robson,20 T. Rodrigo,11 E. Rogers,23 S.Rolli,56 R. Roser,16 M. Rossi,54 R. Rossin,17 A. Ruiz,11 J. Russ,12 V. Rusu,13 H. Saarikko,22 S.Sabik,33 A. Safonov,53 W.K. Sakumoto,49 G. Salamanna,51 O. Salt�o,3 D. Saltzberg,8 C.S�an hez,3 L. Santi,54 S. Sarkar,51 L. Sartori,46 K. Sato,16 P. Savard,33 A. Savoy-Navarro,44 T.S heidle,25 P. S hlaba h,16 E.E. S hmidt,16 M.P. S hmidt,60 M. S hmitt,38 T. S hwarz,7 L.S odellaro,11 A.L. S ott,10 A. S ribano,46 F. S uri,46 A. Sedov,48 S. Seidel,37 Y. Seiya,41 A.Semenov,14 L. Sexton-Kennedy,16 A. Sfyrla,19 M.D. Shapiro,28 T. Shears,29 P.F. Shepard,47 D.Sherman,21 M. Shimojima,55 M. Sho het,13 Y. Shon,59 I. Shreyber,36 A. Sidoti,46 P. Sinervo,33A. Sisakyan,14 J. Sjolin,42 A.J. Slaughter,16 J. Slaunwhite,39 K. Sliwa,56 J.R. Smith,7 F.D.Snider,16 R. Snihur,33 M. Soderberg,34 A. Soha,7 S. Somalwar,52 V. Sorin,35 J. Spalding,16 F.Spinella,46 T. Spreitzer,33 P. Squilla ioti,46 M. Stanitzki,60 A. Staveris-Polykalas,46 R. St.Denis,20 B. Stelzer,8 O. Stelzer-Chilton,42 D. Stentz,38 J. Strologas,37 D. Stuart,10 J.S. Suh,27A. Sukhanov,17 H. Sun,56 T. Suzuki,55 A. Ta�ard,23 R. Takashima,40 Y. Takeu hi,55 K.Takikawa,55 M. Tanaka,2 R. Tanaka,40 M. Te hio,34 P.K. Teng,1 K. Terashi,50 J. Thom,16 A.S.Thompson,20 E. Thomson,45 P. Tipton,60 V. Tiwari,12 S. Tka zyk,16 D. Toba k,53 S. Tokar,14121

K. Tollefson,35 T. Tomura,55 D. Tonelli,46 S. Torre,18 D. Torretta,16 S. Tourneur,44 W.Tris huk,33 R. Tsu hiya,57 S. Tsuno,40 N. Turini,46 F. Ukegawa,55 T. Unverhau,20 S. Uozumi,55D. Usynin,45 S. Valle orsa,19 N. van Remortel,22 A. Varganov,34 E. Vataga,37 F. V�azquez,17 G.Velev,16 G. Veramendi,23 V. Veszpremi,48 R. Vidal,16 I. Vila,11 R. Vilar,11 T. Vine,30 I.Vollrath,33 I. Volobouev,28 G. Volpi,46 F. W�urthwein,9 P. Wagner,53 R.G. Wagner,2 R.L.Wagner,16 J. Wagner,25 W. Wagner,25 R. Wallny,8 S.M. Wang,1 A. Warburton,33 S. Was hke,20D. Waters,30 M. Weinberger,53 W.C. Wester III,16 B. Whitehouse,56 D. Whiteson,45 A.B.Wi klund,2 E. Wi klund,16 G. Williams,33 H.H. Williams,45 P. Wilson,16 B.L. Winer,39 P.Witti h,16 S. Wolbers,16 C. Wolfe,13 T. Wright,34 X. Wu,19 S.M. Wynne,29 A. Yagil,16 K.Yamamoto,41 J. Yamaoka,52 T. Yamashita,40 C. Yang,60 U.K. Yang,13 Y.C. Yang,27 W.M.Yao,28 G.P. Yeh,16 J. Yoh,16 K. Yorita,13 T. Yoshida,41 G.B. Yu,49 I. Yu,27 S.S. Yu,16 J.C.Yun,16 L. Zanello,51 A. Zanetti,54 I. Zaw,21 X. Zhang,23 J. Zhou,52 and S. Zu helli5(CDF Collaboration)1 Institute of Physi s, A ademia Sini a, Taipei, Taiwan 11529, Republi of China2 Argonne National Laboratory, Argonne, Illinois 604393 Institut de Fisi a d'Altes Energies, Universitat Autonoma de Bar elona, E-08193, Bellaterra(Bar elona), Spain4 Baylor University, Wa o, Texas 767985 Istituto Nazionale di Fisi a Nu leare, University of Bologna, I-40127 Bologna, Italy6 Brandeis University, Waltham, Massa husetts 022547 University of California, Davis, Davis, California 956168 University of California, Los Angeles, Los Angeles, California 900249 University of California, San Diego, La Jolla, California 9209310 University of California, Santa Barbara, Santa Barbara, California 9310611 Instituto de Fisi a de Cantabria, CSIC-University of Cantabria, 39005 Santander, Spain12 Carnegie Mellon University, Pittsburgh, PA 1521313 Enri o Fermi Institute, University of Chi ago, Chi ago, Illinois 6063714 Joint Institute for Nu lear Resear h, RU-141980 Dubna, Russia15 Duke University, Durham, North Carolina 2770816 Fermi National A elerator Laboratory, Batavia, Illinois 6051017 University of Florida, Gainesville, Florida 32611122

18 Laboratori Nazionali di Fras ati, Istituto Nazionale di Fisi a Nu leare, I-00044 Fras ati, Italy19 University of Geneva, CH-1211 Geneva 4, Switzerland20 Glasgow University, Glasgow G12 8QQ, United Kingdom21 Harvard University, Cambridge, Massa husetts 0213822 Division of High Energy Physi s, Department of Physi s,University of Helsinki and Helsinki Institute of Physi s, FIN-00014, Helsinki, Finland23 University of Illinois, Urbana, Illinois 6180124 The Johns Hopkins University, Baltimore, Maryland 2121825 Institut f�ur Experimentelle Kernphysik, Universit�at Karlsruhe, 76128 Karlsruhe, Germany26 High Energy A elerator Resear h Organization (KEK), Tsukuba, Ibaraki 305, Japan27 Center for High Energy Physi s: Kyungpook National University,Taegu 702-701, Korea; Seoul National University, Seoul 151-742,Korea; and SungKyunKwan University, Suwon 440-746, Korea28 Ernest Orlando Lawren e Berkeley National Laboratory, Berkeley, California 9472029 University of Liverpool, Liverpool L69 7ZE, United Kingdom30 University College London, London WC1E 6BT, United Kingdom31 Centro de Investiga iones Energeti as Medioambientales y Te nologi as, E-28040 Madrid,Spain32 Massa husetts Institute of Te hnology, Cambridge, Massa husetts 0213933 Institute of Parti le Physi s: M Gill University, Montr�eal,Canada H3A 2T8; and University of Toronto, Toronto, Canada M5S 1A734 University of Mi higan, Ann Arbor, Mi higan 4810935 Mi higan State University, East Lansing, Mi higan 4882436 Institution for Theoreti al and Experimental Physi s, ITEP, Mos ow 117259, Russia37 University of New Mexi o, Albuquerque, New Mexi o 8713138 Northwestern University, Evanston, Illinois 6020839 The Ohio State University, Columbus, Ohio 4321040 Okayama University, Okayama 700-8530, Japan41 Osaka City University, Osaka 588, Japan42 University of Oxford, Oxford OX1 3RH, United Kingdom43 University of Padova, Istituto Nazionale di Fisi a Nu leare,123

Sezione di Padova-Trento, I-35131 Padova, Italy44 LPNHE, Universite Pierre et Marie Curie/IN2P3-CNRS, UMR7585, Paris, F-75252 Fran e45 University of Pennsylvania, Philadelphia, Pennsylvania 1910446 Istituto Nazionale di Fisi a Nu leare Pisa, Universities of Pisa, Siena and S uola NormaleSuperiore, I-56127 Pisa, Italy47 University of Pittsburgh, Pittsburgh, Pennsylvania 1526048 Purdue University, West Lafayette, Indiana 4790749 University of Ro hester, Ro hester, New York 1462750 The Ro kefeller University, New York, New York 1002151 Istituto Nazionale di Fisi a Nu leare, Sezione di Roma 1,University of Rome \La Sapienza," I-00185 Roma, Italy52 Rutgers University, Pis ataway, New Jersey 0885553 Texas A&M University, College Station, Texas 7784354 Istituto Nazionale di Fisi a Nu leare, University of Trieste/ Udine, Italy55 University of Tsukuba, Tsukuba, Ibaraki 305, Japan56 Tufts University, Medford, Massa husetts 0215557 Waseda University, Tokyo 169, Japan58 Wayne State University, Detroit, Mi higan 4820159 University of Wis onsin, Madison, Wis onsin 5370660 Yale University, New Haven, Conne ti ut 06520(Dated: September 1, 2006)
124

Appendix CImpa t Parameter Signi� an eThe original approa h to this analysis was to �t the impa t parameter of both muons as in theRun I �0 analysis, [55℄. However, as Figure C.1 demonstrates, there was signi� ant disagreementof the �tted omponents ompared to the data at large impa t parameter. Our on ern was thatthis divergen e in the tail was aused by pattern re ognition failures or tra ks with larger impa tparameter un ertainty. By in orporating the measured un ertainty of ea h impa t parameter to onstru t a signi� an e mu h of this dis repan y was a ounted for.
0 0.05 0.1 0.15 0.2 0.25 0.3
210
310
410
510
0 0.05 0.1 0.15 0.2 0.25 0.3
210
310
410
510 X-proj ProfilesData [179007]PP [41513 +/- 385]BB [109305 +/- 663]BP [28189 +/- 767]
Fitted fractions
Figure C.1: The fra tional ontributions as determined by the likelihood �t are sta ked and ompared to the ombined same-sign dimuon data set.125

Appendix DMonte Carlo SamplesThe Monte Carlo samples generated for this analysis used software release 5.3.4 and followed theB group pres ription spe i�ed in [65℄.D.1 Pythia/Evtgen SamplesThe bottom and harm samples that were utilized to derive the BB, PB, CC and PC templateswere generated with Pythia. Pythia is a Monte Carlo tool used in high-energy physi s tomodel events of outgoing parti les produ ed in intera tions of two in oming parti les [58℄. Toget a realisti mixture of b�b produ tion pro esses, we generated all 2 ! 2 pro esses (msel=1).The minimum p̂T was set to 10GeV. We generated an additional sample with minimum p̂T setto 8GeV to verify that we did not see any s ulpting in the 10GeV sample. B hadrons werede ayed with Evtgen. EvtGen is another Monte Carlo event generator expli itly designedfor simulating the physi s of B hadron de ays and is parti ularly helpful in modeling sequentialde ays, semileptoni de ays, and CP violating de ays [59℄.For the b MC, mixing was turned o� and we for ed the bottom quark to de ay muoni ally.The �b was allowed to de ay freely. Events were then �ltered to require at least one real muonwith pT > 2:8GeV and j�j < 0:7 before simulation and subsequent analysis. We supplementedthe original b�b MC with a avor reation (msel=5) sample. The msel=1 and msel=5 sampleswere ompared and found to produ e similar impa t distributions.The harm MC was generated in Pythia using avor reation (msel=4) with minimum p̂T =8GeV. The harm hadrons were de ayed using the standard Evtgen de ay table. (No de ayswere for ed.) [Note: The original harm MC for this analysis was msel=1 without Evtgen.That sample is no longer used in the analysis.℄For ontrol studies, we additionally generated a Pythia sample of all 2! 2 pro esses where126

we did not sele t heavy avor events. This u,d,s was used to study the PP template.All Pythia samples were generated using Peterson fragmentation, with �P = 0:006 alongwith underlying event \tune A". The ratio of ve tor to pseudo-s alar heavy hadron produ tion(Pv = V=(V + P )) is set to the default value of 0.75.A full CDF dete tor simulation is run for the MC samples using the Geant [60℄ softwarepa kage. Geant models the passage of parti les through matter, and the CDF dete tor ompo-nents. The tra king response in parti ular is simulated in great detail.D.2 FakeEvent SamplesFakeEvent is the name of the single parti le generator in CDF simulation software. The spe iesof parti le as well as the distributions of PT , � and � for the parti les are input to the generator.The dete tor response is simulated using Geant.For dedi ated systemati studies, we followed the 5.3.4 MC pres ription while using FakeEventto generate the following samples:1. �(1s)! �+��,2. ����,3. �+�+,4. single �+ and ��,5. single K+, K�, �+ and ��.Sin e these were single (or double) tra k events with no other a tivity, we were able to generateextremely large samples for systemati study.In all ases, the pT spe trum used ame from the data (� or dimuon pT spe trum). In all ases, the events were generated at in 0 < � < 360Æ and at in �1 < y < 1. The � sample wasused to ompare to the PP template derived from real � ! �+�� de ays. The muon sampleswere used to map out the a eptan e for same sign dimuon events.The single hadron MC (K�, ��) was generated to he k our measurement of the fake muonasymmetry oming from hadrons. In these samples, we passed every event through the simulationand re onstru tion and then kept only events with an identi�ed CMUP muon andidate.127

Appendix EFurther Analysis Che ksE.1 Additional Kinemati Pro�lesFigures E.1 - E.3 show some additional he ks of the average impa t parameter signi� an eover a range of di�erent kinemati variables. It is not the average values themselves that are ofinterest but the shape of the distributions that we are he king for any biases. The shape of thedistributions for � and Z0 of the muon andidates re e ts the geometri al stru ture of the SVXdete tor as des ribed in Se tion 2.2.3. Where there is less sili on information the average impa tparameter un ertainty is greater and thus the average signi� an e is smaller. It was veri�ed thatthe same distribution shapes are re e ted in the Monte Carlo used for template onstru tion.E.2 Toy ExperimentsIn order to validate the templates and �tting ode a number of toy experiments were reated and�tted. Many of these were used in testing and improving the �tting templates and strategy. Weused a number of di�ering input values for the omponents and found that the output values werealso very onsistent. On e the te hnique was settled and the data had been �t we generated 2500experiments of 500,000 events with the �nal templates and used input values based on the �ttedvalues of the data. The results are given in Table E.1 and the pull distributions are shown inFigures E.4 - E.7. Several sets of toy experiments using di�ering input values for the omponentswere repeated and found to be onsistently unbiased, but only the default results are listed here.
128

Profile for Selected Events0Z-60 -40 -20 0 20 40 60
) 0(dσ/ 0d
1
2
3
4
5
6
7
-1CDF Run II Preliminary, L = 1.6 fb-1CDF Run II Preliminary, L = 1.6 fb
) Profile for Selected Events0(Zδ0.0 0.5 1.0 1.5 2.0 2.5 3.0 3.5 4.0 4.5 5.0
) 0(dσ/ 0d
2
3
4
5
6
7
-1CDF Run II Preliminary, L = 1.6 fb
Figure E.1: Signal dimuon kinemati distributions for all muon andidates pairs passing analysis uts: (top)Z0 pro�le over d0 and (bottom)Æ(Z0).129

Profile for Selected Eventsφ0 1 2 3 4 5 6
) 0(dσ/ 0d
1
2
3
4
5
6
7
-1CDF Run II Preliminary, L = 1.6 fb
) Profile for Selected Eventsφ(δ0.0 0.5 1.0 1.5 2.0 2.5 3.0
) 0(dσ/ 0d
2.5
3.0
3.5
4.0
4.5
5.0
5.5
6.0
6.5
-1CDF Run II Preliminary, L = 1.6 fb
Figure E.2: Signal dimuon kinemati distributions for all muon andidates pairs passing analysis uts: (top)� pro�le over d0 and (bottom)Æ(�).130

Profile for Selected Eventsη-0.6 -0.4 -0.2 0.0 0.2 0.4 0.6
) 0(dσ/ 0d
2
3
4
5
6
7
-1CDF Run II Preliminary, L = 1.6 fb
) Profile for Selected Eventsη(δ0.0 0.2 0.4 0.6 0.8 1.0 1.2
) 0(dσ/ 0d
0
2
4
6
8
10
12
14
16
18
20
22
-1CDF Run II Preliminary, L = 1.6 fb-1CDF Run II Preliminary, L = 1.6 fb
Figure E.3: Signal dimuon kinemati distributions for all muon andidates pairs passing analysis uts: (top)� pro�le over d0 and (bottom)Æ(�). 131
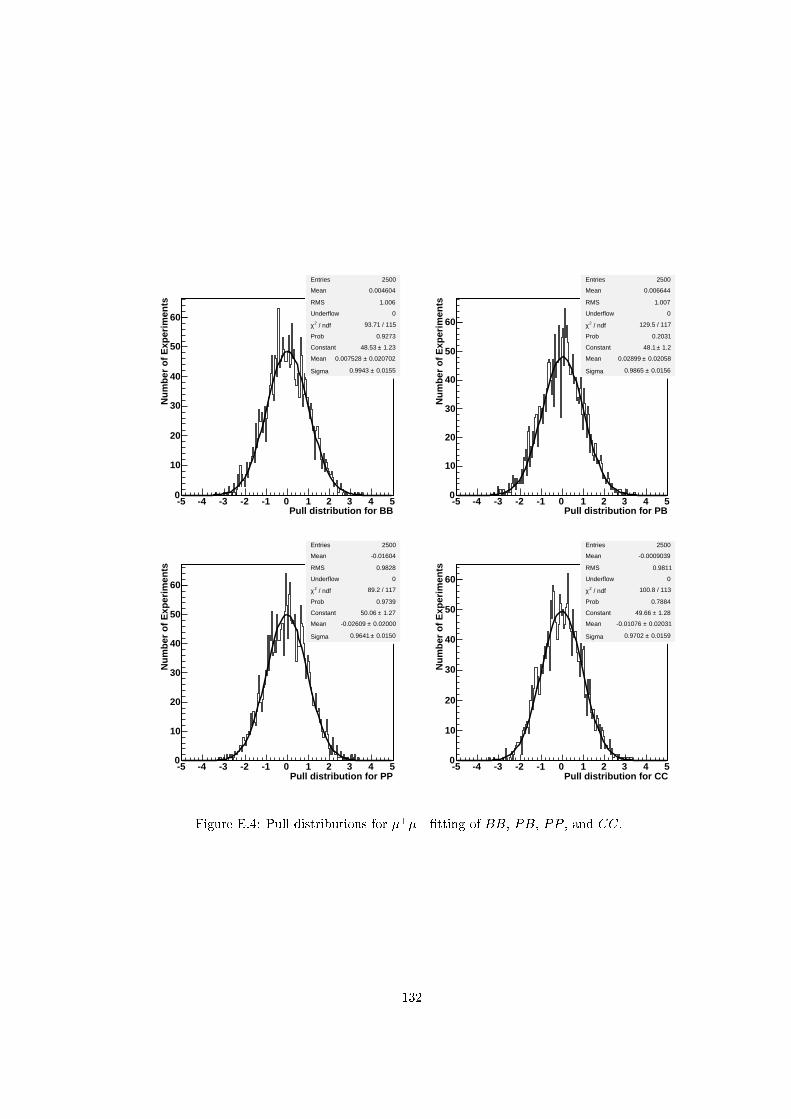
Entries 2500
Mean 0.004604
RMS 1.006
Underflow 0
/ ndf 2χ 93.71 / 115
Prob 0.9273
Constant 1.23± 48.53
Mean 0.020702± 0.007528
Sigma 0.0155± 0.9943
Pull distribution for BB-5 -4 -3 -2 -1 0 1 2 3 4 5
Nu
mb
er o
f E
xper
imen
ts
0
10
20
30
40
50
60
Entries 2500
Mean 0.004604
RMS 1.006
Underflow 0
/ ndf 2χ 93.71 / 115
Prob 0.9273
Constant 1.23± 48.53
Mean 0.020702± 0.007528
Sigma 0.0155± 0.9943
Entries 2500
Mean 0.006644
RMS 1.007
Underflow 0
/ ndf 2χ 129.5 / 117
Prob 0.2031
Constant 1.2± 48.1
Mean 0.02058± 0.02899
Sigma 0.0156± 0.9865
Pull distribution for PB-5 -4 -3 -2 -1 0 1 2 3 4 5
Nu
mb
er o
f E
xper
imen
ts
0
10
20
30
40
50
60
Entries 2500
Mean 0.006644
RMS 1.007
Underflow 0
/ ndf 2χ 129.5 / 117
Prob 0.2031
Constant 1.2± 48.1
Mean 0.02058± 0.02899
Sigma 0.0156± 0.9865
Entries 2500
Mean -0.01604
RMS 0.9828
Underflow 0
/ ndf 2χ 89.2 / 117
Prob 0.9739
Constant 1.27± 50.06
Mean 0.02000± -0.02609
Sigma 0.0150± 0.9641
Pull distribution for PP-5 -4 -3 -2 -1 0 1 2 3 4 5
Nu
mb
er o
f E
xper
imen
ts
0
10
20
30
40
50
60
Entries 2500
Mean -0.01604
RMS 0.9828
Underflow 0
/ ndf 2χ 89.2 / 117
Prob 0.9739
Constant 1.27± 50.06
Mean 0.02000± -0.02609
Sigma 0.0150± 0.9641
Entries 2500
Mean -0.0009039
RMS 0.9811
Underflow 0
/ ndf 2χ 100.8 / 113
Prob 0.7884
Constant 1.28± 49.66
Mean 0.02031± -0.01076
Sigma 0.0159± 0.9702
Pull distribution for CC-5 -4 -3 -2 -1 0 1 2 3 4 5
Nu
mb
er o
f E
xper
imen
ts
0
10
20
30
40
50
60
Entries 2500
Mean -0.0009039
RMS 0.9811
Underflow 0
/ ndf 2χ 100.8 / 113
Prob 0.7884
Constant 1.28± 49.66
Mean 0.02031± -0.01076
Sigma 0.0159± 0.9702
Figure E.4: Pull distributions for �+�� �tting of BB, PB, PP , and CC.132

Entries 2500
Mean -0.0004072
RMS 1.002
Underflow 0
/ ndf 2χ 111.4 / 121
Prob 0.7218
Constant 1.3± 49.4
Mean 0.02007± -0.01071
Sigma 0.0155± 0.9673
Pull distribution for BB-5 -4 -3 -2 -1 0 1 2 3 4 5
Nu
mb
er o
f E
xper
imen
ts
0
10
20
30
40
50
60
70
Entries 2500
Mean -0.0004072
RMS 1.002
Underflow 0
/ ndf 2χ 111.4 / 121
Prob 0.7218
Constant 1.3± 49.4
Mean 0.02007± -0.01071
Sigma 0.0155± 0.9673
Entries 2500
Mean -0.02656
RMS 1.011
Underflow 0
/ ndf 2χ 116.7 / 121
Prob 0.5932
Constant 1.28± 49.28
Mean 0.02024± -0.03271
Sigma 0.016± 0.968
Pull distribution for PB-5 -4 -3 -2 -1 0 1 2 3 4 5
Nu
mb
er o
f E
xper
imen
ts
0
10
20
30
40
50
60
Entries 2500
Mean -0.02656
RMS 1.011
Underflow 0
/ ndf 2χ 116.7 / 121
Prob 0.5932
Constant 1.28± 49.28
Mean 0.02024± -0.03271
Sigma 0.016± 0.968
Entries 2500
Mean 0.03059
RMS 1.02
Underflow 0
/ ndf 2χ 114.8 / 121
Prob 0.6424
Constant 1.26± 48.25
Mean 0.02077± 0.02224
Sigma 0.0168± 0.9923
Pull distribution for PP-5 -4 -3 -2 -1 0 1 2 3 4 5
Nu
mb
er o
f E
xper
imen
ts
0
10
20
30
40
50
60
Entries 2500
Mean 0.03059
RMS 1.02
Underflow 0
/ ndf 2χ 114.8 / 121
Prob 0.6424
Constant 1.26± 48.25
Mean 0.02077± 0.02224
Sigma 0.0168± 0.9923
Entries 2500
Mean 0.005595
RMS 0.9997
Underflow 0
/ ndf 2χ 130.4 / 118
Prob 0.2048
Constant 1.27± 49.57
Mean 0.019958± -0.004992
Sigma 0.0150± 0.9561
Pull distribution for CC-5 -4 -3 -2 -1 0 1 2 3 4 5
Nu
mb
er o
f E
xper
imen
ts
0
10
20
30
40
50
60
Entries 2500
Mean 0.005595
RMS 0.9997
Underflow 0
/ ndf 2χ 130.4 / 118
Prob 0.2048
Constant 1.27± 49.57
Mean 0.019958± -0.004992
Sigma 0.0150± 0.9561
Figure E.5: Pull distributions for �+�+ �tting of BB, PB, PP , and CC.133

Entries 2500
Mean 0.02186
RMS 0.9997
Underflow 0
/ ndf 2χ 125.8 / 116
Prob 0.2523
Constant 1.3± 49.7
Mean 0.01995± 0.02377
Sigma 0.0147± 0.9566
Pull distribution for BB-5 -4 -3 -2 -1 0 1 2 3 4 5
Nu
mb
er o
f E
xper
imen
ts
0
10
20
30
40
50
60
Entries 2500
Mean 0.02186
RMS 0.9997
Underflow 0
/ ndf 2χ 125.8 / 116
Prob 0.2523
Constant 1.3± 49.7
Mean 0.01995± 0.02377
Sigma 0.0147± 0.9566
Entries 2500
Mean 0.01126
RMS 1.005
Underflow 0
/ ndf 2χ 131.9 / 111
Prob 0.08607
Constant 1.27± 48.74
Mean 0.0206± 0.0265
Sigma 0.0164± 0.9751
Pull distribution for PB-5 -4 -3 -2 -1 0 1 2 3 4 5
Nu
mb
er o
f E
xper
imen
ts
0
10
20
30
40
50
60
70
Entries 2500
Mean 0.01126
RMS 1.005
Underflow 0
/ ndf 2χ 131.9 / 111
Prob 0.08607
Constant 1.27± 48.74
Mean 0.0206± 0.0265
Sigma 0.0164± 0.9751
Entries 2500
Mean -0.006472
RMS 0.9813
Underflow 0
/ ndf 2χ 123 / 109
Prob 0.17
Constant 1.29± 49.59
Mean 0.020401± -0.009122
Sigma 0.0162± 0.9634
Pull distribution for PP-5 -4 -3 -2 -1 0 1 2 3 4 5
Nu
mb
er o
f E
xper
imen
ts
0
10
20
30
40
50
60
Entries 2500
Mean -0.006472
RMS 0.9813
Underflow 0
/ ndf 2χ 123 / 109
Prob 0.17
Constant 1.29± 49.59
Mean 0.020401± -0.009122
Sigma 0.0162± 0.9634
Entries 2500
Mean -0.01771
RMS 0.9714
Underflow 0
/ ndf 2χ 116.2 / 110
Prob 0.3246
Constant 1.27± 50.61
Mean 0.01980± -0.03389
Sigma 0.0143± 0.9453
Pull distribution for CC-5 -4 -3 -2 -1 0 1 2 3 4 5
Nu
mb
er o
f E
xper
imen
ts
0
10
20
30
40
50
60
Entries 2500
Mean -0.01771
RMS 0.9714
Underflow 0
/ ndf 2χ 116.2 / 110
Prob 0.3246
Constant 1.27± 50.61
Mean 0.01980± -0.03389
Sigma 0.0143± 0.9453
Figure E.6: Pull distributions for ���� �tting of BB, PB, PP , and CC.134

Component Avg. Value Avg. Error Pull Mean Pull Width+�BB 43.0 0.28 0.01 � 0.02 0.99 � 0.02+� PB 7.0 0.42 0.03 � 0.02 0.99 � 0.02+� PP 21.0 0.25 -0.03 � 0.02 0.96 � 0.02+� CC 29.0 0.57 -0.01 � 0.02 0.97 � 0.02+ +BB 48.0 0.49 -0.01 � 0.02 0.97 � 0.02+ + PB 17.0 0.75 -0.03 � 0.02 0.97 � 0.02+ + PP 27.0 0.43 0.02 � 0.02 0.99 � 0.02+ + CC 8.0 0.99 0.00 � 0.02 0.96 � 0.02��BB 48.0 0.49 0.02 � 0.02 0.96 � 0.02�� PB 17.0 0.75 0.03 � 0.02 0.98 � 0.02�� PP 27.0 0.43 -0.01 � 0.02 0.96 � 0.02�� CC 8.0 0.99 -0.03 � 0.02 0.95 � 0.02Table E.1: Toy Experiment Results: ea h experiment ontains 300k opposite-sign events and200k same-sign events split evenly between �+�+ and ����subsets.Entries 2500
Mean -0.01578
RMS 1.006
Underflow 0
/ ndf 2χ 129.8 / 115
Prob 0.1627
Constant 1.25± 49.24
Mean 0.020144± 0.006272
Sigma 0.0150± 0.9639
Pull distribution for Asymmetry-5 -4 -3 -2 -1 0 1 2 3 4 5
Nu
mb
er o
f E
xper
imen
ts
0
10
20
30
40
50
60
Entries 2500
Mean -0.01578
RMS 1.006
Underflow 0
/ ndf 2χ 129.8 / 115
Prob 0.1627
Constant 1.25± 49.24
Mean 0.020144± 0.006272
Sigma 0.0150± 0.9639
Figure E.7: Pull distribution for the �tted raw asymmetry135

Appendix FTime-integrated MixingParameterThe time-integrated mixing parameter1, �0, is the ratio of same-sign (SS) muon pairs from Bhadron mixing over all muon pairs from B hadron de ays. It is an admixture of muon pairs fromB0 and Bs mixing de ays where �0 = fd�d + fs�s: (F.1)By using the �tted number of BB SS muon pairs and the orresponding number of BB opposite-sign (OS) muon pairs we should be able to extra t a value for �0. It is important to notethat there are systemati un ertainties involved in a pre ise measurement of �0 that we are notattempting to a ount for.To al ulate �0 we use the ratio of SS to OS muon pairs and the fra tion of muons whi hde ay sequentially (fseq), i.e., b! ! � a ording toR = Nbb(SS)Nbb(OS) = 2�0(1� �0)[f2seq + (1� fseq)2℄ + 2[�20 + (1� �0)2℄fseq(1� fseq)[�20 + (1� �0)2℄[f2seq + (1� fseq)2℄ + 4�0(1� �0)fseq(1� fseq) : (F.2)We are allowing SS pairs in the � mass window to in rease the statisti s for the asymmetry,but these must be removed for �0. We use fseq = 0:102� 0:015, the value al ulated from ourBB Monte Carlo. The un ertainty is dominated by the un ertainty of the semileptoni bran hingratios. The urrent world average is �0 = 0:128 � 0:008 [10℄, and the best measurement madeat the Tevatron is �0 = 0:152 � 0:013 from CDF Run I. In the �tted dimuon data used forthis dissertation we found �0 = 0:203� 0:015. The un ertainty is dominated by the systemati un ertainty in the fra tion of sequential de ays. We have not in luded an un ertainty for template�tting.1The time-integrated mixing parameter is also ommonly referred to as �, but we have reserved � and � asthe time-integrated mixing probabilities for neutral B and B hadrons respe tively. �0 then is 12 (�+ �).136

One on ern might be that this is an indi ation that the fake orre tion of the BB �ttedfra tion is too small whi h would have a signi� ant a�e t on the measured ACP . In assessingsystemati un ertainties on the asymmetry, we also examined �0. Adjusting ea h fake orre tioninput by its un ertainty, we assess �0 still using the default orre tion. �0 is ompletely un hangedin ea h of these variations. In an e�ort to signi� antly a�e t �0, we in reased the hadron/muonnormalization by 50%. This e�e tively in reases the fake rate by 50%, but it redu es �0 byless than 1%. The reason for su h small variations in �0 is that to �rst order the fake rate isdominated by �-fake pairs, and thus there is a proportional shift in the OS total for any hangein the SS total. More fake muons in the BB sample means removing more �+�+ events butalso means removing more �+�� and ���+ events. The asymmetry is a�e ted, but �0 is not.Furthermore, we used the BB fake rate orre tion method to al ulate the expe ted ontributionof SS CC sin e all SS CC pairs all have at least one fake. For this we used the same spe iesfake rates measured in the D� data, but repla ed the normalization and orrelation probabilitieswith orresponding values from CC MC. There are 36k � 2k predi ted SS CC pairs, and thedefault �t �nds 31k � 2k SS CC pairs. This provides additional on�rmation that a high valueof �0 is not indi ating too low of a fake orre tion. It ould be an indi ation that the �tted SSCC fra tions are slightly low; this possibility is dis ussed below. Ultimately, �0 is essentiallyde oupled from the fake orre tion.Another possibility is that we are in orre tly assessing the BB fra tions in the �t. Among the�tting and template variations used for ross- he ks, there is some variation of BB but this oftendoes not a�e t �0. One of the more powerful ross- he ks uses templates from the orrelated bbprodu tion analysis generated with Herwig rather than Pythia. This he k hanges the BBfra tions but not the asymmetry or �0. In addition, as shown in Figure F.1, the shape of theSS data on�rms what we would expe t from BB mixing, that a higher fra tion of SS dimuonpairs are BB and thus higher impa t parameter. If there is too mu h BB in the �t, it musta�e t the SS �t more than the OS �t to a�e t �0, and yet must still return BB fra tions forSS whi h are larger than OS. One ross- he k where this an be seen is in adding an extra PPba kground omprised of only fakes. This he k �nds lower BB fra tions, higher CC fra tionsand returns a �0 onsistent with previous measurements. The relative �t quality is not quite asgood. The �tted raw asymmetry is 0:0159� 0:0070, and the full �t results are shown in TableF.1 and Figure F.2. 137

)0(dσ/0d0 10 20 30 40 50 60
No
rmal
ized
Dim
uo
n D
ata
-310
-210
-110
OS data projection(blue) and SS proj. (red)
Figure F.1: Normalized OS(histogram) and SS(points) proje tion of data
138

Finally, we performed a ross- he k in ludes �0 as a onstraint. The asymmetry is 0:0134�0:0050 and the relative �t quality is equivalent to the default. The full �t results are shown inTable F.2 and Figure F.3. Again, the SS CC fra tions are higher in this �t.In on lusion, we �nd a value for �0 whi h is signi� antly higher than expe ted; we believe thisresult an be attributed to a high rate of fake muons in the �tted ba kgrounds and is only veryweakly orrelated with the CP asymmetry. Examining the fake orre tion to �tted BB eventswe �nd that �0 is very insensitive to any un ertainties in this al ulation. We are on�dentthat the anomalous �0 is not an indi ation that the fake removal is insuÆ ient. Fake muonsalso ome into this analysis as ba kgrounds from whi h the signal is isolated in the likelihood�tting. The relative weights of PB, PP , and CC (all ontaining fake muons) seem to be mu hmore important to �0 than to the asymmetry. We have do umented �tting variations that an hange the value of �0 very signi� antly while leaving the asymmetry essentially una�e ted.The systemati un ertainty on the asymmetry from the �tting has been assessed already, and itis relatively insigni� ant ompared to the un ertainties from statisti s and the fake orre tion.However, �0 is mu h more sensitive to �tting variation than the asymmetry, and would need asigni� ant �tting systemati un ertainty if we were trying to measure it. This un ertainty wouldredu e the signi� an e of any deviation in �0 from the world average. omponent opposite sign (�+��) same-sign (�+�+) same-sign (����)PP 19.4 � 0.2 24.9 � 0.3 21.1 � 0.3BB 39.5 � 0.2 38.5 � 0.4 42.8 � 0.4PB 2.2 � 0.3 7.8 � 0.6 7.6 � 0.6CC 36.2 � 0.5 23.0 � 0.8 22.0 � 0.8KK 2.8 � 0.1 5.7 � 0.2 6.4 � 0.2Table F.1: Additional prompt (fake hadron) ba kground �t results. All numbers listed in per ent. omponent opposite sign (�+��) same-sign (�+�+) same-sign (����)PP 21.9 � 0.2 28.0 � 0.3 24.5 � 0.3BB 44.2 � 0.2 42.6 � 0.3 47.5 � 0.3PB 6.2 � 0.3 18.1 � 0.5 20.0 � 0.6CC 27.7 � 0.4 11.4 � 0.7 9.0 � 0.7Table F.2: �0 onstraint �t results. All numbers listed in per ent.139

0 10 20 30 40 50 600
20
40
60
80
100
310×
0 10 20 30 40 50 600
20
40
60
80
100
310×Y-proj Profiles
OS Data [655669]PP [127377 +/- 1205]BB [258803 +/- 1488]BP [14244 +/- 2143]KK [18042 +/- 683]CC [237202 +/- 2960]
-1Fitted fractions OS (y-proj), CDF Run II Preliminary, L = 1.6 fb
0 10 20 30 40 50 600
5000
0 10 20 30 40 50 600
5000
Y-proj Profilesplus-plus Data [235085]PP [58616 +/- 727]BB [90609 +/- 904]BP [18348 +/- 1343]KK [13427 +/- 485]CC [54085 +/- 1819]
-1Fitted fractions plus-plus (y-proj), CDF Run II Preliminary, L = 1.6 fb
0 10 20 30 40 50 600
5000
0 10 20 30 40 50 600
5000
Y-proj Profilesminus-minus Data [205158]PP [43374 +/- 679]BB [87781 +/- 871]BP [15521 +/- 1293]KK [13247 +/- 473]CC [45235 +/- 1734]
-1Fitted fractions minus-minus (y-proj), CDF Run II Preliminary, L = 1.6 fb
0 10 20 30 40 50 60
310
410
510
0 10 20 30 40 50 60
310
410
510X-proj Profiles
OS Data [655669]PP [127377 +/- 1205]BB [258803 +/- 1488]BP [14244 +/- 2143]KK [18042 +/- 683]CC [237202 +/- 2960]
-1Fitted fractions OS (x-proj), CDF Run II Preliminary, L = 1.6 fb
0 10 20 30 40 50 60
210
310
410
0 10 20 30 40 50 60
210
310
410
X-proj Profilesplus-plus Data [235085]PP [58616 +/- 727]BB [90609 +/- 904]BP [18348 +/- 1343]KK [13427 +/- 485]CC [54085 +/- 1819]
-1Fitted fractions plus-plus (x-proj), CDF Run II Preliminary, L = 1.6 fb
0 10 20 30 40 50 60
210
310
410
0 10 20 30 40 50 60
210
310
410
X-proj Profilesminus-minus Data [205158]PP [43374 +/- 679]BB [87781 +/- 871]BP [15521 +/- 1293]KK [13247 +/- 473]CC [45235 +/- 1734]
-1Fitted fractions minus-minus (x-proj), CDF Run II Preliminary, L = 1.6 fb
)0(dσ/0d0 20 40 60
(dat
a-fi
t)/e
rro
r
-4
-2
0
2
4
6
OS data (x-proj)
)0(dσ/0d0 20 40 60
(dat
a-fi
t)/e
rro
r
-2
-1
0
1
2
3
4
++ data (x-proj)
)0(dσ/0d0 20 40 60
(dat
a-fi
t)/e
rro
r
-2
-1
0
1
2
3
4
- - data (x-proj)
0 10 20 30 40 50 60
(dat
a-fi
t)/e
rro
r
-4
-2
0
2
4
6
OS data (y-proj)
)0(dσ/0d0 10 20 30 40 50 60
(dat
a-fi
t)/e
rro
r
-2
-1
0
1
2
3
4
++ data (y-proj)
)0(dσ/0d0 10 20 30 40 50 60
(dat
a-fi
t)/e
rro
r
-3
-2
-1
0
1
2
3
4
- - data (y-proj)
Figure F.2: Fit results for ross- he k ontaining an additional prompt (fake hadron) ba kground.140

0 10 20 30 40 50 600
20
40
60
80
100
310×
0 10 20 30 40 50 600
20
40
60
80
100
310×Y-proj Profiles
OS Data [655669]PP [143677 +/- 1095]BB [290109 +/- 1155]BP [40419 +/- 1824]CC [181465 +/- 2421]
-1Fitted fractions OS (y-proj), CDF Run II Preliminary, L = 1.6 fb
0 10 20 30 40 50 600
5000
10000
15000
20000
25000
30000
35000
0 10 20 30 40 50 600
5000
10000
15000
20000
25000
30000
35000 Y-proj Profilesplus-plus Data [205523]PP [57447 +/- 614]BB [87463 +/- 624]BP [37126 +/- 1030]CC [23487 +/- 1352]
-1Fitted fractions plus-plus (y-proj), CDF Run II Preliminary, L = 1.6 fb
0 10 20 30 40 50 600
5000
10000
15000
20000
25000
30000
0 10 20 30 40 50 600
5000
10000
15000
20000
25000
30000 Y-proj Profilesminus-minus Data [179347]PP [43987 +/- 572]BB [85153 +/- 605]BP [34053 +/- 995]CC [16154 +/- 1297]
-1Fitted fractions minus-minus (y-proj), CDF Run II Preliminary, L = 1.6 fb
0 10 20 30 40 50 60
210
310
410
510
0 10 20 30 40 50 60
210
310
410
510X-proj Profiles
OS Data [655669]PP [143677 +/- 1095]BB [290109 +/- 1155]BP [40419 +/- 1824]CC [181465 +/- 2421]
-1Fitted fractions OS (x-proj), CDF Run II Preliminary, L = 1.6 fb
0 10 20 30 40 50 60
210
310
410
0 10 20 30 40 50 60
210
310
410
X-proj Profilesplus-plus Data [205523]PP [57447 +/- 614]BB [87463 +/- 624]BP [37126 +/- 1030]CC [23487 +/- 1352]
-1Fitted fractions plus-plus (x-proj), CDF Run II Preliminary, L = 1.6 fb
0 10 20 30 40 50 60
210
310
410
0 10 20 30 40 50 60
210
310
410
X-proj Profilesminus-minus Data [179347]PP [43987 +/- 572]BB [85153 +/- 605]BP [34053 +/- 995]CC [16154 +/- 1297]
-1Fitted fractions minus-minus (x-proj), CDF Run II Preliminary, L = 1.6 fb
)0(dσ/0d0 20 40 60
(dat
a-fi
t)/e
rro
r
-4
-2
0
2
4
6
8
OS data (x-proj)
)0(dσ/0d0 20 40 60
(dat
a-fi
t)/e
rro
r
-2
0
2
4
6
8
++ data (x-proj)
)0(dσ/0d0 20 40 60
(dat
a-fi
t)/e
rro
r
-2
0
2
4
6
- - data (x-proj)
0 10 20 30 40 50 60
(dat
a-fi
t)/e
rro
r
-4
-2
0
2
4
6
8
OS data (y-proj)
)0(dσ/0d0 10 20 30 40 50 60
(dat
a-fi
t)/e
rro
r
-2
0
2
4
6
++ data (y-proj)
)0(dσ/0d0 10 20 30 40 50 60
(dat
a-fi
t)/e
rro
r
-2
0
2
4
6
- - data (y-proj)
Figure F.3: Fit results for ross- he k onstraining �0141

Referen es[1℄ S.W. Herb, et al., EPhys. Rev. Lett. 39, 252 (1977).[2℄ M. Gell-Mann, Symmetries of Baryons and Mesons, EPhys. Rev. 125, 1067 (1962).G. Zweig, Preprint CERN (1964). M. Gell-Mann, EPhys. Lett. 8 214 (1964).[3℄ S.L. Glashow, J. Iliopoulos, L. Maiani, EPhys. Rev. D2, 1285 (1970);S. Weinberg, Phys. Rev. Lett. 19 1264 (1967);A. Salam, p.367 of Elementary Parti le Theory, ed. N. Svartholm (Almquist and Wiksells,Sto kholm, 1969).[4℄ D.J. Gross, F. Wil zek, EPhys. Rev. Lett. 30 1343( 1973).H.D. Politzer, EPhys. Rev. Lett. 30 1346 (1973).[5℄ N. Cabbibo, EPhys. Rev. Lett. 10, 531 (1963).[6℄ M. Kobayashi and T. Maskawa, EProg. Theor. Phys. 49, 652 (1973).[7℄ L.L. Chau and W.Y. Keung, EPhys. Rev. Lett. 53, 1802 (1984).[8℄ L. Wolfenstein, EPhys. Rev. Lett. 51, 1945 (1983).[9℄ Colin Gay, \B Mixing", Annu. Rev. Nu l. Part. S i. 50:577-641 (2000).[10℄ W.-M. Yao et al., Parti le Data Group, Review of Parti le Physi s, J. Phys. G33 (2006).[11℄ I. Yu, Ph.D. Thesis, Yale University, May 1996 (unpublished).[12℄ B. Aubert et al., The BABAR Collaboration, \Improved Measurement of CP Asymmetriesin B0! ( )K0� De ays", EPhys. Rev. Lett. 94 161803 (2005).K. Abe et al., The BELLE Collaboration, EPhys. Rev. D66 071102 (2002).T. A�older et al., The CDF Collaboration, \Measurement of sin 2� from B ! J=K0S withthe CDF dete tor", Phys. Rev. D61, 072005 (2000).[13℄ K. Abe, et al., \Improved measurement of CP-violation parameters sin 2�1 and j�j, B mesonlifetimes, and B0 � B0 mixing parameter �md", The BELLE Collaboration, Phys. Rev.D71 072003 (2005).B. Aubert et al., The BABAR Collaboration, Phys. Rev. D73 012004 (2006).[14℄ M. Gell-Mann, A. Pais, Phys. Rev. 97, 1387 (1955).[15℄ K. Lande, et al., Phys. Rev. 103, 1901 (1956).142

[16℄ P. Renton Ele troweak Intera tions: An Introdu tion to the Physi s of Quarks and Leptons.Cambridge, U.K.: Cambridge University Press, (1990).[17℄ M. Stari , et al., The BELLE Collaboration, \Eviden e for D0-D0bar Mixing", Phys. Rev.Lett. 98, 211803 (2007).[18℄ B. Aubert, The BABAR Collaboration,`Eviden e for D0-D0bar Mixing", Phys. Rev. Lett.97, 211802 (2007).[19℄ V. M. Abazov et al., The D0 Collaboration, \Dire t Limits on the Bs0 Os illation Fre-quen y," Phys. Rev. Lett. 97, 021802 (2006)[20℄ A. Abulen ia et al., The CDF Collaboration, \Observation of Bs-Bsbar Os illations", Phys.Rev. Lett. 97 242003 (2006).[21℄ Baym G. Le tures on Quantum Me hani s. Perseus Books, Cambridge, Mass (1990).[22℄ A. J. Buras, W. Slominski, and H. Steger, \B0�B0 mixing, CP violation and the B-mesonde ay", Nu l. Phys. B238, 529 (1984).[23℄ A.D. Sakharov, \CP Symmetry Violation, C-Asymmetry and Baryoni Asymmetry of theUniverse". Pisma Zh. Eksp. Teor. Fiz. 5 32 (1967).[24℄ I. I. Bigi et al., \CP Violation", edited by C. Jarlskog (World S ienti� , Singapore, 1989).[25℄ J.H. Christenson, J.W. Cronin, V.L. Fit h, R. Turlay, \Eviden e for the 2� de ay of the K02meson", Phys. Rev. Lett. 13 138 (1964).[26℄ D.H. Perkins, Introdu tion to High Energy Physi s, 4th ed, Cambridge University Press,(2000).[27℄ H. Burkhardt et al., NA31 Collaboration, Phys. Lett. B206 169 (1988).V. Fanti et al., NA48 Collaboration, Phys. Lett. B465 335 (1999).A. Alavi-Harati et al., KTeV Collaboration, Phys. Rev. Lett. 83 22 (1999).[28℄ Y. Grossman, et al., \CP Violation Beyond the Standard Model", Heavy Flavors II, Ad-van ed Series on dire tions in High Energy Physi s, 15 (1998).[29℄ D. A osta et al., CDF Collaboration, \First Eviden e for B0s ! �� De ay and Measurementsof Bran hing Ratio and ACP for B+ ! �K+", Phys. Rev. Lett. 95 031801 (2005).[30℄ B. Aubert et al., BaBar Collaboration, \Dire t CP Violating Asymmetry in B0 ! K+��De ays", Phys. Rev. Lett. 93 131801 (2004).[31℄ B. Aubert, The BABAR Collaboration, \Sear h for T and CP Violation in B0�B0 Mixingwith In lusive Dilepton Events.", Phys. Rev. Lett. 88 231801 (2002).[32℄ V. M. Abazov et al., The D0 Collaboration, \Combined D0 Measurements Constrain-ing the CP -violating Phase and Width Di�eren e in the B0s System", hep-ex/0702030v1,FERMILAB-PUB-07/044-E.[33℄ Y. Grossman, Y.Nir, and G. Raz, \Constraining the Phase of Bs�Bs Mixing", Phys. Rev.Lett. 97 151801 (2006).[34℄ M. Beneke, G. Bu halla, A. Lenz and U. Nierste, Phys. Lett. B576, 173 (2003).[35℄ I. Dunietz, R. Fleis her, and U. Nierste, \In Pursuit of New Physi s with Bs De ays", Phys.Rev. D63 114015 (2001). 143

[36℄ R. D. Fields, \The Sour es of b-Quarks at the Tevatron and their Correlations", Phys. Rev.D65, 094006, (2002).[37℄ CDF II Collaboration. The CDF Run II Te hni al Design Report. FERMILAB-Pub-96-390-E (1996).[38℄ A. A�older et al. CDF Central Outer Tra ker. Nu l.Instrum.Meth. A526 249-299, (2004).[39℄ SVX-II: CDF Run II Sili on Tra king Proje ts by A. Sill. 2000. Prepared for 8th Inter-national Workshop on Vertex Dete tors (Vertex 99), Texel, Netherlands, 20-25 June 1999.Nu l. Instrum. Meth. A447 1-8, (2000).[40℄ A. Artikov et al. Design and onstru tion of new entral and forward muon ounters forCDF II submitted to Nu l. Instrum. Meth. (available online O t. 12, 2004).[41℄ D. A osta et al. The CDF Cherenkov Luminosity Monitor. Nu l. Instrum. Meth., A461540-544, (2001).[42℄ D. A osta et al. A Time-Of-Flight Dete tor in CDF-II. Nu l. Instrum. Meth. A518 605-608,(2004).[43℄ R. Downing et al., Tra k Extrapolation and Distribution for the CDF-II Trigger System.Nu l. Instrum. Meth. A570 36-50, (2007).[44℄ E.J. Thomson et al., FERMILAB-CONF-02/144-E (CDF Note 5990) (2002).[45℄ W. Ashmanskas et al. Performan e of the CDF Online Sili on Vertex Tra ker. IEEE Trans.Nu l. S i., 49 1177-1184, (2002).[46℄ \Run II XFT Linker Design Spe i� ation,"http://www.physi s.ohio-state.edu/~hughes/xft/linker/do /linker spe .ps[47℄ T. Aaltonen et al., The CDF Collaboration, \Observation and mass measurement of thebaryon Xi(b)-" Phys. Rev. Lett. 99 052002 (2007).[48℄ A. Abulen ia et al., The CDF Collaboration, \Observation of Bs->K+K- and Measurementsof Bran hing Fra tions of Charmless Two-body De ays of B0 and Bs Mesons in p-pbarCollisions at sqrt(s)=1.96 TeV" Phys. Rev. Lett. 97, 211802 (2006).[49℄ B.Aubert et al., The Babar Collaboration, Phys. Rev. Lett. 88, 231801 (2002).[50℄ D. Ja�e et al., The CLEO Collaboration, Phys. Rev. Lett. 86, 5000 (2001).[51℄ I. Yu et al., \SEARCH FOR CP VIOLATION IN LOW PT DIMUON EVENTS", CDFnote 3113; F. Abe et al., The CDF Collaboration, Phys. Rev. D55, 2546 (1997).[52℄ K. A kersta� et al., The OPAL Collaboration, Z. Phys. C76 401 (1997).[53℄ R. Barate, et al., The ALEPH Collaboration, Eur. Phys. J C20 431 (2001).[54℄ V. Abazov et al., The D0 Collaboration, \Measurement of the CP -violation parameter ofB0 mixing and de ay with pp! ��X data", Phys. Rev. D74 092001 (2006).[55℄ D. A osta et al., The CDF Collaboration, \Measurement of the Average Time-IntegratedMixing Probability of b-Flavored Hadrons Produ ed at the Tevatron", Phys. Rev. D69012002 (2004).[56℄ A. Annovi et al., \Measurement of Correlated bb Produ tion in pp Collisions at ps =1960GeV", CDF Note 8733, (2007). 144

[57℄ A. Ta�ard, \Run II Cosmi Ray Tagger", CDF note 6100.[58℄ T. Sjstrand et al., \High-Energy-Physi s Event Generation with PYTHIA 6.1", Comput.Phys. Commun. 135 238 (2001).[59℄ D.J. Lange, \The EvtGen parti le de ay simulation pa kage", Nu l. Instrum. Meth. A462152 (2001).[60℄ S. Agostinelli et al., \GEANT4 - A simulation toolkit", Nu l. Instr. and Meth. A506 250(2003).[61℄ F. James. \MINUIT, A pa kage of programs to minimize a fun tion of n variables, omputethe ovarian e matrix, and �nd the true errors" program library ode D507, CERN, (1978).[62℄ J. Heinri h, In the Pro eedings of PHYSTAT2003: Statisti al Problems in Parti le Physi s,Astrophysi s, and Cosmology, Menlo Park, California, 8-11 Sep 2003, pp MOCT001[63℄ E. Berry et al., \Study of Muon Mat hing EÆ ien ies and Mistag Rates", CDF note 8042.[64℄ D.Glenzinski et al., \Measurement of Level 1, 2 and 3 low pT dimuon eÆ ien ies for theBs ! �� analysis", CDF note 7314.[65℄ http://www- df.fnal.gov/internal/physi s/bottom/b-monte arlo/instru tions-5 3 4.html[66℄ D. A osta, et al. The CDF Collaboration, \Measurement of the Lifetime Di�eren e BetweenBs Mass Eigenstates", Phys. Rev. Lett. 94 101803 (2005). (Updated in CDF Publi Note8950).
145

Author's BiographyChristopher Phillip Marino was born in Memphis, Tennessee on November 9, 1976. In his �nalyear at White Station High S hool, he enrolled in his �rst Physi s ourse purely out of uriosity.He entered the University of Memphis in 1995 ompletely unde ided with respe t to a major �eldof study. Five years later, highlighted by a semester abroad studying Fren h at the Universit�ed'Angers, he ompleted his time at the University of Memphis, still unde ided with a Ba helorof S ien e in Physi s and Mathemati s and a Ba helor of Arts in Fren h. Finally settling onPhysi s, he pro eeded to the University of Illinois at Urbana-Champaign. He re eived his Mastersin S ien e in Physi s in 2002, and 2003 moved to Bolingbrook Illinois where he worked at FermiNational A elerator Laboratory. In 2007, he ompleted his dissertation and re eived his Do torof Philosophy in Physi s. He intends to ontinue parti le physi s resear h at the Large HadronCollider in Geneva, Switzerland as a postdo toral fellow at Indiana University.
146