ABSTRACT Title of Thesis: DOLLAR SPOT AND GRAY LEAF SPOT
222
ABSTRACT Title of Thesis: DOLLAR SPOT AND GRAY LEAF SPOT SEVERITY AS INFLUENCED BY IRRIGATION PRACTICE AND PLANT PROTECTION MATERIALS Steven James McDonald, Master of Science, 2005 Thesis Directed By: Peter H. Dernoeden, Ph. D. Professor Department of Natural Resources Sciences and Landscape Architecture Agrostis stolonifera and Lolium perenne are widely used turfgrass species grown on golf fairways, however, they are susceptible to dollar spot (Sclerotinia homoeocarpa) and gray leaf spot (Pyricularia grisea) diseases, respectively. Two field studies were conducted to assess: 1) the influence of two irrigation regimes and seven chemical treatments on dollar spot and gray leaf spot severity; and 2) the effects of two spray volumes (468 and 1020 L water ha -1 ), two fungicides (chlorothalonil and propiconazole) and three application timings (dew present or displaced and dry canopy) on dollar spot control. Dollar spot was more severe in A. stolonifera subjected to infrequent irrigation; whereas, gray leaf spot was more severe in frequently irrigated L. perenne. The plant growth regulator and wetting agent evaluated suppressed dollar spot, but they had no effect on gray leaf spot. Chlorothalonil was most effective when applied to a dry canopy in 468 L water ha -1 .
Transcript of ABSTRACT Title of Thesis: DOLLAR SPOT AND GRAY LEAF SPOT
ABSTRACT Title of Thesis: DOLLAR SPOT AND GRAY LEAF SPOT SEVERITY
AS INFLUENCED BY IRRIGATION PRACTICE AND PLANT PROTECTION MATERIALS
Steven James McDonald, Master of Science, 2005 Thesis Directed By: Peter H. Dernoeden, Ph. D.
Professor Department of Natural Resources Sciences and Landscape Architecture
Agrostis stolonifera and Lolium perenne are widely used turfgrass species grown
on golf fairways, however, they are susceptible to dollar spot (Sclerotinia homoeocarpa)
and gray leaf spot (Pyricularia grisea) diseases, respectively. Two field studies were
conducted to assess: 1) the influence of two irrigation regimes and seven chemical
treatments on dollar spot and gray leaf spot severity; and 2) the effects of two spray
volumes (468 and 1020 L water ha-1), two fungicides (chlorothalonil and propiconazole)
and three application timings (dew present or displaced and dry canopy) on dollar spot
control. Dollar spot was more severe in A. stolonifera subjected to infrequent irrigation;
whereas, gray leaf spot was more severe in frequently irrigated L. perenne. The plant
growth regulator and wetting agent evaluated suppressed dollar spot, but they had no effect
on gray leaf spot. Chlorothalonil was most effective when applied to a dry canopy in 468 L
water ha-1.

DOLLAR SPOT AND GRAY LEAF SPOT SEVERITY AS INFLUENCED BY IRRIGATION PRACTICE AND DISEASE MANAGEMENT
WITH PLANT PROTECTION MATERIALS
By
Steven J. McDonald
Thesis submitted to the Faculty of the Graduate School of the University of Maryland, College Park, in partial fulfillment
of the requirements for the degree of Master of Science
2005
Advisory Committee: Dr. Peter H. Dernoeden, Advisor Dr. Thomas R. Turner Dr. Mark J. Carroll Dr. Cale A. Bigelow

©Copyright
By
Steven James McDonald
2005

ii
ACKNOWLEDGEMENTS
I have many people to thank upon completion of my graduate studies. Foremost,
I would like to thank is my advisor, Dr. Peter H. Dernoeden, for giving me the
opportunity to earn a Master of Science degree under his direction. In addition to the
research contributions contained within this thesis, Dr. Dernoeden exposed me to many
aspects of turfgrass pest management, which have been invaluable to me.
I am very grateful for the patience, guidance and friendship provided by the
members of my graduate committee: Dr’s Thomas R. Turner, Mark J. Carroll and Cale
A. Bigelow. I wish to thank Dr. Turner for sharing his knowledge of fertility practices
and turfgrass species and cultivars; Dr. Carroll for his guidance in measuring soil
moisture and environmental conditions; and Dr. Bigelow for his assistance with the
design of these studies and data analyses. I thank Dr. Arvydas Grybauskas for helping
me to better understand the nature of plant disease and epidemiology.
I also thank Mr. Phillip Read and Mr. Michael McNulty, Golf Course
Superintendents at Philadelphia Country Club, who stimulated my interests in disease and
weed management in golf course turf.
This research would not have been possible without assistance from the
University of Maryland Paint Branch Turfgrass Research Facility staff. I would like to
express my appreciation to the people who contributed their time and efforts to my
various research projects including: Mr’s Dave Funk, John Krouse, Jonathan Greenberg,
Joe DeRico and Matthew Katsuleres. I also am thankful for the friendship,
encouragement and assistance from many graduate students at the University of
Maryland, especially Dr. John E. Kaminski III and Ms. Eva Claire Synkowski.

iii
I am extremely thankful for the tireless and endless support of my family and
friends. I wish to thank to my parents, Donna and James McDonald, for their
encouragement as well as their emotional and financial support throughout the past seven
years of my college life. My parents taught me the value of hard work at an early age and
I would like to thank them for that lesson, because it was a major reason why I have
come this far. Last but not least, I wish to acknowledge my best friend and sweetheart,
Elizabeth Ann Sage for her love, friendship, patience and encouragement.

iv
TABLE OF CONTENTS
List of Tables ………………………………………………………………………
v
List of Figures ………………………………………………………………………
vii
List of Abbreviations …………………………………………………………….. viii
Chapter
I. Literature Review Dollar Spot…………………………………………………. 1 Gray Leaf Spot……………………………………………..
29
II. Dollar Spot and Gray Leaf Spot As Influenced by Irrigation, Paclobutrazol, Chlorothalonil and a Wetting Agent
Synopsis……………………………………………………... 41 Introduction…………………………………………………. 43 Material and Methods……………………………………….. 48 Results………………………………………………………. 58 Discussion……………………………………………………
71
III. Dollar Spot Control In Creeping Bentgrass As Influenced by Fungicide Spray Volume and Application Timing
Synopsis…………………………………………………….. Introduction…………………………………………………. 101 Material and Methods………………………………………. 102 Results………………………………………………………. 111 Discussion and Summary……………………………………
120
Appendix A.
………………………………………………………………………...
136
Appendix B.
………………………………………………………………………...
172
Literature Cited ……………………………………………………………………. 199

v
LIST OF TABLES Chapter II:
Table
Dollar Spot and Gray Leaf Spot As Influenced by Irrigation, Paclobutrazol, Chlorothalonil and a Wetting Agent
1. Number of Sclerotinia homoeocarpa infection centers in ‘Crenshaw’ creeping bentgrass fairway turf as influenced by irrigation, chlorothalonil, paclobutrazol and a wetting agent, 2002………………...
80
2. Percent of plot area blighted by Sclerotinia homoeocarpa in ‘Crenshaw’ creeping bentgrass fairway turf as influenced by irrigation, chlorothalonil, paclobutrazol and a wetting agent, 2002………………...
82
3. Percent of plot area blighted by Sclerotinia homoeocarpa in ‘Crenshaw’ creeping bentgrass fairway turf as influenced by irrigation, chlorothalonil, paclobutrazol and a wetting agent, 2003………………...
84
4. Number of Sclerotinia homoeocarpa infection centers in ‘Brightstar’ perennial ryegrass fairway turf as influenced by irrigation, chlorothalonil, paclobutrazol and a wetting agent, 2003………………...
86
5. Number of Sclerotinia homoeocarpa infection centers in ‘Southshore’ creeping bentgrass fairway turf as influenced by irrigation, chlorothalonil, paclobutrazol and a wetting agent 2004…………………
87
6. Percent of plot area blighted by Sclerotinia homoeocarpa in ‘Southshore’ creping bentgrass fairway turf as influenced by irrigation, chlorothalonil, paclobutrazol and a wetting agent, 2004………………...
88
7. Percent of plot area blighted by Pyricularia grisea in ‘Figaro’ perennial ryegrass fairway turf as influenced by irrigation, chlorothalonil, paclobutrazol and a wetting agent, 2002…………………………………
91
8. Percent of plot area blighted by Pyricularia grisea in ‘Figaro’ perennial ryegrass fairway turf as influenced by irrigation, chlorothalonil, paclobutrazol and wetting agent, 2004………………..............................
94
9. Precipitation at the experimental site during the study period in 2002, 2003, and 2004…………………………………………………………...
97
Chapter III:
Table
Dollar Spot Control In Creeping Bentgrass As Influenced by Fungicide Spray Volume and Application Timing
1. Influence of spray volume and application timing on the level of dollar spot control provided by chlorothalonil in ‘L-93’ creeping bentgrass, 2002………………………………………………………………………
122
2. Number of Sclerotinia homoeocarpa infection centers in ‘L-93’ creeping bentgrass as influenced by chlorothalonil, application timing and spray volume, 2002………………………………………………….
123
3. Pre-planned orthogonal contrasts for chlorothalonil applied in two spray volumes and application timings and their effect on dollar spot in ‘L-93’ creeping bentgrass, 2002…………………………………………………
124
4. Number of Sclerotinia homoeocarpa infection centers in ‘Crenshaw’ creeping bentgrass as influenced by chlorothalonil, application timing and spray volume, 2002………………………………………………….
125

vi
5. Influence of spray volume and application timing on the level of dollar spot control provided by chlorothalonil, propiconazole and the propiconazole + chlorothalonil tank-mix in ‘Crenshaw’ creeping bentgrass, 2003…………………………………………………………..
126
6. Percent of plot area blighted by Sclerotinia homoeocarpa in ‘Crenshaw’ creeping bentgrass as influenced by fungicides, spray volume, and application timing where dew was either present or absent, 2003………
127
7. Pre-planned orthogonal contrasts among spray volume, application timing and fungicide treatments and their effect on dollar spot control in ‘Crenshaw’ creeping bentgrass, 2003……………………………………
129
8. Influence of spray volume and application timing on the level of dollar spot control provided by chlorothalonil, propiconazole and the propiconazole + chlorothalonil tank-mix in ‘Southshore’ creeping bentgrass, 2004…………………………………………………………..
130
9. Number of Sclerotinia homoeocarpa infection centers and percent of plot area blighted by S. homoeocarpa in ‘Southshore’ creeping bentgrass as influenced by fungicides, spray volumes and application timings where dew was either present or absent, 2004…………………..
131
10. Pre-planned orthogonal contrasts among spray volume, application timing and fungicide treatments and their effect on dollar spot control in ‘Southshore’ creeping bentgrass, 2004…………………………………
133

vii
LIST OF FIGURES
Chapter II:
Figure
Dollar Spot and Gray Leaf Spot As Influenced by Irrigation, Paclobutrazol, Chlorothalonil and A Wetting Agent
1. Soil Moisture Measurements, 2002………………………………………
98
2. Soil Moisture Measurements, 2004………………………………………
99
Chapter III:
Figure
Dollar Spot Control In Creeping Bentgrass As Influenced by Fungicide Spray Volume and Application Timing
1. Dew Measurements……………………………………………………… 135

viii
LIST OF ABBREVIATIONS† Full meaning Abbreviation 467.5 L water ha-1 Low-SV 1019.5 L water ha-1 High-SV Active ingredient a.i. Analyses of variance ANOVA Area under disease progress curve AUDPC Carbon dioxide CO2 Centimeters cm Colony forming units cfu’s Carbon to nitrogen ratio C:N Demethylation inhibitor DMI Effective concentration EC Gram g Hectare ha Isobutylidene urea IBDU Kilogram kg Least significant difference test LSD test Liter L Liter water ha-1 L ha-1 Meter m Millimeter mm Nitrogen N Paclobutrazol PB Parts million-1 ppm Percent of plot area blighted % PAB Potato dextrose agar PDA Phenazine carboxylic acid PCA Plant growth regulator PGR Primer Select® (wetting agent) WA Quinol-oxiding inhibitor QoI Sclerotinia homoeocarpa infection center IC Species spp. Spent mushroom substrate SMS Spray volumes SV’s Sulfur coated urea SCU Superoxide dismutase SOD Time domain reflectometry TDR Ultra violet UV United States Golf Association USGA Vegetative compatibility group VCG † This list is in alphabetical order and not in the order of use throughout the thesis text.

1
I. Literature Review
Dollar spot Dollar spot disease in creeping bentgrass (Agrostis stolonifera L.) was
described by Monteith and Dahl in 1932. The casual agent initially was incorrectly
identified as a Rhizoctonia spp. and the disease originally was referred to as small brown
patch (Monteith, 1929). Monteith and Dahl (1932) noted that most turfgrass species
were susceptible to dollar spot, especially Agrostis spp. In 1937, Sclerotinia
homoeocarpa F. T. Bennett formally was described as the causal agent of dollar spot
(Bennett, 1937). Although S. homoeocarpa commonly is noted as the casual agent of
dollar spot, some believe that the true genus of the pathogen may be either Lanzia,
Moellerodiscus, or Rutstroemia (Carbone and Kohn, 1993). The problem with properly
naming the dollar spot pathogen is because American isolates of the fungus rarely
produce apothecia and none have produced ascospores. The original British isolates of
the fungus, which produced fertile apothecia, no longer exist (Smiley et al., 2005).
Dollar spot continues to be a difficult disease to manage in creeping bentgrass
grown on golf course fairways. In a typical season in the mid-Atlantic region, dollar spot
is most active in late-spring and early autumn. Some cultivars of creeping bentgrass,
such as ‘Crenshaw’ and ‘SR1020,’ are chronically attacked by S. homoeocarpa in the
summer. Disease symptoms first appear as small, white or tan lesions on individual
leaves. On bentgrass leaves, lesions appear oval or irregular-shaped and white with
brownish borders or as a tip dieback. The hourglass lesion, which is commonly found on
course textured species, is not common on close cut bentgrass. Under ideal
environmental conditions, the small circular flecks (about 1-3 cm) develop into sunken
patches (3-6 cm) of off-white colored turf within a few days. These sunken areas often

2
remain visible for long periods, particularly if fertilizers and/or fungicides are not
applied. The fungus can produce an abundance of foliar mycelium, which disperses the
pathogen to other turfgrass plants quickly. No conidia or other types of spores are
produced by S. homoeocarpa.
Dollar Spot Management As Influenced By Cultural Practices, Composts, Fertilizers and Soil pH
A greenhouse study demonstrated that low soil moisture levels enhance dollar
spot (Couch and Bloom, 1960). Couch and Bloom (1960) evaluated the impact of five
different soil moisture levels ranging from field capacity to permanent wilting point on
dollar spot severity in Kentucky bluegrass (Poa pratensis L.). Mature Kentucky
bluegrass plants were subjected to two weeks of a pre-determined soil moisture stress
level and then watered to field capacity. Plants were inoculated once soil moisture was at
the predetermined stress point. From that point, plants were incubated at 21ºC under high
relative humidity (i.e.>90%) in plastic bags. Dollar spot developed five days after plants
were inoculated. Soil moisture levels equal to or less than 75% of field capacity resulted
in an increase in dollar spot severity, when compared to plants maintained at field
capacity. Dollar spot severity generally was found to be greater when irrigation
practices favored low soil moisture (i.e., drought stress). The impact of leaf wetness
duration or the timing of irrigation in the greenhouse study, however, were not recorded.
It is likely that free water was present in the canopy during most of the study because of
the high relative humidity created by bagging the plants.
Jiang et al. (1998) found that dollar spot in perennial ryegrass (Lolium perenne L.)
maintained at fairway height was enhanced 50% when it received daily irrigation in one

3
year of a two year field study in Kansas. Jiang et al. (1998) observed that there was an
increase in clipping weights in the frequently irrigated plots. They suggested that as
clippings were removed from the study site, nitrogen (N) was depleted, which promoted
the increased blighting.
Watkins et al. (2001) studied the influence of two irrigation regimes on dollar
spot in field trials on creeping bentgrass in Nebraska. In that study, turf was irrigated
daily at 100% or 60% (between April to mid-June) to 80% (between mid-June and 9
September) of potential evapotranspiration. Neither turf quality or dollar spot severity
was affected by either irrigation regime. The total rainfall, however, was above the 14-
year average during both study years. These results and those of Jiang et al. (1998) do
not support the earlier findings of Couch and Bloom (1960).
In bahiagrass (Paspalum notatum Flueggé), it was observed that dollar spot was
more severe in many of the commonly grown cultivars following several periods of
spring drought in Florida (Blount et al. 2002). It was reported that the major factors
contributing to dollar spot development in bahiagrass were periods of drought followed
by humid conditions and rainfall.
Deep and infrequent irrigation is recommended as a disease management tool as
one would predict that drying conditions become less conducive for plant infection by
foliar pathogens (Beard, 1973; Couch, 1995; Vargas, 2004; Watschke et al., 1995). Free
water must be present on the foliage, however, for dollar spot to develop (Hall, 1984).
According to Couch (1995), irrigation practices that maintain soil moisture levels near
field capacity in combination with high nitrogen fertility can reduce dollar spot severity.

4
On golf courses, mowing typically occurs during the early morning hours.
Mowing during this time will displace dew and guttation fluid(s) from the canopy and
can lessen dollar spot severity. In Kentucky, Williams et al. (1996) investigated six
different mowing treatments for their effects on dollar spot incidence and severity in
creeping bentgrass maintained to a height of either 6 or 11 mm. It was determined that
the removal or replacement of turfgrass clippings had no impact on dollar spot incidence
or severity. Dew displacement by early morning mowing, however, reduced dollar spot
severity as much as 82% on fairway (11 mm) and 53% on putting green (6 mm) height
turf. It is likely that the displacement of the dew by mowing reduces the duration of leaf
wetness and speeds drying, which ultimately reduces conditions conducive for infection
in this microenvironment. The aforementioned reduction in dollar spot resulting from the
displacement of dew by mowing was as great as 82%, yet provided a level of disease
suppression that may not be acceptable for golf course turf.
Clippings generally are removed from golf course turf for playability reasons. In
higher cut turf, such as lawns and athletic fields, clippings are allowed to remain after
mowing. These clippings provide a source of N and other nutrients for plants (Vargas,
2004). Dunn et al. (1996) evaluated the influence of clippings on dollar spot in perennial
ryegrass maintained to a height of 16 mm. In July of the year following establishment,
clippings were collected from half of the plots by placing baskets on the mowers. By
August of the same year, and during the following two summers, clippings allowed to
remain on the perennial ryegrass resulted in a reduction of dollar spot between 10 to 40%.
The authors suggested that the N recycled to turf by clippings may have stimulated more
rapid growth and therefore recovery from blighting. These findings do not support those

5
of Williams et al. (1996), however, the two studies were conducted on different species
of grass.
Putting greens frequently are rolled by lightweight machines to increase ball roll
(i.e. green speed). Nikolai et al. (2001) evaluated the effect of lightweight rolling on
greens constructed with three different root zone mixes and seeded to ‘Penncross’
creeping bentgrass. The three root zones were: 85% sand and15% peat (v/v) =USGA
specified; 80% sand, 10% peat, and 10% soil built with a bottom gravel layer; and a non-
disturbed, native soil (sandy clay loam). The two rolling treatments were rolling three
times per week following early morning mowing, and not rolling after early morning
mowing. They found that rolling three times per week in combination with early
morning mowing reduced dollar spot severity by 50 to 200% on selected dates, when
compared to mowing alone. It should be noted, however, that the amount of dollar spot
in those plots ranged from 2.4 infection centers in rolled plots to 8.4 in non-rolled plots.
Hence, the magnitude of the difference was not great. The mechanism by which dollar
spot is suppressed by rolling is unknown. Researchers hypothesized that rolling after
early morning mowing may disperse concentrated guttation fluids that are released from
wounds created by mowing, thus lessening the nutrient substrate needed for infection.
National Turfgrass Evaluation Program (NTEP) data have shown that the
susceptibility of creeping bentgrass to dollar spot varies among cultivars. Abernathy et
al. (2001) evaluated ‘Penn A-4’, ‘Crenshaw’, ‘L-93’, ‘Mariner’ and ‘Penncross’ as either
monostands or as two or three-way blends for differences among their susceptibility to
dollar spot. They reported that blending a moderately resistant cultivar (‘L-93’) with a
susceptible cultivar (‘Crenshaw’) substantially reduced dollar spot, when compared to

6
‘Crenshaw’ alone. The blended stand, however, had between 71 and 114 infection
centers 3.3 m-2. Therefore, it is unlikely that an acceptable level of dollar spot reduction
can be achieved by blending creeping bentgrass cultivars. Regardless, proper blending
likely will help reduce the frequency and amounts of fungicides needed to manage dollar
spot.
Vincelli et al. (1997) evaluated twenty cultivars of four Agrostis species
including: A. palustris Huds (A. stolonifera L.), A..capillaris L. (browntop bentgrass), A.
castellana Boiss. & Reuter. (dryland bentgrass) and A. tenuis Sibth (colonial bentgrass)
for their susceptibility to S. homoeocarpa and their ability to recover from dollar spot
epidemics in the field. The authors observed few consistent patterns in the level of
resistance to S. homoeocarpa and recuperative ability among the cultivars. For example,
in the first study year both ‘Providence’ and ‘SR1020’ had an equal number of infection
centers, however, in the second and third study years ‘Providence’ had significantly
fewer infection centers than ‘SR1020’. The same two cultivars did not recover at the
same rate because the number of infection centers increased in one cultivar, while it
decreased in the other. For example, ‘Providence’ went from 86 infection centers on 30
June 1993 to 109 on 7 July 1993, whereas, ‘SR1020’ went from 164 to 104 during the
same period. It was concluded that turf recovery from dollar spot likely was due to the
plants’ ability to become tolerant, rather than resistant to infection by S. homoeocarpa
(Vincelli et al., 1997)
In 1929, Monteith summarized observations from the Arlington Turf Garden in
which different types of fertilizers provided for different levels of dollar spot suppression
in ‘Metropolitan’ creeping bentgrass. In that study, equivalent amounts of N were

7
applied over the course of a year from either cotton seed meal (an organic slow-release
N-source) or sulphate of ammonia. Plots treated with cotton seed meal remained disease-
free, while the sulphate of ammonia-treated plots became severely blighted by S.
homoeocarpa. Monteith (1929) offered no explanation for these findings.
Liu et al. (1995a.) evaluated several natural organic and inorganic N-sources for
their effect on dollar spot suppression and measured bacterial and fungal population
densities in turfgrass leaves, thatch and soil. The N-sources were applied over a three
year period to creeping bentgrass maintained at 5 mm and Kentucky bluegrass turf
maintained at 5 cm. The N-sources evaluated included: Alignate (1-0-2; from Norwegian
kelp meal); ammonium nitrate (34-0-0); Bovamura (dairy manure; no analysis given,
however applied at 150 kg N ha-1 ); Milorganite (6-2-0); Ringer Greens Super (10-2-6);
Ringer Lawn Restore (9-4-4); Sandaid (1-0-2; from granular sea plant meal); sewage
sludge (no analysis) and sulfur-coated urea (SCU) (35-0-0). The N-sources were applied
at the same time, but at different rates of N varying from 50-250 kg N ha-1. High
microbial populations were found on the leaves and in the thatch of plots treated with
Ringer Greens Super, Ringer Lawn Restore, ammonium nitrate and SCU, when
compared to all other N-sources. No differences, however, were observed in the
microbial populations found in the soils underlying each turfgrass species. Ammonium
nitrate and Ringer products provided for better dollar spot suppression, when compared
to all other treatments. The authors concluded that N from the fertilizers encouraged
microbial populations, which in turn suppressed disease. They proposed no other
mechanism by which dollar spot was suppressed. Because the rates of N differed, the

8
level of dollar spot control could not be correlated to the amount of N applied among the
different fertilizers.
Landschoot and McNitt (1997) evaluated seven fertilizers for their effect on
dollar spot development in ‘Penncross’ creeping bentgrass over a three year period in
Pennsylvania. Five of the fertilizers [Ringer Greens Super (10-2-6), Ringer Compost
(7-4-0), Sustane (5-2-4), Milorganite (6-2-0) and Harmony (14-3-6)] were natural
organics and the remaining two were synthetic organic N- sources (urea formaldehyde;
38-0-0, and urea; 41-0-0). All treatments, except urea formaldehyde, were applied four
times per year at two rates (24 or 48 kg N ha-1), while urea formaldehyde was applied
twice per year at 96 kg N ha-1. Landschoot and McNitt (1997) found that urea, which is
a water soluble synthetic organic fertilizer, gave equal if not better dollar spot
suppression than products containing natural organic N. Landschoot and McNitt
(1997) also noted that turf that had been stimulated to a dark green color typically was
damaged less by dollar spot. They suggested that N availability and the resulting
vigorous growth were reasons for better dollar spot suppression.
Davis and Dernoeden (2002) evaluated nine N-sources applied at 200 kg N ha-1
year-1 for their effect on dollar spot in ‘Southshore’ creeping bentgrass maintained at
fairway height in Maryland. Urea, SCU, Milorganite (6-2-0), Sustane Medium (5-2-4),
Earthgro 1881 select (8-2-4), Earthgro Dehydrated Manure (2-2-2), Ringer Lawn
Restore (10-2-6), Com-Pro (1-2-0) and Scotts All Natural Turf Builder (11-2-4) had
been applied for seven continuous years and dollar spot levels were assessed during the
last three years. In this field study, dollar spot incidence and severity, tissue N and soil
microbial activity were measured. They reported that only Ringer Lawn Restore (10-2-

9
6) and urea (46-0-0) delayed the initial spring onset of dollar spot, while other bio-
organics enhanced or had less of an effect on dollar spot. None of the nine N-sources
evaluated, however, consistently reduced total seasonal disease levels (AUDPC), when
compared to the untreated control. A strong negative correlation (higher tissue N with
less dollar spot) between the amounts of tissue N and dollar spot severity was observed
in one of two years of data collection. In one of two years of soil microbial activity
measurements, Milorganite, Earthgro-S, and urea were weakly and negatively
correlated with higher microbial activity and decreased dollar spot, when compared to
other treatments. Davis and Dernoeden (2002) concluded that the mechanism of dollar
spot suppression appeared to be more attributable to N availability rather than soil
microbial activity. Since N encourages rapid leaf growth, it is widely believed that the
plants are able to re-grow tissue and recover faster than the pathogen can blight and
thereby sustain less damage from S. homoeocarpa (Couch, 1995).
Boulter et al. (2002) evaluated five composts of varying ages applied at different
timings on dollar spot in Ontario, Canada and compared them to preventive applications
of chlorothalonil (tetrachloroisophthalontitrile) over a two year period. Chlorothalonil
was applied at the lowest labeled rate of (38.4 ml a.i. 100 m-2) on 14 day intervals. The
composts used were a blend of feedstocks and manures (horse manure, chicken manure,
paunch manure, bone meal ash, bark mix, soybean meal and Milorganite), which had C:
N ratio’s between 24-32 C:N. Regardless of whether the composts were applied in a
single or multiple applications or at varying ages, there generally were no differences in
the level of dollar spot suppression achieved, when compared to the untreated control.
In the first year of the study, disease pressure was high (from 9.3-23.0 % of plot area

10
blighted 28 days into study), and no differences in dollar spot levels among treatments
control were observed until 63 days after the study began. From that point on, the
fungicide provided better dollar spot control than all compost treatments. During the
second year, plots treated with all five composts developed less dollar spot compared to
untreated plots for most of the season, and provided a level of control nearly equivalent to
that of chlorothalonil. Chlorothalonil probably did not provide better control in both
study years because a low rate was applied on a 14 day interval, which may have been
too long.
There has been limited study of the influence of soil pH on dollar spot. Couch and
Bloom (1960), found that soil pH had little effect on dollar spot development, when it
was assessed at pH’s of 4.0, 5.6, 7.0 and 9.0 in a greenhouse study. These findings were
similar to field observations made earlier by Monteith (1929).
Chemical and Biological Control Of Dollar Spot There have been many attempts to use biological agents to control dollar spot,
however, few of these products and methods have provided acceptable levels of control,
especially during periods of high disease pressure. Nelson and Craft (1991), conducted a
three-year field study on a mixed stand of bentgrass (cultivar not named) and annual
bluegrass (Poa annua L.). Turf was maintained at a putting green height (5 mm) in New
York. They evaluated the effectiveness of 8 strains of Enterobacter cloacae and
compared the bacteria to two commonly used fungicides. Treatments in this field study
included eight strains of the bacterium E. cloacae individually applied preventively as a
topdressing (465 cm3 m-2 cornmeal/sand mixture consisting of 70% fine sand and 30%
cornmeal v/v) versus curative applications of propiconazole (1-[[2-(2, 4-dichlorophenyl)-
11
4-propyl-1, 3-dioxolan-2-yl]methyl]-1H-1,2,4-triazole). Propiconazole was applied twice
at 174 mg a.i. m-2 and all treatments were rated on monthly intervals. In a second study,
iprodione ((3, 5-dichlorophenyl)-N-(1-methylethyl)-2, 4,-dioxo-1-
imidazolidinecarboxamide) was applied at 0.6 g a.i. m-2 once curatively and treated plots
were evaluated twelve days after application. The putting green used for the study had
been naturally infested with S. homoeocarpa. The levels of disease reduction were
assessed and colony forming units (cfu’s) of E. cloacae from the soil were enumerated.
The eight topdressings infested with a strain of E. cloacae provided between 5 and 63%
dollar spot suppression over the course of the study. Strain EcCT-501 was especially
effective in reducing dollar spot levels (63%). Curative applications of propiconazole
provided 97% dollar spot control two months after applications ceased, while EcCT-501
provided 56% control. Strain EcCT-501 provided a level of dollar spot control equal to
iprodione 12 days after application. Although cfu’s of the bacteria declined over time,
bacteria were detected in thatch the spring after summer applications. Nelson and Craft
(1991) concluded that certain strains of E. cloacae provided near equivalent dollar spot
suppression, when compared to the two aforementioned fungicides applied curatively. It
should be noted that they compared curative fungicide treatments to preventive
applications of the bacteria. They also did not state if the level of control provided by
any of the strains would be considered acceptable for golf course turf.
Hodges et al. (1994) evaluated four Pseudomonas strains for their ability to
suppress S. homoeocarpa in a greenhouse study. Three isolates of Pseudomonas
fluorescens and one of Pseudomonas lindbergii were applied to young Kentucky
bluegrass plants and maintained in the dark and under high levels of relative humidity.

12
Plants then were inoculated with an isolate of S. homoeocarpa. Because S.
homoeocarpa causes rapid chlorosis of leaf tissue during the infection process, disease
severity in this study was assessed by the loss of chlorophyll at the end of three days.
The S. homoeocarpa-inoculated control plants had a 26% reduction in chlorophyll
content within 12 hours. Plants treated with all Pseudomonas strains had chlorophyll
levels equal to the uninoculated control. This study was conducted on the phylloplane of
turfgrass plants in controlled environments and there was no attempt to evaluate these
bacteria in the field.
In 1997, Rodriguez and Pfender evaluated Pseudomonas fluorescens (Pf-5) on
four-month old field grown Kentucky bluegrass and ‘Penncross’ creeping bentgrass, in
vitro, and in infested grass clippings for its effect on S. homoeocarpa. Strain Pf-5
produces metabolites (antibiotics, pyoverdine, siderophores and cyanide) antagonistic to
S. homoeocarpa. Grass clippings were taken from the greenhouse study, autoclaved and
infested with S. homoeocarpa by placing them in contact with colonized agar in a moist,
warm chamber for 10 to 15 days. The Pf-5 inoculum was sprayed (108 cfu’s ml-1 water)
over live plants and infested clippings one or two times. The ability of Pf-5 to reduce S.
homoeocarpa also was assessed on various antibiotic –amended media. Four nutrient
medias (King’s medium B agar, dilute cornmeal agar, 523 agar and nutrient agar
amended with 2% glucose or 1% glycerol) were amended with either ampicillin,
streptomycin, kanamycin or cycloheximide. Bacteria were applied to the plates in a
suspension and mycelial plugs of S. homoeocarpa were transferred to the media. The
radial distance between the edge of the bacterial colony and the edge of fungal growth
was measured after 2, 3 and 4 days of incubation. Strain Pf-5 reduced S. homoeocarpa

13
aerial mycelia levels in infested grass clippings, when applied once or twice. Strain Pf-5
also reduced dollar spot incidence and severity in both creeping bentgrass and Kentucky
bluegrass plants, when the bacterium was sprayed either once or twice over the
inoculated turf. In vitro studies, Pf-5 was inhibitory to S. homoeocarpa growth on all
media’s evaluated.
Strains of Pseudomonas aureofaciens (TX-1 and TX-2) were investigated by
Powell et al. (2000) in a greenhouse and field study for their ability to suppress S.
homoeocarpa. A single metabolite of the bacterium (phenazine-1 carboxylic acid; PCA)
was identified as the antagonistic ingredient against S. homoeocarpa. Phenazine-1
carboxylic acid was tested in a greenhouse study on ‘Penncross’ creeping bentgrass and
compared to two commonly used fungicides (chlorothalonil and triadimefon [1 (4-
hlorophenoxy)-3, 3-dimethyl-1-(1H-1, 2, 4- triazol-1-yl)-2-butanone]) in the Michigan
field study. The PCA provided a level of control equal to the fungicides in the
greenhouse study. Similar results were observed in the field; however, triadimefon
provided better control than either chlorothalonil or PCA.
Greenhouse and growth chamber studies have revealed that biological control of
S. homoeocarpa may be effective in controlled experiments (i.e. darkness, high relative
humidity, and controlled temperature). The uses of biological control measures on a
large scale in the field, however, have resulted in erratic levels of dollar spot control.
The increased survival of TX-1 and other bacteria following exposure to UV light and
improved delivery methods were investigated in field studies in Maryland and Indiana
(Davis and Dernoeden, 2001; Hardebeck et al., 2004). To overcome difficulties with
applying bacteria to golf courses and other turfgrass sites, a unit known as the BioJect

14
Biological Management System TM (Bioject) was developed. The BioJect allows for the
fermentation, injection and delivery of desirable bacteria (e.g., Pseudomonas spp.) via the
golf course irrigation system. This automated delivery system made the handling, mixing
and application of large amounts of bacteria easy for golf course managers. Additionally,
bacteria could be applied at night to prevent UV light degradation. Davis and Dernoeden
(2001) performed a field study to assess the number of cfu’s of Pseudomonas
aureofaciens strain TX-1 that were fermented and delivered to the turf by the BioJect.
They also assessed the level of dollar spot suppression provided by this bacterium applied
alone or with fungicides to ‘Crenshaw’ creeping bentgrass. Between 2.9 x 10⁷ and 2.0 x
1010 cfu’s were fermented in the tank during a 12 hour fermentation cycle. When the
irrigation water was analyzed for cfu’s, an average of 7.8 x 10⁵ of Tx-1 cm-2 were
delivered to the turf daily. When averaged over both years of the study, 4.0 x 10⁷ and 3.4
x 104 cfu’s of TX-1 were recovered from the foliage plus thatch and soil, respectively. It
was reported that TX-1 reduced dollar spot by 33% in the first year of the study and by
27% during the second year. The level of dollar spot suppression provided by TX-1
alone, however, was not acceptable for golf course turf and only plots that had been
treated with the combination of TX-1 and fungicides or fungicides alone provided
acceptable control. The TX-1 delayed dollar spot in iprodione and propiconazole-treated
plots, thus extending the residual control provided by those fungicides for seven to ten
days in one of the two study years.
Hardebeck et al. (2004) conducted three field experiments in Indiana to assess
dollar spot control by TX-1 when applied through an irrigation system using the Bioject.
These studies attempted to determine if there were an interaction between the amounts of

15
N or fungicides applied on the level and length of dollar spot control in creeping
bentgrass. Two rates of N (146 and 244 kg ha-1 year-1) from either SCU or urea were
evaluated. The TX-1 was applied nightly through the irrigation system to ‘Crenshaw’
creeping bentgrass. As much as 37% reduction in dollar spot was observed in 1998,
when compared to non-TX-1- treated plots. In 1999, however, TX-1 had no effect on
dollar spot severity. Hardebeck et al. (2004) observed that when environmental
conditions were optimal for dollar spot development, TX-1 provided little dollar spot
control. In general, when disease pressure was low, the efficiency of fungicides
increased by 32% and the duration of dollar spot control increased by 2.6 days when
fungicides were combined with TX-1. Fungicides and fertilizers generally had little or no
effect on TX-1’s ability to control dollar spot. Like Davis and Dernoeden (2001),
Hardebeck et al. (2004) also concluded that the level of dollar spot control provided by
TX-1 was both erratic and unacceptable for golf course turf.
Dernoeden et al. (2000) evaluated the bacterium Bacillus subtilis (SerenadeTM)
applied to ‘Southshore’ creeping bentgrass maintained as a fairway for curative dollar
spot control. The bacteria were applied weekly at two rates and were compared to
commonly used fungicides (thiophanate methyl (dimethyl [1, 2-phenylene-
bis(iminocarbonothioyl)]bis[carbamate]; dimethyl 4,4'-o-phenylenebis[3-
thioallophanate]) and chlorothalonil + thiophanate methyl) applied on 14 day intervals.
On one of five rating dates, the bacteria reduced dollar spot severity, when compared to
the untreated control. The fungicides provided significantly better dollar spot control
than the bacterium on all rating dates. Butler and Tredway (2003), also evaluated B.
subtilis for its ability to control dollar spot on a ‘Crenshaw’ creeping bentgrass putting

16
green when applied alone, in rotations or in tank-mixes with propiconazole. Dollar spot
pressure was severe at the North Carolina site. On all rating dates, plots treated with B.
subtilis had levels of dollar spot equal to untreated plots. The influence of B. subtilis in
rotations and tank-mixes with propiconazole could not be determined because the
fungicide provided excellent dollar spot control throughout the trial (Butler and Tredway,
2003).
Strains within a population that have a reduced ability to cause disease are called
hypovirulent. The cause of hypovirulence in fungi often is associated with double-
stranded RNA (dsRNA) from a mycovirus. Zhou and Boland (1997), found a significant
interaction between hypovirlence in S. homoeocarpa and double-stranded RNA. The
study evaluated 132 isolates of S. homoeocarpa for the presence of the dsRNA trait using
electrophoresis. They found 15 isolates that contained dsRNA and these S. homoeocarpa
isolates caused smaller lesions on detached, inoculated creeping bentgrass leaves. Zhou
and Boland (1997), hypothesized that the transmission of these mycoviruses into the field
could potentially be used as a biological approach for the management of dollar spot.
The practicality of dollar spot reduction on a large scale in the field using S.
homoeocarpa strains of dsRNA isolates is unknown and would require extensive work to
be proven effective.
Plant growth regulators (PGR) have been investigated for their impact on dollar
spot severity. Burpee et al. (1996) evaluated three commonly used PGR’s as follows:
paclobutrazol [(2RS,3RS)-1-(4-chlorophenyl)-4,4-dimethyl-2-(1H-1,2,4-triazol-1-
yl)pentan-3-ol)] applied at 0.16 kg a.i. ha-1; flurprimidol [(a-(1-methylethyl)-a-[4-
(trifluoromethoxy)phenyl]-5-pyrimidinemethanol] applied at 0.33 kg a.i. ha-1; and

17
trinexapac-ethyl [(ethyl 4-cyclopropyl(hydroxy)methylene-3,5-
dioxocyclohexanecarboxylate)] applied at 0.19 kg a.i. ha-1. In vitro studies were
performed to assess the effective concentration of these PGR’s for reducing S.
homoeocarpa mycelial growth by 50% (EC50). The EC50 for paclobutrazol and
flurprimidol were 0.10 and 0.21 µg ml-1, respectively, while it was 15.89 µg ml-1 for
trinexapac-ethyl. In their field studies, the aforementioned PGR’s were applied to
‘Penncross’ creeping bentgrass either alone or as a pre-treatment four days before
fungicide applications were made. The fungicides evaluated were chlorothalonil,
iprodione, propiconazole and thiophanate methyl applied at 9.6, 3.1, 0.4, 3.1 kg a.i. ha-1,
respectively. This study found that both paclobutrazol and flurprimidol had direct
fungistatic effects on S. homoeocarpa when applied alone, probably because these
materials are chemically related to triazole fungicides. Trinexapac-ethyl, however, was
significantly less fungistatic in the in vitro test, when compared to the aforementioned
PGR’s and provided no dollar spot suppression when applied alone in the field. In
general, flurprimidol and paclobutrazol pretreatments significantly enhanced the level of
dollar spot control provided by the fungicides. Pre-treatments with trinexapac-ethyl
enhanced dollar spot control from chlorothalonil, iprodione and propiconazole in one of
the two study years. When applied alone, flurprimidol and paclobutrazol significantly
suppressed (40-55%) dollar spot, when compared to the untreated control. These plant
growth regulators also suppress turf growth, which limits the removal of fungicide due to
less frequent mowing. Therefore, plant growth regulators may assist fungicides by
limiting the amount of chemical removed by mowing.
18
Golembieski and Danneberger (1998) conducted a two-year field study to
evaluate the influence of PGR’s, creeping bentgrass cultivars and N fertility on dollar
spot severity. ‘Crenshaw’ creeping bentgrass was seeded alone or in a 50:50 blend with
‘Penncross’ creeping bentgrass and maintained at fairway height (13 mm). Sulfur coated
urea was applied at 0, 24.4 or 48.8 kg N ha-1 on 30 day intervals for a total of 0,122, 244
kg N ha-1 year-1, respectively. Trinexapac-ethyl was applied four times at 3.0 kg a.i. ha-1
on 30 day intervals. Fertilizer treatments were applied alone or in combination with
trinexapac-ethyl. The ‘Crenshaw’ + ‘Penncross’ blend had less dollar spot at the onset of
disease, when compared to the ‘Crenshaw’ monostand. The blend, however, did not
exhibit less total disease over the two study years. Trinexapac-ethyl reduced dollar spot
severity each month (25-47%), when compared to the untreated control. Nitrogen
fertilization (48.8 kg N ha-1) also reduced dollar spot severity (38-86%) during the entire
study period, when compared to plots that received no N. In plots treated with the
combination of N and trinexapac-ethyl, dollar spot became less severe as the rate of N
increased. The combination of trinexapac-ethyl with the high rate of N only improved
dollar spot control by 2%, when compared to the high rate of N applied alone. The
authors concluded that both trinexapac-ethyl and N, as well as blending of cultivars,
should be incorporated into a dollar spot management program.
Zhang and Schmidt (2000) investigated the influence of trinexapac-ethyl and
propiconazole on ‘Penncross’ creeping bentgrass enzyme antioxidant levels and
photochemical activity under two fertility regimes in a field and greenhouse study. The
antioxidant superoxide dismutase (SOD) has been associated with stress tolerance in
creeping bentgrass. Photochemical activity was measured by fluorescence emission of

19
chlorophyll. The ratio of variable fluorescence to maximum fluorescence (Fv/Fm)
(maximum quantum efficiency) in photosystem II represents the efficiency of the
photosystem. As the value of the Fv/Fm increases the chlorophyll content increases. In a
field study, Zhang and Schmidt (2000) evaluated the effects of trinexapac-ethyl (0.44 kg
a.i. ha-1) and propiconazole (3.3 kg a.i. ha-1) applied monthly from May through
November in Virginia under two N fertility regimes (20.0 and 44.0 kg N ha-1 from urea
applied seven times year-1). Trinexapac-ethyl and propiconazole increased SOD activity,
increased Fm730/Fm690 ratio and reduced dollar spot under both N levels, when
compared to untreated plots. No interaction was observed between N levels and
trinexapac-ethyl or propiconazole. A greenhouse study was conducted to assess the
effects of both chemicals on creeping bentgrass under low soil moisture under the two
aforementioned N levels. Plugs (10 cm diameter and 2 cm deep) from the field that had
been exposed to the N, trinexapac-ethyl and propiconazole treatments were placed in
plastic containers with native soil 10 cm deep and dried to 5% soil moisture. Soil
moisture was maintained at that level for the duration of the study. The plants were
examined weekly for disease and chlorophyll fluorescence for a total of six weeks.
Nitrogen alone did not influence SOD activity in the greenhouse study. Trinexapac-ethyl
and propiconazole grown under the two N levels, however, promoted SOD activity under
low soil moisture conditions. The authors concluded that the increase in bentgrass
photosynthetic capacity provided by propiconazole and trinexapac-ethyl may have played
a partial role in reducing dollar spot.
Lickfeldt et al. (2001) evaluated the implications of long term repeated
applications of trinexapac-ethyl on Kentucky bluegrass mowed to a height of 3.2 cm.

20
Trinexapac-ethyl was applied at 0.17, 0.23 or 0.29 kg a.i. ha-1 five times every four weeks
or at 0.23, 0.29, or 0.34 kg a.i. ha-1 for four times every six weeks over three growing
seasons. Treatments were begun in May of each year. Trinexapac-ethyl was applied at
0.29 kg a.i. ha-1 every four weeks and reduced dollar spot severity 48%, when compared
to the untreated control (1.2 compared to 2.3 severity rating; where 1= no dollar spot and
5=maximum dollar spot severity). No other rates or timings reduced disease severity.
Lickfeldt et al. (2001) speculated that the mechanism for dollar spot reduction by
trinexapac-ethyl was related to the increase in SOD level as reported by Zhang and
Schmidt (2000).
Currently, many projects are being conducted to evaluate other approaches to
obtain extended levels of dollar spot suppression in the field. Preventive fungicide
applications may be the most effective method of dollar spot control. Dwyer and Vargas
(2004) reported that extended levels of dollar spot control can be achieved in Michigan
by applying triadimefon early in the spring (May), prior to the appearance of disease
symptoms (no date of occurrence given), and before environmental conditions are
optimal for disease. A single May application of triadimefon provided a significant
reduction in dollar spot until the middle of August in the same year. This extended
period of control may be due to a reduction in inoculum in response to a fungicide
application early in the spring. Conversely, curative fungicide applications likely result
in a build-up of inoculum, making control more difficult.
Fungicide Resistance to Sclerotinia homoeocarpa and Reduced Residual Dollar Spot Control

21
Chemicals have been used from the earliest reports of dollar spot management
(Monteith, 1932), and today fungicides are considered to be the most cost-effective
approach to the control of this disease (Vargas, 2004). More time, effort and money are
spent managing dollar spot than any other turfgrass disease (Vargas, 2004). Many
chemical control options are available on both preventive and curative bases. Problems
with S. homoeocarpa resistance to fungicides have risen, as fungicide use has increased
(Burpee, 1997).
Resistant strains of S. homoeocarpa have been reported to most classes of
fungicides that penetrate plant tissue (Smiley et al., 2005). Due to the mutli-site,
biochemical processes that are blocked by contact fungicides, these chemicals often are
relied upon to help prevent or delay the onset of resistance. Due to repeated applications
of penetrant fungicides with similar modes-of-action, problems with resistant S.
homoeocarpa populations have become more widespread. Two classes of fungicides
with single-site activity including benzimidazoles (thiophanate-methyl), and
demethylation inhibitors (DMI; propiconazole, triadimefon) have had reported cases of
resistance to S. homoeocarpa in the United States (Warren et al., 1974; Detweiler and
Vargas, 1982; Vargas et al., 1992 and Golembieski et al., 1995). Resistance problems
with DMI fungicides were reported in Canada by Hsiang et al. (1997). Dicarboximide
fungicides are reported to have multi-site activity, but have developed resistance to S.
homoeocarpa and other pathogens. Although unknown, dicarboximide fungicides may
have only single site activity on specific pathogens (Smiley et al., 2005).
Demethylation inhibitor fungicides commonly are used by golf course managers
to control dollar spot. Golembieski et al. (1995) evaluated S. homoeocarpa isolates from

22
Michigan golf courses that had never used a DMI and from courses that reported little or
no control from these fungicides. An in vitro study evaluated the EC50 values of
fungicide-amended potato dextrose agar (PDA). Fifty isolates from each golf course
were exposed to PDA amended with varying levels of triadimefon, fenarimol and
propiconazole. Reduced sensitively to the three DMI fungicides were observed and all
triadimefon-resistant isolates of S. homoeocarpa were cross-resistant to fenarimol and
propiconazole. Field trials were conducted to assess the influence of triadimefon,
fenarimol, propiconazole, iprodione, chlorothalonil and tank-mixes of triadimefon with
either chlorothalonil or iprodione. The fungicide treatments were applied on 10 or 21 day
intervals to a site where DMI resistant strain(s) of S. homoeocarpa were known to exist.
In two of the three study years, plots treated with DMI fungicides and iprodione provided
little or no dollar spot control. The combination of triadimefon and chlorothalonil
reduced dollar spot severity, when compared to the untreated control. The level of control
provided by the combination, however, was unacceptable (average severity rating for the
three years =2.0, on a 0 to 9 scale with 0 = 0 to 9% and 9=90-100% of plot area blighted).
When data were averaged over the three years, no statistically significant differences
were observed when compared to the other treatments applied alone. In all three study
years, chlorothalonil gave complete dollar spot control when applied alone on a 10-day
interval. All other fungicide treatments had disease ratings equal to the untreated plots.
Burpee (1997) examined in the field and lab the effectiveness of chlorothalonil,
iprodione, fluazinam (3-chloro-N-[3-chloro-2, 6-dinitro-4-(trifluoromethyl) phenyl]-5-
(trifluoromethyl)-2-pyridinamine), propiconazole, and thiophanate-methyl on isolates of
S. homoeocarpa that were either sensitive or resistant to both DMI and benzimidazole

23
fungicides. The lab study was conducted by amending PDA with varying concentrations
(0.01 to 100 ug ml-1) of the fungicides and placing 6-mm diameter mycelial plugs of S.
homoeocarpa into the center of the dish. The colonies were measured after 72 hours of
incubation. Data showed that some isolates that were resistant to DMI fungicides also
were resistant to benzimidazole fungicides. Chlorothalonil gave good control in the field,
however, reduced sensitivity was observed in the laboratory. Miller et al. (2002),
reported from a study looking at field and lab resistance that when reduced field
sensitivity to propiconazole, myclobutanil (alpha-butyl-alpha-(4-chlorophenyl)-1H-1, 2,
4-triazole-1-propanenitrile) or triadimefon was observed, reduced sensitivity also was
observed in laboratory settings.
Jo et al. (2002), conducted an in vitro study to assess EC50 concentrations of
thiophanate-methyl and propiconazole needed to reduce mycelial growth of S.
homoeocarpa. Dual fungicide resistance (resistance to more than one class [i.e. DMI and
benzimidazole]), was shown to be 2.5 times more common than single resistance
(resistant to only one class and still sensitive to another) in S. homoeocarpa isolates from
Ohio (Jo et al., 2002). Despite efforts to induce S. homoeocarpa resistance to
propiconazole through the repeated transfer of isolates to the fungicide-amended PDA,
resistance did not develop (Burpee, 2001). Therefore, Burpee (2001) suggested that the
mechanism of S. homoeocarpa resistance to fungicides in the field was due to a selection
of the naturally existing resistant biotypes. In a greenhouse study with ‘L-93’ creeping
bentgrass plants, however, isolates of S. homoeocarpa that had been exposed to repeated
exposure to propiconazole developed reduced levels of sensitivity, when compared to
isolates that had not received repeated propiconazole exposures (Miller et al., 2002).

24
Another potential reason for poor or short residual control may be due to rapid
microbial degradation of the fungicide. Apparently, some microbes are capable of using
a fungicide as an energy source. Little is known about the nature, scope and overall
importance of this phenomenon in turf. In Italy, only iprodione and propiconazole are
labeled for the control of dollar spot (Mocioni et al., 2001). As a result of repeated
applications, Mocioni et al. (2001) reported reduced residual effectiveness of iprodione
on Italian golf courses. Laboratory study revealed that poor field control provided by
iprodione was due to enhanced microbial degradation of the fungicide and not due to the
selection of resistant strains of S. homoeocarpa. The phenomenon was dependent on soil
physical-chemical properties (i.e. number of previous iprodione applications, soil pH and
organic matter content). Enhanced degradation of iprodione following repeated
applications to control Sclerotinia spp. in onions (Allium cepa) and lettuce (Papaver
somniferum) was reported earlier by Martin et al., 1990 and Walker, 1987.
Genetics of S. homoeocarpa and Its Hosts Powell and Vargas (2000) assessed vegetative compatibility groups (VCG)
among isolates of S. homoeocarpa collected during two epidemic periods in one year.
Vegetative compatibility is the ability of hyphae of two strains of fungi to fuse and form a
stable heterokaryon. For this to happen, the fungi must share identical alleles at a
particular set of loci. If strains are not genetically the same, they will not fuse together
and no heterokaryon will be formed. Vegetative compatibility groups are useful in
identifying subpopulations and members of the same VCG that are genetically similar
(Kohn et al., 1991). As previously mentioned, it is believed that S. homoeocarpa may not
be the correct taxon or that there may be more than one casual agent. After examination

25
of over 1,300 isolates, Powell and Vargas (2000) concluded that the two epidemics
occurring in Michigan were the result of a single rather than multiple pathogen species.
Viji et al. (2004), examined the genetic diversity among S. homoeocarpa isolates
from different geographic regions and different turfgrass species [i.e. creeping bentgrass,
annual bluegrass (Poa annua L.), bermudagrass (Cynodon dactylon L.) and perennial
ryegrass (Lolium perenne L.)] and identified eleven VCG’s. Over half of the isolates
belonged to one VCG, which were found in different geographic regions including
Canada, Delaware, Illinois, New Jersey, New York, North Carolina, Pennsylvania and
Virginia. In a virulence test, it was determined that there was a relationship between the
VCG and an isolates’ ability to damage turfgrass (Viji et al., 2004).
Other studies have assessed the genetic variation and host specialization of S.
homoeocarpa (Raina et al., 1997; Hsiang et al., 1999; and Hsiang et al., 2000). From
these experiments, it was determined that within a population of S. homoeocarpa some
level of variation in a local population during a dollar spot epidemic exists; however, in
the broad picture there was very little variation. Hsiang et al. (1999), surveyed the
genetic variability of 191 isolates of S. homoeocarpa from Ontario and Japan using
restriction fragment length polymorphisms (RFLP) of the intergenic spacer region of
rDNA and random amplified polymorphic DNA (RAPD). From the isolates evaluated,
the genetic similarity among isolates from Japan and Ontario was 66% and 86%,
respectively (Hsiang et al., 1999). When the Ontario isolates were compared to the
Japan isolates, there was a high level of genetic diversity (51%). From these studies, it
was concluded that within a population there is a high degree of genetic similarity,
26
however, among different populations from different geographic locations there was a lot
of diversity.
Hsiang et al. (2000) assessed the host specialization of fifty S. homoeocarpa
isolates from five turfgrass [annual bluegrass, creeping bentgrass, Kentucky bluegrass,
perennial ryegrass and tall fescue (Festuca arundinacea L.)] hosts using RAPD analysis.
These analyses showed significant genetic differentiation among isolates from different
host species. Data indicated that there was a weak level of host specialization by S.
homoeocarpa (Hsiang et al., 2000). Limited variation within the S. homoeocarpa
genome may be due to the lack of apothecia production in nature. Without sexual
reproduction, there would be no chance for sexual recombination and therefore less
diversity would be expected within an S. homoeocarpa population.
Bonos et al. (2003) evaluated 265 creeping bentgrass clones and five different
isolates of S. homoeocarpa in the field. Quantitative inheritance is when the clones and
progeny show varying levels of resistance and none show complete resistance. All clones
and progeny exhibited varying levels (10-60%) of disease severity and none was immune
to S. homoeocarpa. They concluded that the distribution of phenotypes for clones and
progeny for dollar spot resistance may be quantitatively inherited. Belanger et al. (2004)
suggested that the use of interspecific hybrids (Agrostis stolonifera x Agrostis capillaris
L.) could be a tool for developing cultivars resistant to dollar spot. Agrostis capillaris
(colonial bentgrass) exhibits some natural resistance to S. homoeocarpa when compared
to creeping bentgrass, however, it is more susceptible to brown patch (Rhizoctonia solani
Kühn). It will take many years of screening to develop S. homoeocarpa resistant
cultivars.

27
Bonos et al. (2004) identified resistant creeping bentgrass clones that showed a
significant increase in turfgrass density and reduction in the size of the S. homoeocarpa
infection centers. The mechanism for conferring smaller-sized infection centers is
unknown. Trichome size was associated with less dollar spot, because resistant clones
had larger trichomes than susceptible clones. Bonos et al. (2004) concluded that the large
trichomes may be a physical hinderance to infection by S. homoeocarpa.
Fu et al. (2005) introduced a rice thaumatin-like protein (TLPD34) into creeping
bentgrass in an attempt to improve the host resistance to fungal diseases including brown
patch and dollar spot. The gene was introduced into ‘Crenshaw’ creeping bentgrass using
A. tumefaciens strain LBA4404 in concert with the plasmid pUbiTLP, which carried the
necessary TLPD34 gene and selection marker. Transgenic plants were screened using
glufosinate-ammonium at the tissue culture stage and in the greenhouse. The expression
of the TLPD34 gene was confirmed using PCR amplification. To assess the level of
fungal disease resistance in the transgenic creeping bentgrass, the plants were exposed to
R. solani and S. homoeocarpa in the greenhouse and field, respectively. Field test with S.
homoeocarpa showed that the TLPD34 transgenic plants had improved dollar spot
resistance in the field (40%), however, increased susceptibility to brown patch under
greenhouse evaluations (Fu et al., 2005).
Previous research has identified cultural, genetic, and biological approaches to
reduce dollar spot incidence and severity. No single practice will provide for complete
control or can be relied upon to reduce disease severity to within an acceptable level for
golf course greens, tees and fairways. Therefore, fungicides continue to be relied upon,
but they have their own problems. Resistance problems seem to be on the rise, as are

28
field reports of less residual control being provided by fungicides. Due to current
restrictions on application rates and intervals, and the potential removal of various
fungicides from the market, ways to use these materials more efficaciously need to be
investigated.

29
Gray leaf spot Gray leaf spot is incited by Pyricularia grisea (Cooke) Sacc.
[teleomorph Magnaporthe oryzae (B. Couch) and M. grisea (T.T. Herbert) Barr]. DNA
sequencing and mating research with the pathogen has led it to be divided into two
species, M. grisea and M. oryzae (Couch and Kohn, 2002). Magnaporthe grisea is used
to describe isolates from Digitaria spp., while M. oryzae is used to describe isolates from
rice (Oryza sativa L.) and turfgrasses. Smiley et al. (2005) noted that until a formal name
change is adopted by the International Committee of Fungal Nomenclature, P. grisea and
M. grisea likely will continue to be referenced.
Turfgrass species damaged by gray leaf spot include: annual ryegrass (Lolium
mulitflorum Lam.) perennial ryegrass (Lolium perenne L.), tall fescue (Festuca
arundinacea Schreb.), kikuyugrass (Pennisetum clandestinum Hochst. ex Chiov.) and St.
Augustinegrass (Stenotaphrum secundatum (Walt.) Kuntze). The primary host for P.
grisea in the mid-Atlantic region is perennial ryegrass. The earliest reports of gray leaf
spot outbreaks in perennial ryegrass occurred in Pennsylvania in 1992 and Maryland in
1995 (Landschoot and Hoyland, 1992; Dernoeden, 1996). The disease since has been
reported in various regions of the United States including the mid- Atlantic, northeastern,
mid-west, and California (Harmon et al., 2000; Pederson et al., 2000 Schumann and
Jackson, 1999; Uddin et al., 2002a). Gray leaf spot of perennial ryegrass has become a
disease of significant economic importance, particularly in the mid-Atlantic and
transition zone regions. Uddin et al. (2003b), reported that an average golf course with
perennial ryegrass fairways has had to increase their fungicide budget by greater than 5%
since 1995 to address gray leaf spot.

30
Harmon and Latin (2001) found that the pathogen survives unfavorable
environmental conditions in plant debris as dormant mycelium. Once spring
environmental conditions become favorable for the growth of dormant mycelium, conidia
are produced on necrotic tissues and dispersed on air currents. The release cycle of
spores and infection processes are still misunderstood (Uddin et al., 2003a). The
symptoms of gray leaf spot appear in mid-to-late summer and can continue into the late
autumn if the proper environmental conditions exist (Harmon and Latin, 2005).
Disease symptoms on perennial ryegrass first appear as small, water- soaked
lesions with grayish borders on leaf margins. These lesions often appear to be round or
oval in shape, grayish brown or dark brown in color and sometimes they have a yellow
halo. Infected leaves may have a twisted or “fish-hook” appearance. Leaf lesions,
however, can be diverse in color and shape and may not be a reliable diagnostic aid.
Conidia develop quickly on infected tissue, and form a dense mat in early morning hours
that gives infected tissue a grayish color and/or a felted appearance. The conidia are
dispersed by wind, equipment and people to infect other perennial ryegrass plants. This
disease can be rapid acting and has the ability to destroy large areas of perennial ryegrass
in a few days (Dernoeden, 1996). Severely affected stands often have a purple-gray or
wilt-like appearance, and when the disease is allowed to progress the turf will collapse,
die and turn a tan color. Pyricularia grisea is not known to be pathogenic to other
grasses or weeds in the mid-Atlantic region. Hence, other grasses and weeds remain
following a gray leaf spot epidemic. Once disease symptoms become pronounced, gray
leaf spot easily can be confused with other diseases including leaf spot and net-blotch
(i.e. Bipolaris spp., Curvularia spp., Drechslera spp.,), brown patch (Rhizoctonia spp.),

31
dollar spot (Sclerotinia homoeocarpa) and Pythium blight (Pythium spp.). The potential
for a misdiagnosis can complicate fungicide selection and give P. grisea more time to be
destructive. To positively confirm gray leaf spot, it is necessary to examine blighted
tissue for conidia.
Gray leaf spot on tall fescue begins as small, round or oval, tan-brown leaf lesions
with a dark purple margin. Individual lesions are small (<5 mm) and can coalesce,
however, tall fescue usually is able to recover from infections. (Smiley et al. 2005). In
St. Augustinegrass, gray leaf spot symptoms initially appear as small, brown to red
lesions on leaves and stolons. Lesions quickly become oblong with enlarged necrotic
centers. Once lesions become necrotic, they appear grayish-tan in the center and have
brown to red borders. Pyricularia grisea can quickly cause immature stands of St.
Augustinegrass to thin out and decline, however, older stands rarely incur significant
damage (Atilano and Busey, 1983). In both tall fescue and St. Augustinegrass, diseased
stands may appear scorched, as if they were suffering from drought stress (Smiley et al.
2005).
Environmental Conditions Favoring Gray Leaf Spot Development High summer temperatures and dry soil conditions appear to predispose plants to
leaf infection by P. grisea. The disease, however, can appear during cool and wet
conditions and frequently becomes active in September and can persist into November.
Nightly watering is a common practice during periods of drought. Nightly watering
results in long periods of leaf wetness, which allows for huge numbers of P. grisea spores
to be produced overnight (Dernoeden, 1999). Uddin et al. (2003a) reported that
conditions conducive for gray leaf spot development often occur in late summer or early

32
autumn when the average air temperature is = 28ºC (Uddin et al.,2003a). High relative
humidity, extended periods of leaf wetness (12 to 15 hours), and moderately warm
temperature (=20ºC) conditions increased the chances for gray leaf spot development in a
greenhouse model. Uddin et al. 2003a, found that gray leaf spot did not develop in
perennial ryegrass plants that were air dried immediately after spraying the leaves with a
conidial suspension. The authors concluded that free moisture is required for gray leaf
spot development in ryegrass. Therefore, temperature and period of leaf wetness are
highly dependent on each other.
Harmon and Latin (2005) documented outbreaks of gray leaf spot in perennial
ryegrass and winter survival of P. grisea (M. oryzae) in Indiana. Gray leaf spot was
observed in central Indiana in the last week of August or the first week of September
during all three study years. By capturing conidia, it was observed that in only one of the
three study years, disease progress followed conidia release. Peak conidia capture,
however, was in September of each year. In another study, four different environmental
regimes (three artificial greenhouse environments and one field) were evaluated for the
over-wintering survival of the pathogen. The three artificial treatments were constant
temperatures of 4, -20 ºC and alternating 24 hour periods of 4 and -20ºC. The field
regime was completed by placing P. grisea infested perennial ryegrass residue in an
envelope inside a large stand of perennial ryegrass from November to May. Alternation
of temperatures and the -20ºC treatments resulted in the least pathogen viability when
compared to the field sample and the constant 4 ºC treatments. Harmon and Latin (2005)
concluded that when winter temperatures are low (< -20ºC), the pathogen population is
reduced thus resulting in less disease the following summer.

33
Cultural Practices and Fertility Influences on Gray Leaf Spot Vaiciunas and Clarke (2001) evaluated the impact of N rate, mowing height and
clipping removal on the incidence and severity of gray leaf spot for three years in New
Jersey. The N rates evaluated were 0, 24.4, 48.8, and 97.6 kg N ha-1 from urea. In one
study year, when disease pressure was low, gray leaf spot severity decreased between 22
and 69% of the plot area blighted with increasing N rate. During the other two years, they
observed that gray leaf spot severity increased as N rate increased, especially at rates
greater than 24.4 kg N ha-1. Plots mowed at 12 mm had 52, 66, and 45% less gray leaf
spot when compared to those mowed at 89 mm during all three study years, respectively.
In one year, removal of clippings reduced gray leaf spot by as much as 41%, however,
disease pressure was low in that year. During the two other study years, clipping removal
had no influence on gray leaf spot. Clarke and Vaiciunas (2001) noted that water-
soluble N sources (sources not given in abstract) increased disease severity, while slow
release N sources had no effect on gray leaf spot, when compared to non-fertilized plots.
Uddin et al. (2001) evaluated ammonium nitrate (35-0-0), ammonium sulfate
(21-0-0), urea (46-0-0), IBDU (isobutylidene urea; (31-0-0) and Milorganite (6-2-0) at
24.5 and 49 kg N ha-1 for their effects on gray leaf spot in perennial ryegrass in
Pennsylvania. Plots treated with ammonium nitrate, ammonium sulfate and urea
exhibited greater disease severity than plots treated with IBDU, Milorganite or the
untreated control. These findings support those of Clarke and Vaiciunas (2001).
Williams et al. (2001) investigated the effects of mowing height and N level on
the severity of gray leaf spot in a two-year field study in Kentucky. Mowing treatments
were 1.9 and 6.4 cm and there were two N levels from urea (183 and 366 kg ha-1 year-1).

34
The N treatments were applied monthly between April and August. No interactions
between N-level and mowing height were observed. Plots treated with the highest N rate
had significantly more gray leaf spot (32%) than those treated with the lowest N rate
(18%). The authors suggested that applications of water-soluble N prior to the onset or
during environmental condition favorable for gray leaf spot development should be
avoided (Williams et al., 2001).
Uddin et al. (2004) evaluated the effect of the herbicide ethofumesate (2-ethoxy-
2, 3-dihydro-3, 3-dimethyl-5-benzofuranyl methanesulfonate), which is used to control
annual bluegrass in perennial ryegrass turf, for its effects gray leaf spot. They found that
when ethofumesate was applied in the spring it increased the severity of gray leaf spot.
Autumn applications (disease not active) of ethofumesate, however, had no effect on
disease severity in the following year. Summer applications of ethofumesate were not
evaluated. Clark and Vaiciunas (2001), observed that the herbicide dithiopyr (S,S'-
dimethyl 2-difluoromethyl-4-isobutyl-6-trifluoromethylpyridine-3,5-dicarbothioate),
which is used for preemergence crabgrass (Digitaria spp.) control, also increased gray
leaf spot severity.
Biological Control of Gray Leaf Spot Viji et al. (2002) conducted experiments with spent mushroom substrate (SMS) as
a possible biological control approach for gray leaf spot. In laboratory studies, isolates of
Pseudomonas aeruginosa from the SMS were found to be antagonistic to P. grisea.
Foliar applications of the bacteria at various timings (preventively) were made to
‘Pennfine’ perennial ryegrass in a greenhouse and field study. The P. aeruginosa
suppressed gray leaf spot equally when it was applied at 1, 3 and 7 days prior to

35
inoculation with P. grisea in the controlled experiment and in potted ryegrass plants
maintained in the field. The authors suggested that P. aeruginosa may be a potential
biocontrol agent for gray leaf spot management when used preventively.
Silicon exists in the soil solution as mono silicic acid (Si (OH)4). Silicon has been
shown to reduce levels of several important diseases of rice (Oryza sativa L.), including
rice blast (P. grisea). Silicon is the second most abundant element in the earth’s crust
and generally most soils are comprised of 5 to 40% silicon. Silicon is absorbed readily
by plant roots, however, repeated years of cropping can reduce silicon levels to a point
where it is no longer available to plants. Other soils, however, contain little plant-
available silicon. Previous research has shown that foliar and soil incorporated
applications of silicon to soils that are silicon-deficient dramatically reduces the severity
of rice blast and other rice diseases (Datnoff et al., 2001). In rice, there appears to be no
benefit for using silicon in soils with silicon levels greater than 19 ppm (Korndorfer et al.
2001). Little is known about the critical levels for silicon in soils where turfgrasses are
grown, however, preliminary research indicates that these values (i.e. 19 ppm) are similar
to those of rice (L. E. Datnoff, personal communication).
Nanayakkara et al. (2004) evaluated the effects of silicon on the severity of gray
leaf spot in perennial ryegrass grown in two different soils in a greenhouse. The soils
were a peat:sand mix with a silicon level of 5 ppm and a Hagerstown silt loam soil with a
silicon level of 70 ppm. Each soil received applications of Wollastonite (mineral calcium
silicate, CaSiO3) and calcium silicate slag at rates of 454, 907, 4536 and 9072 kg ha-1
(0.0, 0.5, 1.0, 5 and 10 tons ha-1). Nine-week –old perennial ryegrass plants grown in the
silicon-treated soil were inoculated with P. grisea. Disease incidence and severity as

36
well as silicon levels in plants were evaluated. Two weeks after inoculation, silicon
levels in plant tissue significantly increased with increasing levels of silicon. No
differences were observed in disease level and amount of silicon in the plants grown in
the two soils (peat:sand mix and Hagerstown silt loam) evaluated. Disease incidence and
severity were reported to be significantly lower in plants grown in both silicon-amended
soils (no data shown).
Brecht et al. (2000) conducted a greenhouse study that evaluated the effect of soil
incorporated silicon on gray leaf spot in 20 genotypes of St. Augustinegrass. Data were
obtained twice each week for a month and converted to an area under disease progress
curve (AUDPC) value. Leaf tissue was analyzed for percent silicon at the end of
experiment. The addition of silicon reduced AUDPC values in all genotypes, some by as
much as 78%. Generally, silicon reduced disease the most in genotypes that were very
susceptible to gray leaf spot. The researchers recommended the use of silicon to protect
plants from gray leaf spot, particularly in genotypes that have low levels of disease
resistance and in soils that are low in soluble silicon.
Chemical Gray Leaf Spot Control and Resistance Problems with P. grisea The potential for major damage to perennial ryegrass fairways from gray leaf spot
has resulted in increased fungicide costs throughout the mid-Atlantic and transition zone
regions in the USA. In severe cases, total renovation of fairways and roughs may be
required (Uddin et al., 2003b). Fungicides that are relied upon for gray leaf spot
management in perennial ryegrass include: azoxystrobin (methyl (E)-2-{2-[6-(2-
cyanophenoxy)pyrimidin-4-yloxy]phenyl}-3-methoxyacrylate); thiophanate-methyl
(dimethyl 4,4'-o-phenylenebis[3-thioallophanate), propiconazole (1-[[2-(2, 4-

37
dichlorophenyl)-4-propyl-1, 3-dioxolan-2-yl] methyl]-1H-1, 2, 4-triazole); trifloxystrobin
(methyl (E)-methoxyimino-{(E)-a-[1-(a,a,a-trifluoro-m-tolyl)ethylideneaminooxy]-o-
tolyl}acetate); pyraclostrobin (methyl N-{2-[1-(4-chlorophenyl)-1H-pyrazol-3-
yloxymethyl]phenyl}(N-methoxy)carbamate); mancozeb (manganese ethylenebis
dithiocarbamate; and chlorothalonil (tetrachloroisophthalonitrile) (Vincelli et al. 2001,
Uddin et al. 2002b, Dernoeden et al. 2002). These fungicides are most efficacious when
applied before the disease becomes active.
Three strobilurin- class fungicides (quinol-oxiding inhibitor, QoI), are labeled for
gray leaf spot control in perennial ryegrass turf (trifloxystrobin, Compass®; azoxystrobin;
Heritage®, and pyraclostrobin; Insignia®). These fungicides inhibit the cytochrome bc1
respiratory complex in mitochondria and have proven to be very effective against P.
grisea. Vincelli and Dixon (2001) reported isolates of P. grisea resistant to azoxystrobin
and trifloxystrobin from golf courses in Kentucky and Illinois in 2000. In vitro studies to
assess the EC50 for both azoxystrobin and trifloxystrobin to suspected-resistance and
baseline isolates were conducted. All suspected- resistant isolates required significantly
higher concentrations (690 times more azoxystrobin and 827 times more trifloxystrobin)
than the baseline isolates to provide suppression of conidial germination.
Kim et al. (2003) amplified the cytochrome b gene from QoI resistant P. grisea
isolates (QoI-treated turf) and from baseline isolates. Isolates that were QoI resistant
fungicides carried a single point mutation in two different nucleotide positions (F129L
and G143A), and neither of these mutations was found in the baseline population. An in
vitro study assessed the sensitivity to azoxystrobin and trifloxystrobin from QoI resistant
isolates of P. grisea from Indiana and Maryland. This study assessed conidia

38
germination in various fungicide dilutions in Petri dishes. It was found that P. grisea
isolates possessing the G143A mutation were significantly more resistant to azoxystrobin
and trifloxystrobin, than those possessing the F129 L mutation. From DNA
fingerprinting of these resistant isolates, it was concluded that it only took a small
number of ancestral mutations for field resistance to occur (Kim et al., 2003).
St. Augustinegrass is the primary lawn grass grown from southern California to
the Gulf Coast States (Brecht et al. 2004). In St. Augustinegrass, fungicides are relied
upon to manage P. grisea. Some of the same chemistries used in perennial ryegrass (i.e.
chlorothalonil, propiconazole, azoxystrobin and pyraclostrobin), effectively control gray
leaf spot in St. Augustinegrass plants (Datnoff et al. 2003).
Brecht et al. (2004) evaluated the use of silicon applied as calcium silicate (20%)
to suppress gray leaf spot in St. Augustinegrass. Calcium silicate slag (1,000 kg Si ha-1)
was incorporated into the soil at 5 metric tons ha-1 to three sites with silicon deficient
soils prior to sprigging ‘Floratam’ St. Augustinegrass. The three treatments included soil
incorporated silicon (calcium silicate-incorporated at 1,000 kg Si ha-1), foliar sprays of
chlorothalonil (7.6 kg a.i. ha-1), and a combination of foliar chlorothalonil applications
and calcium silicate-incorporated. Chlorothalonil treatments were applied every 10 days
after sprigging. All treatments equally and significantly reduced gray leaf spot, when
compared to untreated turf. Final St. Augustinegrass coverage ratings were increased by
17 and 34% at two of three sites where calcium silicate was incorporated into plots, when
compared to untreated plots. The level of silicon in leaves of calcium silicate-
incorporated plots was 1.2 to 1.3 %, while it was 0.6 to 0.7% in leaves from untreated
plots. It was not determined if the increase in St. Augustinegrass coverage by calcium

39
silicate was due to a reduction in disease, a physiological growth response from increased
uptake of silicon, or both. It was suggested, however, that gray leaf spot in St.
Augustinegrass can be more effectively managed with combinations of silicon and
fungicides (Brecht et al., 2004).
Two studies examined the use of an amino-acid containing product (i.e. Macro-
sorb Foliar) and a surfactant (i.e. Break-Thru) applied alone and in combination with
fungicides (triadimefon, for there effects on gray leaf spot in perennial ryegrass (Vincelli
et al. 2001, Uddin et al. 2002b). Neither material enhanced the level of control provided
by the fungicides or had any effect on gray leaf spot when applied alone.
Genetic Research with Gray Leaf Spot and P. grisea Hofmann and Hamblin (2000) evaluated the reaction of 49 perennial ryegrass
cultivars and experimental lines in Illinois to field inoculation of P. grisea. A spore
solution (concentration of 104 to 105 conidia per ml) was applied weekly from 13 June
until 27 July. When rated on 29 September, all perennial ryegrass plots had significant
damage (> 20% plot area blighted). There were significant differences in the level of
susceptibility among cultivars, since some plots had been blighted by nearly 80%.
Windstar, Brightstar and Cathedral were three of the cultivars that were damaged
substantially by P. grisea; whereas, Morningstar, SR 4200, and Pick F3 were damaged
least (< 27%).
Bonos et al. (2004) evaluated perennial ryegrass cultivars (65 in 2001 and 73 in
2002) for resistance to P. grisea. Cultivars that showed improved natural resistance were
selected, interpollinated and then seeded. These plants then were evaluated for two
growing seasons for gray leaf spot resistance. They observed uniform and consistent

40
blighting and most cultivars had greater than 50% of the plot area blighted during both
study years. Some cultivars had similar levels of gray leaf spot during both years, while
other cultivars exhibited improved resistance. Offsprings developed from parents that
showed some initial natural resistance to gray leaf spot exhibited greater resistance in the
second year. Cultivars showing even minor levels of resistance recovered more rapidly
once air temperatures cooled. It was noted that 50% of the cultivars that showed some
levels of P. grisea resistance were from Eastern Europe, where perennial ryegrass is
indigenous. They concluded that the best opportunity to find resistant germplasm is to
collect germplasm from Eastern Europe.
No highly resistant perennial ryegrass cultivars are currently available, and
fungicide use remains the only approach to effectively manage gray leaf spot. Hence,
knowledge of cultural management programs to reduce gray leaf spot incidence and
severity are warranted.

41
II. DOLLAR SPOT AND GRAY LEAF SPOT SEVERITY AS INFLUENCED BY IRRIGATION, PACLOBUTRAZOL, CHLOROTHALONIL AND A WETTING AGENT
Synopsis
The most commonly grown turfgrass species on fairways in the mid-Atlantic
region of the United States are creeping bentgrass (Agrostis stolonifera L. var palustris
(Huds.) Farw.) and perennial ryegrass (Lolium perenne L.). Creeping bentgrass and
perennial ryegrass are susceptible to dollar spot (Sclerotinia homoeocarpa F. T. Bennett)
and gray leaf spot (Pyricularia grisea (Cooke) Sacc.) diseases, respectively. This field
study assessed the influence of two irrigation regimes (light and frequent versus deep and
infrequent) on dollar spot and gray leaf severity over a three year period. Within each
irrigation regime, seven chemical treatments also were evaluated. The chemical
treatments included: chlorothalonil, paclobutrazol (PB), wetting agent (WA),
chlorothalonil + PB, chlorothalonil + WA, chlorothalonil + PB + WA, and an untreated
control. Data revealed that dollar spot became more severe in mid-to-late summer in
creeping bentgrass that received infrequent irrigation, when compared to frequent
irrigation in 2002 and 2004. Chlorothalonil generally provided an acceptable level of
dollar spot control, even at a reduced rate in 2004. Paclobutrazol suppressed dollar spot
40 to 60% and the WA suppressed dollar spot 30 to 50% on several rating dates over the
seasons (PB, n=11; WA, n=7). On numerous rating dates in 2004, chlorothalonil, PB,
WA, and chlorothalonil + PB provided better dollar spot suppression in frequently
irrigated versus infrequently irrigated turf. Gray leaf spot was severe in 2002 and 2004,
but the disease did not develop in 2003. In 2002, gray leaf spot rapidly and severely
damaged even the fungicide-treated plots, and no significant irrigation effects or
chlorothalonil treatment differences were observed. Gray leaf spot was more severe in

42
frequently irrigated blocks, when compared to infrequently irrigated blocks in 2004.
Chlorothalonil provided effective gray leaf spot control in 2004, but only in the
infrequently irrigated blocks where disease pressure was less. Neither PB or WA had any
effect on gray leaf spot, and no benefit was observed from tank-mixing chlorothalonil
with either PB or WA. Results from this study suggest that maintaining soil moisture
levels above 25 cm3 cm-3 reduced dollar spot severity in mid-to-late summer and
improved the ability of chlorothalonil, PB, and WA to suppress the disease. This study
also showed that gray leaf spot was very destructive under periods of very high disease
pressure and an ineffective fungicide application interval (14 day), regardless of soil
moisture level. Chlorothalonil effectively controlled gray leaf spot when applied on an
eight-day rather than a fourteen-day spray interval, but only in infrequently irrigated
blocks in 2004. This information will help golf course superintendents better manage
dollar spot and gray leaf spot by adjusting their irrigation practices and by using plant
protection chemicals more effectively.

43
Introduction
Golf course fairways normally comprise between 10 and 14 hectares of highly
managed fairway turf, which represent approximately of 20% of the overall area of an
entire golf course (Beard, 2002). Fairways are extremely important to the playability of
the entire golf course. Throughout the mid-Atlantic region of the United States, the most
common cool-season turfgrass species grown on fairways are creeping bentgrass
(Agrostis stolonifera L. var palustris (Huds.) Farw.) and perennial ryegrass (Lolium
perenne L.). Although both turfgrass species provide excellent fairway surfaces, each
can be seriously affected by at least one major summer disease. Creeping bentgrass is
very susceptible to dollar spot (Sclerotinia homoeocarpa F. T. Bennett) and perennial
ryegrass is very susceptible to gray leaf spot (Pyricularia grisea (Cooke) Sacc.).
Economically, dollar spot is one of the most important diseases affecting golf courses and
more money is spent on managing this disease than any other (Vargas, 2004).
Additionally, Uddin et al. (2003b) reported that an average golf course with perennial
ryegrass fairways has had to increase their fungicide budget by greater than 5% since
1995 to address gray leaf spot.
During summer months, water from irrigation is applied frequently to fairways to
maintain turf health and promote vigor. There are two distinct approaches to irrigating
fairways during summer months in the mid-Atlantic region. These approaches are light
and frequent and deep and infrequent irrigation. Frequent irrigation is a common summer
practice for numerous golf course managers, primarily because of aesthetic reasons.
Frequent irrigation promotes wet soils and dew formation, which are important in the
development of several turf diseases. Deep and infrequent irrigation is performed for

44
playability and agronomic reasons, and involves maintaining the soil as dry as possible
until symptoms of wilt are observed. Deep and infrequent irrigation typically is
recommended as a cultural disease management tool as one would predict that dry soil
conditions are less conducive for plant infection by most foliar pathogens (Couch, 1995;
Vargas, 2004; Watschke et al., 1995). A greenhouse study demonstrated that low soil
moisture levels enhanced dollar spot in mature Kentucky bluegrass (Poa pratensis L.)
plants (Couch and Bloom, 1960). In that study, soil moisture levels = 75% of field
capacity resulted in a 45 to 55% increase in dollar spot severity, when compared to plants
maintained at field capacity. Jiang et al. (1998), however, found that dollar spot in
fairway height perennial ryegrass was enhanced by 50% when it received daily irrigation
in one year of a two year field study in Kansas. Jiang et al. (1998), also observed an
increase in clipping weights in the frequently irrigated plots. They suggested that as
clippings were removed from the study site, nitrogen was depleted, which promoted the
increased blighting. Watkins et al. (2001) studied the influence of two irrigation regimes
on dollar spot in creeping bentgrass in Nebraska. In that field study, turf was irrigated
daily at 100% or 60% (between April to mid-June) to 80% (between mid-June and 9
September) of potential evapotranspiration. Dollar spot severity was not affected by
either irrigation regime. Rainfall, however, was above the 14-year average during both
study years. These results and those of Jiang et al. (1998) do not support the earlier
findings of Couch and Bloom (1960). The influence of irrigation frequency on dollar
spot in the mid-Atlantic region has not been assessed in the field. There are no field
studies that have investigated the influence of soil moisture on gray leaf spot severity.
Previous research, however, has demonstrated that both dollar spot and gray leaf spot are

45
more prevalent during periods that favor increased leaf wetness durations (Couch, 1995,
Hall, 1984, Uddin et. al, 2003a, Williams et al., 1996).
In addition to cultural practices, many golf course managers use a variety of
chemicals to maintain fairways at the desired quality level. Some of these chemicals
include plant growth regulators (PGR’s), wetting agents and fungicides. Paclobutrazol
(4-chlorophenyl) m ethyl-alpha (1-1 dimethyl) -1h-1, 2, 4 triazole-1 ethanol) is a PGR
that is commonly applied to manage excess clippings, improve turfgrass color and
density, and to suppress annual bluegrass (Poa annua L.) populations. Paclobutrazol
belongs to the triazole class of chemicals and has fungistatic effects on S. homoeocarpa
in creeping bentgrass (Burpee et. al 1996, Dernoeden et al., 2002). Little information
exists on the effect that paclobutrazol may have on gray leaf spot or on dollar spot in turf
managed under different irrigation regimes.
Wetting agents are commonly used on fairways to improve water infiltration and
to alleviate hydrophobic soil conditions associated with localized dry spots and fairy
rings. Primer Select® (polymeric polyoxyalkylene 95% oxoalkonyl hydroxyl
polyoxlalkane diyl 5%; Aquatrols Corporation of America, Paulsboro, NJ) is a non-ionic
surfactant that is commonly used on golf courses and has been shown to suppress dollar
spot (Dernoeden et al., 2002). On mornings following an application of most wetting
agents, there is displacement of dew from the turfgrass canopy. Williams et al. (1996)
reported that early morning displacement of leaf surface exudates by mowing reduced
dollar spot severity (53 to 81%). Liu et al. 1995b, reported that the tank-mix of the
wetting agent Aqua-Gro® (95% polyoxyethylene ester and 50% polyoxyethylene ether of
cyclic acid and alklated phenols with silicone anti-foam emulsion; Aquatrols Corporation

46
of America, Paulsboro, NJ) with the fungicide benomyl (methyl 1-(butylcarbamoyl)-2-
benzimidazole carbamate) reduced dollar spot severity, when compared to benomyl
applied alone. They hypothesized that the benomyl rate could be reduced by 30% when
tank-mixed with Aqua-Gro and immediately watered-in. The effect of dew displacement
by a wetting agent on gray leaf spot severity is unknown.
Chlorothalonil (tetrachloroisophthalonitrile) is perhaps the most widely used
fungicide on turfgrasses and it effectively controls dollar spot and gray leaf spot
(Mitkowski et al., 2005; Dernoeden et al., 2005). Chlorothalonil is an extremely
important fungicide for use in disease resistance management programs. Because of its
broad spectrum activity, there have been no reported cases of pathogen resistance to
chlorothalonil, but there have been resistance problems with other fungicides used to
control dollar spot and gray leaf spot in turf (Burpee, 1997; Vargas, 2004; Vincelli,
2001). Furthermore, the United States Environmental Protection Agency (E.P.A) placed
restrictions on the use of chlorothalonil in 2002 (Appendix B. Table 1). These
restrictions have created the need to elucidate approaches to increasing the longevity of
chlorothalonil. The effects of irrigation on chlorothalonil performance are unknown.
Therefore, since chlorothalonil, paclobutrazol and wetting agents and various tank-mixes
are widely used as part of fairway management programs, research regarding their use
under relatively wet or dry irrigation regimes is warranted.
The purpose of this three year field study was to evaluate the influence of two
irrigation regimes (light and frequent versus deep and infrequent) and three commonly
used chemicals (chlorothalonil, paclobutrazol, wetting agent) and various tank-mixes of

47
these materials on fairway height creeping bentgrass and perennial ryegrass for their
impact on dollar spot and gray leaf spot incidence and severity.

48
Materials and Methods Site Descriptions
This study was conducted at the University of Maryland Paint Branch Turfgrass
Research Facility in College Park, MD. Soil was a Keyport silt loam (fine, mixed,
semiactive, mesic Aquic Hapludult) with a pH ranging from 5.8 to 6.2 and 12 to 20 mg of
organic matter/g soil.
2002. In April 2002, the soil in eight, 3.0 m x 10.5 m blocks was tilled and leveled by
hand raking. These blocks will be described further in the irrigation protocol to follow.
Blocks were split (1.5 m x 10.5 m) and ‘Crenshaw’ creeping bentgrass and ‘Figaro’
perennial ryegrass were separately seeded into each half block at 49 and 292 kg seed ha -
1, respectively. Following the mid- April seeding, the soil was raked and firmed by
rolling. ‘Crenshaw’ was chosen based on its known high susceptibility of dollar spot and
‘Figaro’ because of its susceptibility to gray leaf spot (T. R. Turner, personal
communication). The study area received a total of 120 kg N ha-1 during the 2002
study period from either a 16-4 -8 or 19-0-19 fertilizer (Appendix A. Table 2). All plots
were mowed three times week-1 to a height of 19 mm with a reel mower and clippings
were removed. Treatments were initiated on 17 June and the final applications were
made on 26 August 2002. Neither dollar spot or gray leaf spot were visually active at the
time the study was initiated.
2003. The 2002 site was renovated using glyphosate (N-(phosphonomethyl)glycine) in
October 2002. The site was vertical cut and seeded (49 kg seed ha -1) with ‘Crenshaw’
creeping bentgrass on 12 October 2002. Similarly, ‘Brightstar’ perennial ryegrass was
seeded (440 kg seed ha-1) on 5 May 2003. A spring seeding was chosen because
immature perennial ryegrass turf generally is more susceptible to gray leaf spot. ‘Figaro’

49
was rapidly and severely damaged by P. grisea in 2002, and there were few differences
among treatments. Therefore, ‘Brightstar’ was substituted in 2003 in anticipation that it
was not as susceptible as ‘Figaro’. Creeping bentgrass and perennial ryegrass plots were
mowed two to three times week-1 to a height of 19 and 21 mm, respectively. Higher
mowing was required for the perennial ryegrass because of poor stand development.
During all study years, chemical applications were periodically made to the plot areas to
manage weeds and diseases (Appendix A. Table 1). Flutalonil (N-[3-(1-methylethoxy)
phenyl ]-2-(trifluoromethyl) benzamid) was used to control brown patch (Rhizoctonia
solani Kuhn) and mefenoxam (R)-20[2, 6-dimethylphenyl)-methoxyacetylamino]-
propionic) targeted Pythium blight (Pythium spp.). These aforementioned fungicides
would not be expected to greatly affect dollar spot or gray leaf spot (Dernoeden et al.,
2001). Creeping bentgrass received a total of 60 kg N ha-1, while the perennial ryegrass
received a total of 146 kg N ha-1 from either of the aforementioned fertilizers or urea
during the study period (Appendix A. Table 2).
Originally, treatments were initiated in the creeping bentgrass on 6 June and
repeated on 19 June 2003. Dollar spot became a problem in the creeping bentgrass 12
June (Appendix A. Table 5), especially in plots that did not contain a chlorothalonil
treatment. This was prior to the time when the perennial ryegrass plants were mature
enough to impose treatments. On 16 June, dollar spot activity was intense in the
bentgrass and infection centers had coalesced by 27 June. On 27 June, all bentgrass
plots were treated with chlorothalonil (10.2 kg a.i. ha-1) to control dollar spot and to allow
time for infection centers to heal so that irrigation treatments could be imposed
simultaneously on both species. To speed recovery from dollar spot in bentgrass, 24.4 kg

50
N ha-1 from urea were applied on 27 June. Treatments finally were re-initiated in both
species on 10 July and continued every 14 days until 21 August.
2004. The 2003 site was treated with glyphosate on 17 September 2003 and reseeded as
previously described. Irrigation blocks were reversed and the frequently irrigated blocks
became infrequently irrigated blocks and vice versa. Similarly, the perennial ryegrass
and creeping bentgrass were reversed in each block. On 15 October 2003, ‘Crenshaw’
creeping bentgrass was seeded (78 kg seed ha-1) as previously described. Because there
was no gray leaf spot damage to ‘Brightstar’, ‘Figaro’ was seeded (370 kg seed ha-1) on 3
October. On 10 November, both sites were fertilized with 48.8 kg N ha-1 from a
complete fertilizer. Both stands were fertilized with 24.5 kg N ha-1 from a complete
fertilizer on 19 April 2004. The study area received 85.7 kg N ha-1 from 20-20-20 or urea
during the 2004 study period (Appendix A. Table 2). Both species were mowed to a
height of 19 mm three times week-1 with a reel mower and clippings were removed.
Chemical and irrigation treatments were initiated 1 June 2004. The rate of
chlorothalonil was reduced in 2004 in the creeping bentgrass to 4.5 kg a.i. ha-1, which is
the low label rate. Treatments were initiated 1 June and reapplied to the bentgrass on 15
and 29 June, 15 and 30 July and 16 August. Initially, chlorothalonil was applied to the
perennial ryegrass at 4.5 kg a.i. ha-1. The 2002 data suggested that the 8.0 kg a.i. ha-1
applied on a fourteen day interval would not be expected to effectively control gray leaf
spot once the disease had become active, the rates and application intervals were adjusted
as noted below. Perennial ryegrass plots received chlorothalonil (4.5 kg a.i. ha-1)
treatments on 15 and 29 June, and 15 July 2004. Gray leaf spot became active in the
perennial ryegrass plots on 20 July 2004. Thereafter, chlorothalonil (8.0 kg a.i. ha-1) was

51
applied to the all perennial ryegrass plots that were to receive chlorothalonil either alone
or in a tank-mix on 20 and 28 July, and 6 and 16 August. Paclobutrazol and Primer
Select®-alone- treatments were applied on a 14 day interval beginning 1 June and ending
16 August.
Irrigation Treatments In autumn 2001, eight (3.0 x 10.5 m) independently irrigated blocks were
outfitted with pop-up, matched precipitation spray irrigation heads (Weathermatic Model
5520; Weathermatic Irrigation Company; Dallas, TX.) which delivered 22.3 L minute-1 to
each block. This is equivalent to a precipitation rate of 0.15 mm water minute-1. To
assess the main effects of two irrigation regimes consisting of i) infrequent irrigation to a
soil depth of 6 to 8 cm and ii) light (on average 5.0 mm water) and frequent (daily)
irrigation. The irrigation treatments were applied to four, randomly assigned blocks.
Throughout the study, rainfall events were recorded using a rain gauge (Rain Gauge,
Spectrum Technologies, Inc. Plainfield, IL.).
Infrequently and frequently irrigated blocks were irrigated between 6:00 and 8:00
hours and 21:00 hours, respectively. These times were chosen based on the practices of
many golf course managers. Typically, a golf course manager that irrigates frequently
will water during the night (21:00-23:00 hours). Frequent, nighttime irrigation is not a
recommended cultural practice, but is still common because infrequent irrigation during
the morning hours takes significantly more time and labor to complete prior to turf
maintenance practices and golfer use. When golf course managers are watering
infrequently, typically they will assess dew patterns early in the morning hours (6:00
hours) and determine if the turf is likely to wilt that day. The infrequently irrigated
blocks only received water when visible drought stress symptoms were observed or when

52
soil moisture measurements indicated that the soil had fallen well below field capacity
(i.e. < 17 cm3 cm-3 soil moisture). Both irrigation regimes were adjusted based on
weather patterns and irrigation was withheld if rainfall were forecasted or had recently
occurred (> 6.0 mm).
Overall, approximately 25 to 38 mm of water from irrigation or rainfall week-1
were applied to both frequently and infrequently irrigated plots in 2002, which was a
drought year. Due to frequent rain in 2003 (47.6 cm precipitation during study period),
there were only a few dates when supplemental irrigation was applied to the frequently
irrigated blocks. The 2004 season was another wet year (51.4 cm precipitation during the
study period) and tarps (3.3 x 11 m) were used to cover infrequently irrigated blocks prior
to the onset of rain. Tarps were slightly wider than individual blocks and were
constructed from 12 mil black/white reinforced polyethylene sheeting; Model 12 BW;
Integra Plastics, Madison, SD). Tarps only were used on the infrequently irrigated plots
to promote soil drying and to better assess the effect of irrigation and soil moisture on the
diseases being assessed. The white side of the tarps faced up and they usually were
removed within 15 minutes after weather had cleared. Tarps were used on 14 occasions
between 4 June and 21 August. The frequently irrigated blocks received water daily at
the aforementioned amounts and times of day. The frequently irrigated blocks received
an average of 64 mm water week-1, while the infrequently irrigated plots received 21 mm
week-1 from either irrigation or rainfall during 2004. The frequently irrigated blocks
received substantially more water due to frequent rainfall, which there was no control
over.

53
Chemical Treatments In 2002 and 2003, seven chemical subplot (1.5 x 1.5 m) treatments were applied
as follows: chlorothalonil at 8.0 kg a.i. ha-1; paclobutrazol (PB) at 0.13 kg a.i. ha-1;
Primer Select® (WA) at 6.3 L product ha-1; chlorothalonil + PB; chlorothalonil + WA;
chlorothalonil + PB + WA; and an untreated control. Rates for the tank-mix treatments
were the same as for each chemical applied alone. As previously noted, the rate of
chlorothalonil was reduced to 4.5 kg a.i. ha-1 in the bentgrass in 2004 because no dollar
spot differences were observed among these treatments in 2002 and 2003. Chemical
treatments were applied on the dates described above and footnoted in the data tables.
Chemical treatments were applied using a CO2 pressurized sprayer (262 kPa) equipped
with an 8004E flat fan nozzle and calibrated to deliver 468 L ha-1. On treatment days,
chlorothalonil and WA were allowed to completely dry on foliage and irrigation was
applied to the entire area with a minimum of 6.4 mm of water eight to ten hours after
application for PB uptake by roots.
Dew Measurements In 2004 only, dew measurements were obtained 1, 3, 5 and 7 days after
application of treatments when paclobutrazol and WA were included to determine the
duration and amount of dew displaced by the these treatments. Measurements were
taken separately on each species. Two replications of each species and irrigation regime
were assessed to obtain an average. Canopy dew measurements were performed as
described by Williams et al. (1998). Briefly, four white, unscented Kimwipe tissues
(Kimberly-Clark Corp, Rosewell GA.) were placed into a zip-lock bag and weighted.
Prior to dew removal, the four tissues were removed from the bag and blotted over 120

54
cm2 area of an untreated control plot using a wooden frame as a template. Blotting was
carefully performed to accurately measure canopy dew and not to absorb any moisture
from the thatch layer. Tissues then were placed into the same bag and immediately
weighed. The gain in weight was used to calculate the amount of dew present on the
canopy. Data were converted from grams 120 cm-2 to millimeters of moisture as
previously described by Williams et al. (1998). Dew amounts (mm) then were converted
into L ha-1.
Soil Moisture Measurements
In all years, volumetric soil moisture was recorded two to three times week-1
using time domain reflectometry (TDR) (Soil Moisture Equipment Corp., CA). The
TDR technique has been shown to be a viable method for determining water content in
soils that are homogenous (Topp et al., 1982). The two probes of the TDR were 15 cm in
length and pushed into the soil so that the top of the probes were flush with the thatch
layer. The TDR takes the average of the dielectric constant within those 15 cm and
records the values as cm3 cm-3. Seven measurements were taken randomly in each
perennial ryegrass and creeping bentgrass block. Soil moisture measurements then were
averaged for each irrigation regime and species. Significantly different means were
separated at P=0.05 using Fischer’s least significant difference (LSD test). Soil moisture
measurements then were charted over the course of each study year with 1+- standard
error (SE) bars shown. (Figures 1 and 2).
Soil Temperature To determine the effects of the two different irrigation regimes on soil
temperature, four continuous data logging probes (Stowaway Tidbit Temperature Logger,

55
Onset Computer Corp., Pocasset, MA.) were installed 6.5 cm below the soil surface. One
probe was placed in two perennial ryegrass and two creeping bentgrass blocks subjected
to either frequent or infrequent irrigation. Soil was compacted over top and around
probes to ensure accuracy. Probes were capable of storing temperature data for 55 days
and measurements were recorded every 15 minutes. Loggers were checked weekly and
downloaded into Box Car software system, (Onset Computer Corp. Pocasset, MA.) on a
laptop computer. The Box Car system is a computer program that tracks and plots
changes in soil temperature over time. Logger installation and removal dates were 28
June and 2 November 2002; 11 June and 11 September 2003; 26 May and 26 October
2004. Loggers were checked weekly throughout the study period. During 2003 and
2004, the loggers were occassionaly struck by lightening and did not record data. Soil
temperature data will not be discussed, but can be found in Appendix A. Figures 2 - 4.
Ratings and Statistical Analyses. Plots were rated for disease severity and turfgrass quality. Dollar spot was
assessed by counting the number of infection centers plot-1 until they had coalesced.
Depending on disease pressure, S. homoeocarpa infection centers typically coalesce
when more than 3% of the plot area became blighted. Thereafter, plots were rated
visually on a linear 0 to 100% scale where 0=no disease and 100=entire plot area
blighted. An acceptable threshold was judged to be 8 to 10 S. homoeocarpa infection
centers plot-1 or 0.5 % plot area blighted. Gray leaf spot was assessed using the same
visual linear scale. Area under the disease progress curve (AUDPC) is a way to integrate
data from a study period into a single value for each treatment. Hence, AUDPC values
allow one to assess the total amount of disease within a treatment over a specified time

56
period. The AUPDC values were calculated for dollar spot and gray leaf spot data
according to Campbell and Madden (1990) using the formula ∑ (sum of) [yi + yi+1)/2
[ti+1-ti] where i=1, 2, 3….n-1, yi is the amount of disease (either infection centers or
percent of plot area blighted) and ti is the time of the ith rating. For dollar spot, AUDPC
values were calculated separately for early season (i.e., infection center data) and late
season (i.e., percent plot area blighted data) data collection periods. The AUDPC values
shown in the data tables represent a sum value, where the larger number represents a
greater amount of disease. Because these treatments were evaluated over the same time
period each year, there is no need to standardize or normalize the data. The 2002, 2003
and 2004 % PAB AUDPC (dollar spot) values include ratings taken 32, 24, and 42 days
after the last fungicide application, respectively. he unit of measure for an AUDPC value
is disease x time, since disease would be shown on the y-axis (either IC or % plot area
blighted) and time (days) on the x-axis of a figure. Turfgrass quality was rated visually
on a 0 to 10 scale where 0=brown turf; 7.5=minimum acceptable level of quality for a
golf course fairway, and 10=optimum greenness and density. Turf quality data are not
discussed, but can be found in Appendix A.
Treatment structure was a 2 (irrigation treatments) x 7 (6 chemical treatments and
one untreated control) factorial with four replications. Data were subjected to a one-way
analysis of variance (ANOVA) in SAS MIXED (SAS version 9.1, SAS Institute; Cary,
NC). When an interaction was observed, data were subjected to a two-way ANOVA in
SAS GLM to separate treatments and include a Tukey’s LSD test to separate treatments
P= 0.05) (Steel et al., 1997). Disease data were analyzed using a square-root

57
transformation to normalize the data. Turf quality data were separated using the
protected less conservative Fisher’s LSD test (P= 0.05).

58
Results
Dollar Spot 2002. Treatments initially were applied on 17 June, but dollar spot was very slow to
develop (Table 1, Appendix A. Table 3). June and July were marked by prolonged
periods of dry weather (Table 9). Soil moisture levels initially were similar, but began to
separate during the last week of June. By 9 July, infrequently and frequently irrigated
plots had a mean soil water content ranging from 16 to 28 cm3 cm-3, respectively (Figure
1). Except on 10 August, soil moisture levels in the infrequently irrigated blocks (15.5-
26.0 cm3 cm-3) were lower than those in the frequently irrigated blocks (27.0-35.2 cm3
cm-3) for the entire study period. Dollar spot pressure peaked on 3 September, when
untreated plots had an average of 109 S. homoeocarpa infection centers plot-1 (IC’s).
Thereafter, dollar spot severity was rated by assessing the percent of plot area blighted
(% PAB). It should be noted that the acceptable threshold for dollar spot control in
fairway height turf was judged to be 8 to 10 IC’s plot-1 or 0.5 % PAB.
From 19 July to 16 August, no differences in the level of dollar spot control were
observed between irrigation regimes (Table 1; all data not shown). There were, however,
differences in the level of dollar spot control among the chemical treatments (Table 1).
Dollar spot was first observed in the paclobutrazol (PB)-alone and untreated plots on 19
July. By 29 July, chlorothalonil-alone, chlorothalonil + PB, and chlorothalonil + PB +
wetting agent (WA) reduced dollar spot, when compared to all other treatments (data not
shown). On 7 August, only the tank-mix of chlorothalonil + PB provided complete dollar
spot control. By 16 August, all chemical treatments, except the WA (4.4 IC’s), had
reduced dollar spot, when compared to the untreated control (8.5 IC’s). On 22 August,
infrequently irrigated plots had an average of 15.5 IC’s, while frequently irrigated plots
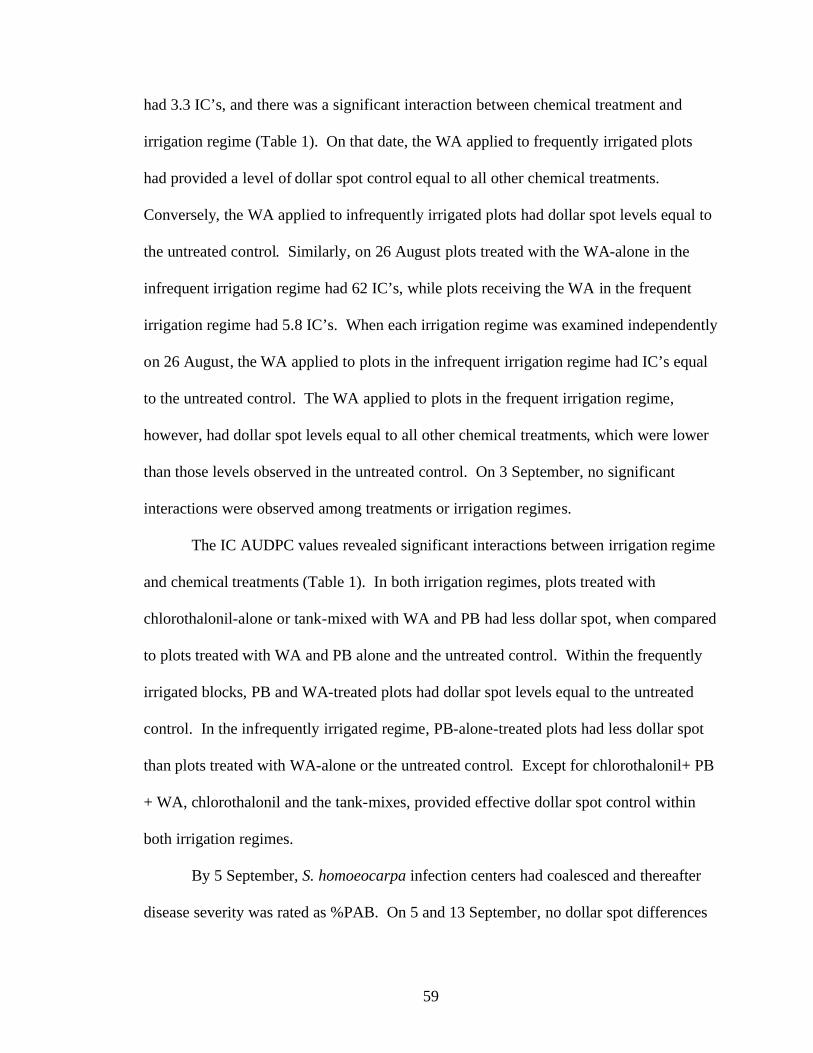
59
had 3.3 IC’s, and there was a significant interaction between chemical treatment and
irrigation regime (Table 1). On that date, the WA applied to frequently irrigated plots
had provided a level of dollar spot control equal to all other chemical treatments.
Conversely, the WA applied to infrequently irrigated plots had dollar spot levels equal to
the untreated control. Similarly, on 26 August plots treated with the WA-alone in the
infrequent irrigation regime had 62 IC’s, while plots receiving the WA in the frequent
irrigation regime had 5.8 IC’s. When each irrigation regime was examined independently
on 26 August, the WA applied to plots in the infrequent irrigation regime had IC’s equal
to the untreated control. The WA applied to plots in the frequent irrigation regime,
however, had dollar spot levels equal to all other chemical treatments, which were lower
than those levels observed in the untreated control. On 3 September, no significant
interactions were observed among treatments or irrigation regimes.
The IC AUDPC values revealed significant interactions between irrigation regime
and chemical treatments (Table 1). In both irrigation regimes, plots treated with
chlorothalonil-alone or tank-mixed with WA and PB had less dollar spot, when compared
to plots treated with WA and PB alone and the untreated control. Within the frequently
irrigated blocks, PB and WA-treated plots had dollar spot levels equal to the untreated
control. In the infrequently irrigated regime, PB-alone-treated plots had less dollar spot
than plots treated with WA-alone or the untreated control. Except for chlorothalonil+ PB
+ WA, chlorothalonil and the tank-mixes, provided effective dollar spot control within
both irrigation regimes.
By 5 September, S. homoeocarpa infection centers had coalesced and thereafter
disease severity was rated as %PAB. On 5 and 13 September, no dollar spot differences
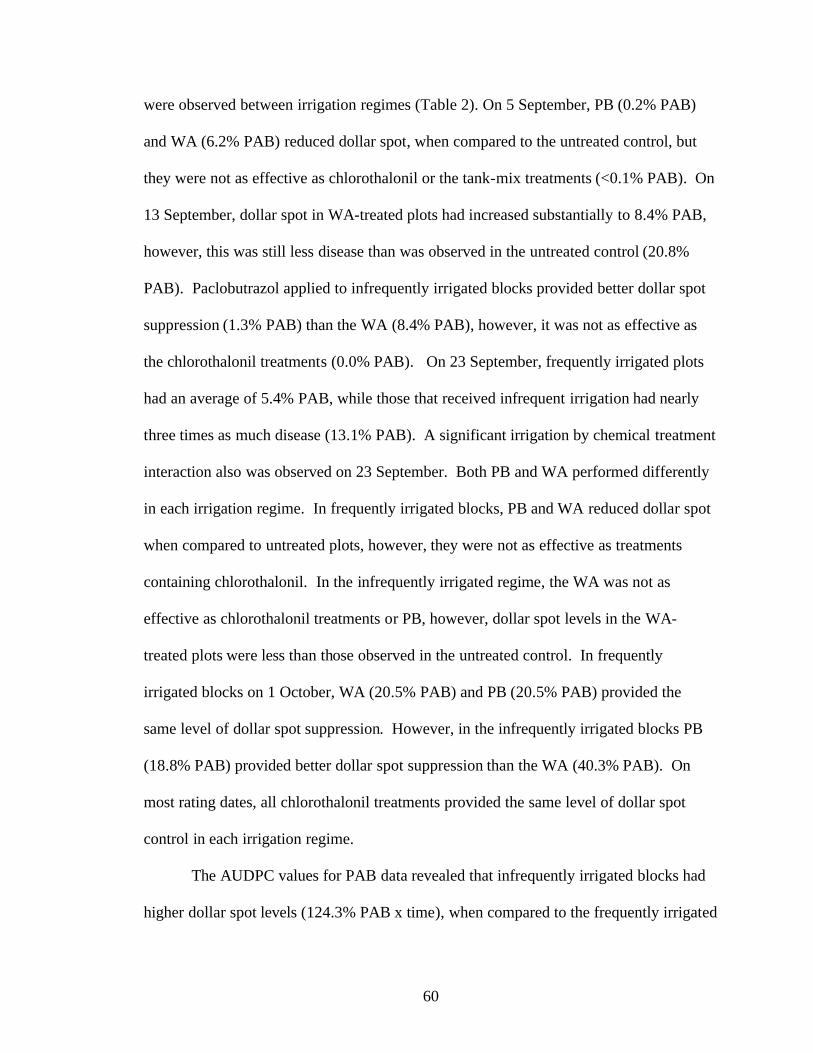
60
were observed between irrigation regimes (Table 2). On 5 September, PB (0.2% PAB)
and WA (6.2% PAB) reduced dollar spot, when compared to the untreated control, but
they were not as effective as chlorothalonil or the tank-mix treatments (<0.1% PAB). On
13 September, dollar spot in WA-treated plots had increased substantially to 8.4% PAB,
however, this was still less disease than was observed in the untreated control (20.8%
PAB). Paclobutrazol applied to infrequently irrigated blocks provided better dollar spot
suppression (1.3% PAB) than the WA (8.4% PAB), however, it was not as effective as
the chlorothalonil treatments (0.0% PAB). On 23 September, frequently irrigated plots
had an average of 5.4% PAB, while those that received infrequent irrigation had nearly
three times as much disease (13.1% PAB). A significant irrigation by chemical treatment
interaction also was observed on 23 September. Both PB and WA performed differently
in each irrigation regime. In frequently irrigated blocks, PB and WA reduced dollar spot
when compared to untreated plots, however, they were not as effective as treatments
containing chlorothalonil. In the infrequently irrigated regime, the WA was not as
effective as chlorothalonil treatments or PB, however, dollar spot levels in the WA-
treated plots were less than those observed in the untreated control. In frequently
irrigated blocks on 1 October, WA (20.5% PAB) and PB (20.5% PAB) provided the
same level of dollar spot suppression. However, in the infrequently irrigated blocks PB
(18.8% PAB) provided better dollar spot suppression than the WA (40.3% PAB). On
most rating dates, all chlorothalonil treatments provided the same level of dollar spot
control in each irrigation regime.
The AUDPC values for PAB data revealed that infrequently irrigated blocks had
higher dollar spot levels (124.3% PAB x time), when compared to the frequently irrigated

61
blocks (72.4% PAB x time). When each irrigation regime was independently examined,
PB-treated plots had lower dollar spot levels in both irrigation regimes, when compared
to WA-treated plots and the untreated control (Table 2). Plots treated with WA had lower
dollar spot levels versus the untreated control in both irrigation regimes. All plots treated
with chlorothalonil-alone or in a tank-mix had low levels of dollar spot throughout 2002
and few differences were observed among those treatments.
2003. The year was marked by heavy dollar spot pressure, unseasonably cool
temperatures, and frequent rainfall (Table 9). Although there were soil moisture
differences between irrigation regimes, soil moisture in the infrequently irrigated blocks
never fell below 19 cm3 cm-3 in 2003 (Appendix A. Figure 1). Furthermore, soil moisture
levels in both irrigation regimes were similar during the entire study period. Chemical
treatments initially were applied to the bentgrass on 6 and 19 June 2003, however, dollar
spot damage in most treated plots quickly exceeded the threshold (data not shown,
Appendix A. Table 5). On 27 June, chlorothalonil (8.0 kg a.i. ha-1) was applied to all
bentgrass plots. After a period of recovery, all chemical and irrigation treatments were
re-implemented on 10 July. Ratings were taken as percent of plot area blighted, since
patches had rapidly coalesced.
When dollar spot reactivated in the study area on 24 July, there were no dollar
spot differences between the irrigation regimes (Table 3). Among chemical treatments
on 24 July, plots treated with chlorothalonil and all tank-mixes were disease-free.
Paclobutrazol-treated plots (2.9% PAB) had lower dollar spot levels, when compared to
the WA (6.2% PAB) and untreated control (9.0% PAB) on 24 July. By 31 July, dollar

62
spot was observed in plots treated with chlorothalonil + PB and chlorothalonil + WA, but
no dollar spot was observed in plots treated with chlorothalonil-alone or chlorothalonil +
WA + PB. Paclobutrazol and WA-treated plots had dollar spot levels equal to the
untreated control on 31 July. On 6 August, all plots treated with chlorothalonil were
dollar spot-free, but untreated plots were severely damaged (18.8% PAB). Dollar spot
levels were above the threshold (>0.5% PAB) in WA-alone (9.8% PAB) and PB-alone
(4.3% PAB)-treated plots, but these disease levels were less than those observed in the
untreated control (18.8% PAB) on 6 August. Dollar spot severity peaked on 13 August
and there were high levels of disease in the untreated plots (23% PAB) and WA-alone-
treated plots (17.8% PAB), which were statistically similar. Paclobutrazol-alone (6.3%
PAB) reduced dollar spot, when compared to the WA-alone (17.8% PAB). All
chlorothalonil treatments provided complete control, which was significantly better than
all other treatments on 13 August.
By late August, plots had begun to recover and little or no dollar spot was
observed in plots receiving the chlorothalonil treatments. Dollar spot levels among WA,
PB and untreated control plots were similar at this time (data not shown; Appendix A.
Table 6). Beginning in early September soil moisture measurements in the infrequently
irrigated blocks had dropped due to less frequent rainfall in mid-to-late August
(Appendix A. Figure 1 and Table 9). On 5 September, a significant chemical by
irrigation treatment interaction was observed (Table 3). Within the frequent irrigation
regime, all treatments had equal levels of dollar spot. In the infrequently irrigated blocks,
plots treated with PB-alone had less dollar spot than WA-treated plots and the untreated
control. Similarly, on 15 September there was a chemical by irrigation interaction. In the

63
infrequently irrigated blocks, plots treated with chlorothalonil and the tank-mixes had less
dollar spot, when compared to plots treated with WA and PB or the untreated control on
15 September.
The AUDPC for PAB values showed that chlorothalonil-alone and tank-mix
treatments provided the best level of dollar spot control. Although plots treated with PB-
alone were severely damaged by dollar spot, PB- treated plots had less disease, when
compared to WA-treated plots and the untreated control. There were no significant
effects between irrigation regimes in 2003. This likely was due to frequent rainfall, since
no agronomically important differences in soil moisture levels between the regimes
during the peak period of disease activity occurred.
Dollar spot in the perennial ryegrass was controlled curatively with iprodione (6.1
kg a.i. ha-1), but on a few occasions in 2003 disease injury was evaluated (Table 4). All
plots treated with chlorothalonil, chlorothalonil tank-mixes or PB-alone had less dollar
spot, when compared to the untreated control on 6 August. The perennial ryegrass blocks
were treated with iprodione (6.1 kg a.i. ha-1) on 6 August and dollar spot reactivated on
21 August. Dollar spot progressed until 28 August, before the perennial ryegrass was
again treated with iprodione. Chlorothalonil-alone, the tank-mixes and PB-alone
provided an equal level of dollar spot control on 28 August. There was a non-significant
trend on all rating dates in August indicating that dollar spot levels were higher in
perennial ryegrass blocks that had received infrequent versus frequent irrigation.
2004. Due to frequent rainfall in 2003, tarps were used on 14 occasions in 2004 to
achieve variation in soil moisture levels between irrigation regimes. Soil moisture in

64
frequently irrigated blocks remained above 30 cm3 cm-3 between 10 June and 12
September (Figure 2). Except between 29 July and 18 August, infrequently irrigated
blocks had soil moisture levels below 25 cm3 cm-3. On three occasions during mid-to-
late August, wilt was observed in at least one infrequently irrigated block. Irrigation and
chemical treatments were initiated on 1 June, and dollar spot became active on 29 June.
The chlorothalonil rate was reduced from 8.0 kg a.i. ha-1 to the low label rate of 4.5 kg
a.i. ha-1 in 2004.
Plots were evaluated for dollar spot 16 times during 2004 (all data not shown;
Appendix A. Tables 8 and 9). There were no dollar spot differences among irrigation or
chemical treatments when trace levels of disease were first observed on 29 June (data not
shown; Appendix A. Table 8). On 6 July, plots treated with WA-alone (8.8 IC’s) had
dollar spot levels equivalent to the untreated control (6.6 IC’s), but there were no
differences among all other treatments (data not shown, Appendix A. Table 8). By 13
July, all treated plots had active dollar spot, but only plots treated with chlorothalonil +
PB (0.3 IC’s) had levels lower than the untreated control (6.9 IC’s; data not shown;
Appendix A. Table 8). There was a significant chemical by irrigation interaction on 21
July (Table 5). Plots treated with WA-alone (10.8 IC’s) and PB-alone (6.0 IC’s) in
frequently irrigated blocks had dollar spot levels equivalent to the untreated control (10.3
IC’s, Table 5). In infrequently irrigated blocks, PB-alone (0.0 IC’s), but not WA-alone
(8.5 IC’s), provided a level of dollar spot control equivalent to all chlorothalonil-
treatments. There were no irrigation by chemical interactions on 2 and 10 August (Table
5). Plots treated with PB-alone (22.4 IC’s) had dollar spot levels less than plots treated
with WA-alone (60.8 IC’s) and untreated plots (60.8 IC’s) on 2 August. Chlorothalonil-

65
alone (5.6 IC’s)-treated plots had less dollar spot than plots treated with PB-alone (22.4
IC’s). Chlorothalonil + PB (0.6 IC’s) and chlorothalonil + PB + WA (0.5 IC’s) provided
a higher level of dollar spot, when compared to chlorothalonil-alone (5.6 IC’s) on 2
August (Table 5). On 10 August, plots treated with PB-alone (35.1 IC’s) had less dollar
spot, when compared to plots treated with WA-alone (95.1 IC’s) and the untreated
control (100.9 IC’s). Chlorothalonil + PB (1.1 IC’s) and chlorothalonil + PB + WA (1.1
IC’s) provided better dollar spot control, when compared to all other treatments.
The IC AUDPC data showed that plots treated with WA-alone had dollar spot
levels equivalent to the untreated control (Table 5). Plots treated with PB-alone (441.6
IC’s x time) had less dollar spot than plots treated with WA-alone (1292 IC’s x time).
Chlorothalonil + PB (19.2 IC’s x time) and chlorothalonil + PB + WA (25.6 IC’s x time)
provided a higher level of dollar spot control, when compared to chlorothalonil-alone
(115.2 IC’s x time) or chlorothalonil + WA (134.4 IC’s x time). There were no dollar
spot differences between irrigation regimes during this period.
During mid-to-late August, soil moisture measurements in the infrequently blocks
were at the lowest point for the year and dollar spot pressure increased throughout the
month (Figure 3). Paclobutrazol-alone (1.9% PAB) provided better dollar spot
suppression versus WA-alone (4.1% PAB), however, chlorothalonil and tank-mix
treatments provided the highest level of control on 17 August (data not shown, Appendix
A. Table 9). From 24 August to 27 September, significant interactions were observed
(Table 6). On all three rating dates between 30 August and 27 September there was less
dollar spot in frequently irrigated blocks (4.1-11.5%) versus infrequently irrigated blocks
(9.2-24.0%, Table 6, all data not shown; Appendix A. Table 9). There were, however,

66
few dollar spot differences among chemical treatments, except WA-alone, on 24 and 30
August and 3 September (Table 6). During the aforementioned period, WA-alone-treated
plots had dollar spot levels equivalent to the untreated control in both irrigation regimes.
Within frequently irrigated blocks on 17 September, plots treated with chlorothalonil-
alone (9.8% PAB), chlorothalonil + WA (12.8% PAB), and WA-alone (16.5% PAB) had
dollar spot levels equivalent to the untreated control (18.5 % PAB, Table 6). All other
treatments in the frequently irrigated blocks on 17 September, which contained PB
reduced dollar spot, when compared to the untreated control (18.5% PAB). All chemical
treatments in the infrequently irrigated blocks had less dollar spot than the untreated
control at this time. The highest level of dollar spot control was provided by
chlorothalonil + PB (4.1% PAB) and chlorothalonil + PB + WA (12.8% PAB), when
compared to all other treatments (13.0-63.3% PAB) within the infrequently irrigated
blocks on 17 September. Within frequently irrigated blocks, there were few dollar spot
differences among chemical-treated plots and the untreated control on 22 September
(data not shown, Appendix A. Table 9) and 27 September (Table 6). In the infrequently
irrigated blocks, however, plots treated with PB-alone, chlorothalonil-alone and the tank-
mixes had less dollar spot, when compared to the WA-alone and the untreated control
(Table 6).
The PAB AUDPC values showed that more dollar spot developed in infrequently
irrigated blocks (1685% PAB x time), when compared to frequently irrigated blocks
(857% PAB x time, Table 6). In both irrigation regimes, WA-treated plots had dollar
spot levels equivalent to the untreated control and plots treated with PB-alone had less
dollar spot than plots treated with WA-alone. There were no differences in the level of

67
dollar spot control provided by PB-alone (869% PAB x time), chlorothalonil-alone
(389% PAB x time) and tank-mixes (279 to 480%PAB x time) in the frequently irrigated
blocks. In the infrequently irrigated blocks, however, chlorothalonil + PB (209% PAB x
time) and chlorothalonil + PB + WA (213 % PAB x time) provided better dollar spot
control, when compared to PB-alone (882% PAB x time, Table 6).
Gray Leaf Spot 2002. The 2002 summer was marked by prolonged periods of drought and heat stress.
Chemical treatments were initiated on 17 June, and gray leaf spot became active on 3
July. Gray leaf spot was assessed as a percent of plot area blighted (% PAB) by P.
grisea.
All treated plots, except chlorothalonil + PB, had active gray leaf spot (0.1-1.4%
PAB) on 3 July, but there were no disease differences among irrigation and chemical
treatments (data not shown, Appendix A. Table 11). By 19 July, gray leaf spot had
progressed and plots treated with PB-alone (3.1% PAB), WA-alone (5.1% PAB) and the
untreated control (4.8% PAB) had similar levels of blighting (Table 7). Only plots
treated with chlorothalonil + PB (0.1% PAB) had less disease, when compared to the
untreated control on 19 July. By 29 July, plots treated with PB-alone (37.3% PAB), WA-
alone (30.6% PAB) and the untreated control (26.9% PAB) were blighted severely. All
chlorothalonil-treated plots (0.8-3.4% PAB) continued to suppress gray leaf spot, but
disease levels would likely be high enough to warrant a curative fungicide application to
golf course fairways. Gray leaf spot intensified between late July and early August and
again no disease differences among plots treated with PB-alone (72.6% PAB), WA-alone
(66.0% PAB) and the untreated control (62.4% PAB) were observed on 8 August. Gray

68
leaf spot also intensified in all chlorothalonil-treated plots between 8 and 16 August.
There were no differences among chlorothalonil-treated plots at these times, but blight
levels (2.9-20.0% PAB) would be considered unacceptable by most golf course
managers. On 22 August, there was a significant interaction between irrigation and
chemical treatments. There was more blighting in infrequently irrigated blocks (57.9%
PAB) versus frequently irrigated blocks (46.8% PAB) on 22 August. Although data
cannot be statistically compared, blight levels were higher in chlorothalonil-treated plots
subjected to infrequent irrigation (20.5- 33.6% PAB), when compared to those in the
frequently irrigated blocks (5.5-12.0% PAB). Data collected 29 August and 5 September
were similar to those observed on 22 August, except the blight levels were higher.
Gray leaf spot AUDPC value data showed that there was a significant (P=0.05)
interaction between irrigation and chemical treatments (Table 7). There was, however,
no significant irrigation effect. The AUDPC values suggested that plots treated with
chlorothalonil + PB + WA (1030% PAB x time) in the frequently irrigated block had a
higher level of gray leaf spot, when compared to plots treated with chlorothalonil-alone
(671% PAB x time), chlorothalonil + PB (660%PAB x time) and chlorothalonil + WA
(690% PAB x time). The AUDPC values for both irrigation regimes showed that PB-
alone, WA-alone had no effect on gray leaf spot. Except as previously noted, there were
no differences in gray leaf spot levels among plots treated with chlorothalonil-alone
(939% PAB x time) and the tank-mix treatments (762- 1183% PAB x time).
2003 and 2004. In 2002, ‘Figaro’ perennial ryegrass was rapidly blighted by P. grisea.
Therefore, in 2003 ‘Brightstar’ perennial ryegrass was substituted in anticipation that it

69
would not be as susceptible, which may have allowed for better assessment of potential
differences among chemical treatments. The 2003 study year, however, was marked by
cool temperatures and frequent rainfall and gray leaf spot did not develop in the
‘Brightstar’. Therefore, in 2004 ‘Figaro’ perennial ryegrass again was evaluated and the
rate and application interval for chlorothalonil treatments were adjusted. Prior to the time
gray leaf spot became visually active in the study area, the rate and application interval
for all chlorothalonil treatments were 4.5 kg a.i ha-1 and 14 days, respectively. On 20
July, when gray leaf spot became visually active, the chlorothalonil rate was increased to
8.0 kg a.i. ha-1 and the application interval was reduced to 8 days.
Trace levels of gray leaf spot were observed in untreated (0.1% PAB) and WA-
alone-treated plots (0.1% PAB) on 20 July (data not shown, Appendix A. Table 12). All
plots within the infrequently irrigated blocks were disease-free on 27 July, but the highest
disease level in frequently irrigated blocks was only 0.2% PAB (data not shown,
Appendix A. Table 12). On 2 August, there were no significant irrigation effects or
interactions, but chlorothalonil-treated plots were disease free (data not shown, Appendix
A. Table 12). Gray leaf spot did not intensify until 10 August, when blight levels
increased to between 3.3 and 6.3% PAB in plots treated with PB-alone, WA-alone and
untreated control (Table 8). Similar blight levels were observed on 17 August (data not
shown, Appendix A. Table 12). On 24 August, the disease had dramatically intensified
and there was a significant interaction. There were greater disease levels in frequently
irrigated blocks (11.4% PAB), when compared to infrequently irrigated blocks (3.3%
PAB) on 24 August (Table 8). All chlorothalonil-treated plots were disease-free, but
plots treated with PB-alone and WA-alone were more severely blighted in the frequently

70
irrigated blocks. Similar results were observed on 30 August. On 30 August and 3 and 22
September, frequently irrigated blocks (27.5-52.0% PAB) were more severely blighted
than infrequently irrigated blocks (9.9-40.1% PAB). All chlorothalonil-treated plots (last
treated on 16 August) were disease-free on 3 September, but had 2.3 to 3.4% PAB on 13
September. By 22 September, gray leaf spot severity had increased substantially in all
chlorothalonil-treated plots (15.0-18.8% PAB) in the frequently irrigated blocks. In
infrequently irrigated blocks, however, blight levels only ranged from 0.5 to 2.5% PAB
in chlorothalonil-treated plots. Similarly on 27 September and 4 October, gray leaf spot
was more severe in frequently irrigated (52.0-57.8% PAB) versus infrequently irrigated
(40.2-41.5% PAB) blocks. Chlorothalonil-treated plots in infrequently irrigated blocks
(1.3-8.8% PAB) continued to exhibit far less blighting than was observed in frequently
irrigated blocks (13.8-28.3% PAB) between 27 September and 4 October. No gray leaf
spot differences, however, were observed among plots treated with chlorothalonil-alone
and the tank-mixes on any rating date in 2004 (Table 8).
The AUDPC values confirmed that there was less damage in infrequently
irrigated blocks (1140% PAB x time), when compared to frequently irrigated blocks
(1809% PAB x time) throughout the season (Table 8). There was, however, no
interaction between chemical and irrigation treatments. As was observed in 2002, plots
treated with PB-alone (43.1% PAB x day), WA-alone (41.1% PAB x day) had gray leaf
spot levels equivalent to the untreated control (38.5% PAB x day). There were no
AUDPC value differences among chlorothalonil-alone and tank-mix treatments.
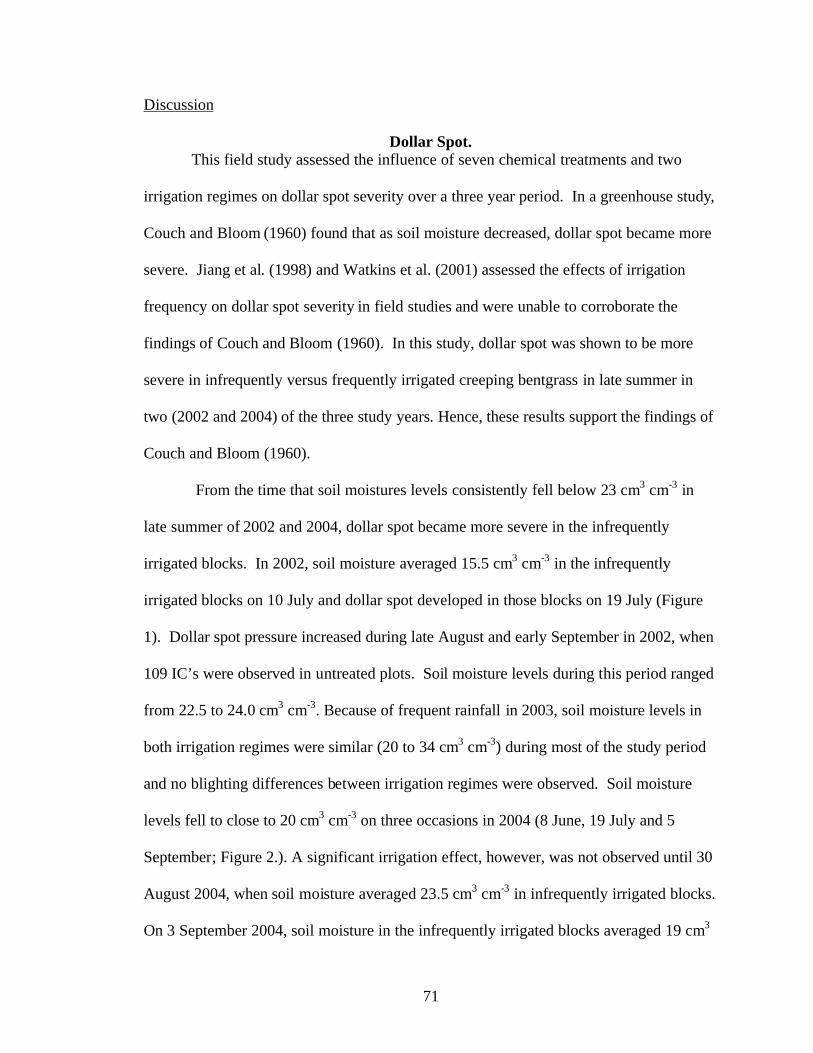
71
Discussion
Dollar Spot. This field study assessed the influence of seven chemical treatments and two
irrigation regimes on dollar spot severity over a three year period. In a greenhouse study,
Couch and Bloom (1960) found that as soil moisture decreased, dollar spot became more
severe. Jiang et al. (1998) and Watkins et al. (2001) assessed the effects of irrigation
frequency on dollar spot severity in field studies and were unable to corroborate the
findings of Couch and Bloom (1960). In this study, dollar spot was shown to be more
severe in infrequently versus frequently irrigated creeping bentgrass in late summer in
two (2002 and 2004) of the three study years. Hence, these results support the findings of
Couch and Bloom (1960).
From the time that soil moistures levels consistently fell below 23 cm3 cm-3 in
late summer of 2002 and 2004, dollar spot became more severe in the infrequently
irrigated blocks. In 2002, soil moisture averaged 15.5 cm3 cm-3 in the infrequently
irrigated blocks on 10 July and dollar spot developed in those blocks on 19 July (Figure
1). Dollar spot pressure increased during late August and early September in 2002, when
109 IC’s were observed in untreated plots. Soil moisture levels during this period ranged
from 22.5 to 24.0 cm3 cm-3. Because of frequent rainfall in 2003, soil moisture levels in
both irrigation regimes were similar (20 to 34 cm3 cm-3) during most of the study period
and no blighting differences between irrigation regimes were observed. Soil moisture
levels fell to close to 20 cm3 cm-3 on three occasions in 2004 (8 June, 19 July and 5
September; Figure 2.). A significant irrigation effect, however, was not observed until 30
August 2004, when soil moisture averaged 23.5 cm3 cm-3 in infrequently irrigated blocks.
On 3 September 2004, soil moisture in the infrequently irrigated blocks averaged 19 cm3

72
cm-3, and a significant irrigation effect was observed. Dollar spot pressure in 2004
peaked in the infrequently irrigated untreated control (63.3% PAB) plots on 17
September, at which time soil moisture averaged 23 cm3 cm-3. On the same day in the
frequently irrigated untreated control plots, soil moisture averaged 36 cm3 cm-3 and only
18.5% PAB was observed. Hence, when moisture levels for this soil approached a range
of 20 to 23 cm3 cm-3 in late summer, dollar spot became more severe in the creeping
bentgrass. Low soil moistures levels in a similar range (15.5-22.9 cm3 cm-3) occurring
earlier in the season, however, were not associated with increases in dollar spot severity.
It is conceivable that when soil moisture levels were low earlier in the season, S.
homoeocarpa inoculum levels were not sufficient to incite severe blighting. Indeed, it
was only early in the season when IC’s could be counted since disease pressure was low,
and IC AUDPC values from 2002 and 2004 between irrigation regimes were not
significantly different. Another important factor to consider is that ‘Crenshaw’ creeping
bentgrass was the host. Dollar spot generally is more severe in other bentgrass cultivars
in Maryland in late spring or early summer. Typically, however, peak dollar spot activity
in ‘Crenshaw’ often occurs in late-summer in Maryland (Bigelow et al., 2002; Dernoeden
and Kaminski, 2000). Hence, these results may only apply to situations in which severe
outbreaks of dollar spot occur in late summer.
The mechanism by which low soil moisture conditions in mid-to-late summer
predispose creeping bentgrass to more severe damage from S. homoeocarpa is unknown.
Some theories would include: 1) low soil moisture levels predispose plants to infection
due to stress; 2) high soil moisture levels may enhance microbial competition and/or
antagonism with S. homoeocarpa; 3) frequent irrigation may physically remove S.

73
homoeocarpa mycelia from plant surfaces; and 4) high soil moisture levels increase
organic matter mineralization thus increasing N availability to plants. It is possible that
S. homoeocarpa is more competitive under conditions of low soil moisture or that
drought and other summer stresses weaken plants, rendering them more susceptible to the
pathogen. Furthermore, turf managed under low soil moisture levels or drought stress
grows more slowly and is less likely to recover rapidly from damage caused by S.
homoeocarpa. It also is possible in soils with high moisture levels that there is an
increase in microbial populations, which antagonize, compete with or in some way
reduce the capacity of S. homoeocarpa to infect plants. Finally, more N may be available
to plants due to an increase in mineralization in warm and wet soils. The availability of
more N can stimulate recovery from blighting caused by S. homoeocarpa (Couch, 1995).
Fidanza and Dernoeden (1996), conducted a two year field study that evaluated
the effects of two irrigation practices on brown patch (Rhizoctonia solani Kühn) in
perennial ryegrass. They found that brown patch severity was consistently reduced with
morning irrigation, when compared to evening irrigation. They hypothesized that
frequent morning irrigation may have physically removed R. solani mycelia from the
canopy, thus preventing and/or delaying the onset or expression of the disease. Williams
and coworkers (1996 and 1998), found that dew displacement before 0400 hours would
not reduce the leaf wetness duration, and that early morning dew displacement speeds
canopy drying and reduces dollar spot severity. In this study, water was applied to
frequently irrigated blocks at 2100 hours, before most dew or foliar S. homoeocarpa
mycelium would have formed in the canopy. Therefore, it is unlikely that significant
amounts of S. homoeocarpa mycelium were removed as a result of irrigation at 2100

74
hours. Dew generally begins to form in creeping bentgrass at about 2000 hours during
summer in Maryland. It is possible that irrigation at 2100 hours could have increased the
leaf wetness duration in the frequently irrigated creeping bentgrass. Regardless, the time
of irrigation (i.e. 2100 hours) did not appear to play a role in the dollar spot differences
observed in this study. Obviously, more research is needed to elucidate mechanism(s),
which enable S. homoeocarpa to be more damaging under conditions of decreasing soil
moisture. It is likely, however, that other environmental and host-pathogen interaction
factors are involved and that a soil moisture level below 23 cm3 cm-3 in mid-to-late
summer is not the only factor involved.
In this study, dollar spot was evaluated early in each year by counting IC’s, but as
the epidemic progressed plots were evaluated as a percent PAB. The threshold at which a
golf course manager would likely apply a fungicide curatively was subjectively
established at 8 to 10 IC’s or 0.5% PAB. Over the three years, chlorothalonil-alone
provided acceptable dollar spot control on 15 of 16 rating dates early in the season, when
IC data were collected. In both irrigation regimes and over the three years, however, late
season PAB data showed that chlorothalonil-alone only provided an acceptable level of
control on 12 of 23 rating dates. It is important to note that on nine PAB rating dates,
data were obtained fourteen or more days after chlorothalonil was last applied. When a
chemical by irrigation interaction was observed, however, chlorothalonil-alone provided
better dollar spot control on 9 of 13 ratings in the frequently irrigated blocks than was
observed in infrequently irrigated blocks. Conversely, on only 4 of 13 rating dates when
interactions were observed, chlorothalonil-alone provided better dollar spot in
infrequently irrigated blocks, when compared to the frequently irrigated blocks. Hence,

75
chlorothalonil, even at the reduced rate evaluated in 2004, generally provided acceptable
dollar spot control in frequently irrigated turf late in the season, when disease pressure
was greatest.
The AUDPC values showed that PB-alone reduced dollar spot levels, when
compared to the untreated control in all three years. On six occasions over the three
years when the threshold had been exceeded in untreated plots, PB-alone provided
acceptable dollar spot control. In 2002 and 2004, when interactions were observed, PB-
alone provided better dollar spot control in the frequently irrigated blocks on 9 of 13
rating dates, when compared to the infrequently irrigated blocks. On 4 of 13 rating dates,
however, PB-alone provided better dollar spot control in the infrequently irrigated blocks,
when compared to frequently irrigated blocks. Over the three years, PB-alone reduced
dollar spot blighting by 40 to 60% on eleven rating dates and by greater than 60% on
twenty rating dates, when compared to the untreated control. It should be noted that the
PB rate evaluated (0.12 kg a.i. ha-1) was a low label rate. Results from this study support
those of Burpee et al. (1996), corroborating that PB-applied alone (0.16 kg a.i. ha-1) does
provide an agronomically significant level of dollar spot suppression.
As previously noted, early morning displacement of dew would be expected to
reduce dollar spot severity in fairway turf (Williams et al. 1996). The WA-alone only was
able to provide acceptable dollar spot suppression on one occasion when the disease
exceeded the IC threshold in the untreated control. However, the WA provided better
dollar spot suppression in the frequently irrigated blocks, when compared to the
infrequently irrigated blocks on 13 of 14 rating dates over the three years. This may have
been due to the capacity of the WA to more effectively displaced dew in the frequently

76
irrigated blocks, where disease pressure was generally less. On seven dates over the three
years, the WA reduced dollar spot by as much as 30 to 50%, when compared to the
untreated control. When examining all AUDPC values (AUDPC IC’s=3; AUDPC
PAB=3), however, the WA-alone only reduced dollar spot levels twice, when compared
to the untreated control.
When chlorothalonil-alone treated plots had exceeded the threshold (IC and PAB
data), the mixtures of chlorothalonil + PB and chlorothalonil + PB + WA provided
acceptable dollar spot control on only three rating dates over the three year period. In
2004, the rate of chlorothalonil was reduced and IC AUDPC values for that year (i.e.,
early season data) indicated that the tank-mix of chlorothalonil + PB provided a higher
level of dollar spot control, when compared to chlorothalonil-alone, chlorothalonil + WA
and chlorothalonil + PB + WA. The 2004 PAB AUDPC data (i.e., late season data),
however, showed that there were no dollar spot differences among plots treated with
chlorothalonil-alone or a tank-mix. On two 2004 rating dates (2 and 10 August),
chlorothalonil + PB and chlorothalonil + PB + WA provided a higher level of dollar spot
control, when compared to chlorothalonil-alone and chlorothalonil + WA. Hence, data
indicated that PB, which was applied at a low label rate, was more effective in
suppressing dollar spot when disease pressure was low early in the season. The AUDPC
values for each rating type (i.e., IC and PAB) showed that plots treated with
chlorothalonil + WA generally had dollar spot levels equivalent to plots treated with
chlorothalonil-alone. Hence, there was a benefit from applying a combination of
chlorothalonil + PB, but there was no benefit provided by tank-mixing chlorothalonil +
WA. Except for the 2004 IC AUDPC data, all other AUDPC values calculated during

77
the three study years detected few differences among chlorothalonil-alone and tank-mix
treatments.
Data from this study have shown that maintaining moisture levels above 25 cm3
cm-3 for this soil in late summer through frequent irrigation can reduce dollar spot
severity and improve the ability of chlorothalonil, PB, and WA to suppress the disease in
fairway height creeping bentgrass. Although neither PB and WA can be expected to
provide an acceptable level of dollar spot control, on several rating dates over the three
years each material reduced dollar spot levels, when compared to untreated plots. Hence,
in creeping bentgrass fairways where dollar spot is a chronic problem the use of PB and
WA may help to reduce dollar spot levels as well as provide other important agronomic
benefits. In 2002 and 2004, the chlorothalonil treatments preformed better in turf that
had been subjected to frequent irrigation, when compared to infrequent irrigation.
Furthermore, on two ratings dates in 2004, chlorothalonil (reduced rate of 4.5 kg a.i. ha-1)
+ PB provided a higher level of dollar spot control, when compared to all other
chlorothalonil treatments. Because the rate and application intervals for chlorothalonil
are restricted, these data will help golf course superintendents use chlorothalonil to
manage dollar spot more efficiently. Since environmental conditions are widely variable
among regions, these finding and conclusion may only apply to creeping bentgrass grown
in a transition zone climate in the mid-Atlantic region.
Gray Leaf Spot.
Gray leaf spot was severe in 2002 and 2004, but the disease did not develop in
2003. There was no irrigation effect on gray leaf spot in 2002. Chlorothalonil treatments
provided an acceptable level of gray leaf control on only 2 of 8 rating dates in 2002, and

78
there were no disease differences among chlorothalonil treatments. The AUDPC values
for 2002 showed that there were no gray leaf spot differences among chlorothalonil
treatments in the infrequently irrigated blocks. Within the frequently irrigated blocks,
plots treated with chlorothalonil + PB + WA (1030% PAB x time) had a higher AUDPC
value in 2002, when compared to chlorothalonil-alone, chlorothalonil + WA and
chlorothalonil + PB (671-690% PAB x time). This likely was due to an error in
application, since one of the four replicates was blighted disproportionately. The WA
and PB applied had no impact on gray leaf spot. Data indicated that the fungicide spray
interval was too long to provide effective gray leaf spot control.
The application interval for all chlorothalonil treatments was reduced to eight
days and the rate was increased from 4.5 to 8.0 kg a.i. ha-1 after gray leaf spot was
observed in 2004. The AUDPC values showed that gray leaf spot was more severe in
frequently irrigated blocks (1809% PAB x time), when compared to infrequently irrigated
blocks (1139% PAB x time). The threshold at which a golf course manager would likely
apply a fungicide curatively to control gray leaf spot was subjectively established at 0.5
to 1.0% PAB. The chemical treatments provided an acceptable level of gray leaf spot
control on 8 of 13 rating dates in 2004. On 3 of 13 rating dates in 2004, when
interactions were observed, plots treated with chlorothalonil in frequently irrigated blocks
(13.8-28.3% PAB) exhibited substantially more blighting, when compared to the same
treatments applied in infrequently irrigated blocks (0.5-8.8% PAB). As was observed in
2002, plots treated with WA and PB-alone had gray leaf spot levels equivalent to the
untreated control and no gray leaf spot differences among chlorothalonil treatments were
observed.

79
In 2002, the application interval and/or chlorothalonil rate were not sufficient to
effectively control gray leaf spot, which rapidly and severely damaged even the
fungicide-treated plots. As a result, no significant irrigation effects or chlorothalonil
treatment differences were observed in 2002. Throughout the 2004 season, however,
chlorothalonil-treated plots in frequently irrigated blocks were more severely blighted,
when compared to chlorothalonil-treated plots in the infrequently irrigated blocks. The
difference between 2002 and 2004 was due to less disease pressure in infrequently
irrigated plots in 2004, which resulted in a greatly improved level of gray leaf spot
control provided by chlorothalonil in those blocks. While no benefit was observed from
tank-mixing PB or WA with chlorothalonil, there also did not appear to be any negative
effects when using these chemicals during a gray leaf spot epidemic.
These studies showed that under conditions of high disease pressure, and
insufficient use of fungicides, gray leaf spot was very destructive, regardless of soil
moisture level. Using a closer spray interval, however, chlorothalonil did effectively
control gray leaf spot, but only under conditions of less frequent irrigation, which
resulted in lower soil moisture (= 26.0 cm3 cm-3). Gray leaf spot occurs during periods of
moderate to warm weather that is accompanied by periods of prolonged leaf wetness
(Couch, 1995; Uddin et al. 2003). Large number by P. grisea conidia undoubtedly were
alighting on leaves of infrequently irrigated perennial ryegrass, but may have had a
reduced capacity to germinate and infect leaves due to a shorter leaf wetness duration.
Less frequent irrigation would have reduced the number of wetting and drying cycles and
contributed to generally drier soil conditions, which may have reduced the capacity of the
pathogen to sporulate and blight. Other environmental and biological factors probably

80
contributed to the inability of P. grisea to more severely blight perennial ryegrass in the
infrequently irrigated blocks in 2004. Additional research is needed to better understand
the relationship between irrigation practices and the incidence and severity of gray leaf
spot.
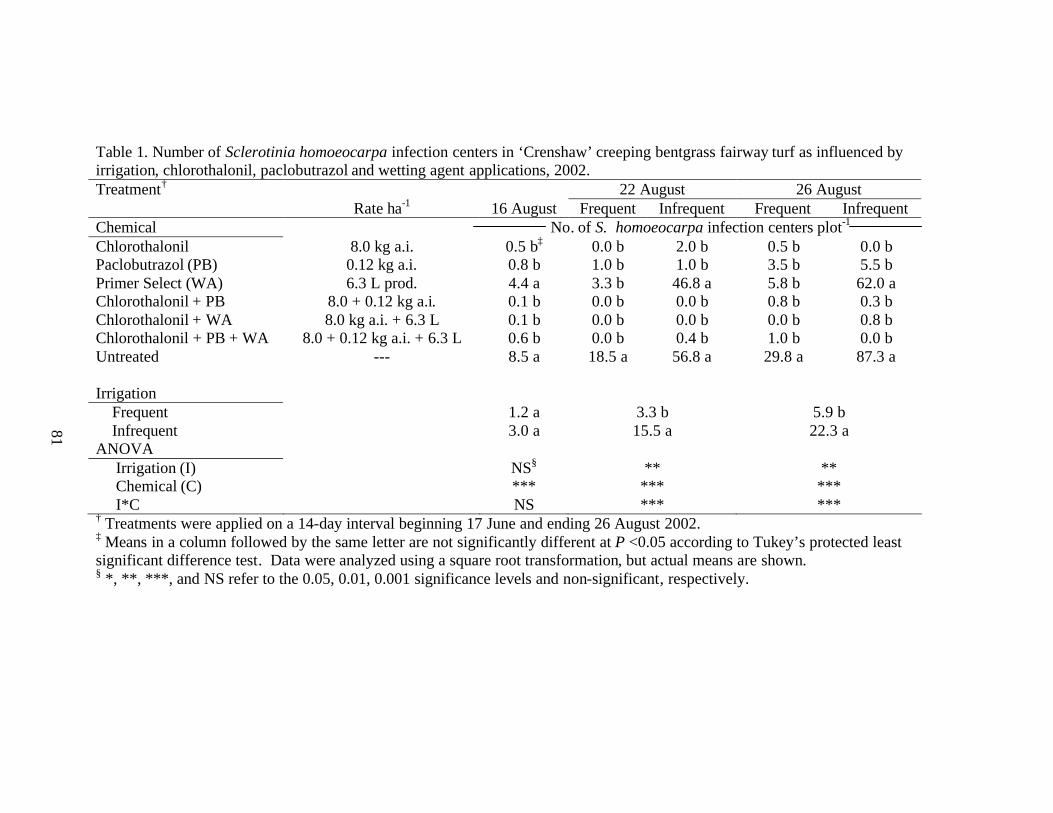
81
Table 1. Number of Sclerotinia homoeocarpa infection centers in ‘Crenshaw’ creeping bentgrass fairway turf as influenced by irrigation, chlorothalonil, paclobutrazol and wetting agent applications, 2002. Treatment† 22 August 26 August Rate ha-1 16 August Frequent Infrequent Frequent Infrequent Chemical No. of S. homoeocarpa infection centers plot-1 Chlorothalonil 8.0 kg a.i. 0.5 b‡ 0.0 b 2.0 b 0.5 b 0.0 b Paclobutrazol (PB) 0.12 kg a.i. 0.8 b 1.0 b 1.0 b 3.5 b 5.5 b Primer Select (WA) 6.3 L prod. 4.4 a 3.3 b 46.8 a 5.8 b 62.0 a Chlorothalonil + PB 8.0 + 0.12 kg a.i. 0.1 b 0.0 b 0.0 b 0.8 b 0.3 b Chlorothalonil + WA 8.0 kg a.i. + 6.3 L 0.1 b 0.0 b 0.0 b 0.0 b 0.8 b Chlorothalonil + PB + WA 8.0 + 0.12 kg a.i. + 6.3 L 0.6 b 0.0 b 0.4 b 1.0 b 0.0 b Untreated --- 8.5 a 18.5 a 56.8 a 29.8 a 87.3 a Irrigation Frequent 1.2 a 3.3 b 5.9 b Infrequent 3.0 a 15.5 a 22.3 a ANOVA Irrigation (I) NS§ ** ** Chemical (C) *** *** *** I*C NS *** *** † Treatments were applied on a 14-day interval beginning 17 June and ending 26 August 2002. ‡ Means in a column followed by the same letter are not significantly different at P <0.05 according to Tukey’s protected least significant difference test. Data were analyzed using a square root transformation, but actual means are shown. § *, **, ***, and NS refer to the 0.05, 0.01, 0.001 significance levels and non-significant, respectively.

82
Table 1 (Cont’d). Number of Sclerotinia homoeocarpa infection centers in ‘Crenshaw’ creeping bentgrass fairway turf as influenced by irrigation, chlorothalonil, paclobutrazol and wetting agent applications, 2002. Treatment† AUDPC Rate ha-1
3 September Frequent Infrequent
Chemical No. of S. homoeocarpa infection centers disease x time Chlorothalonil 8.0 kg a.i. 4.8 b‡ 7.1 c 13.2 c Paclobutrazol (PB) 0.12 kg a.i. 50.1 a 277.6 ab 230.5 b Primer Select (WA) 6.3 L prod. 96.0 a 437.1 a 1072.8 a Chlorothalonil + PB 8.0 + 0.12 kg a.i. 0.0 b 6.8 c 3.3 c Chlorothalonil + WA 8.0 kg a.i. +6.3 L 1.6 b 4.1 c 24.4 c Chlorothalonil + PB + WA 8.0 + 0.12 kg a.i. + 6.3 L 12.5 b 108.1 bc 12.1 c Untreated --- 108.8 a 702.1 a 1439.8 a Irrigation Frequent 37.3 a 220.4 a Infrequent 40.9 a 399.5 a ANOVA Irrigation (I) NS§ NS Chemical (C) *** *** I*C NS *** † Treatments were applied on a 14-day interval beginning 17 June and ending 26 August 2002. ‡ Means in a column followed by the same letter are not significantly different at P <0.05 according to Tukey’s protected least significant difference test. Data were analyzed using a square root transformation, but actual means are shown. § *, **, ***, and NS refer to the 0.05, 0.01, 0.001 significance levels and non-significant, respectively.

83
Table 2. Percent of plot area blighted by Sclerotinia homoeocarpa in ‘Crenshaw’ creeping bentgrass fairway turf as influenced by irrigation, chlorothalonil, paclobutrazol and wetting agent applications, 2002. Treatment† 23 September Rate ha-1 5 September 13 September Frequent Infrequent Chemical % of plot area blighted Chlorothalonil 8.0 kg a.i. 0.1 c‡ 0.0 d 0.0 c 0.1 d Paclobutrazol (PB) 0.12 kg a.i. 0.2 b 1.3 c 8.0 b 12.5 c Primer Select (WA) 6.3 L prod. 6.2 b 8.4 b 9.3 b 31.3 b Chlorothalonil + PB 8.0 + 0.12 kg a.i. 0.0 c 0.0 d 0.0 c 0.0 d Chlorothalonil + WA 8.0 kg a.i. + 6.3 L 0.0 c 0.0 d 0.0 c 0.1 d Chlorothalonil + PB +WA 8.0 + 0.12 kg a.i. + 6.3 L 0.0 c 0.0 d 0.0 c 0.0 d Untreated - 14.3 a 20.8 a 20.8 a 47.8 a Irrigation Frequent 2.0 a 4.1 a 5.4 b Infrequent 4.4 a 4.6 a 13.1 a ANOVA Irrigation (I) NS§ NS ** Chemical (C) *** *** *** I*C NS NS ***
† Treatments were applied on a 14-day interval beginning 17 June and ending 26 August 2002. ‡ Means in the same column followed by the same letter are not significantly different at P <0.05 according to Tukey’s protected least significant difference test. Data were analyzed using a square root transformation, but actual means are shown. § *, **, ***, and NS refer to the 0.05, 0.01, 0.001 significance levels and non-significant, respectively.

84
Table 2 (cont’d). Percent of plot area blighted by Sclerotinia homoeocarpa in ‘Crenshaw’ creeping bentgrass fairway turf as influenced by irrigation, chlorothalonil, paclobutrazol and wetting agent applications, 2002. Treatment† 1 October AUDPC Rate ha-1 Frequent Infrequent Frequent Infrequent Chemical % of plot area blighted % blighted x time Chlorothalonil 8.0 kg a.i. 0.3 c‡ 2.8 d 0.2 d 0.4 d Paclobutrazol (PB) 0.12 kg a.i. 20.5 b 18.8 c 66.9 c 74.3 c Primer Select (WA) 6.3 L prod. 20.5 b 40.3 b 142.9 b 260.0 b Chlorothalonil + PB 8.0 + 0.12 kg a.i. 0.3 c 0.0 d 0.0 d 0.5 d Chlorothalonil + WA 8.0 kg a.i. + 6.3 L 0.3 c 1.4 d 0.0 d 1.15 d Chlorothalonil + PB + WA 8.0 + 0.12 kg a.i. + 6.3 L 0.2 c 0.0 d 0.0 d 0.0 d Untreated - 34.8 a 55.8 a 296.8 a 533.3 a Irrigation Frequent 11.0 a 72.4 b Infrequent 17.0 a 124.3 a ANOVA Irrigation (I) NS§ * Chemical (C) *** *** I*C *** ***
† Treatments were applied on a 14-day interval beginning 17 June and ending 26 August 2002. ‡ Means in the same column followed by the same letter are not significantly different at P <0.05 according to Tukey’s protected least significant difference test. Data were analyzed using a square root transformation, but actual means are shown. § *, **, ***, and NS refer to the 0.05, 0.01, 0.001 significance levels and non-significant, respectively.
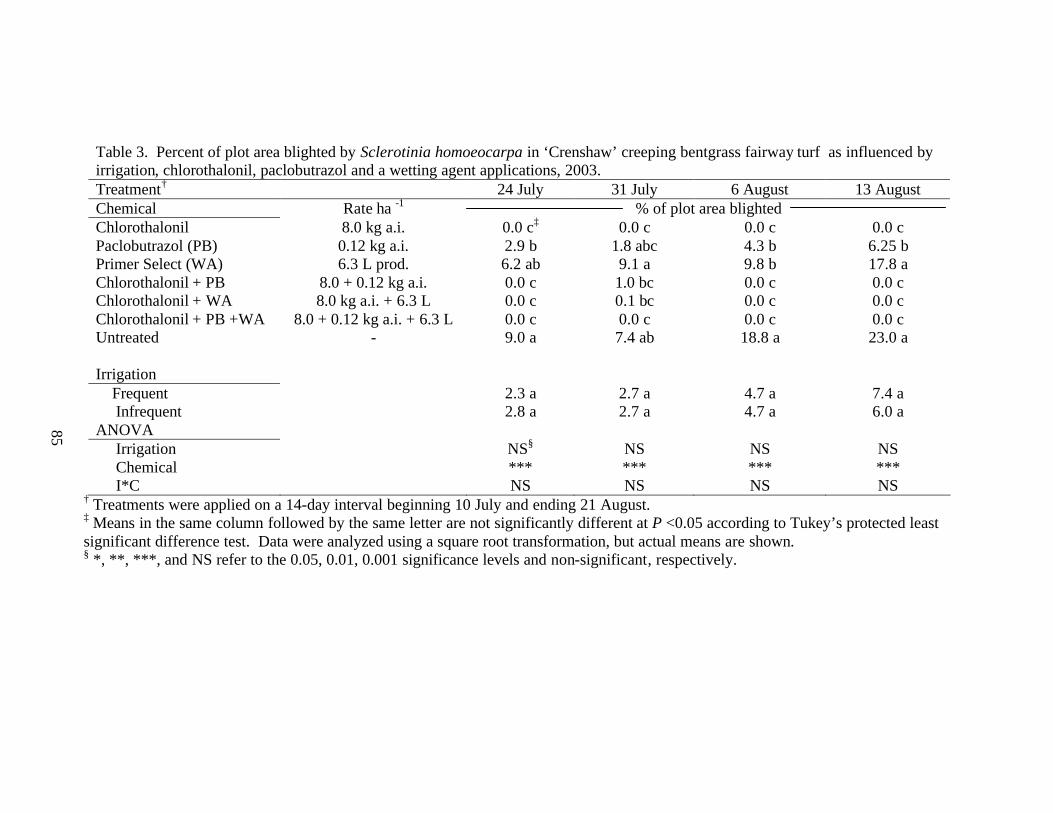
85
Table 3. Percent of plot area blighted by Sclerotinia homoeocarpa in ‘Crenshaw’ creeping bentgrass fairway turf as influenced by irrigation, chlorothalonil, paclobutrazol and a wetting agent applications, 2003. Treatment† 24 July 31 July 6 August 13 August Chemical Rate ha -1 % of plot area blighted Chlorothalonil 8.0 kg a.i. 0.0 c‡ 0.0 c 0.0 c 0.0 c Paclobutrazol (PB) 0.12 kg a.i. 2.9 b 1.8 abc 4.3 b 6.25 b Primer Select (WA) 6.3 L prod. 6.2 ab 9.1 a 9.8 b 17.8 a Chlorothalonil + PB 8.0 + 0.12 kg a.i. 0.0 c 1.0 bc 0.0 c 0.0 c Chlorothalonil + WA 8.0 kg a.i. + 6.3 L 0.0 c 0.1 bc 0.0 c 0.0 c Chlorothalonil + PB +WA 8.0 + 0.12 kg a.i. + 6.3 L 0.0 c 0.0 c 0.0 c 0.0 c Untreated - 9.0 a 7.4 ab 18.8 a 23.0 a Irrigation Frequent 2.3 a 2.7 a 4.7 a 7.4 a Infrequent 2.8 a 2.7 a 4.7 a 6.0 a ANOVA Irrigation NS§ NS NS NS Chemical *** *** *** *** I*C NS NS NS NS
† Treatments were applied on a 14-day interval beginning 10 July and ending 21 August. ‡ Means in the same column followed by the same letter are not significantly different at P <0.05 according to Tukey’s protected least significant difference test. Data were analyzed using a square root transformation, but actual means are shown. § *, **, ***, and NS refer to the 0.05, 0.01, 0.001 significance levels and non-significant, respectively.

86
Table 3 (cont’d). Percent of plot area blighted by Sclerotinia homoeocarpa in ‘Crenshaw’ creeping bentgrass fairway turf as influenced by irrigation, chlorothalonil, paclobutrazol and a wetting agent applications, 2003. Treatment† 5 September 15 September Rate ha -1 Frequent Infrequent Frequent Infrequent AUDPC Chemical % of plot area blighted % blighted x time Chlorothalonil 8.0 kg a.i. 0.5 a‡ 0.0 c 1.2 ab 0.5 a 6.1 c Paclobutrazol (PB) 0.12 kg a.i. 1.8 a 3.7 b 2.0 ab 3.9 b 153.5 b Primer Select (WA) 6.3 L prod. 2.3 a 5.7 a 3.0 a 6.1 b 334.4 a Chlorothalonil + PB 8.0 + 0.12 kg a.i. 0.3 a 0.0 c 0.9 ab 0.2 a 10.5 c Chlorothalonil + WA 8.0 kg a.i. + 6.3 L 0.2 a 0.0 c 1.0 ab 0.4 a 17.8 c Chlorothalonil + PB + WA 8.0 + 0.12 kg a.i. + 6.3 L 0.0 a 0.0 c 0.5 ab 0.3 a 2.3 c Untreated - 2.7 a 6.9 a 2.7 ab 6.2 b 413.5 a Irrigation 1.1 a 1.6 a 127.3 a Frequent 2.3 a 2.5 a 140.7 a Infrequent ANOVA Irrigation NS§ NS NS Chemical *** *** *** I*C *** *** NS
† Treatments were applied on a 14-day interval beginning 10 July and ending 21 August. ‡ Means in the same column followed by the same letter are not significantly different at P <0.05 according to Tukey’s protected least significant difference test. Data were analyzed using a square root transformation, but actual means are shown. § *, **, ***, and NS refer to the 0.05, 0.01, 0.001 significance levels and non-significant, respectively.

87
Table 4. Number of Sclerotinia homoeocarpa infection centers in ‘Brightstar’ perennial ryegrass fairway turf as influenced by irrigation, chlorothalonil, paclobutrazol and wetting agent applications, 2003. Treatment Rate ha -1 6 August 21 August 28 August Chemical† No. of S. homoeocarpa infection centers plot-1 Chlorothalonil 8.0 kg a.i. 0.0 b‡ 0.0 c 0.0 b Paclobutrazol (PB) 0.12 kg a.i. 4.0 b 2.3 bc 5.9 b Primer Select (WA) 6.3 L prod. 27.4 a 9.7 a 30.4 a Chlorothalonil + PB 8.0 + 0.12 kg a.i. 2.2 b 1.3 c 3.0 b Chlorothalonil + WA 8.0 kg a.i. + 6.3 L 5.2 b 0.3 c 1.4 b Chlorothalonil + PB + WA 8.0 + 0.12 kg a.i. + 6.3 L 0.0 b 0.0 c 0.0 b Untreated - 31.3 a 6.3 ab 24.8 a Irrigation Frequent 8.5 a 1.2 a 5.8 a Infrequent 13.6 a 5.2 a 15.5 a ANOVA Irrigation NS§ NS NS Chemical *** *** *** I*C NS NS NS
† Treatments were applied on a 14-day interval beginning 10 July and ending 21 August. ‡ Means in the same column followed by the same letter are not significantly different at P <0.05 according to Tukey’s protected least significant difference test. Data were analyzed using a square root transformation, but actual means are shown. § *, **, ***, and NS refer to the 0.05, 0.01, 0.001 significance levels and non-significant, respectively.

88
Table 5. Number of Sclerotinia homoeocarpa infection centers in ‘Southshore’ creeping bentgrass as influenced by irrigation, chlorothalonil, paclobutrazol and wetting agent, 2004. Treatment† 21July Rate ha -1 Frequent Infrequent 2 August 10 August AUDPC Chemical Number of S. homoeocarpa infection centers plot-1 disease x time Chlorothalonil 4.5 kg a.i. 0.0 a‡ 2.0 ab 5.6 c 11.1 c 115.2 cd Paclobutrazol (PB) 0.12 kg a.i. 6.0 bc 0.0 a 22.4 b 35.1 b 441.6 b Primer Select (WA) 6.3 L prod. 10.8 c 8.5 bc 67.3 a 95.1 a 1292.8 a Chlorothalonil + PB 4.5 + 0.12 kg a.i. 0.0 a 2.0 a 0.6 d 1.1 d 19.2 e Chlorothalonil + WA 4.5 kg a.i. +6.3 L 1.3 ab 0.0 a 6.6 c 11.3 c 134.4 c Chlorothalonil + PB + WA 4.5 + 0.12 kg a.i. + 6.3 L 0.3 ab 0.0 a 0.5 d 1.1 d 25.6 d Untreated - 10.3 c 19.0 c 60.8 a 100.9 a 1305.6 a Irrigation Frequent 4.0 a 23.4 a 32.7 a 467.2 a Infrequent 4.5 a 23.4 a 40.4 a 486.4 a ANOVA Irrigation NS§ NS§ NS NS Chemical *** *** *** *** I*C *** NS NS NS
†Treatments were applied on a 14-day interval beginning 1 June and ending 16 August. ‡ Means in the same column followed by the same letter are not significantly different at P <0.05 according to Tukey’s protected least significant difference test. Data were analyzed using a square root transformation, but actual means are shown. § *, **, ***, and NS refer to the 0.05, 0.01, 0.001 significance levels and non-significant, respectively.

89
Table 6. Percent of plot area blighted by Sclerotinia homoeocarpa in ‘Southshore’ creeping bentgrass as influenced by irrigation, chlorothalonil, paclobutrazol and a wetting agent, 2004. Treatment† 24 August 30 August Rate ha -1 Frequent Infrequent Frequent Infrequent Chemical % of plot area blighted Chlorothalonil 4.5 kg a.i. 0.5 bc‡ 0.3 bc 1.0 b 1.5 b Paclobutrazol (PB) 0.12 kg a.i. 2.0 ab 1.8 b 2.9 b 2.6 b Primer Select (WA) 6.3 L prod. 7.4 a 16.0 a 11.7 a 27.5 a Chlorothalonil + PB 4.5 + 0.12 kg a.i. 0.2 c 0.1 c 0.5 b 0.3 b Chlorothalonil + WA 4.5 kg a.i. +6.3 L 0.6 bc 0.4 bc 0.9 b 1.5 b Chlorothalonil + PB + WA 4.5 + 0.12 kg a.i. + 6.3 L 0.3 c 0.4 bc 0.5 b 1.5 b Untreated - 8.5 a 16.5 a 11.4 a 29.3 a Irrigation Frequent 2.8 a 4.1 b Infrequent 5.1 a 9.2 a ANOVA Irrigation NS§ * Chemical *** *** I*C ** ***
†Treatments were applied on a 14-day interval beginning 1 June and ending 16 August. ‡ Means in the same column followed by the same letter are not significantly different at P <0.05 according to Tukey’s protected least significant difference test. Data were analyzed using a square root transformation, but actual means are shown. § *, **, ***, NS and refer to significant at the 0.05, 0.01, 0.001, non-significant, respectively.

90
Table 6 (cont’d). Percent of plot area blighted by Sclerotinia homoeocarpa in ‘Southshore’ creeping bentgrass as influenced by irrigation regime, chlorothalonil, paclobutrazol and a wetting agent, 2004. Treatment† 3 September 17 September Rate ha -1 Frequent Infrequent Frequent Infrequent Chemical % of plot area blighted Chlorothalonil 4.5 kg a.i. 2.0 b‡ 3.9 b 9.8 abc 13.0 c Paclobutrazol (PB) 0.12 kg a.i. 3.9 b 4.4 b 9.5 bc 15.8 c Primer Select (WA) 6.3 L prod. 17.8 a 35.8 a 16.5 ab 46.3 b Chlorothalonil + PB 4.5 + 0.12 kg a.i. 1.4 b 0.8 b 6.5 c 4.1 d Chlorothalonil + WA 4.5 kg a.i. +6.3 L 2.1 b 3.7 b 12.8 abc 13.0 c Chlorothalonil + PB + WA 4.5 + 0.12 kg a.i. + 6.3 L 0.9 b 3.7 b 7.0 c 12.8 d Untreated - 18.6 a 37.0 a 18.5 a 63.3 a Irrigation Frequent 6.7 b 11.5 b Infrequent 12.8 a 24.0 a ANOVA Irrigation *§ ** Chemical *** *** I*C * ***
†Treatments were applied on a 14-day interval beginning 1 June and ending 16 August. ‡ Means in the same column followed by the same letter are not significantly different at P <0.05 according to Tukey’s protected least significant difference test. Data were analyzed using a square root transformation, but actual means are shown. § *, **, ***, NS and refer to significant at the 0.05, 0.01, 0.001, non-significant, respectively.

91
Table 6 (cont’d). Percent of plot area blighted by Sclerotinia homoeocarpa in Southshore creeping bentgrass as influenced by irrigation, chlorothalonil, paclobutrazol and a wetting agent, 2004. Treatment† 27 September AUDPC Rate ha -1 Frequent Infrequent Frequent Infrequent Chemical % of plot area blighted % blighted x time Chlorothalonil 4.5 kg a.i. 9.5 a‡ 21.3 c 389.5 b 627.3 bc Paclobutrazol (PB) 0.12 kg a.i. 9.1 a 18.5 cd 869.2 b 881.5 b Primer Select (WA) 6.3 L prod. 11.0 a 45.0 b 1783.5 a 4325.5 a Chlorothalonil + PB 4.5 + 0.12 kg a.i. 10.5 a 10.1 d 295.2 b 209.1 c Chlorothalonil + WA 4.5 kg a.i. +6.3 L 14.0 a 19.0 cd 479.7 b 639.6 bc Chlorothalonil + PB + WA 4.5 + 0.12 kg a.i. + 6.3 L 9.0 a 12.3 cd 278.8 b 213.2 c Untreated - 12.5 a 63.8 a 1898.3 a 4924.1 a Irrigation Frequent 14.4 b 856.9 b Infrequent 28.0 a 1685.1 a ANOVA Irrigation **§ * Chemical *** *** I*C *** ***
† Treatments were applied on a 14-day interval beginning 1 June and ending 16 August. ‡ Means in the same column followed by the same letter are not significantly different at P <0.05 according to Tukey’s protected least significant difference test. Data were analyzed using a square root transformation, but actual means are shown. § *, **, ***, NS and refer to significant at the 0.05, 0.01, 0.001, non-significant, respectively.

92
Table 7. Percent of plot area blighted by Pyricularia grisea in ‘Figaro’ perennial ryegrass as influenced by irrigation, chlorothalonil, paclobutrazol and a wetting agent, 2002. Treatment† Rate ha-1 19 July 29 July 8 August 16 August % plot area blighted Chemical Chlorothalonil 8.0 kg a.i. 0.9 ab‡ 1.6 b 6.3 b 9.8 b Paclobutrazol (PB) 0.12 kg a.i. 3.1 a 37.3 a 72.6 a 96.4 a Primer Select (WA) 6.3 L prod. 5.1 a 30.6 a 66.0 a 95.6 a Chlorothalonil + PB 8.0 + 0.12 kg a.i. 0.1 b 0.8 b 2.9 b 5.3 b Chlorothalonil + WA 8.0 kg a.i. + 6.3 L 0.9 ab 1.4 b 5.4 b 12.4 b Chlorothalonil + PB + WA 8.0 + 0.12 kg a.i. + 6.3 L 1.5 ab 3.4 b 10.5 b 20.0 b Untreated - 4.8 a 26.9 a 62.4 a 91.4 a Irrigation Frequent 4.3 a 14.1 a 37.7 a 44.5 a Infrequent 0.4 a 15.0 a 26.5 a 50.0 a ANOVA Irrigation (I) NS§ NS NS NS Chemical (C) *** *** *** *** I*C NS NS NS NS
† Treatments were applied on a 14 day interval beginning on 17 June and ending 26 August, 2002. ‡ Means in the same column followed by the same letter are not significantly different at P =0.05 according to Tukey’s protected least significant difference test. Data were analyzed using a square root transformation, but actual means are shown. § *, **, ***, and NS refer to the 0.05, 0.01, 0.001 significance levels and non-significant, respectively.

93
Table 7 (cont’d). Percent of plot area blighted by Pyricularia grisea in ‘Figaro’ perennial ryegrass as influenced by irrigation, chlorothalonil, paclobutrazol and wetting agent, 2002. Treatment† 22 August Rate ha-1 Frequent Infrequent 29 August Chemical % plot area blighted Chlorothalonil 8.0 kg a.i. 5.5 b‡ 29.8 b 43.8 b Paclobutrazol (PB) 0.12 kg a.i. 96.5 a 99.5 a 99.0 a Primer Select (WA) 6.3 L prod. 97.5 a 99.5 a 99.0 a Chlorothalonil + PB 8.0 + 0.12 kg a.i. 10.5 b 20.5 b 42.5 b Chlorothalonil + WA 8.0 kg a.i. + 6.3 L 6.5 b 26.0 b 42.3 b Chlorothalonil + PB + WA 8.0 + 0.12 kg a.i. + 6.3 L 12.0 b 33.6 b 51.3 b Untreated - 96.8 a 96.8 a 96.9 a Irrigation Frequent 46.8 b 66.0 a Infrequent 57.9 a 69.6 a ANOVA Irrigation (I) *§ NS Chemical (C) *** *** I*C ** NS
† Treatments were applied on a 14 day interval beginning on 17 June and ending 26 August, 2002. ‡ Means in the same column followed by the same letter are not significantly different at P =0.05 according to Tukey’s protected least significant difference test. Data were analyzed using a square root transformation, but actual means are shown. § *, **, ***, and NS refer to the 0.05, 0.01, 0.001 significance levels and non-significant, respectively.

94
Table 7 (cont’d). Percent of plot area blighted by Pyricularia grisea in ‘Figaro’ perennial ryegrass as influenced by irrigation, chlorothalonil, paclobutrazol and wetting agent, 2002. Treatment† AUDPC Rate ha-1 5 Sept Frequent Infrequent Chemical % plot area blight % blighted x day Chlorothalonil 8.0 kg a.i. 53.1 b‡ 670.9 c 939.6 b Paclobutrazol (PB) 0.12 kg a.i. 99.0 a 3536.6 a 3522.9 a Primer Select (WA) 6.3 L prod. 98.5 a 3489.8 a 3354.2 a Chlorothalonil + PB 8.0 + 0.12 kg a.i. 54.4 b 659.8 c 762.1 b Chlorothalonil + WA 8.0 kg a.i. + 6.3 L 55.6 b 689.5 c 970.9 b Chlorothalonil + PB + WA 8.0 + 0.12 kg a.i. + 6.3 L 61.9 b 1029.5 b 1183.1 b Untreated - 97.8 a 3504.1 a 3070.6 a Irrigation Frequent 72.6 a 1940.3 a Infrequent 76.0 a 1971.9 a ANOVA Irrigation (I) NS§ NS Chemical (C) *** *** I*C NS *
† Treatments were applied on a 14 day interval beginning on 17 June and ending 26 August, 2002. ‡ Means in the same column followed by the same letter are not significantly different at P=0.05 according to Tukey’s protected least significant difference test. Data were analyzed using a square root transformation, but actual means are shown. § *, **, ***, and NS refer to the 0.05, 0.01, 0.001 significance levels and non-significant, respectively.

95
Table 8. Percent of plot area blighted by Pyricularia grisea in ‘Figaro’ perennial ryegrass as influenced by irrigation, chlorothalonil, paclobutrazol and wetting agent, 2004. Treatment† 24 August 30 August Rate ha-1† 10 August Frequent Infrequent Frequent Infrequent Chemical % plot area blighted Chlorothalonil 8.0 kg a.i. 0.0 b‡ 0.0 b 0.0 b 0.0 b‡ 0.0 b Paclobutrazol (PB) 0.12 kg a.i. 6.3 a 35.0 a 9.4 a 72.5 a 22.8 a Primer Select (WA) 6.3 L prod. 4.2 a 23.5 a 7.9 a 66.3 a 23.0 a Chlorothalonil + PB 8.0 + 0.12 kg a.i. 0.0 b 0.0 b 0.0 b 0.0 b 0.0 b Chlorothalonil + WA 8.0 kg a.i. + 6.3 L 0.0 b 0.0 b 0.0 b 0.0 b 0.0 b Chlorothalonil + PB + WA 8.0 + 0.12 kg a.i. + 6.3 L 0.0 b 0.0 b 0.0 b 0.0 b 0.0 b Untreated - 3.3 a 21.5 a 5.8 a 53.8 a 24.0 a Irrigation Frequent 2.6 a 11.4 a 27.5 a Infrequent 1.3 a 3.3 b 9.9 b ANOVA Irrigation (I) NS§ * * Chemical (C) *** *** *** I*C NS ** ***
† All chlorothalonil treatments were applied at 4.5 kg a.i. ha-1 on 1, 15 and 29 June and 15 July, 2004. On 20, 28 July and 6 and 16 August 2004, all chlorothalonil treatments were applied at 8.0 kg a.i. ha-1. Paclobutrazol and wetting agent-alone were applied on a 14 day interval beginning 1 June and ending 16 August. ‡ Means in the same column followed by the same letter are not significantly different at P =0.05 according to Tukey’s protected least significant difference test. Data were analyzed using a square root transformation, but actual means are shown. § *, **, ***, and NS refer to the 0.05, 0.01, 0.001 significance levels and non-significant, respectively.

96
Table 8 (cont’d). Percent of plot area blighted by Pyricularia grisea in ‘Figaro’ perennial ryegrass as influenced by irrigation, chlorothalonil, paclobutrazol and wetting agent, 2004. Treatment† 3 September 22 September Rate ha-1† Frequent Infrequent
13 September Frequent Infrequent
Chemical % plot area blighted Chlorothalonil 8.0 kg a.i. 0.0 b‡ 0.0 b 2.8 b 18.8 b 2.5 b Paclobutrazol (PB) 0.12 kg a.i. 86.3 a 30.3 a 84.8 a 98.0 a 94.8 a Primer Select (WA) 6.3 L prod. 80.0 a 35.0 a 78.8 a 98.0 a 94.0 a Chlorothalonil + PB 8.0 + 0.12 kg a.i. 0.0 b 0.0 b 2.3 b 18.8 b 0.5 b Chlorothalonil + WA 8.0 kg a.i. + 6.3 L 0.0 b 0.0 b 3.4 b 17.5 b 1.5 b Chlorothalonil + PB + WA 8.0 + 0.12 kg a.i. + 6.3 L 0.0 b 0.0 b 3.3 b 15.0 b 1.0 b Untreated - 76.3 a 31.3 a 71.6 a 98.0 a 86.5 a Irrigation Frequent 34.6 a 42.6 a 52.0 a Infrequent 13.8 b 27.9 b 40.1 b ANOVA Irrigation (I) **§ ** ** Chemical (C) *** *** *** I*C *** NS ***
† All chlorothalonil treatments were applied at 4.5 kg a.i. ha-1 on 1, 15 and 29 June and 15 July 2004. On 20, 28 July and 6 and 16 August 2004, all chlorothalonil treatments were applied at 8.0 kg a.i. ha-1. Paclobutrazol and wetting agent-alone were applied on a 14 day interval beginning 1 June and ending 16 August. ‡ Means in the same column followed by the same letter are not significantly different at P =0.05 according to Tukey’s protected least significant difference test. Data were analyzed using a square root transformation, but actual means are shown. § *, **, ***, and NS refer to the 0.05, 0.01, 0.001 significance levels and non-significant, respectively.
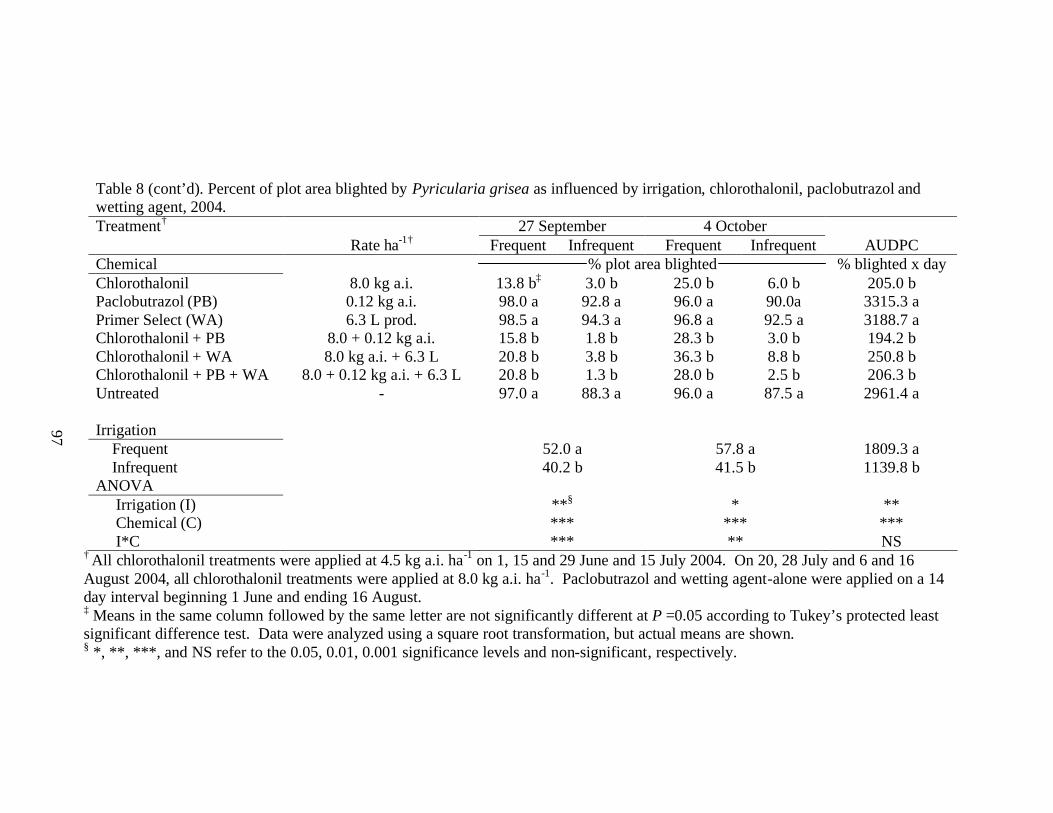
97
Table 8 (cont’d). Percent of plot area blighted by Pyricularia grisea as influenced by irrigation, chlorothalonil, paclobutrazol and wetting agent, 2004. Treatment† 27 September 4 October Rate ha-1† Frequent Infrequent Frequent Infrequent AUDPC Chemical % plot area blighted % blighted x day Chlorothalonil 8.0 kg a.i. 13.8 b‡ 3.0 b 25.0 b 6.0 b 205.0 b Paclobutrazol (PB) 0.12 kg a.i. 98.0 a 92.8 a 96.0 a 90.0a 3315.3 a Primer Select (WA) 6.3 L prod. 98.5 a 94.3 a 96.8 a 92.5 a 3188.7 a Chlorothalonil + PB 8.0 + 0.12 kg a.i. 15.8 b 1.8 b 28.3 b 3.0 b 194.2 b Chlorothalonil + WA 8.0 kg a.i. + 6.3 L 20.8 b 3.8 b 36.3 b 8.8 b 250.8 b Chlorothalonil + PB + WA 8.0 + 0.12 kg a.i. + 6.3 L 20.8 b 1.3 b 28.0 b 2.5 b 206.3 b Untreated - 97.0 a 88.3 a 96.0 a 87.5 a 2961.4 a Irrigation Frequent 52.0 a 57.8 a 1809.3 a Infrequent 40.2 b 41.5 b 1139.8 b ANOVA Irrigation (I) **§ * ** Chemical (C) *** *** *** I*C *** ** NS
† All chlorothalonil treatments were applied at 4.5 kg a.i. ha-1 on 1, 15 and 29 June and 15 July 2004. On 20, 28 July and 6 and 16 August 2004, all chlorothalonil treatments were applied at 8.0 kg a.i. ha-1. Paclobutrazol and wetting agent-alone were applied on a 14 day interval beginning 1 June and ending 16 August. ‡ Means in the same column followed by the same letter are not significantly different at P =0.05 according to Tukey’s protected least significant difference test. Data were analyzed using a square root transformation, but actual means are shown. § *, **, ***, and NS refer to the 0.05, 0.01, 0.001 significance levels and non-significant, respectively.

98
Table 9. Precipitation at the experimental site during the study period in 2002, 2003, and 2004. Month Total precipitation (mm)† 2002
June 53 July 49 August 78 September 82 Total 262
2003 June 167 July 156 August 101 September 177 Total 601
2004 June 127 July 296 August 91 September 115 Total 629
† Precipitation was measured using a rain gauge at the site.

99
0
5
10
15
20
25
30
35
40
Jun
13
Jun
23
Jul 3
Jul 1
3
Jul 2
3
Aug
2
Aug
12
Aug
22
Sep
t 1
Frequent Infrequent
**† **†
Vol
umet
ric W
ater
Con
tent
(cm
3 cm
-3)
Figure 1. Soil Moisture Measurements, 2002.†
Vertical bars represent +- 1 standard error of the mean (SE). † In creeping bentgrass, *, **, ***, and NS refer to a significant irrigation effect on dollar spot at the 0.05, 0.01, 0.001 significance levels and non-significant, respectively. § If there is no symbol for rating date (6/17 to 8/16), there was a non-significant irrigation (NS) effect.

100
0
5
10
15
20
25
30
35
40
May
13
Jun
2
Jun
22
Jul 1
2
Aug
1
Aug
21
Sep
10
Sep
30
Frequent Infrequent
*† *† **† **†
*‡ *‡ **‡ **‡ **‡ **‡
Vol
umet
ric W
ater
Con
tent
(cm
3 cm
-3)
Vertical bars represent +- 1 standard error of the mean (SE). † In creeping bentgrass, *, **, ***, and NS refer to a significant irrigation effect on dollar spot at the 0.05, 0.01, 0.001 significance levels and non-significant,
respectively. ‡ In perennial ryegrass, *, **, ***, and NS refer to a significant irrigation effect on gray leaf spot at the 0.05, 0.01, 0.001 significance levels and non-significant,
respectively. § If there is no symbol for rating date (6/7 to 8/16), there was a non-significant irrigation (NS) effect.
Figure 2. Soil Moisture Measurements, 2004†‡

101
III. DOLLAR SPOT CONTROL IN CREEPING BENTGRASS AS INFLUENCED BY FUNGICIDE SPRAY VOLUME AND APPLICATION TIMING Synopsis Dollar spot (Sclerotinia homoeocarpa F. T Bennett) is a difficult disease to
control in creeping bentgrass (Agrostis stolonifera L. var palustris (Huds.) Farw.). To
maximize fungicide performance, more information is needed regarding proper delivery
timing and water dilution or spray volume. In these field studies, a contact
(chlorothalonil) and a penetrant (propiconazole) fungicide were evaluated. The
objectives of this field study were to: (1) assess the influence of two spray volumes (468
and 1020 L water ha-1); and (2) evaluate the impact of the presence or absence of dew at
the time of application on the ability of the aforementioned fungicides to control dollar
spot in fairway height creeping bentgrass. Only chlorothalonil (8.0 kg a.i. ha-1) was
assessed in 2002, but chlorothalonil (4.5 kg a.i. ha-1), propiconazole (1.65 to 3.3 kg a.i.
ha-1), and a tank-mix of chlorothalonil (4.5 kg a.i. ha-1) + propiconazole (1.65 to 3.3 kg
a.i. ha-1) were evaluated in 2003 and 2004. Treatments were applied in two spray
volumes with dew present or displaced in the AM and again in the PM. In all three study
years, chlorothalonil provided better dollar spot control when applied in 468 versus 1020
L water ha-1 and in the PM, when compared to AM. In 2004 only, chlorothalonil gave
better dollar spot control on several dates in plots treated with the dew displaced, when
compared to plots treated with dew present. Few differences in spray volume and
application timing were observed with propiconazole and the tank mix treatments. The
tank-mix, however, generally provided a longer duration and higher level of dollar spot
control, when compared to propiconazole-alone. Evidentially, chlorothalonil
performance was reduced as a result of being diluted or washed from foliar surfaces in

102
the higher water volume or diluted by dew; whereas, the penetrant propiconazole was
able to effectively penetrate tissue without loss of effectiveness. Since both fungicides
perform well when applied in 468 L water ha-1, golf course managers can use the lower
spray volume to save time, labor and fuel.
Introduction Dollar spot (Sclerotinia homoeocarpa) continues to be a difficult disease to
control in creeping bentgrass (Agrostis stolonifera L. var palustris (Huds.) Farw.)
fairways in many regions of the world. Chlorothalonil (tetrachloroisophthalontitrile) is a
contact fungicide in the nitrile class and is perhaps the most common chemical used on
turf for disease control. Beginning in 2002, the United States Environmental Protection
Agency mandated that the use of chlorothalonil be restricted because of its negative
effects on non-target aquatic ecosystems. These restrictions (29.2 kg a.i. ha-1 annually to
fairways) have created a demand on increasing the effectiveness of chlorothalonil.
Furthermore, chlorothalonil is highly valued in disease resistance management programs
and methods for improving its performance need to be investigated. There have been no
reported cases of pathogen resistance to chlorothalonil, but there have been resistance
problems with other fungicides used to control turfgrass diseases (Burpee, 1997; Vargas,
2004; Vincelli, 2003).
Propiconazole (1-[[2-(2, 4-dichlorophenyl)-4-propyl-1, 3-dioxolan-2-yl]
methyl]-1H-1, 2, 4-triazole) is a penetrant fungicide that is commonly used to control
dollar spot and generally provides a longer period of control than chlorothalonil
(Mitkowski et al., 2005). Propiconazole is a demethyation inhibitor (DMI), which
penetrates plants. This chemical moves mostly upward (acropetal) in the grass plant after
penetration has occurred. Previous research has indicated that chlorothalonil tank-mixed

103
with a penetrant can improve the level of dollar spot control, when compared to either
fungicide applied alone (Vargas, 2004; Vincelli, 2003).
Due to playability issues, pesticide exposure and demands from golfers,
superintendents normally make pesticide applications early in the morning or possibly at
night. The effect of the presence of dew at the time a fungicide is applied is unknown.
Furthermore, there has been little study on the impact of water dilution volume or spray
volume (SV) on fungicide performance. Couch (1984) evaluated triadimefon (1-(2-(2,4-
dichlorophenyl) 4-propyl-1-1,3-dixolan-2-ymethyl0-1H-1,2,4- triazole) and
chlorothalonil in SV’s ranging from 203 to 13,033 L water ha-1 (L ha-1) for curative dollar
spot (30% plot area blighted) control in a ‘Penneagle’ creeping bentgrass putting green.
Couch (1984) observed that chlorothalonil (6.2 kg a.i. ha-1) performed best in 407 L
water ha-1, when applied-alone. He also reported that triadimefon (0.76 kg a.i. ha-1 )
performed best when applied in 815 L water ha-1. Triadimefon is in the same chemical
class as propiconazole and both fungicides have the same mode of action. Vincelli et al.
(2003) evaluated the efficacy of triadimefon (0.38 kg a.i. ha-1) and chlorothalonil (8.0 kg
a.i. ha-1) applied in 407 and 815 L ha-1 for dollar spot control in a ‘Crenshaw’ creeping
bentgrass fairway. One treatment was applied on a 14 day interval while another was
applied curatively. Vincelli et al. (2003) reported that the use of both SV’s resulted in an
equivalent level of dollar spot control for both fungicides. Ashbaugh and Larson (1982),
applied triadimefon, iprodione (3-(3, 5-dichlorophenyl)-N-(1-methylethyl)-2, 4,-dioxo-1-
imidazolidinecarboxamide) and chlorothalonil curatively to a stand of fairway height
creeping bentgrass using various SV’s. They reported that there were no differences in
the level of curative dollar spot control among the SV (203, 407, 1017.5 and 2035 L ha-1)

104
with chlorothalonil (4.0 and 8.0 kg a.i. ha-1), triadimefon (1.0 kg a.i. ha-1) or iprodione
(1.5 kg a.i. ha-1). Gregos et al. (2000) reported that there were no significant differences
in the length or level of dollar spot control when chlorothalonil (9.31 kg a.i. ha-1),
triadimefon (0.79 kg a.i. ha-1) and propiconazole (0.87 kg a.i. ha-1) were applied in 407,
815, and 1628 L water ha-1. Hence, Ashbaugh and Larson (1982), Gregos et al. (2000)
and Vincelli et al. (2003) could not corroborate the findings reported by Couch (1984).
Williams et al. (1996) showed that dew plays an important role in the
development of dollar spot and that early morning dew displacement from the canopy can
reduce dollar spot severity. In a separate study, Williams et al. (1998) quantified the
amount of dew and plant exudates in the canopy of ‘Penncross’ creeping bentgrass
maintained to a height of 19 mm. Plant exudates were measured by placing a tent on top
of the turf, which prevented condensation from forming on the turfgrass canopy. Plots
inside tents were blotted in the same fashion as those outside of the tent, and the
difference in dew (outside the tent) and exudates (inside the tent) was determined. In
both study years, plant exudates contributed substantially (33%) to total dew. The
amount of dew found in the canopy ranged from 0.16 mm to 0.23 mm, with a mean of
0.195 mm (1,949 L ha-1) when measured at 8:00 hours. It is conceivable that moisture
from dew in the canopy could impact fungicide performance. No studies, however, have
assessed the relationship of the presence or absence of dew on the efficacy of fungicides.
Due to conflicting research results, and varying SV’s and/or methods of
application, further study is needed to evaluate the importance of SV as well as the
presence or absence of dew on the ability of fungicides to control dollar spot.
Furthermore, manufacturer labels often are vague and only may state that their fungicide

105
should be applied in enough water to obtain thorough plant coverage. In general,
recommended SV’s range from 204 to 1868 L ha-1, depending on the fungicide and target
pathogen. For logistical reasons, however, golf course superintendent would prefer to
utilize lower rather than higher SV’s. Hence, an important aspect of this study was to
determine if dollar spot control is diminished if a lower rather than higher water volume
were utilized. The purpose of this study was to investigate the efficacy of a contact
(chlorothalonil) and a penetrant (propiconazole) fungicide for their ability to control
dollar spot as influenced by SV (468 and 1020 L ha-1) and by the presence or absence of
dew (AM dew present; AM dew displaced; and PM dry turf).
106
Materials and Methods These studies were conducted at the University of Maryland Paint Branch
Turfgrass Research Facility in College Park, MD. Soil was a Keyport silt loam (fine,
mixed, semiactive, mesic Aquic Hapludult) with a pH ranging from 5.8 to 6.2 and 12 to
20 mg of organic matter/g soil. Treatments were applied with a CO2 pressurized sprayer
(262 kPa; 35 psi) equipped with either an 8004 (467.5 L ha-1; low-SV) or 8010 (1019.5 L
ha-1; high-SV) flat fan nozzle. Spray volume (SV) or water dilution volume is the
amount of water into which a material (active ingredient, surfactants and inert materials)
is dissolved or suspended into before it is applied to a given area of turf. Treatments
were not reapplied until significant levels (i.e. threshold) of dollar spot were observed so
as to quantify differences among treatments. The threshold at which a golf course
superintendent (or in this study) reapply a fungicide was subjectively judged to be 8 to 10
infection centers (IC’s) plot-1 or 0.5% plot area blighted, depending on the size of the
infection centers and whether they had coalesced. Dollar spot developed naturally and
uniformly in all years.
During all years, study sites were fertilized as typical golf course fairways (i.e. =
146 kg N ha-1 year-1). The N-source was urea (46-0-0) and was applied in spring and
autumn of each year. Study sites were mowed three times week-1 to a height of 12.7 mm.
Generally, the study sites were mowed about 20 hours after treatments were applied.
Irrigation was applied often due to frequent periods of drought stress in 2002 (218 mm
rainfall during study period). In 2003 and 2004, however, irrigation was seldom needed
because of frequent and abundant rainfall (305 mm and 298 mm during 2003 and 2004
study periods, respectively). In all years, the AM treatments were applied at 0800 hours
and PM treatments were applied after the turf canopy was dry, typically after 1230 hours.

107
In 2003 and 2004, dew was displaced using the straight edge on the reverse side of an
aluminum rake immediately before treatments were applied. Different sites were used
each year and plots were 1.5 m x 1.5 m. In most other studies of this nature, fungicides
were either applied on time or on a specific interval (i.e. 14 day). Hence, if fungicides
were effectively controlling the disease, differences in spray volume may not be detected.
Hence, to best elucidate potential differences among treatments, dollar spot was allowed
to become active and increase to above threshold levels (i.e. ≥ 0.5 % plot area blighted)
before a follow-up application was made. No fungicides were applied to the test sites in
the spring prior to the initiation of each study.
Site Descriptions 2002 Separate areas of ‘Crenshaw’ and ‘L-93’ creeping bentgrass were utilized in 2002.
‘Crenshaw’ was seeded in the spring of 2001 and ‘L-93’ was seeded in autumn of 2000.
Treatments were arranged as a randomized complete block with the ‘Crenshaw’ site
having five replications and the ‘L-93’ four replications. The treatment structure for the
2002 study was a 2 (SV’s) x 2 (AM and PM) factorial. Treatments were as follows:
chlorothalonil applied at 8.0 kg a.i. ha-1 AM in the low SV (468 L ha-1; low-SV) or the
high SV (1020 L ha-1; high-SV), and again to separate plots in the PM of the same day.
This was the only year when there was a no “dew displaced” treatment. Dollar spot was
active for one day before treatments initially were applied. Treatments were applied to
‘Crenshaw’ on 20 June, 21 July, and 23 August and to ‘L-93’ on 20 June and 21 July
2002. Because the ‘L-93’site was severely blighted by 7 August, no further ratings were
obtained thereafter.
2003 A ‘Crenshaw’ creeping bentgrass site seeded in September 2001 was the 2003
study site. The rate of chlorothalonil was reduced from 8.0 to 4.5 kg a.i. ha-1 in 2003.

108
Treatments were as follows: chlorothalonil applied alone in the AM in low-SV or high-
SV and PM on the same day. Propiconazole was applied alone (3.3 kg a.i. ha-1) and the
tank-mix of chlorothalonil and propiconazole (same rates) were applied on the same
timings as previously given for chlorothalonil-alone. The experiment was designed as a
completely randomized design with four replications. The 2003 treatment structure was a
2 (SV’s) x 3 (AM, AM dew displaced, and PM dry) x 4 (chlorothalonil, propiconazole,
tank-mix and untreated control) factorial. The site was treated 18 August 2003 with 5.3
kg a.i. ha-1 flutolanil (N-[3-(1-methylethoxy) phenyl] trifluoromethyl) benzamide) and
0.73 kg a.i. of mefenoxam (R)-2-[2, 6-dimethylphenyl)-methoxyactlamino]-propionic) to
preventively control brown patch (Rhizoctonia solani Kuhn) and Pythium blight (Pythium
spp), respectively.
Dollar spot was not active at the time the 2003 study was initiated. All treatments
were applied initially on 23 July 2003. Chlorothalonil- alone treatments were reapplied
on 7 and 23 August. Propiconazole and tank-mix (propiconazole + chlorothalonil)
treatments only were re-applied on 19 August.
2004 ‘Southshore’ creeping bentgrass, seeded in the autumn of 2002, was used for the
2004 study site. The experimental design and treatment structure were the same as
described for 2003. The rate of propiconazole, however, was reduced from 3.30 to 1.65
kg a.i. ha-1, regardless of whether it was applied alone or tank-mixed with chlorothalonil.
Dollar spot was not visually active when the study began. Treatments were initiated on
12 May 2004. Chlorothalonil treatments were reapplied 4 and 23 June. Propiconazole
and tank-mix treatments were reapplied on 18 June.

109
Dew Measurements Canopy dew measurements were obtained as described by Williams et al. (1998).
Four white, unscented Kimwipe tissues (Kimberly-Clark Corp, Rosewell GA.) were
placed into a zip-lock bag and weighted. Prior to dew removal, the four tissues were
removed from the bag and blotted over 120 cm2 area of an untreated control plot using a
wooden frame as a template. Blotting was carefully performed to accurately measure
canopy dew and not to absorb any moisture from the thatch layer. Tissues then were
placed into the same bag and immediately weighed. The gain in weight was used to
calculate the amount of dew present on the canopy. Data were converted from grams 120
cm-2 to millimeters of moisture as previously described by Williams et al. (1998). Dew
amounts (mm) then were converted into L ha-1 in order to gain a better understanding of
the amount of water in the canopy, which may dilute or in some way impact fungicide
performance.
Ratings and Statistical Analyses Disease ratings were performed twice weekly during all study years. Ratings
were taken by counting the number of S. homoeocarpa infection centers plot-1(IC’s) or by
estimating the percent of plot area blighted (% PAB) once infection centers coalesced.
Percent of plot area blighted was assessed visually on a 0 to 100 scale with 0= no dollar
spot and 100= entire plot area blighted. All dollar spot data were square root transformed
(vx) to correct for normality, however, actual means are shown in the data tables. Area
under the disease progress curve (AUDPC) is a way to integrate data from a study period
into a single value for each treatment. Hence, AUDPC values allow one to assess the
total amount of disease within a treatment over a specified time period. The AUPDC

110
values were calculated according to Campbell and Madden (1990) using the formula ∑
(sum of) [yi + yi+1)/2 [ti+1-ti] where i=1, 2, 3….n-1, yi is the amount of disease (either
infection centers or percent of plot area blighted) and ti is the time of the ith rating.
Values were calculated separately for early season (i.e., infection center data) and late
season (i.e., percent plot area blighted data) data collection periods. The AUDPC values
shown in the data tables represent a sum value, where the larger number represents a
greater amount of disease. Because these treatments were evaluated over the same time
period each year, there is no need to standardize or normalize the data. The 2002 (‘L-93’
site), 2003 and 2004 % PAB AUDPC values include ratings taken 18, 41, and 23 days
after the last fungicide application, respectively. The unit of measure for an AUDPC
value is disease x time, since disease would be shown on the y-axis (either IC or % plot
area blighted) and time (days) on the x-axis of a figure. Data for each year were
individually subjected to analysis of variance (ANOVA) and significantly different
means were separated at P= 0.05 by Turkey’s least significant difference mean
comparison test using the SAS MIXED procedure (SAS version 9.1, SAS Institute; Cary,
NC). Pre-planned orthogonal contrasts in 2002 included: chlorothalonil low-SV versus
high-SV and chlorothalonil AM versus PM treatments. For 2003 and 2004, the pre-
planned orthogonal contrasts evaluated were: chlorothalonil applied in the low-SV versus
high-SV; AM dew present versus AM dew displaced; AM dew present versus PM; AM
dew displaced versus PM; and propiconazole-alone versus propiconazole + chlorothalonil
(averaged over SV’s and timings). The contrasts were performed using ‘estimate’
statements in SAS MIXED procedure.

111
Results Dollar Spot
2002. The 2002 study year was marked by heavy dollar spot pressure in both the
‘L-93’ and ‘Crenshaw’. Data from each cultivar were analyzed separately because the
studies were performed in different locations and had different levels of dollar spot
pressure. Dollar spot became active one day prior to initiating the treatments in both
sties. In 2002, no significant interactions between SV and application timing at both sites
were observed (Table 1 and Appendix Table 3). Therefore, main effects and pre-planned
orthogonal contrasts are discussed. The analyses of variance for application time and SV
data as well as their potential interactions were conducted using only the chlorothalonil
treatments in 2002. This was done because the untreated control had no time of
application or SV that could be included in the analysis (Table 1 and Appendix Table 3).
On certain dates, when there were significant differences among treatments, data in the
tables may not indicate a significant SV effect because of inclusion of data from the
untreated control (Table 2). For this reason, there were no differences in AUDPC values
among chlorothalonil treatments in both sites in 2002 (all data not shown). Therefore, it
is important to examine the pre-planned orthogonal contrasts to determine if differences
due to SV or time of application had occurred.
‘L-93’ Site When treatments initially were applied on 20 June, all plots had similar numbers
of S. homoeocarpa infection centers plot-1 (IC’s, Table 2). On 28 June (eight days after
treatment= 8 DAT), all treatments significantly reduced dollar spot levels, when
compared to the untreated control (Table 2). At this time, the PM application of
chlorothalonil in the lower SV (low-SV, 468 L ha-1) provided better dollar spot

112
suppression (2 IC’s) than both treatments applied in the higher SV (high-SV, 1020 L ha-1;
10 to 12 IC’s, Table 3). On all rating dates in July, all chlorothalonil-treated plots had
similar numbers of IC’s (Table 2, all data not shown, Appendix B Table 3). Contrast
statements for 17 and 19 July, however, showed that better dollar spot control was
provided by chlorothalonil applied in the low-SV, when compared to the high-SV (Table
3). Eight days following re-application (i.e. 29 July), all chlorothalonil treatments
reduced dollar spot levels dramatically (Table 2). Contrast statements comparing the
SV’s on 29 July showed that chlorothalonil applied in the low-SV provided better dollar
spot control (2 to 4 IC’s), when compared to treatments applied in the high-SV (6 to 10
IC’s, Table 3). By 1 August, plots treated with chlorothalonil in the low-SV and both
timings had lower, trace levels of dollar spot (0.0 and 0.3 IC’s), when compared to
treatments applied in the high-SV (3.5 IC’s) and the untreated control (118 IC’s, Table
2). Dollar spot pressure in the following days intensified in all chlorothalonil-treated
plots. On the last rating date (7 August), chlorothalonil applied in the low-SV (16 to 20
IC’s) and in the AM or PM continued to provide better dollar spot control, when
compared to AM treatments applied in the high-SV (34 to 46 IC’s, Table 2).
On six of the nine rating dates, SV contrast statements indicated that
chlorothalonil applied in the low-SV gave better dollar spot control than when applied in
the high-SV on ‘L-93’ creeping bentgrass (Table 3). Time of application (AM vs. PM)
did not influence the performance of chlorothalonil in ‘L-93’. On two dates (i.e., 28 June
and 1 August), however, chlorothalonil applied in the low-SV, PM gave better dollar spot
control than when applied in the high-SV, AM (Table 2).
‘Crenshaw’ Site

113
The ‘Crenshaw’ site also had active dollar spot when the study was initiated (20
June) and all plots had a similar number of IC’s at this time (Table 4). Between 28 June
(8 DAT) and 29 July (eight days after second application), all chlorothalonil-treated plots
had similar levels of dollar spot (all data not shown; Appendix B Table 5). During the
course of the study (20 June to 5 September) there were 14 rating dates and only on 29
July (P=0.05), 1 (P=0.001) and 30 August (P=0.05) were significant contrasts observed
(Appendix Table 6). On 29 July, treatments applied in the low-SV (0.2 IC) gave a higher
level of dollar spot control, when compared to those applied in the high-SV (2.2 to 3.2
IC’s, Table 4). By 1 August, plots treated with chlorothalonil applied in low-SV had
trace dollar spot levels (0.2 IC), while plots receiving both high-SV treatments had 1.6 to
2.0 IC’s. Low-spray volume treatments gave better dollar spot control versus those
applied in high-SV on 1 August (data not shown, Appendix Table 6). On 30 August, the
contrast showed that treatments applied with the low-SV provided better curative dollar
spot control, when compared to those applied in the high-SV. For example, on 30 August
plots treated with chlorothalonil in the low-SV (9 to 15 IC’s) remained close to the
threshold, while plots treated using the high-SV had dollar spot levels above the threshold
(22 and 24 IC’s, Table 4). Time of application again did not appear to influence
fungicide performance. However, on 1 August plots treated in the PM in the high-SV
had a higher level of disease, when compared to all other chlorothalonil treatments. By 5
September, dollar spot was extremely severe and no differences were observed among
chlorothalonil treatments (Table 4).
2003. In 2003, the rate of chlorothalonil was reduced from 8.0 to 4.5 kg a.i. ha-1 in order
to better assess differences among SV and application timing. Also, three new

114
parameters were evaluated as follows: dew displaced, propiconazole-alone (3.3 kg a.i. ha-
1) and a tank-mix of propiconazole (3.3 kg a.i. ha-1) + chlorothalonil (4.5 kg a.i. ha-1).
Treatments initially were applied to ‘Crenshaw’ creeping bentgrass on 23 July, one week
before dollar spot became visually active (data not shown, Appendix B. Table 8). Data
are shown as a percent of plot area blighted by S. homoeocarpa (PAB), because dollar
spot developed in the untreated plots and coalesced before S. homoeocarpa infection
centers developed in fungicide-treated plots. The five, pre-planned orthogonal contrasts
that were evaluated included: chlorothalonil applied in the low-SV versus high-SV; AM
dew present versus AM dew displaced; AM dew present versus PM; AM dew displaced
versus PM; and propiconazole-alone versus propiconazole + chlorothalonil (averaged
over SV’s and timings). On every rating date, except 30 July and 21 August, at least one
of the five contrasts was significant (Table 7, Appendix B. Table 9). There was a
significant fungicide effect on most rating dates because propiconazole and the tank-mix
were providing a higher level of dollar spot control, when compared to chlorothalonil-
alone (Table 5). These differences would be expected since chlorothalonil is a contact
fungicide with a probable shorter period of residual effectiveness.
Chlorothalonil-Alone, Spray Volume Treatments Due to a large number of observations, data from some rating dates were omitted
from Tables 5, 6 and 7 and are shown in Appendix B. From 30 July to 11 August, few
significant differences or interactions were observed among SV and application timing
treatments (data not shown; Appendix B Table 7). On 11 August, however, the contrasts
showed that chlorothalonil applied in the low-SV (0.06% PAB) gave better dollar spot
control, when compared to plots treated with the high-SV (0.20% PAB, Appendix B
Table 8). Dollar spot pressure peaked on 16 August when 7.9% PAB was observed in

115
untreated plots (Table 6). On 16 August, the contrast again showed that chlorothalonil
applied in the low-SV (0.1% PAB) gave slightly yet significantly better dollar spot
control, when compared to plots treated with the high-SV (0.2%PAB, Table 6 and Table
7). Two days after the second application of chlorothalonil (25 Aug), treatments applied
in the low-SV, PM (0.1% PAB) provided better dollar spot control than both AM
treatments applied in the high-SV (>0.9% PAB, Table 6). From 29 August to 1 October,
the SV contrast again revealed that chlorothalonil applied in low-SV provided better
dollar spot control, when compared to treatments applied in the high-SV (Table 7,
Appendix B. Table 9). Contrast statements for the two SV’s showed that on 12 of the 21
rating dates chlorothalonil applied in low-SV provided better dollar spot control, when
compared to chlorothalonil applied in the high-SV (Table 7; Appendix B Table 9).
Contrasts for the AUDPC values also showed that chlorothalonil-alone provided better
(P=0.001) dollar spot control when applied in the PM and in the low-SV, when compared
to AM applications with dew present or displaced or in the high-SV (Table7).
Chlorothalonil-Alone, Dew Treatments Contrast statements showed that there were no differences on any rating date
between chlorothalonil applied in the AM with the dew present versus dew displaced
(Table 7, Appendix B. Table 9). However, contrasts did show that plots treated with
chlorothalonil in the PM provided better dollar spot control, when compared to AM
applications with dew present on 6, 8, 11, 21 and 27 August (Table 7, Appendix B. Table
9). Contrasts for data collected 4, 6, 8, 11, 13 and 21 August also showed that
chlorothalonil applied in the PM provided better dollar spot control, when compared to
AM applications with the dew displaced (Table 7, Appendix B. Table 9).
Propiconazole and Tank-Mix Treatments

116
When comparing the propiconazole-alone treatments among themselves, few
differences were observed throughout 2003 (Table 6, all data not shown, Appendix B.
Table 8). When propiconazole-alone (0.6 % PAB) data were compared to those of the
tank-mix (0.3% PAB), the tank-mix treatments provided better dollar spot control than
propiconazole applied-alone (Table 6). Propiconazole-alone was last applied on 19
August and dollar spot was allowed to progress until 1 October. During this period, no
differences among the application timing and SV treatments were observed (Table 6).
Furthermore, no differences were observed among the tank-mix treatments (Table 6).
When propiconazole-alone and the tank-mix were compared as a contrast, the tank-mix
was shown to have provided better dollar spot control than propiconazole-alone on 9 of
the 21 rating dates (Table 7, Appendix B. Table 9).
2004. In 2003, no differences were observed among propiconazole-alone or the tank-
mix treatments. Therefore, in 2004 the rate of propiconazole was reduced from 3.30 to
1.65 kg a.i. ha-1 for both treatments. Also, the 2004 study was conducted on ‘Southshore’
creeping bentgrass rather than ‘Crenshaw’. All other treatments remained the same as
evaluated in 2003. Treatments initially were applied on 12 May 2004, one week before
dollar spot became visually active. Plots were evaluated for dollar spot 18 times during
2004 (all data not shown, Appendix B Tables 10, 11 and 12). Initially (19 May to 2
June), dollar spot was rated by counting the number of S. homoeocarpa infections centers
plot-1. Dollar spot pressure became severe in the first week of June and untreated plots
had an average of 36 IC’s. Thereafter, ratings were taken as a percent of plot area
blighted by S. homoeocarpa.
Chlorothalonil-Alone, Spray Volume Treatments
117
There were few differences among chemical treatments from 19 May to 28 May
(data not shown, Appendix Table 11). On 2 June, plots treated with chlorothalonil-alone
in the low-SV, PM (0.7 IC’s) had less dollar spot than plots treated in low-SV, AM with
dew present (8.7 IC’s) or in high-SV with dew present (10.2 IC’s) (Table 9). On 13 June
(9 days after the second treatment), 15 and 17 June, the contrast revealed that
chlorothalonil-alone applied in the low-SV provided better dollar spot control, when
compared to the high-SV (Table 9). Dollar spot was allowed to progress above the
threshold following the last application on 23 June. Dollar spot became very severe
during the first half of July and on 9 July 18.8% PAB was observed in untreated plots.
Contrast statements from 7 to 16 July again showed that chlorothalonil provided better
dollar spot when applied in the low-SV versus the high-SV. Hence, on 9 of 18 rating
dates in 2004, chlorothalonil applied in the low-SV provided better dollar spot control,
when compared to treatments applied in the high-SV.
Chlorothalonil-Alone, Dew Treatments On 2 June, the contrast statement revealed that plots treated in the AM with dew
displaced had less dollar spot (4.7 IC’s), when compared to plots treated in the AM with
dew present (9.5 IC’s, Table 9). The contrast also showed that plots treated with
chlorothalonil in the PM (1.9 IC’s) had less dollar spot, when compared to plots treated
with chlorothalonil in the AM with dew displaced (4.7 IC’s, Tables 9 and 10). On 3, 8
and 11 June, plots treated in the PM (0.0-0.3% PAB) had less dollar spot versus those
plots treated in the AM (0.2-0.7% PAB) with dew present (data not shown, Appendix B.
Table 11).
Chlorothalonil treatments were re-applied on 4 June, when plots had reached the
threshold. From 22 June to 2 July, chlorothalonil applied in the PM (0.3-0.7% PAB)

118
provided consistently better dollar spot control, when compared to plots treated in the
AM (0.7-1.1% PAB) with the dew displaced (Table 9). During the later stages of the
epidemic (7 to 16 July), few differences were observed among application timing or dew
treatments (Table 9, all data not shown; Appendix B. Table 11). On 5 of 18 rating dates,
chlorothalonil provided better dollar spot control when applied in the AM with the dew
displaced, when compared to the AM application with the dew present. Also, on 8 of 18
rating dates, chlorothalonil provided better dollar spot control when applied in the PM,
when compared to AM treatments with the dew present.
Propiconazole-alone and Tank-mix Treatments As experienced in 2003, no differences were observed on any rating date when
propiconazole or tank-mix treatments were compared to themselves (Table 9). When
dollar spot first was observed in the propiconazole and tank-mix-treated plots (8 and 11
June, data not shown, Appendix B. Table 11), the contrast revealed that the tank-mix had
provided better dollar spot control than propiconazole-alone. Similar results between the
tank-mix and propiconazole-alone treatments were observed from 22 June to 16 July, and
significant contrast differences occurred on 11 of 18 rating dates (Table 10, all data not
shown, Appendix B. Table 12).
Dew Measurements Dew measurements were taken on four, rain-free days between 4 June and 22
August in both 2003 and 2004. The mean amount of dew quantified was different on
each date, which would be expected in view of varying temperatures, relative humidity
and other environmental factors. Dew levels ranged from 982 L ha-1 to 2,548 L ha-1, with
a mean of 1842 L ha-1 (Figure 1). In Kentucky, Williams et al. (1998) found that the
mean amount of dew on the canopy of fairway height (19 mm) creeping bentgrass was

119
1,945 L ha-1. Hence, these measurements are remarkably similar to those reported by
Williams et al. (1998).

120
Discussion
Spray volumes and application timings were evaluated over a three year period
with two commonly used fungicides for dollar spot control. The magnitude of the
differences in dollar spot levels among treatments in these studies was small because a
reapplication threshold was established. In most golf course settings, an acceptable
threshold for dollar spot damage is less than 0.5 % plot (turf) area blighted. To observe
differences among treatments, however, dollar spot was allowed to become active before
plots were re-treated to remain within the threshold and to avoid excessive blighting.
In all three study years, chlorothalonil-alone provided better dollar spot control
when applied in 468 versus 1020 L ha-1. Couch (1984) previously reported that
chlorothalonil provided better dollar spot control using a similar SV (i.e. 407 L ha-1),
when compared to higher amounts (814, 1628, 3256, 6512 and 13,030 L ha-1). Other
researchers, however, observed that there were no differences in the level of dollar spot
control provided by chlorothalonil using various SV’s (Ashbaugh and Larson, 1982;
Gregos et al., 2000; Vincelli et al., 2003). Applying chlorothalonil to a dry turfgrass
canopy in the PM also increased efficacy, when compared to both AM (dew present and
dew displaced) treatments. In 2003, there were no dollar spot differences on any rating
date between AM dew present and AM dew displaced treatments using chlorothalonil.
On five of sixteen rating dates in 2004, however, chlorothalonil applied in the AM with
the dew displaced resulted in better dollar spot control, when compared to AM
applications with the dew present. While there was no consistent benefit provided by
displacing the dew between years, 2004 data suggested that displacing dew can be
beneficial when using chlorothalonil-alone. In general, the 2003 and 2004 data indicate

121
that applying chlorothalonil in the low-SV and in the PM extends the level of acceptable
(i.e. threshold of < 0.5 PAB) dollar spot control by an average of 2 to 4 days, when
compared to high-SV and AM treatments (all data not shown; Appendix Tables 8 and
11). As previously noted, the amount of dew present in the canopy ranged between 982
L ha-1 and 2,548 L ha-1. Displacement when dew levels are high may still result in large
amounts of water remaining within the lower canopy or thatch, which could reduce the
effectiveness of chlorothalonil. Apparently, significant amounts of chlorothalonil did not
adhere to the foliage when it was applied in the higher SV or in the presence of dew.
Differences in the dew displacement treatments between years (2003 and 2004) may be
attributed to the amount of moisture remaining following displacement, differences in the
amount of active ingredient applied, or bentgrass cultivar. Hence, to optimize
chlorothalonil performance when targeting dollar spot, it should be applied to a dry
canopy in 468 L ha-1 rather than 1020 L ha-1.
No differences were observed in the level of dollar spot control in either year
among dew and SV treatments using propiconazole-alone. Evidently, SV and the
presence of dew did not affect the ability of effective, fungicidal levels of propiconazole
to penetrate plants and move acropetally. Couch (1984) found that the acropetal
penetrant triadimefon, with the same mode of action as propiconazole, performed best
when applied in 815 L ha-1, when compared to 204, 407, 1628, 3256, 6512 and 13,030 L
ha-1. The 815 L ha-1 SV was between the 468 and 1020 L ha-1 SV evaluated in this study.
Vincelli et al. (2003), however, found that triadimefon provided equal levels of dollar
spot control in 407 and 815 L ha-1. Difference between our results and those of Vincelli
et al. (2003) and Couch (1984) could possibly be attributed to differences in disease

122
severity, chemistry, amount of active ingredient applied, formulation, surfactants and
other unknown factors. There also were no differences among dew or SV treatments
with propiconazole + chlorothalonil in either study year. During 2003 and 2004 the tank-
mix, however, provided better and extended levels of dollar spot control on 29 of 39
rating dates, when compared to propiconazole-alone. Hence, data generally have shown
that the presence or absence of dew and the two SV’s assessed did not affect the level of
dollar spot control provided by either propiconazole or propiconazole + chlorothalonil.
Summary
This is the first reported study that evaluated the influence of both dew and SV on
the level of dollar spot control provided by a contact and penetrant fungicide alone or in a
tank-mix combination. Data clearly showed that golf course superintendents can
effectively use 468 L ha-1 SV for targeting dollar spot with the fungicides evaluated. This
information is very important since using 1020 L ha-1 would require about twice the
amount of water. Since golf course fairways typically range between 61 and 74 ha,
applying fungicides in the higher SV would require the input of substantially more time,
labor, fuel and equipment. These results pertain only to dollar spot control in creeping
bentgrass with chlorothalonil and propiconazole. Sclerotinia homoeocarpa initially
attacks foliage, but can eventually infect crown tissue. Other turfgrass pathogens that
primarily infect stem and/or root tissue may be more efficaciously controlled by
fungicides applied in higher SV’s.

123
Table 1. Influence of spray volume and application timing on the level of dollar spot control provided by chlorothalonil in ‘L-93’ creeping bentgrass, 2002. Source of variation† 20 June 28 June 29 July 1 Aug 7 Aug AUDPC
Application time NS NS NS NS NS NS
Spray volume NS * ** ** * *§
Spray volume* application time NS NS NS NS NS NS † Chlorothalonil was applied 20 June and 21 July 2002 at a rate of 8.0 kg a.i. ha-1. § On certain dates when significant differences between spray volumes had occurred the ANOVA may not indicate a significant spray volume effect because of inclusion of the untreated control data. *, **, ***, and NS refer to significance level at the 0.05, 0.01, 0.001 levels and non-significant; respectively

124
Table 2. Number of Sclerotinia homoeocarpa infection centers as influenced by chlorothalonil, application timing and spray volume in ‘L-93’ creeping bentgrass, 2002. Timing Spray volume†
S. homoeocarpa infection centers plot-1
20 June 28 June 29 July 1 August 7 August (L ha -1) (no.) AM§ 468 12.3 a‡ 3.8 bc 1.8 d 0.0 c 15.8 d AM 1020 14.0 a 11.5 b 10.3 b 3.5 b 45.8 b PM ¶ 468 11.0 a 2.0 c 3.5 cd 0.3 c 19.8 cd PM 1020 9.3 a 10.0 b 6.0 bc 3.5 b 33.5 bc - Untreated control 9.3 a 26.0 a 120.5 a 117.8 a 116.5 a - P>F 0.7883 0.0021 0.001 0.001 0.0001 † Chlorothalonil (8.0 kg a.i. ha-1) timing and spray volume treatments were applied 20 June and 21 July 2002. ‡ Means in the same column followed by the same letter are not significantly different at P <0.05 according to Tukey’s protected least significant difference test. Data were analyzed using a square root transformation, but data in columns are actual means. § AM treatments were applied in early morning with dew present on the canopy. ¶ PM treatments were applied in the afternoon to a dry canopy.

125
Table 3. Pre-planned orthogonal contrasts for chlorothalonil applied in two spray volumes and application timings and their effect on dollar spot in ‘L-93’ creeping bentgrass, 2002. Contrast 20 June 28 June 17 July 19 July 29 July 1 Aug 7 Aug AUDPC
Chlorothalonil† 468 vs. 1020 L ha-1 NS‡ * * * ** *** ** *
Chlorothalonil† AM vs. PM NS NS NS NS NS NS NS NS †Chlorothalonil (8.0 kg a.i. ha-1) was applied 20 June and 21 July 2002. ‡ *, **, ***, and NS refer to significance level at the 0.05, 0.01, 0.001 levels and non-significant; respectively.
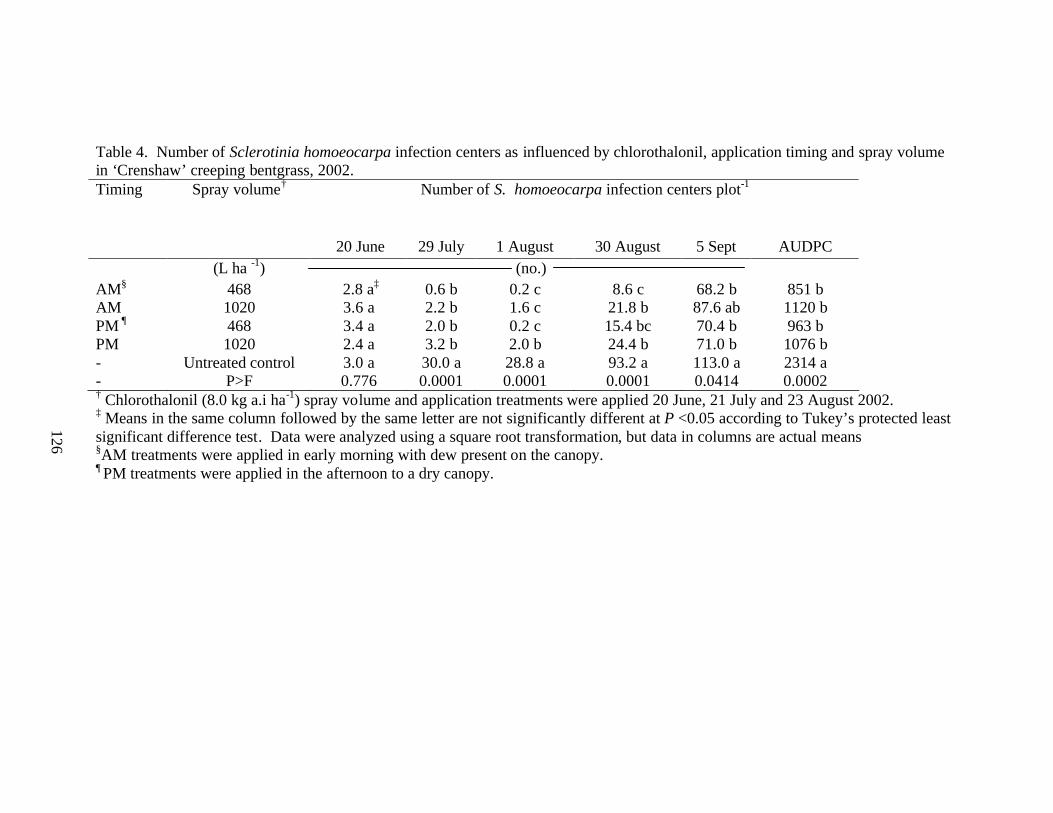
126
Table 4. Number of Sclerotinia homoeocarpa infection centers as influenced by chlorothalonil, application timing and spray volume in ‘Crenshaw’ creeping bentgrass, 2002. Timing Spray volume†
Number of S. homoeocarpa infection centers plot-1
20 June 29 July 1 August 30 August 5 Sept AUDPC (L ha -1) (no.) AM§ 468 2.8 a‡ 0.6 b 0.2 c 8.6 c 68.2 b 851 b AM 1020 3.6 a 2.2 b 1.6 c 21.8 b 87.6 ab 1120 b PM ¶ 468 3.4 a 2.0 b 0.2 c 15.4 bc 70.4 b 963 b PM 1020 2.4 a 3.2 b 2.0 b 24.4 b 71.0 b 1076 b - Untreated control 3.0 a 30.0 a 28.8 a 93.2 a 113.0 a 2314 a - P>F 0.776 0.0001 0.0001 0.0001 0.0414 0.0002 † Chlorothalonil (8.0 kg a.i ha-1) spray volume and application treatments were applied 20 June, 21 July and 23 August 2002. ‡ Means in the same column followed by the same letter are not significantly different at P <0.05 according to Tukey’s protected least significant difference test. Data were analyzed using a square root transformation, but data in columns are actual means §AM treatments were applied in early morning with dew present on the canopy. ¶ PM treatments were applied in the afternoon to a dry canopy.

127
Table 5. Influence of spray volume and application timing on the level of dollar spot control provided by chlorothalonil, propiconazole and the propiconazole + chlorothalonil tank-mix in ‘Crenshaw’ creeping bentgrass, 2003. Source of variation 16 Aug 18 Aug 25 Aug 29 Aug 4 Sept 7 Sept 10 Sept 12 Sept 22 Sept 29 Sept 1 Oct AUDPC
Fungicide† ***§ *** *** *** *** *** *** *** *** *** *** *** Spray volume (SV)
*** *** ** NS *** *** *** *** *** *** ** *** Dew ‡
NS NS NS NS NS NS NS ** ** ** NS ** Fungicide*SV
NS NS *** ** *** *** *** * NS NS NS * Fungicide*dew
NS NS NS NS NS ** NS NS * NS NS ** SV*dew
NS NS NS NS NS NS NS NS NS NS NS NS Fungicide*SV*dew
NS NS NS NS NS NS NS NS NS NS NS NS †Chlorothalonil-alone (4.5 kg a.i. ha-1) treatments were re-applied on 23 July and 7 and 23 August, 2003. Propiconazole (3.3 kg a.i. ha-1) and propiconazole (3.3 kg a.i. ha-1) + chlorothalonil (4.5 kg a.i. ha-1) were applied on 23 July and 19 August 2003. ‡ The dew source of variation included three variables: AM dew present, AM dew displaced and PM dry. § *, **, ***, and NS refer to the 0.05, 0.01, 0.001 significance levels and non-significant, respectively.

128
Table 6. Percent of plot area blighted by Sclerotinia homoeocarpa as influenced by fungicides, spray volume, and application timing where dew was either present or absent in ‘Crenshaw’ creeping bentgrass, 2003. Plot area blighted by S. homoeocarpa¶ Fungicide
Dew/displaced /none
Timing
L ha-1
16 Aug
18 Aug
25 Aug
4 Sept
% Chlorothalonil † Dew AM 468 0.1 de§ 0.3 bc 0.5 bcd 0.3 c Chlorothalonil Displaced AM 468 0.1 de 0.3 bc 0.4 bcd 0.3 c Chlorothalonil None PM 468 0.1 e 0.1 c 0.1 cd 0.2 c Propiconazole ‡ Dew AM 468 0.4 b-e 0.4 bc 0.0 d 0.0 c Propiconazole Displaced AM 468 0.5 b-e 0.4 bc 0.0 d 0.0 c Propiconazole None PM 468 0.5 bcd 0.5 bc 0.0 d 0.0 c Propiconazole + Chlorothalonil ‡ Dew AM 468 0.2 b-e 0.3 bc 0.0 d 0.0 c Propiconazole + Chlorothalonil Displaced AM 468 0.1 cde 0.2 bc 0.0 d 0.0 c Propiconazole + Chlorothalonil None PM 468 0.1 cde 0.2 bc 0.0 d 0.0 c Chlorothalonil Dew AM 1020 0.3 b-e 0.2 bc 1.0 b 1.1 b Chlorothalonil Displaced AM 1020 0.3 b-e 0.6 bc 0.9 b 1.1 b Chlorothalonil None PM 1020 0.1 cde 0.2 bc 0.5 bc 0.3 bc Propiconazole Dew AM 1020 0.6 bc 0.7 bc 0.0 d 0.0 c Propiconazole Displaced AM 1020 0.8 b 0.8 bc 0.0 d 0.0 c Propiconazole None PM 1020 0.6 bcd 0.9 b 0.0 d 0.0 c Propiconazole + Chlorothalonil Dew AM 1020 0.4 b-e 0.6 bc 0.0 d 0.0 c Propiconazole + Chlorothalonil Displaced AM 1020 0.3 b-e 0.3 bc 0.0 d 0.0 c Propiconazole + Chlorothalonil None PM 1020 0.4 b-e 0.5 bc 0.0 d 0.0 c Untreated control - - - 7.9 a 7.7 a 4.0 a 3.4 a P>F .0001 .0001 .0001 .0001 † Chlorothalonil–alone (4.5 kg a.i. ha-1) treatments were applied on 23 July, and 7 and 23 August 2003. ‡Propiconazole (3.3 kg a.i. ha-1) and propiconazole (3.3 kg a.i. ha-1) + chlorothalonil (4.5 kg a.i. ha-1) were applied on 23 July and 19 August 2003. § Means in the same column followed by the same letter are not significantly different at P <0.05 according to Tukey’s protected least significant difference test. Data were analyzed using a square root transformation, but data in columns are actual means. ¶ Dollar spot was rated visually on a 0 to100 scale with 0= no blighting, 0.5= dollar spot threshold in fairway turf and 100= 100% of plot area blighted by S. homoeocarpa.

129
Table 6 (cont’d). Percent of plot area blighted by Sclerotinia homoeocarpa as influenced by fungicides, spray volume, and application timing where dew was either present or absent in ‘Crenshaw’ creeping bentgrass, 2003. Plot area blighted by S. homoeocarpa¶ Fungicide
Dew/displaced/none
Timing
L ha-1
12 Sept
22 Sept
1 Oct
AUDPC
% % blighted x time Chlorothalonil † Dew AM 468 1.0 bc§ 2.8 ab 4.1 abc 2979 bc Chlorothalonil Displaced AM 468 0.8 bcd 2.4 a-d 3.5 a-d 2660 c Chlorothalonil None PM 468 0.5 cde 1.0 b-f 3.3 a-e 1213 cd Propiconazole‡ Dew AM 468 0.2 ef 0.4 def 0.9 ef 566 d Propiconazole Displaced AM 468 0.1 ef 0.4 def 1.0 def 608 d Propiconazole None PM 468 0.1 ef 0.3 ef 0.8 ef 493 d Propiconazole + Chlorothalonil ‡ Dew AM 468 0.0 f 0.2 f 0.9 ef 330 d Propiconazole + Chlorothalonil Displaced AM 468 0.0 f 0.2 f 0.8 f 212 d Propiconazole + Chlorothalonil None PM 468 0.0 f 0.2 f 0.7 f 204 d Chlorothalonil Dew AM 1020 1.7 b 3.9 a 6.2 a 5233 b Chlorothalonil Displaced AM 1020 1.6 b 5.0 a 5.4 ab 5200 b Chlorothalonil None PM 1020 1.1 bc 2.0 a-e 3.8 abc 2506 c Propiconazole Dew AM 1020 0.4 cde 0.9 b-f 1.6 c-f 1192 cd Propiconazole Displaced AM 1020 0.4 cde 0.9 b-f 1.5 c-f 1147 cd Propiconazole None PM 1020 0.3 def 0.7 b-f 1.4 c-f 1299 cd Propiconazole + Chlorothalonil Dew AM 1020 0.1 ef 0.5 c-f 1.1 def 577 d Propiconazole + Chlorothalonil Displaced AM 1020 0.1 ef 0.5 def 0.8 f 516 d Propiconazole + Chlorothalonil None PM 1020 0.0 f 0.3 f 0.8 f 484 d Untreated control - - - 3.4 a 2.6 abc 2.2 b-f 12292 a P>F .0001 .0001 .0001 .0001 † Chlorothalonil–alone (4.5 kg a.i. ha-1) treatments were applied on 23 July, and 7 and 23 August 2003. ‡Propiconazole (3.3 kg a.i. ha-1) and propiconazole (3.3 kg a.i. ha-1) + chlorothalonil (4.5 kg a.i. ha-1) were applied on 23 July and 19 August 2003. § Means in the same column followed by the same letter are not significantly different at P <0.05 according to Tukey’s protected least significant difference test. Data were analyzed using a square root transformation, but data in columns are actual means. ¶ Dollar spot was rated visually on a 0 to100 scale with 0= no blighting, 0.5= dollar spot threshold in fairway turf and 100= 100% of plot area blighted by S. homoeocarpa.

130
Table 7. Pre-planned orthogonal contrasts among spray volume, application timing and fungicide treatments and their effect on dollar spot control in ‘Crenshaw’ creeping bentgrass, 2003. Contrast Rating Date
Chlorothalonil 468 vs. 1020
L ha-1†
Chlorothalonil AM dew present vs. AM
dew displaced†
Chlorothalonil AM dew present vs. PM
†
Chlorothalonil AM dew displaced vs. PM
†
Propiconazole vs. propiconazole + chlorothalonil‡
11 August **§ NS * * NS 13 August NS NS NS * * 16 August ** NS NS NS *** 18 August NS NS NS NS *** 7 September *** NS ** ** * 10 September *** NS ** * * 12 September *** NS ** * *** 29 September ** NS ** ** NS 1 October ** NS ** ** NS AUDPC *** NS *** *** ** † Chlorothalonil–alone (4.5 kg a.i. ha-1) treatments were applied on 23 July and 7 and 23 August 2003. ‡ Propiconazole (3.3 kg a.i. ha-1) and propiconazole (3.3 kg a.i. ha-1) + chlorothalonil (4.5 kg a.i. ha-1) were applied on 23 July and 19 August 2003. § *, **, ***, and NS refer to the 0.05, 0.01, 0.001 significance levels and non-significant, respectively.

131
Table 8. Influence of spray volume and application timing on the level of dollar spot control provided by chlorothalonil, propiconazole and the propiconazole + chlorothalonil tank-mix in ‘Southshore’ creeping bentgrass, 2004. Source of variation 13 June 15 June 17 June 22 June 25 June 2 July 9 July 12 July 16 July PAB
AUDPC Fungicide† NS§ *** *** ** *** *** *** *** *** ***
Spray volume (SV) ** NS NS ** ** NS ** ** *** ***
Dew¶ NS NS NS NS NS * * NS NS *
Fungicide*SV NS * NS NS NS NS * ** *** *
Fungicide*dew NS NS NS NS NS * NS * NS *
SV*dew NS NS NS NS NS NS NS NS NS NS
Fungicide*SV*dew NS NS NS NS NS NS NS NS NS NS †Chlorothalonil–alone (4.5 kg a.i. ha-1) treatments were applied on 12 May, 4 and 23 June 2004. Propiconazole (1.65 kg a.i. ha-1) and the tank-mix were applied on 12 May and 18 June 2004. ¶ The dew source of variation included three variables: AM dew present, AM dew displaced and PM dry. § *, **, ***, and NS refer to the 0.05, 0.01, 0.001 significance levels and non-significant, respectively.
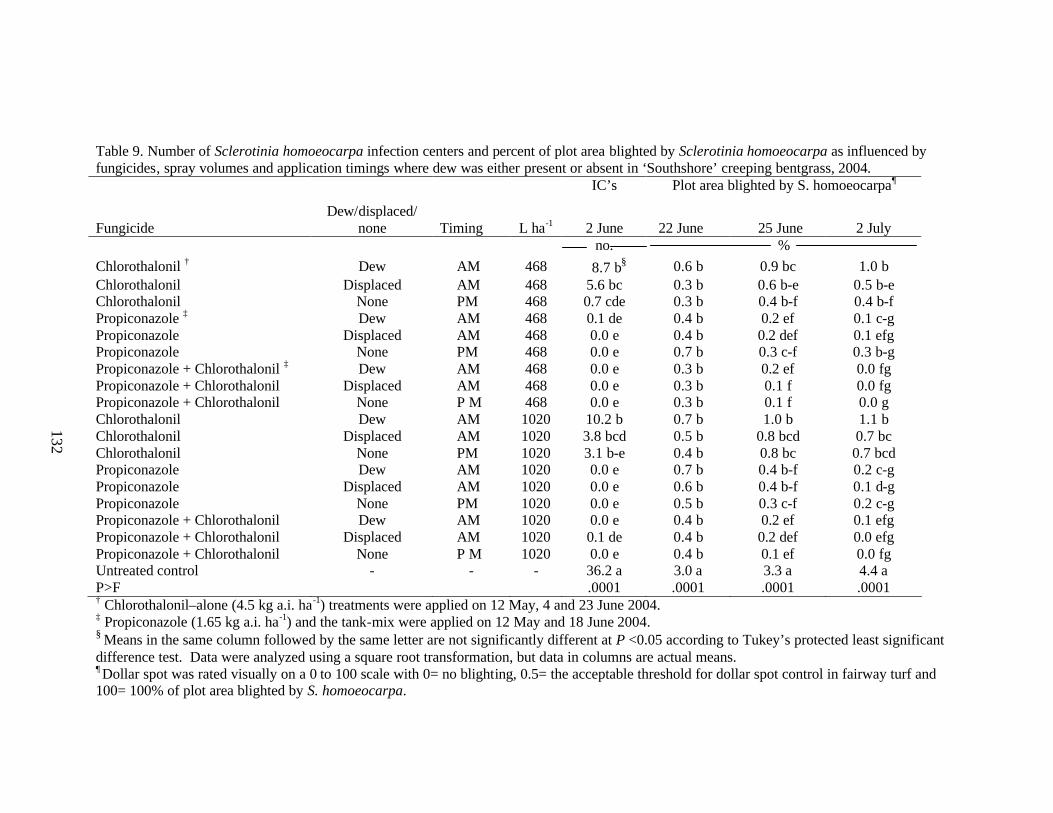
132
Table 9. Number of Sclerotinia homoeocarpa infection centers and percent of plot area blighted by Sclerotinia homoeocarpa as influenced by fungicides, spray volumes and application timings where dew was either present or absent in ‘Southshore’ creeping bentgrass, 2004. IC’s Plot area blighted by S. homoeocarpa¶
Fungicide
Dew/displaced/ none
Timing
L ha-1
2 June
22 June
25 June
2 July
no. % Chlorothalonil † Dew AM 468 8.7 b§ 0.6 b 0.9 bc 1.0 b Chlorothalonil Displaced AM 468 5.6 bc 0.3 b 0.6 b-e 0.5 b-e Chlorothalonil None PM 468 0.7 cde 0.3 b 0.4 b-f 0.4 b-f Propiconazole ‡ Dew AM 468 0.1 de 0.4 b 0.2 ef 0.1 c-g Propiconazole Displaced AM 468 0.0 e 0.4 b 0.2 def 0.1 efg Propiconazole None PM 468 0.0 e 0.7 b 0.3 c-f 0.3 b-g Propiconazole + Chlorothalonil ‡ Dew AM 468 0.0 e 0.3 b 0.2 ef 0.0 fg Propiconazole + Chlorothalonil Displaced AM 468 0.0 e 0.3 b 0.1 f 0.0 fg Propiconazole + Chlorothalonil None P M 468 0.0 e 0.3 b 0.1 f 0.0 g Chlorothalonil Dew AM 1020 10.2 b 0.7 b 1.0 b 1.1 b Chlorothalonil Displaced AM 1020 3.8 bcd 0.5 b 0.8 bcd 0.7 bc Chlorothalonil None PM 1020 3.1 b-e 0.4 b 0.8 bc 0.7 bcd Propiconazole Dew AM 1020 0.0 e 0.7 b 0.4 b-f 0.2 c-g Propiconazole Displaced AM 1020 0.0 e 0.6 b 0.4 b-f 0.1 d-g Propiconazole None PM 1020 0.0 e 0.5 b 0.3 c-f 0.2 c-g Propiconazole + Chlorothalonil Dew AM 1020 0.0 e 0.4 b 0.2 ef 0.1 efg Propiconazole + Chlorothalonil Displaced AM 1020 0.1 de 0.4 b 0.2 def 0.0 efg Propiconazole + Chlorothalonil None P M 1020 0.0 e 0.4 b 0.1 ef 0.0 fg Untreated control - - - 36.2 a 3.0 a 3.3 a 4.4 a P>F .0001 .0001 .0001 .0001 † Chlorothalonil–alone (4.5 kg a.i. ha-1) treatments were applied on 12 May, 4 and 23 June 2004. ‡ Propiconazole (1.65 kg a.i. ha-1) and the tank-mix were applied on 12 May and 18 June 2004. § Means in the same column followed by the same letter are not significantly different at P <0.05 according to Tukey’s protected least significant difference test. Data were analyzed using a square root transformation, but data in columns are actual means. ¶ Dollar spot was rated visually on a 0 to 100 scale with 0= no blighting, 0.5= the acceptable threshold for dollar spot control in fairway turf and 100= 100% of plot area blighted by S. homoeocarpa.

133
Table 9 (cont’d). Percent of plot area blighted by Sclerotinia homoeocarpa as influenced by fungicides, spray volumes and application timings where dew was either present or absent in ‘Southshore’ creeping bentgrass, 2004 Plot area blighted by S. homoeocarpa¶ Fungicide
Dew/ displaced/ none
Timing
L ha-1
9 July
12 July
16 July
AUDPC
% % blighted x time Chlorothalonil † Dew AM 468 2.1 bcd§ 2.0 bcd 2.2 b-e 42 bc Chlorothalonil Displaced AM 468 1.8 b-f 1.6 b-e 2.0 b-e 31 b-e Chlorothalonil None PM 468 1.6 b-f 1.5 b-e 1.5 b-e 26 c-f Propiconazole ‡ Dew AM 468 1.2 c-g 1.0 cde 1.4 b-e 20 c-f Propiconazole Displaced AM 468 1.0 d-h 1.0 cde 1.0 de 19 c-f Propiconazole None PM 468 1.4 b-f 1.5 b-e 1.5 b-e 27 b-f Propiconazole + Chlorothalonil ‡ Dew AM 468 0.3 gh 0.5 e 0.8 e 11 ef Propiconazole + Chlorothalonil Displaced AM 468 0.2 h 0.4 e 0.9 e 9 f Propiconazole + Chlorothalonil None PM 468 0.4 fgh 0.7 de 0.9 e 12 ef Chlorothalonil Dew AM 1020 3.0 b 2.9 b 3.5 b 58 b Chlorothalonil Displaced AM 1020 1.9 b-e 1.9 bcd 2.7 bcd 29 bcd Chlorothalonil None PM 1020 2.5 bc 2.3 bc 3.1 bc 44 bc Propiconazole Dew AM 1020 1.3 c-f 1.2 b-e 1.5 b-e 26 c-f Propiconazole Displaced AM 1020 1.0 d-h 1.2 b-e 1.4 cde 24 c-f Propiconazole None PM 1020 1.4 b-f 1.0 cde 1.4 cde 23 c-f Propiconazole + Chlorothalonil Dew AM 1020 0.4 fgh 0.6 de 0.9 e 14 ef Propiconazole + Chlorothalonil Displaced AM 1020 0.4 fgh 0.7 de 0.8 e 14 ef Propiconazole + Chlorothalonil None PM 1020 0.8 e-h 0.8 cde 0.9 e 15 def Untreated control - - - 18.8 a 12.5 a 10.6 a 267 a P>F .0001 .0001 .0001 .0001 † Chlorothalonil–alone (4.5 kg a.i. ha-1) treatments were applied on 12 May, 4 and 23 June 2004. ‡ Propiconazole (1.65 kg a.i. ha-1) and the tank-mix were applied on 12 May and 18 June 2004.
§ Means in the same column followed by the same letter are not significantly different at P <0.05 according to Tukey’s protected least significant difference test. Data were analyzed using a square root transformation, but data in columns are actual means. ¶ Dollar spot was rated visually on a 0 to100 scale with 0= no blighting, 0.5= dollar spot threshold in fairway turf and 100= 100% of plot area blighted by S. homoeocarpa.

134
Table 10. Pre-planned orthogonal contrasts among spray volume, application timing and fungicide treatments and their effect on dollar spot control in ‘Southshore’ creeping bentgrass, 2004. Contrast Date Chlorothalonil
468 vs. 1020 L ha-1 †
Chlorothalonil AM dew present vs. AM
dew displaced †
Chlorothalonil AM dew present vs. PM †
Chlorothalonil AM dew displaced vs.
PM †
Propiconazole vs. propiconazole + chlorothalonil ‡
24 May NS NS NS * NS 2 June NS ** *** * NS 3 June NS NS ** NS NS 8 June NS NS * NS * 11 June NS NS * NS * 13 June * NS NS NS NS 15 June *** NS NS NS * 17 June ** NS NS NS NS 22 June NS * ** NS *** 25 June * NS ** NS ** 30 June * ** ** NS *** 2 July NS * ** NS *** 7 July ** NS NS NS *** 9 July * * NS NS *** 12 July * NS NS NS ** 16 July *** NS NS NS *** PAB AUDPC ** * ** NS *** † Chlorothalonil–alone (4.5 kg a.i. ha-1) treatments were applied on 12 May, 4 and 23 June, 2004. ‡ Propiconazole (1.65 kg a.i. ha-1) and the tank-mix were applied on 12 May and 18 June, 2004. § *, **, ***, and NS refer to the 0.05, 0.01, 0.001 significance levels and non-significant; respectively.

135
Figure 1. Dew Measurements
0
500
1000
1500
2000
2500
3000
Low spray volume
High spray volume
23-Jul-03 7-Aug-03 19-Aug-03 22-Aug-03 12-May-04 4-Jun-04 18-Jun-04 23-Jun-04
Measurement date and spray volume equivalent
Lit
ers
hec
tacr
e-1

136
Appendix A. Table 1. Fungicide and herbicide applications made to the irrigation study site between 2002 and 2004. Date(s) Chemical
Name Full IUPAC name Rate Target
5 June, 3 July 2002 and 9 and 24 June 2004
Flutolanil N-[3-(1-methylethoxy) phenyl ]-2-(trifluoromethyl) benzamid
8.0 kg ha-1 Brown patch (Rhizoctonia solani Kuhn)
20 April 2003 Chlorothalonil + propiconazole
tetrachloroisophthalonitrile + (1-[[2-(2,4-dichlorophenyl)-4-propyl-1,3-dioxolan-2-yl]methyl]-1H-1,2,4-triazole
10.2 + 1.1 kg a.i. ha-
1 Dollar spot (Sclerotinia homoeocarpa F.T. Bennett)
15 May 2003, 24 October and 10 November 2004
Chlorothalonil tetrachloroisophthalonitrile 10.2 kg a.i. ha-1 Dollar spot and seedling diseases
22 May 2003 9 and 24 June 2004
Mefenoxam (R)-20[2, 6-dimethylphenyl)-methoxyacetylamino]-propionic
1.1 kg a.i. ha-1 Pythium blight (Pythium spp.)
24 June 2003 15 May 2004
2, 4-D + MCPP + dicamba
dimethylamine salt of 2, 4, dichlorophenoxyacetic acid); MCPP (dimethylamine salt of (+)-(R)-2-(2-methyl-4-chlorophenoxy) propionic acid) and dicamba (dimethylamine salt (3, 6-dichloro-o-anisic acid
3.18 kg ha-1 Broadleaf weeds
11 July 2003† Fenoxaprop-ethyl
(+)-ethyl2-[4[(6-chloro-2-benzoaczolyl) oxy] propanoate
1.5 kg a.i. ha-1 Smooth crabgrass (Digitaria ischaemum Schreb.)
14 July 2003 Halosulfuron 3-chloro-5-(4,6-dimethoxypyrimidin-2-ylcarbamoylsulfamoyl)-1-methylpyrazole-4-carboxylic acid
2.0 kg a.i. ha-1 Yellow nutsedge (Cyperus esculentus L.)
† Only perennial ryegrass plots were treated.

137
Appendix A. Table 1 (cont’d). Fungicide and herbicide applications made to the irrigation study site between 2002 and 2004. Date(s) Chemical Name Full IUPAC name Rate Target 25 July 2003 9 June and 10 August 2004
Deltamethrin (s)-alpha-cyano-3-phenoxybenzyl (1R, 3R)-3-(2-2-dibro movinyl)-2, 2-dimethyl-cyclopropanecar.
0.004 kg a.i. ha-1 Black cutworms (Agrotis ipsilon Hufnagel)
6 and 29 August 2003 Iprodione† (3-(3.5-dichlorophenyl)-H-(1-methylethyl)-2, 4dioxo-1-imidazolidinecarboxamide)
6.1 kg a.i. ha-1 Dollar spot
21 April, 10 May and 1 June 2002; 27 April, 18 May and 8 June 2004
Siduron 1-(2-methylcyclohexyl)-3-phenylurea
8.9 kg a.i. ha-1 Smooth crabgrass (Digitaria ischaemum Schreb)
July 14 2004 Propamocarb propyl 3-(dimethylamino) propylcarbamate
3.9 kg a.i. ha-1 Pythium blight (Pythium spp.)
† Only perennial ryegrass plots were treated.

138
Appendix A. Table 2. Fertilizer applications made to the irrigation study site between 2002 and 2004. Date(s) of application ¶ Analysis Amount (kg N ha-1) Composition and sources 5, 7 April and 17 May, and 14 June 2002
19-4-8 24.0, 24.0, 24.0, 24.0
14.4% ammonical N, 1.6% urea N, 4 % P2O5, 8 % K2O, 15% S and small amounts of Fe and Mn
6 June 2002 19-0-19 24.0 2.0% urea N, 17.0 % sulfur coated urea N, 19.0% soluble potash, 16.0 % sulfur and small amounts of Fe and Cl)
15 April 2003 (Starter fertilizer) ‡
19-25- 5 48.8 4.3% ammoniacal N, 7.4% urea N, 6.3% other water soluble N, 1.0% water insoluble N and 1.8% combined S
5 May†, 3 June†, 7 July 2003† 4 and 11 May 2004
20-20-20 24.0, 48.8, 12.2, 12.2, 12.2
3.95 % ammonical N, 9.8% urea N, 6.25% nitrate N, 20% P2O5, 20 % K2O and small amounts of B, Cu, Fe, Mn, Mo and Zn
27 June and 8 September 2003 17, 21 and 28 May 2004
46-0-0 24.4 and 48.8 24.4, 24.4, 24.4
46% urea N
10 November 2003 (Complete fertilizer)
18-24-12 49 9% ammonical N, 9 %urea N; 4.5% slowly available N, 24% P2O5, 12% K2O
19 April 2004 18-18-18 24.4 7.04% ammonical nitrogen 10.96% urea nitrogen † Denotes application dates where perennial ryegrass plots only received fertilizer. ‡ Denoted application dates where creeping bentgrass only received fertilizer. ¶ To prevent any turf burning if needed, all fertilizer applications were watered-in immediately after application.

139
Appendix A. Table 3. Total estimate evapotranspiration (ET) at the experimental site during the study period (2002-2004).
† Evapotranspiration was estimated using an atmometer (ET Gauge, Spectrum Technologies, Inc. Plainfield, IL.) located next to the rainfall gauge and within 20 meters of the center of the study site.
Month Total estimated ET (mm)† 2002
June 66 July 130 August 106 September 80 Total 382
2003 June 53 July 68 August 76 September 38 Total 235
2004 June 83 July 92 August 58 September 42 Total 275

140
Appendix A. Table 4. Number Sclerotinia homoeocarpa infection centers as influenced by irrigation, chlorothalonil, paclobutrazol and wetting agent, 2002. Treatment† Rate ha-1 3 July 19 July 29 July 7 August Chemical no. S. homoeocarpa infection centers plot-1 Chlorothalonil 8.0 kg a.i. 0.0 a‡ 0.0 a 0.1 b 0.1 ab Paclobutrazol (PB) 0.12 kg a.i. 0.0 a 0.1 a 0.8 ab 0.4 ab Primer Select (WA) 6.3 L prod. 0.0 a 0.0 a 0.8 ab 0.4 ab Chlorothalonil + PB 8.0 + 0.12 kg a.i. 0.0 a 0.0 a 0.1 b 0.0 b Chlorothalonil + WA 8.0 kg a.i. + 6.3 L 0.0 a 0.0 a 0.4 ab 0.1 ab Chlorothalonil + PB + WA 8.0 + 0.12 kg a.i. + 6.3 L 0.0 a 0.0 a 0.0 b 0.2 ab Untreated - 0.0 a 0.1 a 1.8 a 2.3 a Irrigation Frequent 0.0 a 0.0 a 0.6 a 0.5 a Infrequent 0.0 a 0.1 a 0.4 a 0.5 a ANOVA Irrigation (I) NS§ NS NS NS Chemical (C) NS NS *** * I*C NS NS NS NS
†Treatments were applied on a 14-day interval beginning 17 June and ending 26 August 2002. ‡ Means in the same column followed by the same letter are not significantly different at P <0.05 according to Tukey’s protected least significant difference test. Data were analyzed using a square root transformation, but actual means are shown. § *, **, ***, and NS refer to the 0.05, 0.01, 0.001 significance levels and non-significant, respectively.

141
Appendix A. Table 5. Number of Sclerotinia homoeocarpa infection centers and percent of plot area blighted by dollar spot as influenced by irrigation, chlorothalonil, paclobutrazol and a wetting agent in ‘Crenshaw’ creeping bentgrass, 2003. Treatment† Rate ha-1 12 June 19 June 26 June Chemical no. of S. homoeocarpa IC’s % plot area blighted Chlorothalonil 8.0 kg a.i. 1.6 b‡ 0.1 b 0.1 c Paclobutrazol (PB) 0.12 kg a.i. 13.0 a 3.8 a 3.9 b Primer Select (WA) 6.3 L prod. 23.4 a 4.9 a 6.3 ab Chlorothalonil + PB 8.0 + 0.12 kg a.i. 1.5 b 0.1 b 0.0 c Chlorothalonil + WA 8.0 kg a.i. + 6.3 L 1.4 b 0.1 b 0.0 c Chlorothalonil + PB + WA 8.0 + 0.12 kg a.i. + 6.3 L 1.6 b 0.1 b 0.0 c Untreated - 35.4 a 5.0 a 12.2 a Irrigation Frequent 13.2 a 2.5 a 3.8 a Infrequent 8.9 a 1.4 a 2.7 a ANOVA Irrigation (I) NS§ NS NS Chemical (C) *** *** *** I*C NS NS NS
† Treatments were applied on a 14-day interval beginning 10 July and ending 21 August. ‡ Means in the same column followed by the same letter are not significantly different at P <0.05 according to Tukey’s protected least significant difference test. Data were analyzed using a square root transformation, but actual means are shown. § *, **, ***, and NS refer to the 0.05, 0.01, 0.001 significance levels and non-significant, respectively.

142
Appendix A. Table 6. Percent of plot area blighted by Sclerotinia homoeocarpa as influenced by irrigation, chlorothalonil, paclobutrazol and a wetting agent in ‘Crenshaw’ creeping bentgrass, 2003. Treatment† Rate ha -1 21 August 27 August Chemical % of plot area blighted Chlorothalonil 8.0 kg a.i. 0.2 c‡ 0.0 b Paclobutrazol (PB) 0.12 kg a.i. 5.9 b 3.4 a Primer Select (WA) 6.3 L prod. 9.9 a 5.9 a Chlorothalonil + PB 8.0 + 0.12 kg a.i. 0.1 c 0.0 b Chlorothalonil + WA 8.0 kg a.i. + 6.3 L 0.1 c 0.0 b Chlorothalonil + PB + WA 8.0 + 0.12 kg a.i. + 6.3 L 0.1 c 0.0 b Untreated - 12.4 a 7.3 a Irrigation 4.3 a 2.1 a Frequent 3.9 a 2.3 a Infrequent ANOVA Irrigation NS§ NS Chemical *** *** I*C NS NS
† Treatments were applied on a 14-day interval beginning 10 July and ending 21 August. ‡ Means in the same column followed by the same letter are not significantly different at P <0.05 according to Tukey’s protected least significant difference test. Data were analyzed using a square root transformation, but actual means are shown. § *, **, ***, and NS refer to the 0.05, 0.01, 0.001 significance levels and non-significant, respectively.

143
Appendix A. Table 7. Number of Sclerotinia homoeocarpa infection centers as influenced by irrigation, chlorothalonil, paclobutrazol and wetting agent in ‘Brightstar’ perennial ryegrass, 2003. Treatment† 31 July Rate ha -1 Frequent Infrequent Chemical No. of S. homoeocarpa infection centers plot-1 Chlorothalonil 8.0 kg a.i. 0.0 a‡ 0.75 a Paclobutrazol (PB) 0.12 kg a.i. 0.0 a 0.0 a Primer Select (WA) 6.3 L prod. 0.0 a 1.8 a Chlorothalonil + PB 8.0 + 0.12 kg a.i. 0.0 a 0.0 a Chlorothalonil + WA 8.0 kg a.i. + 6.3 L 0.0 a 0.0 a Chlorothalonil + PB + WA 8.0 + 0.12 kg a.i. + 6.3 L 0.0 a 0.0 a Untreated - 0.0 a 0.8 a Irrigation Frequent 0.0 a Infrequent 0.6 a ANOVA Irrigation NS§ Chemical * I*C *
† Treatments were applied on a 14-day interval beginning 10 July and ending 21 August. ‡ Means in the same column followed by the same letter are not significantly different at P <0.05 according to Tukey’s protected least significant difference test. Data were analyzed using a square root transformation, but actual means are shown. § *, **, ***, and NS refer to the 0.05, 0.01, 0.001 significance levels and non-significant, respectively.

144
Appendix A. Table 8. Number of Sclerotinia homoeocarpa infection centers as influenced by irrigation, chlorothalonil, paclobutrazol and wetting agent in ‘Southshore’ creeping bentgrass, 2004. Treatment† Rate ha -1 7 June 22 June 29 June 6 July 13 July Chemical no. S. homoeocarpa infections centers plot-1 Chlorothalonil 4.5 kg a.i. 0.0 a‡ 0.0 a 0.0 a 0.1 b 0.5 ab Paclobutrazol (PB) 0.12 kg a.i. 0.0 a 0.0 a 0.5 a 1.4 b 2.9 ab Primer Select (WA) 6.3 L prod. 0.0 a 0.0 a 0.6 a 8.8 a 6.5 ab Chlorothalonil + PB 4.5 + 0.12 kg a.i. 0.0 a 0.0 a 0.0 a 0.0 b 0.3 b Chlorothalonil + WA 4.5 kg a.i. + 6.3 L 0.0 a 0.0 a 0.0 a 0.1 b 1.5 ab Chlorothalonil + PB + WA 4.5 + 0.12 kg a.i. + 6.3 L 0.0 a 0.0 a 0.0 a 0.0 b 1.9 ab Untreated - 0.0 a 0.0 a 0.9 a 6.6 a 6.9 a Irrigation Frequent 0.0 a 0.0 a 0.5 a 2.7 a 3.4 a Infrequent 0.0 a 0.0 a 0.0 a 2.1 a 2.3 a ANOVA Irrigation NS§ NS NS§ NS NS Chemical NS NS NS *** *** I*C NS NS NS NS NS
†Treatments were applied on a 14-day interval beginning 1 June and ending 16 August. ‡ Means in the same column followed by the same letter are not significantly different at P <0.05 according to Tukey’s protected least significant difference test. Data were analyzed using a square root transformation, but actual means are shown. § *, **, ***, and NS refer to the 0.05, 0.01, 0.001 significance levels and non-significant, respectively.

145
Appendix A. Table 9. Percent of plot area blighted by Sclerotinia homoeocarpa as influenced by irrigation, chlorothalonil, paclobutrazol and a wetting agent in ‘Southshore’ creeping bentgrass, 2004. Treatment† 9 September 22 September Rate ha -1 17 August Frequent Infrequent Frequent Infrequent Chemical % of plot area blighted Chlorothalonil 4.5 kg a.i. 1.0 bc‡ 3.2 c 5.5 bc 15.5 a 19.8 b Paclobutrazol (PB) 0.12 kg a.i. 1.9 b 8.3 b 9.0 b 15.5 a 23.3 b Primer Select (WA) 6.3 L prod. 4.1 a 15.8 a 39.5 a 15.0 a 61.0 a Chlorothalonil + PB 4.5 + 0.12 kg a.i. 0.5 c 1.9 c 2.0 c 13.0 a 7.8 c Chlorothalonil + WA 4.5 kg a.i. + 6.3 L 1.1 bc 4.9 bc 7.2 b 19.5 a 17.8 b Chlorothalonil + PB + WA 4.5 + 0.12 kg a.i. + 6.3 L 0.9 c 2.0 c 7.1 c 13.5 a 17.0 c Untreated - 5.0 a 17.5 a 51.0 a 15.8 a 41.3 a Irrigation Frequent 1.9 a 7.6 b 15.4 b Infrequent 2.2 a 17.4 a 30.5 a ANOVA Irrigation NS§ * * Chemical *** *** *** I*C NS *** ***
†Treatments were applied on a 14-day interval beginning 1 June and ending 16 August. ‡ Means in the same column followed by the same letter are not significantly different at P <0.05 according to Tukey’s protected least significant difference test. Data were analyzed using a square root transformation, but actual means are shown. § *, **, ***, NS and refer to significant at the 0.05, 0.01, 0.001, non-significant, respectively.

146
Appendix A. Table 10. Number of Sclerotinia homoeocarpa infection centers as influenced by irrigation, chlorothalonil, paclobutrazol and a wetting agent in ‘Figaro’ perennial ryegrass, 2004. Treatment† Rate ha -1 6 July 13 July 2 August Chemical No. of S. homoeocarpa infection centers plot-1 Chlorothalonil 4.5 kg a.i. 0.0 c‡ 0.0 b 0.0 b Paclobutrazol (PB) 0.12 kg a.i. 0.0 c 0.0 b 0.5 b Primer Select (WA) 6.3 L prod. 2.0 b 2.1 ab 2.5 a Chlorothalonil + PB 4.5 + 0.12 kg a.i. 0.0 c 0.0 b 0.0 b Chlorothalonil + WA 4.5 kg a.i. + 6.3 L 0.0 c 0.5 b 0.0 b Chlorothalonil + PB + WA 4.5 + 0.12 kg a.i. + 6.3 L 0.0 c 0.0 b 0.0 b Untreated - 4.8 a 5.1 a 5.5 a Irrigation Frequent 0.4 a 0.7 a 0.9 a Infrequent 1.4 a 1.5 a 1.4 a ANOVA Irrigation NS§ NS NS Chemical *** *** *** I*C NS NS NS
† Treatments were applied on a 14-day interval beginning 1 June and ending 16 August. ‡ Means in the same column followed by the same letter are not significantly different at P <0.05 according to Tukey’s protected least significant difference test. Data were analyzed using a square root transformation, but actual means are shown. § *, **, ***, NS and refer to significant at the 0.05, 0.01, 0.001, non-significant, respectively.
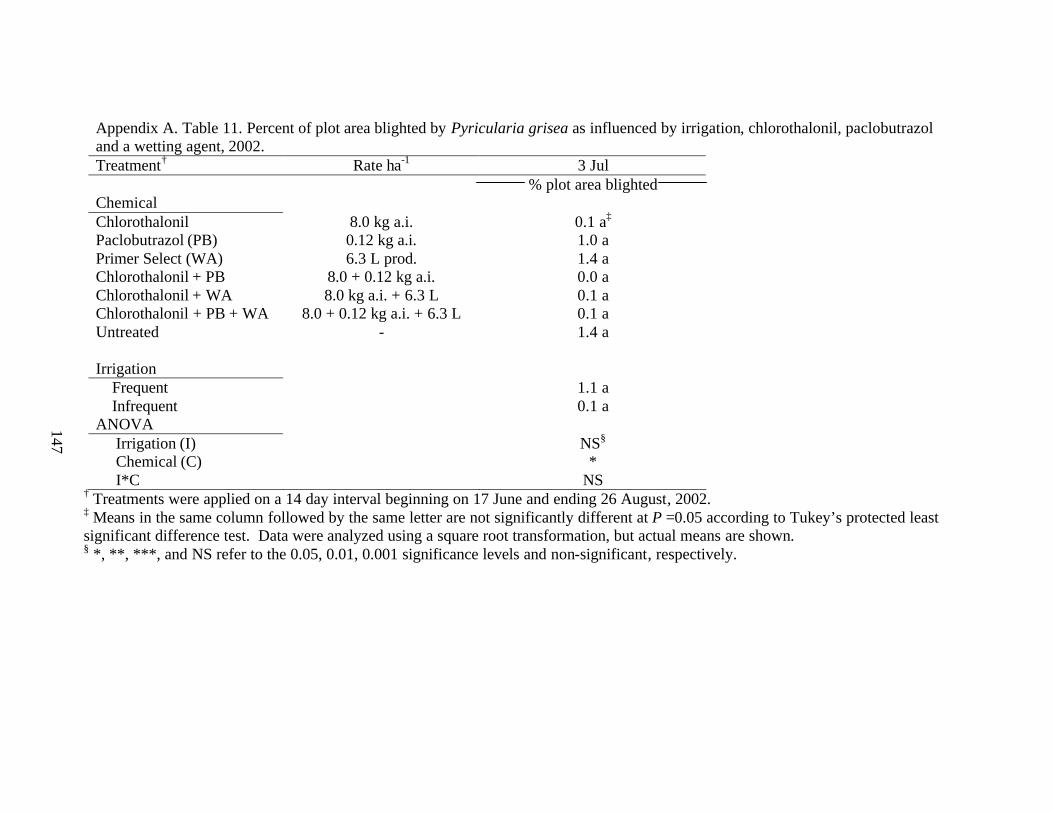
147
Appendix A. Table 11. Percent of plot area blighted by Pyricularia grisea as influenced by irrigation, chlorothalonil, paclobutrazol and a wetting agent, 2002. Treatment† Rate ha-1 3 Jul % plot area blighted Chemical Chlorothalonil 8.0 kg a.i. 0.1 a‡ Paclobutrazol (PB) 0.12 kg a.i. 1.0 a Primer Select (WA) 6.3 L prod. 1.4 a Chlorothalonil + PB 8.0 + 0.12 kg a.i. 0.0 a Chlorothalonil + WA 8.0 kg a.i. + 6.3 L 0.1 a Chlorothalonil + PB + WA 8.0 + 0.12 kg a.i. + 6.3 L 0.1 a Untreated - 1.4 a Irrigation Frequent 1.1 a Infrequent 0.1 a ANOVA Irrigation (I) NS§ Chemical (C) * I*C NS
† Treatments were applied on a 14 day interval beginning on 17 June and ending 26 August, 2002. ‡ Means in the same column followed by the same letter are not significantly different at P =0.05 according to Tukey’s protected least significant difference test. Data were analyzed using a square root transformation, but actual means are shown. § *, **, ***, and NS refer to the 0.05, 0.01, 0.001 significance levels and non-significant, respectively.

148
Appendix A. Table 12. Percent of plot area blighted by Pyricularia grisea as influenced by irrigation, chlorothalonil, paclobutrazol and wetting agent, 2004. Treatment† 27 July Rate ha-1† 20 July 22 July Frequent Infrequent 2 August 17 August Chemical % plot area blighted Chlorothalonil 8.0 kg a.i. 0.0 a‡ 0.0 a 0.0 a 0.0 a 0.0 b 0.0 b Paclobutrazol (PB) 0.12 kg a.i. 0.0 a 0.1a 0.2 a 0.0 a 0.6 ab 6.2 a Primer Select (WA) 6.3 L prod. 0.1 a 0.1 a 0.3 a 0.0 a 1.6 a 5.4 a Chlorothalonil + PB 8.0 + 0.12 kg a.i. 0.0 a 0.0 a 0.0 a 0.0 a 0.0 b 0.0 b Chlorothalonil + WA 8.0 kg a.i. + 6.3 L 0.0 a 0.0 a 0.1 a 0.0 a 0.0 b 0.0 b Chlorothalonil + PB + WA 8.0 + 0.12 kg a.i. + 6.3 L 0.0 a 0.0 a 0.0 a 0.0 a 0.0 b 0.0 b Untreated - 0.1 a 0.1 a 0.2 a 0.0 a 0.4 ab 3.7 a Irrigation Frequent 0.1 a 0.1 a 0.2 a 0.4 a 2.4 a Infrequent 0.0 a 0.0 a 0.0 b 0.0 a 1.9 a ANOVA Irrigation (I) NS§ NS * NS NS Chemical (C) * NS * *** *** I*C NS NS * NS NS
† All chlorothalonil treatments were applied at 4.5 kg a.i. ha-1 on 1, 15 and 29 June and 15 July 2004. On 20, 28 July and 6 and 16 August 2004, all chlorothalonil treatments were applied at 8.0 kg a.i. ha-1. Paclobutrazol and wetting agent-alone were applied on a 14 day interval beginning 1 June and ending 16 August. ‡ Means in the same column followed by the same letter are not significantly different at P =0.05 according to Tukey’s protected least significant difference test. Data were analyzed using a square root transformation, but actual means are shown. § *, **, ***, and NS refer to the 0.05, 0.01, 0.001 significance levels and non-significant, respectively.
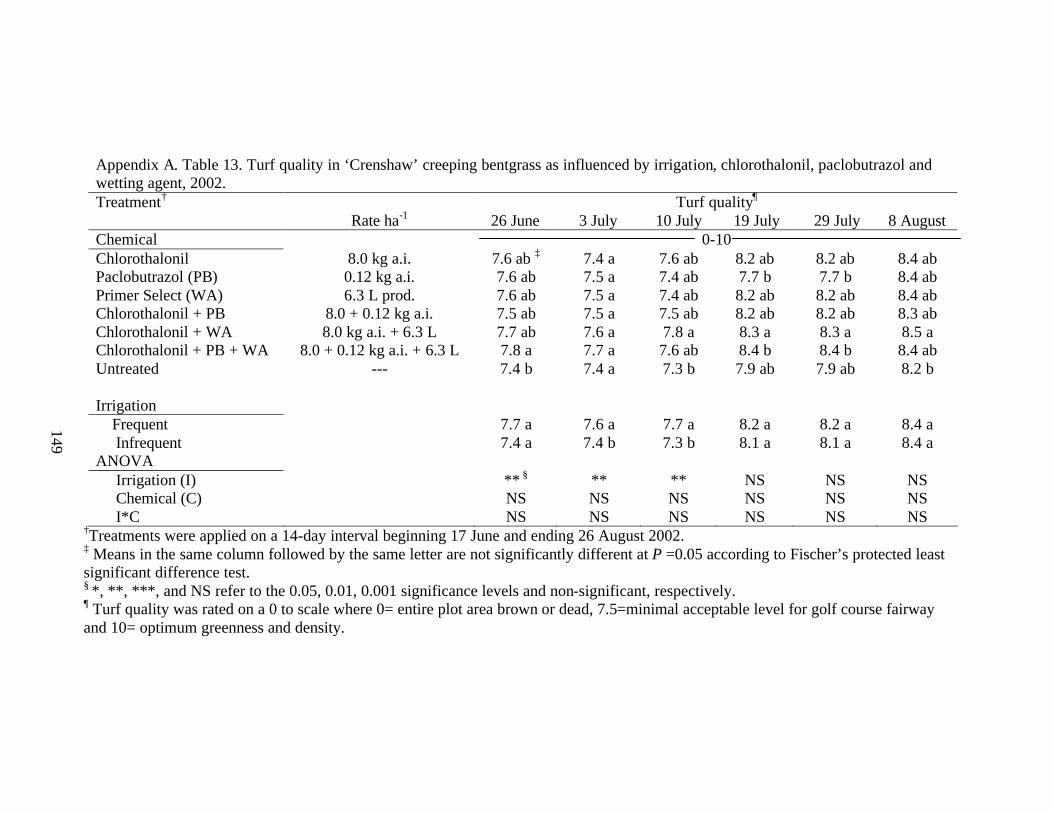
149
Appendix A. Table 13. Turf quality in ‘Crenshaw’ creeping bentgrass as influenced by irrigation, chlorothalonil, paclobutrazol and wetting agent, 2002. Treatment† Turf quality¶ Rate ha-1 26 June 3 July 10 July 19 July 29 July 8 August Chemical 0-10 Chlorothalonil 8.0 kg a.i. 7.6 ab ‡ 7.4 a 7.6 ab 8.2 ab 8.2 ab 8.4 ab Paclobutrazol (PB) 0.12 kg a.i. 7.6 ab 7.5 a 7.4 ab 7.7 b 7.7 b 8.4 ab Primer Select (WA) 6.3 L prod. 7.6 ab 7.5 a 7.4 ab 8.2 ab 8.2 ab 8.4 ab Chlorothalonil + PB 8.0 + 0.12 kg a.i. 7.5 ab 7.5 a 7.5 ab 8.2 ab 8.2 ab 8.3 ab Chlorothalonil + WA 8.0 kg a.i. + 6.3 L 7.7 ab 7.6 a 7.8 a 8.3 a 8.3 a 8.5 a Chlorothalonil + PB + WA 8.0 + 0.12 kg a.i. + 6.3 L 7.8 a 7.7 a 7.6 ab 8.4 b 8.4 b 8.4 ab Untreated --- 7.4 b 7.4 a 7.3 b 7.9 ab 7.9 ab 8.2 b Irrigation Frequent 7.7 a 7.6 a 7.7 a 8.2 a 8.2 a 8.4 a Infrequent 7.4 a 7.4 b 7.3 b 8.1 a 8.1 a 8.4 a ANOVA Irrigation (I) ** § ** ** NS NS NS Chemical (C) NS NS NS NS NS NS I*C NS NS NS NS NS NS
†Treatments were applied on a 14-day interval beginning 17 June and ending 26 August 2002. ‡ Means in the same column followed by the same letter are not significantly different at P =0.05 according to Fischer’s protected least significant difference test. § *, **, ***, and NS refer to the 0.05, 0.01, 0.001 significance levels and non-significant, respectively. ¶ Turf quality was rated on a 0 to scale where 0= entire plot area brown or dead, 7.5=minimal acceptable level for golf course fairway and 10= optimum greenness and density.

150
Appendix A. Table 13 (Cont’d). Turf quality in ‘Crenshaw’ creeping bentgrass as influenced by irrigation, chlorothalonil, paclobutrazol and wetting agent, 2002. Treatment† Turf quality¶ 22 August 29 August Rate ha-1 16 August Frequent Infrequent Frequent Infrequent 13 September Chemical 0-10 Chlorothalonil 8.0 kg a.i. 8.1 a‡ 8.5 a 8.5 a 8.3 a 8.3 a 9.3 a Paclobutrazol (PB) 0.12 kg a.i. 8.0 a 8.5 a 8.5 a 7.9 ab 7.9 ab 8.0 b Primer Select (WA) 6.3 L prod. 8.1 a 8.3 a 8.3 a 7.3 bc 7.3 bc 6.5 c Chlorothalonil + PB 8.0 + 0.12 kg a.i. 8.1 a 8.5 a 8.5 a 8.4 a 8.4 a 9.8 a Chlorothalonil + WA 8.0 kg a.i. + 6.3 L 8.1 a 8.5 a 8.5 a 8.3 a 8.3 a 9.4 a Chlorothalonil + PB + WA 8.0 + 0.12 kg a.i. + 6.3 L 8.0 a 8.5 a 8.5 a 7.9 ab 7.9 ab 9.8 a Untreated --- 7.8 b 7.5 b 7.5 b 7.0 c 7.0 c 5.7 d Irrigation Frequent 8.0 a§ 8.3 a 7.9 a 8.3 a Infrequent 8.0 a 7.9 b 7.8 a 8.4 a ANOVA Irrigation (I) NS§ *** *** NS Chemical (C) NS *** *** *** I*C NS *** *** ***
†Treatments were applied on a 14-day interval beginning 17 June and ending 26 August 2002. ‡ Means in the same column followed by the same letter are not significantly different at P =0.05 according to Fischer’s protected least significant difference test. § *, **, ***, and NS refer to the 0.05, 0.01, 0.001 significance levels and non-significant, respectively. ¶ Turf quality was rated on a 0 to scale where 0= entire plot area brown or dead, 7.5=minimal acceptable level for golf course fairway and 10= optimum greenness and density.

151
Appendix A. Table 13 (Cont’d). Turf quality in ‘Crenshaw’ creeping bentgrass as influenced by irrigation, chlorothalonil, paclobutrazol and wetting agent, 2002. Treatment† Turf quality¶ 23 September 1 October Rate ha-1 Frequent Infrequent Frequent Infrequent 25 October Chemical 0-10 Chlorothalonil 8.0 kg a.i. 9.5 a‡ 9.5 a 8.6 a 8.3 b 9.9 a Paclobutrazol (PB) 0.12 kg a.i. 6.0 b 5.4 b 5.5 b 5.7 c 9.2 b Primer Select (WA) 6.3 L prod. 6.0 b 4.4 c 5.6 b 4.6 dc 8.9 b Chlorothalonil + PB 8.0 + 0.12 kg a.i. 9.9 a 9.8 a 9.3 a 9.8 a 9.8 a Chlorothalonil + WA 8.0 kg a.i. + 6.3 L 9.3 a 9.5 a 9.0 a 8.6 b 9.8 a Chlorothalonil + PB + WA 8.0 + 0.12 kg a.i. + 6.3 L 9.8 a 10.0 a 8.7 a 9.9 a 9.8 a Untreated --- 5.0 c 3.6 d 4.9 b 3.6 d 8.3 c Irrigation Frequent 7.4 b 7.2 a 9.4 a Infrequent 7.9 a 7.4 a 9.4 a ANOVA Irrigation (I) **§ NS NS Chemical (C) *** *** *** I*C ** * NS
†Treatments were applied on a 14-day interval beginning 17 June and ending 26 August 2002. ‡ Means in the same column followed by the same letter are not significantly different at P =0.05 according to Fischer’s protected least significant difference test. §*, **, ***, and NS refer to the 0.05, 0.01, 0.001 significance levels and non-significant, respectively. ¶ Turf quality was rated on a 0 to scale where 0= entire plot area brown or dead, 7.5=minimal acceptable level for golf course fairway and 10= optimum greenness and density.

152
Appendix A. Table 14. Turf quality in ‘Crenshaw’ creeping bentgrass as influenced by irrigation, chlorothalonil, paclobutrazol and wetting agent, 2003. Treatment† Turf quality¶ Rate ha-1 24 July 31 July 6 August 13 August 21 August 27 August Chemical 0-10 Chlorothalonil 8.0 kg a.i. 9.1 a‡ 8.8 a 8.6 a 8.8 a 8.6 a 8.7 a Paclobutrazol (PB) 0.12 kg a.i. 8.1 b 7.2 c 6.8 b 6.7 b 6.9 b 7.1 b Primer Select (WA) 6.3 L prod. 7.9 b 6.5 d 6.2 c 6.0 c 6.1 c 6.4 c Chlorothalonil + PB 8.0 + 0.12 kg a.i. 9.2 a 8.6 ab 8.6 a 9.0 a 8.9 a 9.0 a Chlorothalonil + WA 8.0 kg a.i. + 6.3 L 9.0 a 8.6 ab 8.7 a 8.8 a 8.6 a 8.8 a Chlorothalonil + PB + WA 8.0 + 0.12 kg a.i. + 6.3 L 9.1 d 8.2 b 8.6 a 9.0 a 8.9 a 9.0 a Untreated --- 7.9 b 6.6 d 5.8 c 5.6 c 5.4 d 6.0 d Irrigation Frequent 8.6 a 7.7 a 7.5 a 7.7 a 7.6 a 7.9 a Infrequent 8.6 a 7.8 a 7.7 a 7.7 a 7.6 a 7.8 a ANOVA Irrigation (I) NS§ NS NS NS NS NS Chemical (C) *** *** *** *** *** *** I*C NS NS NS NS NS NS
†Treatments were applied on a 14-day interval beginning 17 June and ending 26 August 2002. ‡ Means in the same column followed by the same letter are not significantly different at P =0.05 according to Fischer’s protected least significant difference test. § *, **, ***, and NS refer to the 0.05, 0.01, 0.001 significance levels and non-significant, respectively. ¶ Turf quality was rated on a 0 to scale where 0= entire plot area brown or dead, 7.5=minimal acceptable level for golf course fairway and 10= optimum greenness and density.

153
Appendix A. Table 14 (Cont’d). Turf quality in ‘Crenshaw’ creeping bentgrass as influenced by irrigation, chlorothalonil, paclobutrazol and wetting agent, 2003. Treatment† Turf quality¶ 15 September Rate ha-1 5 September Frequent Infrequent Chemical 0-10 Chlorothalonil 8.0 kg a.i. 8.8 a‡ 7.7 bc 8.5 a Paclobutrazol (PB) 0.12 kg a.i. 7.1 b 7.2 cd 6.9 b Primer Select (WA) 6.3 L prod. 6.6 c 6.8 d 6.2 c Chlorothalonil + PB 8.0 + 0.12 kg a.i. 8.9 a 8.2 ab 8.8 a Chlorothalonil + WA 8.0 kg a.i. + 6.3 L 8.8 a 8.0 ab 8.6 a Chlorothalonil + PB + WA 8.0 + 0.12 kg a.i. + 6.3 L 9.0 a 8.6 a 8.9 a Untreated --- 6.6 c 6.9 d 6.2 c Irrigation Frequent 7.9 a 7.6 a Infrequent 8.0 a 7.7 a ANOVA Irrigation (I) NS§ NS Chemical (C) *** *** I*C NS **
†Treatments were applied on a 14-day interval beginning 17 June and ending 26 August 2002. ‡ Means in the same column followed by the same letter are not significantly different at P =0.05 according to Fischer’s protected least significant difference test. § *, **, ***, and NS refer to the 0.05, 0.01, 0.001 significance levels and non-significant, respectively. ¶ Turf quality was rated on a 0 to scale where 0= entire plot area brown or dead, 7.5=minimal acceptable level for golf course fairway and 10= optimum greenness and density.

154
Appendix A. Table 15. Turf quality in ‘Crenshaw’ creeping bentgrass as influenced by irrigation, chlorothalonil, paclobutrazol and wetting agent, 2004. Treatment† Turf quality¶ Rate ha-1 7 June 15 June 22 June 29 June 6 July 13 July Chemical 0-10 Chlorothalonil 8.0 kg a.i. 8.6 a‡ 9.1 a 9.2 ab 9.4 a 9.3 a 9.2 ab Paclobutrazol (PB) 0.12 kg a.i. 8.6 a 9.1 a 9.4 a 9.5 a 9.2 a 9.2 ab Primer Select (WA) 6.3 L prod. 8.7 a 9.0 a 9.2 ab 9.4 a 8.9 b 8.9 c Chlorothalonil + PB 8.0 + 0.12 kg a.i. 8.6 a 8.9 a 9.3 a 9.4 a 9.3 a 9.3 ab Chlorothalonil + WA 8.0 kg a.i. + 6.3 L 8.6 a 9.0 a 9.2 ab 9.4 a 9.3 a 9.2 b Chlorothalonil + PB + WA 8.0 + 0.12 kg a.i. + 6.3 L 8.6 a 9.0 a 9.3 ab 9.5 a 9.4 a 9.4 a Untreated --- 8.6 a 9.0 a 9.1 b 9.4 a 8.9 b 9.0 c Irrigation Frequent 8.6 b 8.9 b 9.2 b 9.4 a 9.1 b 9.1 b Infrequent 8.7 a 9.2 a 9.3 a 9.4 a 9.3 a 9.3 a ANOVA Irrigation (I) * § *** * NS ** *** Chemical (C) NS NS NS NS *** *** I*C NS NS NS NS NS NS
†Treatments were applied on a 14-day interval beginning 17 June and ending 26 August 2002. ‡ Means in the same column followed by the same letter are not significantly different at P =0.05 according to Fischer’s protected least significant difference test. § *, **, ***, and NS refer to the 0.05, 0.01, 0.001 significance levels and non-significant, respectively. ¶ Turf quality was rated on a 0 to scale where 0= entire plot area brown or dead, 7.5=minimal acceptable level for golf course fairway and 10= optimum greenness and density.

155
Appendix A. Table 15 (cont’d). Turf quality in ‘Crenshaw’ creeping bentgrass as influenced by irrigation, chlorothalonil, paclobutrazol and wetting agent, 2004. Treatment† Turf quality¶ Rate ha-1 20 July 27 July 2 August 9 August 17 August 24 August Chemical 0-10 Chlorothalonil 8.0 kg a.i. 9.4 ab‡ 9.1 a 9.3 a y 9.3 a 9.0 a 9.2 a Paclobutrazol (PB) 0.12 kg a.i. 9.4 ab 9.0 ab 9.0 a 8.4 b 8.3 b 7.7 b Primer Select (WA) 6.3 L prod. 8.9 c 8.6 b 7.4 b 6.7 c 7.3 c 6.1 c Chlorothalonil + PB 8.0 + 0.12 kg a.i. 9.5 a 9.1 a 9.5 a 9.4 a 9.2 a 9.3 a Chlorothalonil + WA 8.0 kg a.i. + 6.3 L 9.3 b 9.2 a 9.3 a 9.2 a 9.1 a 9.1 a Chlorothalonil + PB + WA 8.0 + 0.12 kg a.i. + 6.3 L 9.4 ab 9.4 a 9.4 a 9.4 a 9.3 a 9.4 a Untreated --- 9.0 c 8.6 b 7.7 b 6.5 c 7.5 c 6.1 c Irrigation Frequent 9.2 a 8.8 b 8.7 a 8.3 b 8.4 a 8.1 a Infrequent 9.3 a 9.1 a 8.9 a 8.6 a 8.7 a 8.2 a ANOVA Irrigation (I) NS§ * NS z * NS NS Chemical (C) *** ** *** *** *** *** I*C NS NS NS NS NS NS
†Treatments were applied on a 14-day interval beginning 17 June and ending 26 August 2002. ‡ Means in the same column followed by the same letter are not significantly different at P =0.05 according to Fischer’s protected least significant difference test. § *, **, ***, and NS refer to the 0.05, 0.01, 0.001 significance levels and non-significant, respectively. ¶ Turf quality was rated on a 0 to scale where 0= entire plot area brown or dead, 7.5=minimal acceptable level for golf course fairway and 10= optimum greenness and density.

156
Appendix A. Table 15 (cont’d). Turf quality in ‘Crenshaw’ creeping bentgrass as influenced by irrigation, chlorothalonil, paclobutrazol and wetting agent, 2004. Treatment† Turf quality¶ 9 September 13 September Rate ha-1 30 August 3 September Frequent Infrequent Frequent Infrequent Chemical 0-10 Chlorothalonil 8.0 kg a.i. 9.3 a‡ 9.3 b 8.4 a 7.1 b 7.7 a 7.0 b Paclobutrazol (PB) 0.12 kg a.i. 9.0 b 8.4 b 7.0 b 6.6 a 7.1 a 6.1 c Primer Select (WA) 6.3 L prod. 7.4 c 6.7 c 5.3 c 4.3 c 5.5 b 2.9 d Chlorothalonil + PB 8.0 + 0.12 kg a.i. 9.5 a 9.4 a 8.4 a 8.8 b 8.2 a 8.6 a Chlorothalonil + WA 8.0 kg a.i. + 6.3 L 9.3 a 9.2 b 7.9 ab 7.0 b 7.8 a 6.9 b Chlorothalonil + PB + WA 8.0 + 0.12 kg a.i. + 6.3 L 9.4 a 9.4 a 8.9 a 8.7 a 8.4 a 8.6 a Untreated --- 7.7 c 6.5 c 5.2 c 3.4 d 5.3 b 2.5 d Irrigation Frequent 7.6 a 6.7 b 6.5 b 6.1 b Infrequent 7.7 a 7.3 a 7.3 a 7.1 a ANOVA Irrigation (I) NS z ** *** *** Chemical (C) *** *** *** *** I*C NS NS * ***
†Treatments were applied on a 14-day interval beginning 17 June and ending 26 August 2002. ‡ Means in the same column followed by the same letter are not significantly different at P =0.05 according to Fischer’s protected least significant difference test. § *, **, ***, and NS refer to the 0.05, 0.01, 0.001 significance levels and non-significant, respectively. ¶ Turf quality was rated on a 0 to scale where 0= entire plot area brown or dead, 7.5=minimal acceptable level for golf course fairway and 10= optimum greenness and density.

157
Appendix A. Table 15 (cont’d). Turf quality in ‘Crenshaw’ creeping bentgrass as influenced by irrigation, chlorothalonil, paclobutrazol and wetting agent, 2004. Treatment† Turf quality¶ 17 September 22 September Rate ha-1 Frequent Infrequent Frequent Infrequent 27 September 4 October Chemical 0-10 Chlorothalonil 8.0 kg a.i. 6.0 ab 5.8 b 5.8 a y 5.2 b 5.2 abc 4.2 a Paclobutrazol (PB) 0.12 kg a.i. 6.0 ab 5.8 b 6.2 a 4.9 b 5.6 ab 5.4 a Primer Select (WA) 6.3 L prod. 4.8 bc 2.9 c 5.8 a 1.2 c 4.6 c 4.9 a Chlorothalonil + PB 8.0 + 0.12 kg a.i. 7.3 a 8.1 a 6.4 a 7.3 a 5.7 ab 5.1 a Chlorothalonil + WA 8.0 kg a.i. + 6.3 L 5.5 bc 5.4 b 5.7 a 4.9 b 4.9 bc 4.3 a Chlorothalonil + PB + WA 8.0 + 0.12 kg a.i. + 6.3 L 7.0 a 8.1 a 6.2 a 7.3 a 6.9 a 4.9 a Untreated --- 4.5 c 2.3 c 5.4 a 1.0 c 4.5 c 4.7 a Irrigation Frequent 5.5 a 4.5 b 4.5 b 4.5 a Infrequent 5.9 a 5.9 a 5.8 a 5.1 a ANOVA Irrigation (I) NS *** z *** NS Chemical (C) *** *** * NS I*C *** *** NS NS
†Treatments were applied on a 14-day interval beginning 17 June and ending 26 August 2002. ‡ Means in the same column followed by the same letter are not significantly different at P =0.05 according to Fischer’s protected least significant difference test. § *, **, ***, and NS refer to the 0.05, 0.01, 0.001 significance levels and non-significant, respectively. ¶ Turf quality was rated on a 0 to scale where 0= entire plot area brown or dead, 7.5=minimal acceptable level for golf course fairway and 10= optimum greenness and density.

158
Appendix A. Table 16. Turf quality in ‘Figaro’ perennial ryegrass as influenced by irrigation, chlorothalonil, paclobutrazol and wetting agent, 2002. Treatment† Turf quality¶ Rate ha-1 26 June 3 July 10 July 19 July 29 July 8 August Chemical 0-10 Chlorothalonil 8.0 kg a.i. 7.6 a‡ 7.4 a 7.7 ab 7.4 ab 7.4 a 6.9 a Paclobutrazol (PB) 0.12 kg a.i. 7.6 a 7.6 a 7.7 ab 7.3 ab 5.7 b 2.3 b Primer Select (WA) 6.3 L prod. 7.6 a 7.5 a 7.4 b 7.1 b 5.8 b 2.6 b Chlorothalonil + PB 8.0 + 0.12 kg a.i. 7.8 a 7.6 a 7.9 a 7.9 a 7.7 a 7.2 a Chlorothalonil + WA 8.0 kg a.i. + 6.3 L 7.8 a 7.6 a 7.8 ab 7.6 ab 7.4 a 7.1 a Chlorothalonil + PB + WA 8.0 + 0.12 kg a.i. + 6.3 L 7.8 a 7.7 a 7.7 ab 7.3 ab 7.4 a 7.0 a Untreated --- 7.6 a 7.6 a 7.6 ab 6.9 b 6.1 b 3.1 b Irrigation Frequent 7.7 a 7.7 a 7.6 a 6.9 b 6.6 a 5.3 a Infrequent 7.6 a 7.5 a 7.7 a 7.8 a 6.9 a 5.1 a ANOVA Irrigation (I) NS§ NS NS *** NS NS Chemical (C) NS NS NS NS *** *** I*C NS NS NS NS NS NS
†Treatments were applied on a 14-day interval beginning 17 June and ending 26 August 2002. ‡ Means in the same column followed by the same letter are not significantly different at P =0.05 according to Fischer’s protected least significant difference test. § *, **, ***, and NS refer to the 0.05, 0.01, 0.001 significance levels and non-significant, respectively. ¶ Turf quality was rated on a 0 to scale where 0= entire plot area brown or dead, 7.5= minimal acceptable level for golf course fairway and 10= optimum greenness and density.
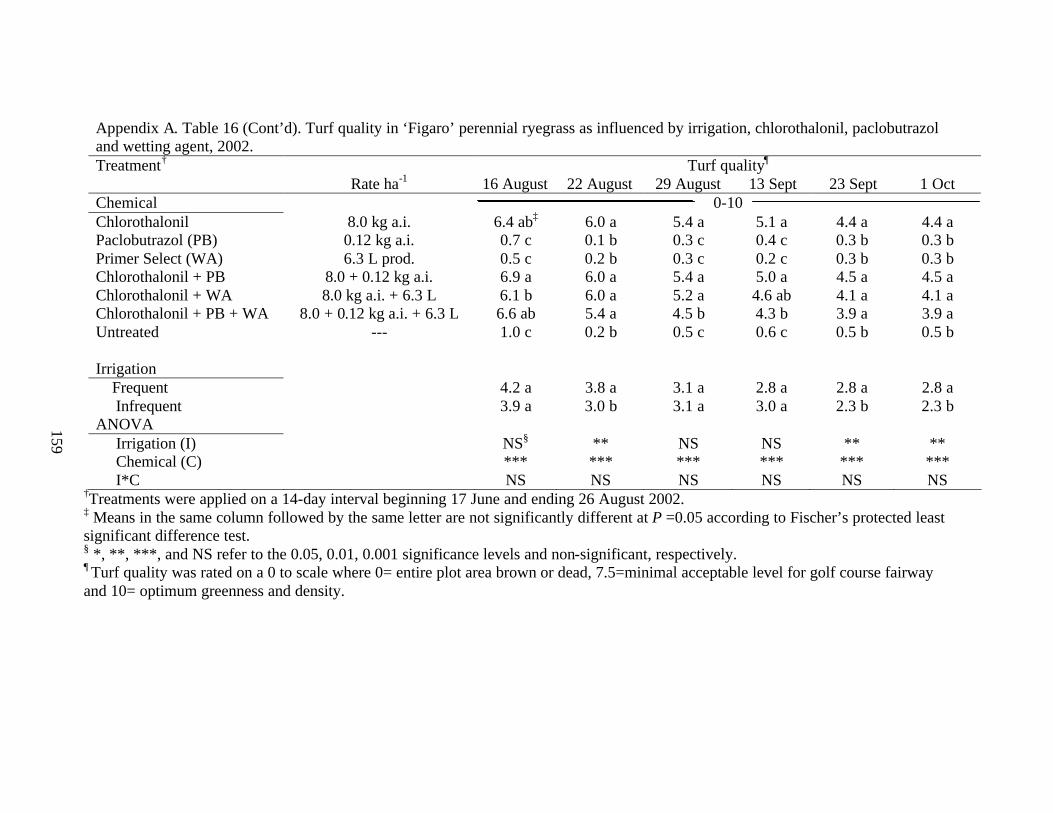
159
Appendix A. Table 16 (Cont’d). Turf quality in ‘Figaro’ perennial ryegrass as influenced by irrigation, chlorothalonil, paclobutrazol and wetting agent, 2002. Treatment† Turf quality¶ Rate ha-1 16 August 22 August 29 August 13 Sept 23 Sept 1 Oct Chemical 0-10 Chlorothalonil 8.0 kg a.i. 6.4 ab‡ 6.0 a 5.4 a 5.1 a 4.4 a 4.4 a Paclobutrazol (PB) 0.12 kg a.i. 0.7 c 0.1 b 0.3 c 0.4 c 0.3 b 0.3 b Primer Select (WA) 6.3 L prod. 0.5 c 0.2 b 0.3 c 0.2 c 0.3 b 0.3 b Chlorothalonil + PB 8.0 + 0.12 kg a.i. 6.9 a 6.0 a 5.4 a 5.0 a 4.5 a 4.5 a Chlorothalonil + WA 8.0 kg a.i. + 6.3 L 6.1 b 6.0 a 5.2 a 4.6 ab 4.1 a 4.1 a Chlorothalonil + PB + WA 8.0 + 0.12 kg a.i. + 6.3 L 6.6 ab 5.4 a 4.5 b 4.3 b 3.9 a 3.9 a Untreated --- 1.0 c 0.2 b 0.5 c 0.6 c 0.5 b 0.5 b Irrigation Frequent 4.2 a 3.8 a 3.1 a 2.8 a 2.8 a 2.8 a Infrequent 3.9 a 3.0 b 3.1 a 3.0 a 2.3 b 2.3 b ANOVA Irrigation (I) NS§ ** NS NS ** ** Chemical (C) *** *** *** *** *** *** I*C NS NS NS NS NS NS
†Treatments were applied on a 14-day interval beginning 17 June and ending 26 August 2002. ‡ Means in the same column followed by the same letter are not significantly different at P =0.05 according to Fischer’s protected least significant difference test. § *, **, ***, and NS refer to the 0.05, 0.01, 0.001 significance levels and non-significant, respectively. ¶ Turf quality was rated on a 0 to scale where 0= entire plot area brown or dead, 7.5=minimal acceptable level for golf course fairway and 10= optimum greenness and density.

160
Appendix A. Table 17. Turf quality in ‘Brightstar’ perennial ryegrass as influenced by irrigation, chlorothalonil, paclobutrazol and wetting agent, 2003. Treatment† Turf quality¶ Rate ha-1 24 July 31 July 6 August 13 August 21 August Chemical 0-10 Chlorothalonil 8.0 kg a.i. 8.3 a‡ 8.3 a 8.4 a 8.4 ab 8.6 ab Paclobutrazol (PB) 0.12 kg a.i. 8.3 a 8.2 a 8.4 a 8.4 ab 8.5 b Primer Select (WA) 6.3 L prod. 8.3 a 8.1 a 7.9 b 8.1 bc 8.0 c Chlorothalonil + PB 8.0 + 0.12 kg a.i. 8.3 a 8.2 a 8.4 a 8.5 a 8.6 ab Chlorothalonil + WA 8.0 kg a.i. + 6.3 L 8.3 a 8.0 a 8.3 a 8.4 ab 8.6 ab Chlorothalonil + PB + WA 8.0 + 0.12 kg a.i. + 6.3 L 8.3 a 7.9 a 8.5 a 8.6 a 8.8 a Untreated --- 8.3 a 7.8 a 7.9 b 8.0 c 7.9 c Irrigation Frequent 8.2 a 8.0 a 8.3 a 8.2 b 8.4 a Infrequent 8.4 a 8.1 a 8.2 a 8.5 a 8.5 a ANOVA Irrigation (I) NS§ NS NS * NS Chemical (C) NS NS ** ** *** I*C NS NS NS NS NS
†Treatments were applied on a 14-day interval beginning 17 June and ending 26 August 2002. ‡ Means in the same column followed by the same letter are not significantly different at P =0.05 according to Fischer’s protected least significant difference test. § *, **, ***, and NS refer to the 0.05, 0.01, 0.001 significance levels and non-significant, respectively. ¶ Turf quality was rated on a 0 to scale where 0= entire plot area brown or dead, 7.5= minimal acceptable level for golf course fairway and 10= optimum greenness and density.

161
Appendix A. Table 17 (Cont’d). Turf quality in ‘Brightstar’ perennial ryegrass as influenced by irrigation, chlorothalonil, paclobutrazol and wetting agent, 2003. Treatment† Turf quality¶ 27 August Rate ha-1 Frequent Infrequent 5 Sep 15 Sep Chemical 0-10 Chlorothalonil 8.0 kg a.i. 9.0 a‡ 8.6 a 8.8 a 8.9 a Paclobutrazol (PB) 0.12 kg a.i. 8.2 b 8.2 a 8.4 b 8.0 bc Primer Select (WA) 6.3 L prod. 7.3 b 8.1 b 8.2 c 7.9 c Chlorothalonil + PB 8.0 + 0.12 kg a.i. 9.0 a 8.7 a 8.9 a 8.9 a Chlorothalonil + WA 8.0 kg a.i. + 6.3 L 8.9 a 8.6 a 8.9 a 8.7 a Chlorothalonil + PB + WA 8.0 + 0.12 kg a.i. + 6.3 L 9.0 a 8.7 a 8.9 a 8.6 ab Untreated --- 7.2 b 8.0 b 8.1 c 7.7 c Irrigation Frequent 8.4 a 8.5 b 8.3 a Infrequent 8.4 a 8.8 a 8.4 a ANOVA Irrigation (I) NS§ ** NS Chemical (C) *** *** *** I*C NS NS NS
†Treatments were applied on a 14-day interval beginning 17 June and ending 26 August 2002. ‡ Means in the same column followed by the same letter are not significantly different at P =0.05 according to Fischer’s protected least significant difference test. § *, **, ***, and NS refer to the 0.05, 0.01, 0.001 significance levels and non-significant, respectively. ¶ Turf quality was rated on a 0 to scale where 0= entire plot area brown or dead, 7.5= minimal acceptable level for golf course fairway and 10= optimum greenness and density.

162
Appendix A. Table 18. Turf quality in ‘Figaro’ perennial ryegrass as influenced by irrigation, chlorothalonil, paclobutrazol and wetting agent, 2004. Treatment† Turf quality¶ Rate ha-1 7 June 15 June 22 June 29 June 6 July 13 July Chemical 0-10 Chlorothalonil 8.0 kg a.i. 8.48 a‡ 8.9 a 9.0 a 9.3 a 9.1 ab 9.3 a Paclobutrazol (PB) 0.12 kg a.i. 8.43 ab 8.9 a 9.0 a 9.3 a 9.2 a 9.2 a Primer Select (WA) 6.3 L prod. 8.45 ab 8.9 a 9.0 a 9.2 ab 9.0 bc 9.0 b Chlorothalonil + PB 8.0 + 0.12 kg a.i. 8.45 ab 8.9 a 9.0 a 9.3 a 9.1 ab 9.3 a Chlorothalonil + WA 8.0 kg a.i. + 6.3 L 8.45 ab 8.9 a 9.0 a 9.3 a 9.1 ab 9.3 a Chlorothalonil + PB + WA 8.0 + 0.12 kg a.i. + 6.3 L 8.45 ab 8.9 a 9.0 a 9.3 a 9.2 a 9.3 a Untreated --- 8.39 b 8.9 a 9.0 a 9.1 b 8.9 c 9.0 b Irrigation Frequent 8.4 a 8.8 b 8.9 b 9.2 b 9.0 b 9.2 a Infrequent 8.4 a 9.0 a 9.1 a 9.3 a 9.2 a 9.2 a ANOVA Irrigation (I) NS z ** *** ** ** NS Chemical (C) NS NS NS NS NS *** I*C NS NS NS NS NS NS
†Treatments were applied on a 14-day interval beginning 17 June and ending 26 August 2002. ‡ Means in the same column followed by the same letter are not significantly different at P =0.05 according to Fischer’s protected least significant difference test. § *, **, ***, and NS refer to the 0.05, 0.01, 0.001 significance levels and non-significant, respectively. ¶ Turf quality was rated on a 0 to scale where 0= entire plot area brown or dead, 7.5=minimal acceptable level for golf course fairway and 10= optimum greenness and density.

163
Appendix A. Table 18 (cont’d). Turf quality in ‘Figaro’ perennial ryegrass as influenced by irrigation, chlorothalonil, paclobutrazol and wetting agent, 2004. Treatment† Turf quality¶ Rate ha-1 20 July 27 July 2 August 9 August 17 August 24 August Chemical 0-10 Chlorothalonil 8.0 kg a.i. 9.3 ab‡ 9.2 ab 9.4 a y 9.4 a 9.4 a 9.4 a Paclobutrazol (PB) 0.12 kg a.i. 9.4 a 9.3 a 8.9 b 8.4 b 8.2 b 6.6 b Primer Select (WA) 6.3 L prod. 9.2 c 9.2 ab 8.9 b 8.3 b 8.2 b 7.0 b Chlorothalonil + PB 8.0 + 0.12 kg a.i. 9.3 ab 9.3 a 9.4 a 9.4 a 9.4 a 9.4 a Chlorothalonil + WA 8.0 kg a.i. + 6.3 L 9.2 bc 9.3 ab 9.4 a 9.4 a 9.4 a 9.4 a Chlorothalonil + PB + WA 8.0 + 0.12 kg a.i. + 6.3 L 9.3 ab 9.3 ab 9.4 a 9.4 a 9.4 a 9.4 a Untreated --- 9.2 c 9.1 b 8.8 b 8.5 b 8.3 b 7.0 b Irrigation Frequent 9.3 a 9.2 b 9.1 a 8.8 a 8.8 a 8.0 b Infrequent 9.3 a 9.3 a 9.3 a 9.1 a 9.0 a 8.6 a ANOVA Irrigation (I) NS§ ** NS NS NS ** Chemical (C) * NS ** *** *** *** I*C NS NS NS NS NS NS
†Treatments were applied on a 14-day interval beginning 17 June and ending 26 August 2002. ‡ Means in the same column followed by the same letter are not significantly different at P =0.05 according to Fischer’s protected least significant difference test. § *, **, ***, and NS refer to the 0.05, 0.01, 0.001 significance levels and non-significant, respectively. ¶ Turf quality was rated on a 0 to scale where 0= entire plot area brown or dead, 7.5=minimal acceptable level for golf course fairway and 10= optimum greenness and density.

164
Appendix A. Table 18 (cont’d). Turf quality in ‘Figaro’ perennial ryegrass as influenced by irrigation, chlorothalonil, paclobutrazol and wetting agent, 2004. Treatment† Turf quality¶ 30 August 3 Sept Rate ha-1 Frequent Infrequent Frequent Infrequent 9 Sept 13 Sept Chemical 0-10 Chlorothalonil 8.0 kg a.i. 9.3 a ‡ 9.4 a 9.4 a 9.4 a 9.1 a 9.2 a Paclobutrazol (PB) 0.12 kg a.i. 2.9 c 7.0 b 3.0 b 5.6 b 4.2 b 3.4 b Primer Select (WA) 6.3 L prod. 3.5 bc 7.4 b 3.1 b 5.5 b 4.6 b 3.9 b Chlorothalonil + PB 8.0 + 0.12 kg a.i. 9.3 a 9.4 a 9.4 a 9.4 a 9.1 a 9.0 a Chlorothalonil + WA 8.0 kg a.i. + 6.3 L 8.8 a 9.4 a 9.4 a 9.4 a 9.1 a 9.1 a Chlorothalonil + PB + WA 8.0 + 0.12 kg a.i. + 6.3 L 9.1 a 9.4 a 8.7 a 9.4 a 9.2 a 9.1 a Untreated --- 4.1 b 6.8 b 3.6 b 5.8 b 4.5 b 3.5 b Irrigation Frequent 6.8 b 6.8 b 6.4 b 6.1 b Infrequent 8.4 a 7.8 a 7.8 a 7.4 a ANOVA Irrigation (I) ***§ *** *** z *** Chemical (C) *** *** *** *** I*C *** ** NS NS
†Treatments were applied on a 14-day interval beginning 17 June and ending 26 August 2002. ‡ Means in the same column followed by the same letter are not significantly different at P =0.05 according to Fischer’s protected least significant difference test. § *, **, ***, and NS refer to the 0.05, 0.01, 0.001 significance levels and non-significant, respectively. ¶ Turf quality was rated on a 0 to scale where 0= entire plot area brown or dead, 7.5=minimal acceptable level for golf course fairway and 10= optimum greenness and density.

165
Appendix A. Table 18 (cont’d). Turf quality in ‘Figaro’ perennial ryegrass as influenced by irrigation, chlorothalonil, paclobutrazol and wetting agent, 2004. Treatment† Turf quality¶ Rate ha-1 17 Sept 22 Sept 27 Sep 4 Oct 16 Oct Chemical 0-10 Chlorothalonil 8.0 kg a.i. 8.2 a‡ 8.2 a 8.0 a 7.5 a 7.2 a Paclobutrazol (PB) 0.12 kg a.i. 2.2 b 0.9 b 1.4 b 1.4 b 2.4 b Primer Select (WA) 6.3 L prod. 2.4 b 0.9 b 1.3 b 1.3 b 2.5 b Chlorothalonil + PB 8.0 + 0.12 kg a.i. 8.1 a 8.3 a 8.0 a 7.0 a 7.2 a Chlorothalonil + WA 8.0 kg a.i. + 6.3 L 8.0 a 8.1 a 7.7 a 6.9 a 6.7 a Chlorothalonil + PB + WA 8.0 + 0.12 kg a.i. + 6.3 L 8.0 a 8.2 a 7.9 a 7.3 a 7.3 a Untreated --- 2.4 b 1.1 b 1.8 b 1.5 b 3.1 b Irrigation Frequent 4.5 b 4.1 b 4.3 b 3.6 b 4.5 b Infrequent 6.7 a 6.0 a 6.0 a 5.8 a 5.8 a ANOVA Irrigation (I) ***§ *** *** *** *** Chemical (C) *** *** *** *** *** I*C NS NS NS NS NS
†Treatments were applied on a 14-day interval beginning 17 June and ending 26 August 2002. ‡ Means in the same column followed by the same letter are not significantly different at P =0.05 according to Fischer’s protected least significant difference test. § *, **, ***, and NS refer to the 0.05, 0.01, 0.001 significance levels and non-significant, respectively. ¶ Turf quality was rated on a 0 to scale where 0= entire plot area brown or dead, 7.5=minimal acceptable level for golf course fairway and 10= optimum greenness and density.

166
0
5
10
15
20
25
30
35
40
6/8 6/18 6/28 7/8 7/18 7/28 8/7 8/17 8/27 9/6 9/16 9/26
FrequentInfrequent
Vol
umet
ric W
ater
Con
tent
(cm
3 cm
-3)
Vertical bars represent +- 1standard error of the mean (SE) where the bars exceed the size of the symbol.Date
Appendix A. Figure 1. Soil Moisture Measurements, 2003.†
† There were no rating dates throughout 2003 where there was a significant irrigation effect on dollar spot or gray leaf spot.

167
0
5
10
15
20
25
30
35
6/23 7/3 7/13 7/23 8/2 8/12 8/22
Frequent
Infrequent
air
Appendix A. Figure 2. Daily Average Soil Temperature (6.5 cm) as Influenced by Irrigation Regime and Ambient Air Temperature, 2002.
Tem
pera
ture
(Cº)
Date

168
0
5
10
15
20
25
30
35
6/8 6/18 6/28 7/8 7/18 7/28 8/7 8/17 8/27 9/6 9/16
Frequent Infrequent Air
Appendix A. Figure 3. Daily Average Soil Temperature (6.5 cm) as Influenced by Irrigation Regime and Ambient Air Temperature, 2003.
Tem
pera
ture
(Cº)
Date

169
0
5
10
15
20
25
30
35
5/13 6/2 6/22 7/12 8/1 8/21 9/10 9/30
FrequentInfrequentAir
Appendix A. Figure 4. Daily Average Soil Temperature (6.5 cm) as Influenced by Irrigation Regime and Ambient Air Temperature, 2004.
Date
Tem
pera
ture
(Cº)

170
Appendix A. Figure 5. Creeping bentgrass dew measurements as influenced by chemical and irrigation treatments following the fifth application*, 2004
0
50
100
150
200
250
300
350
400
450
1 DAT 3 DAT 5 DAT 7 DAT Days After Treatment (DAT)
Chlorothalonil -alone-wet Chlorothalonil -alone-dry Paclobutrazol (PB)-alone-wet Paclobutrazol (PB)-alone-dry Primer (WA)-alone-wet Primer (WA)-alone-dryUntreated-wet Untreated-dry
*Fifth application was the only application that dew measurements were taken at 1, 3, 5 and 7 days after treatment (DAT).
Lite
rs d
ew h
a-1

171
Appendix A. Figure 6. Perennial ryegrass dew measurements as influenced by chemical and irrigation treatments following the fifth application*, 2004
0
50
100
150
200
250
300
350
400
450
1 DAT 3 DAT 5 DAT 7 DAT Days After Treatment (DAT)
Chlorothalonil -alone-wetChlorothalonil -alone-dryPaclobutrazol (PB)-alone-wetPaclobutrazol (PB)-alone-dryPrimer (WA)-alone-wetPrimer (WA)-alone-dryUntreated-wetUntreated-dry
*Fifth application was the only application that dew measurements were taken at 1, 3, 5 and 7 days after treatment (DAT).
Lite
rs d
ew h
a-1

172
Appendix B. Table 1. Restrictions placed on use of chlorothalonil (Daconil Ultrex 82.5 WDG) by United States E.P.A. in
2000. Site Maximum individual application of active
ingredient (minimum re-treatment timing)* Maximum season
total per ha.* Golf course green 2.07 kg/ha (11.3 lb/A) (14 days)
1.34 kg/ha (7.3 lb/A) (7 days) 81 kg/ha (73 lb/A)
Golf course tee 2.07 kg/ha (11.3 lb/A) (14 days) 1.34 kg/ha (7.3 lb/A) (7 days)
58.38 kg/ha (52 lb/A)
Golf course fairway 2.07 kg/ha (11.3 lb/A) (one application) 1.34 kg/ha (7.3 lb/A) (7 days)
29.2 kg/ha (26 lb/A)
Sod farm 2.07 kg/ha (11.3 lb/A) (one application) 1.34 kg/ha (7.3 lb/A) (7 days)
29.2kg/ha (26 lb/A)
General turf 2.07 kg/ha (11.3 lb/A) (one application) 1.34 kg/ha (7.3 lb/A) (7 days)
29.2kg/ha (26 lb/A)

173
Appendix B. Table 2. Influence of spray volume and application timing on the level of dollar spot control provided by chlorothalonil in ‘L-93’ creeping bentgrass, 2002. Source of variation 17 July 19 July
Time NSठNS
Spray volume† * NS
Spray volume* time NS NS † Chlorothalonil (8.0 kg. a.i. ha-1) was applied 20 June and 21 July 2002. ‡ On certain dates when significant differences between spray volumes had occurred the ANOVA may not indicate a significant spray volume effect because of the inclusion of the untreated control data. § *, **, ***, and NS refer to significance level at the 0.05, 0.01, 0.001 levels and non-significant; respectively.

174
Appendix B. Table 3. Number of Sclerotinia homoeocarpa infection centers as influenced by chlorothalonil, application timing and spray volume in ‘L-93’ creeping bentgrass, 2002. Timing Spray volume†
S. homoeocarpa infection centers plot-1
(L ha -1) 3 July 17 July 19 July 22 July AUDPC (no.) AM§ 468 6.5 a‡ 19.8 a 28.3 a 43.0 a 528 b AM 1020 7.3 a 26.0 a 36.5 a 44.5 a 811 b PM¶ 468 2.3 a 10.5 a 22.0 a 36.5 a 391 b PM 1020 9.3 a 24.8 a 40.5 a 37.5 a 710 b - Untreated control 13.3 a 15.3 a 30.3 a 36.0 a 2211 a - P>F 0.0970 0.0863 0.2358 0.8899 0.0001 † Chlorothalonil (8.0 kg a.i ha-1) spray volume and application timing treatments were applied 20 June and 21 July 2002. ‡ Means in the same column followed by the same letter are not significantly different at P <0.05 according to Tukey’s protected least significant difference test. Data were analyzed using a square root transformation, but data in columns are actual means. § AM treatments were applied in early morning with dew present on the canopy. ¶ PM treatments were applied in the afternoon to a dry canopy.

175
Appendix B.. Table 4. Influence of spray volume and application timing on the level of dollar spot control provided by chlorothalonil in ‘Crenshaw’ creeping bentgrass, 2002. Source of variation 20 June 28 June 3 July 17 July 19 July 22 July 29 July 1 August
Time NS‡ NS NS NS NS NS NS NS
Spray volume† NS NS NS NS NS NS NS ***
Spray volume* time NS NS NS NS NS NS NS NS † Treatments were applied 20 June, 21 July and 23 August 2002. ‡ *, **, ***, and NS refer to significance level at the 0.05, 0.01, 0.001 levels and non-significant; respectively.

176
Appendix B.. Table 4 (cont’d). Influence of spray volume and application timing on the level of dollar spot control in ‘ Crenshaw’ creeping bentgrass provided by chlorothalonil, 2002. Source of variation 7 August 14 August 16 August 20 August 22 August 30 August 5 Sept AUDPC
Time NS‡ NS NS NS NS NS NS NS
Spray volume† NS NS NS NS NS * NS NS
Spray volume* time NS NS NS NS NS NS NS NS † Treatments were applied 20 June, 21 July and 23 August 2002. ‡ *, **, ***, and NS refer to significance level at the 0.05, 0.01, 0.001 levels and non-significant; respectively.

177
Appendix B. Table 5. Number of Sclerotinia homoeocarpa infection centers as in ‘ Crenshaw’ creeping bentgrass influenced by chlorothalonil, application timing and spray volume, 2002. Timing Spray volume†
S. homoeocarpa infection centers plot-1
28 June 3 July 17 July 19 July 7 August (L ha -1) (no.) AM§ 468 1.2 b‡ 0.4 b 0.6 a 2.0 a 2.4 b AM 1020 1.4 b 1.6 b 1.4 a 3.0 a 7.4 b PM ¶ 468 0.6 b 0.4 b 1.4 a 2.6 a 5.6 b PM 1020 0.8 b 0.6 b 1.0 a 2.4 a 8.0 b - Untreated control 6.8 a 4.8 a 2.8 a 3.0 a 23.8 a - P>F 0.0011 0.0011 0.1844 0.7795 0.0012 † Chlorothalonil (8.0 kg a.i ha-1) spray volume and application timing treatments were applied 20 June, 21 July and 23 August 2002. ‡ Means in the same column followed by the same letter are not significantly different at P <0.05 according to Tukey’s protected least significant difference test. Data were analyzed using a square root transformation, but data in columns are actual means § AM treatments were applied in early morning with dew present on the canopy. ¶ PM treatments were applied in the afternoon to a dry canopy.

178
Appendix B. Table 5 (cont’d). Number of Sclerotinia homoeocarpa infection centers in ‘Crenshaw’ creeping bentgrass as influenced by chlorothalonil, application timing and spray volume. Timing Spray volume†
S. homoeocarpa infection centers plot-1
14 August 16 August 20 August 22 August L ha -1 (no.) AM§ 468 8.2 b‡ 15.0 a 38.4 b* 57.4 a AM 1020 14.6 b 22.8 a 40.8 b 55.8 a PM ¶ 468 11.6 b 23.8 a 39.2 b 54.4 a PM 1020 10.6 b 20.4 a 44.0 b 55.4 a - Untreated control 27.2 a 37.0 a 59.4 a 67.2 a - P>F 0.0431 0.0702 0.0342 0.5953 † Chlorothalonil (8.0 kg a.i ha-1) spray volume and application timing treatments were applied 20 June, 21 July and 23 August 2002. ‡ Means in the same column followed by the same letter are not significantly different at P <0.05 according to Tukey’s protected least significant difference test. Data were analyzed using a square root transformation, but data in columns are actual means § AM treatments were applied in early morning with dew present on the canopy. ¶PM treatments were applied in the afternoon to a dry canopy.

179
Appendix B. Table 6. Pre-planned orthogonal contrasts for chlorothalonil applied in two spray volume and their effects on dollar spot control in ‘Crenshaw’ creeping bentgrass with chlorothalonil, 2002. Contrast 20 June 28 June 3 July 17 July 19 July 22 July 29 July 1 August
Chlorothalonil 468 vs. 1020† NS‡ NS NS NS NS NS ** ***
Chlorothalonil AM vs. PM† NS NS NS NS NS NS NS NS † Chlorothalonil was applied 20 June and 21 July 2002 at the rate of 8.0 kg a.i. ha-1. ‡ *, **, ***, and NS refer to significance level at the 0.05, 0.01, 0.001 levels and non-significant; respectively.

180
Appendix B. Table 6 (cont’d). Pre-planned orthogonal contrasts for chlorothalonil applied in two spray volume and their effect on dollar spot control in Crenshaw’ creeping bentgrass with chlorothalonil. 2002 Contrast 7 August 14 August 16 August 20 August 22 August 30 August 5 Sept AUDPC
Chlorothalonil 468 vs. 1020† NS‡ NS NS NS NS * NS NS
Chlorothalonil AM vs. PM † NS NS NS NS NS NS NS NS † Chlorothalonil was applied 20 June and 21 July 2002 at the rate of 8.0 kg a.i. ha-1. ‡ *, **, ***, and NS refer to significance level at the 0.05, 0.01, 0.001 levels and non-significant; respectively.
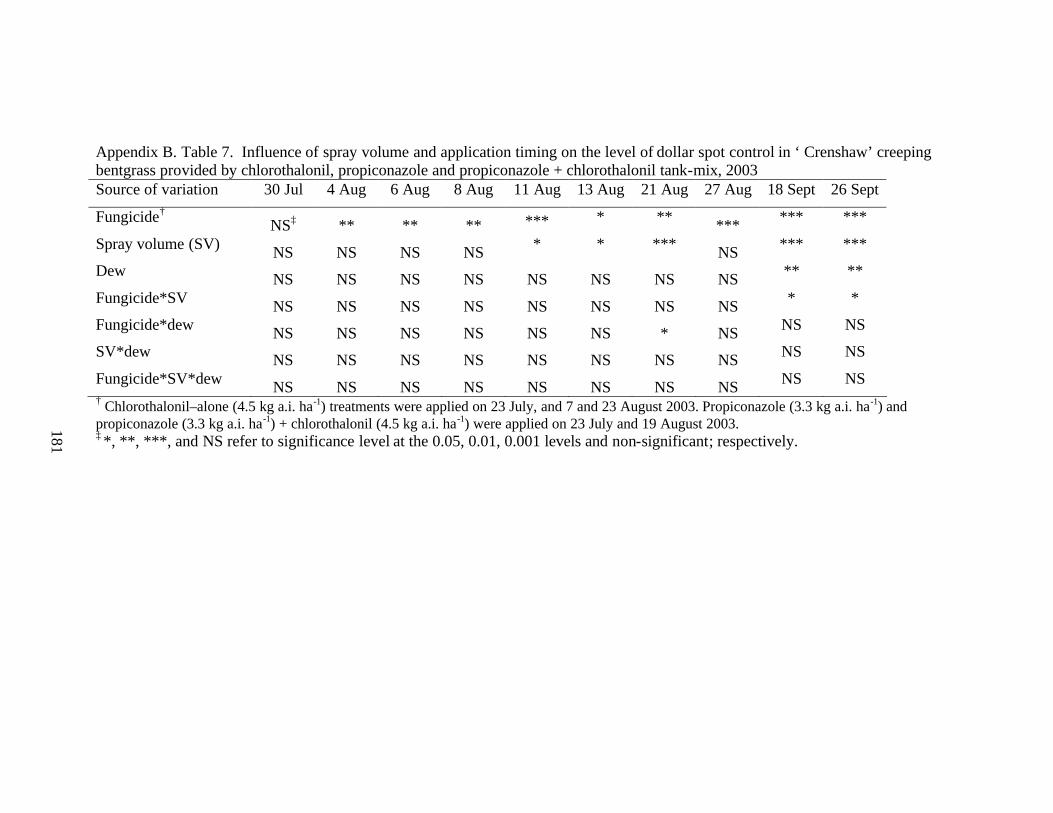
181
Appendix B. Table 7. Influence of spray volume and application timing on the level of dollar spot control in ‘ Crenshaw’ creeping bentgrass provided by chlorothalonil, propiconazole and propiconazole + chlorothalonil tank-mix, 2003 Source of variation 30 Jul 4 Aug 6 Aug 8 Aug 11 Aug 13 Aug 21 Aug 27 Aug 18 Sept 26 Sept
Fungicide† NS‡ ** ** ** *** * ** *** *** ***
Spray volume (SV) NS NS NS NS * * *** NS *** ***
Dew NS NS NS NS NS NS NS NS ** **
Fungicide*SV NS NS NS NS NS NS NS NS * *
Fungicide*dew NS NS NS NS NS NS * NS NS NS
SV*dew NS NS NS NS NS NS NS NS NS NS
Fungicide*SV*dew NS NS NS NS NS NS NS NS NS NS † Chlorothalonil–alone (4.5 kg a.i. ha-1) treatments were applied on 23 July, and 7 and 23 August 2003. Propiconazole (3.3 kg a.i. ha-1) and propiconazole (3.3 kg a.i. ha-1) + chlorothalonil (4.5 kg a.i. ha-1) were applied on 23 July and 19 August 2003. ‡ *, **, ***, and NS refer to significance level at the 0.05, 0.01, 0.001 levels and non-significant; respectively.

182
Appendix B. Table 8. Percent of plot area blighted by Sclerotinia homoeocarpa in ‘ Crenshaw’ creeping bentgrass as influenced by fungicides, spray volumes, and application timing where dew was either present or displaced, 2003. Plot area blighted by S. homoeocarpa¶ Fungicide
Dew/displaced/none
Timing
L ha-1
30 Jul 4 Aug 6 Aug 8 Aug 11 Aug
% Chlorothalonil † Dew AM 468 0.0 a§ 0.1 b 0.1 b 0.5 ab 0.1 bc Chlorothalonil Displaced AM 468 0.0 a 0.1 b 0.2 b 0.4 ab 0.1 bc Chlorothalonil None PM 468 0.0 a 0.0 b 0.1 b 0.1 b 0.0 bc Propiconazole ‡ Dew AM 468 0.0 a 0.0 b 0.0 b 0.0 b 0.0 bc Propiconazole Displaced AM 468 0.0 a 0.0 b 0.0 b 0.0 b 0.0 c Propiconazole None PM 468 0.0 a 0.0 b 0.0 b 0.0 b 0.0 c Propiconazole + Chlorothalonil ‡ Dew AM 468 0.0 a 0.0 b 0.0 b 0.2 b 0.0 c Propiconazole + Chlorothalonil Displaced AM 468 0.0 a 0.0 b 0.0 b 0.0 b 0.0 c Propiconazole + Chlorothalonil None PM 468 0.0 a 0.0 b 0.0 b 0.1 b 0.0 c Chlorothalonil Dew AM 1020 0.0 a 0.2 b 0.2 b 0.8 ab 0.3 b Chlorothalonil Displaced AM 1020 0.0 a 0.2 b 0.2 b 1.2 ab 0.2 bc Chlorothalonil None PM 1020 0.0 a 0.0 b 0.0 b 0.1 b 0.0 bc Propiconazole Dew AM 1020 0.0 a 0.0 b 0.0 b 0.2 b 0.0 bc Propiconazole Displaced AM 1020 0.0 a 0.0 b 0.0 b 0.2 b 0.0 bc Propiconazole None PM 1020 0.0 a 0.0 b 0.0 b 0.0 b 0.0 c Propiconazole + Chlorothalonil Dew AM 1020 0.0 a 0.0 b 0.0 b 0.0 b 0.0 c Propiconazole + Chlorothalonil Displaced AM 1020 0.0 a 0.0 b 0.0 b 0.0 b 0.0 c Propiconazole + Chlorothalonil None PM 1020 0.0 a 0.0 b 0.0 b 0.6 ab 0.0 c Untreated control - - - 0.3 a 1.1 a 1.2 a 1.9 a 3.9 a P>F .108 .0001 .0001 .0007 .0001 † Chlorothalonil–alone (4.5 kg a.i. ha-1) treatments were applied on 23 July, and 7 and 23 August 2003. ‡Propiconazole (3.3 kg a.i. ha-1) and propiconazole (3.3 kg a.i. ha-1) + chlorothalonil (4.5 kg a.i. ha-1) were applied on 23 July and 19 August 2003. § Means in the same column followed by the same letter are not significantly different at P <0.05 according to Tukey’s protected least significant difference test. Data were analyzed using a square root transformation, but data in columns are actual means. ¶ Dollar spot was rated visually on a 0 to100 scale with 0= no blighting, 0.5= dollar spot threshold in fairway turf and 100= 100% of plot area blighted by S. homoeocarpa.

183
Appendix B. Table 8 (cont’d). Percent of plot area blighted by Sclerotinia homoeocarpa in ‘ Crenshaw’ creeping bentgrass as influenced by fungicides, spray volumes, and application timings where dew was either present or displaced, 2003. Plot area blighted by S. homoeocarpa¶ Fungicide
Dew/displaced/none
Timing
L ha-1
13 Aug 27 Aug 29 Aug 7 Sept
% Chlorothalonil † Dew AM 468 0.0 b§ 0.3 b 0.1 bc 0.6 bcd Chlorothalonil Displaced AM 468 0.2 b 0.2 b 0.0 bc 0.5 cde Chlorothalonil None PM 468 0.0 b 0.0 b 0.0 c 0.2 def Propiconazole ‡ Dew AM 468 0.1 b 0.0 b 0.0 c 0.0 f Propiconazole Displaced AM 468 0.3 b 0.1 b 0.0 bc 0.0 f Propiconazole None PM 468 0.1 b 0.0 b 0.0 c 0.0 f Propiconazole + Chlorothalonil‡ Dew AM 468 0.0 b 0.0 b 0.0 c 0.0 f Propiconazole + Chlorothalonil Displaced AM 468 0.0 b 0.0 b 0.0 c 0.0 f Propiconazole + Chlorothalonil None PM 468 0.1 b 0.0 b 0.0 c 0.0 f Chlorothalonil Dew AM 1020 0.2 b 0.4 b 0.2 b 1.2 bc Chlorothalonil Displaced AM 1020 0.1 b 0.3 b 0.1 bc 1.3 b Chlorothalonil None PM 1020 0.0 b 0.0 b 0.0 bc 0.6 bcd Propiconazole Dew AM 1020 0.1 b 0.0 b 0.0 c 0.1 ef Propiconazole Displaced AM 1020 0.2 b 0.0 b 0.0 c 0.1 ef Propiconazole None PM 1020 0.2 b 0.0 b 0.0 c 0.1 def Propiconazole + Chlorothalonil Dew AM 1020 0.1 b 0.0 b 0.0 c 0.0 f Propiconazole + Chlorothalonil Displaced AM 1020 0.1 b 0.2 b 0.0 c 0.0 f Propiconazole + Chlorothalonil None PM 1020 0.1 b 0.0 b 0.0 c 0.0 f Untreated control - - - 3.6 a 2.2 a 3.0 a 3.6 a P>F .0001 .0001 .0001 .0001 † Chlorothalonil–alone (4.5 kg a.i. ha-1) treatments were applied on 23 July, and 7 and 23 August 2003. ‡Propiconazole (3.3 kg a.i. ha-1) and propiconazole (3.3 kg a.i. ha-1) + chlorothalonil (4.5 kg a.i. ha-1) were applied on 23 July and 19 August 2003. § Means in the same column followed by the same letter are not significantly different at P <0.05 according to Tukey’s protected least significant difference test. Data were analyzed using a square root transformation, but data in columns are actual means. ¶ Dollar spot was rated visually on a 0 to100 scale with 0= no blighting, 0.5= dollar spot threshold in fairway turf and 100= 100% of plot area blighted by S. homoeocarpa.

184
Appendix B. Table 8 (cont’d). Percent of plot area blighted by Sclerotinia homoeocarpa in ‘ Crenshaw’ creeping bentgrass as influenced by fungicides, spray volumes, and application timings where dew was either present or displaced, 2003. Plot area blighted by S. homoeocarpa¶ Fungicide
Dew/displaced/none
Timing
L ha-1
10 Sept
18 Sept
26 Sept
29 Sept
% Chlorothalonil † Dew AM 468 0.5 bcd§ 1.7 ab 2.2 ab 3.7 ab Chlorothalonil Displaced AM 468 0.4 cde 1.5 ab 2.1 abc 3.3 abc Chlorothalonil None PM 468 0.2 cde 0.8 bc 0.9 bcd 1.9 bcd Propiconazole ‡ Dew AM 468 0.1 de 0.3 cde 0.3 de 0.8 d Propiconazole Displaced AM 468 0.0 de 0.3 cde 0.4 de 0.8 d Propiconazole None PM 468 0.0 e 0.2 cde 0.2 de 0.8 d Propiconazole + Chlorothalonil ‡ Dew AM 468 0.0 e 0.2 cde 0.2 de 0.6 d Propiconazole + Chlorothalonil Displaced AM 468 0.0 e 0.1 de 0.1 de 0.7 d Propiconazole + Chlorothalonil None PM 468 0.0 e 0.0 e 0.0 e 0.6 d Chlorothalonil Dew AM 1020 1.3 b 2.7 a 4.2 a 5.3 a Chlorothalonil Displaced AM 1020 1.2 b 2.6 a 3.4 a 4.7 a Chlorothalonil None PM 1020 0.6 bc 1.5 ab 2.2 ab 3.3 abc Propiconazole Dew AM 1020 0.1 cde 0.7 bcd 0.7 bcde 1.5 bcd Propiconazole Displaced AM 1020 0.0 de 0.6 bcd 0.6 bcde 1.2 d Propiconazole None PM 1020 0.1 cde 0.5 bcd 0.4 cde 0.9 d Propiconazole + Chlorothalonil Dew AM 1020 0.0 e 0.3 cde 0.2 de 1.0 d Propiconazole + Chlorothalonil Displaced AM 1020 0.0 e 0.2 cde 0.2 de 0.8 d Propiconazole + Chlorothalonil None PM 1020 0.0 e 0.1 cde 0.1 de 0.8 d Untreated control - - - 2.9 a 3.1 a 0.7 bcde 1.5 cd P>F .0001 .0001 .0001 .0001 † Chlorothalonil–alone (4.5 kg a.i. ha-1) treatments were applied on 23 July, and 7 and 23 August 2003. ‡Propiconazole (3.3 kg a.i. ha-1) and propiconazole (3.3 kg a.i. ha-1) + chlorothalonil (4.5 kg a.i. ha-1) were applied on 23 July and 19 August 2003. § Means in the same column followed by the same letter are not significantly different at P <0.05 according to Tukey’s protected least significant difference test. Data were analyzed using a square root transformation, but data in columns are actual means. ¶ Dollar spot was rated visually on a 0 to100 scale with 0= no blighting, 0.5= dollar spot threshold in fairway turf and 100= 100% of plot area blighted by S. homoeocarpa.

185
Appendix B. Table 9. Pre-planned orthogonal contrasts for spray volume level and application timing among fungicide treatments on dollar spot control in ‘Crenshaw’ creeping bentgrass, 2003. Contrast Date Chlorothalonil
468 vs. 1020 L ha-1 †
Chlorothalonil AM dew present vs. AM
dew displaced †
Chlorothalonil AM dew present vs. PM†
Chlorothalonil AM dew displaced vs.
PM †
Propiconazole vs. propiconazole + chlorothalonil ‡
30 July NS NS NS NS NS 4 August NS NS NS * NS 6 August NS NS ** ** NS 8 August NS NS ** * NS 18 August NS NS NS NS * 21 August NS NS NS NS NS 25 August *** NS ** * NS 27 August NS NS ** NS NS 29 August ** NS ** * NS 4 September *** NS ** ** NS 18 September ** NS ** ** * 26 September *** NS ** ** ** † Chlorothalonil–alone (4.5 kg a.i. ha-1) treatments were applied on 23 July and 7 and 23 August 2003. ‡ Propiconazole (3.3 kg a.i. ha-1) and propiconazole (3.3 kg a.i. ha-1) + chlorothalonil (4.5 kg a.i. ha-1) were applied on 23 July and 19 August 2003. § *, **, ***, and NS refer to the 0.05, 0.01, 0.001 significance levels and non-significant, respectively.

186
Appendix B. Table 10. Influence of spray volume and application timing on the level of dollar spot control provided by chlorothalonil, propiconazole and the propiconazole + chlorothalonil tank-mix in ‘Southshore’ creeping bentgrass, 2004. Source of variation 19 May 24 May 28 May 2 June IC AUDPC 3 June 8 June 11 June 30 June 7 July
Fungicide† NS§ * NS *** *** *** *** *** *** ***
Spray volume (SV) NS NS NS NS NS NS NS NS ** ***
Dew ¶ NS NS NS * NS NS * NS *** NS
Fungicide*SV NS NS NS NS NS NS NS NS NS **
Fungicide*dew NS NS NS ** NS NS NS NS * *
SV*dew NS NS NS NS NS NS NS NS NS NS
Fungicide*SV*dew NS NS NS NS NS NS NS NS * NS †Chlorothalonil–alone (4.5 kg a.i. ha-1) treatments were applied on 12 May, 4 and 23 June 2004. Propiconazole (1.65 kg a.i. ha-1) and the tank-mix were applied on 12 May and 18 June 2004. ¶ The dew source of variation included three variables: AM dew present, AM dew displaced and PM dry. § *, **, ***, and NS refer to the 0.05, 0.01, 0.001 significance levels and non-significant, respectively.

187
Appendix B. Table 11. Number of Sclerotinia homoeocarpa infection centers in ‘Southshore’ creeping bentgrass as influenced by chlorothalonil, spray volumes, and application timings where dew was either present or absents, 2004. S. homoeocarpa infection centers plot-1 ¶ Fungicide
Dew/displaced/ none
Timing
L ha-1
19 May
24 May
28 May
IC AUDPC
no. disease x time Chlorothalonil † Dew AM 468 0.1 ab§ 0.1 b 0.2 b 28.8 b Chlorothalonil Displaced AM 468 0.1 ab 0.4 b 0.1 b 21.4 b Chlorothalonil None PM 468 0.3 ab 0.1 b 0.0 b 6.1 b Propiconazole ‡ Dew AM 468 0.1 ab 0.0 b 0.0 b 1.8 b Propiconazole Displaced AM 468 0.0 b 0.0 b 0.0 b 0.0 b Propiconazole None PM 468 0.0 b 0.1 b 0.0 b 1.1 b Propiconazole + Chlorothalonil ‡ Dew AM 468 0.0 b 0.0 b 0.0 b 0.0 b Propiconazole + Chlorothalonil Displaced AM 468 0.0 b 0.0 b 0.0 b 0.0 b Propiconazole + Chlorothalonil None P M 468 0.0 b 0.0 b 0.0 b 0.0 b Chlorothalonil Dew AM 1020 0.0 b 0.1 b 0.1 b 31.6 b Chlorothalonil Displaced AM 1020 0.0 b 0.3 b 0.6 b 18.8 b Chlorothalonil None PM 1020 0.1 ab 0.0 b 0.3 b 14.8 b Propiconazole Dew AM 1020 0.0 b 0.0 b 0.0 b 0.0 b Propiconazole Displaced AM 1020 0.1 ab 0.0 b 0.3 b 3.5 b Propiconazole None PM 1020 0.0 b 0.1 b 0.0 b 2.2 b Propiconazole + Chlorothalonil Dew AM 1020 0.0 b 0.1 b 0.0 b 0.0 b Propiconazole + Chlorothalonil Displaced AM 1020 0.1 ab 0.0 b 0.0 b 1.3 b Propiconazole + Chlorothalonil None P M 1020 0.1 ab 0.0 b 0.3 b 13.0 b Untreated control - - - 1.9 a 11.0 a 20.0 a 254.5 a P>F 0.0120 .0001 .0001 .0001 † Chlorothalonil–alone (4.5 kg a.i. ha-1) treatments were applied on 12 May, 4 and 23 June 2004. ‡ Propiconazole (1.65 kg a.i. ha-1) and the tank-mix were applied on 12 May and 18 June 2004. § Means in the same column followed by the same letter are not significantly different at P <0.05 according to Tukey’s protected least significant difference test. Data were analyzed using a square root transformation, but data in columns are actual means. ¶ Dollar spot was rated visually by counting the number of S. homoeocarpa infection centers plot-1.

188
Appendix B. Table 11(Cont’d). Percent of plot area blighted by Sclerotinia homoeocarpa in ‘Southshore’ creeping bentgrass as influenced by chlorothalonil, spray volumes and application timings where dew was either present or absent, 2004. Plot area blighted by S. homoeocarpa¶ Fungicide
Dew/displaced/ none
Timing
L ha-1
3 June
8 June
11 June
13 June
% Chlorothalonil † Dew AM 468 0.5 b§ 0.3 bc 0.3 b 0.0 b Chlorothalonil Displaced AM 468 0.4 b 0.2 bcd 0.1 b 0.0 b Chlorothalonil None PM 468 0.2 bcd 0.1 bcd 0.0 b 0.0 b Propiconazole ‡ Dew AM 468 0.0 d 0.1 bcd 0.0 b 0.0 b Propiconazole Displaced AM 468 0.0 cd 0.0 bcd 0.2 b 0.1 b Propiconazole None PM 468 0.0 cd 0.0 bcd 0.2 b 0.1 b Propiconazole + Chlorothalonil ‡ Dew AM 468 0.0 d 0.0 bcd 0.0 b 0.0 b Propiconazole + Chlorothalonil Displaced AM 468 0.0 d 0.0 bcd 0.0 b 0.1 b Propiconazole + Chlorothalonil None PM 468 0.0 d 0.0 bcd 0.0 b 0.0 b Chlorothalonil Dew AM 1020 0.7 b 0.5 b 0.2 b 0.2 b Chlorothalonil Displaced AM 1020 0.4 b 0.2 bcd 0.1 b 0.1 b Chlorothalonil None PM 1020 0.3 bc 0.1 bcd 0.1 b 0.0 b Propiconazole Dew AM 1020 0.0 cd 0.0 bcd 0.2 b 0.1 b Propiconazole Displaced AM 1020 0.0 d 0.1 bcd 0.2 b 0.1 b Propiconazole None PM 1020 0.0 d 0.1 bcd 0.2 b 0.2 b Propiconazole + Chlorothalonil Dew AM 1020 0.0 cd 0.0 bcd 0.1 b 0.0 b Propiconazole + Chlorothalonil Displaced AM 1020 0.0 d 0.0 bcd 0.0 b 0.1 b Propiconazole + Chlorothalonil None PM 1020 0.0 d 0.0 d 0.1 b 0.0 b Untreated control - - - 1.9 a 2.5 a 2.4 a 2.5 a P>F .0001 .0001 .0001 .0001 † Chlorothalonil–alone (4.5 kg a.i. ha-1) treatments were applied on 12 May, 4 and 23 June 2004. ‡ Propiconazole (1.65 kg a.i. ha-1) and the tank-mix were applied on 12 May and 18 June 2004. § Means in the same column followed by the same letter are not significantly different at P <0.05 according to Tukey’s protected least significant difference test. Data were analyzed using a square root transformation, but data in columns are actual means. ¶ Dollar spot was rated visually on a 0 to100 scale with 0= no blighting, 0.5= dollar spot threshold in fairway turf and 100= 100% of plot area blighted by S. homoeocarpa.
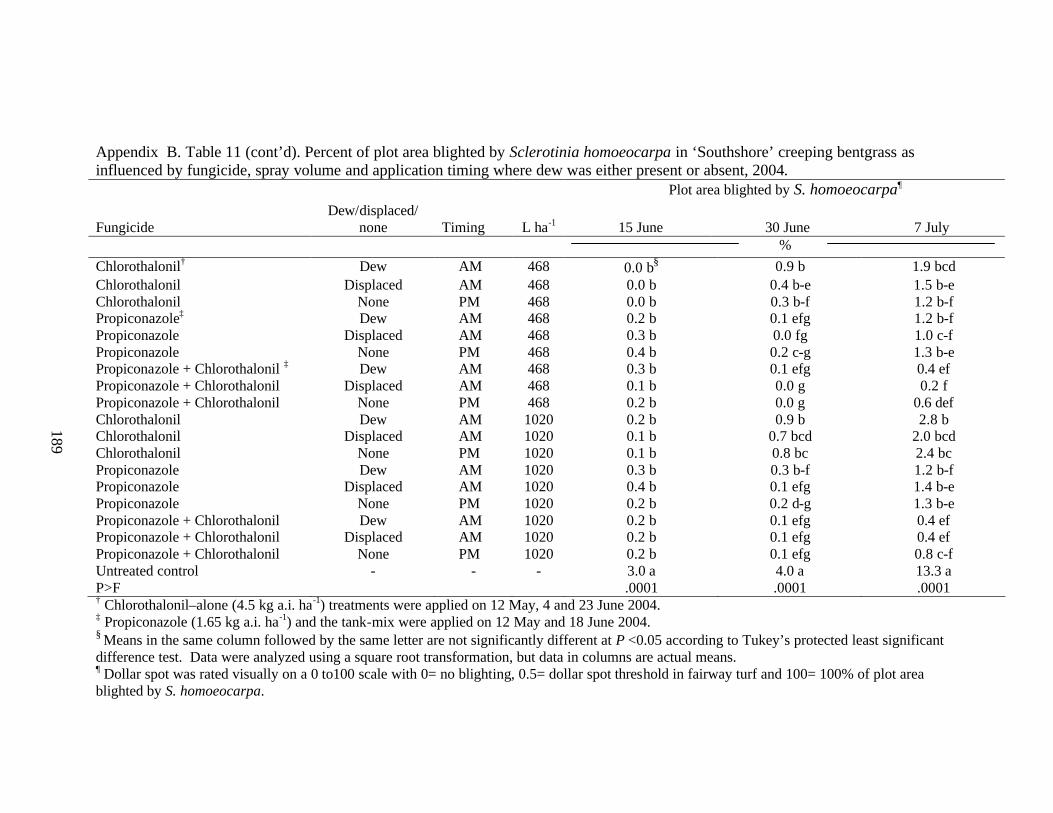
189
Appendix B. Table 11 (cont’d). Percent of plot area blighted by Sclerotinia homoeocarpa in ‘Southshore’ creeping bentgrass as influenced by fungicide, spray volume and application timing where dew was either present or absent, 2004. Plot area blighted by S. homoeocarpa¶ Fungicide
Dew/displaced/ none
Timing
L ha-1
15 June
30 June
7 July
% Chlorothalonil† Dew AM 468 0.0 b§ 0.9 b 1.9 bcd Chlorothalonil Displaced AM 468 0.0 b 0.4 b-e 1.5 b-e Chlorothalonil None PM 468 0.0 b 0.3 b-f 1.2 b-f Propiconazole‡ Dew AM 468 0.2 b 0.1 efg 1.2 b-f Propiconazole Displaced AM 468 0.3 b 0.0 fg 1.0 c-f Propiconazole None PM 468 0.4 b 0.2 c-g 1.3 b-e Propiconazole + Chlorothalonil ‡ Dew AM 468 0.3 b 0.1 efg 0.4 ef Propiconazole + Chlorothalonil Displaced AM 468 0.1 b 0.0 g 0.2 f Propiconazole + Chlorothalonil None PM 468 0.2 b 0.0 g 0.6 def Chlorothalonil Dew AM 1020 0.2 b 0.9 b 2.8 b Chlorothalonil Displaced AM 1020 0.1 b 0.7 bcd 2.0 bcd Chlorothalonil None PM 1020 0.1 b 0.8 bc 2.4 bc Propiconazole Dew AM 1020 0.3 b 0.3 b-f 1.2 b-f Propiconazole Displaced AM 1020 0.4 b 0.1 efg 1.4 b-e Propiconazole None PM 1020 0.2 b 0.2 d-g 1.3 b-e Propiconazole + Chlorothalonil Dew AM 1020 0.2 b 0.1 efg 0.4 ef Propiconazole + Chlorothalonil Displaced AM 1020 0.2 b 0.1 efg 0.4 ef Propiconazole + Chlorothalonil None PM 1020 0.2 b 0.1 efg 0.8 c-f Untreated control - - - 3.0 a 4.0 a 13.3 a P>F .0001 .0001 .0001 † Chlorothalonil–alone (4.5 kg a.i. ha-1) treatments were applied on 12 May, 4 and 23 June 2004. ‡ Propiconazole (1.65 kg a.i. ha-1) and the tank-mix were applied on 12 May and 18 June 2004. § Means in the same column followed by the same letter are not significantly different at P <0.05 according to Tukey’s protected least significant difference test. Data were analyzed using a square root transformation, but data in columns are actual means. ¶ Dollar spot was rated visually on a 0 to100 scale with 0= no blighting, 0.5= dollar spot threshold in fairway turf and 100= 100% of plot area blighted by S. homoeocarpa.

190
Appendix B. Table 12. Pre-planned orthogonal contrasts among spray volume levels, application timings and fungicide treatments and their effect on dollar spot control in ‘Southshore’ creeping bentgrass, 2004. Contrast Date Chlorothalonil
468 vs. 1020 L ha-1†
Chlorothalonil AM dew present vs. AM
dew displaced†
Chlorothalonil AM dew present vs. PM †
Chlorothalonil AM dew displaced vs.
PM†
Propiconazole vs. propiconazole + chlorothalonil‡
19 May NS§ NS NS NS NS 28 May NS NS NS NS NS IC AUDPC NS NS NS NS NS † Chlorothalonil –alone (4.5 kg a.i. ha-1) treatments were applied on 12 May, 4 and 23 June, 2004. ‡ Propiconazole (1.65 kg a.i. ha-1) and the tank-mix were applied on 12 May and 18 June, 2004. § *, **, ***, and NS refer to the 0.05, 0.01, 0.001 significance levels and non-significant; respectively.

191
Appendix B. Table 13. Influence of spray volume and application timing on turf quality provided by chlorothalonil, propiconazole and the propiconazole + chlorothalonil tank-mix on ‘Crenshaw’ creeping bentgrass, 2003. Source of variation 4 Aug 6 Aug 16 Aug 21 Aug 29 Aug 4 Sept 12 Sept 18 Sept 26 Sept 1 Oct
Fungicide† NS‡ NS *** NS NS ** *** *** *** *** Spray Volume (SV) NS NS NS NS NS NS * * ** ** Dew§ NS NS NS NS NS NS NS NS NS NS Fungicide*SV NS NS NS NS NS NS NS NS NS NS Fungicide*dew NS NS NS NS NS * ** NS NS * SV*dew NS NS NS NS NS NS NS NS NS NS Fungicide*SV*dew NS NS NS NS NS NS NS NS NS NS †Chlorothalonil-alone (4.5 kg a.i. ha-1) treatments were re-applied on 23 July and 7 and 23 August, 2003. Propiconazole (3.3 kg a.i. ha-1) and propiconazole (3.3 kg a.i. ha-1) + chlorothalonil (4.5 kg a.i. ha-1) were applied on 23 July and 19 August 2003. ‡ *, **, ***, and NS refer to the 0.05, 0.01, 0.001 significance levels and non-significant, respectively. § The dew source of variation included three variables: AM dew present, AM dew displaced and PM dry.

192
Appendix B. Table 14. Turf quality as influenced by fungicides, spray volume, and application timing where dew was either present or absent in ‘Crenshaw’ creeping bentgrass, 2003. Fungicide
Dew/ Displaced/
None
Timing
L ha-1
Quality
4 Aug 6 Aug 16 Aug 21 Aug 29 Aug (0-10) Chlorothalonil † Dew AM 468 8.3 a§ 8.2 a 8.5 a 8.4 a 9.0 a Chlorothalonil Displaced AM 468 8.1 a 8.1 a 8.6 a 8.2 a 9.1 a Chlorothalonil None PM 468 8.2 a 8.5 a 8.9 a 8.4 a 9.2 a Propiconazole ‡ Dew AM 468 8.2 a 8.5 a 7.8 a 8.4 a 9.3 a Propiconazole Displaced AM 468 8.1 a 8.3 a 7.9 a 8.3 a 9.2 a Propiconazole None PM 468 8.1 a 8.5 a 7.8 a 8.2 a 9.3 a Propiconazole + Chlorothalonil ‡ Dew AM 468 8.2 a 8.5 a 8.4 a 8.7 a 9.3 a Propiconazole + Chlorothalonil Displaced AM 468 8.2 a 8.1 a 8.9 a 8.6 a 9.4 a Propiconazole + Chlorothalonil None P M 468 8.0 a 8.3 a 8.4 a 8.2 a 8.9 a Chlorothalonil Dew AM 1020 8.0 a 8.4 a 8.6 a 8.3 a 8.9 a Chlorothalonil Displaced AM 1020 8.1 a 8.5 a 8.5 a 8.2 a 9.0 a Chlorothalonil None PM 1020 8.3 a 8.6 a 8.7 a 8.4 a 9.2 a Propiconazole Dew AM 1020 8.2 a 8.5 a 7.7 a 8.2 a 9.3 a Propiconazole Displaced AM 1020 8.1 a 8.4 a 8.1 a 8.1 a 9.3 a Propiconazole None PM 1020 8.2 a 8.5 a 7.6 a 8.2 a 9.2 a Propiconazole + Chlorothalonil Dew AM 1020 8.2 a 8.5 a 8.0 a 8.4 a 9.4 a Propiconazole + Chlorothalonil Displaced AM 1020 8.2 a 8.5 a 7.9 a 8.5 a 9.3 a Propiconazole + Chlorothalonil None P M 1020 8.1 a 8.0 a 7.6 a 7.9 a 8.9 a Untreated control - - - 7.9 a 7.9 a 5.6 b 6.2 b 7.3 b P>F .4919 .1744 .0001 .0001 .0001 † Chlorothalonil –alone (4.5 kg a.i. ha-1) treatments were applied on 23 July, and 7 and 23 August 2003. ‡ Propiconazole (3.3 kg a.i. ha-1) and propiconazole (3.3 kg a.i. ha-1) + chlorothalonil (4.5 kg a.i. ha-1) were applied on 23 July and 19 August 2003. § Means in the same column followed by the same letter are not significantly different at P <0.05 according to Tukey’s protected least significant difference test.

193
Appendix B. Table 14. (cont’d). Turf quality as influenced by fungicides, spray volume, and application timing where dew was either present or absent in ‘Crenshaw’ creeping bentgrass, 2003. Fungicide
Dew/ Displaced/
None
Timing
L ha-1
Quality
4 Sept 12 Sept 18 Sept 26 Sept 1 Oct (0-10) Chlorothalonil † Dew AM 468 8.8 a§ 8.1 b-e 7.4 cd 7.7 b-e 6.9 efg Chlorothalonil Displaced AM 468 8.8 a 8.1 b-e 7.5 bcd 7.4 de 7.0 defg Chlorothalonil None PM 468 8.9 a 8.7 a-d 8.0 a-d 7.9 a-e 7.1 b-g Propiconazole ‡ Dew AM 468 9.1 a 9.0 ab 8.5 abc 8.7 abc 8.2 a-e Propiconazole Displaced AM 468 9.2 a 9.0 ab 8.5 abc 8.7 abc 8.2 a-e Propiconazole None PM 468 9.1 a 9.3 ab 8.8 a 8.9 ab 8.4 abc Propiconazole + Chlorothalonil ‡ Dew AM 468 9.2 a 9.4 a 8.7 ab 8.9 ab 8.5 ab Propiconazole + Chlorothalonil Displaced AM 468 9.3 a 9.4 a 9.1 a 9.0 a 8.6 a Propiconazole + Chlorothalonil None PM 468 8.7 a 8.8 abc 8.5 abc 8.5 a-d 7.9 a-f Chlorothalonil Dew AM 1020 8.5 a 7.6 de 7.1 d 6.8 e 5.9 g Chlorothalonil Displaced AM 1020 8.6 a 7.8 cde 7.1 d 6.9 e 6.6 fg Chlorothalonil None PM 1020 8.9 a 8.4 a-d 7.8 a-d 7.6 cde 7.0 c-g Propiconazole Dew AM 1020 9.0 a 8.8 abc 8.1 a-d 8.2 a-d 7.4 a-f Propiconazole Displaced AM 1020 9.0 a 8.8 abc 8.1 a-d 8.2 a-d 7.6 a-f Propiconazole None PM 1020 9.2 a 8.9 abc 8.4 abc 8.5 a-d 8.2 a-e Propiconazole + Chlorothalonil Dew AM 1020 9.1 a 9.1 ab 8.6 abc 8.6 a-d 8.1 a-e Propiconazole + Chlorothalonil Displaced AM 1020 9.2 a 9.2 ab 8.7 ab 8.8 abc 8.4 abc Propiconazole + Chlorothalonil None PM 1020 8.7 a 8.9a bc 8.6 abc 8.6 a-d 8.3 abcd Untreated control - - - 7.2 b 7.2 e 7.0 d 8.2 a-d 7.1 b-g P>F .0001 .0001 .0001 .0001 .0001 † Chlorothalonil –alone (4.5 kg a.i. ha-1) treatments were applied on 23 July, and 7 and 23 August 2003. ‡ Propiconazole (3.3 kg a.i. ha-1) and propiconazole (3.3 kg a.i. ha-1) + chlorothalonil (4.5 kg a.i. ha-1) were applied on 23 July and 19 August 2003. § Means in the same column followed by the same letter are not significantly different at P <0.05 according to Tukey’s protected least significant difference test.

194
Appendix B. Table 15.Turf quality as influenced by fungicides, spray volume and application timing where dew was either present or absent in ‘Southshore’ creeping bentgrass, 2004. Source of variation 24 May 2 June 8 June 15 June 30 June 9 July 16 July
Fungicide† NS‡ *** *** *** *** *** ***
Spray volume (SV) NS NS NS NS ** NS ***
Dew § NS ** NS NS NS * NS
Fungicide* SV NS * NS NS NS NS NS
Fungicide*dew NS NS NS NS NS * NS
SV *dew NS NS NS NS NS NS *
Fungicide* SV *dew NS NS NS NS NS NS NS † Chlorothalonil –alone (4.5 kg a.i. ha-1) treatments were applied on 12 May, 4 and 23 June 2004. Propiconazole (1.65 kg a.i. ha-1) and the tank-mix were applied on 12 May and 18 June 2004. ‡ *, **, ***, and NS refer to the 0.05, 0.01, 0.001 significance levels and non-significant, respectively. § The dew source of variation included three variables: AM dew present, AM dew displaced and PM dry.

195
Appendix B. Table 16. Turf quality as influenced by spray volume and application timing on ‘Southshore’ creeping bentgrass, 2004. Fungicide
Dew/ Displaced/
None
Timing
L ha-1
Turf Quality
24 May 2 June 8 June 15 June (0-10) Chlorothalonil † Dew AM 468 8.8 a§ 8.0 b 8.8 a 8.3 bc Chlorothalonil Displaced AM 468 8.8 a 8.2 b 8.8 a 8.6 abc Chlorothalonil None PM 468 8.8 a 8.2 b 8.8 a 8.8 abc Propiconazole ‡ Dew AM 468 8.8 a 8.7 a 8.8 a 8.8 abc Propiconazole Displaced AM 468 8.8 a 8.7 a 8.8 a 8.8 ab Propiconazole None PM 468 8.8 a 8.7 a 8.8 a 8.8 ab Propiconazole + Chlorothalonil ‡ Dew AM 468 8.8 a 8.9 a 8.9 a 9.0 a Propiconazole + Chlorothalonil Displaced AM 468 8.8 a 8.9 a 8.9 a 9.0 a Propiconazole + Chlorothalonil None P M 468 8.8 a 9.0 a 9.0 a 9.0 a Chlorothalonil Dew AM 1020 8.8 a 8.0 b 8.6 a 8.2 c Chlorothalonil Displaced AM 1020 8.8 a 8.3 b 8.8 a 8.6 abc Chlorothalonil None PM 1020 8.8 a 8.3 b 8.7 a 8.2 c Propiconazole Dew AM 1020 8.8 a 8.7 a 8.8 a 8.8 abc Propiconazole Displaced AM 1020 8.8 a 8.8 a 8.8 a 8.8 abc Propiconazole None PM 1020 8.8 a 8.8 a 8.8 a 8.8 abc Propiconazole + Chlorothalonil Dew AM 1020 8.8 a 8.8 a 8.8 a 9.2 a Propiconazole + Chlorothalonil Displaced AM 1020 8.8 a 8.8 a 8.8 a 9.0 a Propiconazole + Chlorothalonil None P M 1020 8.8 a 8.9 a 8.9 a 9.0 a Untreated control - - - 7.7 a 6.9 c 6.4 b 6.2 d P>F .0001 .0001 .0001 .0001 † Chlorothalonil –alone (4.5 kg a.i. ha-1) treatments were applied on 12 May, 4 and 23 June 2004. ‡ Propiconazole (1.65 kg a.i. ha-1) and the tank-mix were applied on 12 May and 18 June 2004. § Means followed by the same letter are not significantly different at P <0.05 according to Tukey’s protected least significant difference test.

196
Appendix B. Table 16 (Cont’d). Turf quality as influenced by spray volume and application timing on ‘Southshore’ creeping bentgrass, 2004. Fungicide
Dew/ Displaced/
None
Timing
L ha-1
Turf Quality
30 June 9 July 16 July (0-10) Chlorothalonil † Dew AM 468 8.2 de§ 7.5 ef 7.2 de Chlorothalonil Displaced AM 468 8.6 a-e 7.8 c-f 7.6 cde Chlorothalonil None PM 468 8.8 a-e 7.7 d-f 7.0 ef Propiconazole ‡ Dew AM 468 8.9 abc 8.6 a-e 8.7 ab Propiconazole Displaced AM 468 9.0 ab 8.7 a-d 8.8 ab Propiconazole None PM 468 9.0 ab 8.3 a-e 8.4 abc Propiconazole + Chlorothalonil ‡ Dew AM 468 9.0 ab 9.0 ab 9.0 ab Propiconazole + Chlorothalonil Displaced AM 468 9.0 ab 9.1 a 9.0 ab Propiconazole + Chlorothalonil None P M 468 9.1 a 8.9 abc 9.1 a Chlorothalonil Dew AM 1020 8.3 cde 6.9 f 6.1 f Chlorothalonil Displaced AM 1020 8.4 b-e 8.2 a-e 6.7 ef Chlorothalonil None PM 1020 8.2 e 7.9 b-f 7.2 de Propiconazole Dew AM 1020 8.8 a-e 8.6 a-e 8.1 bcd Propiconazole Displaced AM 1020 8.8 a-e 8.5 a-e 8.3 abc Propiconazole None PM 1020 8.9 abc 8.6 a-e 8.4 abc Propiconazole + Chlorothalonil Dew AM 1020 8.9 abc 8.7 a-d 8.7 ab Propiconazole + Chlorothalonil Displaced AM 1020 8.8 a-d 8.8 abc 8.8 ab Propiconazole + Chlorothalonil None P M 1020 9.0 ab 8.8 abc 8.8 ab Untreated control - - - 5.4 f 3.9 f 4.0 g P>F .0001 .0001 .0001 † Chlorothalonil –alone (4.5 kg a.i. ha-1) treatments were applied on 12 May, 4 and 23 June 2004. ‡ Propiconazole (1.65 kg a.i. ha-1) and the tank-mix were applied on 12 May and 18 June 2004. § Means followed by the same letter are not significantly different at P <0.05 according to Tukey’s protected least significant difference test.

197
Appendix B. Table 17. Turf color as influenced by spray volume and application timing on ‘Southshore’ creeping bentgrass, 2003. Fungicide
Dew/ Displaced/
None
Timing
L ha-1
Color ¶
1 October (0-10) Chlorothalonil † Dew AM 468 7.1 de § Chlorothalonil Displaced AM 468 7.2 cde Chlorothalonil None PM 468 7.2 cde Propiconazole ‡ Dew AM 468 8.5 ab Propiconazole Displaced AM 468 8.7 ab Propiconazole None PM 468 8.7 ab Propiconazole + Chlorothalonil ‡ Dew AM 468 8.6 ab Propiconazole + Chlorothalonil Displaced AM 468 8.9 a Propiconazole + Chlorothalonil None P M 468 8.2 abc Chlorothalonil Dew AM 1020 6.6 de Chlorothalonil Displaced AM 1020 6.5 de Chlorothalonil None PM 1020 7.6 bcd Propiconazole Dew AM 1020 8.4 ab Propiconazole Displaced AM 1020 8.4 ab Propiconazole None PM 1020 8.7 ab Propiconazole + Chlorothalonil Dew AM 1020 8.4 ab Propiconazole + Chlorothalonil Displaced AM 1020 8.8 a Propiconazole + Chlorothalonil None P M 1020 8.2 abc Untreated control - - - 6.3 e P>F 0.0001 † Chlorothalonil –alone (4.5 kg a.i. ha-1) treatments were applied on 23 July, and 7 and 23 August 2003. ‡ Propiconazole (3.3 kg a.i. ha-1) and propiconazole (3.3 kg a.i. ha-1) + chlorothalonil (4.5 kg a.i. ha-1) were applied on 23 July and 19 August 2003. § Means in the same column followed by the same letter are not significantly different at P <0.05 according to Tukey’s protected least significant difference test. ¶ Color was rated on a linear scale from 0-10; 0 being brown dead turf, 7 being acceptable fairway color, and 10 being optimal density and greenness.

198
Appendix B. Table 18. Mean amounts of canopy dew measured in 2003 and 2004. Treatments applied Amount of dew (L ha-1) 23 July 2003 All 1529† 7 August 2003 Chlorothalonil-alone 2548 19 August 2003 Propiconazole and tank-mix 2548 22 August 2003 Chlorothalonil-alone 2039 12 May 2004 All 1777 4 June 2004 Chlorothalonil-alone 982 18 June 2004 Propiconazole and tank-mix 2291 23 June 2004 Chlorothalonil-alone 1019 † Dew was measured by blotting Kimwipe tissues over 120 cm2 area of creeping bentgrass turf using a wooden frame as a template.

199
Literature Citied Abernathy, S.D., R.H. White, P.F. Colbaugh, M.C. Engelke, G.R. Taylor, and T.C. Hale.
2001. Dollar spot resistance among blends of creeping bentgrass cultivars. Crop Sci. 41:806-809.
Ashbaugh F. M., and P.O. Larsen. 1984. Effect of various dilution rates on curative
fungicidal control of dollar spot. Fungicides and Nematicide Tests. Vol. 38:187. Atilano, R. A., and P. Busey. 1983. Susceptibility of St. Augustinegrass germplasm to
Pyricularia grisea. Plant Dis. 67:782-783. Beard, J.B. 1973. Turfgrass: Science and Culture. Prentice-Hall, Englewood Cliffs, NJ. Beard, J. B. 2002. Turf Management for Golf Courses. Prentice-Hall, Englewood Cliffs,
NJ. Bennett, F.T. 1937. Dollar spot disease of turf and its casual organism Sclerotinia
homoeocarpa n. sp. Ann. Appl. Biol. 24:236-57. Belanger, F.C., S.A. Bonos, and W.A. Meyer. 2004. Dollar spot resistant hybrids
between creeping bentgrass and colonial bentgrass. Crop Sci. 44:581-586. Bigelow, C.A., J.E. Kaminski, P.H. Dernoeden, and J.M. Krouse. 2002. Dollar spot
control with Banner MAXX, Medallion, Daconil Ultrex, Echo and Concorde. Fungicides and Nematicide Tests: 58 T045 http://www.plantmanagementnetwork.org/pub/trial/fntests/
Blount, A. R, H. Dankers, M. T. Momol, and T. A. Kucharek. 2002. Severe dollar spot
fungus on bahiagrass in Florida. Online, Crop Management dol:10.1094/cm-2002-0927-01-rs.
Bonos, S. A., C. D. Casler, and W.A. Meyer. 2003. Inheritance of dollar spot resistance
in creeping bentgrass. Crop Sci. 43:2189-2196. Bonos, S.A., C. D. Casler, and W.A. Meyer. 2004. Plant response and characteristics
associated with dollar spot resistance in creeping bentgrass. Crop Sci. 44:1763-1769.
Bonos, S.A., C. Kubik, B. B. Clarke, and W.A. Meyer. 2004. Breeding perennial ryegrass
for resistance to gray leaf spot. Crop Sci. 44:575-580. Boulter, J. I., G. J. Boland and J. T. Trevors. 2002. Evaluation of composts for
suppression of dollar spot (Sclerotinia homoeocarpa) of turfgrass. Plant Dis. 86:405-410.

200
Brecht, M. O., L. E. Datnoff, T. A. Kucharek, and R. T. Nagata. 2004. Influence of silicon and chlorothalonil on suppression of gray leaf spot and increase in plant growth in St. Augustinegrass. Plant Dis. 88:338-344.
Brecht, M. O., L. E. Datnoff, T. A. Kucharek, and R. T. Nagata. 2000. Evaluation of
silicon for control of gray leaf spot in 20 genotypes of St. Augustinegrass. Biological and Cultural Tests for Control of Plant Diseases (Online) 17:T02.
Burpee, L .L. 2001. Growth of Sclerotinia homoeocarpa as affected by repeated exposure
to propiconazole. J. Int. Turf. Res. Soc. 9: 645-648. Burpee, L.L., D.E. Green, and S.L. Stephens. 1996. Interactive effects of plant growth
regulators and fungicides on epidemics of dollar spot in creeping bentgrass. Plant Dis. 80:1245-1250.
Burpee, L. L. 1997. Control of dollar spot of creeping bentgrass caused by an isolate of
Sclerotinia homoeocarpa resistant to benzimidazole and demethlation-inhibitor fungicides. Plant Dis. 81:1259-1263.
Butler, E. L., and L.P. Tredway. 2003. Evaluation of Serenade AS for control of dollar
spot in creeping bentgrass. Biological and Cultural Tests for Control of Plant Diseases (Online) 19:T002
Campbell, C. L., and L. V. Madden. 1990. Introduction to Plant Disease Epidemiology.
John Wiley and Sons, New York. Carbone, I., and L. M. Kohn. 1993. Ribosomal DNA sequence divergence within internal
transcribed spacer 1 of the Sclerotiniacae. Mycologia 85:415-427. Clarke, B. B., and S.S. Vaiciunas. 2001. Best management practices for the control of
gray leaf spot. Phytopathology 91: S148. (Abstract). Couch, B. C., and L. M. Kohn. 2002. A multilocus gene genealogy concordant with host
preference indicates segregation of a new species, Magnaporthe oryzae, from M. grisea. Mycologia 94:683-693.
Couch, H. B. 1984. Dilution rates, nozzle size, nozzle pressure and disease control. Golf
Course Management.52 (8):73-80. Couch, H. B. 1995. Diseases of Turfgrasses. Krieger Publishing Co., Malabu, Fl. Couch, H. B., and J.R. Bloom. 1960. Influence of environment on disease of turfgrass.
II, Effect of nutrient, pH, and soil moisture on Sclerotinia dollar spot. Phytopathology. 50:761-763.

201
Datnoff, L. E., G. H. Synder, and G. H. Korndorfer. 2001. Silicon in Agriculture. Elsevier, Amsterdam.
Datnoff, L., R. Nagata, and B. Rutherford. 2003. Evaluation of fungicides for control of
gray leaf spot on St. Augustinegrass. Fungicide and Nematicide Test (Online) 59:T041
Davis, J.G., and P.H. Dernoeden. 2001. Fermentation and delivery of Pseudomonas
aureofaciens to bentgrass affected by dollar spot and brown patch. Intern. Turfgrass Soc. Res. J. 9:655-664.
Davis, J. G., and P.H. Dernoeden. 2002. Dollar spot, tissue nitrogen, and soil microbial
activity in bentgrass as influenced by nitrogen source. Crop Sci. 42:480-488. Dernoeden, P.H. 2001. Gray leaf spot control with fungicides,1998. Fungicides and
Nematicide Tests: 56 T32 http://www.plantmanagementnetwork.org/pub/trial/fntests/
Dernoeden, P. H., S.J. McDonald, and J. E. Kaminski. 2005. Gray leaf spot control in
Maryland, 2004. Fungicide and Nematicide Test (http://www.plantmanagementnetwork.org/pub/trial/fntests/) 60:T042.
Dernoeden, P. H., J.E. Kaminski, and J.M. Krouse. 2002. Dollar spot control with
fungicides, nitrogen sources and a wetting agent, 2001. Fungicide and Nematicide Test(http://www.plantmanagementnetwork.org/pub/trial/fntests/) 57:T06.
Dernoeden, P. H., J.M. Krouse, and J. G. Davis. 2000. Curative dollar spot control with
Serenade, Spectro and Floradox, 1999. Fungicide and Nematicide Test. (http://www.plantmanagementnetwork.org/pub/trial/fntests/) 55:T492
Dernoeden, P.H. and J. E. Kaminski. 2000. Preventive dollar spot control with
fungicides. Fungicide and Nematicide Test. (http://www.plantmanagementnetwork.org/pub/trial/fntests/) 56:T9.
Dernoeden, P.H., 1999. July brings gray leaf spot to perennial ryegrass. Golf Course
Management. 67 (7): 62-66. Dernoeden, P.H., 1996. Perennial ryegrass and gray leaf spot. Golf Course Management.
64 (1): 49-52. Detweiler, A. R., and J.M. Vargas, Jr., 1982. Resistance of Sclerotinia homoeocarpa to
iprodione. Phytopathology. 72:976. Dunn, J. H., D. D. Minner, B. F. Fresenburg, and S. S. Bughrara. 1996. Clippings
disposal and fertilization influence disease in perennial ryegrass turf. Hort. Sci. 31:1180-1181.

202
Dwyer, P. J., and J. M. Vargas. 2004. Preventative control of dollar spot. 74th Annual
Michigan State Turfgrass Conference Proceedings. Online. : http://turf.msu.edu/docs/74th_Conference/Dwyer_Golf_$spot.pdf
Fidanza, M.A., and P.H. Dernoeden. 1996. Brown patch severity in perennial ryegrass as influenced by irrigation, fungicide, and fertilizers. Crop Science 36:1631-1638.
Fry, W. E. 1977. Integrated control of potato late blight-Effects of polygenic resistance and techniques of timing fungicide applications. Phytopathology.68:1650-1655.
Fu, D., N. A. Tisserat, Y. Xiao, D. Settle, S. Muthukrishman, and G. H. Liang. 2005.
Over-expression of rice TLPD34 enhances dollar spot resistance in transgenic bentgrass. Plant Sci. 168:671-680.
Gregos, J. S., G. Jung, and B. List. 2000. Dollar spot volume study for fairway turf.
2000 Wisconsin Turfgrass Research Reports. 18: 46-47. Golembiewski, R.C., J.M Vargas, Jr., A.L. Jones, and A. R. Detwiler. 1995. Detection of
demethylation inhibitor (DMI) resistance Sclerotinia homoeocarpa populations. Plant Dis. 79:491-493.
Golembiewski, R. C., and T. K. Danneberger. 1998. Dollar spot severity as influenced
by trinexapac-ethyl, creeping bentgrass cultivar and nitrogen fertility. Agronomy Journal. 90:466-470.
Hall, R. 1984. Relationship between weather factors and dollar spot of creeping
bentgrass. Can. J. Plant Sci. 64:167-174. Hardebeck, G. A., R. F. Turco, R. Latin, and Z. J. Reicher. 2004. Application of
Pseudomonas aueofaciens TX-1 through irrigation for control of dollar spot and brown patch on fairway-height turf. Hort Sci. 39:1750-1753.
Harmon, P. F., R. Kane, G. Ruhl, and R. Latin. 2000. First report of gray leaf spot on
perennial ryegrass in Indiana. Plant Dis. 84:492. Harmon, P. F., and R. Latin. 2005. Winter survival of the perennial ryegrass pathogen
Magnaporthe oryzae in North Central Indiana. Plant Dis.89:412-418. Harmon, P. F., and R. Latin. 2001. Perennation of Magnaporthe grisea in the Midwest:
disease management implications. Phytopathology. 91:S148. (Abstract) Hodges, C. F., D. A. Campbell, and N. Christians. 1994. Potential biocontrol of
Sclerotinia homoeocarpa and Bipolaris sorokiniana on the phylloplane of Poa pratensis with strains of Pseudomonas spp. Plant Pathology. 43:500-506.

203
Hofmann, N. E., and A. M. Hamblin. 2000. Reaction of perennial ryegrass to gray leaf spot following inoculation in the field. Biological and Cultural Tests for Control of Plant Diseases (http://www.plantmanagementnetwork.org/pub/trial/fntests/) 16:T56.
Hsiang, T., L. Yang, and W. Barton. 1997. Baseline sensitivity and cross resistance to
demethylation-inhibiting fungicides in Ontario isolates of Sclerotinia homoeocarpa. European Journal of Plant Pathology. 103:406-416.
Hsiang, T., and G. S. Mahuku. 1999. Genetic variation within and between southern
Ontario populations of Sclerotinia homoeocarpa. Plant Pathology. 48: 83-94. Hsiang, T., X. L. Ma, L. Yang, and S. Cook. 2000. Analyses of RAPD data for detection
of host specialization in Sclerotinia homoeocarpa. Plant Pathology. 49: 269-275. Jiang, H., J. Fry, and N. Tisserat. 1998. Assessing irrigation management for its effects
on disease and weed levels in perennial ryegrass. Crop Sci. 38:440-445. Jo, Y., J.W. Rimelspach, and M. J. Boehm. 2002. Resistance of Sclerotinia
homoeocarpa to thiophanate-methyl and propiconazole in Ohio. Phytopathology 92:S40 Publication no. P-2002-0284-AMA. (Abstract)
Kim, Y. S., E. W. Dixon, P. Vincelli, and M.L. Farman. 2003. Field resistance to
strobiluron (QoI) fungicides in Pyricularia grisea caused by mutations in the mitochondrial cyctochrome b gene. Phytopathology 93:891-900.
Kohn, L. M., Stasovski, E., Carbone, I., Royer, J., and Anderson, J. B. 1991. Mycelial
incompatibility and molecular markers identify genetic variability in field populations of Sclerotinia sclerotiorum. Phytopathology 81:480-485.
Korndorfer, G. H., G. H. Snyder, M. Ulloa, G. Powell, and L. E. Datnoff. 2001. Calibration of soil and plant silicon analysis for rice production. Journal of Plant Nutrition 24:1071-1084.
Landschoot, P. J., and A.S. McNitt. 1997. Effect of nitrogen fertilizers on suppression of dollar spot disease of Agrostis stolonifera L. Intern. Turfgrass Soc. Res. J. 8: 905-911.
Landschoot, P.J., and B.F. Hoyland. 1992. Gray leaf spot of perennial ryegrass turf in
Pennsylvania. Plant Dis. 76:1280-1282. Lickfeldt, D. W., D. S. Gardner, B. E. Branham, and T. B. Voigt. 2001. Implications of
repeated trinexapac-ethyl applications on Kentucky bluegrass. Agronomy Journal. 93:1164-1168.

204
Liu, L. X., T. Hsiang, C. Cary, and J. L. Eggens. 1995a. Microbial populations and suppression of dollar spot disease in creeping bentgrass with inorganic and organic amendments. Plant Dis. 79:144-147.
Liu, L. X., T.Hsiang, and J. L. Eggens. 1995b. Effect of a wetting agent on adsorption,
movement and uptake of benomyl applied to creeping bentgrass. Journal of Turfgrass Management. 1:77-89.
Martin, C., D. Vega, J. Bastide, and P. Davet. 1990. Enhanced degradation of iprodione
in soil after repeated treatments for controlling Sclerotinia minor. Plant and Soil 127:140-142.
Miller, G. L., K. L. Stevenson, and L. L. Burpee. 2002. Sensitivity of Sclerotinia
homoeocarpa isolates to propiconazole and impact on control of dollar spot. Plant Dis. 86:1240-1246.
Mitkowski, N. A., K. Jordan, and B. Boesh. 2005. Efficacy of fungicide for control of
dollar spot on creeping bentgrass. Fungicide and Nematicide Test (http://www.plantmanagementnetwork.org/pub/trial/fntests/) 60: T029.
Mocioni, M., M. Gennari, and M. L. Gullino. 2001. Reduced sensitivity of Sclerotinia
homoeocarpa to fungicides on some Italian golf courses. Intern. Turfgrass Soc. Res. J., 9:701-704.
Monteith, J. 1929. Some effects of lime and fertilizers on turf diseases. Bull.U.S. Golf
Assoc. Green Section. 9 (5):82-89. Monteith, J., and A. S. Dahl.1932.Turf diseases and their control. Bull. U.S. Golf Assoc.
Green Section.12 (4):85-187. Nanayakkara, U. N., W. Uddin, and L. E. Datnoff. 2004. Effects of silicon on
development if gray leaf spot in perennial ryegrass turf. NE APS Abstracts Pg. 36-37.
Nikolai, T. A., P. E. Rieke, J.N. Rogers, and J.M. Vargas. 2001. Turfgrass and soil
responses to lightweight rolling on putting green root zone mixes. Intern. Turfgrass Soc. Res. J. 9:604-609.
Nelson, E. B., and C. M. Craft. 1991. Introduction and establishment of strains of
Enterobacter cloacae in golf course turf for the biological control of dollar spot. Plant Dis. 510-514.
Nelson, E. B., and C. M. Craft. 1992. Suppression of dollar spot on creeping bentgrass
and annual bluegrass turf with compost-amended topdressings. Plant Dis. 76:954-958.

205
Pederson, D. K., R. T. Kane, and H. T. Wilkinson. 2000. First report of gray leaf spot caused by Pyricularia grisea on Lolium perenne in Illinois. Plant Dis. 84:1151.
Powell, J. F., J. M. Vargas. Jr., M. G. Nair, A. R. Detweiler, and A. Chandra. 2000.
Management of dollar spot on creeping bentgrass with metabolites of Pseudomonas aureofaciens (TX-1). Plant Dis. 84:19-24.
Powell, J. F., and J. M. Vargas. Jr. 2001. Vegetative compatibility and seasonal variation
among isolates of Sclerotinia homoeocarpa. Plant Dis. 85:377-381. Raina, K., N. Jackson, and J.M. Chandlee. 1997. Detection of genetic variation in
Sclerotinia homoeocarpa isolates using RAPD analysis. Mycological Research. 5:585-590.
Reicher, Z. J., and C. S., Throssell. 1997. Effect of repeated fungicide applications on
creeping bentgrass turf. Crop Sci. 37:910-915. SAS Institute Inc., 2003. SAS OnlineDoc® Version 9.1. SAS Institute. Cary, North
Carolina. Schumann, G. L., and N. Jackson. 1999. First report of gray leaf spot (Pyricularia
grisea) on perennial ryegrass (Lolium perenne) in New England. Plant Dis. 83:1073.
Smiley, R. W., P. H. Dernoeden, and B. B. Clarke. 2005. Compendium of Turfgrass
Diseases. Third Edition. American Phytopathological Society, St. Paul, MN. Smith, J. D., N. Jackson, and A. R. Woolhouse. 1989. Fungal Diseases of Amenity Turf
Grasses. E. and F. N. Spon, NY. Topp. G. C., J. L. Davis, and A. P. Annan. 1982. Electromagnetic determintation of soil
water content using TDR: I Application to wetting fronts and steep gradients. Soil Sci. Soc. Am. J. 46: 672-678.
Uddin, W., G. Viji, and L. Stowell. 2002a. First report of gray leaf spot of perennial
ryegrass in sports fields in California. Plant Dis. 86:75. Uddin, W., M. D. Sokia, J. Shelton, and E. L. Sokia. 2002b. Evaluation of fungicides for
control of gray leaf spot on perennial ryegrass. Fungicide and Nematicide Test. (http://www.plantmanagementnetwork.org/pub/trial/fntests/) 58: T054
Uddin, W., K. Serlemitsos, and G. Viji. 2003a. A temperature and leaf duration-based
model for prediction of gray leaf spot of perennial ryegrass turf. Phytopathology 93:336-343.

206
Uddin, W. K., G. Viji, and P. Vincelli. 2003b. Gray leaf spot (blast) of perennial ryegrass turf: An emerging problem for the turfgrass industry. Plant Dis. 87:880-889.
Uddin, W., M. D. Sokia, A. S. McNitt, and M. A. Fidanza. 2004. Effects of timing of
ethofumesate application on severity of gray leaf spot of perennial ryegrass turf. Plant Dis. 88:1146-1152.
Uddin, W., M. D.Sokia, J. Shelton, and E. L. Sokia. 2001. Severity of gray leaf spot
(blast) of perennial ryegrass turf as influenced by nitrogen source. Phytopathology 91:S90. (Abstract)
Uddin, W., M. D. Soika, F. E. Moorman, and G. Viji. 1999. A serious outbreak of blast
disease (gray leaf spot) of perennial ryegrass in golf course fairways in Pennsylvania. Plant Dis. 83:783.
Vaiciunas, S., and B. B. Clarke. 2001. Current perspectives for the control of gray leaf
spot. 71st Annual Michigan Turfgrass Conference Proceedings Abstract. 30: 86. Vargas, J. M., Jr., R. Golembieski, and A.R. Detweiler. 1992. Dollar spot resistance to
DMI fungicides. Golf Course Management. 60:50-54. Vargas, J.M. 2004. Management of Turfgrass Diseases. Third Edition. CRC Press, Boca
Raton, FL Viji, G., W. Uddin, and C. P. Romaine. 2003. Suppression of gray leaf spot (blast) of
perennial ryegrass turf by Pseudomonas aeruginosa from spent mushroom substrate. Biological Control 36:233-243.
Viji, G., W. Uddin, N. R. O’Neill, S. Mischke, and J.A. Saunders. 2004. Genetic
diversity of Sclerotinia homoeocarpa isolates from turfgrassess from various regions in North America. Plant Dis. 88:1269-1276.
Vincelli, P., J. C. Doney Jr., and A. J. Powell. 1997. Variation among creeping bentgrass
cultivars in recovery from epidemics of dollar spot. Plant Dis. 81:99-102. Vincelli, P., and E. Dixon. 2001. Resistance to QoI (strobilurin-like) fungicides in isolates
of Pyricularia grisea from perennial ryegrass. Plant Dis. 86: 235-240. Vincelli, P., E. Dixon, D. Williams, and P. Burrus. 2001. Efficacy of fungicides for
control of gray leaf spot of perennial ryegrass. Fungicide and Nematicide Test (http://www.plantmanagementnetwork.org/pub/trial/fntests/) 57:T33.
Vincelli, P., and E. Dixon. 2003. Summer fungicide spray programs for creeping
bentgrass greens. Golf Course Management. 71 (6): 87-90.

207
Vincelli, P., E. Dixon, D. Williams, and P Burrus. 2003. Efficacy of fungicides for control of dollar spot of creeping bentgrass managed as a fairway. Fungicide and Nematicide Test. (http://www.plantmanagementnetwork.org/pub/trial/fntests/) 59:T007.
Warren, C. G., P. L. Sanders, and H. Cole. 1974. Sclerotinia homoeocarpa tolerance to
benzimidazole configuration fungicides. Phytopathology 64:1139-1142. Walker, A. 1987. Further observations on enhanced degradation of iprodione and
vinclozolin in soil. Pesticide Sci. 21:219-231. Watschke, T. L., P.H. Dernoeden and D. J, Shetlar. 1995. Managing Turfgrass Pests.
CRC Press Inc. Boca Raton, FL. Watkins, J. E., R.C. Shearman, R.E. Gaussoin, W.K. Cecil, M. Vaitkus, and L.A. Wit.
2001. An integrated approach to dollar spot management on a bentgrass fairway. International Turfgrass Soc. Res. J. 9:729-735.
Weibal, E. N., and B. B. Clarke. 2000. Impact of water volume, nozzle type and clipping
removal on the efficacy of trifloxzstrobin and other selected fungicides for the control of brown patch in cool-season turfgrass. Rutgers Turfgrass Proceedings Vol. 32. Online: http://turf.rutgers.edu/PROCEEDINGS/2000/2000_235.pdf
Williams, D. W., A. J. Powell, Jr., P. Vincelli and C.T. Dougherty. 1996. Dollar spot on
bentgrass as influenced by leaf surface moisture, nitrogen and clipping removal. Crop Sci. 36:1304-1309.
Williams, D. W., A .J. Powell, Jr., P. Vincelli, and C.T. Dougherty.1998. Separation and
quantitation of the sources of dew on creeping bentgrass. Crop Sci. 38:1613-1617. Williams, D. W., P. B. Burrus, and P. Vincelli. 2001. Severity of gray leaf spot in
perennial ryegrass as influenced by mowing height and nitrogen level. Crop Sci. 41:1207-1211.
Zhang, X., and R.E. Schmidt. 2000. Application of trinexapac-ethyl and propiconazole
enhances superoxide dismutase and photochemical activity in creeping bentgrass. J. Amer. Soc. Hort. Sci. 125(1):47-51.
Zhou, T., and G. J. Boland. 1997. Hypovirulence and double stranded RNA in Sclerotinia
homoeocarpa. Phytopathology. 87:147-153.

Steven J. McDonald
Curriculum Vitae Name: Steven James McDonald Address: 206 Highland Rd. Pottstown, PA 19464 Phone: (610) 633-1878 Education: University of Maryland, M.S., December 2005 Advisor: Peter H. Dernoeden, Ph. D. Delaware Valley College, B.S., Turfgrass Science, May 2003 Advisor: Douglas T. Linde, Ph. D. Employment: Graduate Research Assistant, University of Maryland, College Park, MD. June 2003-December
2005 Assistant Superintendent-in-Training, Philadelphia Country Club, Gladwyne, PA., May 2002-June
2003 Intern, Philadelphia Country Club, Gladwyne, PA., June 2000-May 2002 Student Research Technician, Delaware Valley College, Doylestown, PA, September 2002-May
2003 Student Intern, Hickory Valley Golf Club, Gilbertsville, PA, May 1999-June 2000 Caddie, Philadelphia Country Club, Gladwyne, PA, September 1997-May 2002 Current Responsibilities:
Research:
Thesis title: Dollar Spot and Gray Leaf Spot Severity as Influenced by Irrigation Practice and Disease Management With Plant Protection Materials
Thesis research:
§ Irrigation frequency effects on dollar spot and gray leaf spot incidence and severity § Chlorothalonil, plant growth regulator and wetting agents effects on dollar spot and
gray leaf spot in fairway height turf § Influence of dilution rate/ spray volume and application timing for fungicide (contact
vs. penetrant vs. tank-mix) applications targeting dollar spot in fairway height creeping bentgrass
§ Quantify canopy dew and its effect of fungicide performance in fairway height creeping bentgrass
Other research projects: § Poa annua and Poa trivialis control in fairway height turf with bispyribac-sodium
(Velocity)

Steven J. McDonald
§ Cool-season turfgrass seedling tolerance to bispyribac § Masking discoloration elicited by bispyribac in creeping bentgrass § Yellow tuft control in creeping bentgrass with Subdue MAXX § Monitering Pyricularia grisea conidia release using a spore trap § Fertilizer and bio-stimulant uses for increased dollar spot suppression § Curative control of dollar spot with various fungicides § Dollar spot control using early season fungicide application § Evaluated new herbicides for broadleaf weed control in lawn turf § Kentucky bluegrass mitigation and soil residual effects of non-selective herbicides
on overseeded Kentucky bluegrass § Selective control of creeping bentgrass in tall fescue turf with mesotrione,
fenoxaprop-ethyl and triclopyr § Yellow nutsedge control with sulfosulfuron and halosulfuron
Extension:
§ Perform turfgrass disease diagnostics at the University of Maryland Turfgrass Disease Diagnostic Laboratory
§ Assist on extension visits to golf courses and athletic fields within the state of Maryland
§ Author or co-author of turfgrass disease and insect extension publications (University of Maryland Turfgrass Technical Updates)
§ Assist with the field evaluation of fungicides, herbicides and fertilizers and performed statistical analyses of data
§ Developed of a database of digital images of turfgrass disease symptoms, signs and maladies
§ Gave presentations at annual University of Maryland field days and conferences
Teaching:
Assistant Lab Instructor: NRSC410 Principles of Plant Pathology, Fall 2005
§ Prepare turfgrass samples for an undergraduate laboratory exercise on Koch’s Postulate
Guest Lecturer: PLSC402 Sports Turf Management, Spring 2005 § Turfgrass disease research and how golf course superintendents benefit from
information obtained through university research Co-Lab Instructor: NRSC410 Principles of Plant Pathology, Fall 2004 § Prepare disease samples and isolates for class laboratory
Guest Lecturer: NRSC410 Principles of Plant Pathology, Fall 2004 § Biology and control of dollar spot disease in turfgrass
Steven J. McDonald
Guest Lecturer: NRSC423 Soil-Water Pollution, Fall 2004 § Audubon International Certification for Golf Course Environmental Stewardship
Course Preparation Volunteer for PGA Tour Tournaments and USGA Championships: 2005 USGA Amateur, Merion Golf Club, Ardmore, PA, August 2005. 2005 Booz-Allen Classic, Congressional Country Club, Bethesda, MD, June 2005. 2003 USGA Women’s Amateur, Philadelphia Country Club, Gladwyne, PA, August 2003. 2002 SEI Pennsylvania Classic, Waynesborough Country Club, Paoli, PA September 2002. Honors and Awards: Dale Carnegie Training Program, 2002 Delaware Valley College Agricultural Ambassador, 2000-2002 Delaware Valley College Agronomy and Environmental Science Distinguished Student, 2003 Delaware Valley College Deans List (2000-2003) Delaware Valley College NCAA Golf Team, 2000-2003 (Captain 2002) Middle Atlantic Conference (MAC) All-Academic Golf Team, 2002-2003 Delaware Valley College Turf Club, President, 2002 Delaware Valley College Turfgrass Scholarship, 2002 Golf Course Superintendents Association of America Scholars Scholarship, 2003 GCSAA Student Essay Contest (Third Place), ‘Dollar Spot, a Historic Disease of Golf Course Turf’’, 2005 Philadelphia Association of Golf Course Superintendents Scholarship, 2002 United States Golf Association Mid-Atlantic Green Section Internship, 2002 Golf Association of Philadelphia J. Wood Platt Caddie Scholar, 2000-2003 Certifications: Pennsylvania State Pesticide Certification, Category 7 and core, 2000-Present Professional Societies and Other Memberships: American Phytopathological Society Golf Course Superintendents Association of America Maryland Turfgrass Council Mid-Atlantic Association of Golf Course Superintendents Philadelphia Association of Golf Course Superintendents United States Golf Association Abstracts Published: Dernoeden, P.H, J. E. Kaminski, and S. J. McDonald. 2004. Preemergence smooth crabgrass and
postemergence annual bluegrass control in turfgrass. Proceedings Northeastern Weed Science Society 58: 119.

Steven J. McDonald
McDonald, S. J. and P. H. Dernoeden. 2005. Postemergence control of annual and roughstalk
bluegrass in creeping bentgrass with bispyrabac sodium. Proceedings Northeastern Weed Science Society 59:92
McDonald, S. J. and P. H. Dernoeden. 2004. Dollar spot control in bentgrass as influenced by
fungicide spray dilution and timing. Proceedings Northeastern Division American Phytopathological Society. Pg. 34.
Dernoeden, P.H, J.E. Kaminski, and S.J. McDonald. 2005. Maryland 2004 smooth crabgrass
control studies in turf. Proceedings Northeastern Weed Science Society 59:97-98. J.E. Kaminski, P.H. Dernoeden, and S.J. McDonald. 2006. Colonial, creeping and velvet bentgrass
safety and tolerance to bispyribac sodium. Proceedings Northeastern Weed Science Society 60: (submitted)
Invited Professional Presentations: Pennsylvania Turfgrass Council, Southeastern Pennsylvania Conference, January 12, 2006.
(In preparation) § Dollar spot management as influence by irrigation and fungicide spray volume
Extension Presentations: Maryland Turfgrass Conference, January 2004.
§ Dollar spot control as influenced by fungicide application timing and dew removal Maryland Turfgrass Conference, January 2005.
§ Dollar spot severity as influenced by irrigation in creeping bentgrass Maryland Turfgrass Conference, January 2006. (In preparation)
§ The use of Velocity to control Poa annua in cool-season turf Extension Publications: McDonald, S. J., and P. H. Dernoeden. 2004. Biology and management of the annual bluegrass
weevil (Listronotus maculicolis) in turfgrass. www.mdturfcouncil.org. Reports Published in Fungicide and Nematicide Tests: Dernoeden, P.H., S.J. McDonald, and J.E. Kaminski. 2005. Brown patch and dollar spot control in bentgrass with fungicides, 2003. Fungicide and Nematicide Tests 60: 38.

Steven J. McDonald
Dernoeden, P.H., S.J. McDonald, J.M. Krouse and J.E. Kaminski. 2005. Brown patch control in colonial bentgrass with various fungicides, 2003. Fungicide and Nematicide Tests 60:36. Dernoeden, P.H., S.J. McDonald, and J.E. Kaminski. 2005. Brown patch and dollar spot control in colonial bentgrass with various fungicides, 2004. Fungicide and Nematicide Tests 60:37. Dernoeden, P.H., S.J. McDonald, J.M. Krouse and J.E. Kaminski. 2005. Dollar spot and brown patch control in creeping bentgrass with fungicides, 2004. Fungicide and Nematicide Tests 60:39. Dernoeden, P.H., S.J. McDonald, and J.E. Kaminski. 2005. Gray leaf spot control with Syngenta and Cleary’s fungicides, 2003. Fungicide and Nematicide Tests 60: 40. Dernoeden, P.H., S.J. McDonald, and J.E. Kaminski. 2005. Gray leaf spot control with Aventis and BASF fungicides, 2003. Fungicide and Nematicide Tests 60: 41. Dernoeden, P.H., S.J. McDonald, and J.E. Kaminski. 2005. Gray leaf spot control in Maryland, 2004. Fungicide and Nematicide Tests 60: 42. McDonald, S.J., J.E. Kaminski, and P.H. Dernoeden. 2005. Curative yellow tuft control in creeping bentgrass with fungicides, 2004. Fungicide and Nematicide Tests 60: 43.