Glycopolypeptide-Grafted Bioactive Polyionic ... - IIT Bombay
ABSTRACT
Title of Document: RADIATION-GRAFTED FABRICS FOR THE EXTRACTION OF URANIUM FROM SEAWATER
Chanel Nicole Tissot, Doctor of Philosophy, 2014
Directed By: Professor Robert Briber
Materials Science & Engineering
Much interest has been generated in extraction uranium from the ocean – the world’s
largest uranium reserve. This dissertation describes the development and seawater testing of a
polymeric adsorbent for uranium based on radiation-induced grafting.
Among all monomers and polymeric substrates tested, grafting of the monomer bis(2-
methacryloxyethyl) phosphate (B2MP) onto Winged nylon fabric was determined to produce
adsorbents of the highest degrees of grafting. Degree of grafting was optimized by irradiating at
a range of dose rates and total absorbed doses and by varying monomer concentration, solvent,
purging gas and radiation source. Both the University of Maryland’s Co-60 gamma irradiator and
1-9 MeV pulsed LINAC were utilized.
The grafted adsorbents were tested for uranium extraction capacity using a 233U
radiotracer in synthetic seawater at natural (3.3 ppb) uranium concentrations. It was determined
that adsorbents of degrees of grafting between 75 and 100% obtained the highest distribution
coefficients for uranium. Kinetic studies revealed an increase in 233U concentration on the
adsorbent over the course of 4 hours after which time a steady-state was reached. Correlation of
this data with kinetic models indicated pseudo-second order kinetics, suggesting the rate-limiting
adsorption mechanism as chemical complexation between 233U and the phosphate-containing
adsorbent. Overall, the highest performing adsorbents obtained distribution coefficients of 1.2 ×
104 mL/g and 233U loadings of 1.0 × 10⁻² mg-U/g-adsorbent. These values were a result of
performing the extractions at 3.3 ppb 233U, a concentration several orders of magnitude lower
than those reported in similar studies.
The chemical changes that occurred upon grafting were investigated with FTIR and
Raman analysis of virgin, irradiated and B2MP-grafted Winged nylon. Characterization of the
grafted adsorbents with SEM revealed a unique morphology for the grafted fabrics that has been
attributed to the precipitation of homopolymer from the solvent during irradiation. SEM/EDS
analysis of a grafted adsorbent contacted with 233U-spiked synthetic seawater revealed the
presence of several elements abundant in seawater, indicating that competition between uranium
and other seawater ions is likely to limit the uranium uptake capacity of the adsorbent.
RADIATION-GRAFTED FABRICS FOR THE EXTRACTION OF URANIUM FROM SEAWATER
by
Chanel Nicole Tissot
Dissertation submitted to the Faculty of the Graduate School of the
University of Maryland, College Park, in partial fulfillment
of the requirements for the degree of
Doctor of Philosophy
2014
Advisory Committee:
Professor Robert Briber, Chair/Advisor
Professor William McDonough, Dean’s Representative
Professor Lourdes Salamanca-Riba
Professor Luz Martinez-Miranda
Professor Tim Koeth

© Copyright by
Chanel Nicole Tissot
2014

ii
Dedication
To my grandparents, Donna Duran and Rear Admiral Gene Tissot. Between the two of you, I have all the inspiration I will ever need.

iii
Acknowledgements This dissertation and the journey that it represents would not have been possible without
the support and assistance of a number of people for whom I owe a debt of gratitude. The
combined effort of these individuals has transformed me from a student into an engineer and has
allowed me to do things that I never thought would be possible. This has been an experience
which has changed me for the better, and one that I will never forget.
My advisor, Dr. Robert Briber, accepted me as his student and his mentorship has proven
successful in every aspect. He is responsible for enabling me to overcome every obstacle and
achieve this goal.
Of course, I would like to thank my family for their contributions. Each one of them
provided support and inspiration in their own unique way, regardless of inconvenient time zones
and having absolutely no clue what I’ve been doing all these years.
I would like to thank Dr. Tim Koeth and Vince Adams for trusting me to operate
radiation-producing machines that can deliver a fatal dose in three microseconds, of which the
only notable casualty after four years was a Ludlum 5 GM counter.
A sincere thank you also goes out to Edward Case, Brian Zidek, Mary Dorman and Steve
Hand, who taught me how to be thorough and precise in my work as well as encouraged me to
wear pants while pipetting fissile material.
And of course, my fellow students, who tolerated me through the highs and lows and
truly made this a journey worth undertaking. Travis Dietz, Ian “Beans” Hochuli, Jake McComb,
Yasamin Abbaszadeh, Kevin Mecadon, Lauren Field, Norvik Voskanian, Orion Wenrich and
Layla Shahamat, I hope all of your wildest dreams come true.
Most notably, I’d like to thank Slavica Grdanovska, who made this PhD a team effort and
truly supported me even through the darkest times. Without her, none of this would have been
possible.
iv
Table of Contents
Dedication................................................................................................................................ii
Acknowledgements ................................................................................................................. iii
List of Tables ......................................................................................................................... vii
List of Figures ....................................................................................................................... viii
List of Symbols and Units...................................................................................................... xiii
Chapter 1. Introduction ............................................................................................................ 1
1.1 World Uranium Resources .............................................................................................. 1 1.2 Existing Technologies .................................................................................................... 1
1.3 Dissertation Objectives and Summary ............................................................................. 3
1.4 Limitations..................................................................................................................... 5
1.5 Dissertation Outline........................................................................................................ 6
Chapter 2. Background ............................................................................................................ 7
2.1 Uranium in Seawater ...................................................................................................... 7
2.2 Past Research and Development...................................................................................... 8
2.3 Current R&D ................................................................................................................. 9 2.4 Developing an Effective Sorbent for Uranium ................................................................10
2.5 Interaction of Ionizing Radiation with Matter .................................................................15
2.6 Radiation Chemistry ......................................................................................................19
2.7 Free Radical Polymerization ..........................................................................................22
2.8 Radiation-Induced Grafting ...........................................................................................25
2.9 Radiotracer Technique...................................................................................................30
Chapter 3. Materials ...............................................................................................................34 3.1 Complexing Monomer...................................................................................................34
3.2 Polymeric Substrate.......................................................................................................39
3.2.1 Polypropylene .........................................................................................................40
3.2.2 Nylon 6 ..................................................................................................................43
3.3 Solvent..........................................................................................................................45
3.3.1 Water......................................................................................................................45
3.3.2 Lower Alcohols ......................................................................................................51 3.4 Radiotracer Isotope........................................................................................................51
v
Chapter 4. Equipment .............................................................................................................57
4.1 University of Maryland Co-60 Source ............................................................................57
4.2 Varian Clinac-6 Electron Beam Linear Accelerator ........................................................62
4.3 Liquid Scintillation Counting .........................................................................................67 4.4 Fourier Transform Infrared Spectroscopy .......................................................................74
4.5 Raman Spectroscopy .....................................................................................................79
4.6 Scanning Electron Microscopy / Energy Dispersive X-ray ..............................................83
Chapter 5. Methodology and Results .......................................................................................89
5.1 Materials Selection ........................................................................................................89
5.1.1 Monomer Selection .................................................................................................89
5.1.2 Polymeric Substrate Selection .................................................................................93
5.2 Sample Irradiation .........................................................................................................95 5.2.1 Radiation Safety......................................................................................................95
5.2.2 Dosimetry and Dose Mapping .................................................................................97
5.2.3 Sources of Error .................................................................................................... 106
5.2.4 Irradiation Procedures ........................................................................................... 107
5.2.5 Grafting Method ................................................................................................... 111
5.2.6 Grafting Procedures .............................................................................................. 112
5.2.7 Determination of Degree of Grafting...................................................................... 115 5.3 Sample Optimization ................................................................................................... 116
5.3.1 Solvent Selection .................................................................................................. 118
5.3.2 Effects of Temperature and Purging Gas ................................................................ 126
5.3.3 Mechanism of Homopolymer Formation ................................................................ 131
5.3.4 Monomer Concentration........................................................................................ 138
5.3.5 Total Dose ............................................................................................................ 147
5.3.6 Dose Rate ............................................................................................................. 155 5.3.7. Summary of Optimized Conditions ....................................................................... 160
5.4 Extraction Performance ............................................................................................... 161
5.4.1 Testing of Polymeric Adsorbents ........................................................................... 161
5.4.2 Extraction Efficiency vs. Degree of Grafting .......................................................... 184
5.4.3 Loading Kinetics ................................................................................................... 189
5.4.4 Extraction Temperature ......................................................................................... 202

vi
5.4.5 Distribution Coefficients and Loading Capacity ..................................................... 205
5.4.6 Experimental pH ................................................................................................... 208
5.4.7 Extraction Capacity Summary ............................................................................... 208
5.5 Characterization .......................................................................................................... 211 5.5.1 Fourier Transform Infrared Spectroscopy............................................................... 211
5.5.2 Raman Spectroscopy ............................................................................................. 218
5.5.3 Scanning Electron Microscopy .............................................................................. 229
5.5.4 Energy Dispersive X-Ray ...................................................................................... 236
Chapter 6. Conclusions ......................................................................................................... 243
6.1 Future Work................................................................................................................ 249
6.2. Significance of Work .................................................................................................. 251
References ........................................................................................................................... 253
vii
List of Tables Table 1. Summary of important free radical reactions. .................................................................................................... 24
Table 2. Phosphate-containing monomers tested for grafting. ........................................................................................ 37
Table 3. Radionuclide data for five commercially-available uranium isotopes. ............................................................ 53
Table 4. Degrees of grafting and solubilities of five phosphate-containing monomers at 0.22M. ............................... 91
Table 5. Summary of irradiation and grafting conditions which produced brittle grafted fabrics. ............................... 94
Table 6. A comparison of three dosimetry methods – thin-film dosimetry, Fricke dosimetry and alanine dosimetry 98
Table 7. Advantages and limitations of radiochromic films for gamma and electron dosimetry................................ 100
Table 8. Solubilities and degrees of grafting observed by grafting of B2MP onto Winged nylon in different solvents
at dose rates of 2.5 and 10 kGy/hr.......................................................................................................................... 123
Table 9. Physical appearance of adsorbents of various degrees of grafting. ................................................................ 137
Table 10. Average efficiency determined by 24 samples of different loadings spiked with known concentrations of
233U. .......................................................................................................................................................................... 181
Table 11. Tabulated values and associated counting efficiencies for Figure 45. ......................................................... 184
Table 12. Rate constants and correlation coefficients for two sets of experimental data plotted as Equation 60,
Equation 62 and Equation 63.................................................................................................................................. 198
Table 13. A summary of the highest-performing adsorbent fabrics based on loading capacity 233U.......................... 207
Table 14. Frequencies and assignments of relative IR bands ........................................................................................ 214
Table 15. Frequencies and assignments of relative Raman bands................................................................................. 222
Table 16. Elemental composition of B2MP grafted onto Winged nylon-6 (1252 %) after contact with 3.2 ppb 233U in
synthetic seawater for 4 hours. ............................................................................................................................... 239
viii
List of Figures
Figure 1. (Left). Imaginative artificial land facility for extraction, separation and purification of uranium from
seawater (Right). Configuration of braided adsorbents for uranium extraction................................................... 12
Figure 2. A 1-MeV photon undergoes Compton scattering as it interacts with the target material. ............................. 16
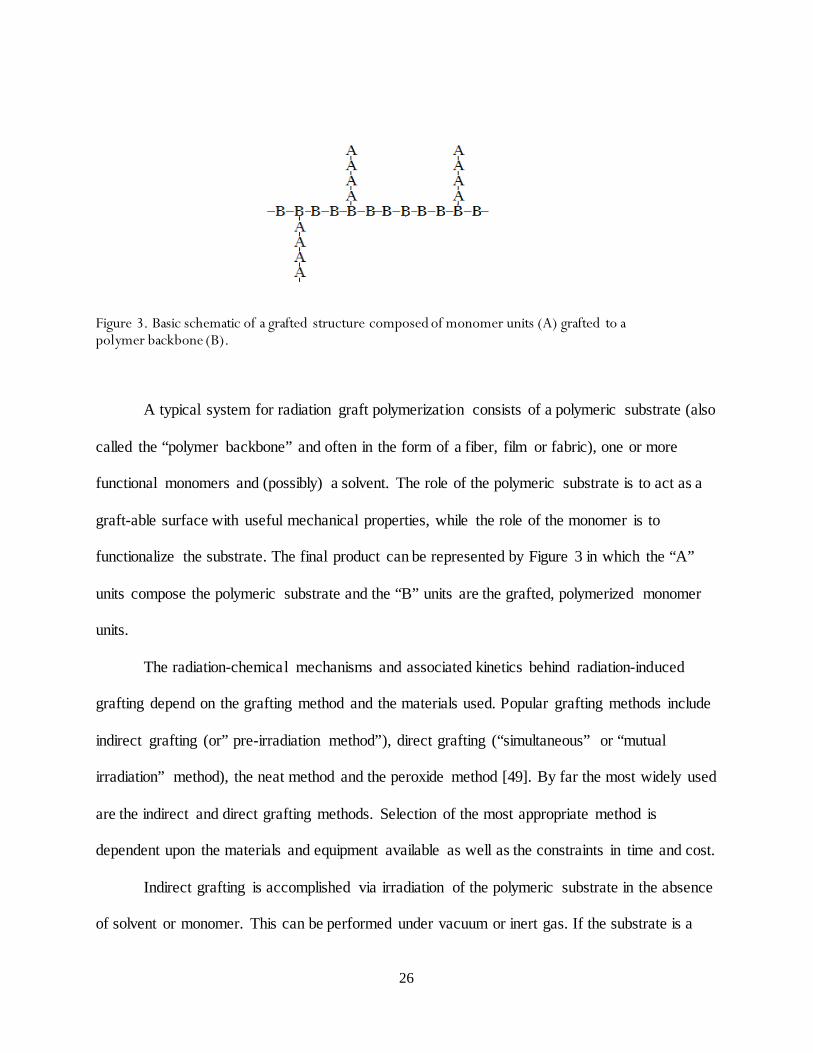
Figure 3. Basic schematic of a grafted structure composed of monomer units (A) grafted to a polymer backbone (B)
.................................................................................................................................................................................... 26
Figure 4. A hydroxyl radical and a vinyl monomer undergo vinyl polymerization. ...................................................... 35
Figure 5. (Left). Tributyl phosphate. (Right). Di(2-ethylhexyl)phosphoric acid ........................................................... 36
Figure 6. Basic schematic of isotactic polypropylene ...................................................................................................... 41
Figure 7. Polypropylene backbone undergoing beta scission .......................................................................................... 42
Figure 8. Structure of nylon-6............................................................................................................................................ 44
Figure 9. Time scale of events: water undergoes radiolysis to form ionization and excitation products ..................... 49
Figure 10. 233U tracer stock solution received in a flame-sealed glass ampoule from Eckert & Ziegler Isotope
Products...................................................................................................................................................................... 56
Figure 11. Schematic of the University of Maryland Co-60 irradiator. .......................................................................... 58
Figure 12. (Left): The Co-60 source array of highest activity in the shielded position. (Right): The irradiator vault.
In the center is the top of the water-filled storage pool........................................................................................... 59
Figure 13. The working surface where small samples are positioned for intermediate-to-high dose rates. ................. 62
Figure 14. (Left): A photograph of user end of the Varian LINAC. (Right): The Varian LINAC from inside the
vault.. .......................................................................................................................................................................... 63
Figure 15. (Left): A vial for direct grafting is positioned for high dose rate irradiation with electron beam. (Right):
Polypropylene fabrics are positioned for low-dose-rate electron beam irradiation. ............................................. 64
Figure 16. (Left) U-233 spiked samples with increasing seawater-to-cocktail ratios. (Right): University of
Maryland’s Packard Tricarb 3100TR liquid scintillation counter.......................................................................... 73
Figure 17. Thermo Nicolet NEXUS 670 FTIR. Chemistry department at the University of Maryland ....................... 79
ix
Figure 18. (Left) A comparison of elastic (Rayleigh) and inelastic (Stokes and anti-Stokes) scattering processes.
(Right) A Horiba Jobin Yvon ARAMIS confocal raman spectrometer................................................................. 80
Figure 19. Representation of some of the interactions between the primary electron beam and the sample. .............. 86
Figure 20. Hitachi S-3400 Variable Pressure SEM located at the Maryland Nanocenter. ............................................ 88
Figure 21. Degrees of grafting obtained with five different monomers by grafting with Co-60 in water (left) and
ethanol (right). ........................................................................................................................................................... 90
Figure 22. (Left). An example of a radiation response curve used to determine the dose to Far West films if the
absorbance and thickness are known. (Right) Dose map for Co-60 irradiator, July 2009. ................................ 102
Figure 23. (Left) An array of radiochromic films packaged in paper envelopes. (Right) A 3-dimensional contour plot
derived from the dose rates obtained at various locations on the array. .............................................................. 103
Figure 24. (Left). A set of samples prepared for direct grafting. (Right). An example of irradiation at 7 different dose
rates simultaneously. ............................................................................................................................................... 108
Figure 25. Structure of Tween 20 .................................................................................................................................... 121
Figure 26. Degrees of grafting determined for B2MP grafted onto Winged nylon with Co-60 at 10 kGy/hr to 40
kGy/hr total dose. .................................................................................................................................................... 122
Figure 27. Degrees of grafting obtained with various solvents after irradiation at 2.5 kGy/hr to 40 kGy total dose. 124
Figure 28. Degrees of grafting obtained with various solvents after irradiation at 10 kGy/hr to 40 kGy total dose.. 124
Figure 29. Comparison of degrees of grafting obtain by grafting B2MP onto Winged nylon in nitrogen-purged and
air-saturated ethanol to 5, 10, 30 and 40 kGy........................................................................................................ 129
Figure 30. (Left) Photographs of virgin Winged nylon, (center) B2MP grafted onto Winged nylon-6 in water to 35%
and (Right) B2MP grafted onto Winged nylon-6 to 213%................................................................................... 132
Figure 31. (Left). Un-irradiated vial containing 0.093 M B2MP in water after approximately 115 minutes of
sonication. (Right). Vial containing 0.093 M B2MP in water after irradiation Co-60 at 20 kGy/hr for one hour
.................................................................................................................................................................................. 133
Figure 32. (Left) Typical sample for direct grafting composed of B2MP, ethanol and un-grafted nylon awaiting
irradiation with Co-60. (Right) Photo taken after direct grafting with Co-60 at 10 kGy/hr to 1 ,2, 6, 12, 20, 30
and 40 kGy (left to right). ....................................................................................................................................... 134
x
Figure 33. Degree of grafting as a function of B2MP concentration in aqueous solution (10mL) in the absence of
surfactant.................................................................................................................................................................. 141
Figure 34. Degree of grafting as a function of B2MP concentration in aqueous solution with Tween 20................. 142
Figure 35. Degree of grafting as a function of B2MP concentration in 100% ethanol. ............................................... 144
Figure 36. Mass of B2MP precipitated (Y-axis) from aqueous solutions containing increasing mass of B2MP (X-
axis) and 0.706 ± 0.01 g Tween 20.. ...................................................................................................................... 145
Figure 37. Degree of grafting as a function of the mass ratio of B2MP to Tween20 in aqueous solution. ................ 147
Figure 38. Degree of grafting as a function of total absorbed dose for B2MP (0.093 M) grafted onto Winged nylon at
10 kGy/hr with Co-60 in water in the absence of surfactant ................................................................................ 149
Figure 39. Degree of grafting as a function of total absorbed dose for B2MP (0.19 M) grafting onto Winged nylon at
10 kGy/hr with Co-60 in water with 63.5 mM Tween20 surfactant .................................................................... 152
Figure 40. Degree of grafting as a function of total absorbed dose for B2MP (0.19 M) grafting onto Winged nylon at
10 kGy/hr with Co-60 in ethanol............................................................................................................................ 153
Figure 41. Degree of grafting as a function of total absorbed dose for B2MP (0.091 M) grafted onto Winged nylon
in water at 20.3 Gy/pulse with LINAC .................................................................................................................. 154
Figure 42. Dose rate dependence for B2MP grafting onto Winged nylon-6 in water with electron beam................. 157
Figure 43. Dose rate dependence for B2MP grafting onto Winged nylon-6 in ethanol with Co-60........................... 158
Figure 44. Mixtures of synthetic seawater and Ultima Gold LLT after vigorous shaking. Seawater loadings of 5%,
10%, 15%, 20%, 30%, 40% and 50% .................................................................................................................... 178
Figure 45. Count rates and counting efficiencies of samples prepared to 233U concentrations of 0.1, 1 and 10 ppb. 183
Figure 46. Distribution coefficients for phosphate-functionalized fabrics as a function of degree of grafting.......... 186
Figure 47. Percentage of uranium removed from a 3.25 ppb solution of 233U in synthetic seawater by phosphate-
functionalized fabrics as a function of degree of grafting. ................................................................................... 189
Figure 48. Distribution coefficients ( ) and uranium loading ( )for grafted adsorbents in contact with 233U-spiked
seawater (3.25 × 10⁻⁶ g-U/mL) for time periods ranging from 30 to 480 minutes. Degrees of grafting
approximately 104.2 ± 6.0%................................................................................................................................... 192
xi
Figure 49. Distribution coefficients ( ) and uranium loading ( ) for grafted adsorbents in contact with 233U-spiked
seawater (3.25 × 10⁻⁶ g-U/mL) for time periods ranging from 30 to 480 minutes. Degrees of grafting
approximately 46.0 ± 3.0% ..................................................................................................................................... 193
Figure 50. Fit of kinetic data against the pseudo-first-order kinetic model. ................................................................. 199
Figure 51. Fit of kinetic data against the pseudo-second-order model.......................................................................... 199
Figure 52. Fit of kinetic data against the intra-particle diffusion model. ...................................................................... 200
Figure 53. Distribution coefficients obtained by contacting grafted fabrics (dg = 90.7%) with synthetic seawater
spiked to 3.25 ppb 233U at various temperatures. .................................................................................................. 204
Figure 54. Loadings of 233U obtained by contacting grafted fabrics (dg = 90.7%) with synthetic seawater spiked to
3.25 ppb 233U at various temperatures.................................................................................................................... 205
Figure 55. FTIR spectra of A) virgin nylon-6 fabric, un-irradiated; B) Winged nylon-6 grafted with B2MP in
ethanol, dg = 30.4%; C) Winged nylon-6 grafted with B2MP in ethanol, dg = 50.3%; D) Winged nylon-6
grafted with B2MP in ethanol, dg = 136.5%.......................................................................................................... 213
Figure 56. FTIR spectra of A) virgin nylon-6 fabric, un-irradiated; B) Winged nylon-6 irradiated with electron beam
in water to 2 kGy; C) Winged nylon-6 irradiated with electron beam in water to 30 kGy; D) Winged nylon-6
irradiated with electron beam in water to 164 kGy ............................................................................................... 213
Figure 57. FTIR (top) and Raman spectra (bottom) for Winged nylon-6 grafted with B2MP in ethanol, dg = 50.3%
.................................................................................................................................................................................. 220
Figure 58. Raman spectra of A) virgin nylon-6 fabric, un-irradiated; B) Winged nylon-6 grafted with B2MP in
ethanol, dg = 30.4%; C) Winged nylon-6 grafted with B2MP in ethanol, dg = 50.3%; D) Winged nylon-6
grafted with B2MP in ethanol, dg = 136.5%.......................................................................................................... 221
Figure 59. Optical micrograph taken with the confocal Raman microscope of un-irradiated Winged nylon fabric. 225
Figure 60. Optical micrograph taken with the confocal Raman microscope of B2MP grafted onto Winged nylon to
73.4% in water. ........................................................................................................................................................ 226
Figure 61. Optical micrographs taken with the confocal Raman microscope of B2MP grafted onto Winged nylon to
191.7% in water. ...................................................................................................................................................... 226
Figure 62. Optical micrographs taken with the confocal Raman microscope of B2MP grafted onto Winged nylon to
30.4% in ethanol. ..................................................................................................................................................... 227
xii
Figure 63. Optical micrographs taken with the confocal Raman microscope of B2MP grafted onto Winged nylon to
50.3% in ethanol. ..................................................................................................................................................... 227
Figure 64. Optical micrographs taken with the confocal Raman microscope of of B2MP grafted onto Winged nylon
to 136.5% in ethanol................................................................................................................................................ 228
Figure 65. Optical micrographs taken with the confocal Raman microscope of B2MP grafted onto Winged nylon to
136.5% in ethanol. ................................................................................................................................................... 228
Figure 66. Winged nylon fabric irradiated in air-saturated water with electron beam to 163 kGy in the absence of
monomer. ................................................................................................................................................................. 231
Figure 67. Winged nylon fabric irradiated in air-saturated water with electron beam to 163 kGy in the absence of
monomer. ................................................................................................................................................................. 231
Figure 68. Winged nylon fabric grafted to 53% with B2MP in ethanol ....................................................................... 232
Figure 69. Winged nylon fabric grafted to 53% with B2MP in ethanol. ...................................................................... 232
Figure 70. Winged nylon fabric grafted to 99% with B2MP in ethanol.. ..................................................................... 233
Figure 71. (Left): Methacryloxyethyl phosphate (MOEP) [81]. (Right): bis(2-methacryloxyethyl) phosphate (B2MP)
.................................................................................................................................................................................. 234
Figure 72. Energy-dispersive x-ray spectra for B2MP grafted onto Winged nylon-6 (degree of grafting 99%)....... 237
Figure 73. SEM image corresponding to EDS analysis. ................................................................................................ 238
Figure 74. Energy dispersive x-ray spectra for B2MP grafted onto Winged nylon-6 (1252 %) after contact with 3.2
ppb 233U in synthetic seawater for 4 hours............................................................................................................. 239
xiii
List of Symbols and Units
MeV 106 electron-volt
kd distribution coefficient
α alpha particle
β beta particle
γ gamma ray
N neutron
hv incident photon energy
m0c2 rest mass energy of an electron
θ photon scattering angle
E incident electron energy
Z atomic number of target material
r0 electron radius
Γ (page 19)
T kinetic energy of incident electron
β ratio of relative velocity to the speed of light
N number density of target material
z charge of incident electron
I mean excitation potential of target material
G radiation chemical yield (g-value)
R molecule formed upon homolysis of solvent molecule
kd dissociation rate constant
kp propagation rate constant
kt termination rate constant
• free radical
P polymer substrate molecule
M monomer molecule
D absorbed dose rate
Gy Gray, unit of absorbed dose (100 rads)

xiv
rad unit of absorbed dose (0.01 Gy)
[U]i concentration of uranium in seawater solution prior to contact with adsorbent
[U]f concentration of uranium in seawater solution after contact with adsorbent
Vsol sample volume
mad mass of adsorbent
Mi mass of uranium in seawater solution prior to contact with adsorbent
Mf mass of uranium in seawater solution after contact with adsorbent
Tg glass transition temperature
eaq- aqueous electron
SF spontaneous fission
Ci Curie, unit of radioactivity
t1/2 radiological half-life
Ma atomic mass
Bq Becquerel, unit of radioactivity
t elapsed time
x distance from radioactive source
I(x) intensity at distance “x”
I0 intensity of source
μ linear attenuation coefficient
CRg gross count rate
CRb background count rate
ε counting efficiency
X correction factor
CRv volumetric count rate
t sample count time
tb background count time
Cnet number of net counts
Cb number of background counts
%T percent transmittance
Is intensity of light entering sample
Ib intensity of light leaving sample

xv
A absorbance
ε absorptivity
l optical path length
C concentration
M molarity
Rem roentgen equivalent man, unit of equivalent dose
ρ density
ε molar extinction coefficient
∆T temperature rise of sample
c thermal capacity of sample
J Joule
dg degree of grafting
mi mass of substrate before grafting
mf mass of grafted substrate
ktr chain transfer rate constant
𝑒 mean energy imparted to material
Vf solution volume after contact with adsorbent
LD critical detection limit
σ standard deviation
Q loading of uranium on adsorbent
k1 pseudo-first-order rate constant
Q∞ loading of uranium on adsorbent at equilibrium
k2 pseudo-second-order rate constant
ki intra-particle diffusion rate constant
ΔH reaction enthalpy
ΔS entropy change
1
Chapter 1. Introduction
1.1 World Uranium Resources
Earth’s uranium resources are no longer sufficient for another century of nuclear power
plant operation at present-day capacity. Due to ever-increasing global demand, the world’s 435
nuclear reactors currently in operation require approximately 67,990 tonnes of uranium per year
[1]. With conventional world-wide uranium resources estimated at only 5,327,200 tonnes, this
allows for less than 80 years of reactor operation without exploration of highly cost-prohibitive
ores [2]. Although this exploration is predicted to double the known reserves of uranium, these
low-grade or difficult-to-access ores are likely to be challenging and expensive to obtain,
resulting in an increase in costs that may rise to levels that make alternative methods of uranium
collection more technically, economically and environmentally feasible.
1.2 Existing Technologies
Research and development in the recovery of uranium from seawater has been ongoing in
multiple countries since the 1960’s. Early efforts such as titanium oxide adsorbents, ion
exchange resins and bio-adsorbents showed poor selectivity for uranium, slow loading kinetics,
high energy use and premature material degradation under seawater conditions (see Section 2.2).
In 2009, researchers of the Japan Atomic Energy Agency (JAEA) completed the first large-scale,
in-ocean uranium adsorption experiment composed of amidoxime ligands radiation-grafted onto
polyethylene fabric [3]. Two extraction configurations were tested – the first being a floating
2
cage filled with stacks of adsorbent fabric and the second being an array of 30-m-long braided
fiber adsorbents moored to the sea floor. In both configurations, the extraction process was
driven by wave and tidal motion. Although the overall uranium yield was very low, this
groundbreaking effort suggested that an increase in extraction efficiency could allow this
technology to become technically and economically feasible.
Amidst a resurgence of interest in the extraction of uranium from seawater, the U.S.
Department of Energy initiated a national effort to improve upon and surpass the capabilities of
the technology developed by the JAEA. Participating institutions included, but are not limited to,
Oak Ridge National Laboratory, The University of Idaho, City University of New York, The
University of Alabama, Pacific Northwest National Laboratory and The University of Maryland,
College Park. These groups approached the challenge from many angles, with several teams
focusing on the synthesis of ligands for uranium, some performing economic analysis and others
developing novel sorbents or processes for elution and regeneration.
The work presented in this dissertation is based partially upon a proposal funded by the
Department of Energy – Nuclear Energy University Programs, aimed to develop adsorbents
based on the radiation grafting of phosphate monomers onto polymeric fabrics. An alternative to
the complex amidoxime-based ligands, phosphate-containing compounds are used extensively
for extracting uranium during the reprocessing of nuclear fuel and, if successfully grafted to a
polymeric substrate, could presumably perform the same role in seawater conditions. Potential
applications of the proposed work include the extraction of uranium or other valuable minerals
from either seawater, fresh water or the waste brine produced by a seawater desalination plant.
3
1.3 Dissertation Objectives and Summary
Described in this dissertation is the complete synthesis of radiation-grafted adsorbent fabrics
including materials selection, optimization, testing and characterization of the products.
Ultimately, the goal of this dissertation was not to produce the highest-performing adsorbent, but
rather to develop a functional and practical adsorbent for uranium by using a procedure that is
easy, inexpensive and environmentally-friendly in an effort to improve the economic viability of
such technology.
The objectives of this dissertation are as follows:
• Select and test phosphate-containing monomers for radiation-induced grafting onto
polymeric substrates
• Select and test polymeric fabrics for radiation grafting and radiation-induced degradation
• Determine radiation grafting conditions required to produce adsorbents at a range of
degrees of grafting
• Develop a method for testing the efficiency of the grafted adsorbents in seawater at
natural uranium concentrations
• Characterize grafted adsorbents to analyze chemical composition, physical properties and
morphology
The literature review and experimental work performed for this thesis were aimed at
answering the following questions:
• Which combination of monomer and polymeric substrate produces the greatest range of
degree of grafting?

4
• Which polymeric substrate produces the highest degrees of grafting with the least
radiation-induced degradation?
• How can the behavior of free radicals produced on these substrates be utilized most
effectively?
• How does the choice of solvent affect the grafted product?
• How do the absorbed dose, dose rate and temperature affect the grafted product?
• Does the source of radiation (electron beam or gamma) affect the grafted product?
• What are the effects of oxidative degradation on the grafted adsorbents and how can this
be prevented?
• What are the kinetics and mechanisms of grafting under different conditions?
• Can characterization prove that the monomer is actually grafted to the substrate?
• What are the mechanisms and effects of homopolymerization of the monomer in different
solvents?
• What range of degree of grafting produces adsorbents with the highest distribution
coefficients for uranium?
• What are the kinetics of uranium removal from synthetic seawater using the grafted
fabrics?
• How does temperature affect the uranium extraction process?
5
1.4 Limitations
The materials developed in this dissertation come with several limitations, which could be
further investigated through the suggestions mentioned throughout the document.
Uranium extraction experiments were performed in synthetic seawater prepared according to
ASTM Standard D 1141, the composition of which does not include microbes or trace elements
(below a concentration of 0.005 mg/L) that would otherwise be present in real seawater [4]. This
means that a reduction in extraction efficiency due to biofouling or competition from trace
elements is not accounted for during testing of the grafted fabrics. Although the synthetic
seawater was continuously stirred throughout the experiments at 650 rpm, it is not expected to
accurately represent the tidal motion of the sea and could over or under-represent these effects.
Extraction experiments were performed at near-natural concentrations (~3.17 × 10⁻⁶ g/L) of
uranium at the expense of a realistic pH. Experiments were performed at a pH between 6 and 8
because the only 233U tracer available was in the form of 1M uranyl nitrate. At a pH of 8.2, the
dominant uranium ion in seawater is uranyl tricarbonate (UO2(CO2)34-). The difference between
the natural and experimental pH could mean that the experimental results could improve or
worsen if the pH is changed to represent natural seawater accurately. Should this work be
continued, an experiment to determine the effect of pH on extraction performance on pH should
certainly be a priority.
Analysis with SEM and confocal Raman microscopy revealed an unexpected surface
morphology for the di-acrylate phosphate monomer B2MP grafted onto Winged nylon fabric in
water and ethanol. Although a mechanism is proposed to explain some aspects of the observed
behavior, an attempt was not made to further investigate the phenomenon through modelling,
6
experimentation or additional characterization. Some techniques which may assist in this
analysis are proposed.
1.5 Dissertation Outline
This thesis will begin with a literature review describing the history of uranium extraction
from sea water, the current state of the art and a strategy for developing an effective adsorbent.
The fundamentals of the interaction of ionizing radiation with matter will be discussed in order
to prepare the reader for the topics of free radical polymerization and radiation-induced grafting.
This will include a description of the two main grafting methods, direct and indirect grafting
followed by a discussion of grafting kinetics, reaction mechanisms and irradiation variables. This
section will conclude with a description of the radiotracer method used to quantify uranium
extraction performance.
The next portion of the dissertation will discuss the selection of grafting materials and
describe the facilities and equipment used to perform the synthesis, characterization and analysis
of the grafted samples. The focus of the next chapter is the development of a method to
determine the extraction efficiency of the grafted adsorbents at natural uranium concentrations
using a 233U radiotracer and synthetic seawater. The distribution coefficients and loading
capacities of the adsorbents were calculated and the kinetics of uranium uptake studied.
Finally, the observations obtained through characterization with FTIR, Raman and SEM/EDS
will precede the conclusion and suggestions for future work.
7
Chapter 2. Background
2.1 Uranium in Seawater
Uranium is the heaviest naturally-occurring element and is found in small amounts in
rock, soil, fresh water and seawater. Natural uranium consists mainly of 238U (99.27%) with
small amounts of 235U (0.72%) and 234U (0.0055%) and is only mildly radioactive due to the long
half-life and low overall specific activity of its components [5]. The primary use of uranium is in
commercial power plants, in which either natural or enriched (>0.72% 235U) uranium is utilized
as nuclear fuel.
Uranium is a highly-reactive element which forms many complexes in solution. The
uranyl ion (UO22+) is stable at pH values below 2.5, while in seawater (pH 7.5-8.5), the dominant
form is uranyl tri-carbonate (UO2(CO2)34-) [6], [7].
Even with an average concentration of only 3.0 – 3.3 µg/L (or 3.0 - 3.3 ppb)1 [7], the
world’s oceans are by far the largest uranium resources on earth. The total uranium content of
the world’s oceans has been estimated at 4.5 × 10⁹ metric tons [3], approximately 1000 times that
of known terrestrial ores. This resource is renewed by a constant influx of uranium from river
sources and is balanced by the loss of uranium to seafloor sediments [8]. The estimated residence
time of dissolved uranium in seawater is over 200,000 years [9], significantly higher than the
ocean’s circulation and mixing times [10], suggesting that, for extraction purposes, the ocean
may be considered a constant source of uranium. Because enrichment of uranium is necessary
1 Average concentration is only representative of the open ocean. It does not include marine sediments, pore water or river water
8
for most power applications, it is also worth mentioning that the U235/U238 isotope ratio does not
differ between seawater and conventional ores [11].
2.2 Past Research and Development
Research and development in the extraction of uranium from seawater has been carried
out in several countries since the 1960’s, particularly in the United States, the United Kingdom,
Germany, India and Japan. The first experimental studies in uranium extraction from seawater
involved inorganic adsorbents, namely, titanium oxide. Experiments with titanium oxide
revealed only moderate loading capacity, slow loading kinetics, high energy use and poor
selectivity for uranium [12], [7].
Interest began to increase in the 1980’s, with papers published by multiple research
groups focusing on novel extractants for uranium. These included ion exchange and chelating
resins [13], microbial biomass [14] and polymeric adsorbents [15]. Many of these technologies
have been proven to be impractical for commercial use due to poor performance or high
monetary or environmental costs, particularly for extraction methods that require pumping large
volumes of seawater across a solid sorbent.
Among the first polymeric adsorbents were those based on amidoxime functional groups.
The effectiveness of amidoxime-based adsorbents for uranium sorption, verified by multiple
studies, is due to favorable loading capacities that have been shown to yield adsorbed
concentrations comparable to those found in conventional uranium ores [16], [17]. Over the last
two decades, these amidoxime-based sorbents have taken the form of complexing polymeric
resins [18], fibrous balls [19] and grafted adsorbent fabrics [20].
9
After several decades of effort by scientists and engineers across the world, a major
breakthrough was accomplished when researchers at the Japan Atomic Energy Agency
completed the first large-scale, in-ocean uranium adsorption experiment. Electron beam and
gamma radiation were used to graft polyethylene fabric with acrylonitrile, which was
subsequently reacted with a hydroxylamine solution to convert the cyano groups to the ligand
amidoxime [21]. Large volumes of grafted fabrics were assembled into cages or woven into
braids and placed in the Sea of Japan. Although only one kilogram of uranium was collected
over a course of 240 days, the project indicated that large-scale extraction is not only possible,
but that future adsorbents may have the potential to reach a level of efficiency that may soon
render this technology economically viable.
2.3 Current R&D
Despite the success of the Japanese experiment, the current state of technology remains
very cost prohibitive. In a race to develop the first economical adsorbent, several teams in the
United States (including Oak Ridge National Laboratory (ORNL), Pacific Northwest National
Laboratory (PNNL), The University of Maryland (UMD) and several others) received funding
from the U.S. Department of Energy to improve upon and surpass the capabilities of the
Japanese technology. Novel ideas presented by other teams include extraction of uranium from
shrimp shell waste [22], the use of nanoporous carbon [23], and in the case of the proposed work,
radiation-grafted fabrics based on phosphate.
Outside of the Department of Energy effort, several novel attempts have also been
published within the last few years. Researchers at the Bhabha Atomic Research Center in
Mumbai, India performed an engineering scale study based on amidoxime chelating groups
10
radiation-grafted onto polypropylene sheets. Seawater trials were performed both in an estruary
and at the intake and outtake canals of the coastal Tarapur Atomic Power Station. Adsorbents
were characterized for biofouling while uranium and vanadium obtained was on the order of 10-3
g for submergence times of two to three weeks [24].
Many research efforts continue to improve upon the amidoxime-based adsorbent,
however; slow uranium adsorption kinetics and poor selectivity for the uranyl ion has drawn the
focus for new projects away from amidoxime [25]. For example, a paper published by Zhou et
al. proposed the use of engineered proteins to sequester the uranyl ions (UO22+) from seawater
with greater than 10,000 fold selectivity for the uranyl ion over competing metal ions [26].
2.4 Developing an Effective Sorbent for Uranium
Since the inception of research and development regarding the extraction of uranium
from seawater, the requirements and characteristics of the “ideal adsorbent” have been defined in
an attempt to improve upon and advance existing technology. These needs have changed little
since the 1950’s and are still applicable today despite significant technological advances.
Optimization of the adsorbent based upon the following factors serves to increase the extraction
efficiency and, subsequently, reduce cost.
1) Effective shape and physical form
The physical form and shape of the adsorbent, even in lab-scale testing, should allow for
effective and low-cost extraction when scaled-up for in-ocean testing. For example, titanium
oxide and ion exchange resins were found to be impractical for large-scale extraction because
11
their geometry required the pumping of seawater, which adds to the overall energy cost and
produces environmental concerns.
Several concepts have been developed to optimize extraction efficiency via the use of
wave and tidal motion using fibers or fabrics. These materials have the advantage of flexibility
and strength as well as resistance to acids that are typically used to elute the material. A Swedish
report published by the International Atomic Energy Agency presented a feasibility study of
floating units composed of a sloped plane directing seawater to stacks of adsorbent bed [27]. The
surface areas, thicknesses of the adsorbents and the length of extraction cycles were optimized to
minimize cost, however; in-ocean testing of this concept was never performed.
Nobukawa et al. performed a quarter-scale ocean test involving floating absorbent stacks.
These stacks were towed by a ship at a speed of 2 knots for 30 hours and moored to a buoy to
float for 27 days to simulate the effects of wave power [28]. As previously mentioned,
researchers at the Japan Atomic Energy Agency performed a full-scale, in-ocean test to prove the
technical and economic feasibility of two extraction configurations – the floating absorbent cage
and the braided absorbent. Both configurations were based on radiation-grafted polymer fibers.
Uranium extraction was successful with the floating stacks, however; the cost of fabricating the
floating frames and absorbent beds were found to be highly cost-prohibitive. The cost was
reduced 40% by the development of the braid absorbents, which were moored to the sea floor to
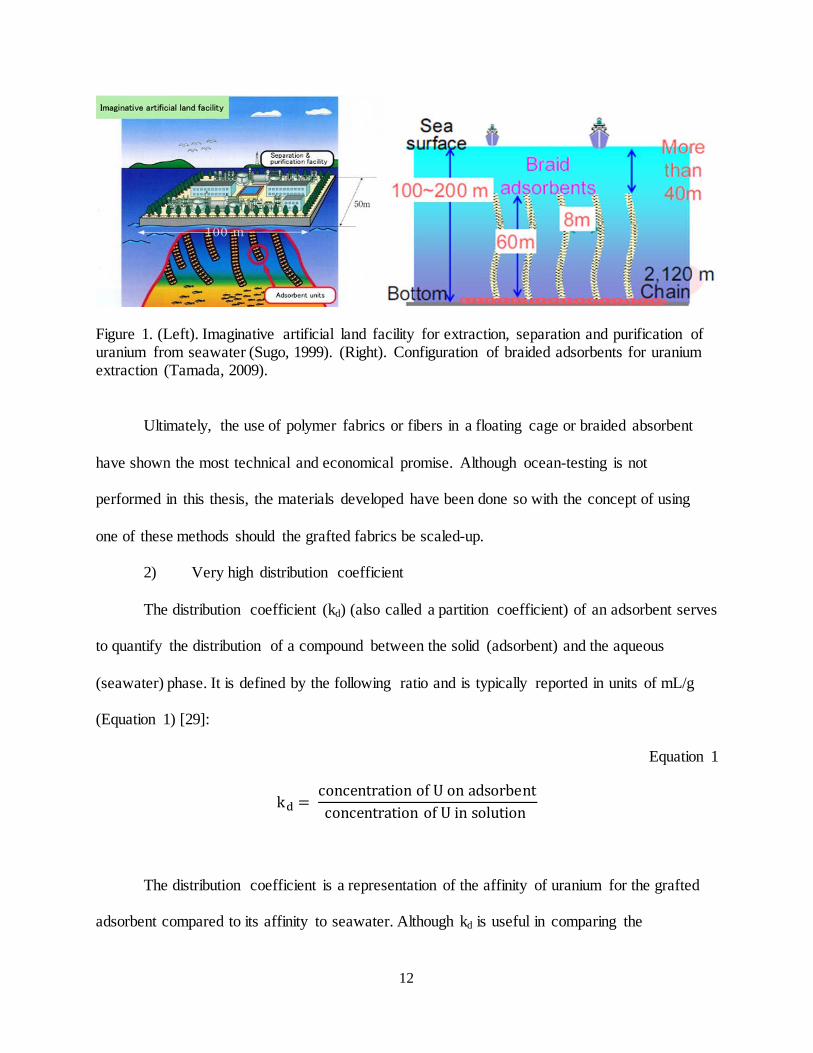
allow wave and tidal motion to drive the extraction process (Figure 1).
12
Figure 1. (Left). Imaginative artificial land facility for extraction, separation and purification of uranium from seawater (Sugo, 1999). (Right). Configuration of braided adsorbents for uranium extraction (Tamada, 2009).
Ultimately, the use of polymer fabrics or fibers in a floating cage or braided absorbent
have shown the most technical and economical promise. Although ocean-testing is not
performed in this thesis, the materials developed have been done so with the concept of using
one of these methods should the grafted fabrics be scaled-up.
2) Very high distribution coefficient
The distribution coefficient (kd) (also called a partition coefficient) of an adsorbent serves
to quantify the distribution of a compound between the solid (adsorbent) and the aqueous
(seawater) phase. It is defined by the following ratio and is typically reported in units of mL/g
(Equation 1) [29]:
Equation 1
kd = concentration of U on adsorbentconcentration of U in solution
The distribution coefficient is a representation of the affinity of uranium for the grafted
adsorbent compared to its affinity to seawater. Although kd is useful in comparing the
13
effectiveness of different adsorbents (say, comparing adsorbents with two different degrees of
grafting), it must be noted that this value cannot be used to compare the performance of samples
determined under different extraction conditions.
It can be demonstrated through Equation 1 that, in a laboratory setting, an increase in
solution volume and hence, an increase in total uranium content will increase kd. Likewise, a
decrease in adsorbent mass will also increase kd. Many parameters do not affect the distribution
coefficient of the system. For this reason, the kd can be used to compare adsorbents tested under
the following conditions:
• Different values of pH
• Different temperature
• Different adsorbent composition
For the purposes of this dissertation, distribution coefficients are not to be used to compare
the performance of adsorbents in different experiments, i.e. a distribution coefficient obtained in
a maximum loading experiment (performed in 100 mL of solution) cannot be compared to a
distribution coefficient obtained in a temperature experiment (performed in 40 mL of solution).
3) A high selectivity for uranium
Over 98% of uranium dissolved in seawater is in the form of a uranyl tri-carbonate
complex, the negatively-charged UO2(CO3)34- [30]. This stable carbonate form exists in the
presence of competing metal ions such as Na+, K+, Ca2+ and Mg2+, some of which have
concentrations in seawater up to one million times that of uranium ions. An adsorbent that has
the ability to discriminate between these competing ions and the ions of interest (and ultimately,
retain the ion of interest) is said to have favorable selectivity. In the proposed work, selectivity is
a characteristic of the complexing monomer. For this reason, utilizing a complexing monomer
14
with a higher selectivity towards uranium may reduce the required mass of adsorbent and,
subsequently, decrease cost.
4) High loading capacity
Loading capacity is defined as the total mass of adsorbate that can be retained by a given
mass of adsorbent under optimal conditions [31]. Although this value is proportional to the
number of available sites on the adsorbent surface, the presence of competing ions must be taken
into account as these species will inevitably inhabit bonding sites. Loading of uranium is
reported in units of mg-U/g-adsorbent or as percent mass of the total loaded adsorbent for a
given adsorption time. The average loading reported by Tamada et al. was 1.5 g-U/kg-adsorbent
over a 30-day collection period [12].
5) Capacity for regeneration
If the collection of uranium from seawater is to be considered economically competitive
with conventional mining, it is imperative that the adsorbent fabric has the capacity for multiple
cycles of re-use (“regeneration”). Steps in this process include rinsing or soaking the uranium-
loaded adsorbent in an eluent solution to remove the uranium, then preparing it to be returned for
collection. A suitable eluent must meet several criteria: 1) it must effectively remove a large
fraction of the uranium from the adsorbent fabric, 2) it must not damage the adsorbent fabric in
the process, 3) it must not be harmful to the environment and 4) it must be economical.
The regeneration capacity of the adsorbents developed in this thesis was not studied and
should be considered a logical next-step if this work is to be continued.
6) Rapid loading kinetics
Faster loading kinetics will result in a reduction of the required contact time between the
adsorbent fabric and the seawater to achieve a desired level of loading. This has a direct
15
influence on the cost-effectiveness of the technology, as shorter loading times may enable greater
overall uranium collection for a fixed amount of time. At some point during the adsorption
process, loading is expected to reach an equilibrium, at which point it is no longer cost effective
to continue collection. The adsorbent should then be removed from the sea for elution.
2.5 Interaction of Ionizing Radiation with Matter
The behavior of interaction between radiation and matter is determined by the charge (if
any) of the radiation, the radiation energy and the properties of the material in which it interacts.
Alpha particles (α), beta particles (β-) and heavy charged particles are considered “directly
ionizing” radiation, since enough energy is transferred to the target material through Coulomb
interactions to eject an electron and produce an ion pair. Indirectly ionizing radiation includes
gamma rays (γ), x-rays and neutrons (n), which carry no charge and therefore do not react as
strongly with matter.
Unlike alpha and beta radiation, which produce thousands of ionizations per incident
particle, gamma rays produce ion pairs through one of three mechanisms: the Compton scatter
mechanism, the photoelectric effect and pair production. The dominant mechanism is dependent
upon the incident photon energy and the atomic number of the absorber. Free electrons produced
through these mechanisms travel along their own track, producing secondary ionizations as they
interact with atoms of the target material.
For the purposes of polymer modification, the gamma sources typically used are
composed of Co-60 or Cs-137 radioisotopes. Consider the case of photons from Co-60 (1.17 and
1.33 MeV) and Cs-137 (662 keV) interacting with a material of moderate (<80) atomic number.
16
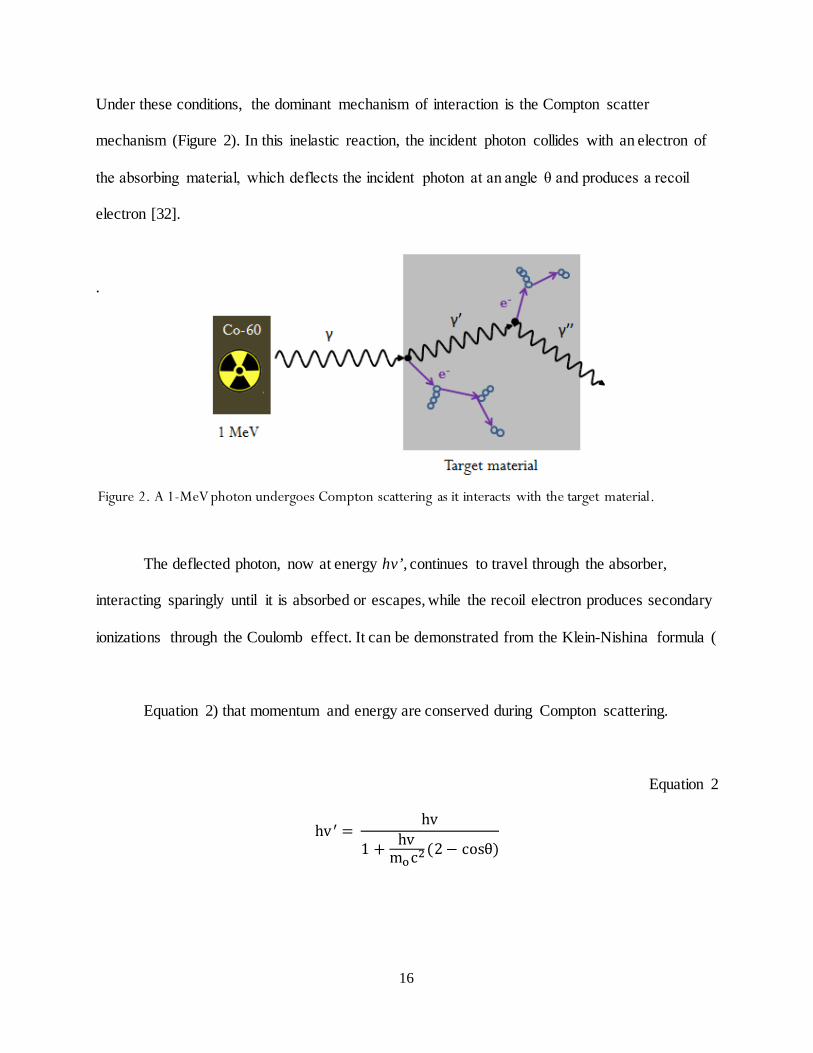
Figure 2. A 1-MeV photon undergoes Compton scattering as it interacts with the target material.
Under these conditions, the dominant mechanism of interaction is the Compton scatter
mechanism (Figure 2). In this inelastic reaction, the incident photon collides with an electron of
the absorbing material, which deflects the incident photon at an angle θ and produces a recoil
electron [32].
.
The deflected photon, now at energy hv’, continues to travel through the absorber,
interacting sparingly until it is absorbed or escapes, while the recoil electron produces secondary
ionizations through the Coulomb effect. It can be demonstrated from the Klein-Nishina formula (
Equation 2) that momentum and energy are conserved during Compton scattering.
Equation 2
hv ′ = hv
1 + hvmoc2(2− cosθ)
17
Where:
hv = incident photon energy
m0c2 = rest mass energy of an electron (0.511 MeV)
Θ = photon scattering angle
It must be noted that without the ejection of the electron by the Compton scatter
interaction, the photon itself would produce no changes in the target material. It is for this reason
that radiation chemical reactions are based entirely on the interactions between electrons and
matter and, ultimately, that the basic chemical mechanisms behind electron beam and gamma
irradiation are the same, despite significant differences in dose rates and the source of radiation.
Accelerator-produced electron beams are perhaps the most widely used radiation source
for grafting applications. Electrons interact with matter via Coulomb interactions and dissipate
their kinetic energy through three interactions: excitation, ionization and Bremsstrahlung
emission. Excitation occurs when the incident electron transfers enough energy to the target
atom to promote one of its electrons to a higher energy level. The electron subsequently de-
excites to a lower energy level through photon emission (fluorescence or phosphorescence) or
the emission of an Auger electron [33], [34].
Bremsstrahlung, German for “braking radiation”, is emitted when the electron is
deflected and subsequently decelerated by the electric field of a target atom. The ratio of specific
energy loss from Bremsstrahlung to that of collisional (ionization and excitation) losses is
dependent upon the atomic number of the absorber and the electron energy and is expressed by
Equation 3 [32].

18
Equation 3
(𝑑𝑑/𝑑𝑑)𝑟𝑟𝑟(𝑑𝑑/𝑑𝑑)𝑐𝑐𝑐
≅ 𝑑𝐸700
Where:
(𝑑𝑑/𝑑𝑑)𝑟𝑟𝑟 = Specific energy loss due to Bremsstrahlung
(𝑑𝑑/𝑑𝑑)𝑐𝑐𝑐 = Specific energy loss due to collision interactions
E = Incident electron energy (MeV)
Z = Atomic number of the absorber
Ionization reactions typically account for approximately 70% of the energy deposited by
the incident electron [34]. Ionization occurs when the incident electron transfers enough kinetic
energy to a target atom to exceed its binding energy, which results in the ejection of the electron
and the formation of an ion pair consisting of the positively-charged ion and the negatively-
charged electron. A 10 keV electron may produce over 450 secondary electrons before it is
absorbed, however; if the ejected electron has enough energy to produce further ionizations, it is
referred to as a “delta ray” [35], [34].
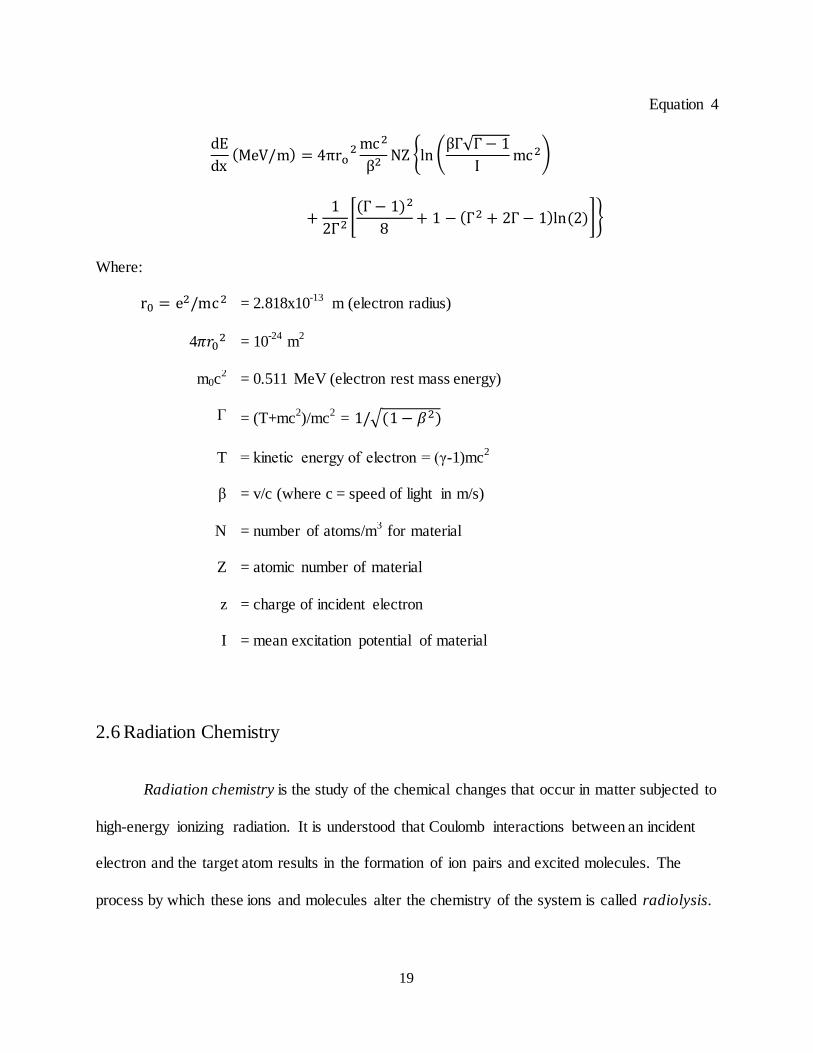
The primary electron slows down as it travels through matter, losing energy through
bremsstrahlung and the through formation of ion pairs and excited molecules. The rate of energy
loss is dependent upon the kinetic energy of the incident electron and the atomic number and
number density of the target material. This rate is calculated using the Bethe formula (
Equation 4):
19
Equation 4
dEdx
(MeV/m) = 4πro2mc2
β2 NZ �ln �βΓ√Γ− 1
I mc2�
+12Γ2
�(Γ − 1)2
8 + 1 − (Γ2 + 2Γ − 1)ln (2)��
Where:
r0 = e2/mc2 = 2.818x10⁻¹³ m (electron radius)
4𝜋𝑟02 = 10-24 m2
m0c2 = 0.511 MeV (electron rest mass energy)
Γ = (T+mc2)/mc2 = 1/�(1− 𝛽2)
T = kinetic energy of electron = (γ-1)mc2
β = v/c (where c = speed of light in m/s)
N = number of atoms/m3 for material
Z = atomic number of material
z = charge of incident electron
I = mean excitation potential of material
2.6 Radiation Chemistry
Radiation chemistry is the study of the chemical changes that occur in matter subjected to
high-energy ionizing radiation. It is understood that Coulomb interactions between an incident
electron and the target atom results in the formation of ion pairs and excited molecules. The
process by which these ions and molecules alter the chemistry of the system is called radiolysis.
20
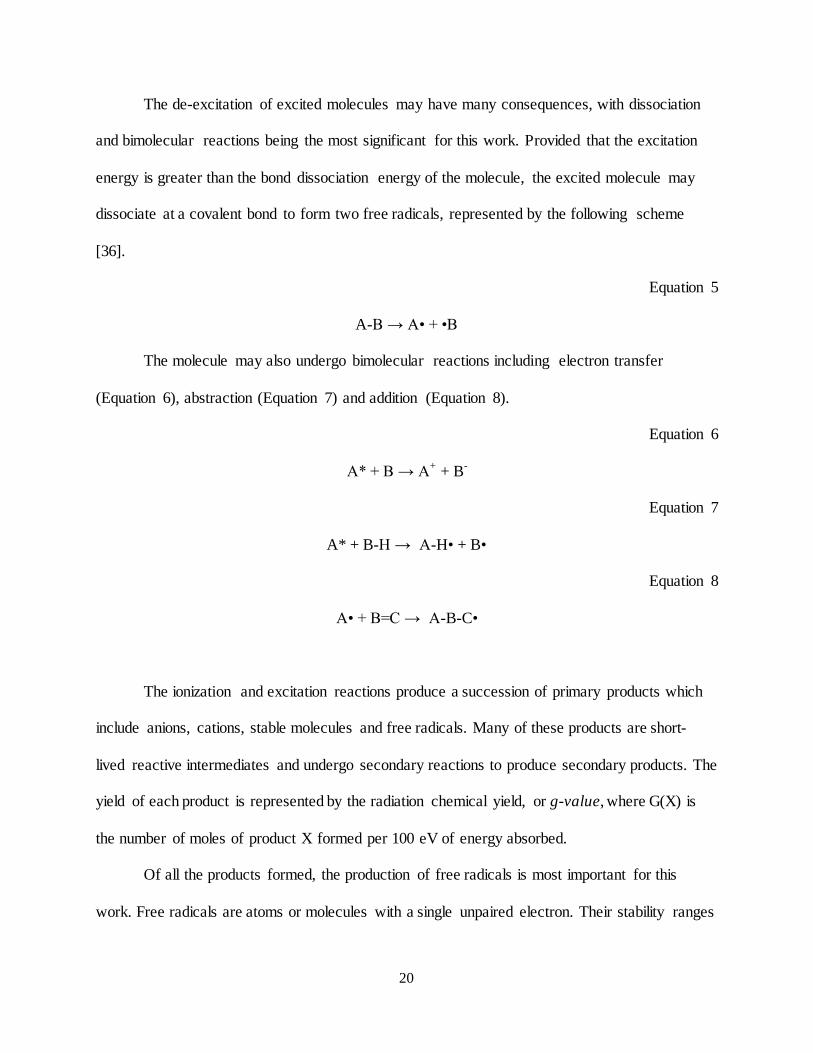
The de-excitation of excited molecules may have many consequences, with dissociation
and bimolecular reactions being the most significant for this work. Provided that the excitation
energy is greater than the bond dissociation energy of the molecule, the excited molecule may
dissociate at a covalent bond to form two free radicals, represented by the following scheme
[36].
Equation 5
A-B → A• + •B
The molecule may also undergo bimolecular reactions including electron transfer
(Equation 6), abstraction (Equation 7) and addition (Equation 8).
Equation 6
A* + B → A+ + B-
Equation 7
A* + B-H → A-H• + B•
Equation 8
A• + B=C → A-B-C•
The ionization and excitation reactions produce a succession of primary products which
include anions, cations, stable molecules and free radicals. Many of these products are short-
lived reactive intermediates and undergo secondary reactions to produce secondary products. The
yield of each product is represented by the radiation chemical yield, or g-value, where G(X) is
the number of moles of product X formed per 100 eV of energy absorbed.
Of all the products formed, the production of free radicals is most important for this
work. Free radicals are atoms or molecules with a single unpaired electron. Their stability ranges
21
from very reactive, such as the hydroxyl radical (•OH) formed in large quantities by the
radiolysis of water, to stable, such as the alanine radical (CH3C•HCOO-) used in radiation
dosimetry.
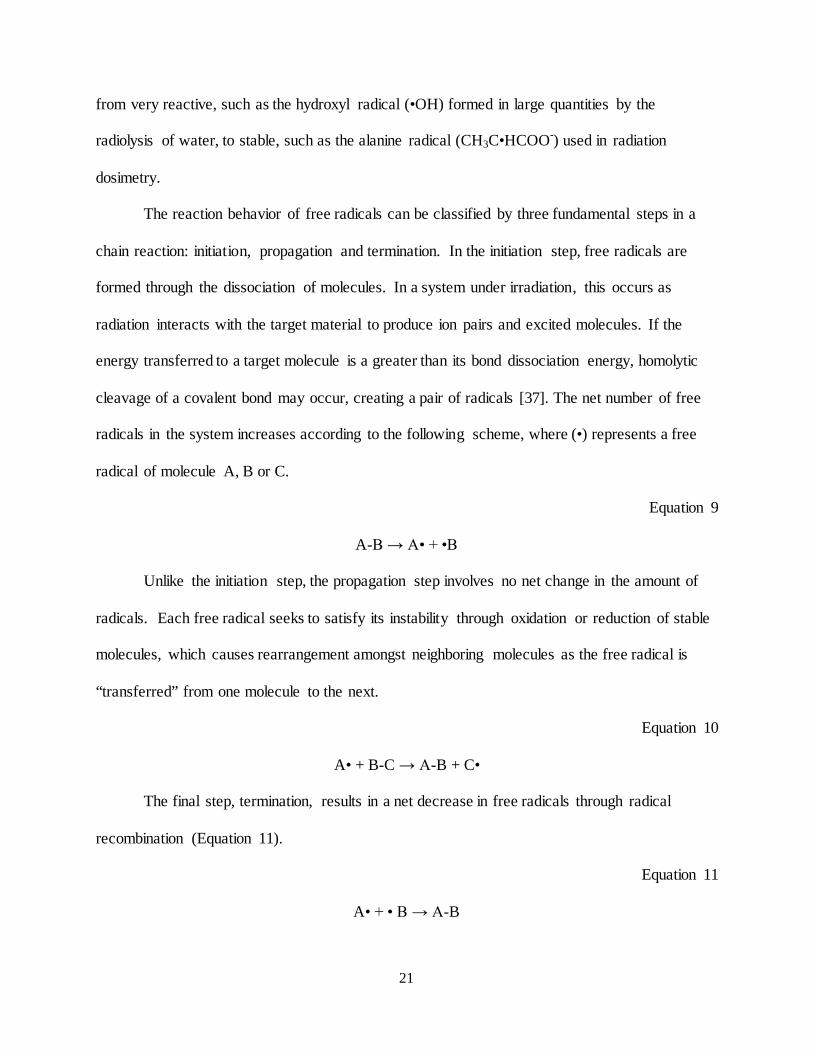
The reaction behavior of free radicals can be classified by three fundamental steps in a
chain reaction: initiation, propagation and termination. In the initiation step, free radicals are
formed through the dissociation of molecules. In a system under irradiation, this occurs as
radiation interacts with the target material to produce ion pairs and excited molecules. If the
energy transferred to a target molecule is a greater than its bond dissociation energy, homolytic
cleavage of a covalent bond may occur, creating a pair of radicals [37]. The net number of free
radicals in the system increases according to the following scheme, where (•) represents a free
radical of molecule A, B or C.
Equation 9
A-B → A• + •B
Unlike the initiation step, the propagation step involves no net change in the amount of
radicals. Each free radical seeks to satisfy its instability through oxidation or reduction of stable
molecules, which causes rearrangement amongst neighboring molecules as the free radical is
“transferred” from one molecule to the next.
Equation 10
A• + B-C → A-B + C•
The final step, termination, results in a net decrease in free radicals through radical
recombination (Equation 11).
Equation 11
A• + • B → A-B
22
The identities of the primary and secondary products, as well as their radiation-chemical
yields and reaction rate constants are unique to each system. A detailed description of the
radiolysis of water under electron beam and gamma irradiation is provided in Section 3.3.1.
2.7 Free Radical Polymerization
Free radical polymerization utilizes the reactive nature of free radicals to produce
polymers of high molecular weight from monomers of lower molecular weight2. Types of
polymer products include homopolymers, in which a single type of monomer is polymerized and
copolymers, in which two or more types of monomers are polymerized with each other.
Examples include homopolymers (-AAAA-), block copolymers (-AABBAA-), random
copolymers (-AABABBB-) and graft copolymers, which are discussed in detail in the following
section.
In a polymerization system, the mechanisms behind the three free radical reactions
(initiation, propagation and termination) are now expanded to include the behavior of the
radiation-polymer system. What is now considered the “classical theory” of free radical
polymerization was pioneered by Flory and hold true for most systems regardless of the chemical
composition [38].
In the initiation reaction, free radicals are generated through homolysis and immediately
seek stability by “stealing” an electron from another molecule. In a system free of chemical
initiators, such as in radiation-induced polymerization, the initiation step may take place in the
solvent, the monomer or the polymeric substrate and is represented by the Equation 12. In the 2 A monomer is a compound that represents a single chemical unit. To form a polymer, two or more monomers are chemically bonded to form a polymer chain.
23
following reactions, (R) represents a molecule formed upon homolysis of a solvent molecule and
kd is the dissociation rate constant.
Equation 12
A 𝑘𝑑�� 2R•
The propagation reaction may take many forms depending upon the nature of the system.
The highly-reactive free radical may undergo a sequence of addition reactions in which
monomer molecules are bonded to form a polymer chain which continues to grow as the free
radical propagates along the chain through electron transfer (Equation 13, Equation 14).
Equation 13
R• + AB 𝑘𝑝�� R-AB•
Where:
kp = propagation rate constant
Equation 14
R-AB• + AB 𝑘𝑝�� R-AB-AB•
The termination step is a recombination of two radicals, the identity of which can be the same
species or a different species altogether (Equation 15).
Equation 15
2A• 𝑘𝑡→ products
Where:
kt = termination rate constant
24
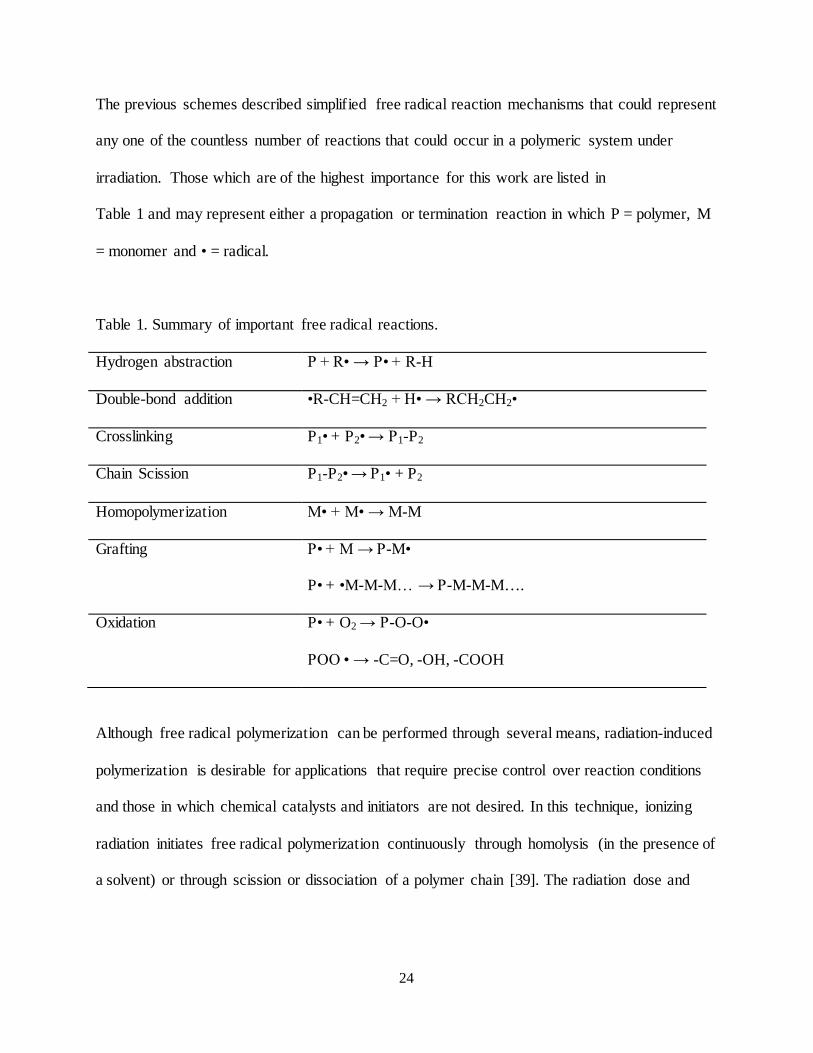
The previous schemes described simplified free radical reaction mechanisms that could represent
any one of the countless number of reactions that could occur in a polymeric system under
irradiation. Those which are of the highest importance for this work are listed in
Table 1 and may represent either a propagation or termination reaction in which P = polymer, M
= monomer and • = radical.
Table 1. Summary of important free radical reactions.
Hydrogen abstraction P + R• → P• + R-H
Double-bond addition •R-CH=CH2 + H• → RCH2CH2•
Crosslinking P1• + P2• → P1-P2
Chain Scission P1-P2• → P1• + P2
Homopolymerization M• + M• → M-M
Grafting P• + M → P-M•
P• + •M-M-M… → P-M-M-M….
Oxidation P• + O2 → P-O-O•
POO • → -C=O, -OH, -COOH
Although free radical polymerization can be performed through several means, radiation-induced
polymerization is desirable for applications that require precise control over reaction conditions
and those in which chemical catalysts and initiators are not desired. In this technique, ionizing
radiation initiates free radical polymerization continuously through homolysis (in the presence of
a solvent) or through scission or dissociation of a polymer chain [39]. The radiation dose and
25
dose rate can be controlled to create polymerized products through crosslinking, scission
(degradation) or grafting reactions depending upon the materials and methods used.
2.8 Radiation-Induced Grafting
Radiation-induced grafting is a copolymerization technique that uses ionizing radiation to
impart desired chemical functional groups onto a polymeric substrate while retaining the
properties of both constituents – often without the need for catalysts, initiators or elevated
temperatures. Examples of applications of radiation-grafted polymers include those for the
removal of ions from solution, ion exchange membranes [40], fuel cell membranes [41],
hydrogels and biomaterials [42].
Most relevant to this thesis is the application of radiation-grafted polymers for selective
adsorption. Depending upon the desired function, these adsorbents typically take the form of
grafted fibers, fabrics, films or membranes. Chelating or complexing functionality is imparted to
the polymeric substrate by grafting functional monomers to the surface (surface grafting) or
through the depth of the substrate (bulk grafting) [43]. In addition to ions of uranium, adsorbates
investigated for separation using radiation-grafting of polymers include ions of mercury [44],
copper [45], germanium [46], cadmium [47], antimony [48] and many more.
26
A typical system for radiation graft polymerization consists of a polymeric substrate (also
called the “polymer backbone” and often in the form of a fiber, film or fabric), one or more
functional monomers and (possibly) a solvent. The role of the polymeric substrate is to act as a
graft-able surface with useful mechanical properties, while the role of the monomer is to
functionalize the substrate. The final product can be represented by Figure 3 in which the “A”
units compose the polymeric substrate and the “B” units are the grafted, polymerized monomer
units.
The radiation-chemical mechanisms and associated kinetics behind radiation-induced
grafting depend on the grafting method and the materials used. Popular grafting methods include
indirect grafting (or” pre-irradiation method”), direct grafting (“simultaneous” or “mutual
irradiation” method), the neat method and the peroxide method [49]. By far the most widely used
are the indirect and direct grafting methods. Selection of the most appropriate method is
dependent upon the materials and equipment available as well as the constraints in time and cost.
Indirect grafting is accomplished via irradiation of the polymeric substrate in the absence
of solvent or monomer. This can be performed under vacuum or inert gas. If the substrate is a
Figure 3. Basic schematic of a grafted structure composed of monomer units (A) grafted to a polymer backbone (B).
27
semicrystalline polymer, this is often performed at a temperature below the glass transition
temperature in order to obtain a high concentration of free radicals in the crystalline region. The
result is a large amount of “trapped” radicals that can survive until the grafting is performed. For
the grafting reaction, the substrate is transferred to a solution containing the monomer and
solvent and is allowed to react.
In this method, free radicals are created on the polymeric substrate (P P•). Upon
contact with the monomer, these radicals propagate through the reaction P• + M → P-M• to form
long branches of polymerized monomer. An obvious advantage of indirect grafting is the
minimal formation of homopolymer through the M• + M• → M-M reaction, as free radicals are
generated only on the polymer and not in the solvent/monomer mixture.
A major disadvantage of the indirect method includes the need for “transfer time”
between irradiation and grafting. The concentration of free radicals on the polymer substrate
begins to immediately decay, resulting in the consumption and elimination of potential grafting
sites. On the surface of the polymer, this radical decay manifests itself in crosslinking (P1• + P2•
→ P1-P2), scission (P1-P2• → P1• + P2) or (if oxygen is present) oxidative degradation. These
reactions minimized through rapid transfer of the irradiated substrate to the monomer solution.
Direct grafting is performed by irradiating the polymeric substrate along with the
monomer. The monomer may be in the gas or liquid phase and, if in the liquid phase, is typically
dissolved in a solvent. In this method, newly-initiated radicals can react immediately and
multiple radical reactions occur simultaneously. In the absence of oxygen, these include radical
formation on the surface of the polymer substrate and monomer (P P•) (M M•), addition to
monomer molecules (•R-CH=CH2 + H• → RCH2CH2•), homopolymer formation (M• + M• →
M-M), hydrogen abstraction of the polymeric backbone (P + R• → P• + R-H), graft propagation
28
(P• + M → P-M•), graft termination (P• + •M-M-M… → P-M-M-M….) and crosslinking (P1• +
P2• → P1-P2) or scission (P1-P2• → P1• + P2) of the polymeric backbone .
Solution grafting is performed via the direct grafting of a monomer/polymer system in
the presence of a liquid solvent. The solvent serves to reduce the viscosity of the reaction
mixture to reduce monomer-monomer reactions that may lead to autoacceleration. In the
autoacceleration effect (also called the “Trommsdorff” or “gel effect”), an excessive increase in
the viscosity of a monomer system due to chain propagation limits the termination reaction by
restricting the diffusion of active chains [33]. The result is a rapid, uncontrolled increase in the
rate of chain propagation. In the case of bulk grafting, the solvent also enhances the diffusion of
monomer molecules into the polymer substrate.
The primary advantage of direct grafting is the simplicity of and the control over the
grafting conditions. The atmosphere of the sample (air, inert gas, N2O, etc.) and temperature of
the irradiation are easily maintained. Radicals formed are readily consumed - not wasted by
decay while transferring the irradiated polymer to the monomer solution. Another major
advantage is that the direct grafting method often requires lower doses than the indirect method
[50], [51].
The main disadvantage of the direct method is that the homopolymerization reaction (M•
+ •M →M-M) may occur at a greater rate than the grafting reaction (P• + M → P-M•),
particularly with vinyl or acrylic monomers [33], [52]. This occurs in systems such as direct
grafting where solvent-based free radical initiation predominates. In these cases, radical transfer
to the dissolved monomer is quicker, resulting in a higher yield for monomer-centered radicals
(M•) over polymer-centered radicals (P•).
29
Homopolymer is a product of monomer-monomer reactions which result in polymerized
monomer that is not covalently bonded to the substrate. The monomer free radicals that cause
homopolymerization reactions can be produced from chain transfer reactions from the solvent (in
the case of direct grafting) or the substrate (in the case of indirect grafting). Homopolymer is
often undesirable for several reasons, several of which are listed as follows.
• The homopolymer is loosely bound to the polymer surface and may release when the
grafted fabric is used for its intended function
• The homopolymer must be removed through the labor-intensive and potentially costly
process of solvent extraction that includes alternating periods of washing and drying
• Homopolymer that is not removed will contribute additional mass to the grafted polymer,
giving a false indication of the degree of grafting
• Irradiations involving the use of inhibitors to control homopolymerization have been
shown to require higher doses to compensate for their effects. This increases processing
cost and may induce radiation damage to the polymeric substrate
Homopolymerization can be controlled with the use of inhibitors, by swelling the polymer
substrate with solvent, by applied a low dose rate and by irradiating the monomer in the vapor
form [49]. In applications where homopolymer formation cannot be controlled by these methods,
care must be taken to sufficiently wash the grafted products after irradiation to remove as much
homopolymer as possible.
The mechanisms and products behind radiation-induced polymerization are highly
dependent upon two irradiation variables – the absorbed dose and dose rate. The absorbed dose
is the energy absorbed by matter per unit mass (1 J/kg = 1 Gray (Gy) or 100 rad), while the dose
rate is the absorbed dose per unit time (rad/s, kGy/hr, etc.) [53]. These variables, particularly the
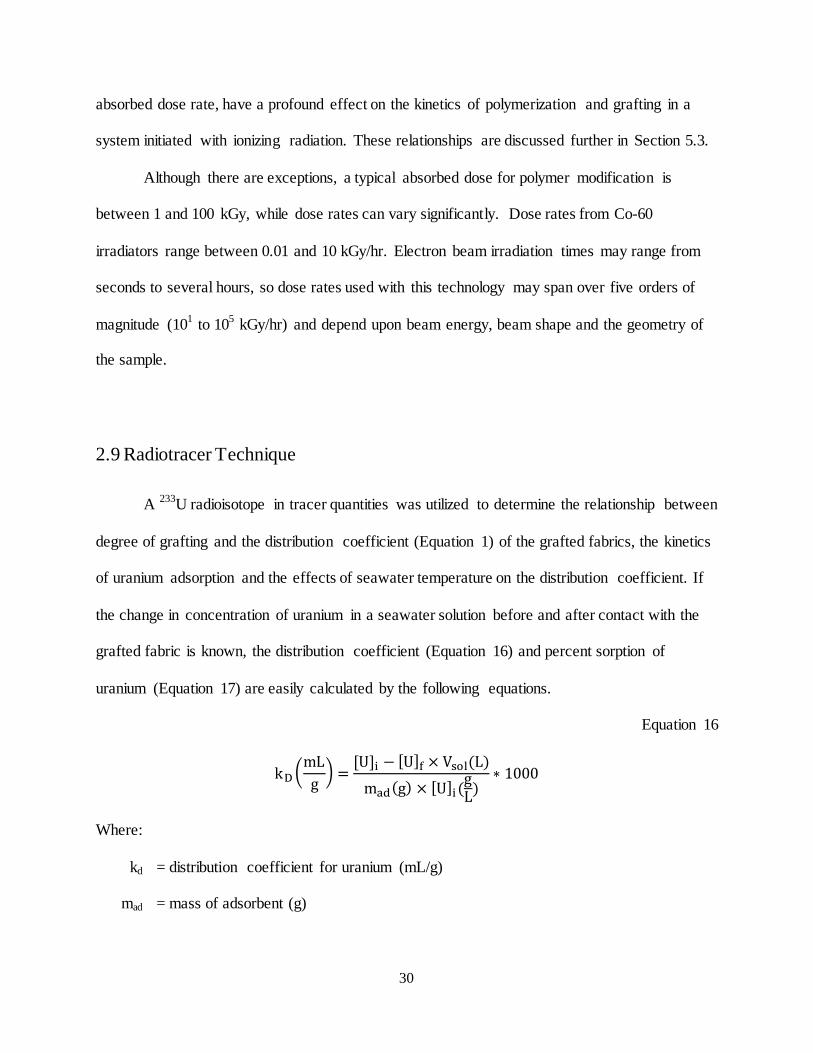
30
absorbed dose rate, have a profound effect on the kinetics of polymerization and grafting in a
system initiated with ionizing radiation. These relationships are discussed further in Section 5.3.
Although there are exceptions, a typical absorbed dose for polymer modification is
between 1 and 100 kGy, while dose rates can vary significantly. Dose rates from Co-60
irradiators range between 0.01 and 10 kGy/hr. Electron beam irradiation times may range from
seconds to several hours, so dose rates used with this technology may span over five orders of
magnitude (101 to 105 kGy/hr) and depend upon beam energy, beam shape and the geometry of
the sample.
2.9 Radiotracer Technique
A 233U radioisotope in tracer quantities was utilized to determine the relationship between
degree of grafting and the distribution coefficient (Equation 1) of the grafted fabrics, the kinetics
of uranium adsorption and the effects of seawater temperature on the distribution coefficient. If
the change in concentration of uranium in a seawater solution before and after contact with the
grafted fabric is known, the distribution coefficient (Equation 16) and percent sorption of
uranium (Equation 17) are easily calculated by the following equations.
Equation 16
kD�mL
g� =
[U]i − [U]f × Vsol(L)mad(g) × [U]i(
gL)
∗ 1000
Where:
kd = distribution coefficient for uranium (mL/g)
mad = mass of adsorbent (g)
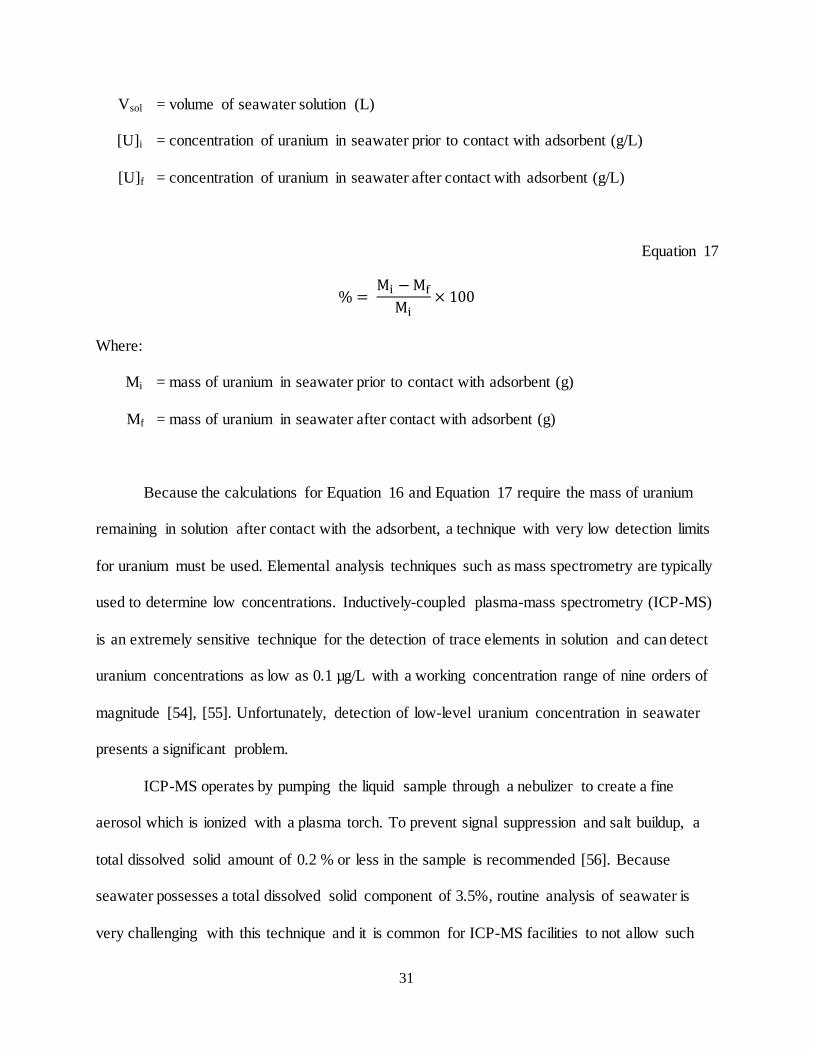
31
Vsol = volume of seawater solution (L)
[U]i = concentration of uranium in seawater prior to contact with adsorbent (g/L)
[U]f = concentration of uranium in seawater after contact with adsorbent (g/L)
Equation 17
% = Mi −Mf
Mi× 100
Where:
Mi = mass of uranium in seawater prior to contact with adsorbent (g)
Mf = mass of uranium in seawater after contact with adsorbent (g)
Because the calculations for Equation 16 and Equation 17 require the mass of uranium
remaining in solution after contact with the adsorbent, a technique with very low detection limits
for uranium must be used. Elemental analysis techniques such as mass spectrometry are typically
used to determine low concentrations. Inductively-coupled plasma-mass spectrometry (ICP-MS)
is an extremely sensitive technique for the detection of trace elements in solution and can detect
uranium concentrations as low as 0.1 µg/L with a working concentration range of nine orders of
magnitude [54], [55]. Unfortunately, detection of low-level uranium concentration in seawater
presents a significant problem.
ICP-MS operates by pumping the liquid sample through a nebulizer to create a fine
aerosol which is ionized with a plasma torch. To prevent signal suppression and salt buildup, a
total dissolved solid amount of 0.2 % or less in the sample is recommended [56]. Because
seawater possesses a total dissolved solid component of 3.5%, routine analysis of seawater is
very challenging with this technique and it is common for ICP-MS facilities to not allow such
32
samples due to rapid degradation of the sensitive and expensive nebulizer [57]. Seawater samples
can be pre-treated before analysis using dilution, manual pre-concentration and matrix removal,
however; these methods are time consuming and may reduce the concentration of the analyte to
below the minimum detectable amount.
An alternative to elemental analysis is the radiotracer technique, in which radioactivity
concentrations are determined with radiation detection equipment. This technique operates on the
principal that all isotopes of a given element behave chemically in an identical manner, and that
a single radioisotope can replace all isotopes of the element in a system with no change in
chemical function. Common applications of radiotracers include medical imaging, tracking of
biological and environmental pathways and the use of various radioisotopes in hydraulic fracking
and oil exploration.
The use of a 233U tracer for determining extraction performance of a sorbent is not novel.
Das et al. developed a phosphate functionalized membrane for the extraction of uranium from
seawater and tested the uranium uptake using seawater spiked to 9.54 µg/mL 233U. Barber et al.
utilized a 233U radiotracer to compare the selectivity of amidoxime-functionalized ionic liquids
towards uranium, thorium and europium [58]. Yet unpublished as of this time, researchers at
Hunter College of the City University of New York have also been using 233U to determine
uranium uptake of solid sorbents [59].
Quantification of 233U in seawater solution is best performed through alpha counting,
which allows alpha particles emitted by a sample to be counted without chemical separation [60].
Several methods of alpha counting exist; however, the low penetrability of alpha particles makes
self-absorption a major concern. This concern can be avoided by performing liquid scintillation
counting.
33
Liquid scintillation is a method for detecting alpha and beta radiation in a liquid sample
and features detection efficiencies up to 100%. In this method, the liquid radioactive sample is
intermixed and counted simultaneously with a scintillation cocktail. The cocktail is a mixture of
solvents and detergents that contain a fluorescent component that emits a detectable photon upon
collision with an alpha particle. A description of liquid scintillation counting can be found in
Chapter 4.
Using liquid scintillation, the distribution coefficient and percent sorption of uranium
from the seawater solution can be determined by converting the mixture count rate to activity
concentration (see Equation 32). The mass concentration is directly proportional to the activity
concentration.
34
Chapter 3. Materials
This section describes role and behavior of the materials that compose the grafted
adsorbent (the monomer and polymer substrate) along with those that are used in synthesis
(solvent) and extraction testing (radiotracer isotope). The criteria for the selection and testing of
these materials will be discussed and the available materials will be compared.
3.1 Complexing Monomer
The monomer used in graft copolymerization should fit two criteria:
1. The monomer must be polymerizable
2. The monomer functionality for complexing uranium must be retained after grafting
The ease of graft polymerization for the monomer depends first on the structure of the
macromolecular backbone and the method of grafting. For example, grafting with anionic
polymerization requires a copolymer backbone with specific reactive groups. For radiation-
induced grafting via the free radical mechanism, the backbone and the monomer must both be
capable of producing reactive centers.
Unsaturated monomers are used in a wide range of polymerization methods including
anionic polymerization, cationic polymerization, Ziegler-Natta polymerization and, most
importantly, free radical polymerization [61]. These polymers contain carbon-carbon double
bonds (vinyl bonds) which, due to their low bond dissociation energy, are easy targets for
reactive free radicals seeking to retrieve an electron. The characteristic polymerization reaction
undertaken by monomers containing terminal unsaturated centers is termed “vinyl
polymerization”.
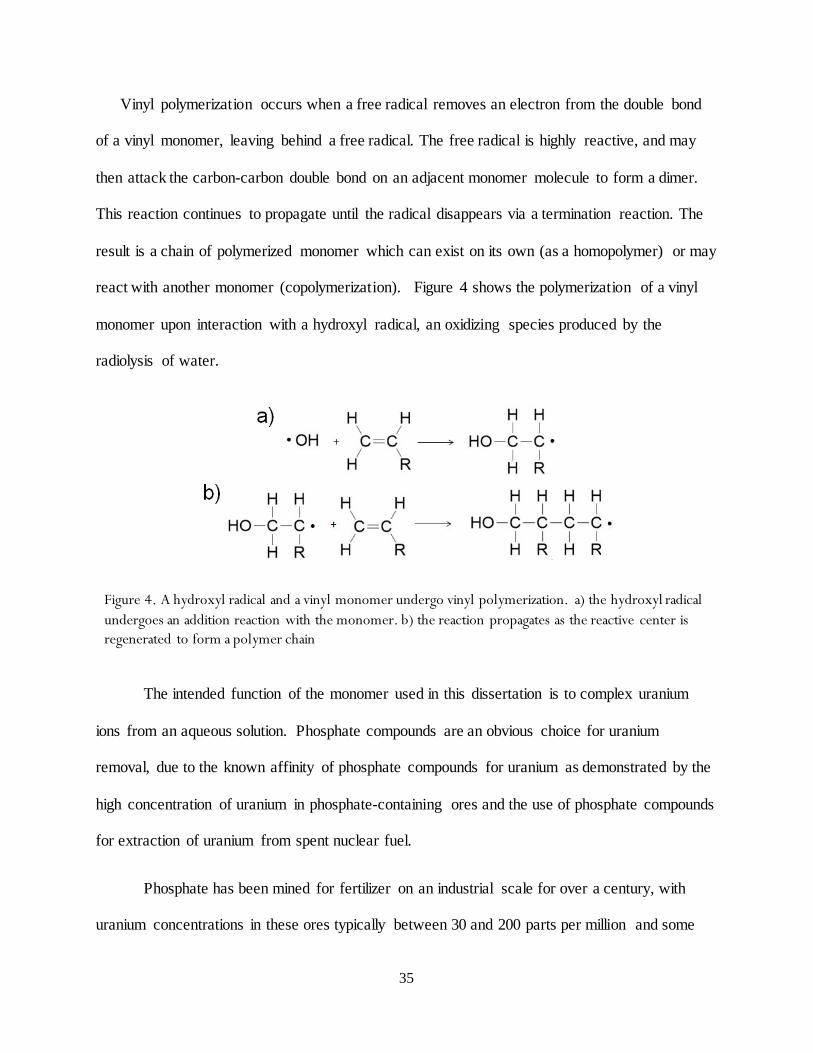
35
Vinyl polymerization occurs when a free radical removes an electron from the double bond
of a vinyl monomer, leaving behind a free radical. The free radical is highly reactive, and may
then attack the carbon-carbon double bond on an adjacent monomer molecule to form a dimer.
This reaction continues to propagate until the radical disappears via a termination reaction. The
result is a chain of polymerized monomer which can exist on its own (as a homopolymer) or may
react with another monomer (copolymerization). Figure 4 shows the polymerization of a vinyl
monomer upon interaction with a hydroxyl radical, an oxidizing species produced by the
radiolysis of water.
The intended function of the monomer used in this dissertation is to complex uranium
ions from an aqueous solution. Phosphate compounds are an obvious choice for uranium
removal, due to the known affinity of phosphate compounds for uranium as demonstrated by the
high concentration of uranium in phosphate-containing ores and the use of phosphate compounds
for extraction of uranium from spent nuclear fuel.
Phosphate has been mined for fertilizer on an industrial scale for over a century, with
uranium concentrations in these ores typically between 30 and 200 parts per million and some
Figure 4. A hydroxyl radical and a vinyl monomer undergo vinyl polymerization. a) the hydroxyl radical undergoes an addition reaction with the monomer. b) the reaction propagates as the reactive center is regenerated to form a polymer chain
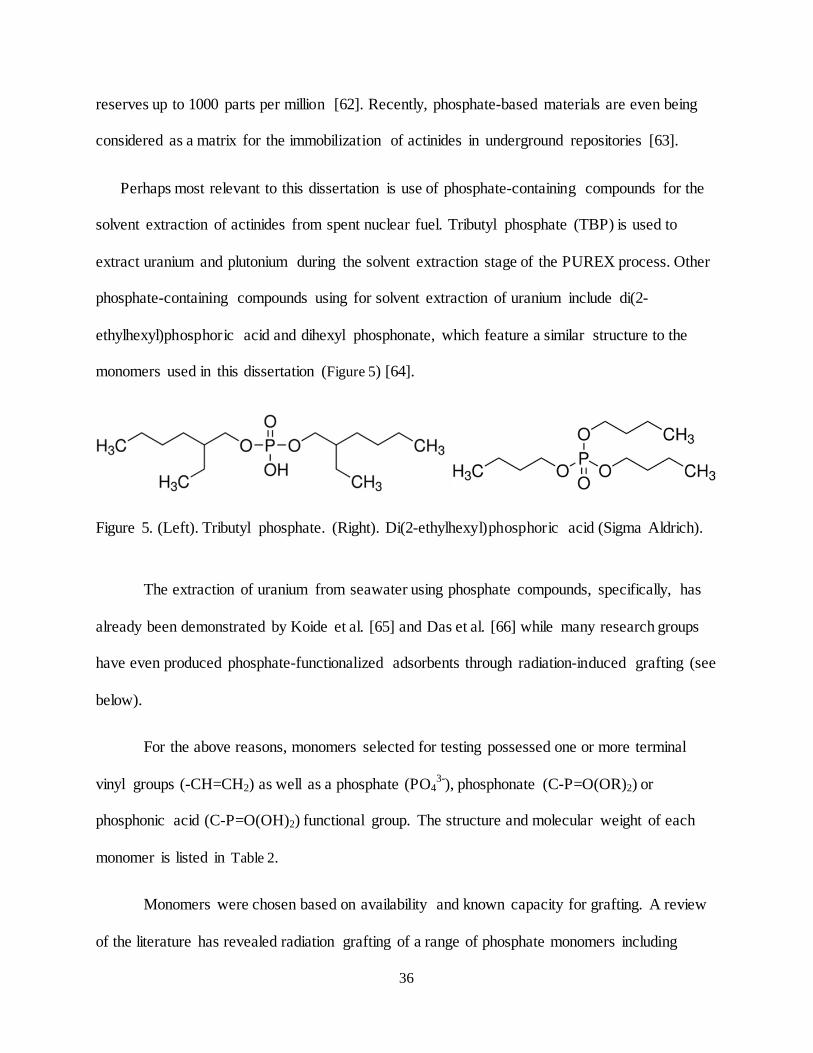
36
reserves up to 1000 parts per million [62]. Recently, phosphate-based materials are even being
considered as a matrix for the immobilization of actinides in underground repositories [63].
Perhaps most relevant to this dissertation is use of phosphate-containing compounds for the
solvent extraction of actinides from spent nuclear fuel. Tributyl phosphate (TBP) is used to
extract uranium and plutonium during the solvent extraction stage of the PUREX process. Other
phosphate-containing compounds using for solvent extraction of uranium include di(2-
ethylhexyl)phosphoric acid and dihexyl phosphonate, which feature a similar structure to the
monomers used in this dissertation (Figure 5) [64].
Figure 5. (Left). Tributyl phosphate. (Right). Di(2-ethylhexyl)phosphoric acid (Sigma Aldrich).
The extraction of uranium from seawater using phosphate compounds, specifically, has
already been demonstrated by Koide et al. [65] and Das et al. [66] while many research groups
have even produced phosphate-functionalized adsorbents through radiation-induced grafting (see
below).
For the above reasons, monomers selected for testing possessed one or more terminal
vinyl groups (-CH=CH2) as well as a phosphate (PO43-), phosphonate (C-P=O(OR)2) or
phosphonic acid (C-P=O(OH)2) functional group. The structure and molecular weight of each
monomer is listed in Table 2.
Monomers were chosen based on availability and known capacity for grafting. A review
of the literature has revealed radiation grafting of a range of phosphate monomers including
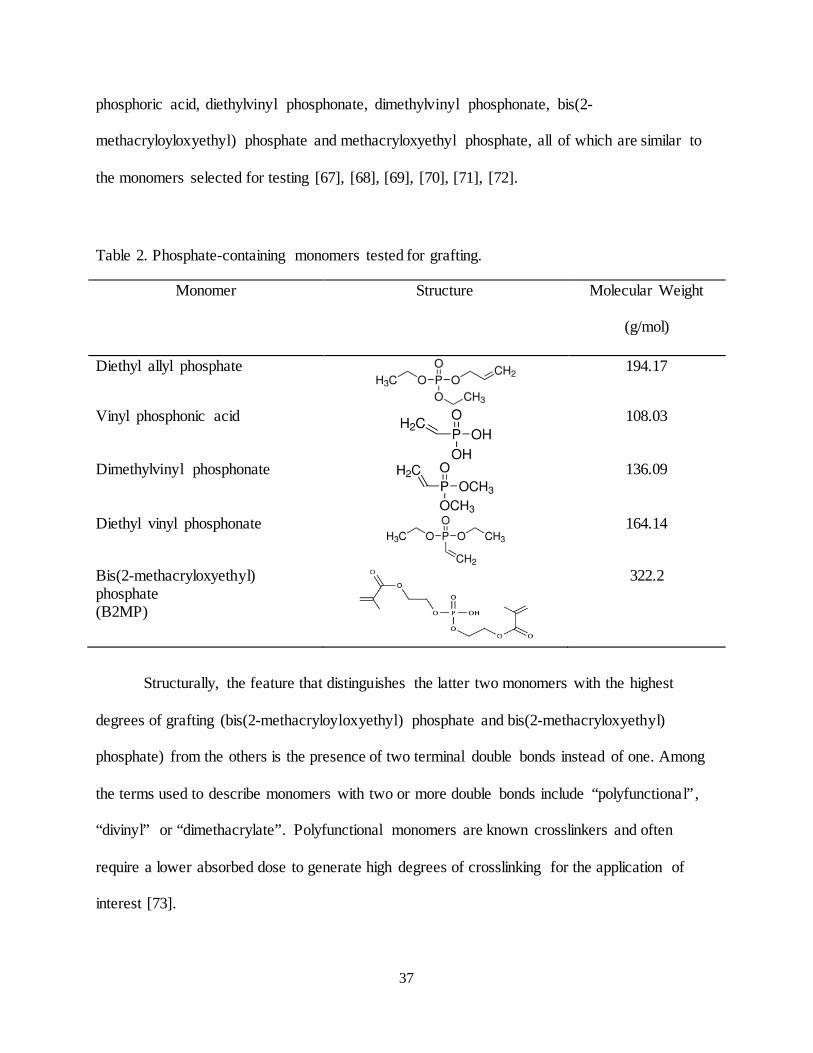
37
phosphoric acid, diethylvinyl phosphonate, dimethylvinyl phosphonate, bis(2-
methacryloyloxyethyl) phosphate and methacryloxyethyl phosphate, all of which are similar to
the monomers selected for testing [67], [68], [69], [70], [71], [72].
Table 2. Phosphate-containing monomers tested for grafting.
Monomer Structure Molecular Weight
(g/mol)
Diethyl allyl phosphate
194.17
Vinyl phosphonic acid
108.03
Dimethylvinyl phosphonate
136.09
Diethyl vinyl phosphonate
164.14
Bis(2-methacryloxyethyl) phosphate (B2MP)
322.2
Structurally, the feature that distinguishes the latter two monomers with the highest
degrees of grafting (bis(2-methacryloyloxyethyl) phosphate and bis(2-methacryloxyethyl)
phosphate) from the others is the presence of two terminal double bonds instead of one. Among
the terms used to describe monomers with two or more double bonds include “polyfunctional”,
“divinyl” or “dimethacrylate”. Polyfunctional monomers are known crosslinkers and often
require a lower absorbed dose to generate high degrees of crosslinking for the application of
interest [73].
38
Such monomers have been used as a branching agent in copolymerization reactions for
the synthesis of branched and hyperbranched polymers [74], [75]. In these applications, a very
large mole ratio of monovinyl to divinyl monomer (~30/1) is used to create star-like branched
copolymers at low monomer conversion and randomly-branched molecules at high monomer
conversion [75]. Similarly, polyfunctional monomers are used as additives to enhance the
radiation copolymerization of monomers such as styrene [76]. Polyfunctional monomers,
particularly multifunctional acrylates, are widely used in radiation curing applications where
high grafting yields are desirable [77].
Flame-retardant fabrics were synthesized via the UV-curing of di-methacryloyloxyethyl
phosphates onto polyethylene terephthalate and cotton [78]. Di-methacryloyloxyethyl phosphates
have also been the subject of many studies aiming to develop self-etching dental adhesives,
which bond restorative material to the tooth surface by polymerizing inside of enamel
micropores [79], [80]. With a structure similar to B2MP (the fifth monomer in Table 2), the
radiation grafting of (mono) methacryloxyethyl phosphate has been demonstrated for biomedical
applications [81]. Divinyl monomers have also been utilized in the synthesis of UV-curable latex
[82].
Unfortunately, studies have also shown that the polymerization of polyfunctional
monomers is complicated and can deviate from traditional theory [73], [83]. A comparison of the
degrees of grafting obtained with several monofunctional monomers to the polyfunctional
monomer bis(2-methacryloxyethyl) phosphate is presented in Section 5.1.1.
39
3.2 Polymeric Substrate
In grafted polymers, the polymeric substrate (also called “trunk polymer” or “polymer
backbone”) is the solid polymer to which new functionalities are added through co-
polymerization with a monomer. Polymeric substrates frequently used for grafting applications
include polyethylene, polypropylene, cellulose, fluoropolymers and nylons - any of which can be
in the form of a film, fiber, fabric or powder [50]. Radiation-grafting of functional groups for
uranium adsorption from aqueous solution has already been performed on fibers and fabrics of
polyethylene [84] [20], polypropylene [20] [24] [85] and polyethylene-polypropylene blends
[86].
In the presence of ionizing radiation, free radicals should be generated readily on the
polymeric substrate, either directly or through interaction with solvent radicals. To accomplish
this, the ideal substrate would feature reactive centers (radicals) of both high reactivity and high
stability. In a grafting system, the radicals produced on the substrate should readily undergo
polymer-monomer interactions, including addition (P• + M → P-M•) and graft termination (P• +
M• → P-M). These reactions are most favorable for reactive sites with as little steric hindrance
as possible, since this effect limits the diffusion of monomer to the substrate radicals and
subsequently hinders grafting [51] [87].
In semicrystalline polymer substrates, two strategies to obtain radicals of high stability
include irradiation at low temperatures and irradiation in the absence of oxygen [88]. The
existence of highly-stable radicals is a requirement of the indirect grafting method. With indirect
grafting, in which free radicals are produced on the substrate in the absence of monomer or
solvent, the substrate must be capable of creating radicals of high stability to prevent the
40
premature termination of radicals (through scission, crosslinking or oxidation). To achieve this, a
semicrystalline polymer is typically irradiated at temperatures below its glass transition
temperature (Tg). This reduces the mobility of the individual polymer chains to prevent radical
transfer and termination, effectively “freezing” or “trapping” the radicals so that they can be
stored until grafting [89] [90]. A significant increase in the temperature of the grafted polymer
before contact with monomer may cause the polymer to anneal, resulting in a dramatic decrease
in free radical concentration which may be observed via electron paramagnetic resonance [91].
Three spunbound ultra-high surface area Winged™ fabrics were obtained from Allasso
Industries. The individual fibers that compose the Winged™ fabrics feature an oblong cross
section with 8 to 23 deep channels running along the length of the fiber [92]. The channels serve
to increase the surface area of the fibers to 50 g/m2 (polypropylene) and 93 g/m2 (nylon-6). For
surface grafting, a high surface area substrate would serve to reduce processing costs and
enhance grafting density by increasing the number sites per unit area for free radical formation
and grafting. The presence of impurities, inhibitors or other additives in the Winged™ fabrics
was not known, and neither fabric was treated prior to use.
3.2.1 Polypropylene
Polypropylene is a semicrystalline polymer, with isotactic propylene being the most
common form and that with the highest degree of crystallinity (Figure 6) [93]. Desirable
properties exhibited by polypropylene include high thermal stability, high chemical resistance,
low density and ease of processing [94]. These and other properties are related to many factors
including the polymer’s stereochemistry, molecular weight, crystallinity and orientation. The
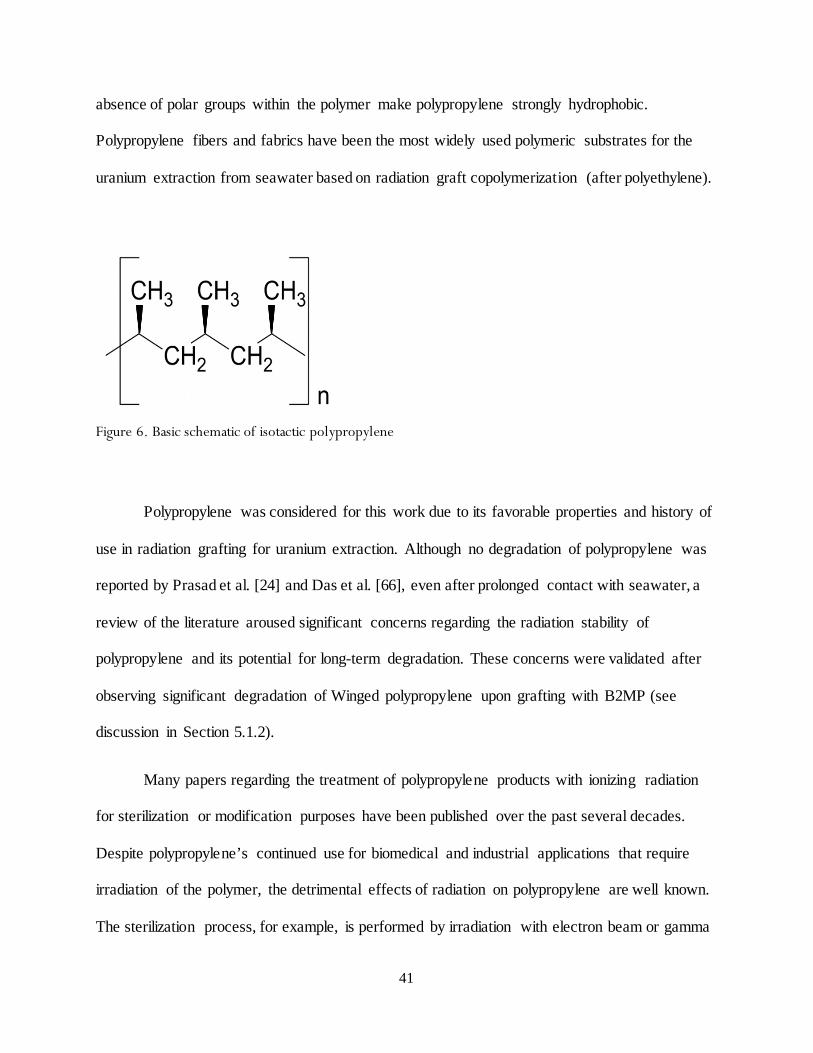
41
absence of polar groups within the polymer make polypropylene strongly hydrophobic.
Polypropylene fibers and fabrics have been the most widely used polymeric substrates for the
uranium extraction from seawater based on radiation graft copolymerization (after polyethylene).
Polypropylene was considered for this work due to its favorable properties and history of
use in radiation grafting for uranium extraction. Although no degradation of polypropylene was
reported by Prasad et al. [24] and Das et al. [66], even after prolonged contact with seawater, a
review of the literature aroused significant concerns regarding the radiation stability of
polypropylene and its potential for long-term degradation. These concerns were validated after
observing significant degradation of Winged polypropylene upon grafting with B2MP (see
discussion in Section 5.1.2).
Many papers regarding the treatment of polypropylene products with ionizing radiation
for sterilization or modification purposes have been published over the past several decades.
Despite polypropylene’s continued use for biomedical and industrial applications that require
irradiation of the polymer, the detrimental effects of radiation on polypropylene are well known.
The sterilization process, for example, is performed by irradiation with electron beam or gamma
Figure 6. Basic schematic of isotactic polypropylene
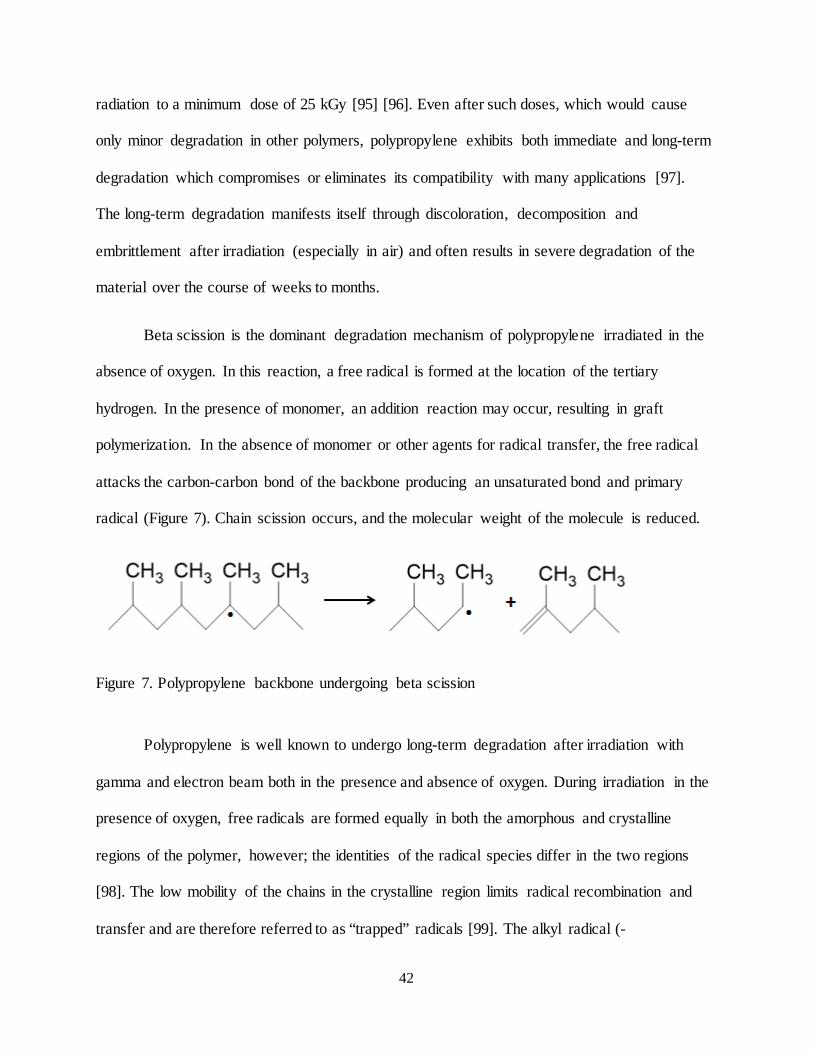
42
radiation to a minimum dose of 25 kGy [95] [96]. Even after such doses, which would cause
only minor degradation in other polymers, polypropylene exhibits both immediate and long-term
degradation which compromises or eliminates its compatibility with many applications [97].
The long-term degradation manifests itself through discoloration, decomposition and
embrittlement after irradiation (especially in air) and often results in severe degradation of the
material over the course of weeks to months.
Beta scission is the dominant degradation mechanism of polypropylene irradiated in the
absence of oxygen. In this reaction, a free radical is formed at the location of the tertiary
hydrogen. In the presence of monomer, an addition reaction may occur, resulting in graft
polymerization. In the absence of monomer or other agents for radical transfer, the free radical
attacks the carbon-carbon bond of the backbone producing an unsaturated bond and primary
radical (Figure 7). Chain scission occurs, and the molecular weight of the molecule is reduced.
Figure 7. Polypropylene backbone undergoing beta scission
Polypropylene is well known to undergo long-term degradation after irradiation with
gamma and electron beam both in the presence and absence of oxygen. During irradiation in the
presence of oxygen, free radicals are formed equally in both the amorphous and crystalline
regions of the polymer, however; the identities of the radical species differ in the two regions
[98]. The low mobility of the chains in the crystalline region limits radical recombination and
transfer and are therefore referred to as “trapped” radicals [99]. The alkyl radical (-
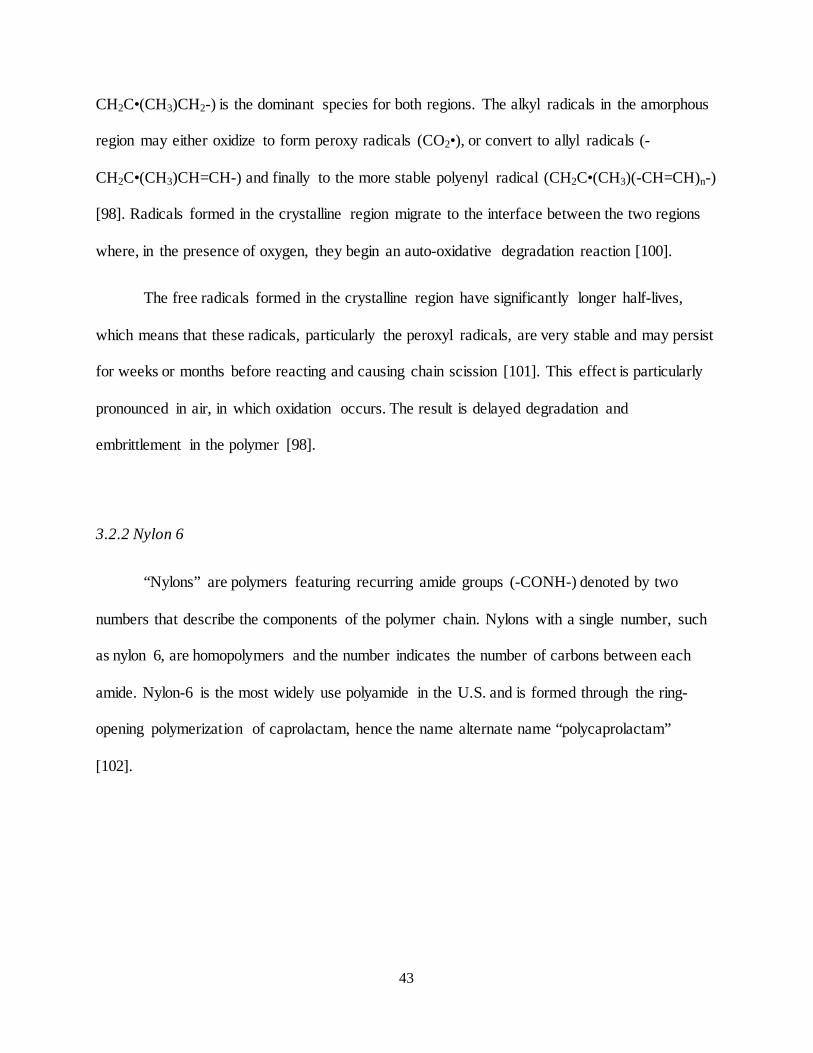
43
CH2C•(CH3)CH2-) is the dominant species for both regions. The alkyl radicals in the amorphous
region may either oxidize to form peroxy radicals (CO2•), or convert to allyl radicals (-
CH2C•(CH3)CH=CH-) and finally to the more stable polyenyl radical (CH2C•(CH3)(-CH=CH)n-)
[98]. Radicals formed in the crystalline region migrate to the interface between the two regions
where, in the presence of oxygen, they begin an auto-oxidative degradation reaction [100].
The free radicals formed in the crystalline region have significantly longer half-lives,
which means that these radicals, particularly the peroxyl radicals, are very stable and may persist
for weeks or months before reacting and causing chain scission [101]. This effect is particularly
pronounced in air, in which oxidation occurs. The result is delayed degradation and
embrittlement in the polymer [98].
3.2.2 Nylon 6
“Nylons” are polymers featuring recurring amide groups (-CONH-) denoted by two
numbers that describe the components of the polymer chain. Nylons with a single number, such
as nylon 6, are homopolymers and the number indicates the number of carbons between each
amide. Nylon-6 is the most widely use polyamide in the U.S. and is formed through the ring-
opening polymerization of caprolactam, hence the name alternate name “polycaprolactam”
[102].
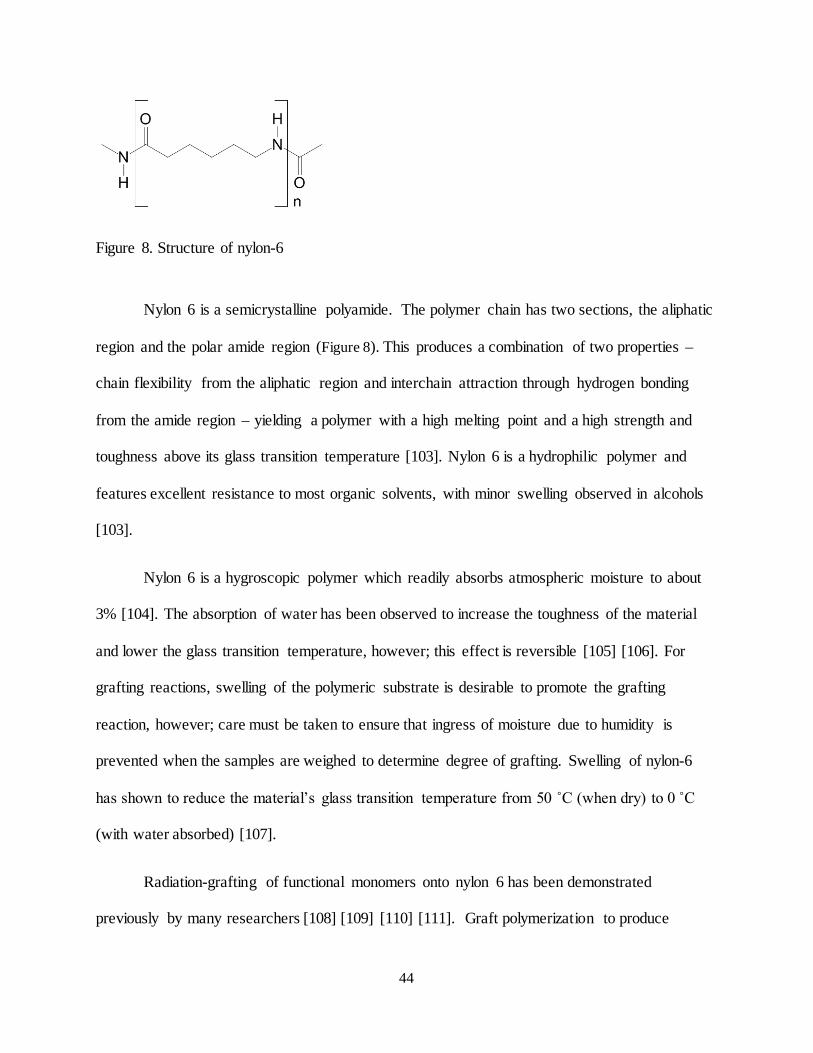
44
Figure 8. Structure of nylon-6
Nylon 6 is a semicrystalline polyamide. The polymer chain has two sections, the aliphatic
region and the polar amide region (Figure 8). This produces a combination of two properties –
chain flexibility from the aliphatic region and interchain attraction through hydrogen bonding
from the amide region – yielding a polymer with a high melting point and a high strength and
toughness above its glass transition temperature [103]. Nylon 6 is a hydrophilic polymer and
features excellent resistance to most organic solvents, with minor swelling observed in alcohols
[103].
Nylon 6 is a hygroscopic polymer which readily absorbs atmospheric moisture to about
3% [104]. The absorption of water has been observed to increase the toughness of the material
and lower the glass transition temperature, however; this effect is reversible [105] [106]. For
grafting reactions, swelling of the polymeric substrate is desirable to promote the grafting
reaction, however; care must be taken to ensure that ingress of moisture due to humidity is
prevented when the samples are weighed to determine degree of grafting. Swelling of nylon-6
has shown to reduce the material’s glass transition temperature from 50 ˚C (when dry) to 0 ˚C
(with water absorbed) [107].
Radiation-grafting of functional monomers onto nylon 6 has been demonstrated
previously by many researchers [108] [109] [110] [111]. Graft polymerization to produce
45
amidoxime functional groups on nylon 6,6, another polyamide, has already been demonstrated
and tested for uranium adsorption from potable water [112].
3.3 Solvent
In a radiation grafting system, the solvent serves many purposes including generating free
radicals in the system, increasing the diffusion of monomer to the polymeric substrate,
improving the uniformity of grafting, dissolving the monomer to reduce monomer-monomer
interactions and swelling the substrate for greater penetration of grafting [49]. The choice of
solvent in graft polymerization can affect both the grafting yields and the properties of the
grafted product [77].
The solvent should be tailored to the application. For example, the synthesis of
functionalized membranes requires bulk grafting, in which case the solvent should be miscible
with the substrate. Both the presence of the solvent and the swelling of the polymer substrate
increase the rate of diffusion within the substrate [113].
3.3.1 Water
Water is a highly-desired solvent, both for radiation grafting and for applications (such as
uranium extraction from seawater) that require environmental compatibility. The advantages of
water for radiation grafting are three-fold. For one, water features a high boiling point and high
heat of vaporization (2.26 × 10³ kJ/kg) [114], which allows for prolonged high dose rate
irradiation with electron beam that could otherwise vaporize many other solvents due to heat
generation. Secondly, the radiation chemistry of water is favorable and well-understood. Finally,
46
polymer substrates that feature polar groups (such as nylon-6) are often hydrophilic, allowing
greater penetration of water and dissolved monomer into the bulk of the substrate.
Water as a solvent is favorable for applications striving for “green chemistry”. Not only
is water non-toxic, as a replacement for organic solvents it minimizes the production of waste
that is difficult or expensive to process [115]. Water holds another advantage in biomedical or
environmental applications (including seawater extraction) where residue from the grafting
process may have serious consequences. The synthesis of grafted polymers does create a
contaminated waste stream, regardless of the solvent used.
A significant disadvantage of using water as a solvent is its limited solubility for most
monomers. This creates two problems. The first problem is maintaining solubility of the aqueous
monomer solution, since traditional methods of stirring, sonication or agitation cannot be
performed during irradiation. Secondly, even if the monomer dissolves well prior to irradiation,
its solubility may decrease during irradiation as polymerization causes an increase in molecular
weight.
Graft polymerization systems employing water as a solvent in the presence of a surfactant
or emulsifier are termed “emulsion polymerization”, “dispersion polymerization” or “suspension
polymerization” depending upon the solubility and components of the system. In these types of
heterogeneous polymerization systems, the two-phase system is composed of water and the
immiscible monomer along with a stabilizer to maintain the monomer droplets [116]. This
creates monomer-swollen micelles of high stability [117]. In the absence of a polymer substrate,
these methods produce spherical polymer particles ranging in size from 50 nm to 2 mm, with
vinyl monomers producing among the largest particles [116].
47
Many publications exist regarding polymerization in emulsions, dispersions and
suspensions, however; the literature on radiation grafting under these conditions is rather limited.
Many efforts have concluded that water-base radiation grafting has the advantages of high
conversion and degrees of grafting, low required doses and dose rates, high efficiency and a
cleaner waste stream [118] [39]. The radiation-grafting of such systems has been performed on a
variety of substrates including silk fiber [119], polypropylene [120], jute fiber [121], pig skins
[122] and many more. Functionalized adsorbents for the removal of heavy metals from drinking
and wastewater were synthesized via the indirect grafting method onto
polyethylene/polypropylene nonwoven fabric in emulsion [123].
Emulsifier-free (“soapless”) emulsion polymerization is performed in a system
containing only the immiscible water and monomer [116]. Although there are limited
publications on this method, it is known for producing high degrees of grafting and a product
free of surfactants which are often challenging to remove [39]. Although micelles are not formed
in this method, the mechanisms between emulsion and soap-free polymerization are very similar
as nano- or micro-spheres are also formed [124].
The radiation chemistry of water has been well-studied due to its importance to biology,
the environment, radiochemistry and nuclear technology. The summary of the radiolysis of water
in the following pages are by no means comprehensive and, should a detailed description of the
phenomenon be desired, dedicated works such as The Radiation Chemistry of Water [125] and
Primary Products of the Radiolysis of Water and Their Reactivity [126] should be consulted.
The energy transfer of electrons to the water molecules through which it passes first
produces an ion pair consisting of a water cation and an electron. The product H2O+ reacts with
another molecule to form the hydronium ion and the hydroxyl radical (Equation 18, Equation 19).
48
Equation 18 H2O H2O+ + e-
Equation 19 H2O+ + H2O → H3O+ + •OH
Similarly, an excited water molecule may dissociate to produce two free radicals
(Equation 20).
Equation 20 H2O H2O* → •OH + H•
The hydroxyl radical (•OH) is a strongly oxidizing species, while the atomic hydrogen
radical (H•) and aqueous electron (eaq-) are reducing species [127]. The electron produced by
ionization is rapidly solvated by molecules of water to produce the solvated (aqueous) electron
(eaq-). The solvated electron is known for its high reactivity and exceptionally high rate of
diffusion [128].
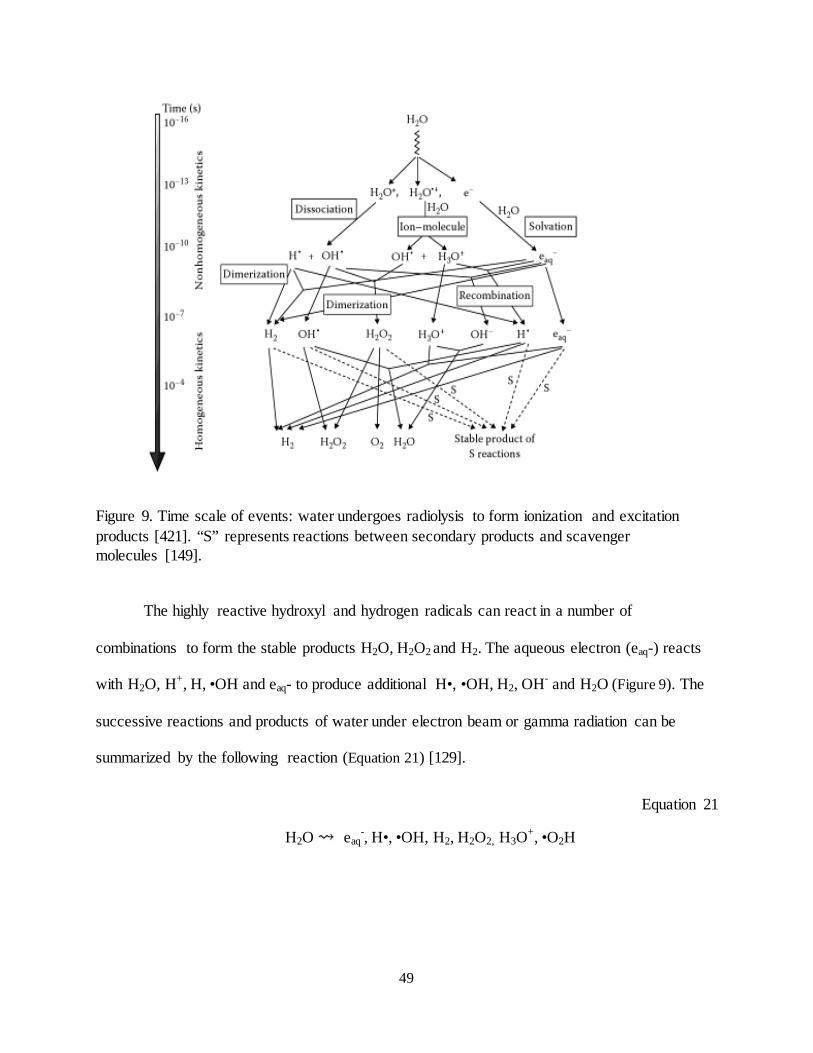
49
The highly reactive hydroxyl and hydrogen radicals can react in a number of
combinations to form the stable products H2O, H2O2 and H2. The aqueous electron (eaq-) reacts
with H2O, H+, H, •OH and eaq- to produce additional H•, •OH, H2, OH- and H2O (Figure 9). The
successive reactions and products of water under electron beam or gamma radiation can be
summarized by the following reaction (Equation 21) [129].
Equation 21 H2O eaq
-, H•, •OH, H2, H2O2, H3O+, •O2H
Figure 9. Time scale of events: water undergoes radiolysis to form ionization and excitation products [421]. “S” represents reactions between secondary products and scavenger molecules [149].
50
Because the radical •O2 H is considered a negligible species for low-LET radiation
(including electron beam and gamma) (Le Caer, 2011) the yields of these products are Geaq- =
GOH = GH3O+ = 2.7; GH = 0.6, GH2 = 0.45 and GH2O2 = 0.7 in neutral pH (3 to 11) [129].
The reactions and product yields are dependent upon pH, the presence of oxygen and the
presence of radical scavengers. Radiation grafting applications often purge the solvent with
nitrous oxide (N2O), a radical scavenger for aqueous electrons. If the solution is saturated,
nitrous oxide readily scavenges aqueous electrons via the reaction in Equation 22 [36] [130].
Equation 22 N2O + eaq
- → N2O- 𝐻+�� N2 + •OH + OH-
The reaction is essentially a conversion of aqueous electrons to hydroxyl radicals,
resulting in an overall yield of the hydroxyl radical in the system [131]. The increase in hydroxyl
radical yield is significant to radiation-grafting systems in which this highly-reactive radical is
utilized to promote hydrogen abstraction of the polymer substrate (P) and addition reactions
among the monomer molecules (M) [132] [133]. These reactions are represented by Equation 23
and Equation 24.
Equation 23 P-H + •OH → P• + H-OH
Equation 24 H2=M + OH → H2(OH)-M•
The initial portion of the work described in this dissertation utilized water from a Direct
Q Millipore system. Deionized water was used for the remainder of the experiments after the
Millipore system was taken out of service.
51
3.3.2 Lower Alcohols
Methanol, ethanol, propanol and tert-butanol were selected for testing based on a
recommendation from Polysciences, the vendor of the monomer bis(2-methacryloxyethyl)
phosphate. Fouassier and Rabek suggests that methanol and ethanol would be the most effective
at dissolving the monomer and promoting grafting onto the polymer substrate since small
molecules are the most capable of swelling the polymer substrate and enhancing solubility of the
monomer [77]. Tert-butanol, on the other hand, possesses large, bulky side groups which may
restrict its access to the polymeric substrate and limit the grafting reactions to the surface only
[77].
In addition to dissolving the monomer, the solvent must be compatible with the
polymeric substrate. Alcohol is known to cause swelling and even dissolution of some nylons,
included nylon 6 [103]. Nylon 6 has displayed absorption of methanol and ethanol, with
methanol showing the highest absorption [134]. The solubility of the monomers and the degrees
of grafting in methanol, ethanol, propanol and tert-butanol will be described in Section 5.3.1.
3.4 Radiotracer Isotope
For the purposes of this dissertation, the role of the radiotracer is to simulate the behavior
of the natural uranium isotopes found in seawater while emitting enough radioactivity to be
detected even at low concentrations. As mentioned previously, the overall specific activity of
naturally-occurring uranium is too low to detect the range of concentrations that would be
encountered in seawater after contact with high-performing grafted fabrics. For this reason, it
52
was necessary to perform the extraction tests in synthetic seawater (which does not include
uranium isotopes) with the addition of a single uranium isotope in tracer amounts.
An ideal radiotracer behaves according to three principles [135]:
1. The radiotracer interacts with the system in a predictable and reproducible way
2. The radiotracer does not alter or perturb the system
3. The radiotracer must be detectable at the concentration(s) in which it will be used
The first principle can be satisfied by selecting a tracer from among the commercially-
available uranium isotopes to ensure that the tracer will behave physically and chemically the
same as uranium. To satisfy the second principle, an effort was made to perform all tracer
experiments at natural concentrations of uranium and at a pH as close to seawater as possible
(see Section 5.4.6). For all experiments, care was also taken to ensure that count rates from all
samples were significantly above the minimum detectable activity of the system (Section
5.4.1.5).
The radioisotope of uranium chosen to determine the extraction efficiency of the grafted
fabrics was selected based on the following criteria: availability, purity, specific activity and
half-life. Commercially-available isotopes include two isotopes present in naturally-occurring
uranium (238U and 235U) as well as the synthetic isotopes 232U, 233U and 236U. The characteristics
of these isotopes are described in Table 3 [136].
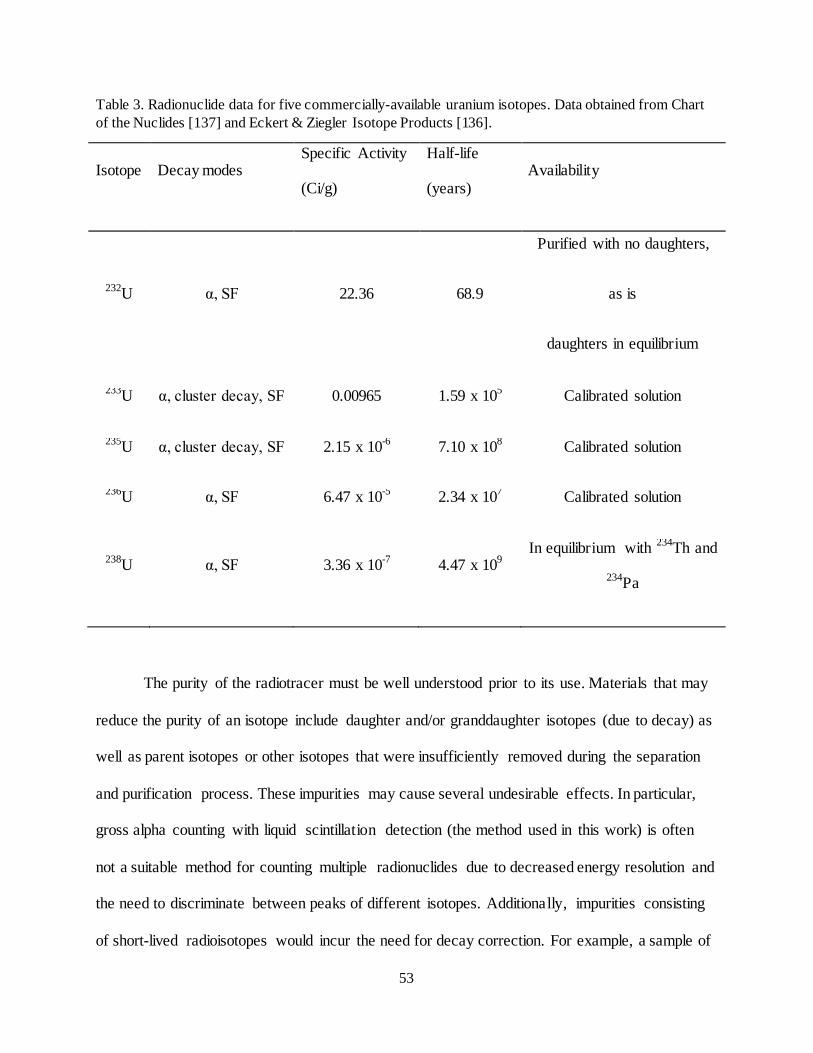
53
Table 3. Radionuclide data for five commercially-available uranium isotopes. Data obtained from Chart of the Nuclides [137] and Eckert & Ziegler Isotope Products [136].
Isotope Decay modes Specific Activity
(Ci/g)
Half-life
(years) Availability
232U α, SF 22.36 68.9
Purified with no daughters,
as is
daughters in equilibrium
233U α, cluster decay, SF 0.00965 1.59 x 10⁵ Calibrated solution
235U α, cluster decay, SF 2.15 x 10⁻⁶ 7.10 x 10⁸ Calibrated solution
236U α, SF 6.47 x 10⁻⁵ 2.34 x 10⁷ Calibrated solution
238U α, SF 3.36 x 10⁻⁷ 4.47 x 10⁹ In equilibrium with 234Th and
234Pa
The purity of the radiotracer must be well understood prior to its use. Materials that may
reduce the purity of an isotope include daughter and/or granddaughter isotopes (due to decay) as
well as parent isotopes or other isotopes that were insufficiently removed during the separation
and purification process. These impurities may cause several undesirable effects. In particular,
gross alpha counting with liquid scintillation detection (the method used in this work) is often
not a suitable method for counting multiple radionuclides due to decreased energy resolution and
the need to discriminate between peaks of different isotopes. Additionally, impurities consisting
of short-lived radioisotopes would incur the need for decay correction. For example, a sample of
54
235U contaminated with only 1% 234U will feature an overall activity 28 times higher than 235U
alone [136].
For applications requiring the detection of low concentrations of a radioisotope, the use
of an isotope with a high specific activity effectively lowers the minimum detectable mass
because more radiation is emitted per unit mass. On the other hand, the use of a radioisotope
with an unnecessarily-high specific activity could create a significant radiation hazard which
could limit the scope of time and type of experiments performed. Specific activity can be
calculated if the atomic mass and half-life are known (Equation 25).
Equation 25
Specific Activity �Cig� =
6.022 × 10²³ �atomsmol � ∗ �ln (2)
t1/2�
3.7 × 10¹⁰ �BqCi � ∗ Ma � g
mol�
Where:
t1/2 = radiological half life (s)
Ma = atomic mass
The radioisotopes with the highest specific activities are 232U and 233U at 2.2 x 101 and
9.6 x 10⁻³ Ci/g, respectively. These specific activities are several orders of magnitude higher than
the uranium isotopes found in real seawater (234U, 235U, 238U), which feature a combined,
naturally-occurring specific activity of 6.8 x 10⁻⁷ Ci/g [138]. This allows detection of
significantly smaller concentrations of uranium using 232U or 233U. This advantage is significant
since the extraction experiments were to be performed at a concentration of only 3.2 ppb and
55
with the anticipation that small fractions of this amount must also be detected post-contact with
the adsorbent fabrics.
The decision between 232U and 233U was based upon the radiological half-lives of the
isotopes. 233U has a half-life of 1.59 x 10⁵ years, while 232U has a half-life of only 68.9 years
[137]. With its shorter half-life, 232U was eliminated as a candidate to prevent the need to correct
for radioactive decay and peaks from the isotope’s short-lived progeny including 228Th (1.9
years), 224Ra (3.6 days), 220Rn (55 seconds) and 216Po (0.15 seconds) [137]. In addition, the
gamma rays from 232U’s progeny present a significant radiation safety hazard, possibly requiring
extensive shielding and limitations on personnel exposure [139].
The selected isotope, 233U, decays through alpha emission (100%) and very rarely,
spontaneous fission (< 6 x 10-11 %) or cluster decay to 24Ne and 28Mg (9 x 10⁻¹⁰% and 1 x 10-13
%, respectively) and features a half-life of 159,200 years [140]. This isotope is not naturally-
occurring; rather, it is produced in a nuclear reactor by the neutron capture reaction of 232Th.
The 233U radionuclide solution was purchased from Eckert & Ziegler Isotope Products
(Figure 10). The solution requested was purified 200 nCi of 233U in the form of uranyl nitrate in
10 mL of dilute nitric acid (catalog number 7233).
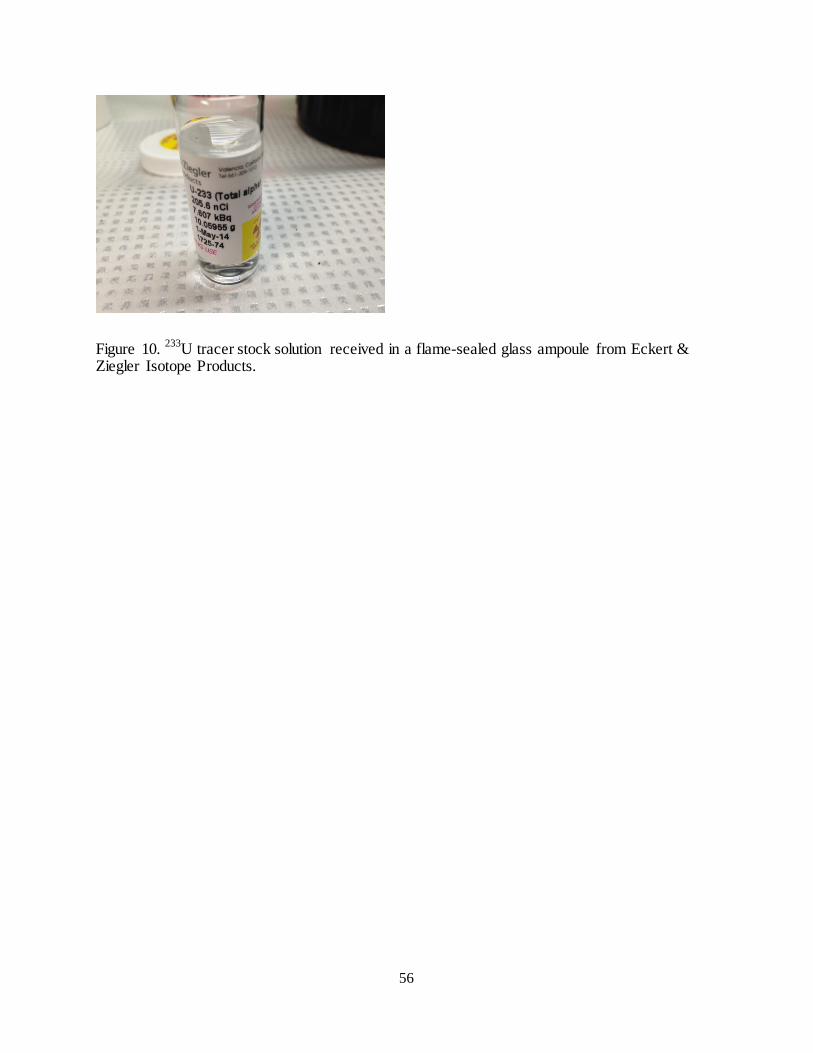
56
Figure 10. 233U tracer stock solution received in a flame-sealed glass ampoule from Eckert & Ziegler Isotope Products.
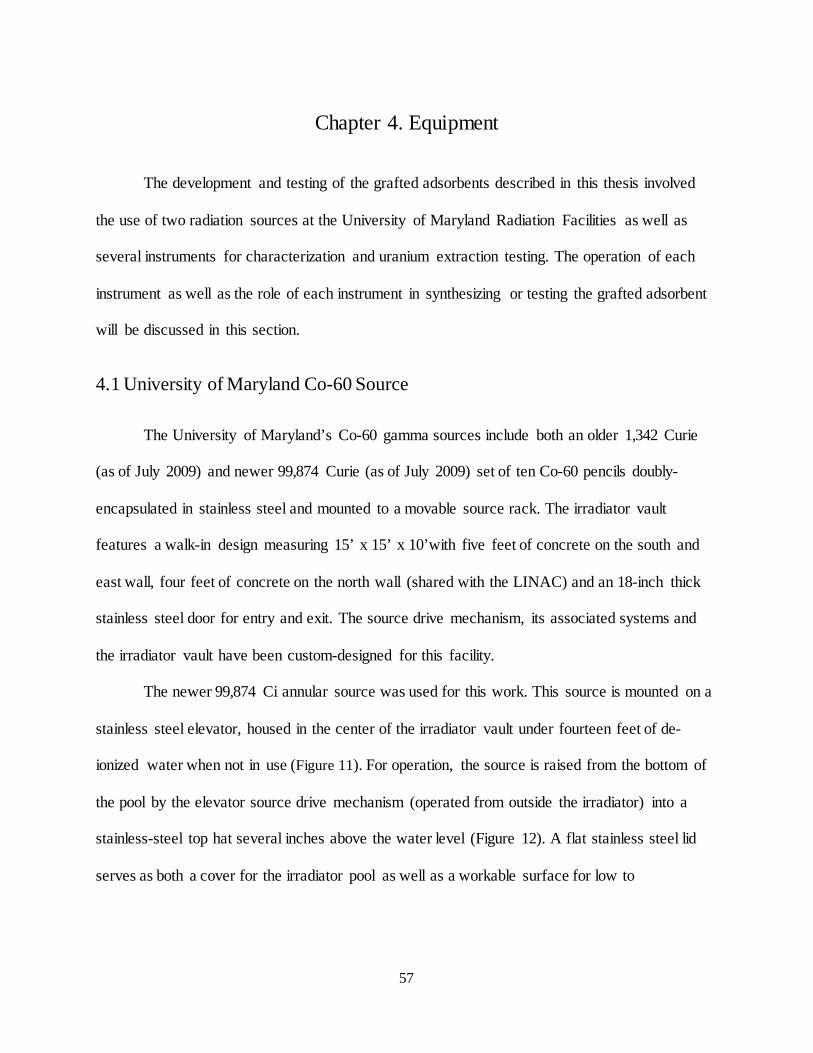
57
Chapter 4. Equipment
The development and testing of the grafted adsorbents described in this thesis involved
the use of two radiation sources at the University of Maryland Radiation Facilities as well as
several instruments for characterization and uranium extraction testing. The operation of each
instrument as well as the role of each instrument in synthesizing or testing the grafted adsorbent
will be discussed in this section.
4.1 University of Maryland Co-60 Source
The University of Maryland’s Co-60 gamma sources include both an older 1,342 Curie
(as of July 2009) and newer 99,874 Curie (as of July 2009) set of ten Co-60 pencils doubly-
encapsulated in stainless steel and mounted to a movable source rack. The irradiator vault
features a walk-in design measuring 15’ x 15’ x 10’with five feet of concrete on the south and
east wall, four feet of concrete on the north wall (shared with the LINAC) and an 18-inch thick
stainless steel door for entry and exit. The source drive mechanism, its associated systems and
the irradiator vault have been custom-designed for this facility.
The newer 99,874 Ci annular source was used for this work. This source is mounted on a
stainless steel elevator, housed in the center of the irradiator vault under fourteen feet of de-
ionized water when not in use (Figure 11). For operation, the source is raised from the bottom of
the pool by the elevator source drive mechanism (operated from outside the irradiator) into a
stainless-steel top hat several inches above the water level (Figure 12). A flat stainless steel lid
serves as both a cover for the irradiator pool as well as a workable surface for low to
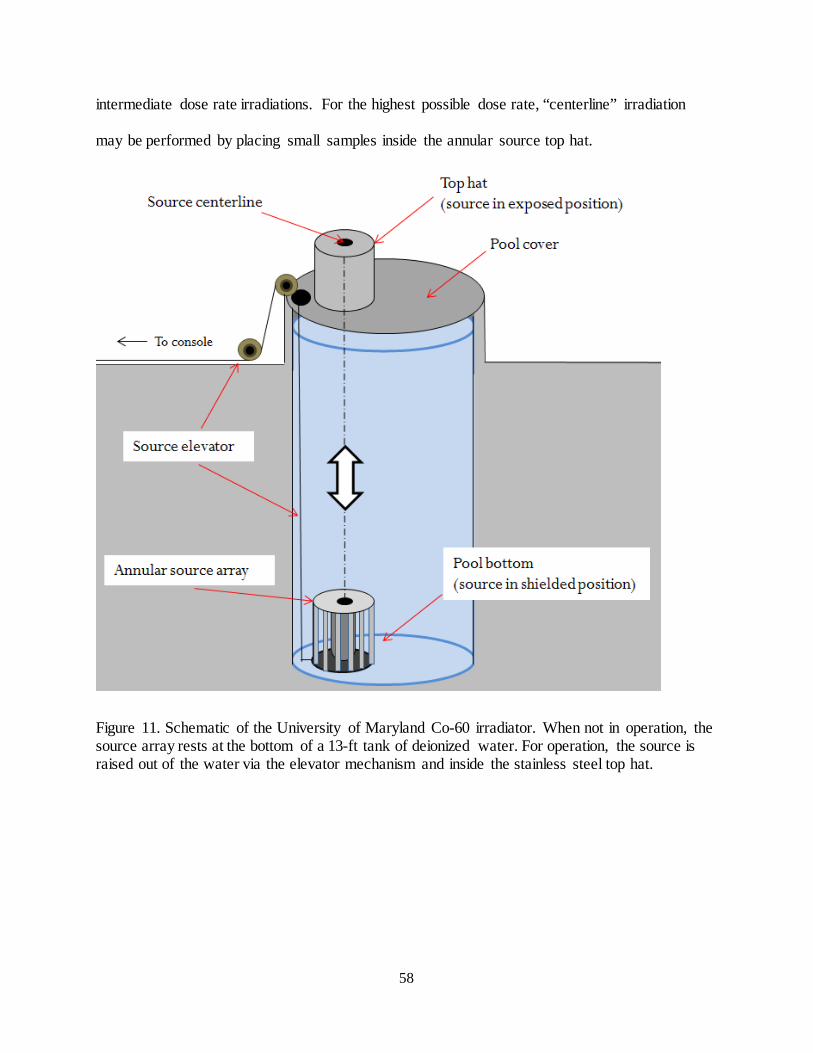
58
intermediate dose rate irradiations. For the highest possible dose rate, “centerline” irradiation
may be performed by placing small samples inside the annular source top hat.
Figure 11. Schematic of the University of Maryland Co-60 irradiator. When not in operation, the source array rests at the bottom of a 13-ft tank of deionized water. For operation, the source is raised out of the water via the elevator mechanism and inside the stainless steel top hat.
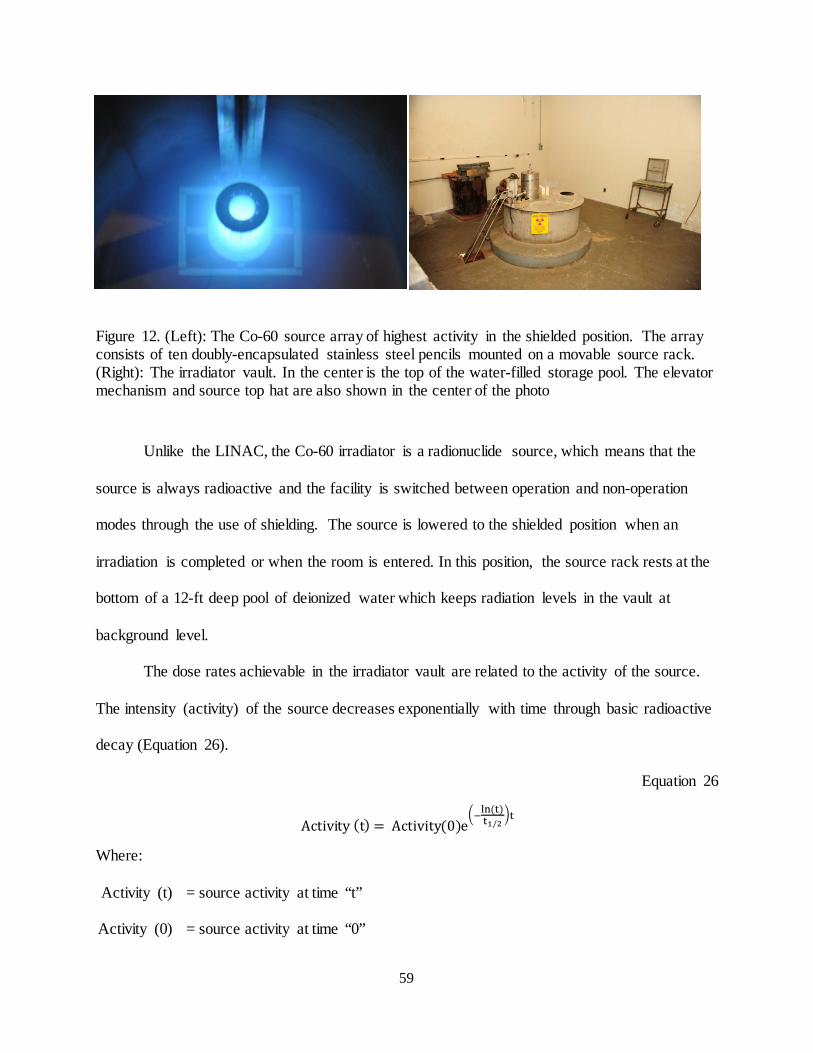
59
Figure 12. (Left): The Co-60 source array of highest activity in the shielded position. The array consists of ten doubly-encapsulated stainless steel pencils mounted on a movable source rack. (Right): The irradiator vault. In the center is the top of the water-filled storage pool. The elevator mechanism and source top hat are also shown in the center of the photo
Unlike the LINAC, the Co-60 irradiator is a radionuclide source, which means that the
source is always radioactive and the facility is switched between operation and non-operation
modes through the use of shielding. The source is lowered to the shielded position when an
irradiation is completed or when the room is entered. In this position, the source rack rests at the
bottom of a 12-ft deep pool of deionized water which keeps radiation levels in the vault at
background level.
The dose rates achievable in the irradiator vault are related to the activity of the source.
The intensity (activity) of the source decreases exponentially with time through basic radioactive
decay (Equation 26).
Equation 26
Activity (t) = Activity(0)e�−ln (t)
t1/2�t
Where:
Activity (t) = source activity at time “t”
Activity (0) = source activity at time “0”
60
t = elapsed time between “0” and “t”
λ = ln(2)/t1/2 (radioactive decay constant) were t1/2 is the radiological half life
The half-life of Co-60 is 5.27 years, which allows 5-10 years of use at high-to-
intermediate dose rates. Co-60 decays first by emitting a beta particle followed by two high-
energy gamma rays of energies 1.173 MeV and 1.332 MeV to the stable isotope Ni-60 [141].
The electrons attenuate within short distances which make the intensity of the source
proportional to the intensity of the emitted photons.
Spatially, the photon intensity decreases exponentially with increasing distance from the
source due to scattering and attenuation of the photons by air and other materials (Equation 27).
Dose rate characterization of the Co-60 irradiator was performed via alanine dosimetry (Section
5.2.2.3). The dose rate at a given distance “x” from the source centerline was determined with
Equation 27.
Equation 27
I(x) = I0e−µx
Where:
I(x) = source strength at distance “x”
I0 = source strength
μ = the linear attenuation coefficient
x = distance from source
The linear attenuation coefficient (µ) represents the probability of interaction between an
incident gamma ray and the material in which it travels. When the Co-60 source is in the exposed
position, several materials are traversed by travelling gamma rays before interaction with the
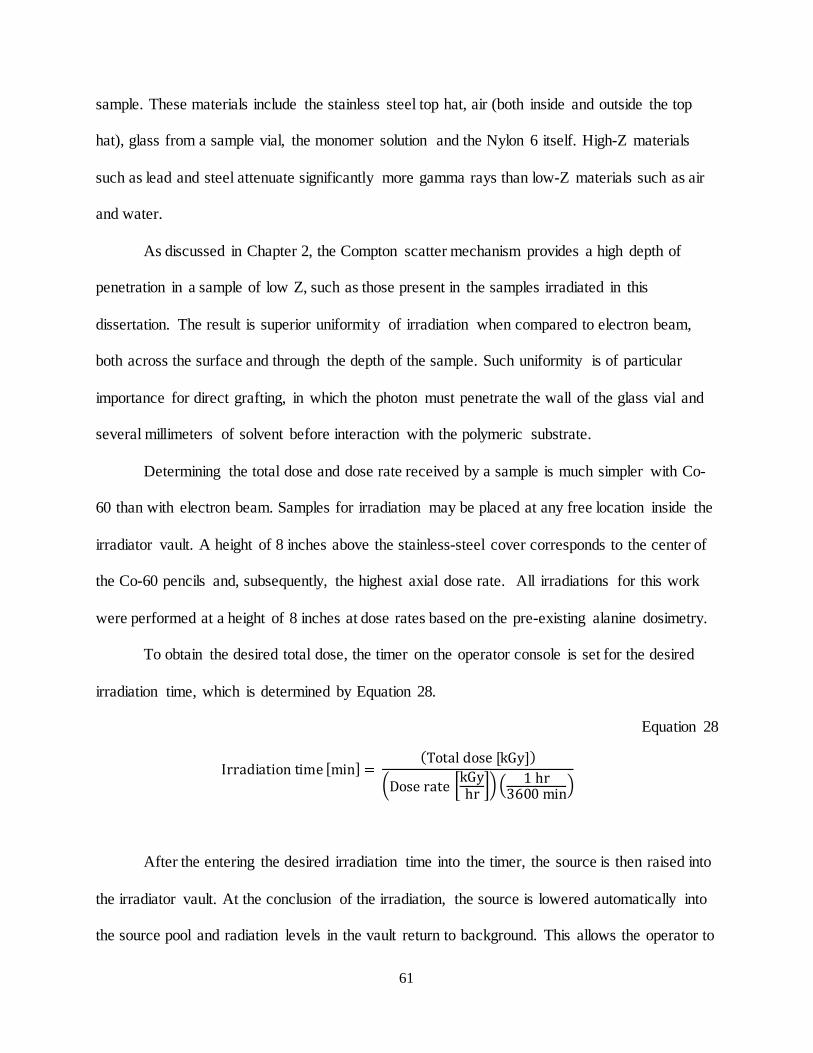
61
sample. These materials include the stainless steel top hat, air (both inside and outside the top
hat), glass from a sample vial, the monomer solution and the Nylon 6 itself. High-Z materials
such as lead and steel attenuate significantly more gamma rays than low-Z materials such as air
and water.
As discussed in Chapter 2, the Compton scatter mechanism provides a high depth of
penetration in a sample of low Z, such as those present in the samples irradiated in this
dissertation. The result is superior uniformity of irradiation when compared to electron beam,
both across the surface and through the depth of the sample. Such uniformity is of particular
importance for direct grafting, in which the photon must penetrate the wall of the glass vial and
several millimeters of solvent before interaction with the polymeric substrate.
Determining the total dose and dose rate received by a sample is much simpler with Co-
60 than with electron beam. Samples for irradiation may be placed at any free location inside the
irradiator vault. A height of 8 inches above the stainless-steel cover corresponds to the center of
the Co-60 pencils and, subsequently, the highest axial dose rate. All irradiations for this work
were performed at a height of 8 inches at dose rates based on the pre-existing alanine dosimetry.
To obtain the desired total dose, the timer on the operator console is set for the desired
irradiation time, which is determined by Equation 28.
Equation 28
Irradiation time [min] = (Total dose [kGy])
�Dose rate �kGyhr �� �
1 hr3600 min�
After the entering the desired irradiation time into the timer, the source is then raised into
the irradiator vault. At the conclusion of the irradiation, the source is lowered automatically into
the source pool and radiation levels in the vault return to background. This allows the operator to
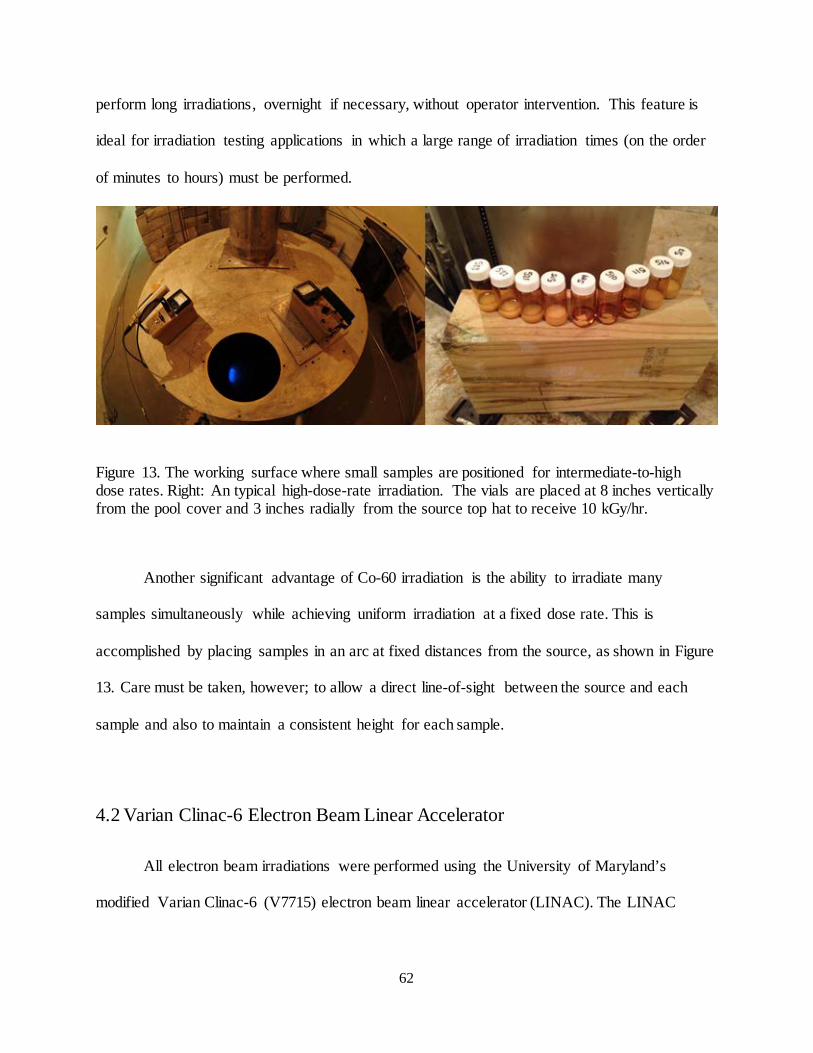
62
perform long irradiations, overnight if necessary, without operator intervention. This feature is
ideal for irradiation testing applications in which a large range of irradiation times (on the order
of minutes to hours) must be performed.
Figure 13. The working surface where small samples are positioned for intermediate-to-high dose rates. Right: An typical high-dose-rate irradiation. The vials are placed at 8 inches vertically from the pool cover and 3 inches radially from the source top hat to receive 10 kGy/hr.
Another significant advantage of Co-60 irradiation is the ability to irradiate many
samples simultaneously while achieving uniform irradiation at a fixed dose rate. This is
accomplished by placing samples in an arc at fixed distances from the source, as shown in Figure
13. Care must be taken, however; to allow a direct line-of-sight between the source and each
sample and also to maintain a consistent height for each sample.
4.2 Varian Clinac-6 Electron Beam Linear Accelerator
All electron beam irradiations were performed using the University of Maryland’s
modified Varian Clinac-6 (V7715) electron beam linear accelerator (LINAC). The LINAC
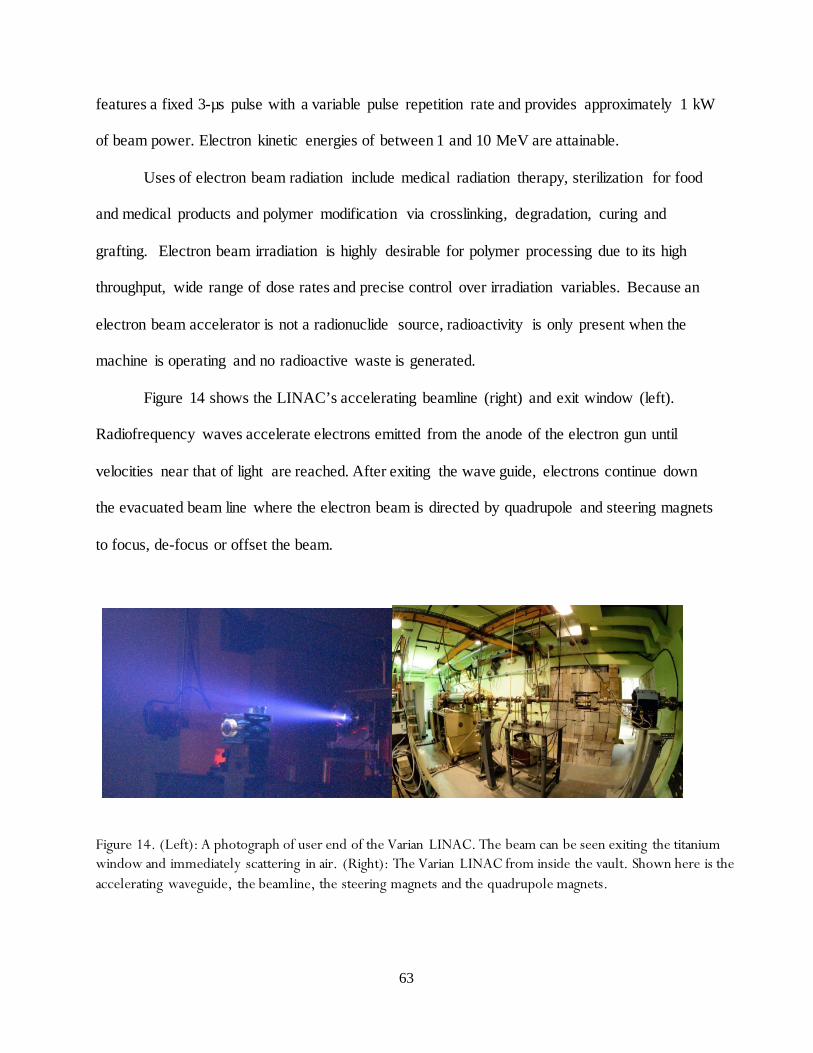
63
features a fixed 3-µs pulse with a variable pulse repetition rate and provides approximately 1 kW
of beam power. Electron kinetic energies of between 1 and 10 MeV are attainable.
Uses of electron beam radiation include medical radiation therapy, sterilization for food
and medical products and polymer modification via crosslinking, degradation, curing and
grafting. Electron beam irradiation is highly desirable for polymer processing due to its high
throughput, wide range of dose rates and precise control over irradiation variables. Because an
electron beam accelerator is not a radionuclide source, radioactivity is only present when the
machine is operating and no radioactive waste is generated.
Figure 14 shows the LINAC’s accelerating beamline (right) and exit window (left).
Radiofrequency waves accelerate electrons emitted from the anode of the electron gun until
velocities near that of light are reached. After exiting the wave guide, electrons continue down
the evacuated beam line where the electron beam is directed by quadrupole and steering magnets
to focus, de-focus or offset the beam.
Figure 14. (Left): A photograph of user end of the Varian LINAC. The beam can be seen exiting the titanium window and immediately scattering in air. (Right): The Varian LINAC from inside the vault. Shown here is the accelerating waveguide, the beamline, the steering magnets and the quadrupole magnets.
64
Electrons passing through the titanium exit window begin immediate attenuation and
scattering upon interaction with the air outside the window, producing a cone-shaped beam that
increases in diameter with an increase in distance from the exit window. Combined with the loss
in beam intensity with increasing distance from the window, this creates constraints with both
dose rate and sample size that must be assessed through dosimetry to assure uniform irradiation
of samples. Ultimately, irradiations that require high dose rates are performed closer to the beam
window, while those requiring low dose rates or greater uniformity over a large area are
performed further from the beam window. Figure 15 compares experimental setups for high dose
rate and low dose rate electron beam irradiations. The dosimetry performed for the experiments
presented in this dissertation is described in Section 5.2.2.
Figure 15. (Left): A vial for direct grafting is positioned for high dose rate irradiation with electron beam. The position of the sample is measured in three dimensions; from the wall, from the floor and from the beam window. (Right): Polypropylene fabrics are positioned for low-dose-rate electron beam irradiation. The samples are pressed between the plastic window and several pounds of dry ice for irradiation below the glass transition temperature.
Dose rates with electron beam vary significantly across the range of beam energies and
sample positions and can range between one and six orders of magnitude higher than those with
65
Co-60 irradiation. The result is a significantly shorter irradiation time. As an example, an
irradiation performed in this thesis to a dose of 40 kGy took four hours with UMD’s Co-60
irradiator and less than ten seconds with electron beam at a position of 17 cm from the beam
window. For this reason, electron beam irradiation is ideal for samples prone to oxidative
degradation or for water-based grafting applications which require a very short irradiation time.
Electron beam irradiation holds a notable advantage when grafting with the indirect
method. The high dose rate obtained with electron beam produces a large number of free
radicals, while the short irradiation time minimizes the decay of these radicals and ultimately
results in a higher radical concentration at the start of the grafting reaction. The high dose rate
and short irradiation time are ideal for characterization of irradiated polymers with electron
paramagnetic resonance, which allows an investigation into the relationship between irradiation
conditions and the concentration of free radicals formed on the substrate.
On the other hand, extended irradiation with electron beam puts samples at risk for
excessive heating due to the exothermic nature of the polymerization reaction and the high rate
of energy deposition from the beam. Sample heating during irradiation is a particular concern for
direct grafting applications which involve the irradiation of a solvent inside a closed container.
Although the irradiation of water under this condition allows for several minutes of irradiation
before boiling, volatile solvents (such as ethanol, at 78.4° C) are at risk of vaporization in a
closed system within the time span of the irradiation. In addition, the range of dose rates that can
be controlled through position of the sample may still be too high for low dose rate applications.
Another consideration when performing irradiations with electron beam is the high linear
energy transfer (LET) of the electron beam. The high LET means that the beam is attenuated in a
short distance, with greater attenuation in high-Z materials. This results in constraints in
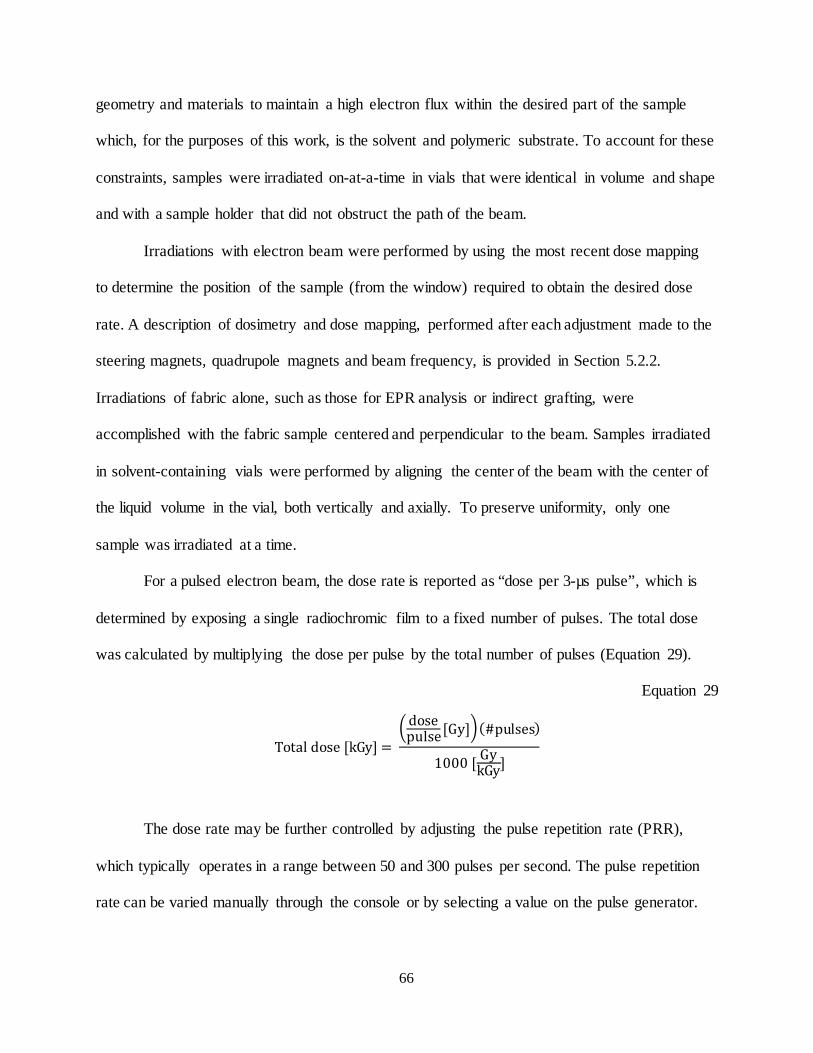
66
geometry and materials to maintain a high electron flux within the desired part of the sample
which, for the purposes of this work, is the solvent and polymeric substrate. To account for these
constraints, samples were irradiated on-at-a-time in vials that were identical in volume and shape
and with a sample holder that did not obstruct the path of the beam.
Irradiations with electron beam were performed by using the most recent dose mapping
to determine the position of the sample (from the window) required to obtain the desired dose
rate. A description of dosimetry and dose mapping, performed after each adjustment made to the
steering magnets, quadrupole magnets and beam frequency, is provided in Section 5.2.2.
Irradiations of fabric alone, such as those for EPR analysis or indirect grafting, were
accomplished with the fabric sample centered and perpendicular to the beam. Samples irradiated
in solvent-containing vials were performed by aligning the center of the beam with the center of
the liquid volume in the vial, both vertically and axially. To preserve uniformity, only one
sample was irradiated at a time.
For a pulsed electron beam, the dose rate is reported as “dose per 3-µs pulse”, which is
determined by exposing a single radiochromic film to a fixed number of pulses. The total dose
was calculated by multiplying the dose per pulse by the total number of pulses (Equation 29).
Equation 29
Total dose [kGy] = �dose
pulse[Gy]�(#pulses)
1000 [ GykGy]
The dose rate may be further controlled by adjusting the pulse repetition rate (PRR),
which typically operates in a range between 50 and 300 pulses per second. The pulse repetition
rate can be varied manually through the console or by selecting a value on the pulse generator.
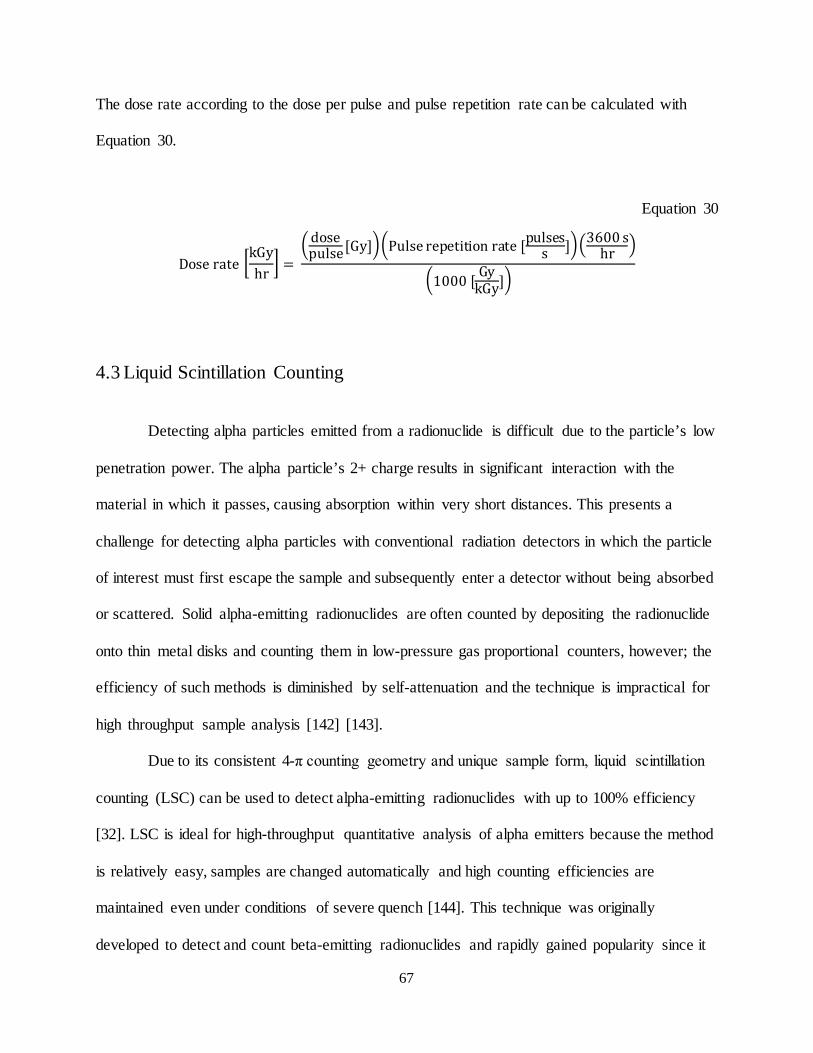
67
The dose rate according to the dose per pulse and pulse repetition rate can be calculated with
Equation 30.
Equation 30
Dose rate �kGyhr
� = �dose
pulse[Gy]��Pulse repetition rate [pulsess ]��3600 s
hr �
�1000 [ GykGy]�
4.3 Liquid Scintillation Counting
Detecting alpha particles emitted from a radionuclide is difficult due to the particle’s low
penetration power. The alpha particle’s 2+ charge results in significant interaction with the
material in which it passes, causing absorption within very short distances. This presents a
challenge for detecting alpha particles with conventional radiation detectors in which the particle
of interest must first escape the sample and subsequently enter a detector without being absorbed
or scattered. Solid alpha-emitting radionuclides are often counted by depositing the radionuclide
onto thin metal disks and counting them in low-pressure gas proportional counters, however; the
efficiency of such methods is diminished by self-attenuation and the technique is impractical for
high throughput sample analysis [142] [143].
Due to its consistent 4-π counting geometry and unique sample form, liquid scintillation
counting (LSC) can be used to detect alpha-emitting radionuclides with up to 100% efficiency
[32]. LSC is ideal for high-throughput quantitative analysis of alpha emitters because the method
is relatively easy, samples are changed automatically and high counting efficiencies are
maintained even under conditions of severe quench [144]. This technique was originally
developed to detect and count beta-emitting radionuclides and rapidly gained popularity since it
68
overcame the problems of self-absorption and detector window attenuation that were common
with other methods [145]. In addition, counting samples with LSC is extremely simple and can
be performed with little-to-no operator intervention and requires little training.
Although the technique was developed for counting of beta-emitting radionuclides, most
LSC equipment is also capable of counting alpha particles with even higher efficiencies. Liquid
scintillation counting for the detection of alpha-emitting radionuclides in seawater or other
aqueous media is performed routinely for several applications, particularly radiochemical and
environmental analysis [146]. The literature describes measurements of a variety of alpha-
emitting radionuclides including 222Rn [147], 226Ra [148], 210Po [149], 232Th [150], 233U [151],
234U, 235U and 238U [152] [153]. Such analysis is performed through either direct counting of the
aqueous sample with LSC or by first pre-concentrating the radionuclide to either a) raise its
overall mass within the counting volume or b) separate beta, gamma or other alpha-emitting
radioisotopes.
Sample preparation for liquid scintillation counting requires dissolving the radioactive
sample in a fluorescent scintillation liquid, termed the “scintillation cocktail”. Many cocktails
are commercially available and are selected based on their capacity to dissolve the sample of
interest while maintaining high scintillation efficiency. Generally, scintillation cocktails for
aqueous samples contain a mixture of organic solvents, emulsifier and fluor (scintillator). The
liquid radionuclide sample is combined with the cocktail in a scintillation vial and shaken
vigorously. The role of the emulsifier is to improve the solubility of the cocktail for aqueous
samples [142]. The role of the solvent is to absorb the energy emitted by the radionuclide and
transfer this energy to the fluor compound, which briefly enters an excited state before de-
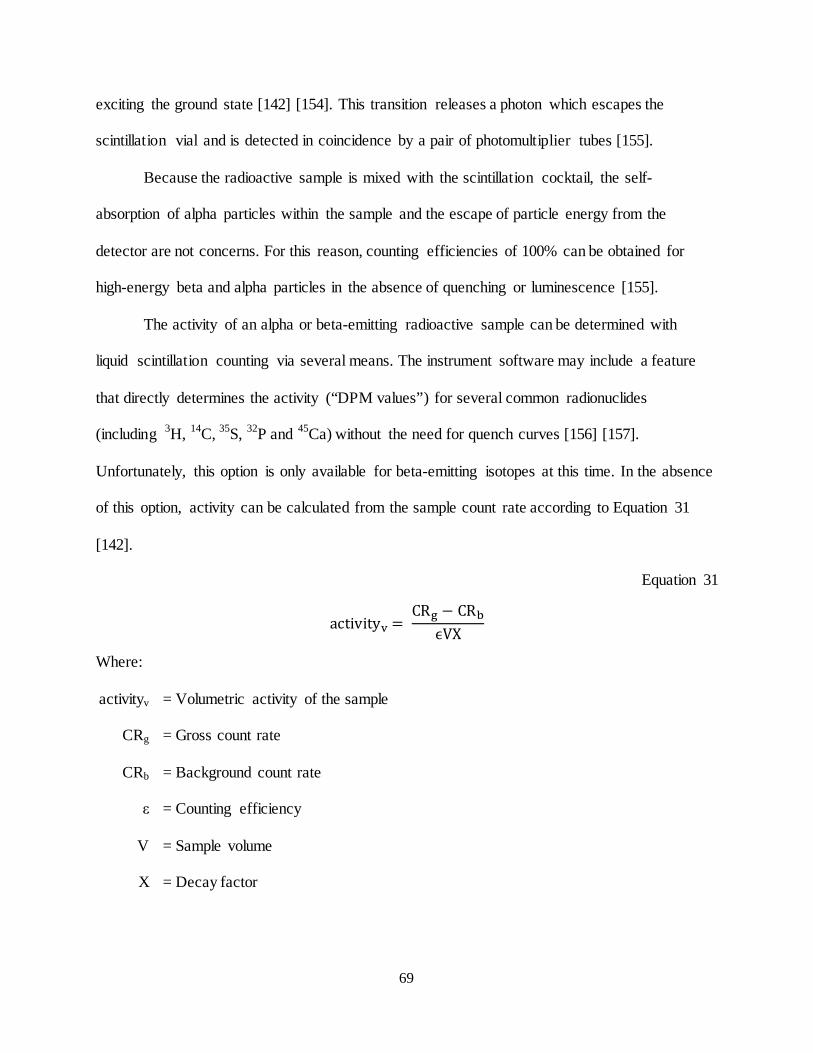
69
exciting the ground state [142] [154]. This transition releases a photon which escapes the
scintillation vial and is detected in coincidence by a pair of photomultiplier tubes [155].
Because the radioactive sample is mixed with the scintillation cocktail, the self-
absorption of alpha particles within the sample and the escape of particle energy from the
detector are not concerns. For this reason, counting efficiencies of 100% can be obtained for
high-energy beta and alpha particles in the absence of quenching or luminescence [155].
The activity of an alpha or beta-emitting radioactive sample can be determined with
liquid scintillation counting via several means. The instrument software may include a feature
that directly determines the activity (“DPM values”) for several common radionuclides
(including 3H, 14C, 35S, 32P and 45Ca) without the need for quench curves [156] [157].
Unfortunately, this option is only available for beta-emitting isotopes at this time. In the absence
of this option, activity can be calculated from the sample count rate according to Equation 31
[142].
Equation 31
activityv = CRg − CRb
ϵVX
Where:
activityv = Volumetric activity of the sample
CRg = Gross count rate
CRb = Background count rate
ε = Counting efficiency
V = Sample volume
X = Decay factor
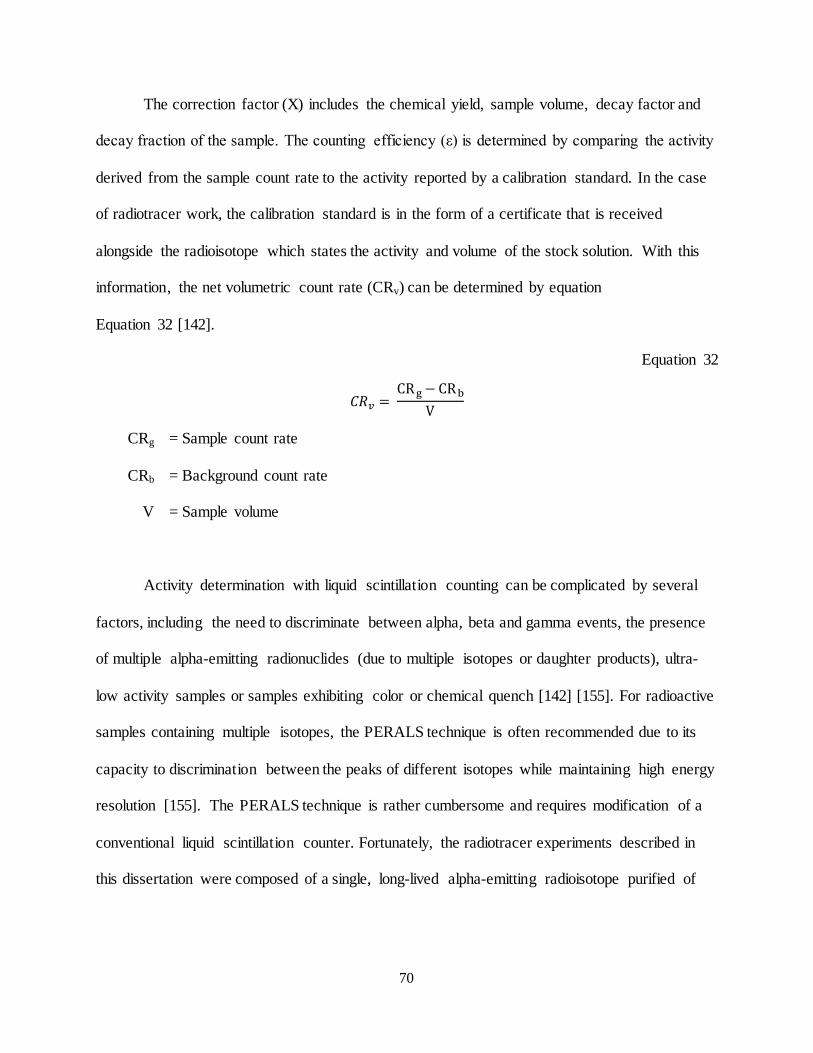
70
The correction factor (X) includes the chemical yield, sample volume, decay factor and
decay fraction of the sample. The counting efficiency (ε) is determined by comparing the activity
derived from the sample count rate to the activity reported by a calibration standard. In the case
of radiotracer work, the calibration standard is in the form of a certificate that is received
alongside the radioisotope which states the activity and volume of the stock solution. With this
information, the net volumetric count rate (CRv) can be determined by equation
Equation 32 [142].
Equation 32
𝐶𝐶𝑣 = CRg − CRb
V
CRg = Sample count rate
CRb = Background count rate
V = Sample volume
Activity determination with liquid scintillation counting can be complicated by several
factors, including the need to discriminate between alpha, beta and gamma events, the presence
of multiple alpha-emitting radionuclides (due to multiple isotopes or daughter products), ultra-
low activity samples or samples exhibiting color or chemical quench [142] [155]. For radioactive
samples containing multiple isotopes, the PERALS technique is often recommended due to its
capacity to discrimination between the peaks of different isotopes while maintaining high energy
resolution [155]. The PERALS technique is rather cumbersome and requires modification of a
conventional liquid scintillation counter. Fortunately, the radiotracer experiments described in
this dissertation were composed of a single, long-lived alpha-emitting radioisotope purified of
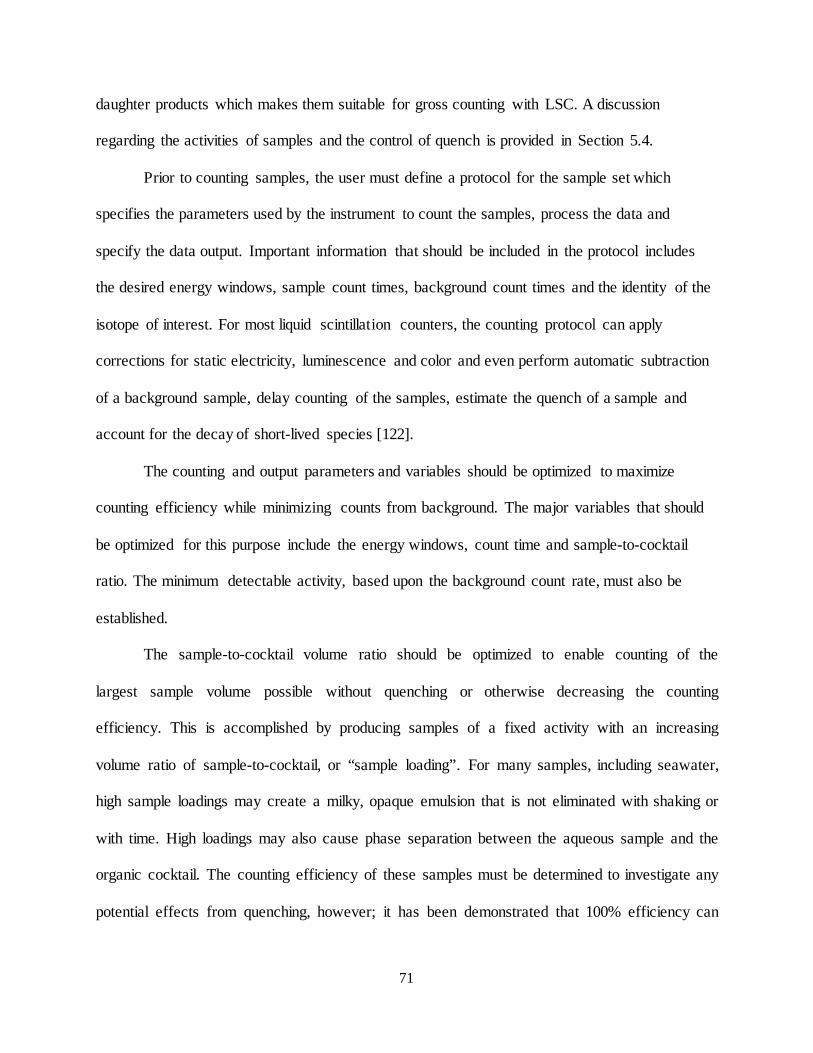
71
daughter products which makes them suitable for gross counting with LSC. A discussion
regarding the activities of samples and the control of quench is provided in Section 5.4.
Prior to counting samples, the user must define a protocol for the sample set which
specifies the parameters used by the instrument to count the samples, process the data and
specify the data output. Important information that should be included in the protocol includes
the desired energy windows, sample count times, background count times and the identity of the
isotope of interest. For most liquid scintillation counters, the counting protocol can apply
corrections for static electricity, luminescence and color and even perform automatic subtraction
of a background sample, delay counting of the samples, estimate the quench of a sample and
account for the decay of short-lived species [122].
The counting and output parameters and variables should be optimized to maximize
counting efficiency while minimizing counts from background. The major variables that should
be optimized for this purpose include the energy windows, count time and sample-to-cocktail
ratio. The minimum detectable activity, based upon the background count rate, must also be
established.
The sample-to-cocktail volume ratio should be optimized to enable counting of the
largest sample volume possible without quenching or otherwise decreasing the counting
efficiency. This is accomplished by producing samples of a fixed activity with an increasing
volume ratio of sample-to-cocktail, or “sample loading”. For many samples, including seawater,
high sample loadings may create a milky, opaque emulsion that is not eliminated with shaking or
with time. High loadings may also cause phase separation between the aqueous sample and the
organic cocktail. The counting efficiency of these samples must be determined to investigate any
potential effects from quenching, however; it has been demonstrated that 100% efficiency can
72
still be obtained for such alpha-emitting samples despite cloudiness or even phase separation of
the sample [144]. The effect of sample composition on counting efficiency is discussed in further
detail in Section 5.4.1.10.
The minimum detectable activity (MDA) must be determined for statistical purposes.
When the activity of a sample is low enough that it approaches the background activity, there is a
chance that a true count may be mistaken as a background count. Assuming a 5% risk of this
occurrence is acceptable and the background count time is one half that of the sample count time,
the minimum number of counts can be determined from Equation 33, which is derived from the
Currie equation [158]:
Equation 33
𝐶𝑛𝑛𝑛 > 4.65�𝐶𝑏 + 1.34
Where:
Cnet = number of net counts (sample counts – background counts)
Cb = Number of background counts
The two major challenges with liquid scintillation counting of alpha particles are
quenching, luminescence and the determination of low-activity samples. Quenching is any type
of interference that decreases the efficiency of energy transfer from the radionuclide to the
detector, most often by reducing the peak height and/or count rate [155]. The two types of
quenching which most commonly affect the efficiency of alpha detection are “color quench” and
“chemical quench”. Color quenching may occur in visibly-colored systems as photons emitted
by the fluor molecules are absorbed by the colored species before escaping the sample vial [157].
Chemical quench is the most troublesome phenomena encountered with gross alpha
counting and may be caused by any chemical substance which decreases the intensity of the light
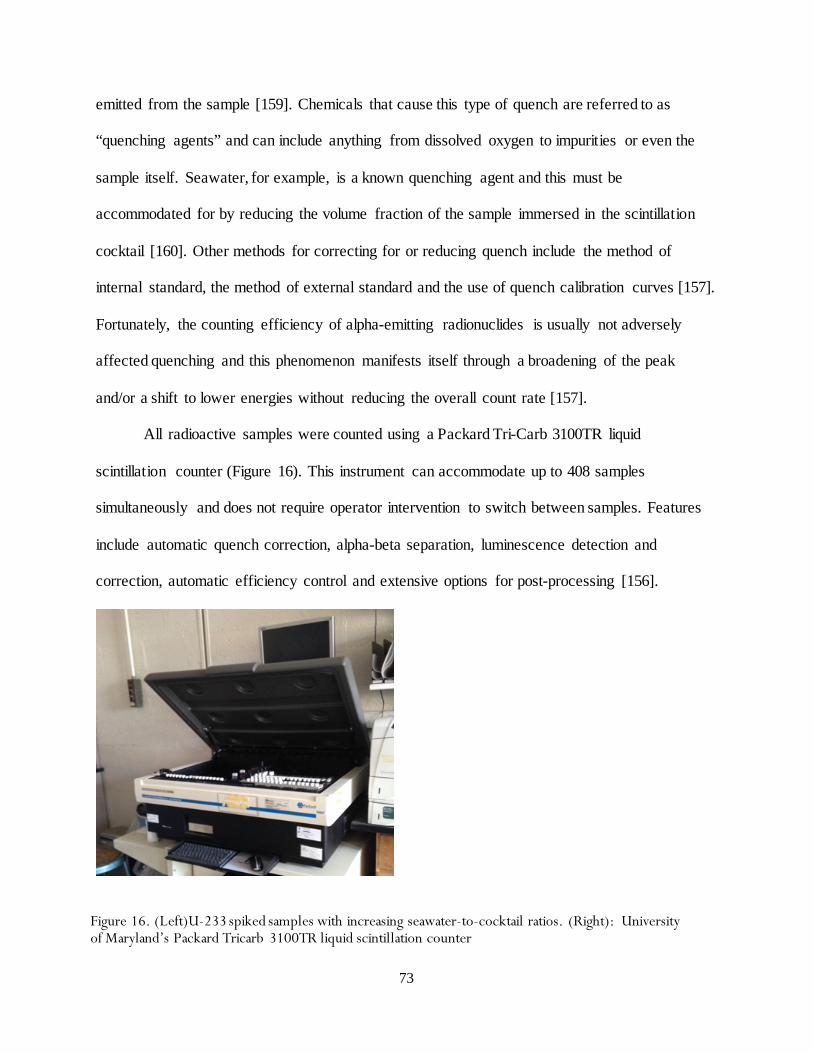
73
emitted from the sample [159]. Chemicals that cause this type of quench are referred to as
“quenching agents” and can include anything from dissolved oxygen to impurities or even the
sample itself. Seawater, for example, is a known quenching agent and this must be
accommodated for by reducing the volume fraction of the sample immersed in the scintillation
cocktail [160]. Other methods for correcting for or reducing quench include the method of
internal standard, the method of external standard and the use of quench calibration curves [157].
Fortunately, the counting efficiency of alpha-emitting radionuclides is usually not adversely
affected quenching and this phenomenon manifests itself through a broadening of the peak
and/or a shift to lower energies without reducing the overall count rate [157].
All radioactive samples were counted using a Packard Tri-Carb 3100TR liquid
scintillation counter (Figure 16). This instrument can accommodate up to 408 samples
simultaneously and does not require operator intervention to switch between samples. Features
include automatic quench correction, alpha-beta separation, luminescence detection and
correction, automatic efficiency control and extensive options for post-processing [156].
Figure 16. (Left)U-233 spiked samples with increasing seawater-to-cocktail ratios. (Right): University of Maryland’s Packard Tricarb 3100TR liquid scintillation counter
74
4.4 Fourier Transform Infrared Spectroscopy
Infrared (IR) spectroscopy is a popular and highly-versatile technique for the
identification of molecules present in a sample, as well as their quantities and spatial distribution.
FTIR, specifically, is a special type of infrared spectrometer developed to improve the speed of
spectrum acquisition and increase sensitivity by measuring all infrared frequencies
simultaneously [161].
The popularity of FTIR is owed to its many advantages. Performing FTIR measurements
requires little training and can be completed in only minutes and at little cost. Analysis and
interpretation of FTIR spectra are straightforward due to the wealth of information and the
existence of sophisticated processing and analysis software for the technique. The attenuated
total reflectance (ATR) accessory allows for analysis of non-transparent samples that otherwise
would require extensive and destructive sample preparation for conventional IR analysis.
Infrared spectroscopy is performed by passing infrared radiation, in the region of 4000 to
400 cm-1, either through (transmittance mode) or onto (reflectance mode) a sample. The sample
can be a solid, liquid or gas. The method used in this thesis was the reflectance mode, which
allows analysis of samples that are too thick to transmit infrared radiation in the conventional
(transmittance) mode. Visually, the difference between the two spectra can be typically observed
by locating the baseline and the direction of the peaks, which start at the bottom of the spectrum
and point upward for absorbance spectra and start and the top of the spectrum and point
downward for the transmittance spectra.
Absorption of infrared radiation by the molecule may cause it to vibrate, resulting in a
change in the dipole moment and the vibrational energy level [162]). The vibrational behavior of
the specific functional group is dependent upon the energy of the incident radiation and hence, is
75
reported as a peak (band) at a given wavenumber in which the vibration and its mode. Types of
vibrations modes include bending, stretching, wagging, twisting and rocking. The intensity of
absorption is proportional to the quantity of the molecule.
The infrared spectrum is a plot of light intensity as a function of wavenumber of absorbed
light in which the wavenumber is the inverse of the frequency of the electromagnetic radiation in
units of cm-1. The y-axis represents percent transmittance and absorbance of light by a sample
according to Equation 34.
Equation 34
%T = 100 × (Is/I)
A = log(Is/I)
Where:
%T = percent transmittance
A = absorbance
I = intensity of light leaving sample
Is = intensity of light entering sample
The concentration of molecules in a sample is proportional to absorbance via Beer’s Law
(Equation 35):
Equation 35
A = εlC
Where:
A = absorbance
ε = absorptivity
76
l = path length
C = concentration
This relationship means that for quantitative analysis or spectral manipulation,
transmittance spectra must first be converted to units of absorbance, which can be accomplished
with software [163]. Peak analysis, such as identifying or comparing functional groups, can be
performed using either spectrum type by interpreting the intensity, shape and position of the
absorption bands.
The position(s) and shape of the absorption bands are vital for identifying the functional
groups present in a sample. This can be accomplished through the use of software or by
comparing the spectrum to a table of known infrared absorption frequencies. Information
commonly included in such tables is the frequency at which the functional group occurs, the
bond types and vibrational modes that occur at that frequency and information regarding the
shape (broad, sharp, etc.) of the peak.
The IR spectrum contains several frequency regions in which the bands belonging to
certain chemical bonds are located. The spectrum can be divided into three regions: the
functional group region (4000-1300 cm-1) and the fingerprint region (1300-910 cm-1) and the
aromatic region (910-650 cm-1) [164]. The wavenumbers included in each region are not
definitive and are known to vary from source to source.
The functional group region encompasses a wealth of information of significance to
grafting of polymers, including the following. The region of highest wavenumber, about 4000-
2800 cm-1, contains bands characteristic of N-H and O-H bonds which are indicative amines and
of water, alcohols or phenol groups, respectively. Also in this region are C-H bonds which are
77
found in nearly every organic molecule, particularly alkanes and alkenes. The region of 2500-
2000 cm-1 is characteristic of triple bonds, while region of 2000-1500 cm-1 is characteristic of
double bonds including C=C, C=N and C=O.
The region between approximately 1300 and 900 cm-1 is called the fingerprint region
because the pattern of bands in this region is highly specific to each unique material [165]. Small
changes in the molecular structure of a sample are easily translated to variation in the fingerprint
region. The end of the spectrum of wavenumbers ~910-650 cm-1 is sometimes referred to as the
aromatic region and features (if present) bands indicative to aromatic ring structures [164].
FTIR is a standard technique for the analysis of polymeric materials. FTIR spectra can
reveal the chemical structure of polymers in order to identify the functional groups present,
determine the concentration of functional groups or observe changes upon modification.
Depending upon the material of interest, FTIR may be used to determine the polymer’s
crystallinity or tacticity, observe aging of the polymer over time and even identify polymers in an
unknown sample [166] [167].
FTIR analysis is one of the most widely-performed methods of characterizing grafted
polymers. Comparison of the untreated polymeric substrate with the grafted product is routinely
performed with this method [168] [169] [170]. The effects of different irradiation and grafting
conditions on the sample composition can also be investigated, as well as the production of solid
or gaseous by modification or decomposition of the sample [171] [172]. FTIR can also be used
to estimate degree of grafting and the purity of the product.
FTIR is particularly useful for studying oxidative degradation that often occurs when
polymers are irradiated in the presence of oxygen. Indications of oxidation along a polymer
backbone include the peroxy (-COOC-) and carbonyl (C=O) functional groups. FTIR can also
78
reveal scission of a polymer chain through the formation of smaller molecules including
aldehydes, ketones and acids.
In comparison with its advantages, FTIR has few limitations. For one, not all molecules
can be detected with FTIR. These molecules are referred to as “IR inactive”, typically because
they do not exhibit a change in dipole moment. Discrimination between small peaks or two
nearby peaks can be prevented due to peak overlap which, if it is present, may make analysis
challenging. For conventional (mid-infrared) instruments, FTIR spectra are also limited to the
region of 4000-400 cm-1.
All analysis presented in this thesis was performed using a Thermo-Nicolet Nexus 670
FTIR, located in the University of Maryland Surface Analysis Center with an attenuated total
reflectance (ATR) accessory (Figure 17). The ATR accessory allows for spectral analysis of
films, fabrics other solids which are not easily dissolved or powdered [173]. An anvil is used to
press the solid sample against the surface of a crystal, usually diamond, into which the infrared
beam is directed and reflected back to the detector [174]. ATR is a surface technique, the
infrared radiation incident upon the sample is absorbed by the surface layer of the sample, only a
few micrometers deep [175]. Despite this limitation, the ATR accessory is required if thick
samples, such as fabrics, are to be analyzed non-destructively.
The procedure and conditions used in FTIR analysis, as well as the functional groups
identified and description of samples analyzed are presented in Section 5.5.1.
79
4.5 Raman Spectroscopy
Like infrared spectroscopy, Raman is a type of molecular spectroscopy that investigates
vibrational transitions in the infrared (104 to 102 cm-1) region. With FTIR spectroscopy, the
spectrum is derived from the absorption of infrared light emitted simultaneously in a range of
frequencies. Raman spectroscopy differs in that light of a single wavelength is emitted and the
spectrum is derived from the scattering of radiation from the molecules in the sample [176].
Raman spectroscopy does not require resonance between the incident radiation and the molecule;
rather, the vibrational transitions are determined by a change in polarizability of the molecule
[177].
Raman spectroscopy is performed by irradiating the sample with a high intensity laser in
the visible or near-infrared region. The laser photons cause polarization of the molecule, exciting
it to a virtual energy state which is a short-lived perturbation of the electron cloud which
surrounds the molecule [178]. Two types of scattered light from the virtual state are observed –
Figure 17. Thermo Nicolet NEXUS 670 FTIR. Chemistry department at the University of Maryland [339]
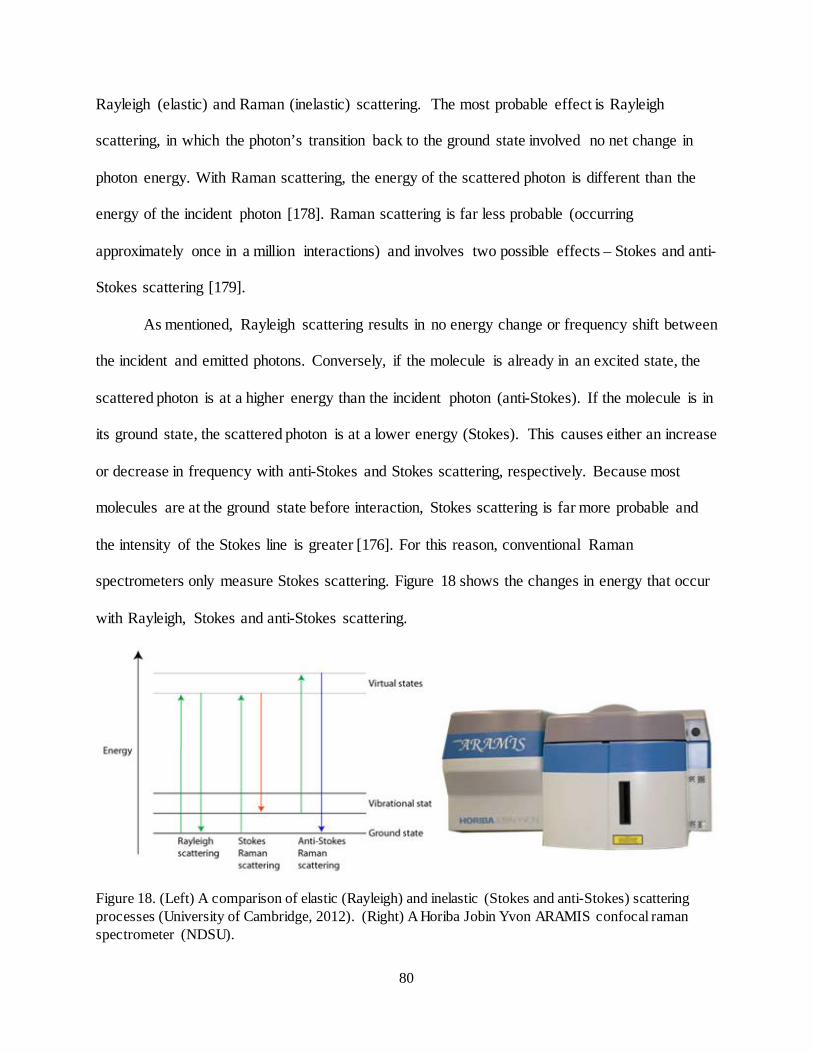
80
Rayleigh (elastic) and Raman (inelastic) scattering. The most probable effect is Rayleigh
scattering, in which the photon’s transition back to the ground state involved no net change in
photon energy. With Raman scattering, the energy of the scattered photon is different than the
energy of the incident photon [178]. Raman scattering is far less probable (occurring
approximately once in a million interactions) and involves two possible effects – Stokes and anti-
Stokes scattering [179].
As mentioned, Rayleigh scattering results in no energy change or frequency shift between
the incident and emitted photons. Conversely, if the molecule is already in an excited state, the
scattered photon is at a higher energy than the incident photon (anti-Stokes). If the molecule is in
its ground state, the scattered photon is at a lower energy (Stokes). This causes either an increase
or decrease in frequency with anti-Stokes and Stokes scattering, respectively. Because most
molecules are at the ground state before interaction, Stokes scattering is far more probable and
the intensity of the Stokes line is greater [176]. For this reason, conventional Raman
spectrometers only measure Stokes scattering. Figure 18 shows the changes in energy that occur
with Rayleigh, Stokes and anti-Stokes scattering.
Figure 18. (Left) A comparison of elastic (Rayleigh) and inelastic (Stokes and anti-Stokes) scattering processes (University of Cambridge, 2012). (Right) A Horiba Jobin Yvon ARAMIS confocal raman spectrometer (NDSU).
81
Raman spectroscopy is a non-destructive technique which allows analysis of solids,
liquids and gases. Sample preparation is often much less demanding than with FTIR
spectroscopy and for most samples, no preparation is required whatsoever. Raman spectroscopy
also has the capacity to analyze samples through glass and does not require background
subtraction to compensate for the presence of air of water in the environment.
The Raman spectrum is similar to that of IR spectroscopy and typically features the same
range of wavenumbers. Raman does have the capability, however; of analyzing the low-
frequency region of approximately 10-500 cm-1 that would require hardware modification with
FTIR [180]. Raman and FTIR data are often compared and presented by graphing the two
spectra together and, like FTIR, Raman peaks may be analyzed by comparing peak locations
with functional group tables or using software.
A significant advantage of Raman spectroscopy is that molecules that are inactive in IR
may be active in Raman. IR spectroscopy requires a change in dipole moment upon vibration,
while Raman spectroscopy requires a change in polarizability. Generally, symmetric vibrations
and non-polar groups are mostly active in Raman, while asymmetric vibration and polar groups
are mostly active in IR [162]. Molecules with centers of symmetry are detectable with either
FTIR or Raman, but not both. This is referred to as the “mutual exclusion principle”. For these
reasons, IR and Raman are considered complementary methods and should both be performed, if
possible, for a thorough sample analysis.
There are many circumstances in which Raman spectroscopy would be a useful
supplement to, or perhaps more useful than FTIR. For example, peaks of interest in IR
spectroscopy that are obscured by additives or impurities may be easy to identify with Raman
[181]. Samples containing elements of high atomic number show more distinctive Raman peaks,
82
while elements of smaller atomic number show more distinctive IR peaks [181]. Raman
spectroscopy is also preferable for samples containing water and features no interference from
atmospheric water vapor or carbon dioxide [182].
Polymer analysis with Raman provides a wealth of information with little effort.
Researchers have used Raman to investigate various aspects of polymers including chemical
composition, surface structure, degradation and deformation, stereo and conformational order
and crystallinity [177]. Because they are considered complementary methods, many applications
of FTIR are also possible with Raman, and vice versa.
Raman spectroscopy is particularly suited to polymers because, unlike IR spectroscopy,
changes in the polymer backbone occur with polarization that may reveal the molecular structure
and composition [177]. This can be explained by the sensitivity of Raman towards nonpolar
functional groups that would otherwise be difficult to analyze with IR spectroscopy [180].
Raman microscopy, also known as confocal Raman, combines a Raman spectrometer
with an optical microscope which allows visualization of the sample being analyzed. This feature
is particularly useful for heterogeneous materials since the microscope can be used to locate and
analyze specific features or regions. The confocal technique involves controlling the sampling
volume through use of a spatial filter which analyzes the signal in three dimensions, and true
confocal Raman allows sample analysis to dimensions below 1 µm [183].
The advantages of Raman spectroscopy, both independent from and as a complement to
FTIR spectroscopy are summarized as follows:
• Compatibility with a wide range of sample shapes, sizes and compositions
• Nondestructive analysis of samples with little or no preparation
• Ability to analyze specific areas of interest using confocal Raman
83
• Selection rules favor Raman spectroscopy – ability to obtain richer spectra than FTIR
• Ability to analyze aqueous samples and samples within glass slides or containers
Challenges and limitations with Raman spectroscopy are significantly outnumbered by its
advantages. The main challenges include fluorescence and low signal intensity. Fluorescence
occurs when the incident photon is partially absorbed and subsequently re-emitted. For polymers,
it is not unusual for fluorescence to overwhelm the Raman spectrum and eliminate the possibility
of analysis. Fortunately, there are several methods that provide relief from fluorescence and
allow analysis of the sample even under conditions of high fluorescence (see Section 5.5.2).
Also, because the probability of Raman scattering is so low, it is not uncommon for a sample to
produce a vibrant spectrum with infrared spectroscopy and a poor, low-intensity spectrum with
Raman spectroscopy [179]. This may result in poor signal-to-noise ratio, particularly if the
spectrum is also complicated by fluorescence.
Analysis for this dissertation was performed using a Horiba Jobin Yvon LabRam
ARAMIS true confocal Raman microscope (Figure 18). The equipment features an optical
microscope with three objectives (x10, x50 and x100), four gratings (600, 1200, 1800 and 2400
gr/mm) and a two lasers of 532 nm (diode-pump solid-state laser) and 633 nm (helium-neon
laser) [184].
4.6 Scanning Electron Microscopy / Energy Dispersive X-ray
Scanning Electron Microscopy / Energy Dispersive X-ray (SEM/EDS or SEM/EDX) is
the coupling of a scanning electron microscope and an x-ray detector which enable simultaneous
investigation of the morphology and elemental composition of a surface. SEM/EDS has a wide
84
range of applications which include the identification of unknown samples, the analysis of
impurities or defects present in a sample or the determination of the size of features in a sample.
Scanning electron microscopes are capable of resolution on the order of 1 nm, much higher than
optical microscopes (~1 µm) and significantly higher than the human eye (~100 µm) [185] [186].
With a depth of field over 300 times that of optical microscopes [187], SEM is capable of
providing a high-resolution, high-magnification image that can easily be coupled with elemental
analysis and mapping.
SEM/EDS is routinely used for the analysis of grafted polymers and is often performed
alongside other characterization techniques including FTIR and Raman. For bulk polymer
systems, SEM has advantages over transmission electron microscopy due to the higher depth of
field and because the preparation of ultra-thin specimens is not required. Advantages of SEM
over optical microscopy, such as confocal Raman, include significantly higher magnification,
higher resolution, a greater depth of focus and the ability to perform simultaneous elemental
mapping [157].
A review of the literature revealed substantial use of SEM for the analysis of polymer
surface morphology. Fracture morphology, phase distribution, porosity, degradation, and the
dimensions of layers or other microstructures may all be visible with SEM [188] [189] [190]
[191] [192] [193]. SEM has been used to observe changes in surface morphology after graft co-
polymerization using both the solution and emulsion grafting methods [168] [194] [123] [81].
Grafted polymers for the extraction of uranium from seawater have also been investigated with
SEM [169].
Conversely, the applications of energy-dispersive X-ray spectroscopy for polymer
analysis are somewhat limited because polymers are mostly composed of lighter elements and
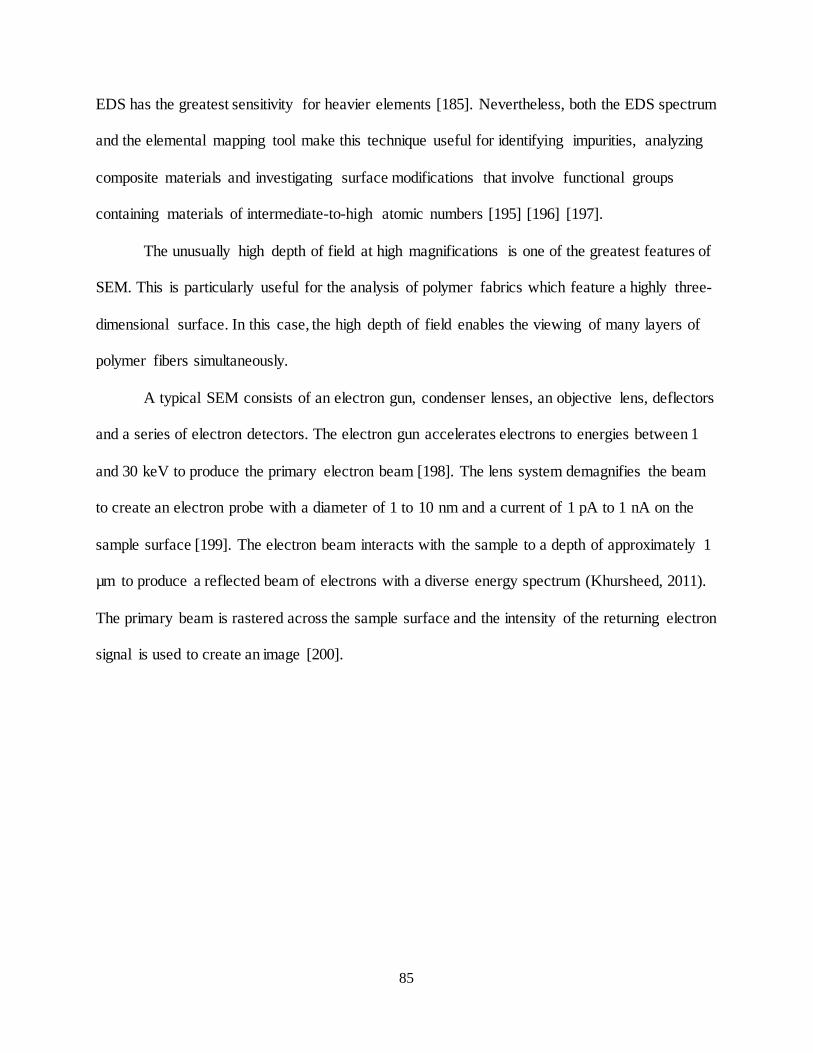
85
EDS has the greatest sensitivity for heavier elements [185]. Nevertheless, both the EDS spectrum
and the elemental mapping tool make this technique useful for identifying impurities, analyzing
composite materials and investigating surface modifications that involve functional groups
containing materials of intermediate-to-high atomic numbers [195] [196] [197].
The unusually high depth of field at high magnifications is one of the greatest features of
SEM. This is particularly useful for the analysis of polymer fabrics which feature a highly three-
dimensional surface. In this case, the high depth of field enables the viewing of many layers of
polymer fibers simultaneously.
A typical SEM consists of an electron gun, condenser lenses, an objective lens, deflectors
and a series of electron detectors. The electron gun accelerates electrons to energies between 1
and 30 keV to produce the primary electron beam [198]. The lens system demagnifies the beam
to create an electron probe with a diameter of 1 to 10 nm and a current of 1 pA to 1 nA on the
sample surface [199]. The electron beam interacts with the sample to a depth of approximately 1
µm to produce a reflected beam of electrons with a diverse energy spectrum (Khursheed, 2011).
The primary beam is rastered across the sample surface and the intensity of the returning electron
signal is used to create an image [200].
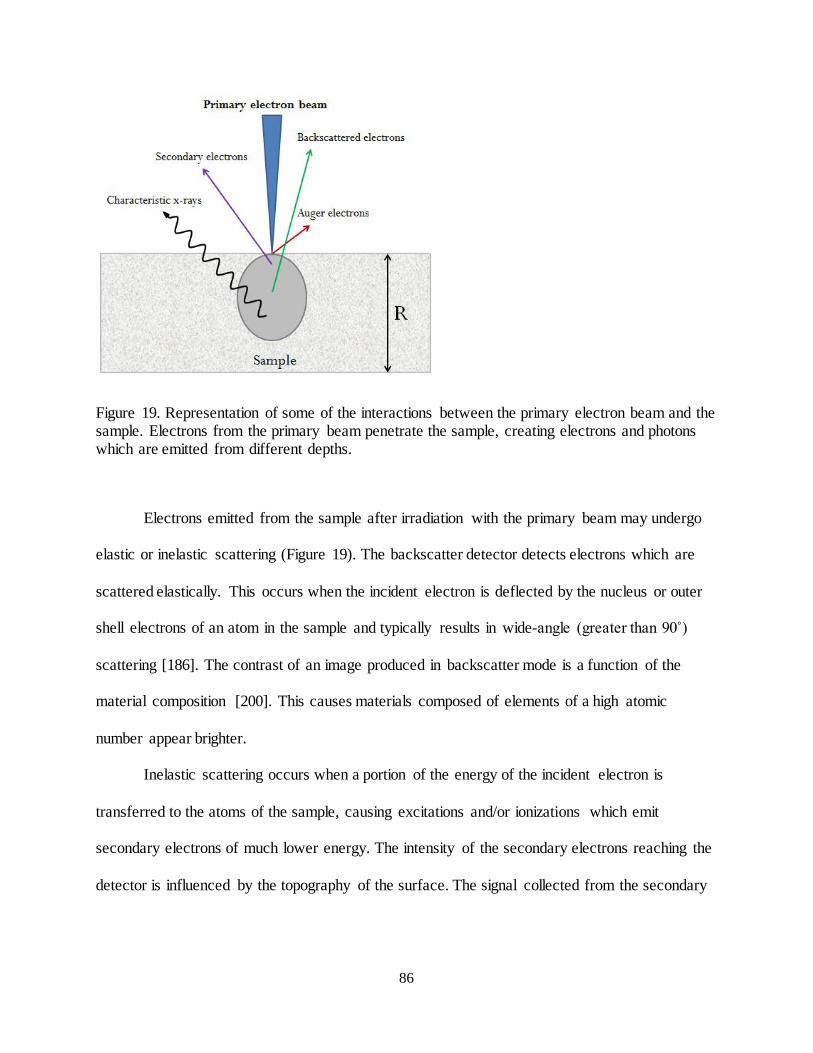
86
Figure 19. Representation of some of the interactions between the primary electron beam and the sample. Electrons from the primary beam penetrate the sample, creating electrons and photons which are emitted from different depths.
Electrons emitted from the sample after irradiation with the primary beam may undergo
elastic or inelastic scattering (Figure 19). The backscatter detector detects electrons which are
scattered elastically. This occurs when the incident electron is deflected by the nucleus or outer
shell electrons of an atom in the sample and typically results in wide-angle (greater than 90˚)
scattering [186]. The contrast of an image produced in backscatter mode is a function of the
material composition [200]. This causes materials composed of elements of a high atomic
number appear brighter.
Inelastic scattering occurs when a portion of the energy of the incident electron is
transferred to the atoms of the sample, causing excitations and/or ionizations which emit
secondary electrons of much lower energy. The intensity of the secondary electrons reaching the
detector is influenced by the topography of the surface. The signal collected from the secondary
87
electron detector is the most widely-used imaging mode and that which produces the best
visualization of the roughness and texture of a surface [186].
Although SEM is capable of analyzing large samples (up to 200 mm in diameter and 50
mm in thickness), some sample preparation may be required depending on the instrument used.
For example, most SEM equipment requires samples to be electrically conductive in order to
obtain sufficient contrast and resolution. Non-conductive samples are vulnerable to the “charging
effect”, which occurs when static electricity accumulates on the sample surface [201]. This has a
profound effect on the contrast of the image which is most significant for secondary electron
mode and least significant for backscatter mode. For this reason, polymer samples are often
sputter-coated with a thin layer (a few nanometers) of metal such as gold, silver or tungsten
[202]. Alternatively, the sample could be analyzed at higher pressures which can be achieved
with variable-pressure SEM [175].
Variable pressure SEM is ideal for samples that are not electrically conductive, including
most polymers. With this instrument, charging on the sample surface is suppressed by the
addition of gas (typically nitrogen or helium) to the sample chamber which undergoes ionization
by the electrons and serves to neutralize the charge on the specimen [175]. Images from this
technique are normally obtained in backscatter mode.
The elemental composition of a sample is determined via energy-dispersive x-ray
spectroscopy. As electrons under inelastic scatter interactions, a portion of their energy is
transferred to atoms in the sample, some of which emit x-rays which are characteristic of the
excited atom [157]. The EDS feature produces both an elemental map that overlays the SEM
image as well as a spectrum that contains qualitative and quantitative information on the
elemental distribution within the sample. Although EDS is a standard attachment for most SEMs,

88
the spatial resolution of this features is approximately one order of magnitude lower than the
standard SEM mode and elements of atomic number below four cannot be analyzed [198].
All SEM/EDS in this dissertation was performed with the Maryland Nanocenter’s Hitachi
S-3400 Variable Pressure SEM fitted with an EDS analyzer (Figure 20). At high vacuum, this
instrument features an ultimate resolution of approximately 3 nm. Images were obtained using
backscatter mode to obtain information on sample composition. The analysis is provided in
Section 5.5.3.
Figure 20. Hitachi S-3400 Variable Pressure SEM located at the Maryland Nanocenter.
89
Chapter 5. Methodology and Results
5.1 Materials Selection
5.1.1 Monomer Selection
A previous chapter described the methodology used to select monomers for testing. All
candidate monomers possessed either a phosphate, phosphonate or phosphonic acid functional
group. Four of the monomers for testing were mono-vinyl (containing one vinyl or allyl group)
and one monomer was di-vinyl (containing two acrylic groups).
A preliminary grafting experiment was performed to compare the degrees of grafting
obtained with each monomer. Each monomer was grafted to Winged nylon-6 using the direct
method in both aqueous and organic solvent at a monomer concentration of approximately 0.22
M. Gamma irradiation was performed at 10 kGy/hr to a total dose of 40 kGy. The results are
shown in Figure 21, with the degree of grafting in both water and ethanol taken as the average of
two samples.
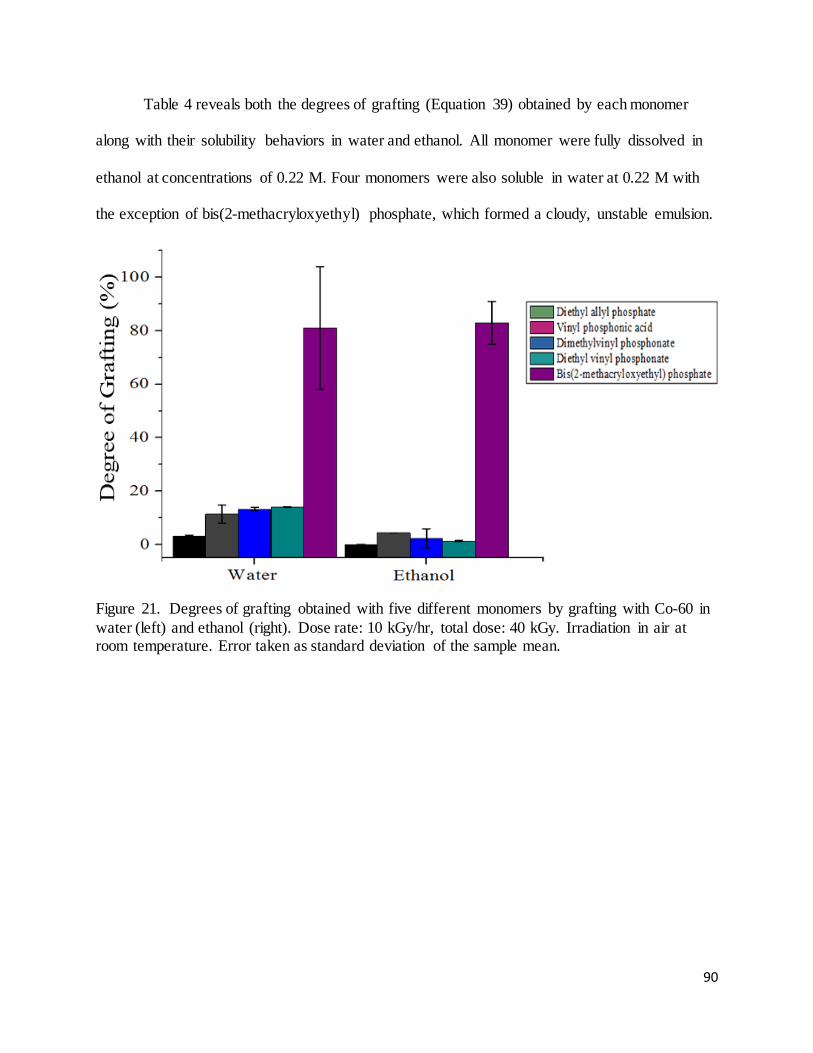
90
Table 4 reveals both the degrees of grafting (Equation 39) obtained by each monomer
along with their solubility behaviors in water and ethanol. All monomer were fully dissolved in
ethanol at concentrations of 0.22 M. Four monomers were also soluble in water at 0.22 M with
the exception of bis(2-methacryloxyethyl) phosphate, which formed a cloudy, unstable emulsion.
Figure 21. Degrees of grafting obtained with five different monomers by grafting with Co-60 in water (left) and ethanol (right). Dose rate: 10 kGy/hr, total dose: 40 kGy. Irradiation in air at room temperature. Error taken as standard deviation of the sample mean.
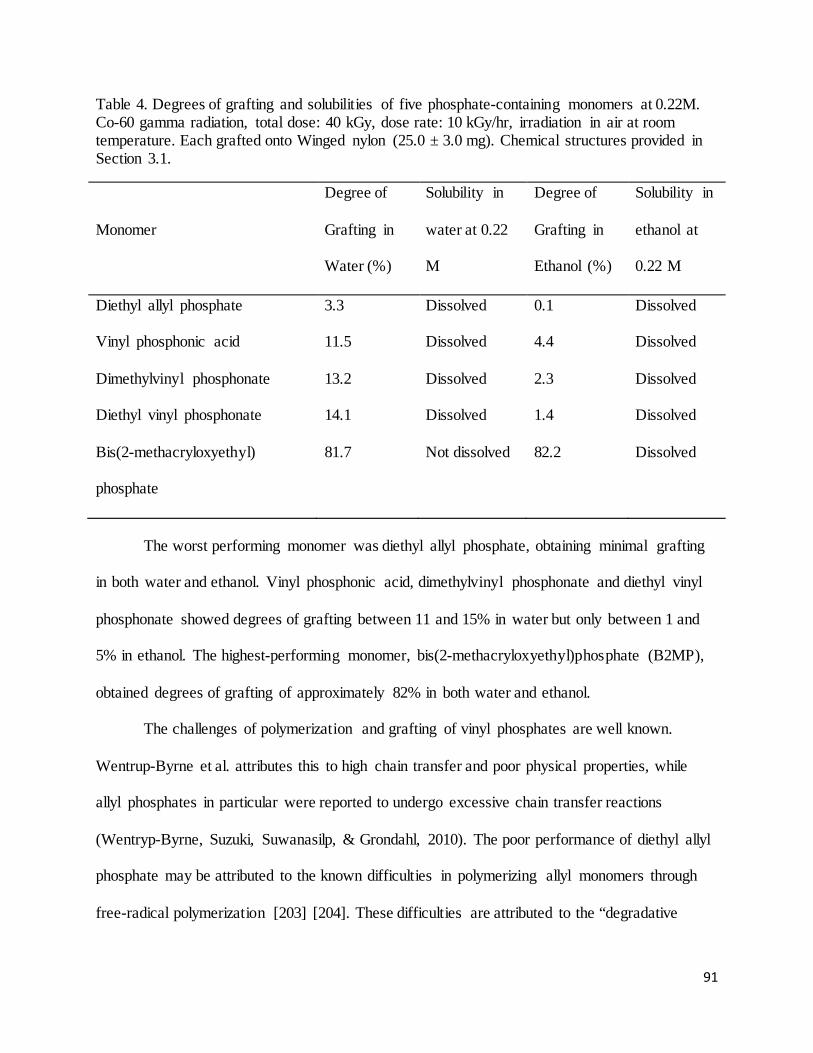
91
Table 4. Degrees of grafting and solubilities of five phosphate-containing monomers at 0.22M. Co-60 gamma radiation, total dose: 40 kGy, dose rate: 10 kGy/hr, irradiation in air at room temperature. Each grafted onto Winged nylon (25.0 ± 3.0 mg). Chemical structures provided in Section 3.1.
Monomer
Degree of
Grafting in
Water (%)
Solubility in
water at 0.22
M
Degree of
Grafting in
Ethanol (%)
Solubility in
ethanol at
0.22 M
Diethyl allyl phosphate 3.3 Dissolved 0.1 Dissolved
Vinyl phosphonic acid 11.5 Dissolved 4.4 Dissolved
Dimethylvinyl phosphonate 13.2 Dissolved 2.3 Dissolved
Diethyl vinyl phosphonate 14.1 Dissolved 1.4 Dissolved
Bis(2-methacryloxyethyl)
phosphate
81.7 Not dissolved 82.2 Dissolved
The worst performing monomer was diethyl allyl phosphate, obtaining minimal grafting
in both water and ethanol. Vinyl phosphonic acid, dimethylvinyl phosphonate and diethyl vinyl
phosphonate showed degrees of grafting between 11 and 15% in water but only between 1 and
5% in ethanol. The highest-performing monomer, bis(2-methacryloxyethyl)phosphate (B2MP),
obtained degrees of grafting of approximately 82% in both water and ethanol.
The challenges of polymerization and grafting of vinyl phosphates are well known.
Wentrup-Byrne et al. attributes this to high chain transfer and poor physical properties, while
allyl phosphates in particular were reported to undergo excessive chain transfer reactions
(Wentryp-Byrne, Suzuki, Suwanasilp, & Grondahl, 2010). The poor performance of diethyl allyl
phosphate may be attributed to the known difficulties in polymerizing allyl monomers through
free-radical polymerization [203] [204]. These difficulties are attributed to the “degradative
92
chain transfer” mechanism which occurs when the newly-formed allyl radical is stabilized
through resonance and is therefore more likely to undergo chain termination than chain
propagation [205]. Free radical polymerization of vinyl phosphate monomers has been attempted
in several studies with poor results, however; lanthanide-initiated polymerization of DEVP has
been performed with high (>90%) yields [206].
The effectiveness and applications of di-vinyl monomers, such as bis(2-
methacryloxyethyl) phosphate, are described in Section 3.1. These monomers are known
crosslinking agents and, due to their poly-functionality and radiation sensitivity, can be utilized
for this purpose either alone or as an additive. Poly-functional monomers have been shown to
require lower absorbed doses to produce high grafting yields [73]. This high affinity for
crosslinking is the most likely explanation for the high degrees of grafting observed with bis(2-
methacryloxyethyl) phosphate.
Due to the high degrees of grafting obtained with B2MP, this monomer was selected as
the complexing monomer for the remainder of the experiments perfomed. B2MP was also the
only monomer characterized with SEM, FTIR and Raman as well as tested for uranium
extraction performance. For this reason, future work should involve testing the uranium
extraction capacity of adsorbents grafted with different phosphate-containing monomers.
93
5.1.2 Polymeric Substrate Selection
The polymeric substrates tested in this dissertation were in the form of nylon-6 and
polypropylene Winged fabrics. Early grafting studies were performed on both Winged nylon
and Winged polypropylene with the goal of comparing the grafting yields obtained with each
substrate. However, significant degradation of Winged polypropylene was observed over the
range of dose rates and total doses required to achieve high degrees of grafting.
Although polypropylene has been used with great success in many radiation grafting
applications, the suitability of Winged polypropylene under the irradiation conditions required
for grafting was found to be very poor. Table 5 summarizes the irradiations performed on
Winged polypropylene. Despite obtaining high degrees of grafting with B2MP, the
polypropylene fabric became hard, brittle and discolored upon irradiation. The severity was
observed to increase with increasing absorbed dose. Grafting in the absence of oxygen by
purging the contents of each vial with nitrogen and nitrous oxide was also attempted with no
success. The observed phenomena of embrittlement and discoloration upon irradiation of
polypropylene have been widely reported in the literature and were discussed in detail in Section
3.2.1. Very high degrees of grafting (>160 %) were obtained under all conditions tested, while
the degrees of grafting obtained for the first two samples of Table 5 were unknown as the grafted
fabrics were discarded due to severe embrittlement before weighing.
On the contrary, Winged nylon maintained its integrity, flexibility and appearance
throughout the vast majority of irradiations performed in this thesis. A handful of exceptions
included high-dose irradiations performed at very high (>0.25 M) monomer concentrations, in
which case the grafted fabric took on a glassy appearance and texture. Otherwise, the range of
doses and dose rates used in this dissertation produced no observable changes in Winged nylon.
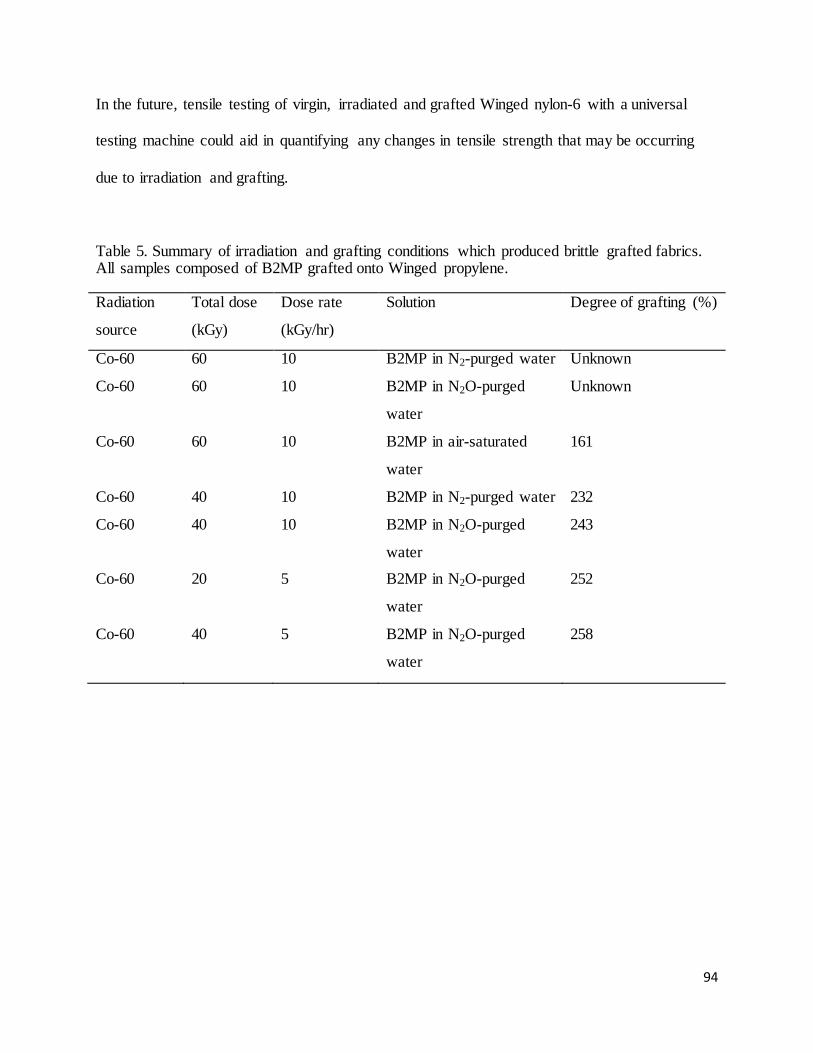
94
In the future, tensile testing of virgin, irradiated and grafted Winged nylon-6 with a universal
testing machine could aid in quantifying any changes in tensile strength that may be occurring
due to irradiation and grafting.
Table 5. Summary of irradiation and grafting conditions which produced brittle grafted fabrics. All samples composed of B2MP grafted onto Winged propylene.
Radiation
source
Total dose
(kGy)
Dose rate
(kGy/hr)
Solution Degree of grafting (%)
Co-60 60 10 B2MP in N2-purged water Unknown
Co-60 60 10 B2MP in N2O-purged
water
Unknown
Co-60 60 10 B2MP in air-saturated
water
161
Co-60 40 10 B2MP in N2-purged water 232
Co-60 40 10 B2MP in N2O-purged
water
243
Co-60 20 5 B2MP in N2O-purged
water
252
Co-60 40 5 B2MP in N2O-purged
water
258
95
5.2 Sample Irradiation
5.2.1 Radiation Safety The precautions taken when working with radiation can be described for two categories
of experimental work: the precautions taken when operating radiation-producing machines and
those taken when working with 233U in the laboratory. In both cases, the standard practice of
“TDS” (time-distance-shielding) was implemented. This strategy involves reducing the time
spend near a radiation source, increasing the distance between one’s self and the source and
maintaining as much shielding as necessary between one’s self and the source.
Fortunately, both the Co-60 gamma irradiator and LINAC were designed with TDS in
mind. Both facilities are contained inside concrete vaults with several feet of concrete shielding
on all walls. The doors at the entrances to the vaults consist of concrete and steel plates. A
system of safety interlocks for both facilities serves several purposes, including:
• Preventing access to the vault during operation (Co-60 source is in exposed position, or
LINAC beam is “on”)
• Allowing escape of personnel from the vault if left inside while the door is closed
• Lowering the Co-60 source or shutting off the LINAC beam if operational conditions
(radiation levels, conductivity, vacuum pressure, etc.) are outside the desired range
A calibrated, operational Geiger-Müller counter was utilized during every entry to both
the Co-60 irradiator and LINAC target room vaults. The instrument was also left in operation
during all time periods spent inside the vaults.
Requirements for independent operation of the UMD Radiation Facilities included
several courses in radiation safety (provided by UMD Department of Environmental Safety) as
96
well as a State of Maryland operator’s license for both the Co-60 irradiator and electron beam
linear accelerator. Qualifications were maintained through annual refresher training.
All personnel working with radioactive materials are issued a personal film badge
dosimeter to be worn during all activities within designated radiation areas. The films are
developed on a routine basis to monitor for any unusual exposure. Such individuals are deemed
“radiation workers” and are limited, by law, to receiving no more than 5 Rem per year. Normal
operation of the two radiation-producing facilities (such as those performed in the course of this
work), typically result in minimal (background level) exposure.
A different set of radiation safety precautions was undertaken during the extraction
efficiency testing of the grafted fabrics. Despite the extremely low activity of the 233U stock
solution, all necessary safety and waste generation procedures were followed. These experiments
were performed in the laboratory, with all radioactive material stored and utilized inside a
designated fume hood labelled as a radioactive materials area.
All potentially-contaminated wastes (gloves, pipette tips, laboratory wipes, etc.) were
disposed of in a radioactive solid waste bin, while all contaminated liquid was added to a carboy
for aqueous radioactive waste. Care was taken to prevent and (if necessary) identify any drips,
spills or cross-contamination that occurred during the experiment. Radioactive solutions
(including stock solutions and testing solutions) were kept sealed either in a capped vial or in a
flask or beaker sealed with laboratory film and were always placed inside a container or tray with
the capacity to hold the entire volume if spilled. Periodic wipe tests on objects and surfaces in the
fume hood revealed no detectable contamination at any point during the experiment. At the end
of the experiment, all counting solutions and 233U-loaded grafted fabrics were sent away for
proper disposal.
97
5.2.2 Dosimetry and Dose Mapping
For experiments conducted prior to July 2012, the dose absorbed by irradiated samples
from both gamma and electron beam sources were determined by pre-irradiation dose mapping
accomplished using radiochromic films and Fricke solutions. After this date, alanine dosimetry
was utilized. Table 6 compares the three dosimetry methods utilized in this thesis.
A dose map is essentially a dose profile of a radioactive source, achieved by performing
dosimetry at different points in space. Dose mapping provides a 2- or 3-dimentional plot of
absorbed dose as a function of distance from the radiation source or distance from the center of a
radiation beam. The absorbent dose rate can be derived by dividing the absorbed dose by the
irradiation time.
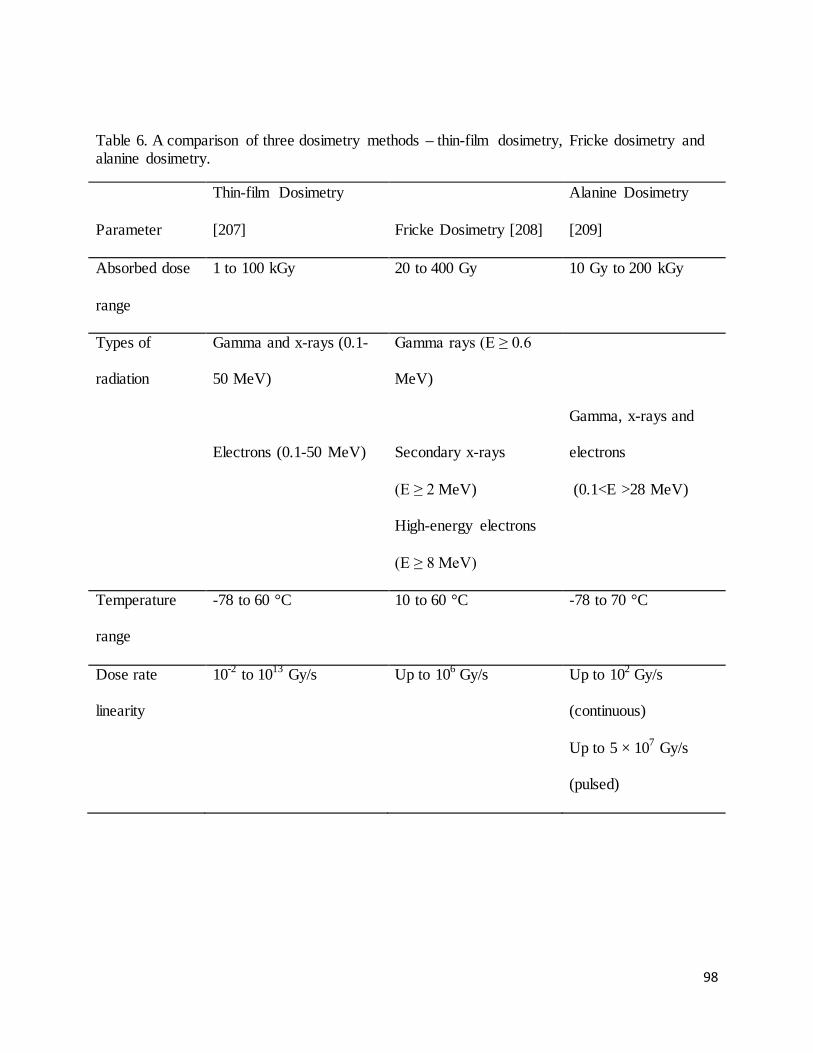
98
Table 6. A comparison of three dosimetry methods – thin-film dosimetry, Fricke dosimetry and alanine dosimetry.
Parameter
Thin-film Dosimetry
[207] Fricke Dosimetry [208]
Alanine Dosimetry
[209]
Absorbed dose
range
1 to 100 kGy 20 to 400 Gy 10 Gy to 200 kGy
Types of
radiation
Gamma and x-rays (0.1-
50 MeV)
Electrons (0.1-50 MeV)
Gamma rays (E ≥ 0.6
MeV)
Secondary x-rays
(E ≥ 2 MeV)
High-energy electrons
(E ≥ 8 MeV)
Gamma, x-rays and
electrons
(0.1<E >28 MeV)
Temperature
range
-78 to 60 °C 10 to 60 °C -78 to 70 °C
Dose rate
linearity
10-2 to 1013 Gy/s Up to 106 Gy/s Up to 102 Gy/s
(continuous)
Up to 5 × 10⁷ Gy/s
(pulsed)
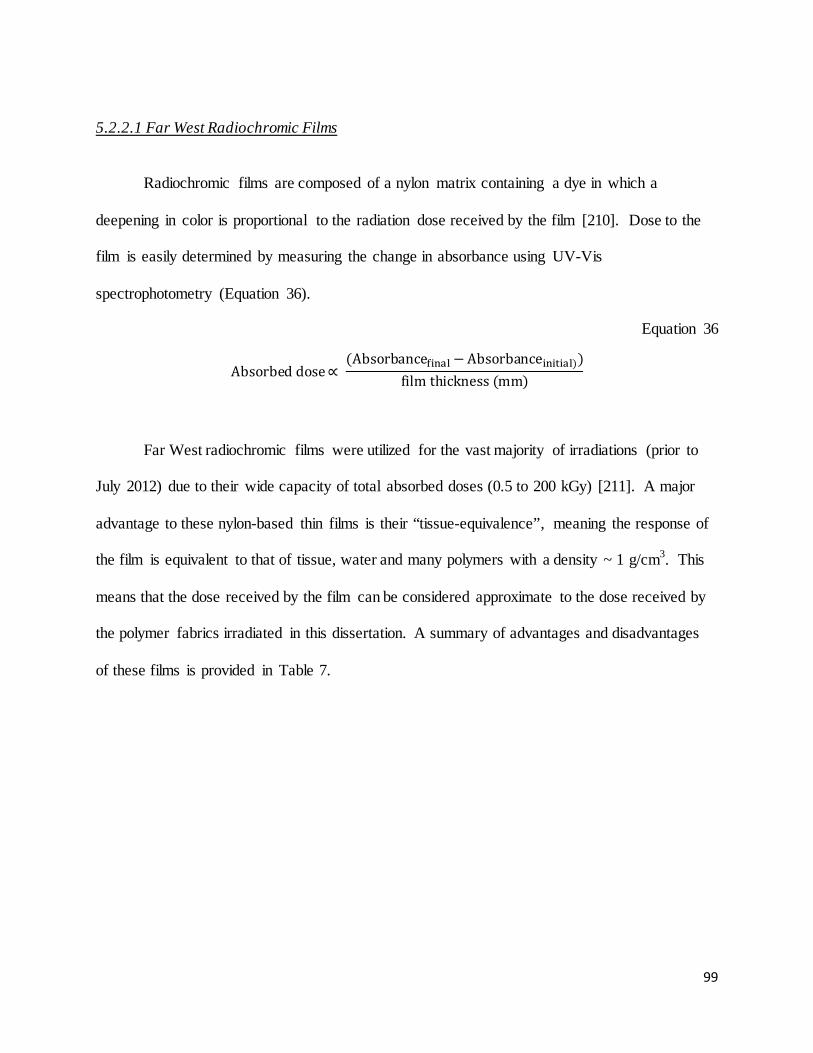
99
5.2.2.1 Far West Radiochromic Films
Radiochromic films are composed of a nylon matrix containing a dye in which a
deepening in color is proportional to the radiation dose received by the film [210]. Dose to the
film is easily determined by measuring the change in absorbance using UV-Vis
spectrophotometry (Equation 36).
Equation 36
Absorbed dose∝ (Absorbancefinal −Absorbanceinitial))
film thickness (mm)
Far West radiochromic films were utilized for the vast majority of irradiations (prior to
July 2012) due to their wide capacity of total absorbed doses (0.5 to 200 kGy) [211]. A major
advantage to these nylon-based thin films is their “tissue-equivalence”, meaning the response of
the film is equivalent to that of tissue, water and many polymers with a density ~ 1 g/cm3. This
means that the dose received by the film can be considered approximate to the dose received by
the polymer fabrics irradiated in this dissertation. A summary of advantages and disadvantages
of these films is provided in Table 7.
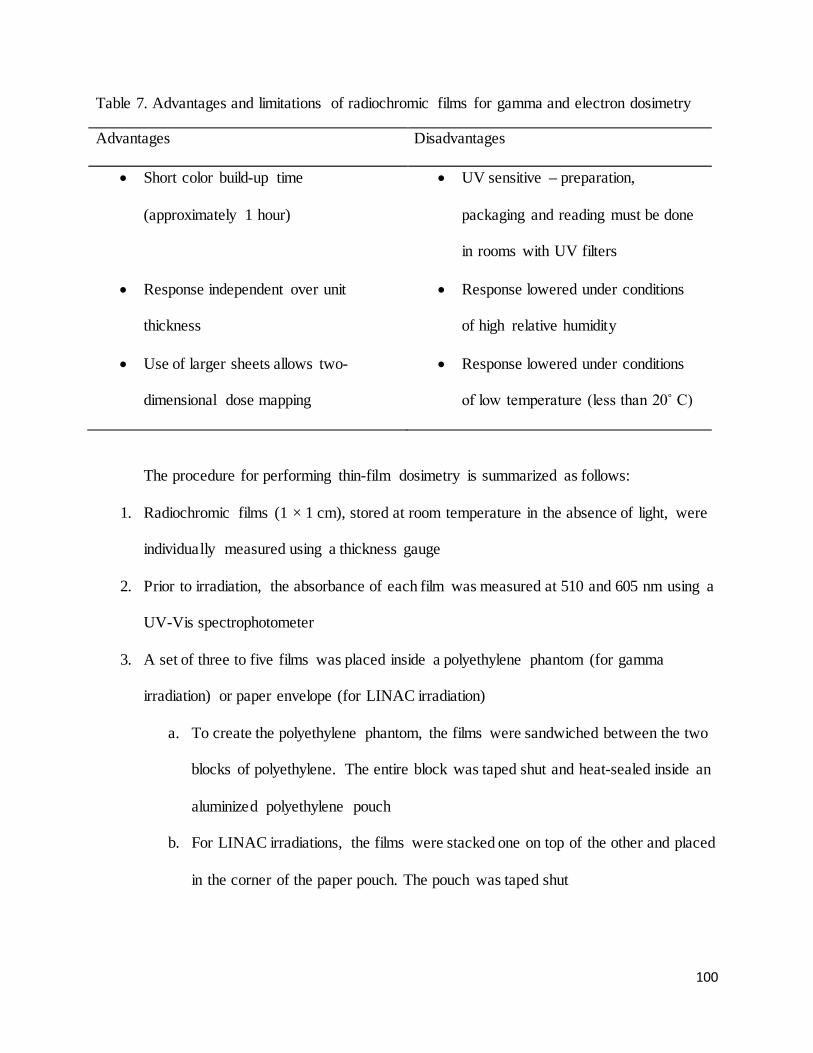
100
Table 7. Advantages and limitations of radiochromic films for gamma and electron dosimetry
Advantages Disadvantages
• Short color build-up time
(approximately 1 hour)
• UV sensitive – preparation,
packaging and reading must be done
in rooms with UV filters
• Response independent over unit
thickness
• Response lowered under conditions
of high relative humidity
• Use of larger sheets allows two-
dimensional dose mapping
• Response lowered under conditions
of low temperature (less than 20˚ C)
The procedure for performing thin-film dosimetry is summarized as follows:
1. Radiochromic films (1 × 1 cm), stored at room temperature in the absence of light, were
individually measured using a thickness gauge
2. Prior to irradiation, the absorbance of each film was measured at 510 and 605 nm using a
UV-Vis spectrophotometer
3. A set of three to five films was placed inside a polyethylene phantom (for gamma
irradiation) or paper envelope (for LINAC irradiation)
a. To create the polyethylene phantom, the films were sandwiched between the two
blocks of polyethylene. The entire block was taped shut and heat-sealed inside an
aluminized polyethylene pouch
b. For LINAC irradiations, the films were stacked one on top of the other and placed
in the corner of the paper pouch. The pouch was taped shut
101
4. The phantoms and pouches were placed inside the Co-60 irradiator or LINAC vault. The
locations of the films were measured with great care in inches (Co-60) or centimeters
(LINAC) from the irradiator top hat or the LINAC beam window
5. The phantoms and paper pouches were irradiated to a dose which caused visible
coloration to the films without reaching saturation
a. For Co-60 irradiation, this could be up to several hours at a low to intermediate
dose rate. All phantoms were placed perpendicular to the source at a vertical
height of 8 inches, with the distance from the source top hat recorded
b. For LINAC operation, usually 2000-5000 pulses were deployed. Films were
placed either at a fixed distance from the beam window (if the beam center was
known) or in a perpendicular array (if the beam center was unknown)
6. The irradiated films were allowed to rest insider their packaging and away from radiation
sources for 24 hours
7. The films were removed from their packaging and their final absorbance measured at 510
and 605 nm
8. The absorbance for each set of films was determined by taking an average of the
absorbance of each film
9. The films were compared to a calibration curve of optical density per unit thickness as a
function of absorbed dose (Figure 22).
10. The absorbed dose of the films was calculated. The dose rate was determined by dividing
the dose by the irradiation time (Co-60) or by the number of pulses (LINAC)
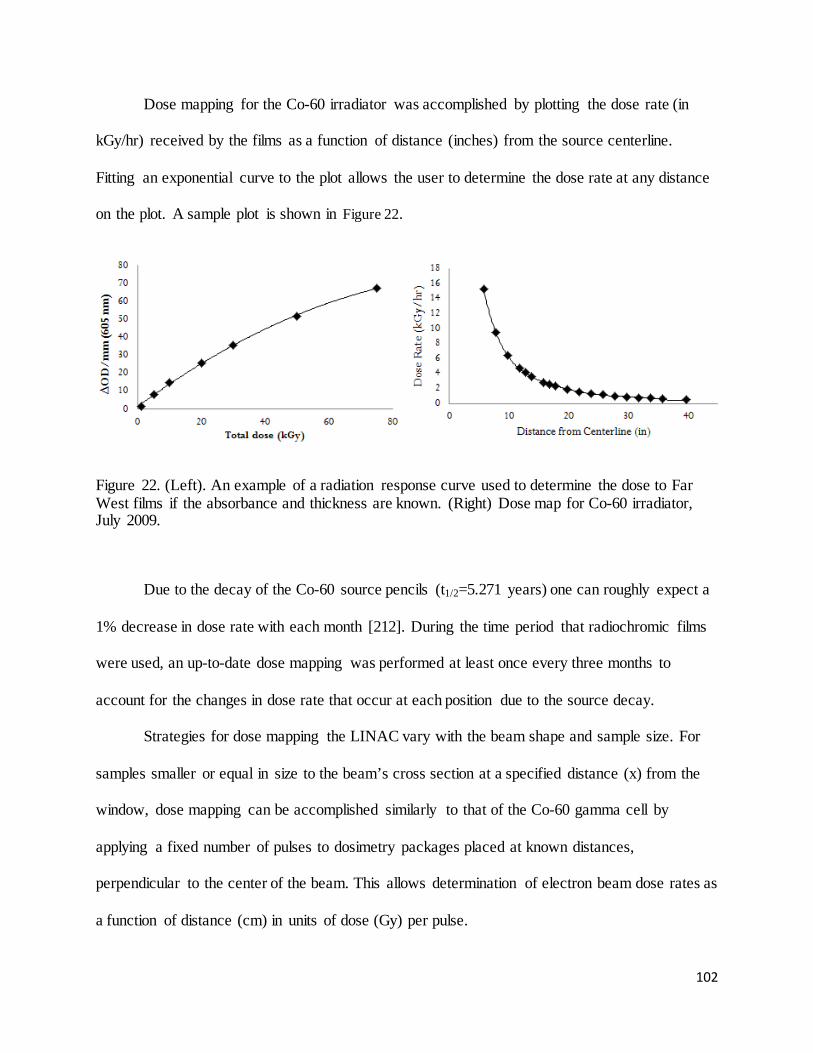
102
Dose mapping for the Co-60 irradiator was accomplished by plotting the dose rate (in
kGy/hr) received by the films as a function of distance (inches) from the source centerline.
Fitting an exponential curve to the plot allows the user to determine the dose rate at any distance
on the plot. A sample plot is shown in Figure 22.
Figure 22. (Left). An example of a radiation response curve used to determine the dose to Far West films if the absorbance and thickness are known. (Right) Dose map for Co-60 irradiator, July 2009.
Due to the decay of the Co-60 source pencils (t1/2=5.271 years) one can roughly expect a
1% decrease in dose rate with each month [212]. During the time period that radiochromic films
were used, an up-to-date dose mapping was performed at least once every three months to
account for the changes in dose rate that occur at each position due to the source decay.
Strategies for dose mapping the LINAC vary with the beam shape and sample size. For
samples smaller or equal in size to the beam’s cross section at a specified distance (x) from the
window, dose mapping can be accomplished similarly to that of the Co-60 gamma cell by
applying a fixed number of pulses to dosimetry packages placed at known distances,
perpendicular to the center of the beam. This allows determination of electron beam dose rates as
a function of distance (cm) in units of dose (Gy) per pulse.
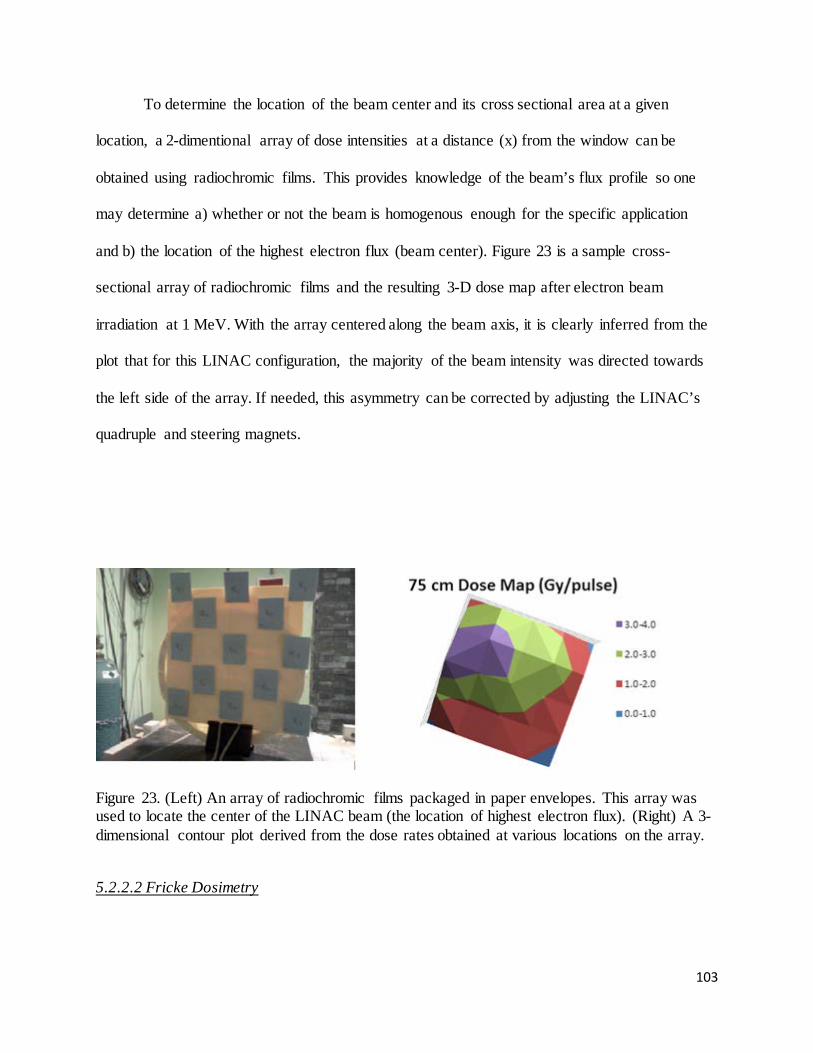
103
To determine the location of the beam center and its cross sectional area at a given
location, a 2-dimentional array of dose intensities at a distance (x) from the window can be
obtained using radiochromic films. This provides knowledge of the beam’s flux profile so one
may determine a) whether or not the beam is homogenous enough for the specific application
and b) the location of the highest electron flux (beam center). Figure 23 is a sample cross-
sectional array of radiochromic films and the resulting 3-D dose map after electron beam
irradiation at 1 MeV. With the array centered along the beam axis, it is clearly inferred from the
plot that for this LINAC configuration, the majority of the beam intensity was directed towards
the left side of the array. If needed, this asymmetry can be corrected by adjusting the LINAC’s
quadruple and steering magnets.
Figure 23. (Left) An array of radiochromic films packaged in paper envelopes. This array was used to locate the center of the LINAC beam (the location of highest electron flux). (Right) A 3-dimensional contour plot derived from the dose rates obtained at various locations on the array.
5.2.2.2 Fricke Dosimetry
104
Fricke dosimetry, also called ferrous-sulfate dosimetry, is a chemical dosimeter which
relies on the direct proportionality between adsorbed dose and the concentration of Fe2+ (ferrous)
ions oxidized to Fe3+ (ferric) ions in an irradiated aqueous solution [213]. Fricke dosimetry
features a precision of up to 0.1% with a properly calibrated spectrophotometer [214]. Although
the Fricke solution can be prepared easily and at little cost, several drawbacks to this dosimetry
system include a high sensitivity to organic and metal ion impurities, a limited absorbed dose
range and substantial temperature dependence during both irradiation and measurement.
Because the Fricke solution is aqueous and can be considered a water-equivalent
material, it is an ideal dosimetry system for approximating absorbed dose in water, human tissue
or polymers (ρ ≅ 1 g/cm3). The solution is prepared according to ASTM Standard E1026-04 and
consists of an air-saturated aqueous solution of 1 mM NaCl, 1 mM ferrous ammonium sulfate
and 0.4 M sulfuric acid (ASTM, 2007).
Absorbed dose is measured by comparing the absorbance before and after irradiation (Af
– Ai) at 300 nm using a Cary 300 Bio UV-Vis Spectrophotometer. The solution should be
irradiated in a borosilicate glass vial and transferred for measurement via pipette to a clean
quartz cuvette. Absorbed dose is determined with Equation 37 [213].
Equation 37
Absorbed dose (Gy) = 9.648 × 10⁶ �Af −Ai
εlρG[Fe3+]�
Where:
Af = final Absorption (after irradiation)
Ai = initial Absorption (before irradiation)
ε = absorptivity
105
l = optical path length (cm) = 1 cm
ρ = density of Fricke solution (g/cm3) = 1.024 g/cm3
G[Fe3+] = radiation chemical yield of ferric ions (molecules/100 eV) = 15.5
molecules/100eV
Due to the convenience of and efficiency of radiochromic films, the Fricke method was
only used to verify LINAC dose rates obtained with film dosimetry.
106
5.2.2.3 Alanine Dosimetry
Alanine dosimetry is performed by irradiating a pellet or film composed of the amino
acid “L-alanine” which forms a stable free radical upon irradiation [215]. The radiation response
of L-alanine is dose dependent and very accurate, making it a reliable technique for dose
measurements. The alanine radical is highly stable due to its crystalline structure and, under the
right conditions, the radical can survive for years with only minimal decay [216].
Electron paramagnetic resonance (EPR) is used to measure the concentration of alanine
radicals in the dosimeter. Absorbed dose is determined by measuring the peak-to-peak amplitude
in the central line of the alanine radical signal [217]. For a given system, the concentration of
alanine radicals is proportional to the absorbed dose but independent of the dose rate, energy and
(for the most part) temperature and humidity [218].
The irradiator dose profile obtained with alanine dosimetry was applied to a spreadsheet
which enabled the calculation of dose rates at any radial position in the irradiator. The
calculations also accounted for the decay of the Co-60 source, allowing the determination of
dose rates as a function of time. The following table compares the three forms of dosimetry
utilized in this dissertation: thin-film, Fricke and alanine dosimetry.
5.2.3 Sources of Error
The uncertainty of the dose rate received by a sample under irradiation with electron
beam or Co-60 is based on two sources of error: the uncertainty due to sample position and the
uncertainty of the calibration. The contributions from other sources of error, such as the pulse
generator (electron beam) and elevator timer (Co-60), were determined to be negligible.
107
The dose rate received by a sample varies according to the position of the sample relative
to the beam window (for electron beam) or the source centerline (Co-60). Irradiations are
performed by placing a sample at the position which corresponds to the desired dose rate
determined by the dosimetry calibration. Because the dose rates observed with both radiation
sources decrease exponentially as a function of increasing distance, the largest uncertainty in
dose rate can be observed at the position nearest to the source. For Co-60 irradiation of a small
sample, this position is about 6 inches from the source centerline. Assuming a positioning error
of 0.25 inches at 6 inches from the centerline, the percent variation in corresponding dose rates is
7.8%. It is also expected that this value would be consistent with electron beam.
The uncertainty based on the dosimetry calibration was calculated as the maximum
variation at any position between the line of best fit and the actual dose rates measured with
alanine. This maximum variation was observed to be 7.9%.
The total uncertainty in dose rate was calculated as the quadrature sum of the two sources
of error and was determined to be 11.1%.
5.2.4 Irradiation Procedures
All irradiations described in this thesis were performed using the University of Maryland
Radiation Facility’s 100 kCi Co-60 gamma irradiation and 1-9 MeV electron beam LINAC.
Irradiation of samples in both the LINAC and Co-60 irradiation were performed at room
temperature without stirring or agitation. Although these features would be highly desirable, any
heating, cooling or stirring using electronic devices was not possible due to the extremely-high
levels of radiation present in the facilities during operation.
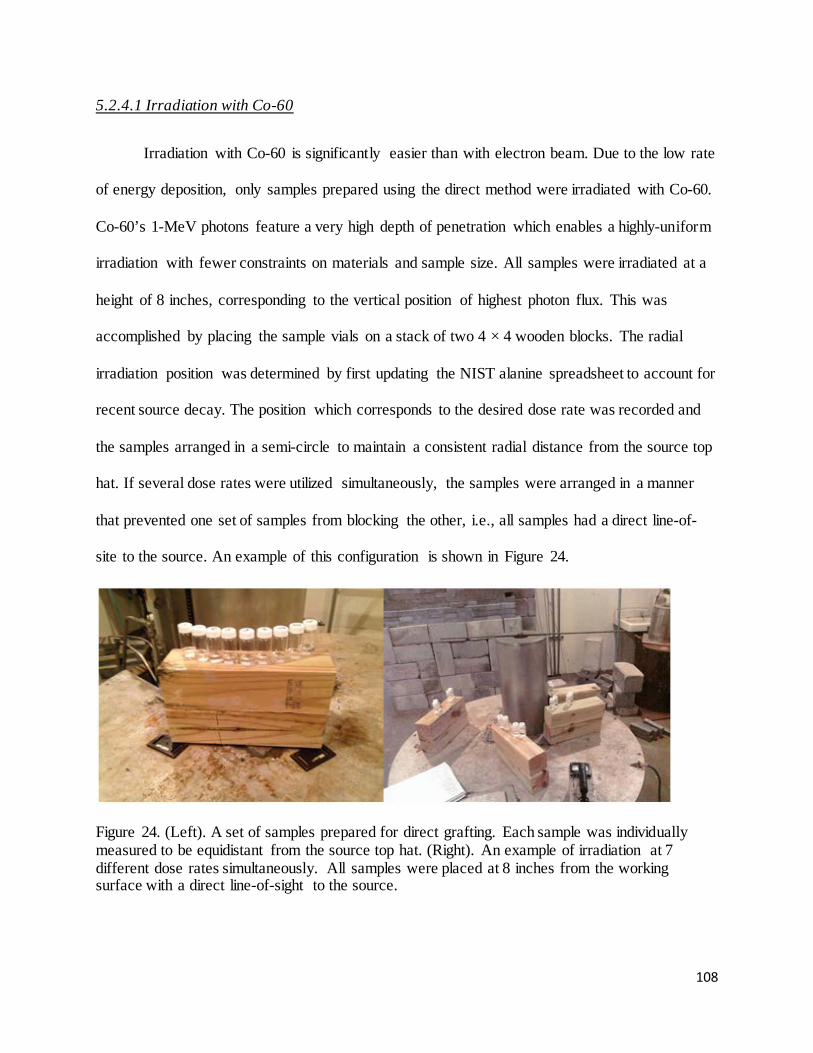
108
5.2.4.1 Irradiation with Co-60
Irradiation with Co-60 is significantly easier than with electron beam. Due to the low rate
of energy deposition, only samples prepared using the direct method were irradiated with Co-60.
Co-60’s 1-MeV photons feature a very high depth of penetration which enables a highly-uniform
irradiation with fewer constraints on materials and sample size. All samples were irradiated at a
height of 8 inches, corresponding to the vertical position of highest photon flux. This was
accomplished by placing the sample vials on a stack of two 4 × 4 wooden blocks. The radial
irradiation position was determined by first updating the NIST alanine spreadsheet to account for
recent source decay. The position which corresponds to the desired dose rate was recorded and
the samples arranged in a semi-circle to maintain a consistent radial distance from the source top
hat. If several dose rates were utilized simultaneously, the samples were arranged in a manner
that prevented one set of samples from blocking the other, i.e., all samples had a direct line-of-
site to the source. An example of this configuration is shown in Figure 24.
Figure 24. (Left). A set of samples prepared for direct grafting. Each sample was individually measured to be equidistant from the source top hat. (Right). An example of irradiation at 7 different dose rates simultaneously. All samples were placed at 8 inches from the working surface with a direct line-of-sight to the source.
109
The duration of the irradiation can be controlled in two ways: by manually raising and
lowering source or by entering the irradiation time (in minutes) on the irradiator timer. In the
second method, the source is lowered automatically when the timer expires. The automatic
nature of the irradiator source allows un-attended operation, which means a licensed operator is
only needed to enter and exit the vault as well as raise the source.
5.2.4.2 Irradiation with Electron Beam
Electron beam irradiations differed in strategy depending upon the sample being
irradiated. Capable of dose rates several orders of magnitude higher than with Co-60, the
electron beam is ideal for generating a high concentration of free radicals on bare fabrics, either
for EPR studies or for indirect grafting. In these cases, room temperature irradiation of fabrics
was performed by taping the bag containing the fabrics sample to an acrylic sheet placed
perpendicular to the beam. The X-Y location of the sample was adjusted so that the center of the
sample was aligned with the center of the beam, while the Z (distance) location was selected
based on the position corresponding to the desired dose rate. The dose rate (Gy/pulse) was
determined by dose mapping with radiochromic films.
Direct grafting was performed with great caution, and care was taken to minimize both
heat transfer and the scattering of electrons from the sample holder to the vial. For this reason, a
makeshift sample holder was created by wrapping a wire centrifuge rack in thin aluminum foil.
Each vial was placed on the aluminum foil without touching the wire structure. This allowed air
to flow beneath the sample and prevented heating of the sample by contact with the holder itself.
The irradiation position (X-Y) and distance from the window (Z) were measured based on the
center of the vial to ensure irradiation of the fabric inside.
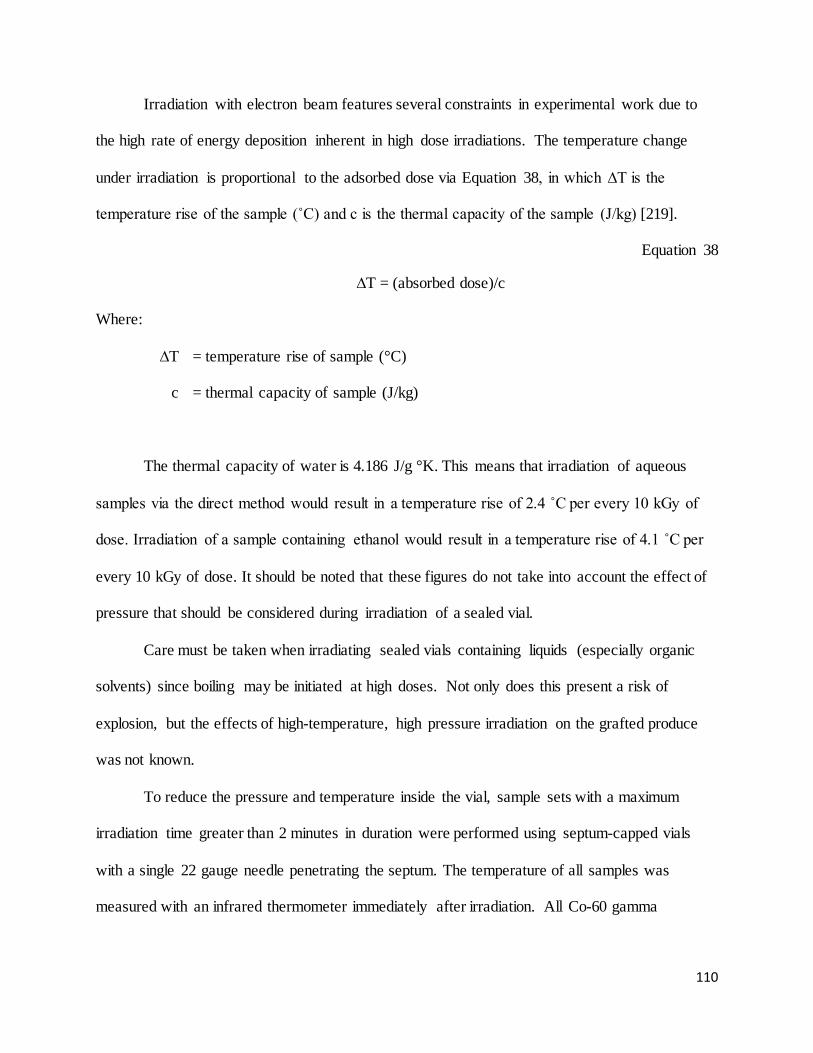
110
Irradiation with electron beam features several constraints in experimental work due to
the high rate of energy deposition inherent in high dose irradiations. The temperature change
under irradiation is proportional to the adsorbed dose via Equation 38, in which ∆T is the
temperature rise of the sample (˚C) and c is the thermal capacity of the sample (J/kg) [219].
Equation 38
∆T = (absorbed dose)/c
Where:
∆T = temperature rise of sample (°C)
c = thermal capacity of sample (J/kg)
The thermal capacity of water is 4.186 J/g °K. This means that irradiation of aqueous
samples via the direct method would result in a temperature rise of 2.4 ˚C per every 10 kGy of
dose. Irradiation of a sample containing ethanol would result in a temperature rise of 4.1 ˚C per
every 10 kGy of dose. It should be noted that these figures do not take into account the effect of
pressure that should be considered during irradiation of a sealed vial.
Care must be taken when irradiating sealed vials containing liquids (especially organic
solvents) since boiling may be initiated at high doses. Not only does this present a risk of
explosion, but the effects of high-temperature, high pressure irradiation on the grafted produce
was not known.
To reduce the pressure and temperature inside the vial, sample sets with a maximum
irradiation time greater than 2 minutes in duration were performed using septum-capped vials
with a single 22 gauge needle penetrating the septum. The temperature of all samples was
measured with an infrared thermometer immediately after irradiation. All Co-60 gamma
111
irradiations, by contrast, were performed using sealed vials to both prevent the ingress of oxygen
and to keep the sample afloat if it were to fall inside the source pool.
As a safety precaution, no organic solvents (including methanol and ethanol) were
irradiated with electron beam for two reasons. The first reason is because explosion of a sample
could severely incapacitate the electron beam, especially if a vial cap or other fragment were to
strike the thin beam window. Secondly, it would not have been possible to irradiate samples
containing methanol or ethanol to the same doses obtained with water without a significant
increase in temperature or even boiling. All irradiations of organic solvents were performed
using Co-60 gamma radiation, in which no increase in temperature was observed.
5.2.5 Grafting Method
Two methods of grafting, the indirect and the direct method, were utilized for grafting
phosphate-containing monomers onto Winged fibers and are introduced in Section 2.8.
The indirect (pre-irradiation) grafting method was the first attempted. This method is
known to produce grafted samples of high uniformity with little-to-no homopolymer due to
enhancement of the graft propagation reaction (P• + M → P-M•) via irradiation of the polymer
substrate in the absence of monomer or solvent. Indirect grafting was performed though
variations of the procedure described in the following section for several monomers, mainly
diethylvinyl phosphate (DEVP). Even for B2MP, grafting yields for this method did not exceed
54% for any monomer, despite high monomer concentrations and long grafting times. It was for
this reason that grafting via the direct method was attempted.
High degrees of grafting were immediately obtained upon direct grafting of B2MP onto
Winged nylon. In addition to higher grafting yields, this method required lower doses, less
112
monomer, less sample preparation time and did not require irradiation in dry ice. For the above
reasons, the irradiations described in this dissertation were all performed via the direct method.
5.2.6 Grafting Procedures
The grafting procedures were developed through experimentation and were frequently
modified for improvement. For the sake of describing the methodology behind the selection of
the complexing monomer and fabric substrate (Section 5.1), a general procedure for grafting
with the direct (simultaneous) and indirect (pre-irradiation) method will be discussed in this
section.
5.2.6.1 Indirect Grafting
1. Square samples were cut from sheets of polymeric fabric to a mass of 25.5 ± 0.3 mg
2. The mass of each individual sample was recorded
3. Each samples was placed in a labelled, un-sealed polyethylene bag
4. The monomer was removed from refrigeration and pipetted (inside an analytical balance)
into a 10 mL septum-capped glass vial until the desired monomer mass was achieved
5. The mass of monomer of each sample was recorded
6. The solvent was measured with a graduated cylinder and added to the vial along with a
stirring flea
7. The vial containing the monomer and solvent was capped and purged with nitrogen gas
for a designated period of time
8. The bagged fabrics and purged vials were purged under vacuum for three cycles and
added to a glove box containing pure nitrogen gas

113
9. The bags containing the fabric samples were removed from the glove box and irradiated
with electron beam
10. After irradiation the fabrics were immediately transferred to the nitrogen glove box and
added to the monomer-solvent mixture
11. The mixture was sealed, removed from the glove box and stirred and/or heated until the
desired grafting time was achieved
12. The grafted fabrics were removed from the vial and rinsed with water to remove loosely-
bound material
13. Each sample was added to approximately 15 mL of deionized water and sonicated for 20-
60 minutes
14. This process was repeated by replacing the vial with fresh water until the solvent
remained clear after sonication
15. The grafted fabrics were dried under vacuum until a constant weight was reached
16. The degree of grafting was determined for each sample with Equation 39.
5.2.6.2 Direct Grafting
In this method, the polymer substrate was irradiated simultaneously with the monomer-
solvent mixture according to the following procedure:
1. Square samples were cut from sheets of polymeric fabric to a mass of 25.5 ± 0.3 mg
2. The mass of each individual sample was recorded
3. The monomer was removed from refrigeration and pipetted (inside an analytical balance)
into a 10 mL glass vial until the desired monomer mass was achieved
4. The mass of monomer of each sample was recorded

114
5. The solvent was measured with a graduated cylinder and added to the vial containing the
monomer
6. The fabric sample was added to the vial
7. The vial was capped, sealed with laboratory film and sonicated for at least 1 hour
8. The sample was removed from sonication and irradiated
a. Samples irradiated with electron beam were transferred immediately from
sonication to the LINAC vault, the samples were shaken thoroughly during
transfer
9. After irradiation, the samples were allowed to rest unopened at room temperature for a
period of at least 16 hours
10. The grafted fabrics were removed from the vials and rinsed with ethanol to remove
loosely-bound material
11. Each sample was added to approximately 15 mL of ethanol and sonicated for 20-60
minutes
12. This process was repeated by replacing the vial with fresh ethanol until the solvent
remained clear after sonication
13. The grafted fabrics were placed on a metal tray and dried in an oven at 65 ˚C until a
constant weight was reached
14. The degree of grafting was determined for each sample with Equation 39.
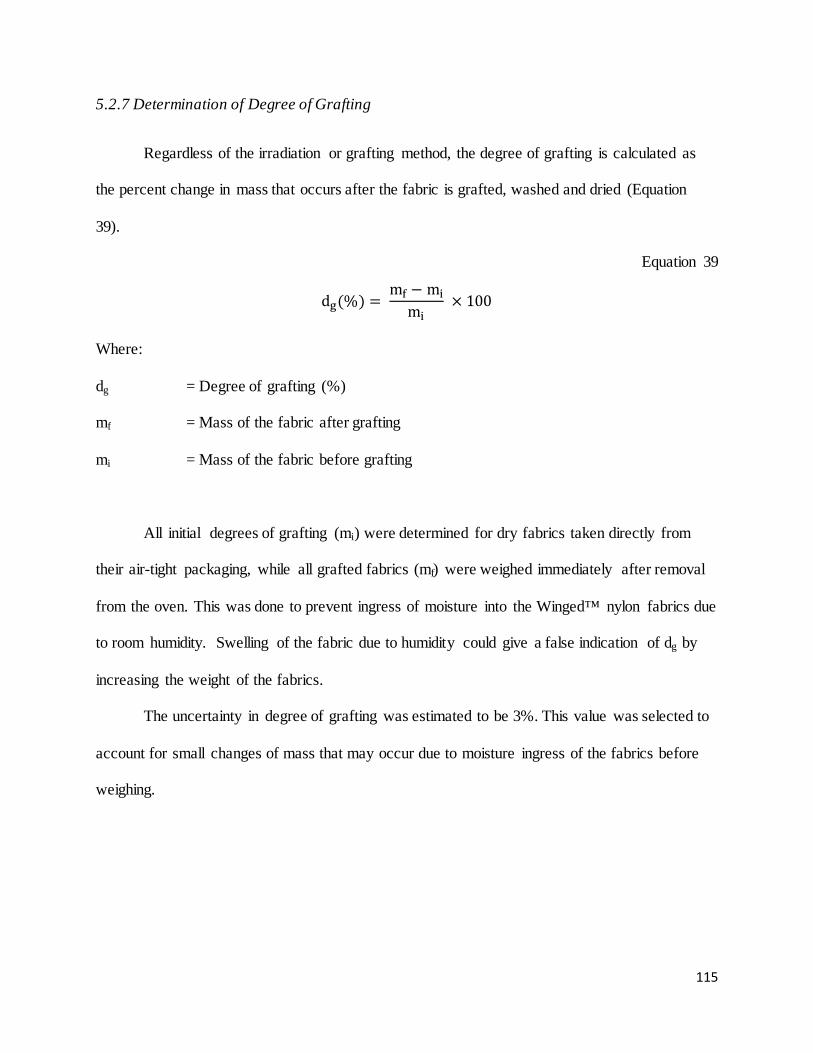
115
5.2.7 Determination of Degree of Grafting
Regardless of the irradiation or grafting method, the degree of grafting is calculated as
the percent change in mass that occurs after the fabric is grafted, washed and dried (Equation
39).
Equation 39
dg(%) = mf − mi
mi × 100
Where:
dg = Degree of grafting (%)
mf = Mass of the fabric after grafting
mi = Mass of the fabric before grafting
All initial degrees of grafting (mi) were determined for dry fabrics taken directly from
their air-tight packaging, while all grafted fabrics (mf) were weighed immediately after removal
from the oven. This was done to prevent ingress of moisture into the Winged™ nylon fabrics due
to room humidity. Swelling of the fabric due to humidity could give a false indication of dg by
increasing the weight of the fabrics.
The uncertainty in degree of grafting was estimated to be 3%. This value was selected to
account for small changes of mass that may occur due to moisture ingress of the fabrics before
weighing.
116
5.3 Sample Optimization
A review of the literature reveals an impressive range of radiation-grafted polymers and
their applications. Dozens of monomer-substrate combinations have been studied in a wide range
of conditions using a variety of techniques, some of which are already exploited commercially
and others of which are based on novel or experimental combinations of materials. Generally, the
purpose of graft-copolymerization is to functionalize a polymeric material, i.e. to give it physical
or chemical properties that it would not otherwise possess.
Regardless of the application, the relationships between the conditions of irradiation and
grafting on the characteristics of the grafted product are routinely reported in the literature.
Optimization of these conditions involves experimentation with variables such as absorbed dose,
dose rate, solvent composition and monomer concentration to obtain the highest-performing
grafted product. The definition of “high-performing” depends upon the application but usually
represents the achievement of an optimal degree of grafting.
Optimization of the grafting and irradiation variables requires an investigation into the
relationships between these conditions and the physical/chemical changes that occur within the
grafting system. Two important considerations must be accounted for - those based on theory
and those based on practice. The theoretical considerations consist of an understanding of the
mechanism by which radiation modifies a monomer-polymer system. From there, the variables
and conditions which may affect the grafting process can be identified and investigated. Practical
considerations include real-world limitations, such as the need to control grafting and irradiation
variables for the sake of minimizing cost, preventing radiation damage to the material and
acquiring degrees of grafting in the desired range based on functionality.
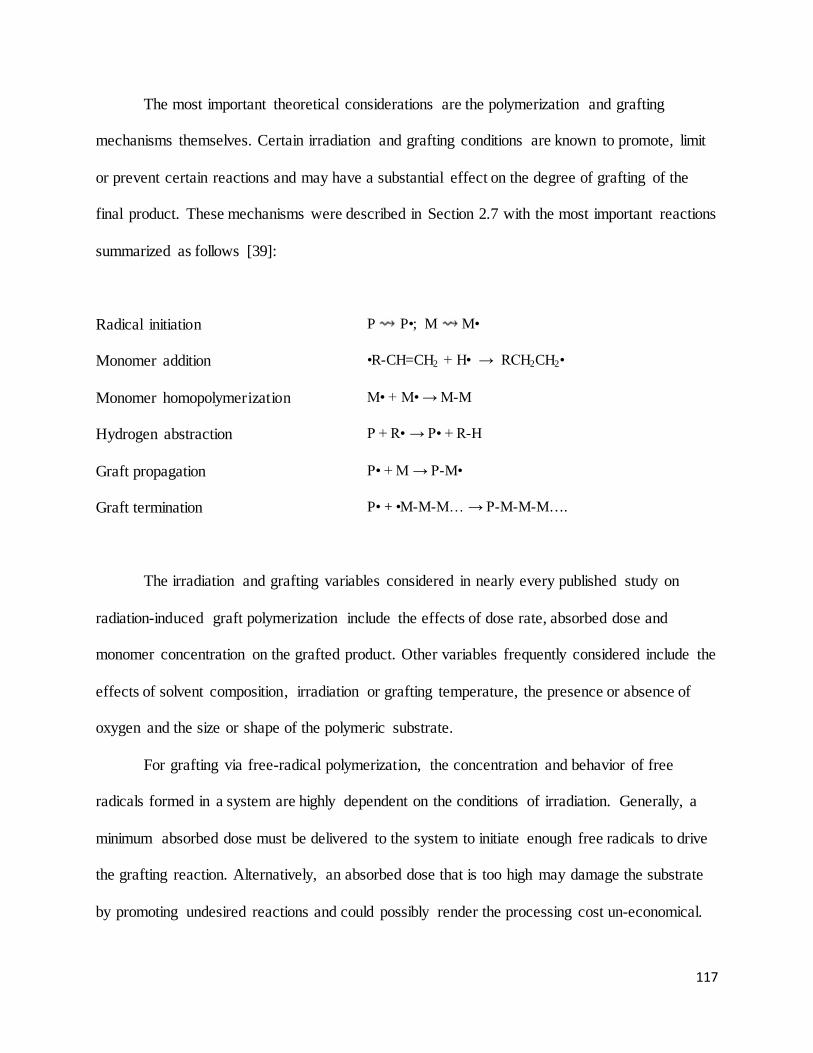
117
The most important theoretical considerations are the polymerization and grafting
mechanisms themselves. Certain irradiation and grafting conditions are known to promote, limit
or prevent certain reactions and may have a substantial effect on the degree of grafting of the
final product. These mechanisms were described in Section 2.7 with the most important reactions
summarized as follows [39]:
Radical initiation P P•; M M•
Monomer addition •R-CH=CH2 + H• → RCH2CH2•
Monomer homopolymerization M• + M• → M-M
Hydrogen abstraction P + R• → P• + R-H
Graft propagation P• + M → P-M•
Graft termination P• + •M-M-M… → P-M-M-M….
The irradiation and grafting variables considered in nearly every published study on
radiation-induced graft polymerization include the effects of dose rate, absorbed dose and
monomer concentration on the grafted product. Other variables frequently considered include the
effects of solvent composition, irradiation or grafting temperature, the presence or absence of
oxygen and the size or shape of the polymeric substrate.
For grafting via free-radical polymerization, the concentration and behavior of free
radicals formed in a system are highly dependent on the conditions of irradiation. Generally, a
minimum absorbed dose must be delivered to the system to initiate enough free radicals to drive
the grafting reaction. Alternatively, an absorbed dose that is too high may damage the substrate
by promoting undesired reactions and could possibly render the processing cost un-economical.
118
Several of the aforementioned mechanisms are strongly dependent on dose rate, with reactions
such as homopolymerization and chain scission generally dominating at high dose rates. For
these reasons, the goal of the optimization of irradiation and grafting variables is to characterize
the relationship between the degree of grafting obtained and the irradiation and grafting
conditions applied in order to produce the highest-performing and most stable product with the
least amount of resources.
5.3.1 Solvent Selection
Many studies have reported that the behavior and yields of grafting reactions depend on
the choice of solvent [52]. The solvent may have many possible roles in the grafting process,
including [220]:
• Diluting the monomer to enhance diffusion to grafting sites
• Swelling the polymeric substrate to enhance bulk diffusion
• Undergoing radiolysis to produce reactive radical species and enhance grafting
• Undergoing chain transfer and termination to hinder grafting
The effects of monomer dilution are discussed in Section 5.3.4, which describes
experiments in which the concentration of monomer was varied and degrees of grafting were
obtained for systems based on water and organic solvent. Swelling of the polymeric substrate is
necessary for applications such as ion-conducting membranes in which grafting should occur
homogenously throughout the thickness of the polymeric substrate [221].
Because the solvent is the largest component (by mass) of the grafting system, the vast
majority of free radical initiated in the system are those produced by solvent molecules. Reactive
species produced in the solvent (such as the hydroxyl radical HO• formed in water) can undergo
119
reactions with both the monomer and the polymeric substrate, transferring a free radical to these
molecules via addition or hydrogen abstraction reactions which result in grafting,
homopolymerization, crosslinking or scission. Solvent initiated radicals can also be detrimental,
however; by producing high rates of homopolymer or by causing chain termination via chain
transfer.
The chain transfer constant of the solvent plays a significant role in determining whether
the solvent enhances or hinders the propagation of grafted chains. The chain transfer reaction (--
M• + X-Y → --M-X+ Y•) involves the termination of a growing chain via radical recombination
between the growing chain and a solvent molecule. A solvent with a high chain transfer rate
constant (ktr/kp) quickly terminates growing chains, which results in decreased levels of grafting.
A solvent featuring a low chain transfer coefficient results in enhancement of chain propagation
and higher levels of grafting [220]. Because the number of free radicals is not reduced in this
reaction, the overall rate of polymerization is not affected. Rather, in this case, the average
molecular weight of the produce is reduced [222].
In the case of free radical polymerization, compounds such as hydrocarbons, acids, ethers
and alcohols have displayed small chain transfer constants [104]. These constants also depend on
the components of the grafting system, often increasing with increasing reactivity of the
propagating radical. Because the chain transfer coefficient of monomer to solvent for B2MP has
not been published, it is unknown how the choice of solvent affects the polymerization of B2MP.
A previous section justified the use of water as solvent (despite its poor solubility) for the
purposes of reducing production cost and minimizing environmental impact. Water-based
polymerization and grafting is performed in either pure water (as an unstable emulsion) or as an
emulsion stabilized with a surfactant [39]. In most cases, the monomer is either insoluble or only
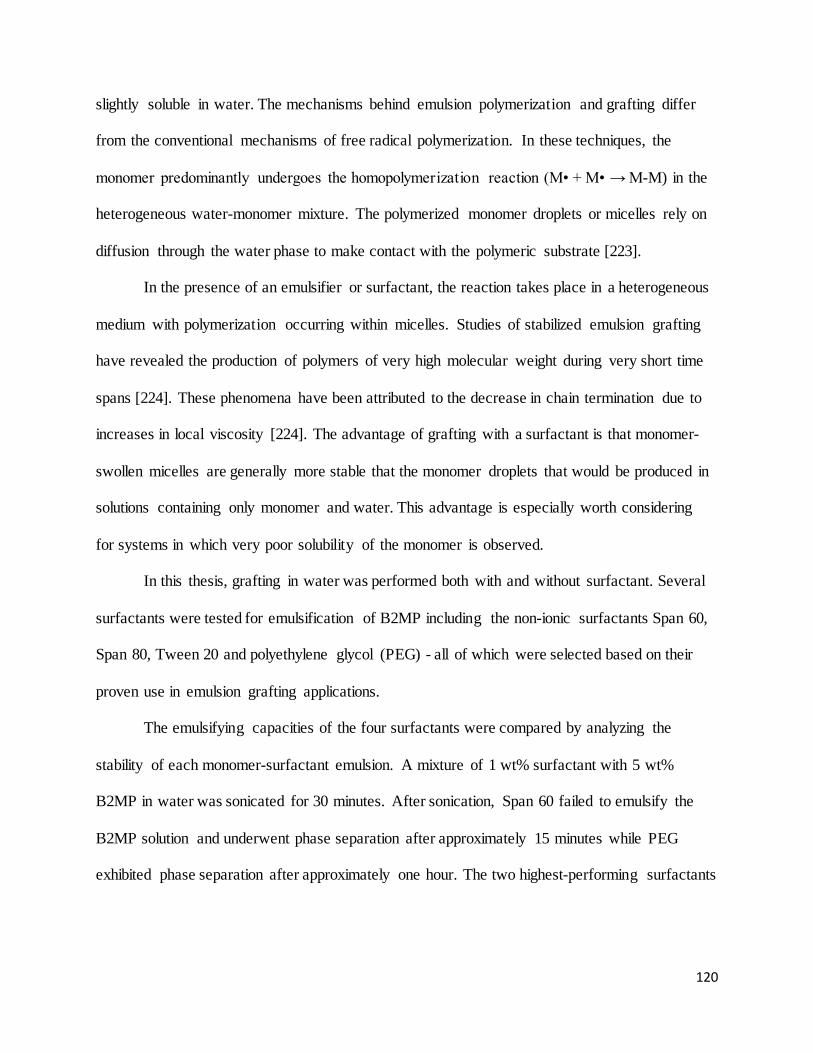
120
slightly soluble in water. The mechanisms behind emulsion polymerization and grafting differ
from the conventional mechanisms of free radical polymerization. In these techniques, the
monomer predominantly undergoes the homopolymerization reaction (M• + M• → M-M) in the
heterogeneous water-monomer mixture. The polymerized monomer droplets or micelles rely on
diffusion through the water phase to make contact with the polymeric substrate [223].
In the presence of an emulsifier or surfactant, the reaction takes place in a heterogeneous
medium with polymerization occurring within micelles. Studies of stabilized emulsion grafting
have revealed the production of polymers of very high molecular weight during very short time
spans [224]. These phenomena have been attributed to the decrease in chain termination due to
increases in local viscosity [224]. The advantage of grafting with a surfactant is that monomer-
swollen micelles are generally more stable that the monomer droplets that would be produced in
solutions containing only monomer and water. This advantage is especially worth considering
for systems in which very poor solubility of the monomer is observed.
In this thesis, grafting in water was performed both with and without surfactant. Several
surfactants were tested for emulsification of B2MP including the non-ionic surfactants Span 60,
Span 80, Tween 20 and polyethylene glycol (PEG) - all of which were selected based on their
proven use in emulsion grafting applications.
The emulsifying capacities of the four surfactants were compared by analyzing the
stability of each monomer-surfactant emulsion. A mixture of 1 wt% surfactant with 5 wt%
B2MP in water was sonicated for 30 minutes. After sonication, Span 60 failed to emulsify the
B2MP solution and underwent phase separation after approximately 15 minutes while PEG
exhibited phase separation after approximately one hour. The two highest-performing surfactants
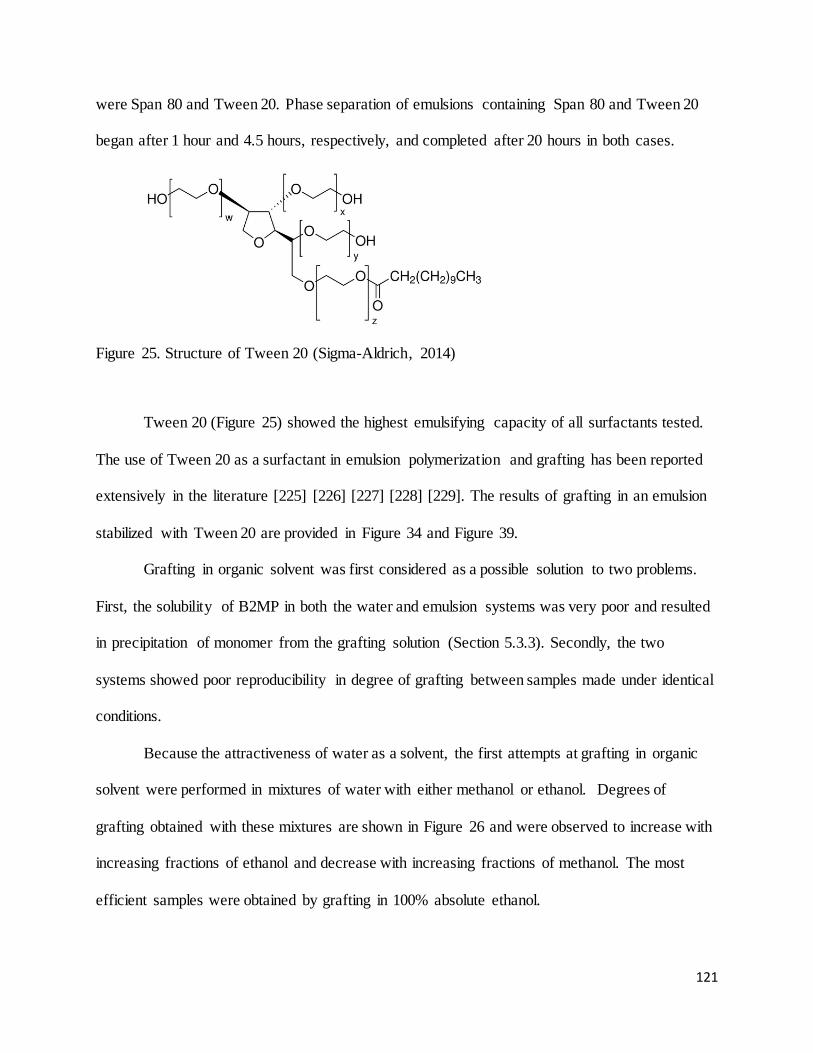
121
were Span 80 and Tween 20. Phase separation of emulsions containing Span 80 and Tween 20
began after 1 hour and 4.5 hours, respectively, and completed after 20 hours in both cases.
Figure 25. Structure of Tween 20 (Sigma-Aldrich, 2014)
Tween 20 (Figure 25) showed the highest emulsifying capacity of all surfactants tested.
The use of Tween 20 as a surfactant in emulsion polymerization and grafting has been reported
extensively in the literature [225] [226] [227] [228] [229]. The results of grafting in an emulsion
stabilized with Tween 20 are provided in Figure 34 and Figure 39.
Grafting in organic solvent was first considered as a possible solution to two problems.
First, the solubility of B2MP in both the water and emulsion systems was very poor and resulted
in precipitation of monomer from the grafting solution (Section 5.3.3). Secondly, the two
systems showed poor reproducibility in degree of grafting between samples made under identical
conditions.
Because the attractiveness of water as a solvent, the first attempts at grafting in organic
solvent were performed in mixtures of water with either methanol or ethanol. Degrees of
grafting obtained with these mixtures are shown in Figure 26 and were observed to increase with
increasing fractions of ethanol and decrease with increasing fractions of methanol. The most
efficient samples were obtained by grafting in 100% absolute ethanol.
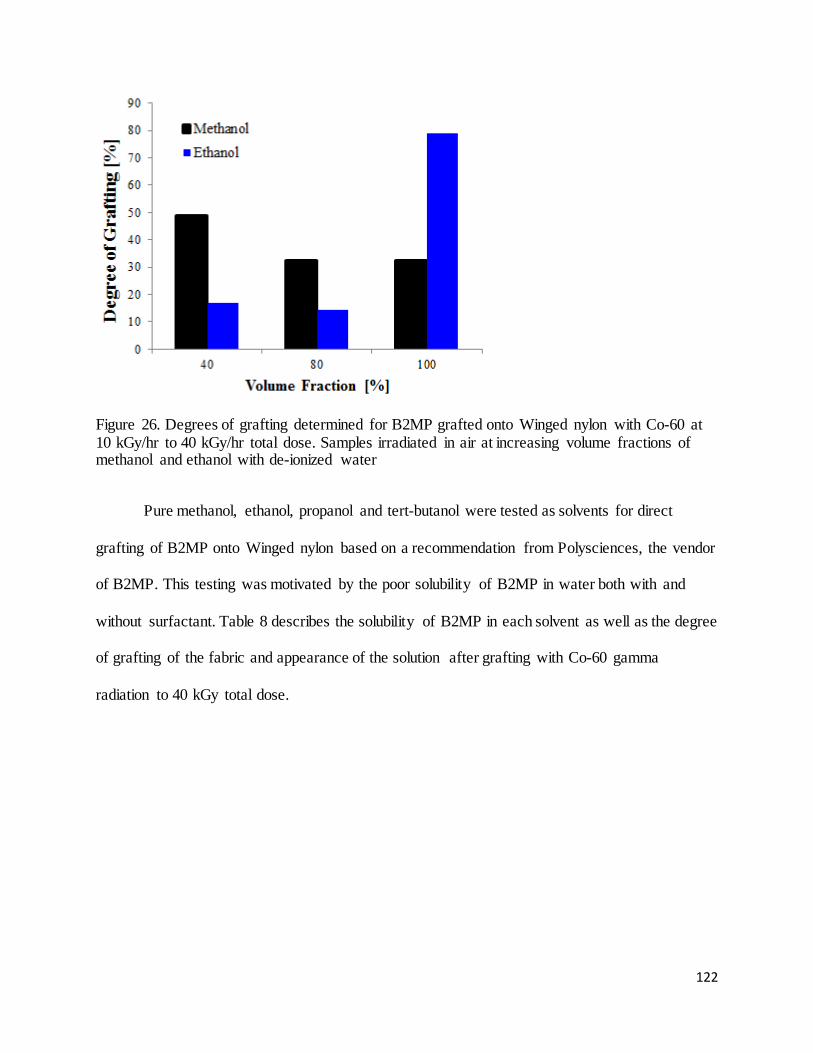
122
Figure 26. Degrees of grafting determined for B2MP grafted onto Winged nylon with Co-60 at 10 kGy/hr to 40 kGy/hr total dose. Samples irradiated in air at increasing volume fractions of methanol and ethanol with de-ionized water
Pure methanol, ethanol, propanol and tert-butanol were tested as solvents for direct
grafting of B2MP onto Winged nylon based on a recommendation from Polysciences, the vendor
of B2MP. This testing was motivated by the poor solubility of B2MP in water both with and
without surfactant. Table 8 describes the solubility of B2MP in each solvent as well as the degree
of grafting of the fabric and appearance of the solution after grafting with Co-60 gamma
radiation to 40 kGy total dose.
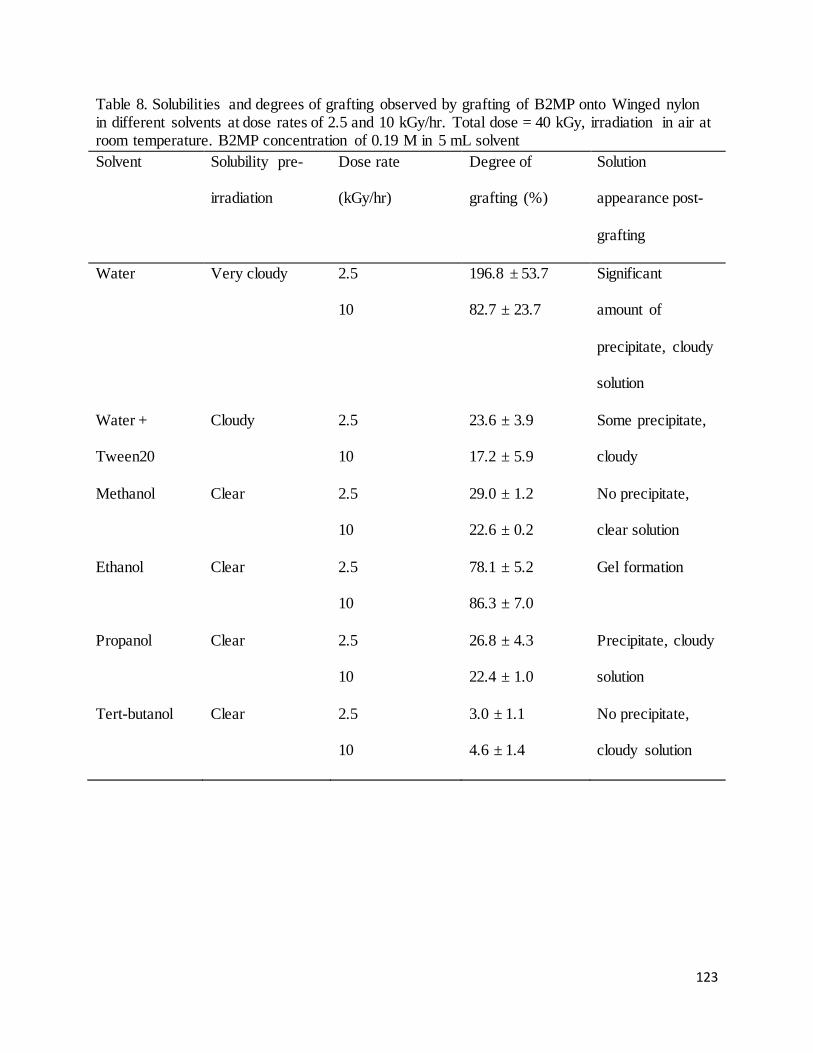
123
Table 8. Solubilities and degrees of grafting observed by grafting of B2MP onto Winged nylon in different solvents at dose rates of 2.5 and 10 kGy/hr. Total dose = 40 kGy, irradiation in air at room temperature. B2MP concentration of 0.19 M in 5 mL solvent Solvent Solubility pre-
irradiation
Dose rate
(kGy/hr)
Degree of
grafting (%)
Solution
appearance post-
grafting
Water Very cloudy 2.5
10
196.8 ± 53.7
82.7 ± 23.7
Significant
amount of
precipitate, cloudy
solution
Water +
Tween20
Cloudy 2.5
10
23.6 ± 3.9
17.2 ± 5.9
Some precipitate,
cloudy
Methanol Clear 2.5
10
29.0 ± 1.2
22.6 ± 0.2
No precipitate,
clear solution
Ethanol Clear 2.5
10
78.1 ± 5.2
86.3 ± 7.0
Gel formation
Propanol Clear 2.5
10
26.8 ± 4.3
22.4 ± 1.0
Precipitate, cloudy
solution
Tert-butanol Clear 2.5
10
3.0 ± 1.1
4.6 ± 1.4
No precipitate,
cloudy solution
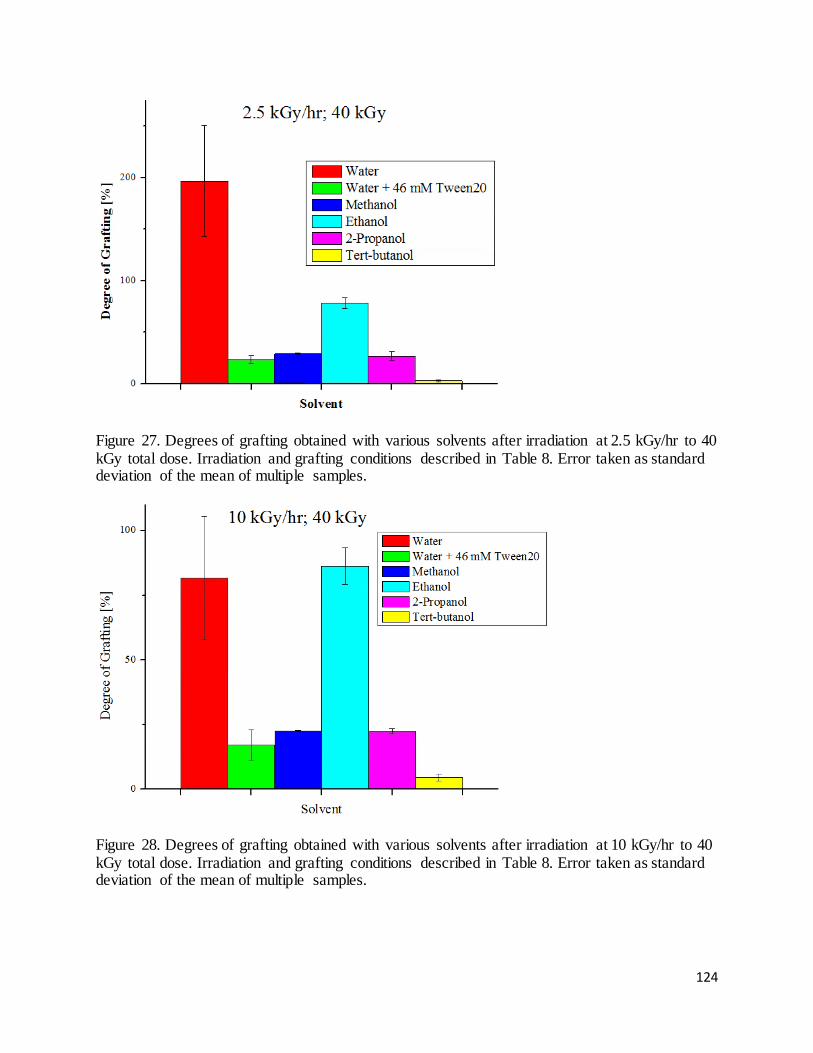
124
Figure 27. Degrees of grafting obtained with various solvents after irradiation at 2.5 kGy/hr to 40 kGy total dose. Irradiation and grafting conditions described in Table 8. Error taken as standard deviation of the mean of multiple samples.
Figure 28. Degrees of grafting obtained with various solvents after irradiation at 10 kGy/hr to 40 kGy total dose. Irradiation and grafting conditions described in Table 8. Error taken as standard deviation of the mean of multiple samples.
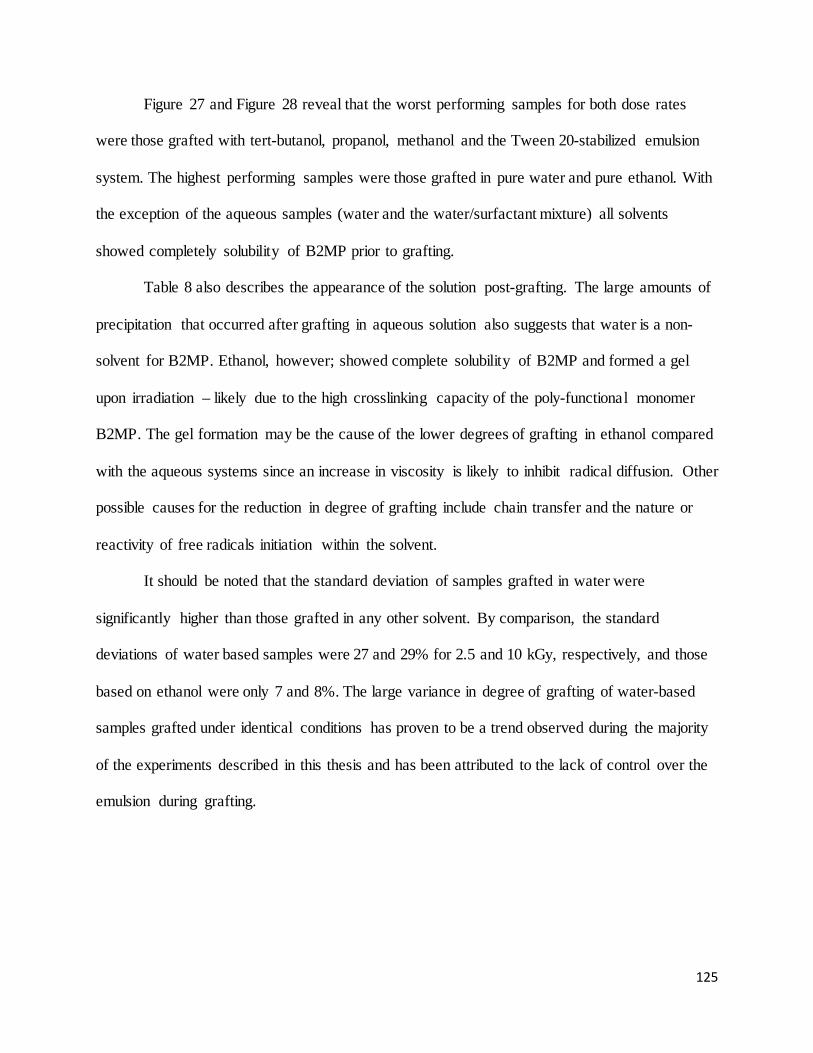
125
Figure 27 and Figure 28 reveal that the worst performing samples for both dose rates
were those grafted with tert-butanol, propanol, methanol and the Tween 20-stabilized emulsion
system. The highest performing samples were those grafted in pure water and pure ethanol. With
the exception of the aqueous samples (water and the water/surfactant mixture) all solvents
showed completely solubility of B2MP prior to grafting.
Table 8 also describes the appearance of the solution post-grafting. The large amounts of
precipitation that occurred after grafting in aqueous solution also suggests that water is a non-
solvent for B2MP. Ethanol, however; showed complete solubility of B2MP and formed a gel
upon irradiation – likely due to the high crosslinking capacity of the poly-functional monomer
B2MP. The gel formation may be the cause of the lower degrees of grafting in ethanol compared
with the aqueous systems since an increase in viscosity is likely to inhibit radical diffusion. Other
possible causes for the reduction in degree of grafting include chain transfer and the nature or
reactivity of free radicals initiation within the solvent.
It should be noted that the standard deviation of samples grafted in water were
significantly higher than those grafted in any other solvent. By comparison, the standard
deviations of water based samples were 27 and 29% for 2.5 and 10 kGy, respectively, and those
based on ethanol were only 7 and 8%. The large variance in degree of grafting of water-based
samples grafted under identical conditions has proven to be a trend observed during the majority
of the experiments described in this thesis and has been attributed to the lack of control over the
emulsion during grafting.
126
5.3.2 Effects of Temperature and Purging Gas The literature suggests that the dependence of grafting efficiency on the temperature of
irradiation is quite complex. While an increase in temperature has been shown to increase the
rate of diffusion of the monomer to the substrate, it has also been demonstrated to increase the
rate of termination reactions [52]. Additionally, a change in temperature may also affect
monomer solubility and radical mobility.
Ideally, the effect of temperature on the radiation-induced grafting of B2MP onto Winged
nylon would be tested by performing irradiations at a range of temperatures. Because electronic
devices cannot be easily used during irradiation, no methods of heating or cooling during
irradiation were applied during the experiments described in this dissertation. Irradiation with
Co-60 gamma produces only negligible temperature rises during irradiation, however; increases
in temperature were observed during electron beam irradiations to very high doses, such as to
irradiate samples for FTIR and Raman analysis (Section 5.5).
It was considered important to determine what, if any, effects of temperature on the
grafting process could have been present. To accomplish this, a set of direct grafting samples
were heated to various temperatures in the absence of radiation to see if grafting could take place
by thermal means. Samples were prepared exactly as they would have been if irradiated. Six
septum-capped vials containing a single Winged nylon fabric (~25 mg), 10 mL of de-ionized
water and ~0.35 g B2MP were placed on a heating plate. Three samples were contacted with the
hot plate for 10 minutes at either room temperature, 75 ˚C or 100 ˚C. An identical set of three
samples was also contacted with the hot plates for 120 minutes at room temperature, 75 ˚C and
100 ˚C. The samples were allowed to rest unopened overnight at room temperature.
127
The experiments performed at room temperature produced no grafting, as did the
experiments at 75 °C. The experiments at 100 ˚C (both 10 minutes and 120 minutes) yielded a
percent change in mass of less than one percent. For these reasons, it can be assumed that
increasing the temperature of the reaction (up to 100 °C) during grafting in the absence of
radiation can be considered to have a negligible effect on the degree of grafting of B2MP onto
Winged nylon. The same conclusion was reported by Choi et al. after attempting to graft vinyl
monomers (acrylic acid) onto nylon-6 using high temperatures in the absence of radiation [230].
Such observations are not meant to imply that temperature-controlled irradiations would not
enhance or decrease the efficiency of grafting, but that the grafting reactions studied were
initiated entirely through radiolytical means. It is suggested to perform temperature-controlled
irradiations as part of future work.
Inert gases such as nitrogen, argon and nitrous oxide (N2O) are often utilized for
polymerization and grafting to prevent or limit oxidation of the polymeric substrate by removing
oxygen from the system. Oxidation of the substrate has two significant consequences. The first
is an alteration of the physical properties of the substrate. The second is the formation of oxygen-
containing groups along the polymer backbone which serve to reduce the number of sites
available for grafting. For polymerization or grafting in water, nitrous oxide also has the added
benefit of increasing the yield of the reactive hydroxyl radical (HO•). Nitrous oxide is believed
to convert aqueous electrons into hydroxyl radicals for aqueous systems undergoing radiolysis
[131] and in the case of an N2O-saturated aqueous solution this reaction is represented by
Equation 40 [231].
Equation 40
N2O + e-aq + H2O→ N2 + OH- + •OH
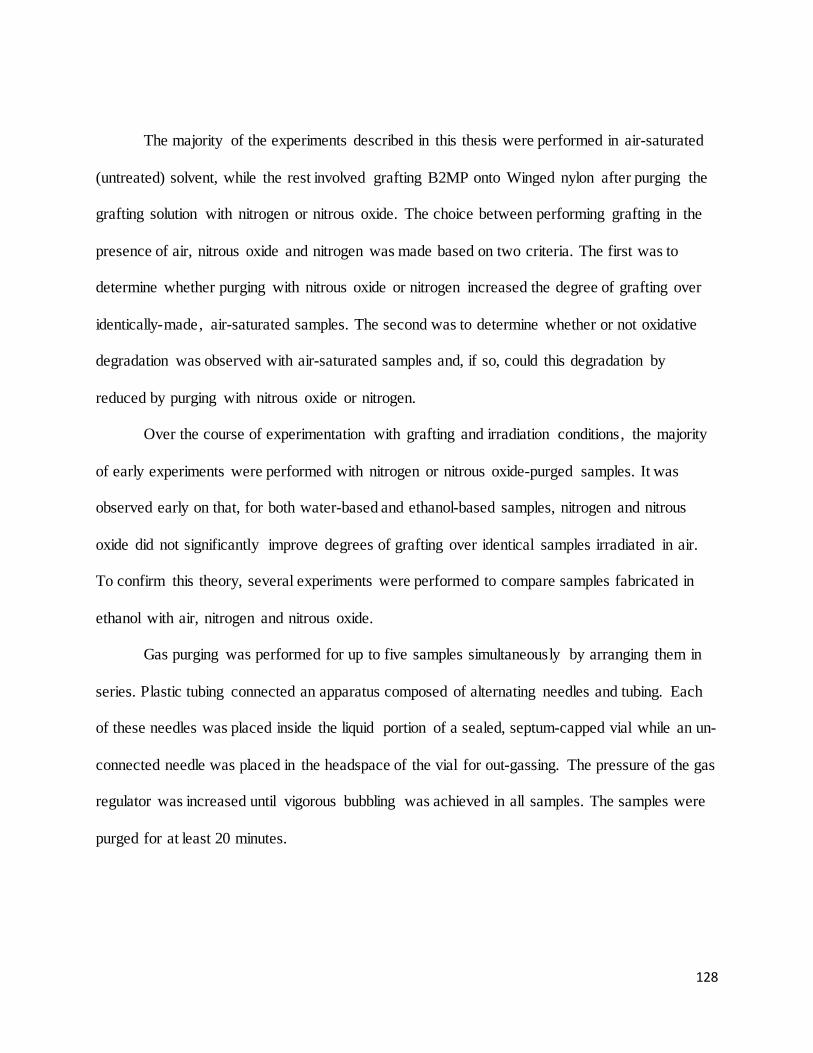
128
The majority of the experiments described in this thesis were performed in air-saturated
(untreated) solvent, while the rest involved grafting B2MP onto Winged nylon after purging the
grafting solution with nitrogen or nitrous oxide. The choice between performing grafting in the
presence of air, nitrous oxide and nitrogen was made based on two criteria. The first was to
determine whether purging with nitrous oxide or nitrogen increased the degree of grafting over
identically-made, air-saturated samples. The second was to determine whether or not oxidative
degradation was observed with air-saturated samples and, if so, could this degradation by
reduced by purging with nitrous oxide or nitrogen.
Over the course of experimentation with grafting and irradiation conditions, the majority
of early experiments were performed with nitrogen or nitrous oxide-purged samples. It was
observed early on that, for both water-based and ethanol-based samples, nitrogen and nitrous
oxide did not significantly improve degrees of grafting over identical samples irradiated in air.
To confirm this theory, several experiments were performed to compare samples fabricated in
ethanol with air, nitrogen and nitrous oxide.
Gas purging was performed for up to five samples simultaneously by arranging them in
series. Plastic tubing connected an apparatus composed of alternating needles and tubing. Each
of these needles was placed inside the liquid portion of a sealed, septum-capped vial while an un-
connected needle was placed in the headspace of the vial for out-gassing. The pressure of the gas
regulator was increased until vigorous bubbling was achieved in all samples. The samples were
purged for at least 20 minutes.
129
Figure 29. Comparison of degrees of grafting obtain by grafting B2MP onto Winged nylon in nitrogen-purged and air-saturated ethanol to 5, 10, 30 and 40 kGy. Dose rate: 10 kGy/hr (Co-60). [B2MP] = 0.073 M, n=16.
Figure 29 compares two identical sets of adsorbents grafted in ethanol. The grafted
fabrics in the top set were irradiated after purging the vial with nitrogen gas and those in the
bottom set were irradiated without purging (air-saturated). At 5 and 10 kGy, the degrees of
grafting for nitrogen-purged samples were 14.5 and 11.3 % higher, respectively, than those for
air-saturated samples. Degrees of grafting obtained for nitrogen-purged ethanol were lower (-
17.7%) and higher (16.0%) than air-saturated samples for those grafted to 30 and 40kGy.
Although the nitrogen-purged samples were an average of 6.0% higher than those in air, the
advantages of these observed increases are unlikely to outweigh the disadvantages of the added
costs and time that are required to purge the samples with N2.
The second criterion for optimizing the choice of purging gas was to determine if such
gases prevented or limited oxidative degradation of the polymeric substrate. Oxidation can easily
130
be observed by comparing un-irradiated and irradiated Winged nylon samples with FTIR or
Raman spectroscopy. The results of FTIR and Raman analysis under such conditions are
described in Section 5.5. Although no oxidation of the polymer substrate was observed after
irradiation in air-saturated water to 2, 30 and 164 kGy with electron beam, the occurrence of any
oxidation upon irradiation with Co-60 is not known and its significance is discussed in Section
5.5.
The similarities in degrees of grafting produced with air-saturated and de-aerated grafting
solutions are likely due to the consumption of dissolved oxygen due to radiolysis. Irradiation of a
closed system (with both electron beam and Co-60) results in the consumption of dissolved
oxygen through radiolysis after a dose of only 0.6 kGy for water [232] and 0.38 kGy for ethanol
[233]. For this reason, it can be assumed that the oxygen present in air-saturated solutions would
be consumed within the first few minutes of irradiation and would not further affect the grafting
process. For this reason, along with the only minor improvements in degree of grafting observed
after purging with nitrogen, the grafted fabrics described in this and all future chapters were
produced by irradiating in air-saturated solution.
131
5.3.3 Mechanism of Homopolymer Formation
The formation of homopolymer is one of the most widely-reported challenges in the
radiation grafting and occurs when monomer molecules polymerize without interaction with the
substrate. Homopolymer is generally considered to be undesirable for most grafting applications
due to the reduction in the overall amount of monomer available for grafting and the need for
solvent extraction to remove the unbound homopolymer. Significant discussion regarding the
effects of homopolymerization and strategies for mitigating these affects are described by
Stannett [234], Hou et al. [235], Dworjanyn et al. [113] and Huglin et al. [236].
The formation of homopolymer via free radical polymerization can be described with the
following mechanisms [220]:
M → M• (direct initiation)
M• + M → M-M• (homopolymer chain growth)
M• + •M → M-M (homopolymer termination)
The grafting reaction (P• +M → P-M•) is favored when the sensitivity of the polymeric
substrate to radiation is greater than the sensitivity of the monomer to radiation (G(R)polymer >
G(R)monomer). In the case of G(R)monomer > G(R)polymer, monomer molecules tend to react through
homopolymer formation as opposed to grafting [220]. Another factor that influences the amount
of homopolymer is the choice of solvent. Because the solvent is intermixed with the monomer,
solvents that produce a high concentration of reactive radicals through radiolysis may increase
the rate of homopolymerization [52].
Homopolymer was observed in this work for all solvents when grafting B2MP onto
Winged nylon. The largest amount of homopolymer was observed for samples grafted in water
and in water stabilized with Tween20. These systems required more than twice the solvent and
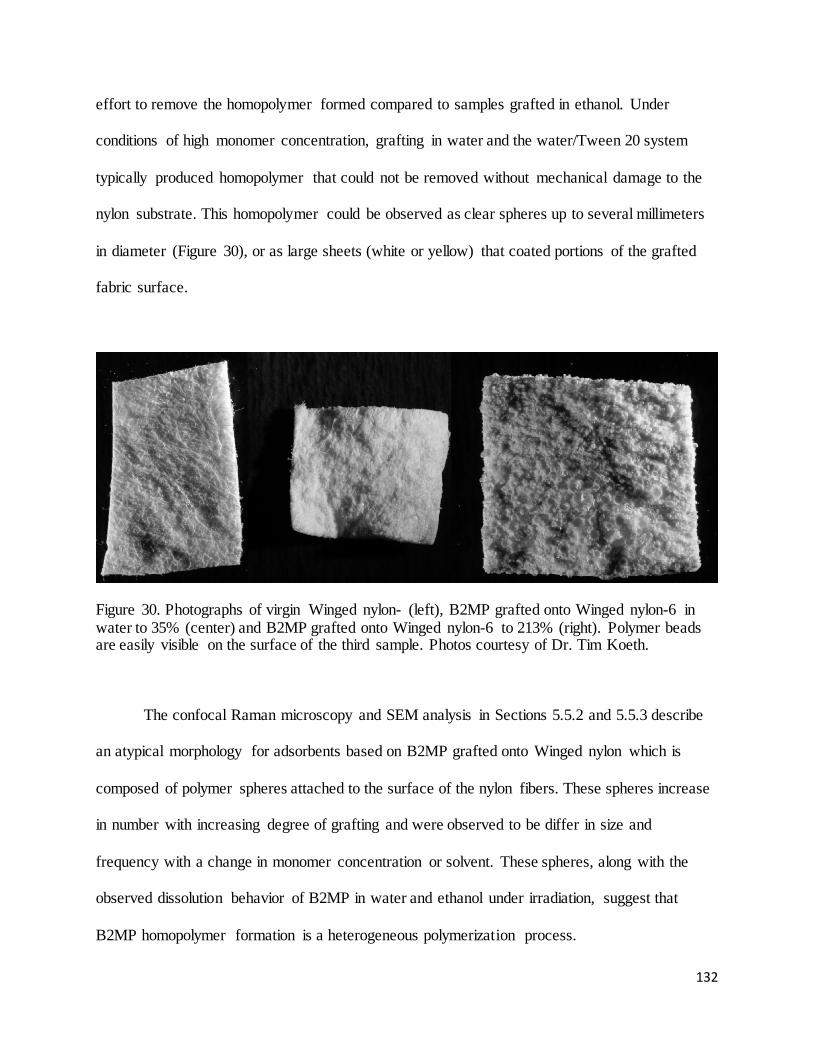
132
effort to remove the homopolymer formed compared to samples grafted in ethanol. Under
conditions of high monomer concentration, grafting in water and the water/Tween 20 system
typically produced homopolymer that could not be removed without mechanical damage to the
nylon substrate. This homopolymer could be observed as clear spheres up to several millimeters
in diameter (Figure 30), or as large sheets (white or yellow) that coated portions of the grafted
fabric surface.
Figure 30. Photographs of virgin Winged nylon- (left), B2MP grafted onto Winged nylon-6 in water to 35% (center) and B2MP grafted onto Winged nylon-6 to 213% (right). Polymer beads are easily visible on the surface of the third sample. Photos courtesy of Dr. Tim Koeth.
The confocal Raman microscopy and SEM analysis in Sections 5.5.2 and 5.5.3 describe
an atypical morphology for adsorbents based on B2MP grafted onto Winged nylon which is
composed of polymer spheres attached to the surface of the nylon fibers. These spheres increase
in number with increasing degree of grafting and were observed to be differ in size and
frequency with a change in monomer concentration or solvent. These spheres, along with the
observed dissolution behavior of B2MP in water and ethanol under irradiation, suggest that
B2MP homopolymer formation is a heterogeneous polymerization process.
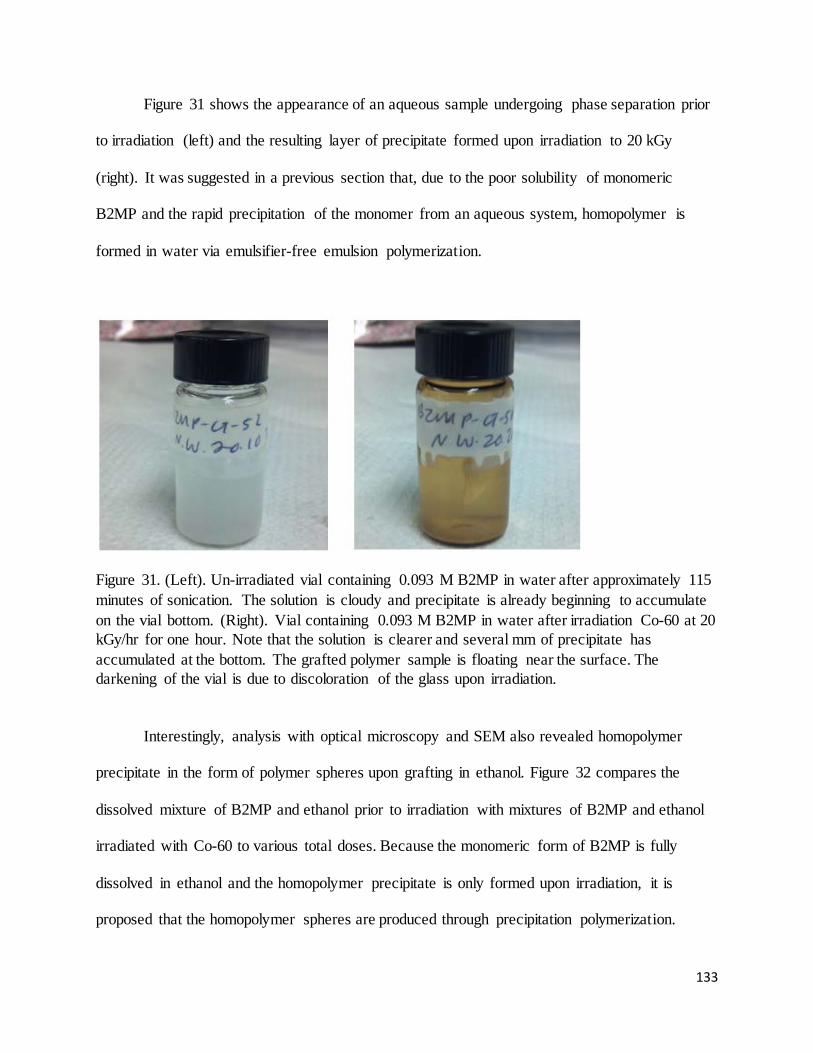
133
Figure 31 shows the appearance of an aqueous sample undergoing phase separation prior
to irradiation (left) and the resulting layer of precipitate formed upon irradiation to 20 kGy
(right). It was suggested in a previous section that, due to the poor solubility of monomeric
B2MP and the rapid precipitation of the monomer from an aqueous system, homopolymer is
formed in water via emulsifier-free emulsion polymerization.
Figure 31. (Left). Un-irradiated vial containing 0.093 M B2MP in water after approximately 115 minutes of sonication. The solution is cloudy and precipitate is already beginning to accumulate on the vial bottom. (Right). Vial containing 0.093 M B2MP in water after irradiation Co-60 at 20 kGy/hr for one hour. Note that the solution is clearer and several mm of precipitate has accumulated at the bottom. The grafted polymer sample is floating near the surface. The darkening of the vial is due to discoloration of the glass upon irradiation.
Interestingly, analysis with optical microscopy and SEM also revealed homopolymer
precipitate in the form of polymer spheres upon grafting in ethanol. Figure 32 compares the
dissolved mixture of B2MP and ethanol prior to irradiation with mixtures of B2MP and ethanol
irradiated with Co-60 to various total doses. Because the monomeric form of B2MP is fully
dissolved in ethanol and the homopolymer precipitate is only formed upon irradiation, it is
proposed that the homopolymer spheres are produced through precipitation polymerization.
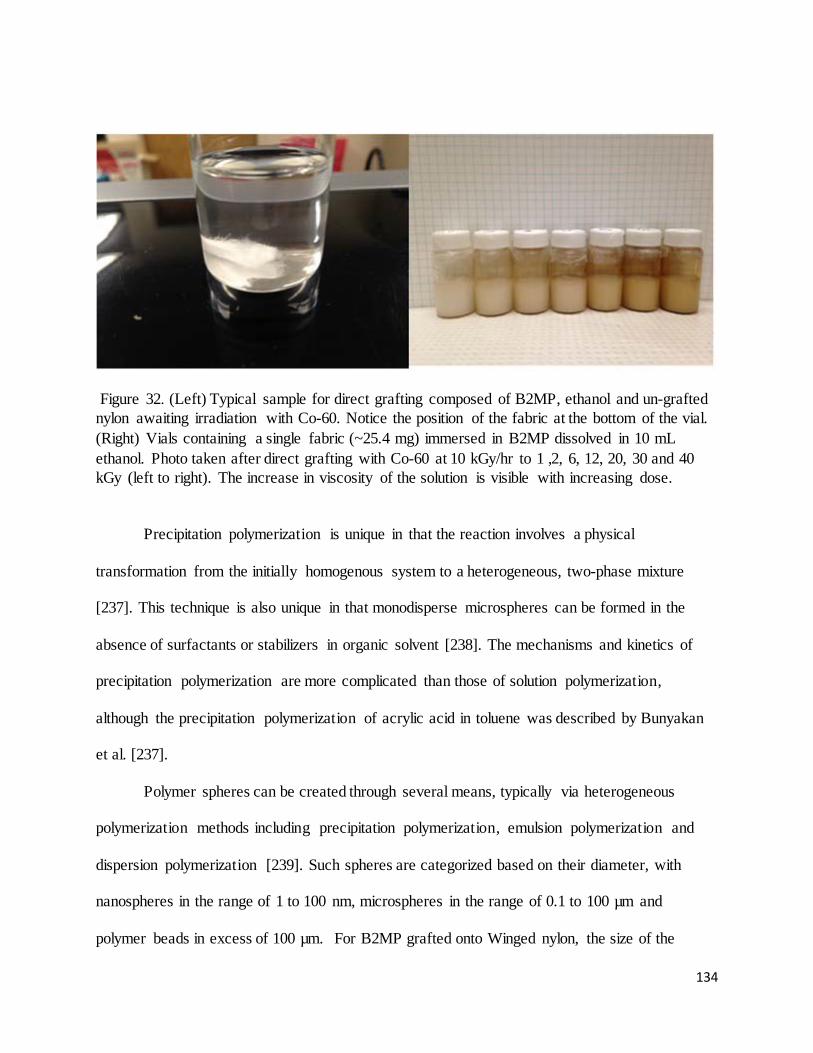
134
Figure 32. (Left) Typical sample for direct grafting composed of B2MP, ethanol and un-grafted nylon awaiting irradiation with Co-60. Notice the position of the fabric at the bottom of the vial. (Right) Vials containing a single fabric (~25.4 mg) immersed in B2MP dissolved in 10 mL ethanol. Photo taken after direct grafting with Co-60 at 10 kGy/hr to 1 ,2, 6, 12, 20, 30 and 40 kGy (left to right). The increase in viscosity of the solution is visible with increasing dose.
Precipitation polymerization is unique in that the reaction involves a physical
transformation from the initially homogenous system to a heterogeneous, two-phase mixture
[237]. This technique is also unique in that monodisperse microspheres can be formed in the
absence of surfactants or stabilizers in organic solvent [238]. The mechanisms and kinetics of
precipitation polymerization are more complicated than those of solution polymerization,
although the precipitation polymerization of acrylic acid in toluene was described by Bunyakan
et al. [237].
Polymer spheres can be created through several means, typically via heterogeneous
polymerization methods including precipitation polymerization, emulsion polymerization and
dispersion polymerization [239]. Such spheres are categorized based on their diameter, with
nanospheres in the range of 1 to 100 nm, microspheres in the range of 0.1 to 100 µm and
polymer beads in excess of 100 µm. For B2MP grafted onto Winged nylon, the size of the
135
polymer particles was observed to be dependent upon solvent and monomer concentration but
was not characterized apart from SEM and optical microscopy. Figure 60, Figure 61, Figure 62
and Figure 63, representing adsorbents grafted in ethanol, show only polymer microspheres.
Figure 58 and Figure 59 show significantly more variation in particle size for adsorbents when
grafted in water. For both solvents, adsorbents grafted at high monomer concentration display
hardened polymer beads visible to the naked eye on the fabric surface.
It is unknown whether or not the polyfunctional structure of the monomer B2MP plays a
role in the grafting of B2MP onto Winged nylon. On one hand, the formation of aggregated
polymer microspheres was observed by Wentrup-Byrne et al. using methacryloxyethyl
phosphate, an acrylate monomer containing only a single reactive group. On the other hand,
polyfunctional crosslinking monomers such as B2MP are known to produce such microspheres
during both emulsion [240] and precipitation polymerization [241] [242]. A high level of
crosslinking within individual particles is considered a “self-stabilizing” mechanism, producing
stable and resilient particle spheres via precipitation polymerization in the absence of surfactants
or stabilizers [243].
Further, it is likely (although not investigated experimentally) that the high crosslinking
capacity of B2MP plays a role in forming the homopolymer microspheres, grafting the
homopolymer microspheres to the substrate or forming grafted layers of microspheres. Naka and
Yamamoto concluded that crosslinking is responsible for the formation of microspheres using
poly-functional vinyl monomers, particularly diethylene glycol dimethacrylate [244]. The same
authors also attributes the aggregation of microspheres to polymerization in aqueous solution in
the absence of surfactant or in organic solvent in the absence of stabilizer [245]. This study
remarks that aggregation (phase separation) of the microspheres, formed by crosslinking of
136
diethylene glycol dimethacrylate, is prevalent in poor solvent and that microsphere formation is
hindered in alcohols due to chain transfer and subsequent viscosity increases due to gelation
[244]. In another study by Naka et al., it was concluded that initiation with radiation was
advantageous in producing monodisperse microspheres since initiation is homogeneous and the
reaction can be carried out without stirring [246].
Although aggregated and coagulation of microspheres have been widely reported with
both emulsion and precipitation polymerization, these behaviors are generally unwanted and
intentional aggregation of crosslinked microspheres on a polymer surface has not been discussed
in the literature. Further, the precipitation of homopolymer on the surface of a polymeric
substrate during grafting has been reported repeatedly in the literature, but this behavior is again
undesired due to the decreases in degree of grafting that is typically observed. This poses two
important questions: what are the mechanisms responsible for bonding the B2MP homopolymer
microspheres to the nylon fabric, and why is this behavior advantageous in this system and
detrimental in others?
In the event that such a phenomenon (although unlikely) has not yet been described in
other studies, understanding the mechanisms of the graft co-polymerization between a polymer
fabric and crosslinked homopolymer microspheres formed through radiation-induced
polymerization may be a worthwhile undertaking. In the absence of the nylon substrate, the
B2MP microspheres could be studied by determining the molecular weight distribution and
polydispersity of microspheres synthesized under conditions of different solvent, monomer
concentration, dose rate, total dose and temperature. Depending on the molecular weight of the
constituent polymer in the microspheres, such analysis could be performed using gel permeation
137
chromatography or light scattering. The diameter and surface morphology of the microspheres
could easily be investigated with SEM or TEM.
Although the exact mechanisms behind the grafted homopolymer microspheres are not
known, several conclusions can still be made. For one, the microspheres are firmly attached to
the nylon fabric and could not be removed through extraction with water, lower alcohols or
through prolonged contact with seawater. Although quantitative analysis was not performed, for
adsorbents grafted in ethanol, an increase in degree of grafting was observed to correspond to an
increase in the number of B2MP microspheres on the surface of the fabric.
The case of precipitating homopolymer in both water and ethanol means that a fraction of
the B2MP reaching the substrate is already homopolymer, making grafted chain growth via
individual monomer molecules less probable. Rather, high degrees of grafting in such a system
indicate that a) B2MP is able to homopolymerize to high molecular weights while retaining
active sites and b) the B2MP homopolymer is likely participating in the grafting reaction. The
experiments described in this chapter, as well as the SEM images provided in Section 5.5.3,
seem to agree that homopolymer is indeed bonding to the polymeric substrate, whether this
reaction is desired or not.
Table 9 summarizes the physical appearance of adsorbents grafted to various degrees of
grafting. Although exceptions in appearance were observed for individual samples, this general
trend was observed regardless of the solvent and radiation source used to produce the adsorbents.
Table 9. Physical appearance of adsorbents of various degrees of grafting.
Degree of Grafting (%)
(approximate) Physical appearance
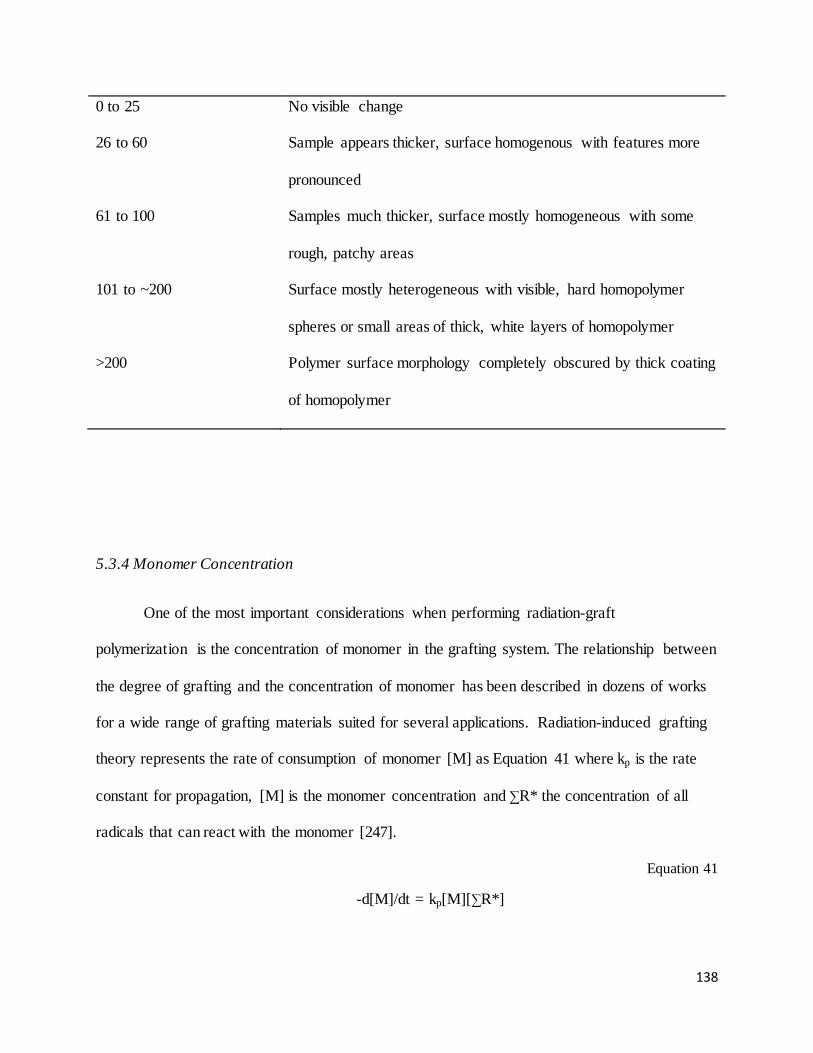
138
0 to 25 No visible change
26 to 60 Sample appears thicker, surface homogenous with features more
pronounced
61 to 100 Samples much thicker, surface mostly homogeneous with some
rough, patchy areas
101 to ~200 Surface mostly heterogeneous with visible, hard homopolymer
spheres or small areas of thick, white layers of homopolymer
>200 Polymer surface morphology completely obscured by thick coating
of homopolymer
5.3.4 Monomer Concentration
One of the most important considerations when performing radiation-graft
polymerization is the concentration of monomer in the grafting system. The relationship between
the degree of grafting and the concentration of monomer has been described in dozens of works
for a wide range of grafting materials suited for several applications. Radiation-induced grafting
theory represents the rate of consumption of monomer [M] as Equation 41 where kp is the rate
constant for propagation, [M] is the monomer concentration and ∑R* the concentration of all
radicals that can react with the monomer [247].
Equation 41 -d[M]/dt = kp[M][∑R*]
139
According to the equation, the monomer consumption (and hence, degree of grafting)
should increase with increasing monomer concentration for a fixed concentration of free radicals
(i.e. fixed irradiation conditions). Most studies report an initial increase in degree of grafting
with monomer concentration, followed by a sharp decrease in degree of grafting at higher
monomer concentrations. The initial increase has been observed for both the direct and indirect
grafting methods, is not characteristic of any one function or trend and is indicative of an
enhancement of diffusion of the monomer to the grafting sites with increasing monomer
concentration [248]. The subsequent decrease in degree of grafting has been attributed to an
increase in the rate of homopolymer formation at high monomer concentration [249].
In systems experiencing high rates of homopolymerization, either due to high dose rates
or excessive monomer concentration, the grafting reaction may be inhibited if an increase in
viscosity hinders the diffusion of monomer to the polymeric substrate. In this case, a plot of
degree of grafting as a function of monomer concentration would reveal a peak and subsequent
decrease in degree of grafting after a certain monomer concentration [248].
Experimental Results
The relationship between degree of grafting and monomer concentration for fixed
irradiation conditions was studied for adsorbents grafted in water, water stabilized with Tween
20 and ethanol. All three systems were tested under the same irradiation conditions, with
irradiations performed via the direct grafting method using Co-60 gamma radiation to a total
dose of 40 kGy. No inert gas purging was performed on any sample described in this section.
At B2MP concentrations below than 0.15 M, the monomer was fully dissolved in de-
ionized water (Figure 33) prior to irradiation. At higher concentrations, the un-irradiated
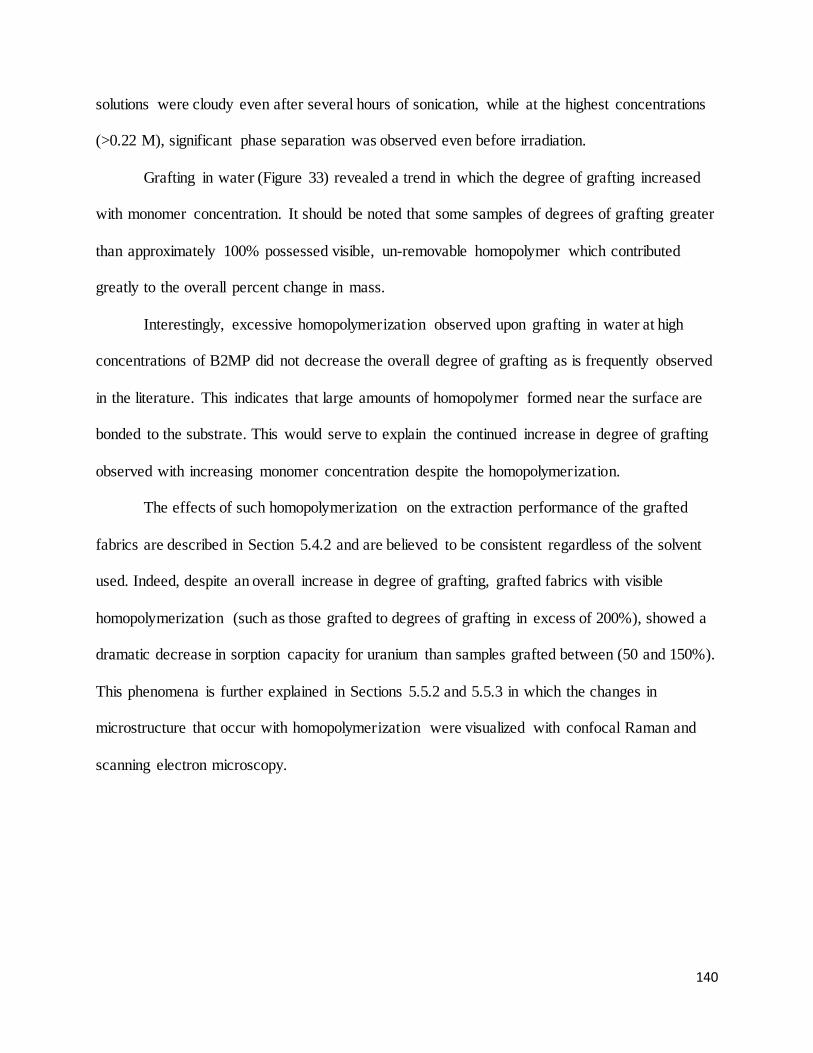
140
solutions were cloudy even after several hours of sonication, while at the highest concentrations
(>0.22 M), significant phase separation was observed even before irradiation.
Grafting in water (Figure 33) revealed a trend in which the degree of grafting increased
with monomer concentration. It should be noted that some samples of degrees of grafting greater
than approximately 100% possessed visible, un-removable homopolymer which contributed
greatly to the overall percent change in mass.
Interestingly, excessive homopolymerization observed upon grafting in water at high
concentrations of B2MP did not decrease the overall degree of grafting as is frequently observed
in the literature. This indicates that large amounts of homopolymer formed near the surface are
bonded to the substrate. This would serve to explain the continued increase in degree of grafting
observed with increasing monomer concentration despite the homopolymerization.
The effects of such homopolymerization on the extraction performance of the grafted
fabrics are described in Section 5.4.2 and are believed to be consistent regardless of the solvent
used. Indeed, despite an overall increase in degree of grafting, grafted fabrics with visible
homopolymerization (such as those grafted to degrees of grafting in excess of 200%), showed a
dramatic decrease in sorption capacity for uranium than samples grafted between (50 and 150%).
This phenomena is further explained in Sections 5.5.2 and 5.5.3 in which the changes in
microstructure that occur with homopolymerization were visualized with confocal Raman and
scanning electron microscopy.
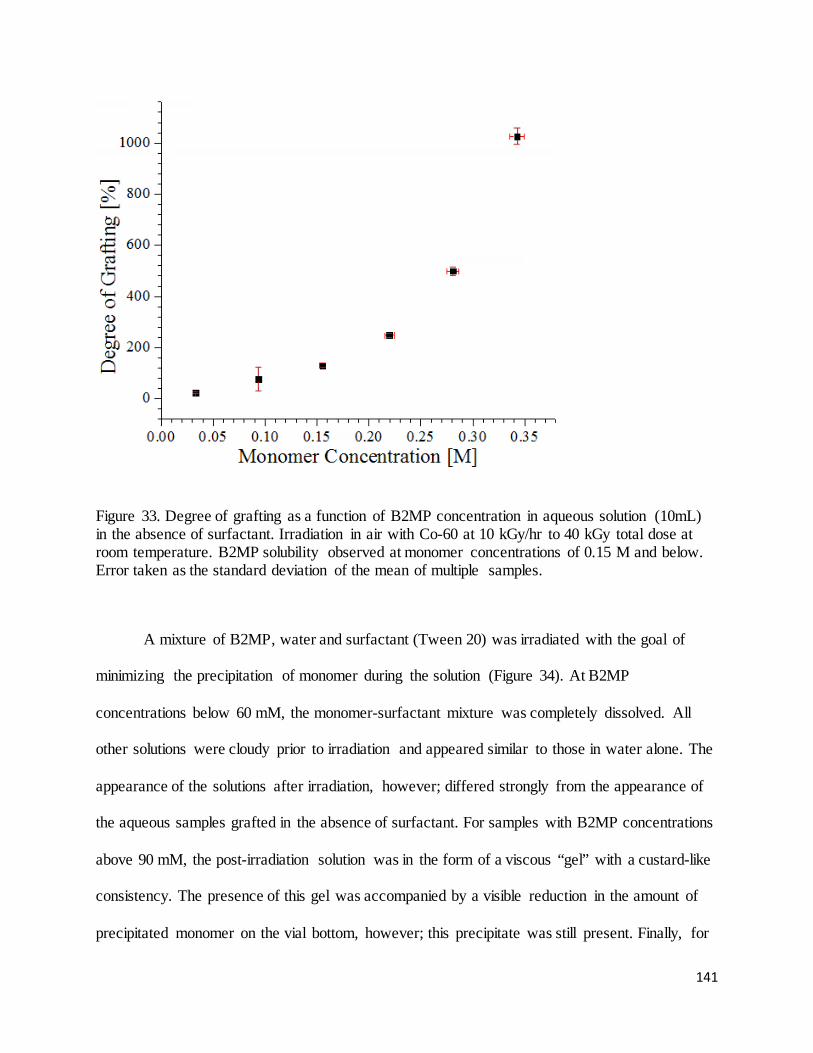
141
Figure 33. Degree of grafting as a function of B2MP concentration in aqueous solution (10mL) in the absence of surfactant. Irradiation in air with Co-60 at 10 kGy/hr to 40 kGy total dose at room temperature. B2MP solubility observed at monomer concentrations of 0.15 M and below. Error taken as the standard deviation of the mean of multiple samples.
A mixture of B2MP, water and surfactant (Tween 20) was irradiated with the goal of
minimizing the precipitation of monomer during the solution (Figure 34). At B2MP
concentrations below 60 mM, the monomer-surfactant mixture was completely dissolved. All
other solutions were cloudy prior to irradiation and appeared similar to those in water alone. The
appearance of the solutions after irradiation, however; differed strongly from the appearance of
the aqueous samples grafted in the absence of surfactant. For samples with B2MP concentrations
above 90 mM, the post-irradiation solution was in the form of a viscous “gel” with a custard-like
consistency. The presence of this gel was accompanied by a visible reduction in the amount of
precipitated monomer on the vial bottom, however; this precipitate was still present. Finally, for
142
the same range of monomer concentration, the degrees of grafting obtained with the
water/Tween 20 system was significantly less than those of water alone.
Figure 34. Degree of grafting as a function of B2MP concentration in aqueous solution with 702.9 ± 3.8 mg of Tween 20. Data labels indicate the mass ratio of B2MP to Tween 20. Irradiation in air with Co-60 at 10 kGy/hr, 40 kGy total dose at room temperature. 10-mL solution volume. Error taken as the standard deviation of the mean of multiple samples
The dependence of degree of grafting on the concentration of B2MP was also determined
for samples grafted with ethanol, the organic solvent with the highest observed degrees of
grafting. Ethanol showed greater solubility of B2MP than with water or with water stabilized
with Tween 20. The entire range of B2MP concentrations tested showed complete solubility in
143
ethanol prior to irradiation, while the post-irradiation consistency was that of a gel which was
easily separated from the grafted fabric through successive washes with fresh ethanol.
Figure 35 shows the relationship between degree of grafting of B2MP irradiated in
ethanol using Co-60 at 10 kGy/hr to a total dose of 40 kGy. Unlike grafting with water and the
water/surfactant system, the degrees of grafting exhibited a linear response to an increase in the
concentration of monomer. The viscosity of the gel produced upon irradiation was observed to
increase at higher monomer concentrations but was not further characterized apart from visual
observation. Removal of residual homopolymer from the samples grafted in ethanol was much
less laborious than with water or the water/Tween 20 mixture.
Section 5.4.2 describes the range of degrees of grafting which result in the most effective
uranium extraction. To produce adsorbents within this range of degrees of grafting in an accurate
and reproducible manner, grafting in ethanol would be more advantageous due to the linear
response between degree of grafting and monomer concentration as well as the lower observed
standard deviations.
The linear response of degree of grafting to increasing monomer concentrations in
ethanol is likely due an increase in diffusion of monomer to the polymeric substrate that is
directly proportional to monomer concentration. This assumption is further confirmed by the
lack of visible precipitate at the bottom of the vial after irradiation and the reduction in surface-
bound homopolymerization when compared to grafting in water.
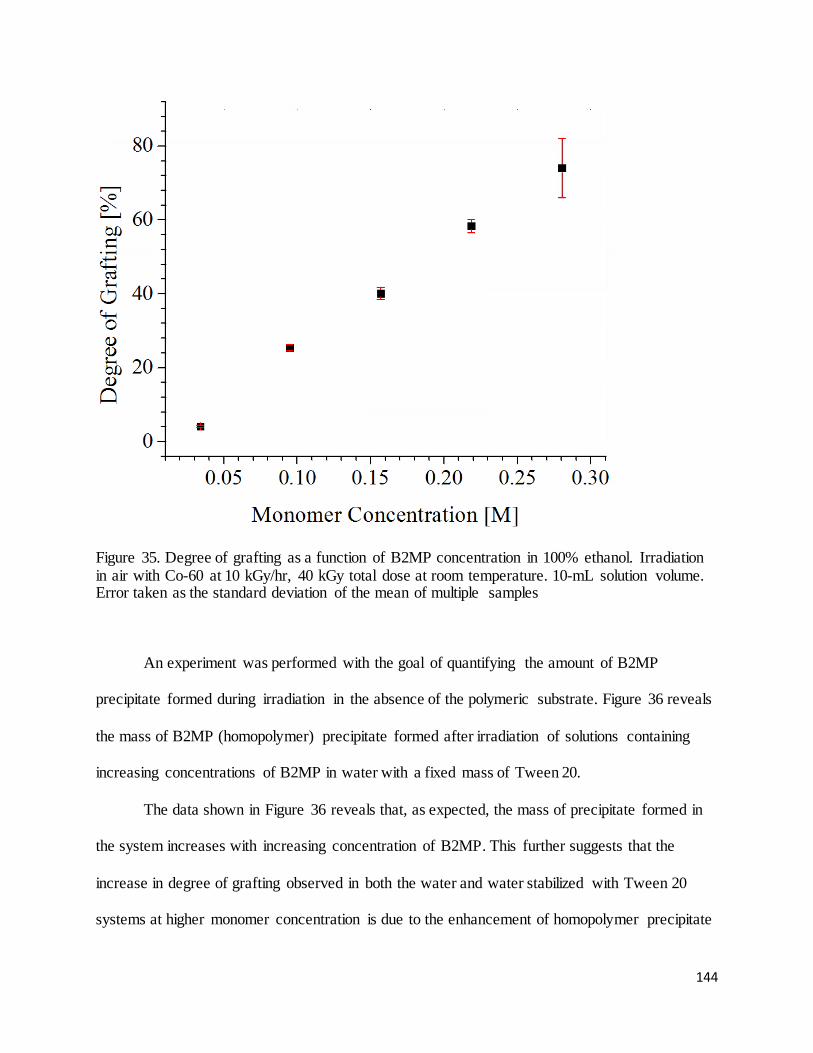
144
Figure 35. Degree of grafting as a function of B2MP concentration in 100% ethanol. Irradiation in air with Co-60 at 10 kGy/hr, 40 kGy total dose at room temperature. 10-mL solution volume. Error taken as the standard deviation of the mean of multiple samples
An experiment was performed with the goal of quantifying the amount of B2MP
precipitate formed during irradiation in the absence of the polymeric substrate. Figure 36 reveals
the mass of B2MP (homopolymer) precipitate formed after irradiation of solutions containing
increasing concentrations of B2MP in water with a fixed mass of Tween 20.
The data shown in Figure 36 reveals that, as expected, the mass of precipitate formed in
the system increases with increasing concentration of B2MP. This further suggests that the
increase in degree of grafting observed in both the water and water stabilized with Tween 20
systems at higher monomer concentration is due to the enhancement of homopolymer precipitate
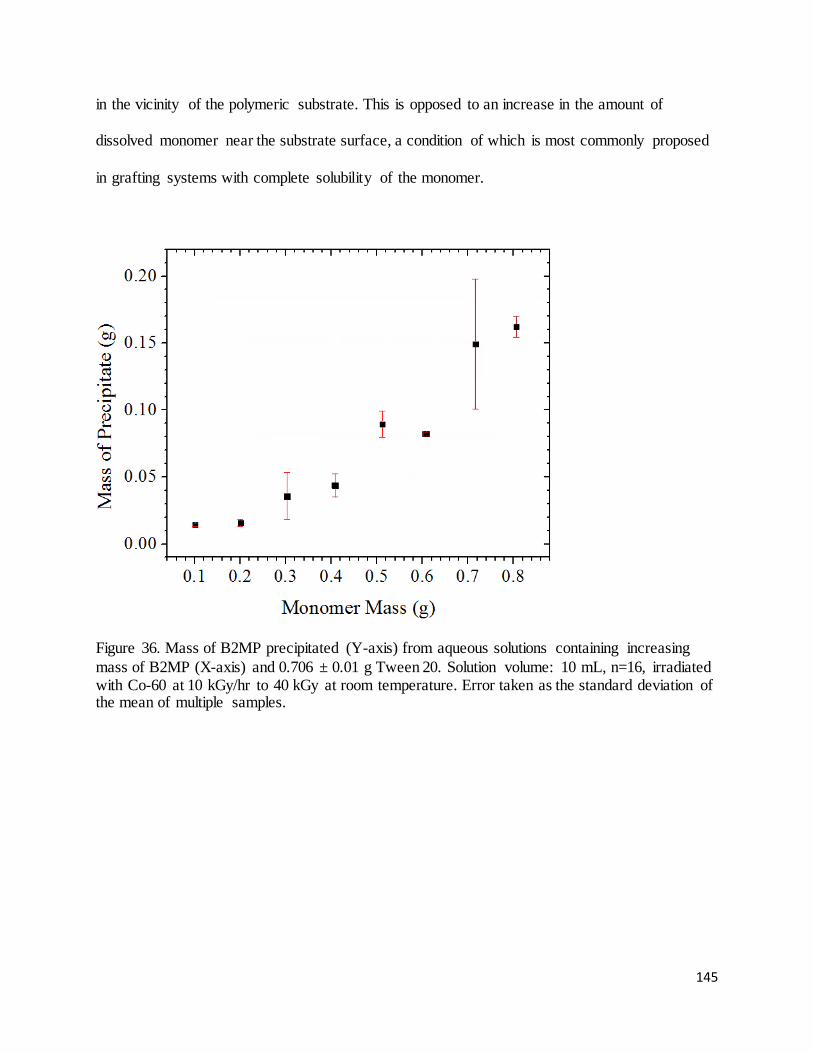
145
in the vicinity of the polymeric substrate. This is opposed to an increase in the amount of
dissolved monomer near the substrate surface, a condition of which is most commonly proposed
in grafting systems with complete solubility of the monomer.
Figure 36. Mass of B2MP precipitated (Y-axis) from aqueous solutions containing increasing mass of B2MP (X-axis) and 0.706 ± 0.01 g Tween 20. Solution volume: 10 mL, n=16, irradiated with Co-60 at 10 kGy/hr to 40 kGy at room temperature. Error taken as the standard deviation of the mean of multiple samples.
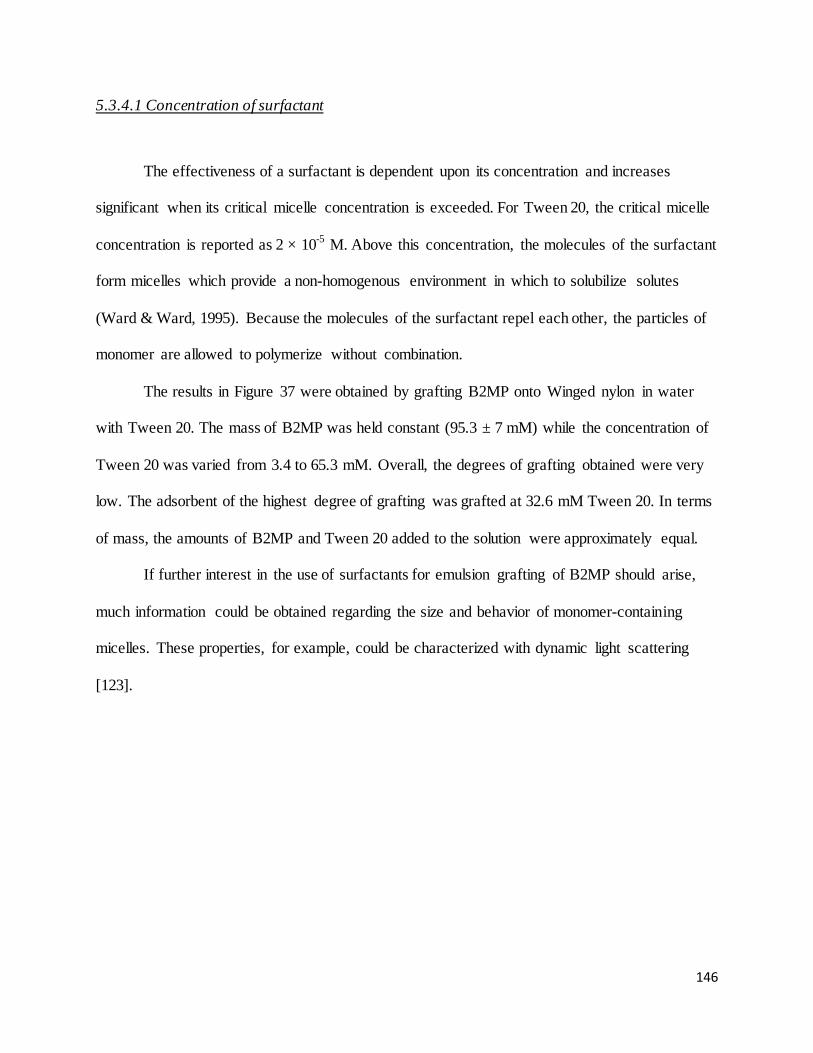
146
5.3.4.1 Concentration of surfactant
The effectiveness of a surfactant is dependent upon its concentration and increases
significant when its critical micelle concentration is exceeded. For Tween 20, the critical micelle
concentration is reported as 2 × 10⁻⁵ M. Above this concentration, the molecules of the surfactant
form micelles which provide a non-homogenous environment in which to solubilize solutes
(Ward & Ward, 1995). Because the molecules of the surfactant repel each other, the particles of
monomer are allowed to polymerize without combination.
The results in Figure 37 were obtained by grafting B2MP onto Winged nylon in water
with Tween 20. The mass of B2MP was held constant (95.3 ± 7 mM) while the concentration of
Tween 20 was varied from 3.4 to 65.3 mM. Overall, the degrees of grafting obtained were very
low. The adsorbent of the highest degree of grafting was grafted at 32.6 mM Tween 20. In terms
of mass, the amounts of B2MP and Tween 20 added to the solution were approximately equal.
If further interest in the use of surfactants for emulsion grafting of B2MP should arise,
much information could be obtained regarding the size and behavior of monomer-containing
micelles. These properties, for example, could be characterized with dynamic light scattering
[123].
147
Figure 37. Degree of grafting as a function of the mass ratio of B2MP to Tween20 in aqueous solution. Monomer mass: 95.2 ± 7 mM B2MP. Irradiation in air with Co-60 at 10 kGy/hr, 40 kGy total dose at room temperature. 10-mL solution volume. Error taken as the standard deviation of the mean of multiple samples
5.3.5 Total Dose
The optimal total absorbed dose delivered to a system under irradiation should be the
minimum dose required to produce the desired changes necessary for the product to perform its
intended function. At low doses, the grafting yield of the product may be too low for the
application. At doses that are too high, the polymeric substrate may be at risk of damage and the
processing cost may become un-economical [39].
148
The total number of free radicals generated via initiation with ionizing radiation increases
with an increase in radiation dose as evidenced by the G-value, or radiation chemical yield. For a
given G-value, the product yield (n(X)) increases proportionally with increasing dose Equation
42.
Equation 42
𝐺(𝑋) = 𝑛(𝑋)𝑒
Where:
G(X) = G-value of produce X
n(X) = Yield of product X
𝑒 = mean energy imparted to material
The data presented in this section is in the form of degree of grafting as a function of total
absorbed dose. In many published works, data is presented as the degree of grafting as a function
of irradiation time. The irradiation times utilized in this section can be determined by dividing
the absorbed dose (kGy) by the dose rate (kGy/hr).
The dependence of degree of grafting on the total absorbed dose was determined via two
methods: a) irradiation of all samples together (using Co-60) in one solution and b) irradiation of
single samples (using electron beam) in individual solutions. Irradiations with Co-60 (including
water, water/Tween 20 and ethanol) were performed by removing small pre-weighed samples of
nylon from a single monomer/solvent solution (115-150 mL) at periodic intervals. This was
performed in an attempt to minimize the high standard deviations observed upon gamma
irradiation of individual samples grafted in water and the water/Tween 20 mixture – essentially
allowing for gentle stirring of the grafting solution at periodic intervals to ensure that each fabric
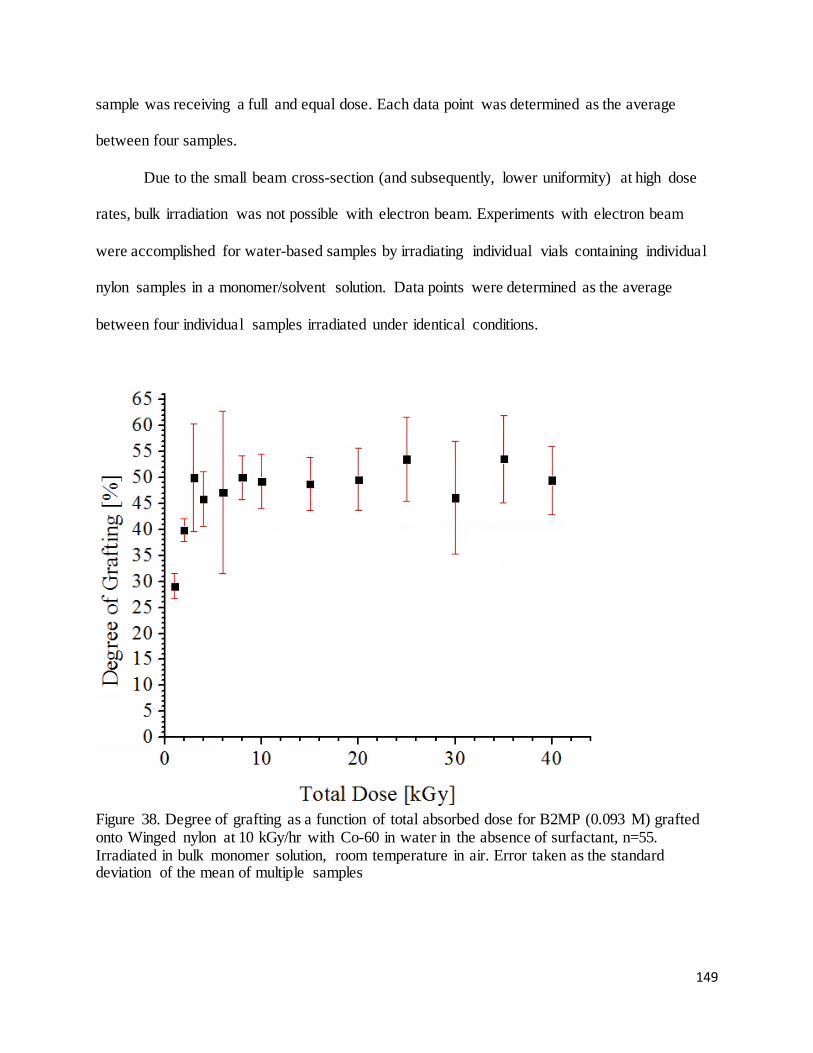
149
sample was receiving a full and equal dose. Each data point was determined as the average
between four samples.
Due to the small beam cross-section (and subsequently, lower uniformity) at high dose
rates, bulk irradiation was not possible with electron beam. Experiments with electron beam
were accomplished for water-based samples by irradiating individual vials containing individual
nylon samples in a monomer/solvent solution. Data points were determined as the average
between four individual samples irradiated under identical conditions.
Figure 38. Degree of grafting as a function of total absorbed dose for B2MP (0.093 M) grafted onto Winged nylon at 10 kGy/hr with Co-60 in water in the absence of surfactant, n=55. Irradiated in bulk monomer solution, room temperature in air. Error taken as the standard deviation of the mean of multiple samples
150
The data in Figure 38 was obtained by irradiation (in air at room temperature) of a bulk
solution of B2MP and water containing 52 nylon fabrics cut to equal weight (6.25 ± 0.03 mg). A
set of four samples were periodically removed from the grafting solution, washed in ethanol,
dried at 65 °C and weighed. Inspection of Figure 38 reveals a rapid increase from 0 to 40%
degrees of grafting within 12 minutes (2 kGy). After 18 minutes (4 kGy), the grafting reaction
reaches saturation with no additional increase in degree of grafting observed. This saturation
does not indicate complete consumption of monomer, rather, it represents the dose at which
degree of grafting ceases to increase with additional dose. Indeed, the percent conversion of
monomer obtained at saturation in Figure 38 is only around 3%. The low observed saturation
dose (4 kGy) is likely due to high efficiency in utilizing radicals for graft initiation and
propagation [248]. Indeed, the requirement of lower doses to obtain high grafting yields is
generally observed more often for the direct grafting method as opposed to the indirect (pre-
irradiation) method, with doses of 10 kGy or less required for some grafting applications [50].
A maximum degree of grafting of 54% was observed after saturation. Degrees of
grafting significantly higher than 50% have been observed for nylon fabrics grafted with B2MP
in water. The plateau observed at low degrees of grafting has been attributed to the fact that the
bulk monomer solution utilized in this experiment was intermittently stirred and contacted with
air, while the high degrees of grafting described in other experiments were achieved through the
irradiation of un-stirred, un-opened vials of B2MP in water.
Two factors could be responsible for the saturation at low degrees of grafting. For one,
repeated contact with oxygen due to frequent opening and stirring of the grafting solution may
have had a scavenging effect on free radicals present on the solvent, monomer and substrate.
Unlike the short irradiation times and sealed vials utilized to produce Figure 41, irradiation with
151
Co-60 in open air takes place in an aerobic state since oxygen has time to diffuse from the
atmosphere into the solvent [232]. For this reason, it is likely that the dose response in this
stirred, open-air experiment would differ from the response observed by the conventional
technique of grafting in sealed, individual vials due to the effects of abundant contact with
atmospheric oxygen.
Secondly, the act of stirring the solution may have had a profound effect on the physical
relationship between the polymeric substrate and the homopolymer precipitate. Since the
solution was stirred, it is possible that contact between the precipitate (which precipitates onto
the substrate on the bottom of the vial) and the fabric was likely diminished. This behavior may
explain the low degrees of grafting observed with the stirred samples (54%, Figure 38) compared
to a non-stirred samples (77%, Figure 34) grafted at the same monomer concentration.
The relatively low dose at which the samples in Figure 38 reach equilibrium could be
explained by the behavior of B2MP in the stirred system. It is possible that increases in degree of
grafting occur while the solution is in the process of phase separating, during which time new
precipitate continues to diffuse towards the substrate. It was observed during the experiment that
after the solution separated into a liquid (water) and solid (homopolymer) phase, the masses of
homopolymer exhibited a tendency to aggregate together rather than mix with the water and
nylon samples. This behavior may explain the plateau observed after only 4 kGy.
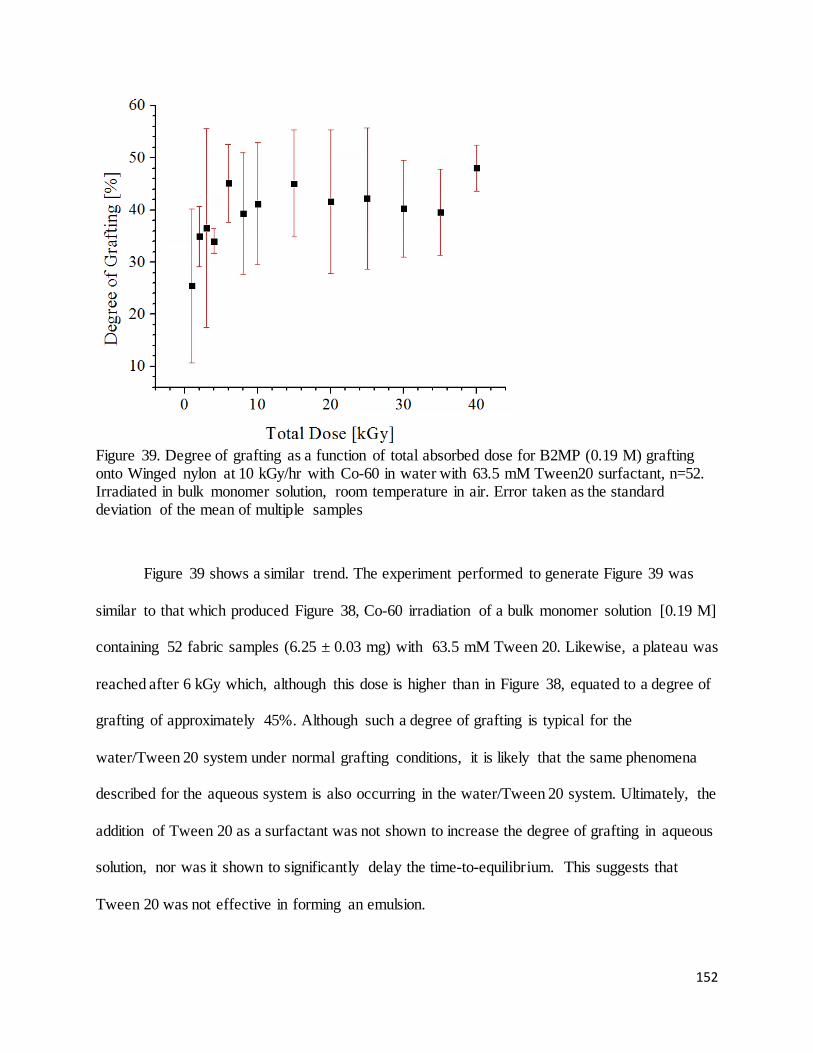
152
Figure 39. Degree of grafting as a function of total absorbed dose for B2MP (0.19 M) grafting onto Winged nylon at 10 kGy/hr with Co-60 in water with 63.5 mM Tween20 surfactant, n=52. Irradiated in bulk monomer solution, room temperature in air. Error taken as the standard deviation of the mean of multiple samples
Figure 39 shows a similar trend. The experiment performed to generate Figure 39 was
similar to that which produced Figure 38, Co-60 irradiation of a bulk monomer solution [0.19 M]
containing 52 fabric samples (6.25 ± 0.03 mg) with 63.5 mM Tween 20. Likewise, a plateau was
reached after 6 kGy which, although this dose is higher than in Figure 38, equated to a degree of
grafting of approximately 45%. Although such a degree of grafting is typical for the
water/Tween 20 system under normal grafting conditions, it is likely that the same phenomena
described for the aqueous system is also occurring in the water/Tween 20 system. Ultimately, the
addition of Tween 20 as a surfactant was not shown to increase the degree of grafting in aqueous
solution, nor was it shown to significantly delay the time-to-equilibrium. This suggests that
Tween 20 was not effective in forming an emulsion.
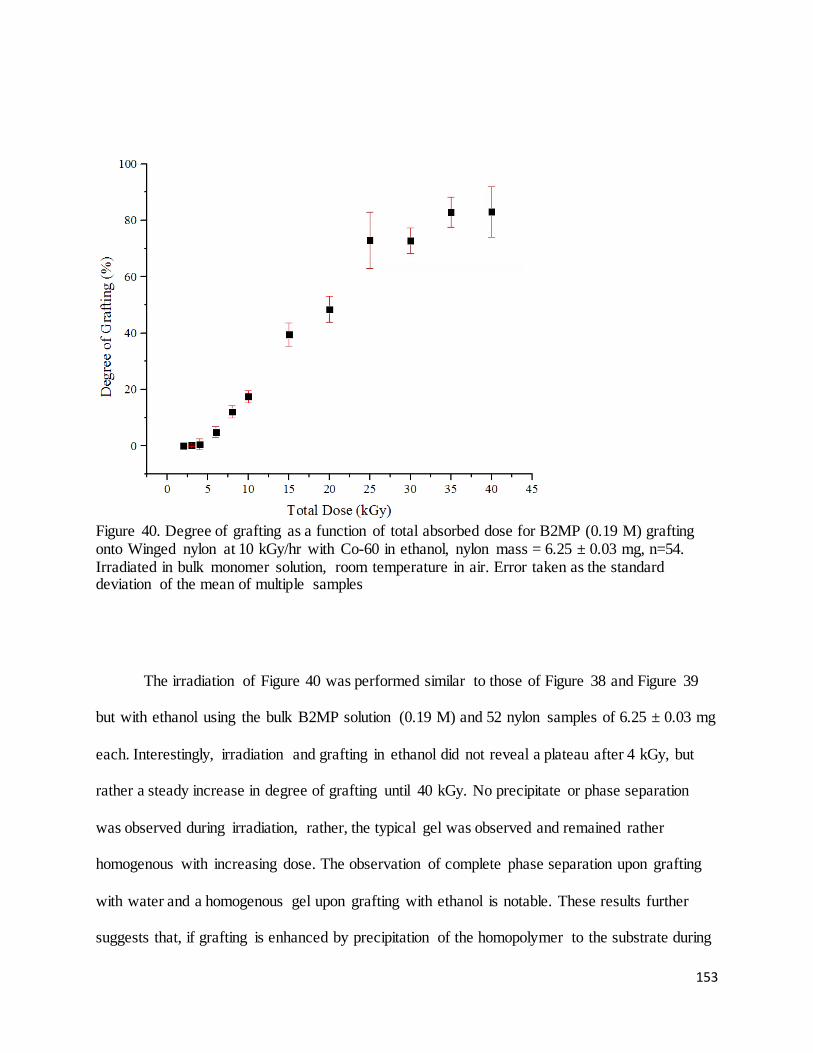
153
Figure 40. Degree of grafting as a function of total absorbed dose for B2MP (0.19 M) grafting onto Winged nylon at 10 kGy/hr with Co-60 in ethanol, nylon mass = 6.25 ± 0.03 mg, n=54. Irradiated in bulk monomer solution, room temperature in air. Error taken as the standard deviation of the mean of multiple samples
The irradiation of Figure 40 was performed similar to those of Figure 38 and Figure 39
but with ethanol using the bulk B2MP solution (0.19 M) and 52 nylon samples of 6.25 ± 0.03 mg
each. Interestingly, irradiation and grafting in ethanol did not reveal a plateau after 4 kGy, but
rather a steady increase in degree of grafting until 40 kGy. No precipitate or phase separation
was observed during irradiation, rather, the typical gel was observed and remained rather
homogenous with increasing dose. The observation of complete phase separation upon grafting
with water and a homogenous gel upon grafting with ethanol is notable. These results further
suggests that, if grafting is enhanced by precipitation of the homopolymer to the substrate during
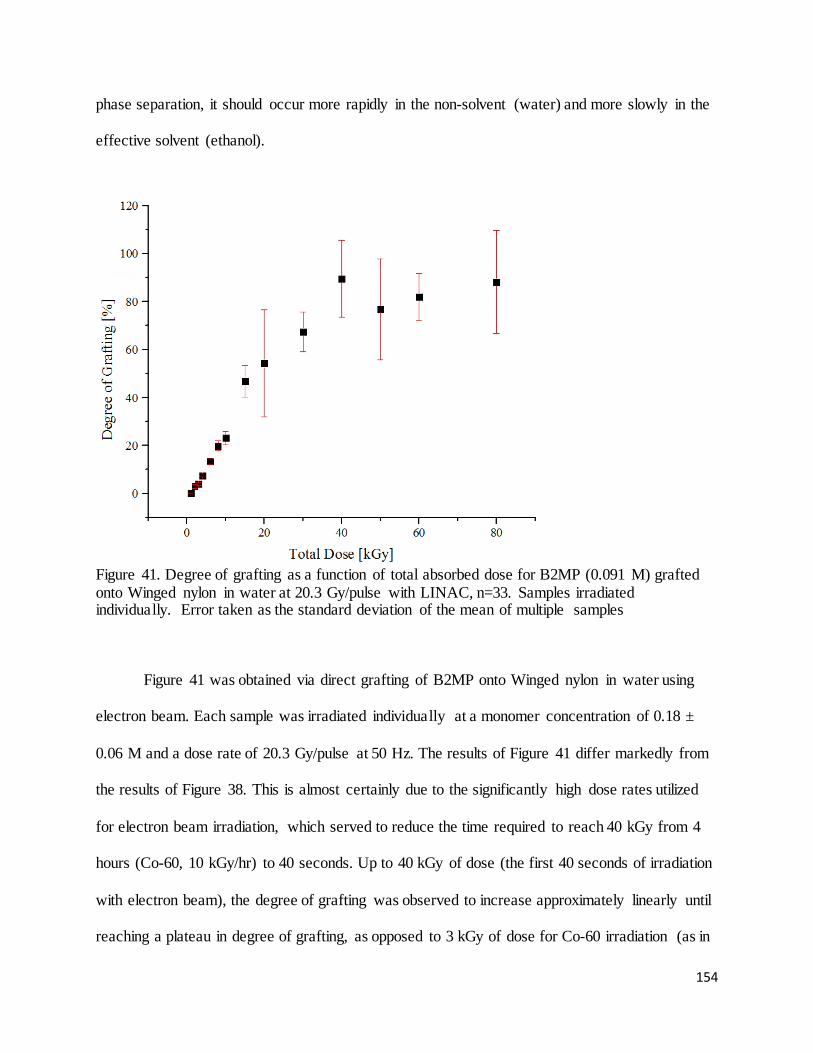
154
phase separation, it should occur more rapidly in the non-solvent (water) and more slowly in the
effective solvent (ethanol).
Figure 41. Degree of grafting as a function of total absorbed dose for B2MP (0.091 M) grafted onto Winged nylon in water at 20.3 Gy/pulse with LINAC, n=33. Samples irradiated individually. Error taken as the standard deviation of the mean of multiple samples
Figure 41 was obtained via direct grafting of B2MP onto Winged nylon in water using
electron beam. Each sample was irradiated individually at a monomer concentration of 0.18 ±
0.06 M and a dose rate of 20.3 Gy/pulse at 50 Hz. The results of Figure 41 differ markedly from
the results of Figure 38. This is almost certainly due to the significantly high dose rates utilized
for electron beam irradiation, which served to reduce the time required to reach 40 kGy from 4
hours (Co-60, 10 kGy/hr) to 40 seconds. Up to 40 kGy of dose (the first 40 seconds of irradiation
with electron beam), the degree of grafting was observed to increase approximately linearly until
reaching a plateau in degree of grafting, as opposed to 3 kGy of dose for Co-60 irradiation (as in
155
Figure 38). Additionally, the maximum degree of grafting observed with electron beam was
89%, compared to a value of about 50% obtained by grafting at low dose rates with Co-60.
5.3.6 Dose Rate
The dose rate is the radiation dose absorbed by a material per unit time and is typically
expressed in units of kGy/hr or Gy/s (steady-state irradiation) or Gy/pulse (pulsed irradiation).
Unlike the limited range of total absorbed doses that are usually utilized for polymer
modification, dose rates utilized for such applications can span over four orders of magnitude.
This is due to the often substantial differences in dose rate capabilities between Co-60 gamma
and electron beam facilities. Dose rates available with Co-60 irradiation range from
approximately 10-1 to 102 kGy/hr depending on the activity and configuration of the source.
Electron beam, on the other hand, yields dose rates on the order of 102 kGy/s (105 kGy/hr) [250].
The rate of free radical formation under radiolysis is proportional to the absorbed dose
rate. Specifically, the rate of radical formation through initiation is proportional to a constant c
and the dose rate D, while kp and kt represent the rate constants for free radical propagation and
termination, respectively and [P] is the polymer substrate [33]. Assuming steady-state conditions,
the radiation chemical yield can be expressed as a function of dose rate according to Equation
43.
Equation 43
G(P) = [P] kp(c/kt)0.5(��)0.5
The dependence of the grafting yield on dose rate (Equation 43) assumes that competition
occurs between termination reactions (M• + •M → M-M; P• + •M → P-M) and propagation
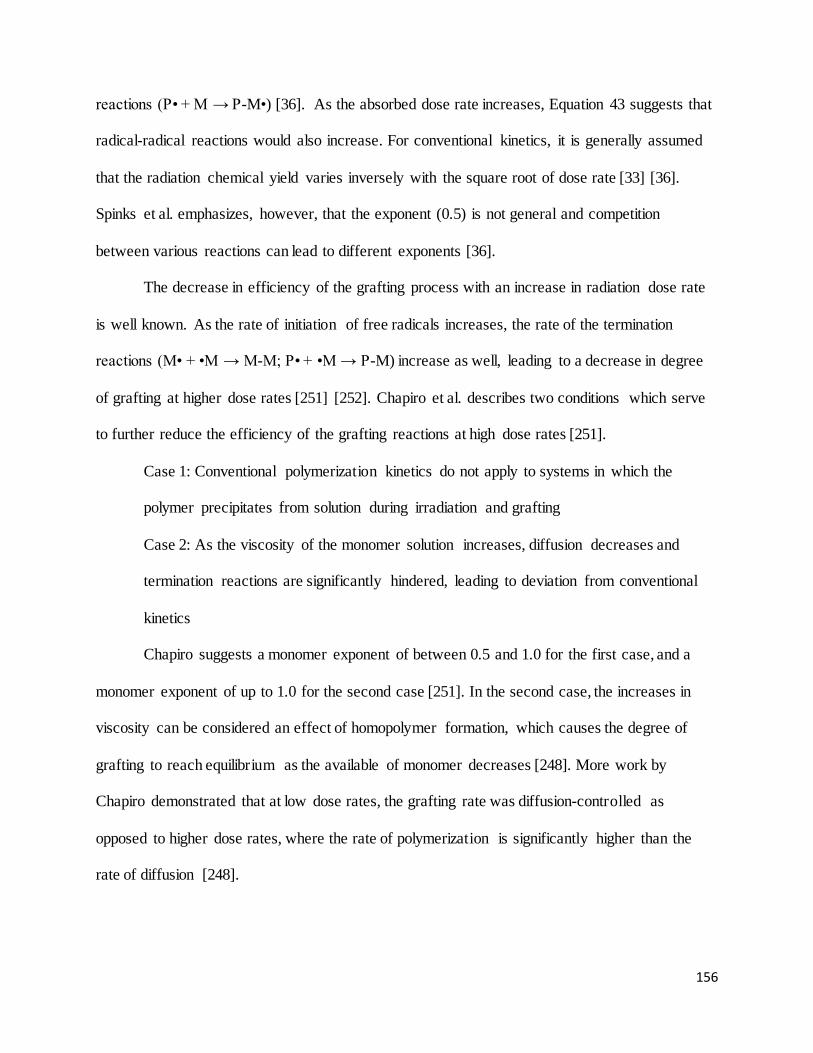
156
reactions (P• + M → P-M•) [36]. As the absorbed dose rate increases, Equation 43 suggests that
radical-radical reactions would also increase. For conventional kinetics, it is generally assumed
that the radiation chemical yield varies inversely with the square root of dose rate [33] [36].
Spinks et al. emphasizes, however, that the exponent (0.5) is not general and competition
between various reactions can lead to different exponents [36].
The decrease in efficiency of the grafting process with an increase in radiation dose rate
is well known. As the rate of initiation of free radicals increases, the rate of the termination
reactions (M• + •M → M-M; P• + •M → P-M) increase as well, leading to a decrease in degree
of grafting at higher dose rates [251] [252]. Chapiro et al. describes two conditions which serve
to further reduce the efficiency of the grafting reactions at high dose rates [251].
Case 1: Conventional polymerization kinetics do not apply to systems in which the
polymer precipitates from solution during irradiation and grafting
Case 2: As the viscosity of the monomer solution increases, diffusion decreases and
termination reactions are significantly hindered, leading to deviation from conventional
kinetics
Chapiro suggests a monomer exponent of between 0.5 and 1.0 for the first case, and a
monomer exponent of up to 1.0 for the second case [251]. In the second case, the increases in
viscosity can be considered an effect of homopolymer formation, which causes the degree of
grafting to reach equilibrium as the available of monomer decreases [248]. More work by
Chapiro demonstrated that at low dose rates, the grafting rate was diffusion-controlled as
opposed to higher dose rates, where the rate of polymerization is significantly higher than the
rate of diffusion [248].
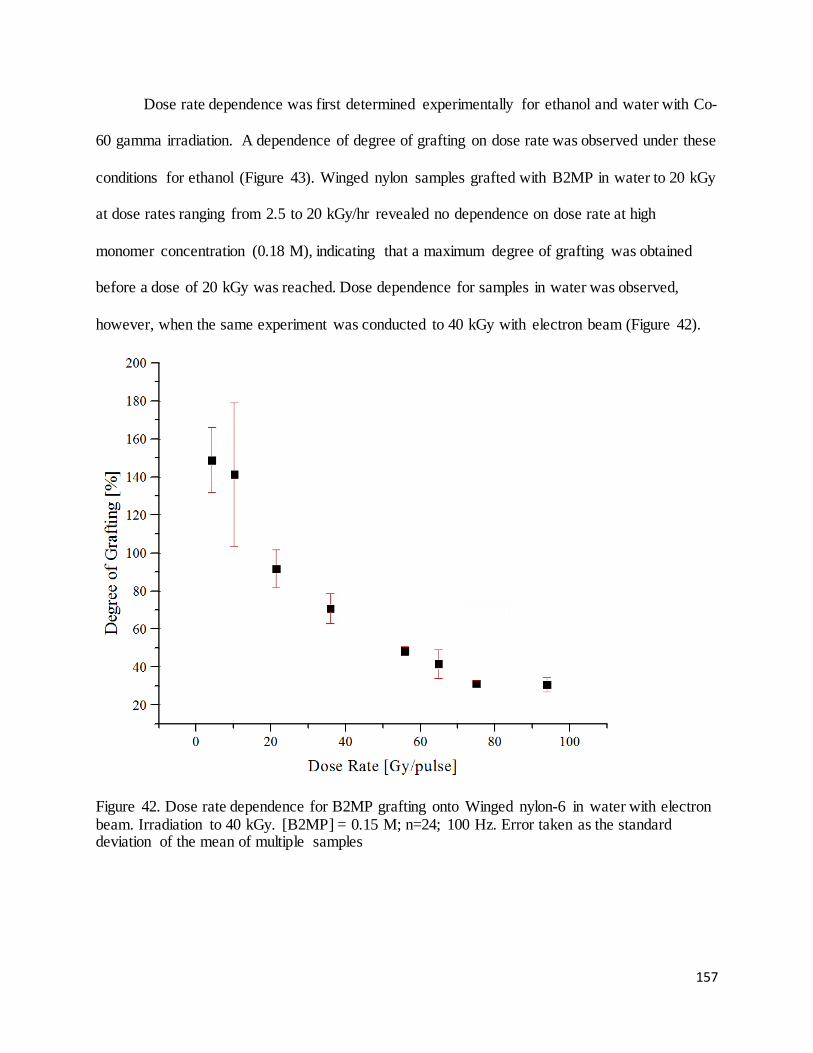
157
Dose rate dependence was first determined experimentally for ethanol and water with Co-
60 gamma irradiation. A dependence of degree of grafting on dose rate was observed under these
conditions for ethanol (Figure 43). Winged nylon samples grafted with B2MP in water to 20 kGy
at dose rates ranging from 2.5 to 20 kGy/hr revealed no dependence on dose rate at high
monomer concentration (0.18 M), indicating that a maximum degree of grafting was obtained
before a dose of 20 kGy was reached. Dose dependence for samples in water was observed,
however, when the same experiment was conducted to 40 kGy with electron beam (Figure 42).
Figure 42. Dose rate dependence for B2MP grafting onto Winged nylon-6 in water with electron beam. Irradiation to 40 kGy. [B2MP] = 0.15 M; n=24; 100 Hz. Error taken as the standard deviation of the mean of multiple samples
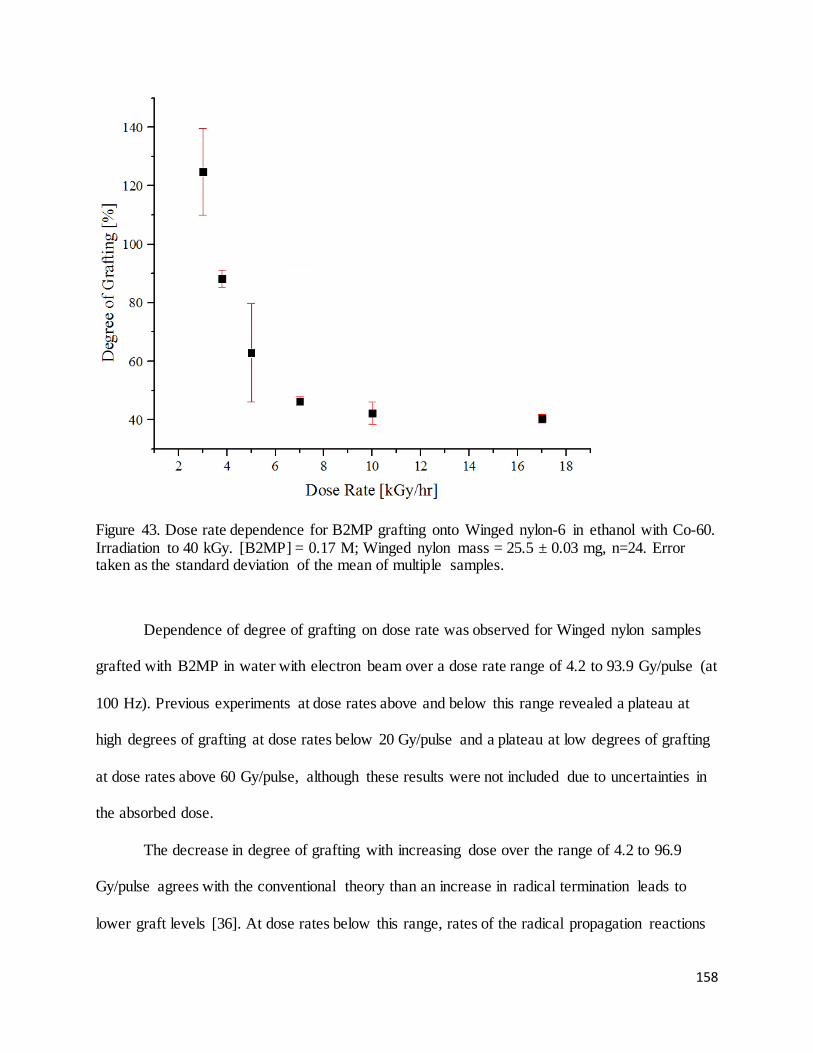
158
Figure 43. Dose rate dependence for B2MP grafting onto Winged nylon-6 in ethanol with Co-60. Irradiation to 40 kGy. [B2MP] = 0.17 M; Winged nylon mass = 25.5 ± 0.03 mg, n=24. Error taken as the standard deviation of the mean of multiple samples.
Dependence of degree of grafting on dose rate was observed for Winged nylon samples
grafted with B2MP in water with electron beam over a dose rate range of 4.2 to 93.9 Gy/pulse (at
100 Hz). Previous experiments at dose rates above and below this range revealed a plateau at
high degrees of grafting at dose rates below 20 Gy/pulse and a plateau at low degrees of grafting
at dose rates above 60 Gy/pulse, although these results were not included due to uncertainties in
the absorbed dose.
The decrease in degree of grafting with increasing dose over the range of 4.2 to 96.9
Gy/pulse agrees with the conventional theory than an increase in radical termination leads to
lower graft levels [36]. At dose rates below this range, rates of the radical propagation reactions
159
are enhanced while at dose rates above this range, these reaction rates are limited. Unlike
grafting in water, grafting in ethanol revealed dependence of degree of grafting on dose rate over
the range of low dose rates obtained by irradiation with Co-60. The degree of grafting was
observed to increase over the range of 3.0 to 7 kGy/hr, above which saturation was observed at a
total dose of 40 kGy.
To summarize, dose rate dependence was observed for grafting in water at high dose
rates (with electron beam) and ethanol at low dose rates (with Co-60). This observation suggests
that the use of each solvent results in different mechanism of graft polymerization, one which
requires a short irradiation time (water) and one which requires a longer irradiation time
(ethanol). Although experiments were not performed to investigate this difference, it is likely
attributed to differences in the rate of precipitation of the homopolymer from the solvent which
was indeed shown to be more much more rapid for water than for ethanol.
160
5.3.7. Summary of Optimized Conditions
Based on the results obtained in this chapter, the following materials and conditions were
utilized for the synthesis of the grafted adsorbents for testing of uranium extraction efficiency
and characterization with FTIR, Raman and SEM. The absorbent is synthesized in at room
temperature in the absence of catalysts, stabilizers, chemical initiators, inhibitors and purging
gases. Degree of grafting was controlled by adjusting the concentration of monomer in each
sample.
Monomer: bis(2-methacryloxyethyl)phosphate (B2MP)
Polymer substrate: Winged nylon-6
Solvent: 100% ethanol
Radiation source: Co-60
Dose rate: 10 kGy/hr
Total dose: 40 kGy
161
5.4 Extraction Performance
5.4.1 Testing of Polymeric Adsorbents
Thus far, this dissertation has focused on the development of grafted polymer fabrics in a
range of degrees of grafting. This section will consider the quality of the grafted fabrics as
adsorbents for uranium by determining the capacity for which they remove uranium from
synthetic seawater containing concentrations of uranium consistent with those found in natural
seawater.
The effectiveness of modified polymers at removing metal ions from solution has been
discussed extensively in the literature. This includes the characterization of extraction
performance of graft-copolymers [253] [254] [45] [255] [256] and, specifically, those developed
for the extraction of uranium from seawater [257] [258] [259] [260].
The effectiveness of an individual adsorbent must be characterized in a manner that
allows comparison with other similar adsorbents. Effectiveness (efficiency or extraction
performance) can be expressed in several ways, the most common being the loading capacity of
the adsorbent (mass of uranium adsorbed per mass adsorbent), percent sorption (fraction of
uranium removed from by the solution) and distribution coefficient (ratio of concentration of
uranium on adsorbent to that remaining in solution). These values are all based on the mass of
uranium sorbed by the adsorbent.
Theoretically, this quantity can be determined in one of two ways. In the first method, the
adsorbents can be contacted with seawater and the mass of uranium on the solid phase
determined. In the second method, the adsorbents can be contacted with seawater and the mass
of uranium removed from the liquid phase can be determined. Both options require different
162
instrumentation and feature different limitations. Due to the convenience and low limits of
detection achievable with liquid scintillation counting, all concentrations were determined by
analyzing the liquid phase.
Extraction performance should not be defined through a single experiment; instead, it is
necessary to understand several behavioral aspects of the grafted fabrics in contact with
seawater. For this reason, the extraction performance of the fabrics was characterized through the
following five parameters:
1. Dependence of extraction performance on degree of grafting
2. Kinetics of uranium uptake
3. Dominant mechanism of uranium adsorption
4. Dependence of extraction performance on temperature
5. Uranium uptake under high uranium concentrations
These experiments are conventionally performed at high concentrations of uranium using
elemental analysis such as inductively coupled plasma mass spectroscopy, atomic adsorption
spectroscopy and UV-VIS spectrophotometry. The effectiveness of several of these methods is
hindered by low concentrations of uranium along with the high total dissolved solids content of
seawater. For this reason, a 233U radiotracer was utilized in this thesis. Instead of measuring the
mass of uranium remaining in seawater, the mass is calculated by determining the radioactivity
of the seawater solution with liquid scintillation counting.
The use of a 233U radiotracer to assess the uranium extraction efficiency of phosphate-
functionalized polymer sorbents from seawater was described by Das et al. in 2012 [66]. The
uptake of 233U on the adsorbent was determined by alpha counting of the spiked seawater
163
solution both before and after overnight contact with the adsorbent [261]. The extraction
performance of these adsorbents was characterized based on uranium loading capacity.
The experiments presented in this dissertation differed primarily from the work of Das et
al. in that the uranium tracer concentration used in that study was 9.54 mg/L, over three orders of
magnitude higher than concentrations present in natural seawater. This concentration was
selected by the authors to maintain a sufficient alpha count rate, since only 50 µL of the spiked
solution was counted. Additionally, uranium uptake was only tested by determining the loading
capacity of the adsorbent under a single set of conditions. The effects of contact time and
extraction temperature were not investigated and a mechanism of adsorption based on kinetic
models was not proposed.
Important to understanding the extraction performance of the grafted fabrics is to gain
insight into the kinetics and mechanisms of adsorption. According to Hill, adsorption is “the
preferential concentration of a species at the interface between two phases” and all phenomena
can be divided into two categories: physical adsorption and chemical adsorption [262]. Physical
adsorption is based on intermolecular forces and generally does not depend on the reactivity
between the adsorbent and the adsorbate [262] [263]. Chemical adsorption involves the
formation of chemical reactions between the adsorbate and active sites on the adsorbent,
typically forming a chemically bonded monolayer of adsorbate on the adsorbent surface [263].
Physical and chemical adsorption can be distinguished from one another through
experimentation. Fitting experimental data to kinetic models aids in determining the rate-limited
step. For chemical adsorption, the rate-limited step may be the rate of the chemical reaction
itself. In physical adsorption processes, the adsorption often occurs so rapidly that the rate-
limiting step is the diffusion of the adsorbate to the adsorbent surface [262]. Although chemical
164
adsorption is likely the dominant mechanism for the phosphate-functionalized fabrics developed
in this thesis, kinetic data was applied to both models in Section 5.4.3.
5.4.1.1 Determination of Extraction Efficiency
To prepare the grafted adsorbents, nylon fabrics were cut individually to a size of 6.15 ±
4 mg and added to B2MP-ethanol mixtures at concentrations ranging from 62.1 to 558.7 mM.
The fabrics were irradiated with Co-60 gamma radiation at 10 kGy/hr to a total dose of 40 kGy.
All grafting was performed using the direct (simultaneous) grafting method.
The fabrics were irradiated in the presence of various monomer concentrations to produce
grafted adsorbents in a wide range of degrees of grafting (0 to 305%). After irradiation, washing
and drying, the adsorbents were sorted according to mass and stored in air-tight containers. The
degree of grafting of each adsorbent was calculated based on the initial and final weight
according to Equation 39. An error of 0.33% was associated with the measurements of degree of
grafting based on Equation 56.
Two gallons of synthetic seawater was purchased from Cole-Parmer. This product was
made pursuant to ASTM standard D 1141 (Standard Practice for the Preparation of Substitute
Ocean Water) specifically for reproducible laboratory testing. Trace elements normally found in
seawater at concentrations below 0.005 mg/L, as well as organic matter, suspended matter and
marine life are not included in this product [4]. Elements present in this mixture include, but are
not limited to, Mg, Ca, Sr, K, Na, Cl, Br, F, Ba, Mn, Cu, Zn, Pb and Ag.
For experiments involving the determination of extraction efficiency, temperature
dependence and adsorption kinetics, the concentrations of 233U in the solutions were chosen to be
165
within the range of the natural concentration of uranium in the world’s oceans (between 3 and
3.3 × 10⁻⁶ g-U/L) [264]. This was accomplished by pipetting 60 µL of 233U into 40 mL of
synthetic seawater, yielding an average concentration of approximately 3.25 × 10⁻⁶ g-U/L. This
concentration was several orders of magnitude smaller than the uranium concentrations utilized
in the majority of similar studies, where concentrations of 6 × 10⁻³ g-U/L [23], 9.5 × 10⁻³ g-U/L
[66] and 4.2 × 10⁻² g-U/L [265], among others, were reported. These higher concentrations are
typically utilized to decrease uncertainties under conditions of high sorption, particularly in cases
where concentrations are determined through elemental analysis.
5.4.1.2 Counting Procedure
All samples were counted in 20-mL glass scintillation vials (Sigma Aldrich) mixed with
Ultima Gold LLT liquid scintillation cocktail (Perkin Elmer). Each set of samples was
accompanied by one or more background (“blank”) samples that consisted of un-spiked seawater
and Ultima Gold LLT at the same sample loadings (sample to cocktail ratio) as the radioactive
samples. All samples were shaken vigorously and stored away from light sources until counted
in the University of Maryland’s Tri-Carb 3100TR liquid scintillation analyzer.
Prior to the experiments, a counting protocol was developed to maintain consistency of
the measurement conditions for all samples. Sample sets were counted automatically for the pre-
selected count times and energy windows without any need for operator intervention. At the
termination of the count, the instrument printed a sheet containing the count rate for each sample
in each specified energy window. Afterwards, the operator can retrieve the count and obtain

166
count rates for different energy windows, as well as a printout of the pulse height spectrum,
without need to re-count the samples.
5.4.1.3 Calculations
The following calculations were used routinely in the experiments in this section. The
calculation for activity (Equation 44) based on count rate has been simplified since to include
only correction factors not equal to 1.
Equation 44
Activity (nCi) =
�Cnet ± �CRg
tg+ CRb
tb� �1 × 10⁹ nCi
Ci �
ε × �60 smin� × �3.7 × 10¹⁰ Bq
Ci �
Where:
Cnet = number of net counts
CRg = number of gross counts
CRb = number of background counts
tg = sample count time
tb = background count time
ε = counting efficiency
The percentage of uranium removed from solution can be calculated with Equation 45:
Equation 45
Sorption [%] = Mi −Mf
Mi × 100
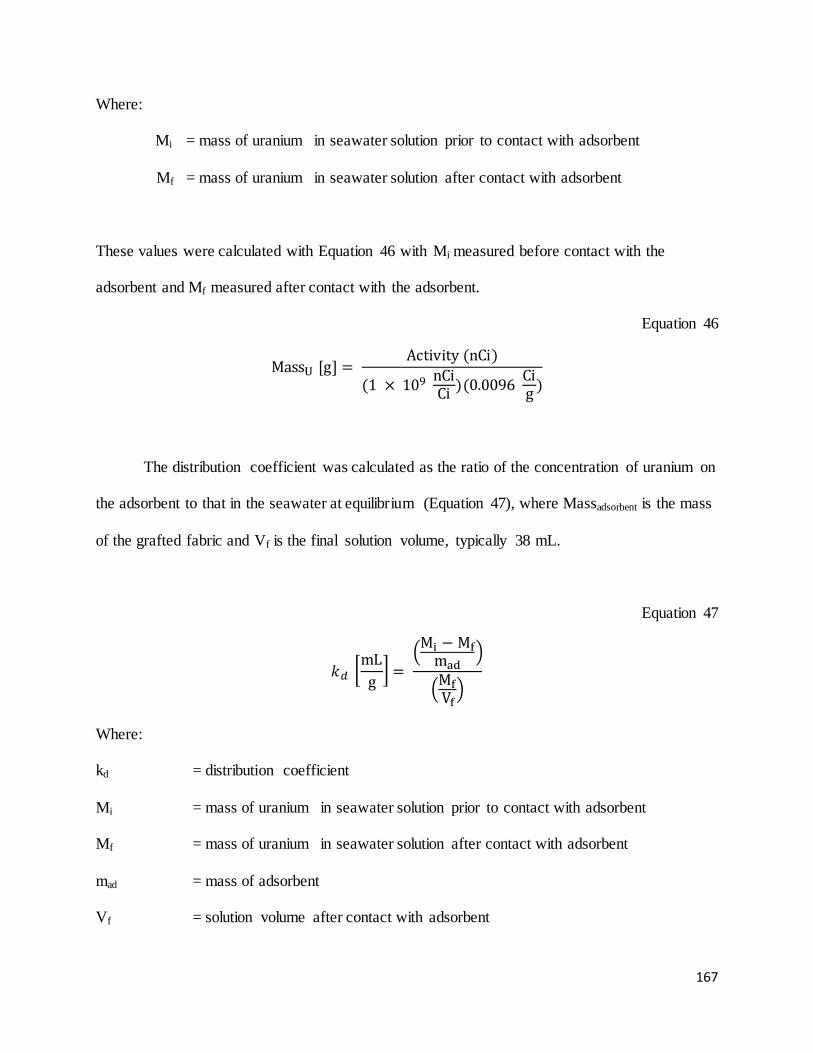
167
Where:
Mi = mass of uranium in seawater solution prior to contact with adsorbent
Mf = mass of uranium in seawater solution after contact with adsorbent
These values were calculated with Equation 46 with Mi measured before contact with the
adsorbent and Mf measured after contact with the adsorbent.
Equation 46
MassU [g] = Activity (nCi)
(1 × 10⁹ nCiCi )(0.0096 Ci
g )
The distribution coefficient was calculated as the ratio of the concentration of uranium on
the adsorbent to that in the seawater at equilibrium (Equation 47), where Massadsorbent is the mass
of the grafted fabric and Vf is the final solution volume, typically 38 mL.
Equation 47
𝑘𝑟 �mL
g� =
�Mi − Mfmad
�
�MfVf�
Where:
kd = distribution coefficient
Mi = mass of uranium in seawater solution prior to contact with adsorbent
Mf = mass of uranium in seawater solution after contact with adsorbent
mad = mass of adsorbent
Vf = solution volume after contact with adsorbent
168
It should be noted that distribution coefficients are strongly affected by the initial
uranium concentration and the mass of the adsorbent. Higher distribution coefficients may be
obtained at lower initial concentrations if the overall amount of uranium remaining the solution
is very low. On the other hand, systems containing an abundance of uranium (such as those with
a very high concentration of uranium) may positively affect the distribution coefficient by
increasing the overall amount removed from the solution (Mi-Mf). This presents a challenge
when comparing distribution coefficients obtained with various initial uranium concentrations
[86]. For this reason, it is advised to avoid comparing the distribution coefficients obtained in
this dissertation to those reported in other articles. Among the works cited in this dissertation, the
majority of seawater extraction experiments have been performed at initial uranium
concentrations between ten and one thousand times greater than those found in nature and in this
dissertation.
5.4.1.4 Minimum Detectable Activity
The first requirement considered when designing the extraction experiments was the
capacity of the method to detect low concentrations of uranium produced by high-uptake
adsorbents. For this reason, it is important to know the value of the smallest signal that can be
reliable detected by the method with confidence that the signal is above background. This value
is called the minimum detectable amount or minimum detectable activity.
The minimum detectable activity (MDA) is derived from the critical detection limit (LD)
which represents the minimum number of counts that are needed from a source to be considered
above background with 95% confidence [32]. In the case of equal count times for the
169
background and radioactive samples and assuming more than 70 counts are detected, the critical
detection limit can be represented by Equation 48.
Equation 48 LD = 4.65√B
Where:
LD = critical detection limit
B = number of background counds
where B is the number of background counts observed [158]. From this, the minimum detectable
activity concentration (pCi/L) for a given count time can be determined by Equation 49 [266].
Equation 49
MDA = LD
2.22EV𝑡X
Where:
LD = detection limit with 95% confidence level
E = fractional detection efficiency (CPM/DPM)
V = volume of sample (L)
X = correction factors
t = count time (minutes)
X = correction factor
For an energy window of 0-2000 keV, the highest number of background counts
observed over a 60 minute count time was 2,556 counts which yields a critical detection limit of
235 counts. Taking the sample volume as 0.02 L, the count time as 60 minutes and the detection
170
efficiency as 102% (see Table 10), the minimum detectable activity for the measurement is 86.5
pCi/L, or 0.087 nCi/L. This corresponds to a minimum of 2773 gross counts and a gross count
rate of 46.2 counts per minute.
Knowing the minimum detectable activity concentration, the minimum detectable mass
concentration of uranium can also be determined. Assuming 10 mL of the spiked uranium
sample is counted, the minimum concentration of uranium that can be detected with 95%
confidence is 1.80 × 10⁻⁸ g-U/L. Assuming an initial concentration of 3.25 × 10⁻⁶ g-U/L, this
corresponds the removal of 99.4 % of the uranium from the seawater solution. Thus, the percent
sorption or distribution coefficient of any adsorbent sample that removes greater than 99.4% of
the uranium from a solution cannot be reported with statistical confidence.
5.4.1.5 Count Time
The counting time for a radioactive sample and its corresponding background sample
should be optimized based on two considerations:
1. Minimizing the error of the count rate
2. Time available for counting
Ideally, all samples would be counted as long as possible to reduce the error of the count
rate (Equation 51). The optimal distribution of counting time between a 233U-spiked sample and
the corresponding background measurement is given by Equation 50. Application of this
equation leads to a minimization of the relative error of the net counting rate [159].
Equation 50
𝑡𝑡𝑏
= �𝐶𝐶𝑔𝐶𝐶𝑏
171
Where:
t = counting time for sample
tb = counting time for background sample
CRg = sample count rate
CRb = background count rate
Manipulation of Equation 50 reveals that low counting rates should approach equal
counting times, while higher count rates favor the allocation of extra counting time away from
the background sample. Because samples of unknown activity were routinely determined in this
work, equal counting times between the sample and background were utilized in all experiments.
Ultimately, the count rate used in the majority of experiments was selected based on the
consideration that the liquid scintillation detector was shared with other users. Because a large
number of samples were frequently counted in a single session (as many as 22 samples per
counting session), a count time of 60 minutes was chosen to ensure that all samples could be
counted without interruption.
5.4.1.6 Energy Windows
Several energy windows were considered and compared. Conventionally, energy
windows are selected based on two criteria: maximization of the counting efficiency and
minimization of the background count rate. This is usually achieved by selecting the narrowest
counting window that maintains high efficiency. For the data collected in this dissertation, it was
noted that narrow counting windows (such as the energy range of 100-500 keV) did indeed
172
possess lower background counting rates (9-11 CPM), however; counting efficiency was
observed to decrease for low-activity samples.
Counting with the entire energy window of the LSC (0 to 2000 keV) was also attempted.
Despite the high background count rates (39-42 CPM) obtained using the entire energy window,
no decrease in count rate was observed for any sample. For this reason, the energy window of 0-
2000 keV was utilized for all experiments.
5.4.1.7 Statistical Considerations
The sources of error considered in this data include:
• Uncertainty of the activity (DPM error)
• Uncertainty of the initial count rate (CRI)
• Uncertainty of the final count rate (CRF)
• Volumetric error (V)
• Uncertainty in degree of grafting
Equation 51 represents the error of the count rate [267] [53]. For calculations that utilize only
one count rate, such as determining the activity or concentration of a sample, the error in
Equation 51 can be used. For calculations that require taking the difference between two count
rates (such as calculations for percent sorption, loading and distribution coefficient), the error in
both count rates must be considered.
Equation 51
error (CR) = √xx =
σx =
�CRg + CRbcount time
Cnet
Where:
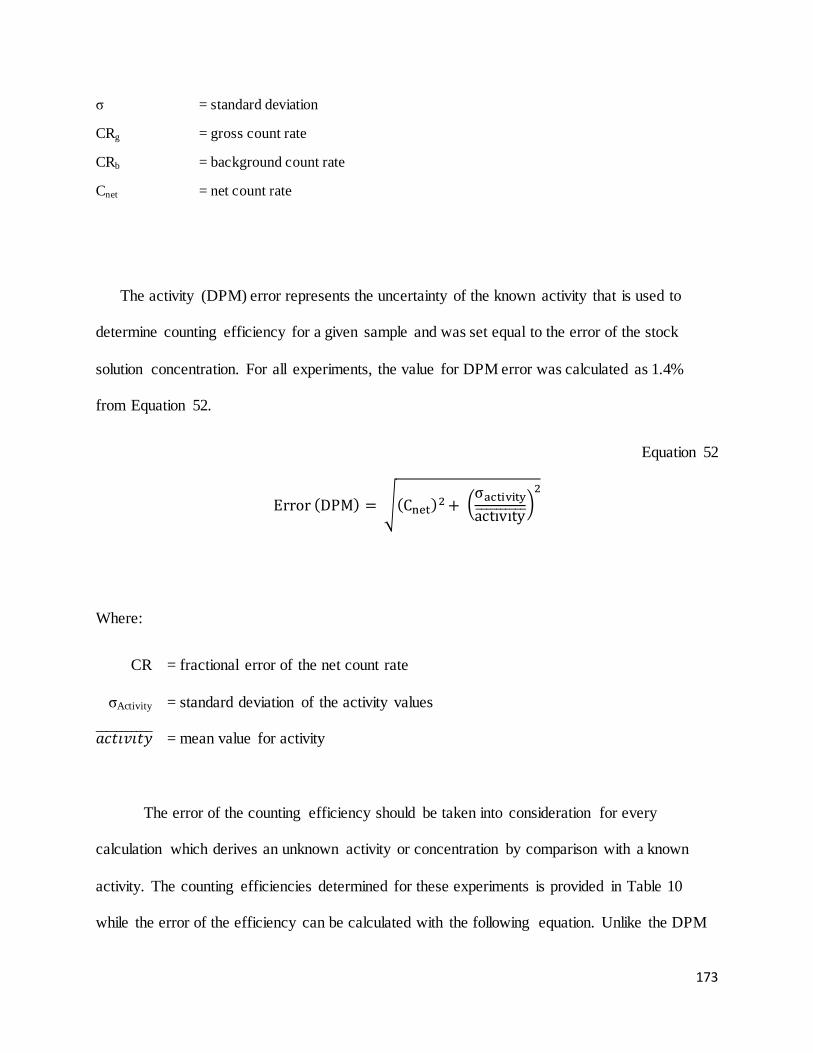
173
σ = standard deviation
CRg = gross count rate
CRb = background count rate
Cnet = net count rate
The activity (DPM) error represents the uncertainty of the known activity that is used to
determine counting efficiency for a given sample and was set equal to the error of the stock
solution concentration. For all experiments, the value for DPM error was calculated as 1.4%
from Equation 52.
Equation 52
Error (DPM) = �(Cnet)2 + �σactivityactıvıty�����������
2
Where:
CR = fractional error of the net count rate
σActivity = standard deviation of the activity values
𝑎𝑎𝑡𝑎𝑎𝑎𝑡𝑎����������� = mean value for activity
The error of the counting efficiency should be taken into consideration for every
calculation which derives an unknown activity or concentration by comparison with a known
activity. The counting efficiencies determined for these experiments is provided in Table 10
while the error of the efficiency can be calculated with the following equation. Unlike the DPM
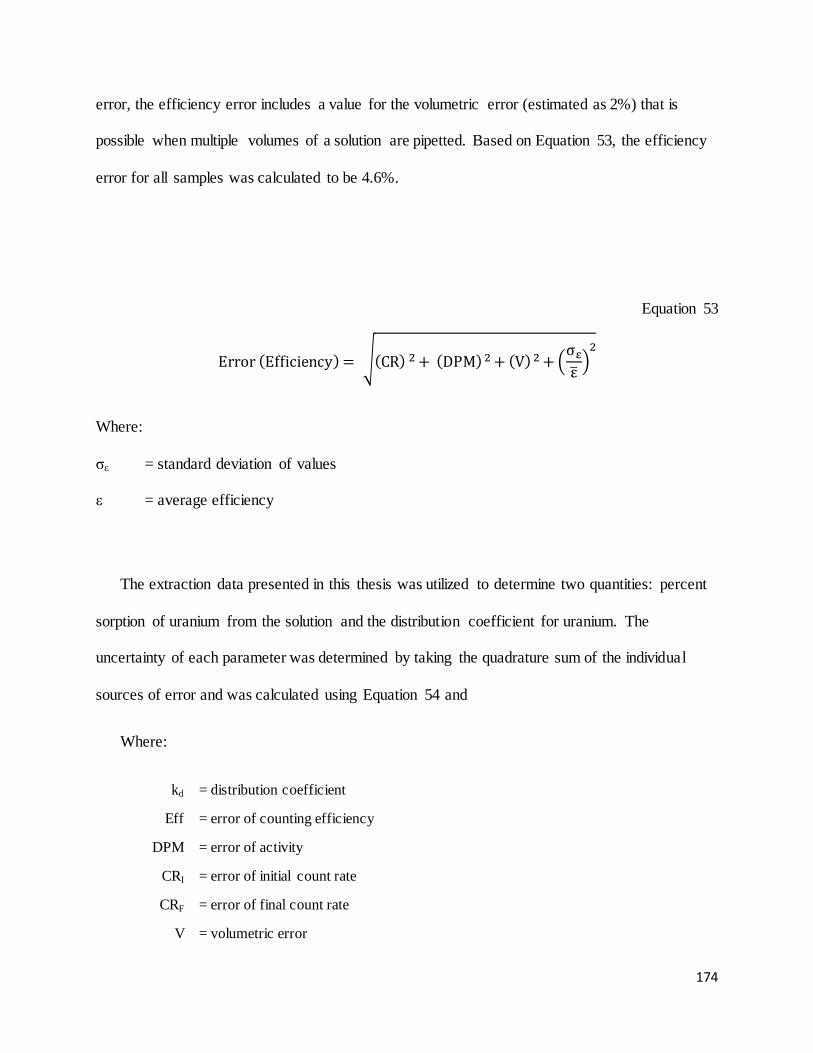
174
error, the efficiency error includes a value for the volumetric error (estimated as 2%) that is
possible when multiple volumes of a solution are pipetted. Based on Equation 53, the efficiency
error for all samples was calculated to be 4.6%.
Equation 53
Error (Efficiency) = �(CR) 2 + (DPM)2 + (V)2 + �σεε� �
2
Where:
σε = standard deviation of values
ε = average efficiency
The extraction data presented in this thesis was utilized to determine two quantities: percent
sorption of uranium from the solution and the distribution coefficient for uranium. The
uncertainty of each parameter was determined by taking the quadrature sum of the individual
sources of error and was calculated using Equation 54 and
Where:
kd = distribution coefficient
Eff = error of counting efficiency
DPM = error of activity
CRI = error of initial count rate
CRF = error of final count rate
V = volumetric error
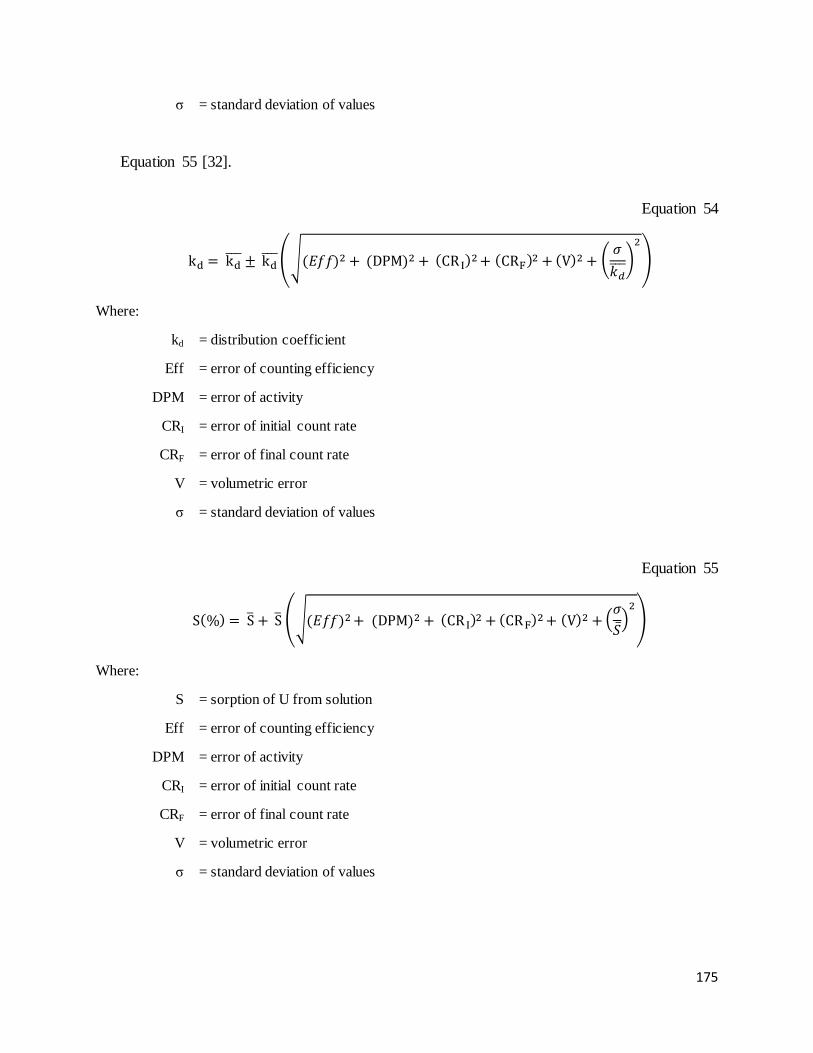
175
σ = standard deviation of values
Equation 55 [32].
Equation 54
kd = kd��� ± kd�����(𝑑𝐸𝐸)2 + (DPM)2 + (CR I)2+ (CRF)2 + (V)2 + �𝜎𝑘𝑟����2
�
Where:
kd = distribution coefficient
Eff = error of counting efficiency
DPM = error of activity
CRI = error of initial count rate
CRF = error of final count rate
V = volumetric error
σ = standard deviation of values
Equation 55
S(%) = S� + S� ��(𝑑𝐸𝐸)2+ (DPM)2 + (CR I)2 + (CRF)2+ (V)2 + �𝜎���2�
Where:
S = sorption of U from solution
Eff = error of counting efficiency
DPM = error of activity
CRI = error of initial count rate
CRF = error of final count rate
V = volumetric error
σ = standard deviation of values
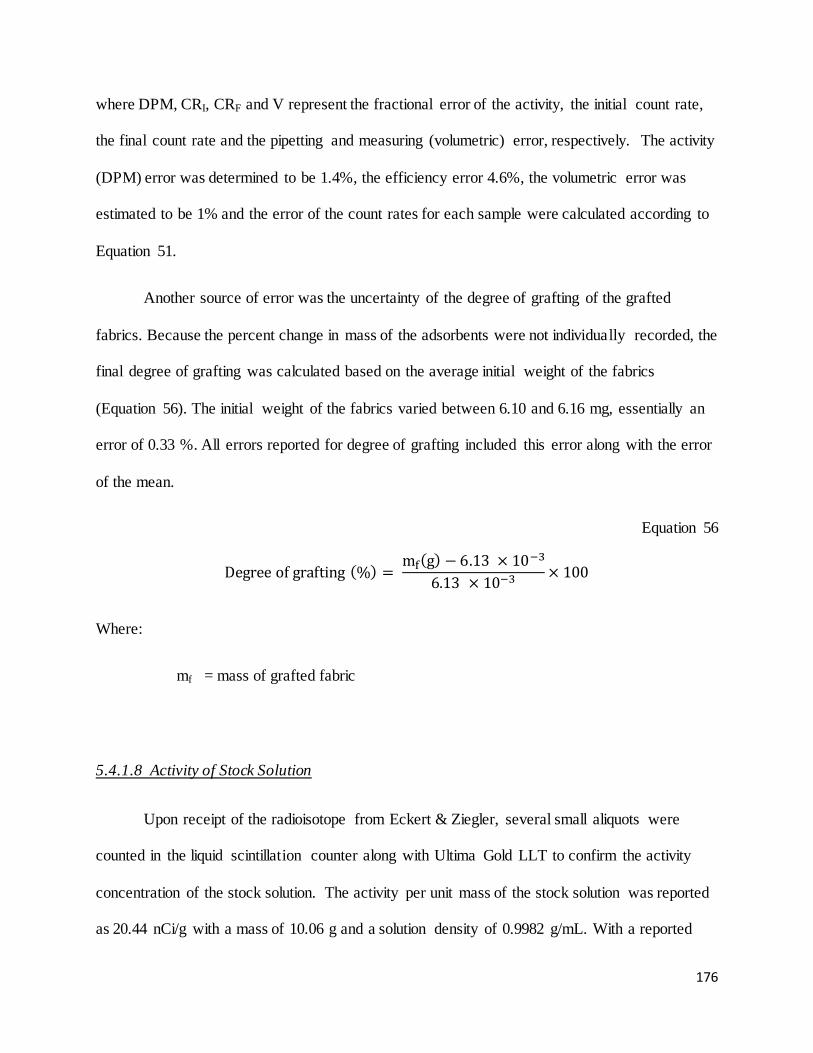
176
where DPM, CRI, CRF and V represent the fractional error of the activity, the initial count rate,
the final count rate and the pipetting and measuring (volumetric) error, respectively. The activity
(DPM) error was determined to be 1.4%, the efficiency error 4.6%, the volumetric error was
estimated to be 1% and the error of the count rates for each sample were calculated according to
Equation 51.
Another source of error was the uncertainty of the degree of grafting of the grafted
fabrics. Because the percent change in mass of the adsorbents were not individually recorded, the
final degree of grafting was calculated based on the average initial weight of the fabrics
(Equation 56). The initial weight of the fabrics varied between 6.10 and 6.16 mg, essentially an
error of 0.33 %. All errors reported for degree of grafting included this error along with the error
of the mean.
Equation 56
Degree of grafting (%) = mf(g) − 6.13 × 10⁻³
6.13 × 10−3 × 100
Where:
mf = mass of grafted fabric
5.4.1.8 Activity of Stock Solution
Upon receipt of the radioisotope from Eckert & Ziegler, several small aliquots were
counted in the liquid scintillation counter along with Ultima Gold LLT to confirm the activity
concentration of the stock solution. The activity per unit mass of the stock solution was reported
as 20.44 nCi/g with a mass of 10.06 g and a solution density of 0.9982 g/mL. With a reported
177
total uncertainty of ± 3.1%, the activity concentration reported was calculated to be 20.48
nCi/mL ± 3.1%.
Ten-µL aliquots of stock solution were each added to 20 mL of Ultima Gold scintillation
cocktail and counted for 30 to 100 minutes in the absence of seawater. The activity concentration
was determined to be 20.45 ± 0.29 [nCi/mL] or 1.26 x 10⁻¹ ± 1.8 x 10⁻³ [DPM/mL] (1.4% error)
based on Equation 52.
5.4.1.9 Cocktail Selection
The role of the scintillation cocktail is to transfer energy from the radioactive sample to
the detector. The counting efficiency of alpha particles with liquid scintillation can approach
100%, however; the efficiency may be lowered or raised by quenching and luminescence [157].
Selection of the most compatible scintillation cocktail for the sample of interest is paramount to
maintaining the highest counting efficiency possible.
The ideal cocktail meets the following criteria:
• Stable dissolution of the radioactive sample without excessive dilution
• 100% efficiency of energy transfer from sample to detector
• Safe and environmentally-friendly
The sample/cocktail mixture should be as homogenous as possible. Ideally, the mixture
would be transparent after vigorous shaking. For samples of very low activity, is it often
desirable to count larger samples volumes to increase the count rate. If the sample loading is too
high, however; a milky, opaque microemulsion may form. The microemulsion may be stable or
may separate into an organic and a liquid phase. This behavior is highly dependent on the
compatibility between the radioactive sample and the scintillation cocktail.
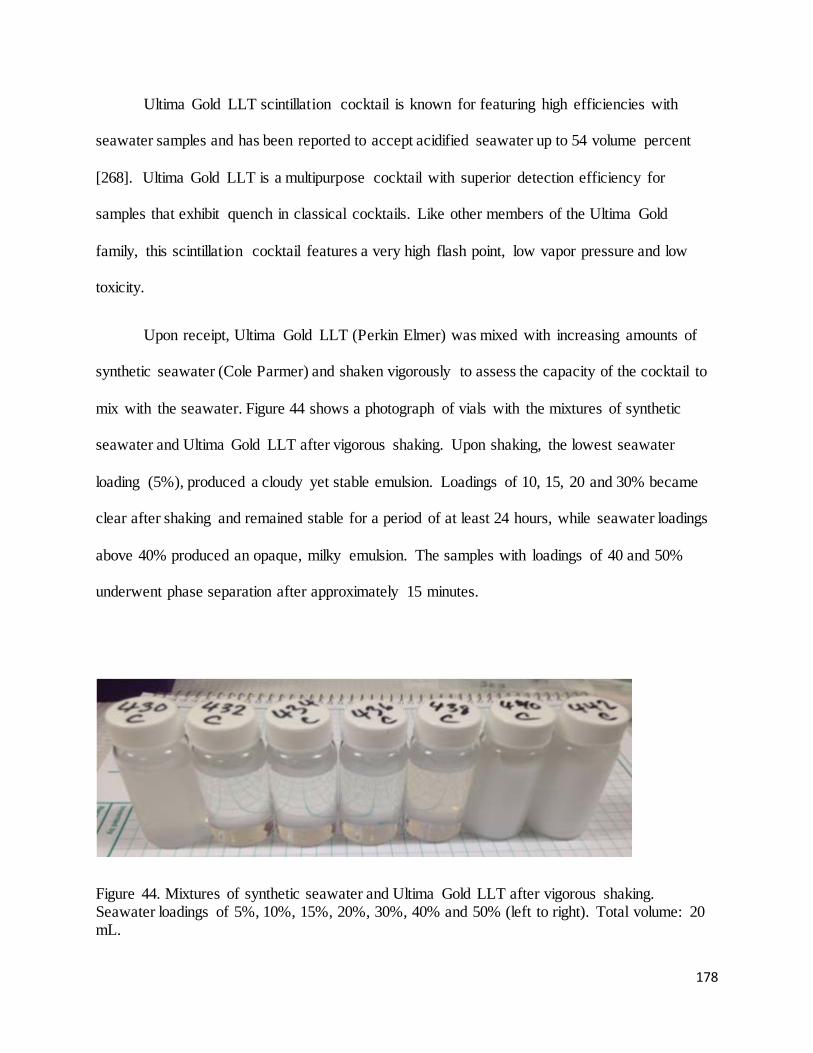
178
Ultima Gold LLT scintillation cocktail is known for featuring high efficiencies with
seawater samples and has been reported to accept acidified seawater up to 54 volume percent
[268]. Ultima Gold LLT is a multipurpose cocktail with superior detection efficiency for
samples that exhibit quench in classical cocktails. Like other members of the Ultima Gold
family, this scintillation cocktail features a very high flash point, low vapor pressure and low
toxicity.
Upon receipt, Ultima Gold LLT (Perkin Elmer) was mixed with increasing amounts of
synthetic seawater (Cole Parmer) and shaken vigorously to assess the capacity of the cocktail to
mix with the seawater. Figure 44 shows a photograph of vials with the mixtures of synthetic
seawater and Ultima Gold LLT after vigorous shaking. Upon shaking, the lowest seawater
loading (5%), produced a cloudy yet stable emulsion. Loadings of 10, 15, 20 and 30% became
clear after shaking and remained stable for a period of at least 24 hours, while seawater loadings
above 40% produced an opaque, milky emulsion. The samples with loadings of 40 and 50%
underwent phase separation after approximately 15 minutes.
Figure 44. Mixtures of synthetic seawater and Ultima Gold LLT after vigorous shaking. Seawater loadings of 5%, 10%, 15%, 20%, 30%, 40% and 50% (left to right). Total volume: 20 mL.
179
5.4.1.10 Counting Efficiency
Quenching and luminescence are known to affect both the pulse height and count rate of
a sample, either increasing or decreasing the counting efficiency. When determining the activity
of an unknown solution, the effects of these factors are also unknown and thus, the activity
cannot be determined without knowledge of the counting efficiency.
The counting efficiency of alpha particles is not typically affected by quenching, rather,
these effects are mainly significant for the counting of beta particles and become more
pronounced at lower particle [157]. Instead, the effect of quench on alpha-emitting radionuclides
is often manifested by a broadening of the peak which is proportional to the level of quench
[157]. Although the pulse height may be reduced under such circumstances, the overall number
of counts (and hence, efficiency) is usually not affected.
To maintain high count rates for samples of low activity, a sample loading of 50% spiked
seawater to 50% scintillation cocktail was used to determine the activity of each seawater
solution post-contact with the adsorbent (Activity F). Because the effects of quench and
luminescence may vary with sample loading, it was important to determine the counting
efficiencies for this sample loading (50%) and the initial sample loading (10%, Activity I)
For this work, efficiency was determined via the method of internal standard. In this
method, identical samples both with and without a known amount of 233U were compared. The
counting efficiency was determined for samples with seawater loadings of 5%, 10%, 15%, 20%,
30%, 40% and 50% of a 20-mL solution at several different concentrations (Table 10). In each
case, the non-background sample was spiked with a known activity of 233U. The counting
efficiency was calculated with Equation 57.
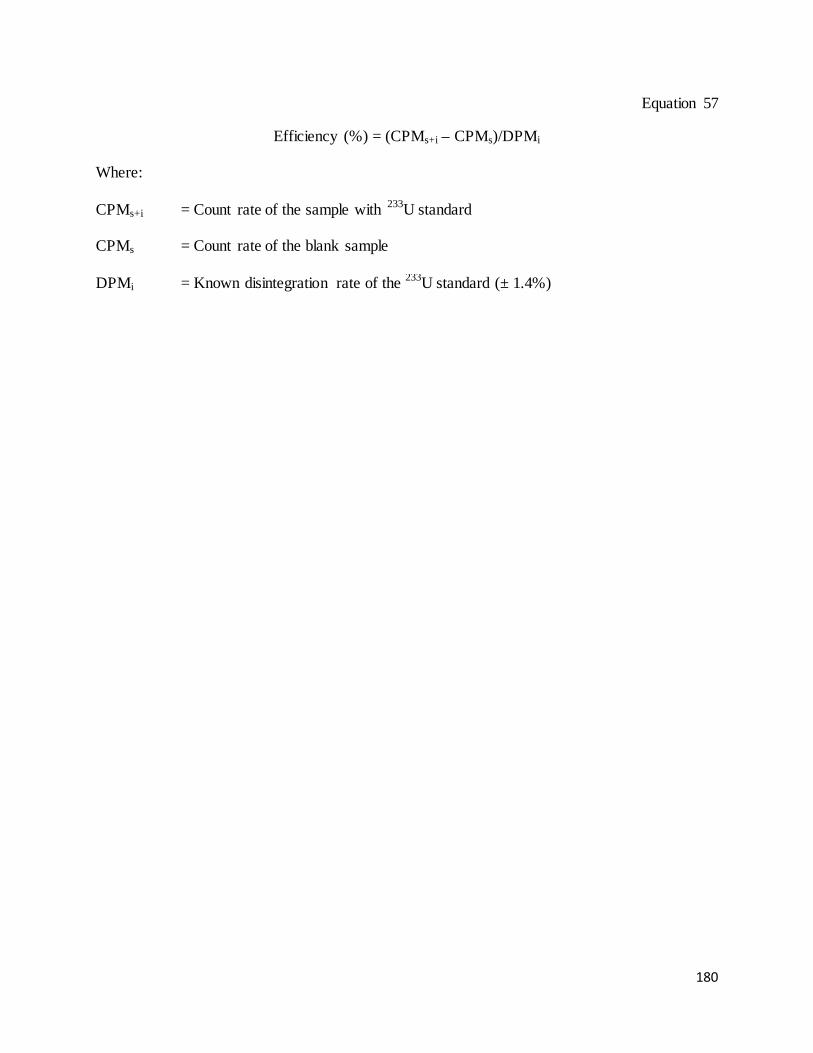
180
Equation 57 Efficiency (%) = (CPMs+i – CPMs)/DPMi
Where:
CPMs+i = Count rate of the sample with 233U standard
CPMs = Count rate of the blank sample
DPMi = Known disintegration rate of the 233U standard (± 1.4%)
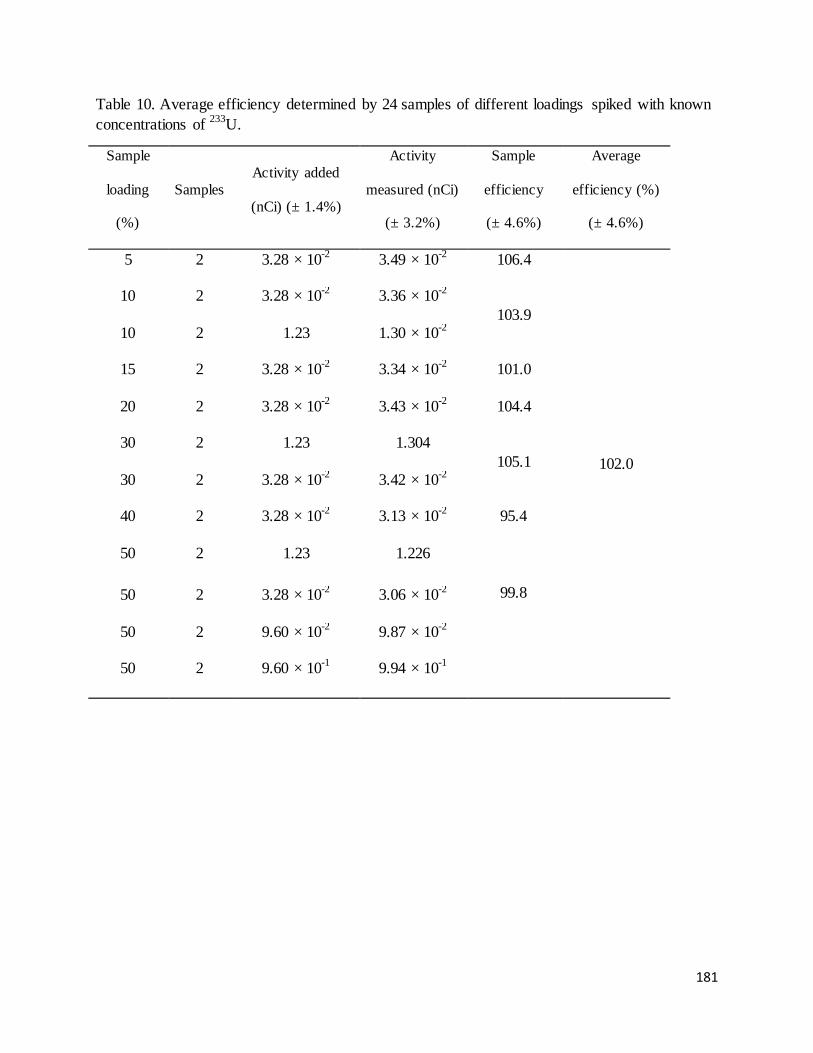
181
Table 10. Average efficiency determined by 24 samples of different loadings spiked with known concentrations of 233U.
Sample
loading
(%)
Samples Activity added
(nCi) (± 1.4%)
Activity
measured (nCi)
(± 3.2%)
Sample
efficiency
(± 4.6%)
Average
efficiency (%)
(± 4.6%)
5 2 3.28 × 10⁻² 3.49 × 10⁻² 106.4
102.0
10 2 3.28 × 10⁻² 3.36 × 10⁻² 103.9
10 2 1.23 1.30 × 10⁻²
15 2 3.28 × 10⁻² 3.34 × 10⁻² 101.0
20 2 3.28 × 10⁻² 3.43 × 10⁻² 104.4
30 2 1.23 1.304 105.1
30 2 3.28 × 10⁻² 3.42 × 10⁻²
40 2 3.28 × 10⁻² 3.13 × 10⁻² 95.4
50 2 1.23 1.226
99.8
50 2 3.28 × 10⁻² 3.06 × 10⁻²
50 2 9.60 × 10⁻² 9.87 × 10⁻²
50 2 9.60 × 10⁻¹ 9.94 × 10⁻¹
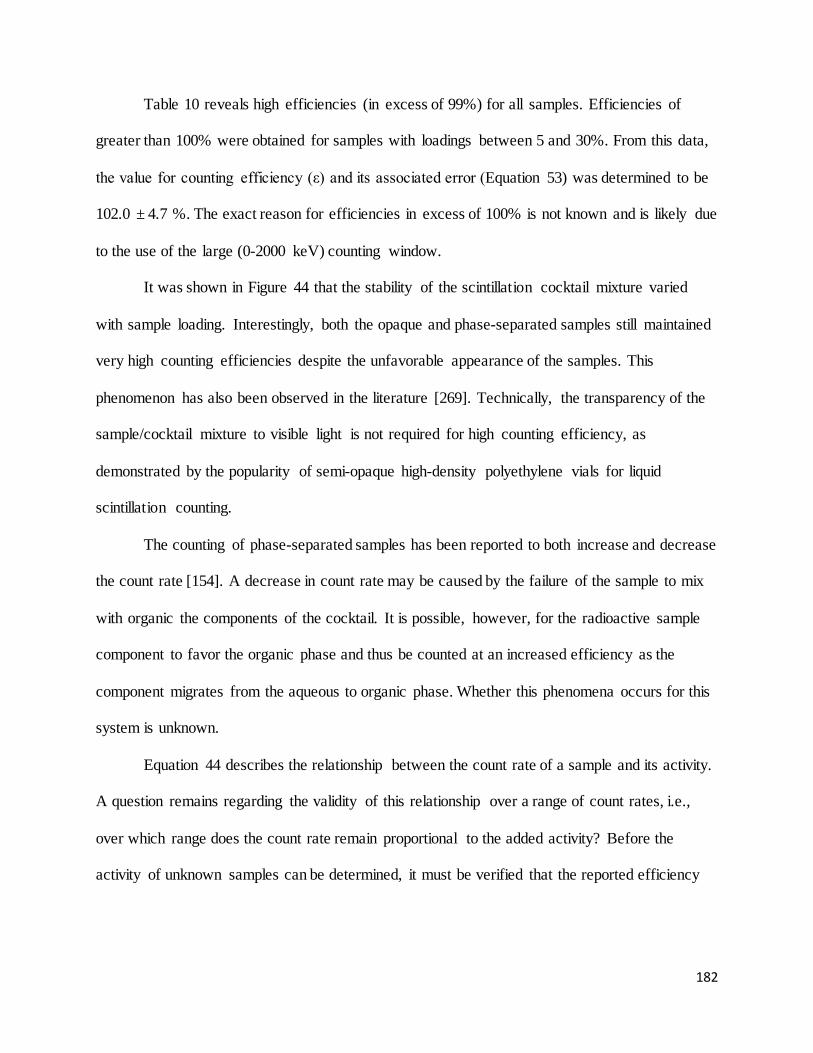
182
Table 10 reveals high efficiencies (in excess of 99%) for all samples. Efficiencies of
greater than 100% were obtained for samples with loadings between 5 and 30%. From this data,
the value for counting efficiency (ε) and its associated error (Equation 53) was determined to be
102.0 ± 4.7 %. The exact reason for efficiencies in excess of 100% is not known and is likely due
to the use of the large (0-2000 keV) counting window.
It was shown in Figure 44 that the stability of the scintillation cocktail mixture varied
with sample loading. Interestingly, both the opaque and phase-separated samples still maintained
very high counting efficiencies despite the unfavorable appearance of the samples. This
phenomenon has also been observed in the literature [269]. Technically, the transparency of the
sample/cocktail mixture to visible light is not required for high counting efficiency, as
demonstrated by the popularity of semi-opaque high-density polyethylene vials for liquid
scintillation counting.
The counting of phase-separated samples has been reported to both increase and decrease
the count rate [154]. A decrease in count rate may be caused by the failure of the sample to mix
with organic the components of the cocktail. It is possible, however, for the radioactive sample
component to favor the organic phase and thus be counted at an increased efficiency as the
component migrates from the aqueous to organic phase. Whether this phenomena occurs for this
system is unknown.
Equation 44 describes the relationship between the count rate of a sample and its activity.
A question remains regarding the validity of this relationship over a range of count rates, i.e.,
over which range does the count rate remain proportional to the added activity? Before the
activity of unknown samples can be determined, it must be verified that the reported efficiency
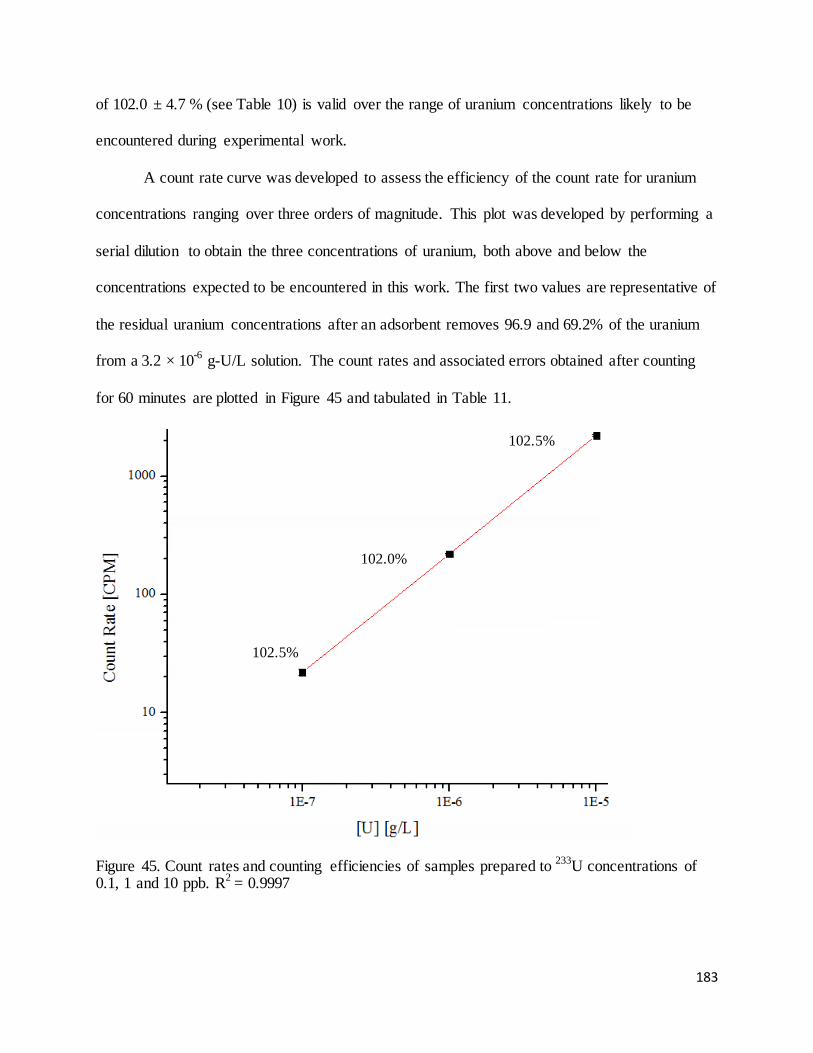
183
of 102.0 ± 4.7 % (see Table 10) is valid over the range of uranium concentrations likely to be
encountered during experimental work.
A count rate curve was developed to assess the efficiency of the count rate for uranium
concentrations ranging over three orders of magnitude. This plot was developed by performing a
serial dilution to obtain the three concentrations of uranium, both above and below the
concentrations expected to be encountered in this work. The first two values are representative of
the residual uranium concentrations after an adsorbent removes 96.9 and 69.2% of the uranium
from a 3.2 × 10⁻⁶ g-U/L solution. The count rates and associated errors obtained after counting
for 60 minutes are plotted in Figure 45 and tabulated in Table 11.
Figure 45. Count rates and counting efficiencies of samples prepared to 233U concentrations of 0.1, 1 and 10 ppb. R2 = 0.9997
102.5%
102.0%
102.5%
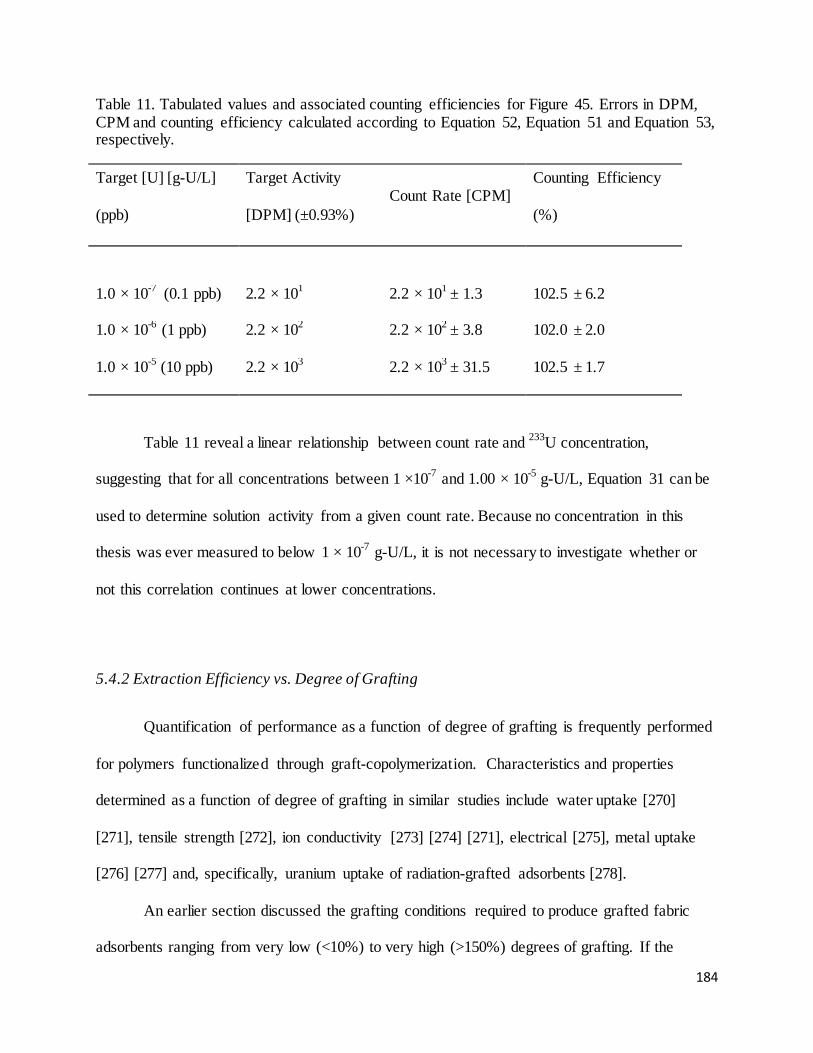
184
Table 11. Tabulated values and associated counting efficiencies for Figure 45. Errors in DPM, CPM and counting efficiency calculated according to Equation 52, Equation 51 and Equation 53, respectively.
Target [U] [g-U/L]
(ppb)
Target Activity
[DPM] (±0.93%) Count Rate [CPM]
Counting Efficiency
(%)
1.0 × 10⁻⁷ (0.1 ppb) 2.2 × 101 2.2 × 101 ± 1.3 102.5 ± 6.2
1.0 × 10⁻⁶ (1 ppb) 2.2 × 10² 2.2 × 10² ± 3.8 102.0 ± 2.0
1.0 × 10⁻⁵ (10 ppb) 2.2 × 10³ 2.2 × 10³ ± 31.5 102.5 ± 1.7
Table 11 reveal a linear relationship between count rate and 233U concentration,
suggesting that for all concentrations between 1 ×10⁻⁷ and 1.00 × 10⁻⁵ g-U/L, Equation 31 can be
used to determine solution activity from a given count rate. Because no concentration in this
thesis was ever measured to below 1 × 10⁻⁷ g-U/L, it is not necessary to investigate whether or
not this correlation continues at lower concentrations.
5.4.2 Extraction Efficiency vs. Degree of Grafting
Quantification of performance as a function of degree of grafting is frequently performed
for polymers functionalized through graft-copolymerization. Characteristics and properties
determined as a function of degree of grafting in similar studies include water uptake [270]
[271], tensile strength [272], ion conductivity [273] [274] [271], electrical [275], metal uptake
[276] [277] and, specifically, uranium uptake of radiation-grafted adsorbents [278].
An earlier section discussed the grafting conditions required to produce grafted fabric
adsorbents ranging from very low (<10%) to very high (>150%) degrees of grafting. If the
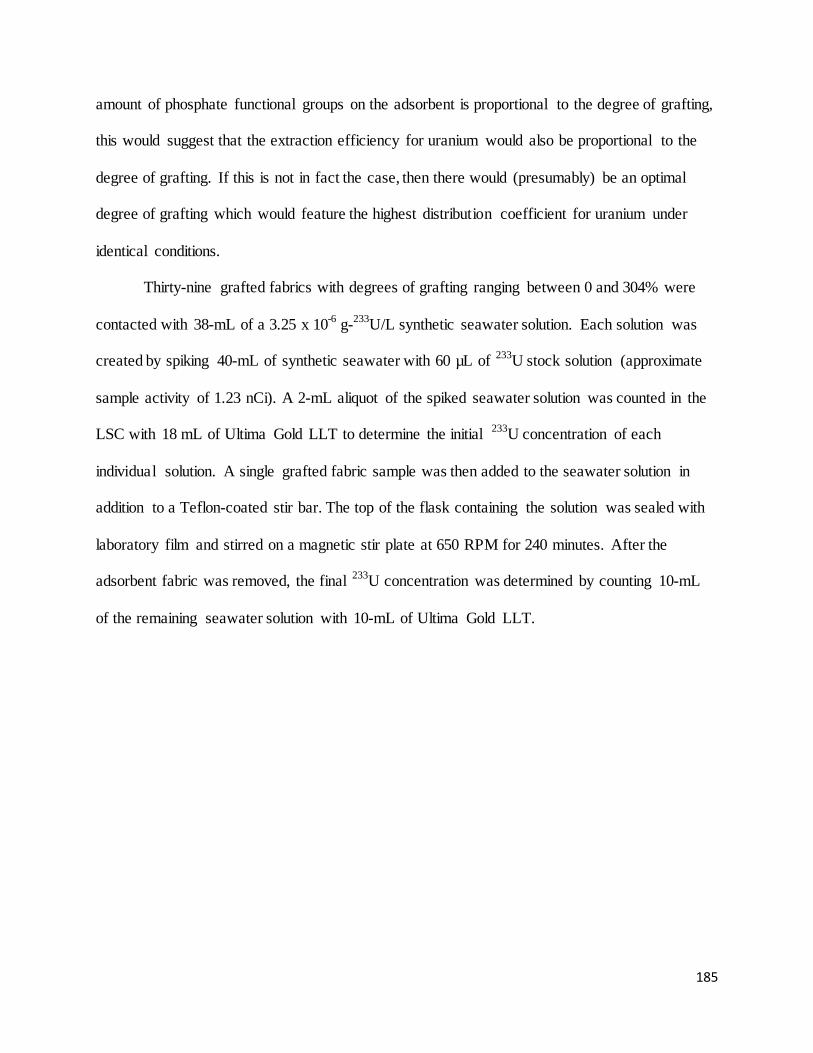
185
amount of phosphate functional groups on the adsorbent is proportional to the degree of grafting,
this would suggest that the extraction efficiency for uranium would also be proportional to the
degree of grafting. If this is not in fact the case, then there would (presumably) be an optimal
degree of grafting which would feature the highest distribution coefficient for uranium under
identical conditions.
Thirty-nine grafted fabrics with degrees of grafting ranging between 0 and 304% were
contacted with 38-mL of a 3.25 x 10⁻⁶ g-233U/L synthetic seawater solution. Each solution was
created by spiking 40-mL of synthetic seawater with 60 µL of 233U stock solution (approximate
sample activity of 1.23 nCi). A 2-mL aliquot of the spiked seawater solution was counted in the
LSC with 18 mL of Ultima Gold LLT to determine the initial 233U concentration of each
individual solution. A single grafted fabric sample was then added to the seawater solution in
addition to a Teflon-coated stir bar. The top of the flask containing the solution was sealed with
laboratory film and stirred on a magnetic stir plate at 650 RPM for 240 minutes. After the
adsorbent fabric was removed, the final 233U concentration was determined by counting 10-mL
of the remaining seawater solution with 10-mL of Ultima Gold LLT.
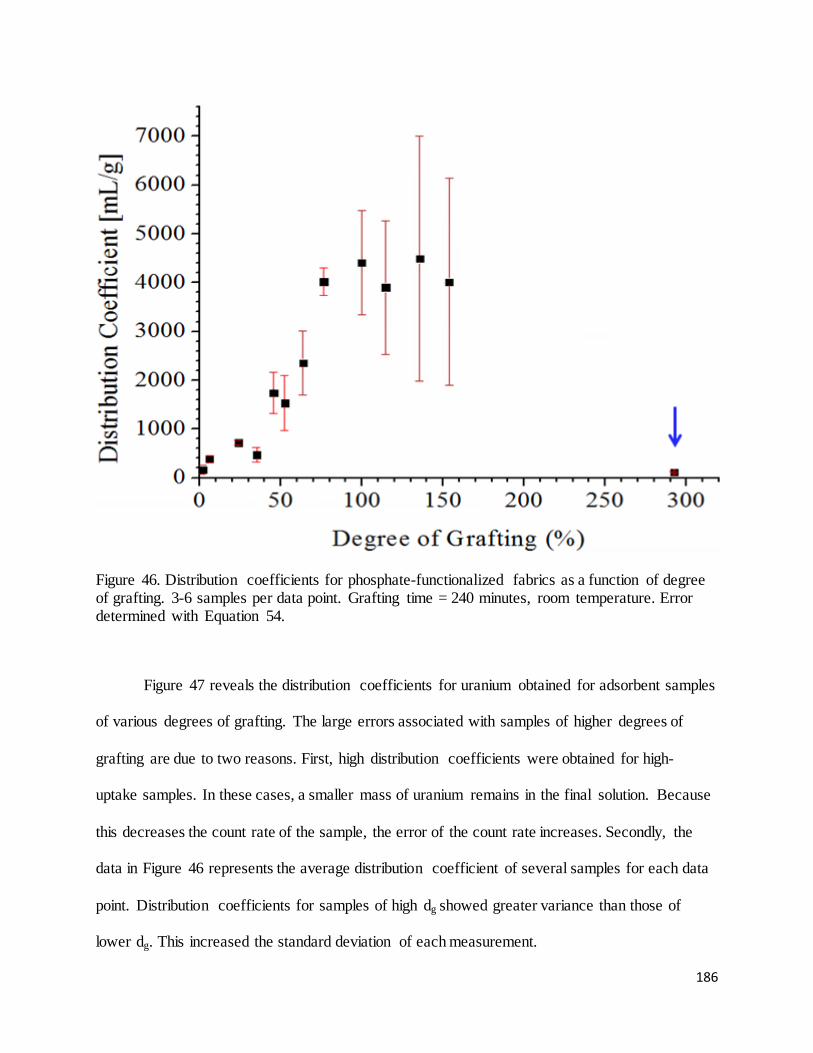
186
Figure 46. Distribution coefficients for phosphate-functionalized fabrics as a function of degree of grafting. 3-6 samples per data point. Grafting time = 240 minutes, room temperature. Error determined with Equation 54.
Figure 47 reveals the distribution coefficients for uranium obtained for adsorbent samples
of various degrees of grafting. The large errors associated with samples of higher degrees of
grafting are due to two reasons. First, high distribution coefficients were obtained for high-
uptake samples. In these cases, a smaller mass of uranium remains in the final solution. Because
this decreases the count rate of the sample, the error of the count rate increases. Secondly, the
data in Figure 46 represents the average distribution coefficient of several samples for each data
point. Distribution coefficients for samples of high dg showed greater variance than those of
lower dg. This increased the standard deviation of each measurement.
187
The plateau and subsequent decrease in extraction efficiency could possibly be explained
by increasingly higher degrees of homopolymerization above 70% degree of grafting. At degrees
of grafting below 76%, the loading capacity is shown to increase with degree of grafting,
indicating an increase in the number of available reactive sites. After this point, the loading
capacity is no longer correlated with the adsorbent’s degree of grafting. It is likely that although
the degree of grafting continues to increase, the number of reactive surface sites available for
complexing reaches a maximum and eventually begins to decrease. This observation is related to
the amount of homopolymer on the grafted fabric and can be easily observed with SEM.
As the degree of grafting of fabric increases beyond approximately 60%, the three-
dimensional features of the fibers on the adsorbent become obscured by thick layers of
homopolymer, ultimately reducing the surface area of the adsorbent. Because adsorption is likely
limited to the surface of the adsorbent, an overall reduction in surface area may reduce the
adsorption capacity even though increasingly larger amounts of monomer are grafted.
The predicted behavior of the adsorption capacity of the grafted fabrics as a function of
degree of grafting can be summarized as follows. The surface features described were observed
visually or with optical and scanning electron microscopy.
At low degrees of grafting (<60%), the three-dimensional surface structure of the
nonwoven fabric is well defined. This allows the uranyl ions to freely penetrate into the fabric
surface with little steric hindrance. Loading capacity is still limited due to less overall phosphate
functionalization.
• As the degree of grafting increases above 60%, the thickness of the homopolymer
layer increases and the fiber structure of the fabric becomes less distinct. Despite
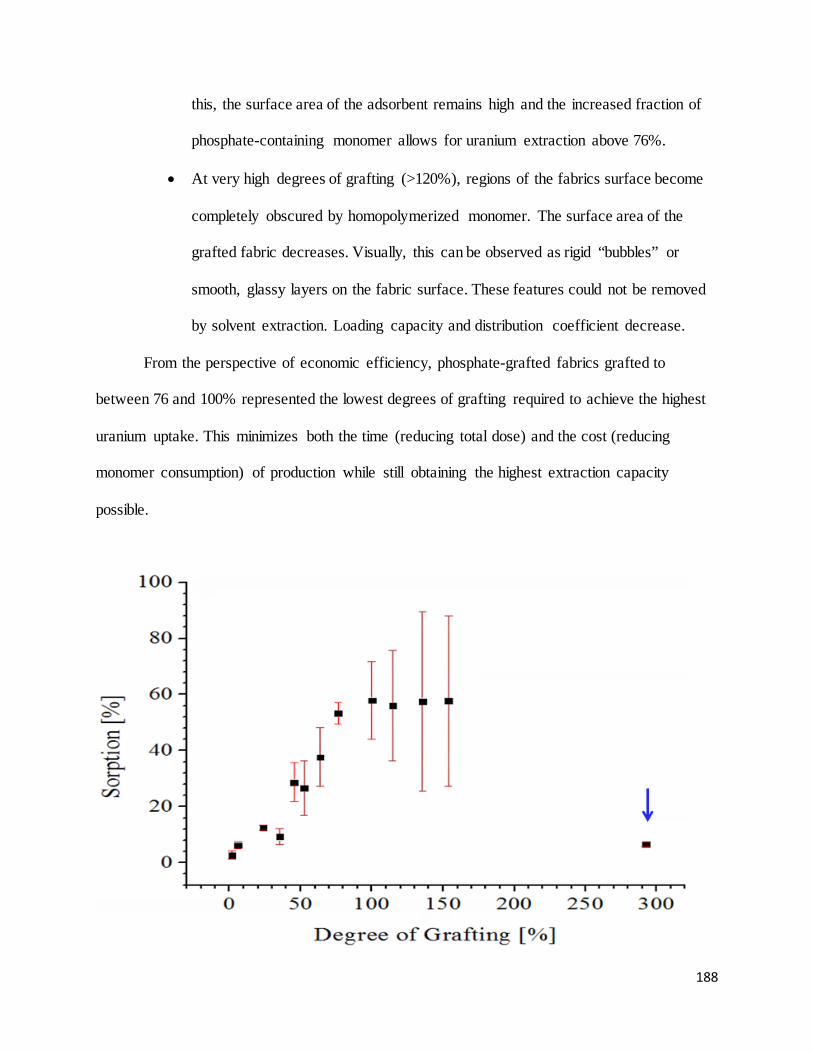
188
this, the surface area of the adsorbent remains high and the increased fraction of
phosphate-containing monomer allows for uranium extraction above 76%.
• At very high degrees of grafting (>120%), regions of the fabrics surface become
completely obscured by homopolymerized monomer. The surface area of the
grafted fabric decreases. Visually, this can be observed as rigid “bubbles” or
smooth, glassy layers on the fabric surface. These features could not be removed
by solvent extraction. Loading capacity and distribution coefficient decrease.
From the perspective of economic efficiency, phosphate-grafted fabrics grafted to
between 76 and 100% represented the lowest degrees of grafting required to achieve the highest
uranium uptake. This minimizes both the time (reducing total dose) and the cost (reducing
monomer consumption) of production while still obtaining the highest extraction capacity
possible.
189
Figure 47. Percentage of uranium removed from a 3.25 ppb solution of 233U in synthetic seawater by phosphate-functionalized fabrics as a function of degree of grafting. 3-6 samples per data point. Grafting time = 240 minutes, room temperature. Error determined with
Figure 47 shows the uranium uptake capacity of the grafted adsorbents from a 32 mL
volume of 3.25 ppb 233U in synthetic seawater. The uptake of uranium for samples of dg between
0 and 38% was very poor, not exceeding 15% sorption in any case. The extraction efficiency
increased as degrees of grafting were increased between 40 and 75%. Over this region, the
sorption capacity was observed to increase over 250%. Distribution coefficient and sorption
plateaued at approximately 76% degree of grafting, with no additional increases in these values
observed between 114 and 154% grafting. A set of three samples with an average dg of 292%
featured very poor extraction capacity.
The plateau in percent sorption indicates that the maximum uranium uptake capacity is
hindered by the competition between uranium and competing seawater ions for complexing sites
on the adsorbent. This was confirmed in the following section by which reveals that increasing
the contact time between the adsorbent and the spiked seawater solution also does not produce an
increase uranium uptake beyond 80%. Results with energy-dispersive x-ray (Section 5.5.3)
further confirm that the seawater ions sodium, chlorine, calcium and magnesium are present on
the adsorbent at atom fractions up to 3.6%.
5.4.3 Loading Kinetics
A rapid rate of adsorption of uranium onto the grafted fabrics would be one of the most
attractive features of the technologies and would be paramount in decreasing the cost of uranium
extraction. This rate is conventionally characterized by determining the “time to equilibrium”,
190
i.e. the time of contact between the adsorbent and the uranium solution required to reach a
steady-state. Two other important considerations are 1) the dominant mechanism behind the
sorption process and 2) the effect of competing ions on the rate of uranium adsorption and the
equilibrium concentration of uranium on the grafted fabrics.
For the adsorption of metal ions from solution, the overall adsorption rate is determined
by the chemical reaction between the ion and the complexing functional group as well as any
involved transport steps [279]. The mechanisms and kinetics of the possible complexation
reactions between the radiation-grafted phosphate functional group and the U(VI) ions found in
seawater are beyond the scope of this dissertation and may be considered by reviewing the work
of Sandino, et. al [280], Geipel et. al [281], Romero-Gonzalez et. al [282] and Gindler [283].
A basic understanding of the dominant adsorption mechanism can be understood by
comparing the experimental data to various adsorption kinetic models. For example, a stronger
correlation of experimental data to the pseudo-second-order model over a diffusion-based model
could suggest that chemisorption, rather than the mass transfer of the ion in the solution, could be
the rate-determining step [284]. The effect of competing ions, while not explicitly studied in this
thesis, can be considered by comparing the equilibrium concentration on the grafted fabric to the
percent sorption of uranium from the seawater solution. This effect is further explored through
EDS analysis (Section 5.5.3).
The rate of uranium adsorption on two sets of grafted fabrics (degrees of grafting of
104.5% and 46.0%, average mass of 12.5 and 9.0 mg) was studied by contacting the adsorbents
with a 38-mL synthetic seawater solution containing 3.25 × 10⁻⁶ g/L of 233U for time intervals
between 30 and 480 minutes. Like the majority of the data in this section, the systems containing
the grafted fabrics in the seawater solutions were sealed with laboratory film and stirred
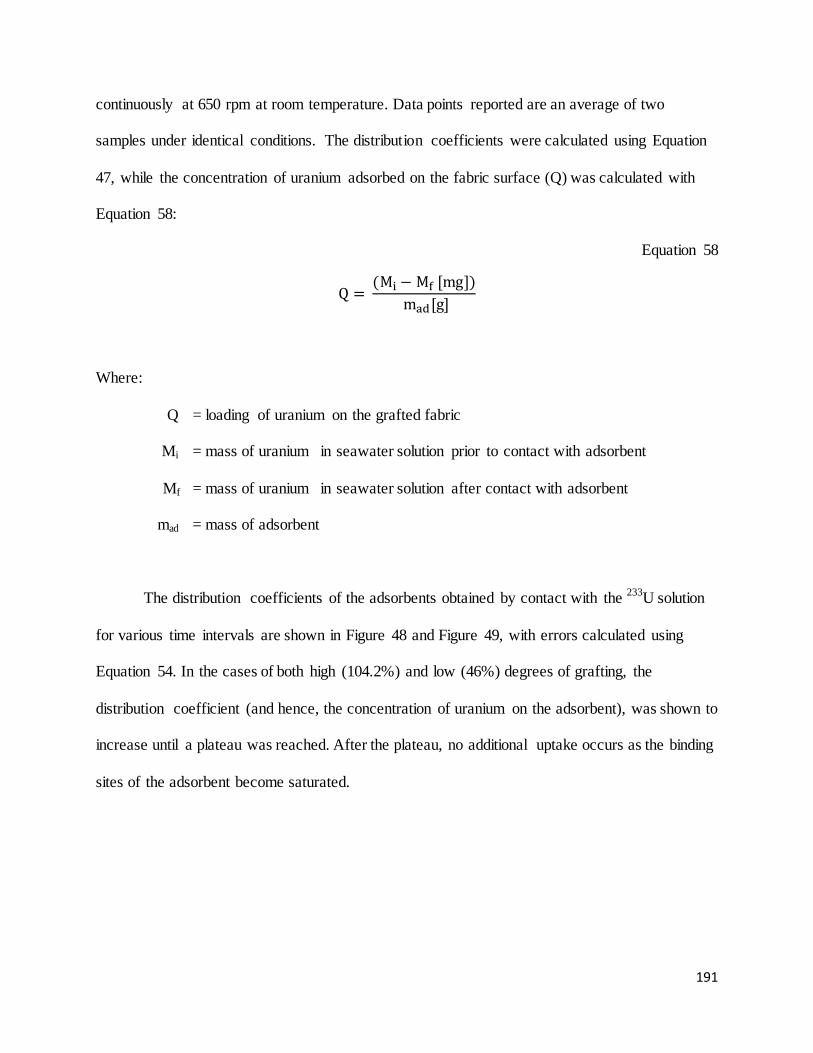
191
continuously at 650 rpm at room temperature. Data points reported are an average of two
samples under identical conditions. The distribution coefficients were calculated using Equation
47, while the concentration of uranium adsorbed on the fabric surface (Q) was calculated with
Equation 58:
Equation 58
Q = (Mi − Mf [mg])
mad[g]
Where:
Q = loading of uranium on the grafted fabric
Mi = mass of uranium in seawater solution prior to contact with adsorbent
Mf = mass of uranium in seawater solution after contact with adsorbent
mad = mass of adsorbent
The distribution coefficients of the adsorbents obtained by contact with the 233U solution
for various time intervals are shown in Figure 48 and Figure 49, with errors calculated using
Equation 54. In the cases of both high (104.2%) and low (46%) degrees of grafting, the
distribution coefficient (and hence, the concentration of uranium on the adsorbent), was shown to
increase until a plateau was reached. After the plateau, no additional uptake occurs as the binding
sites of the adsorbent become saturated.
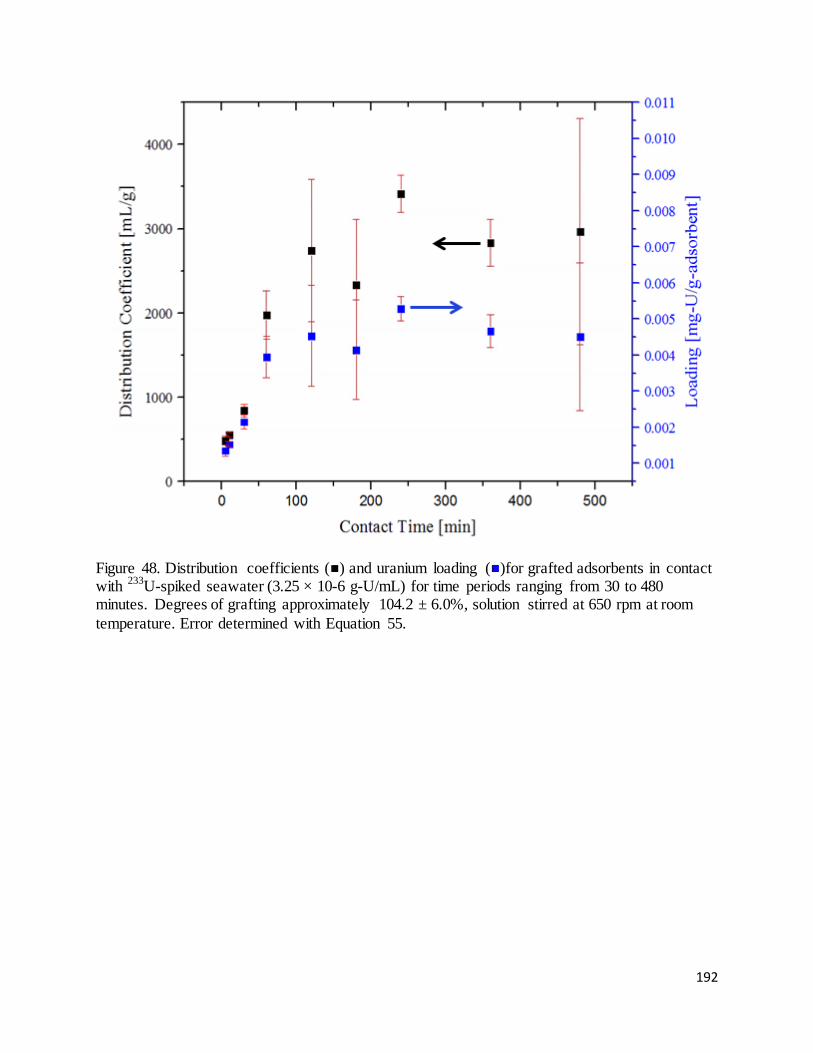
192
Figure 48. Distribution coefficients ( ) and uranium loading ( )for grafted adsorbents in contact with 233U-spiked seawater (3.25 × 10⁻⁶ g-U/mL) for time periods ranging from 30 to 480 minutes. Degrees of grafting approximately 104.2 ± 6.0%, solution stirred at 650 rpm at room temperature. Error determined with Equation 55.
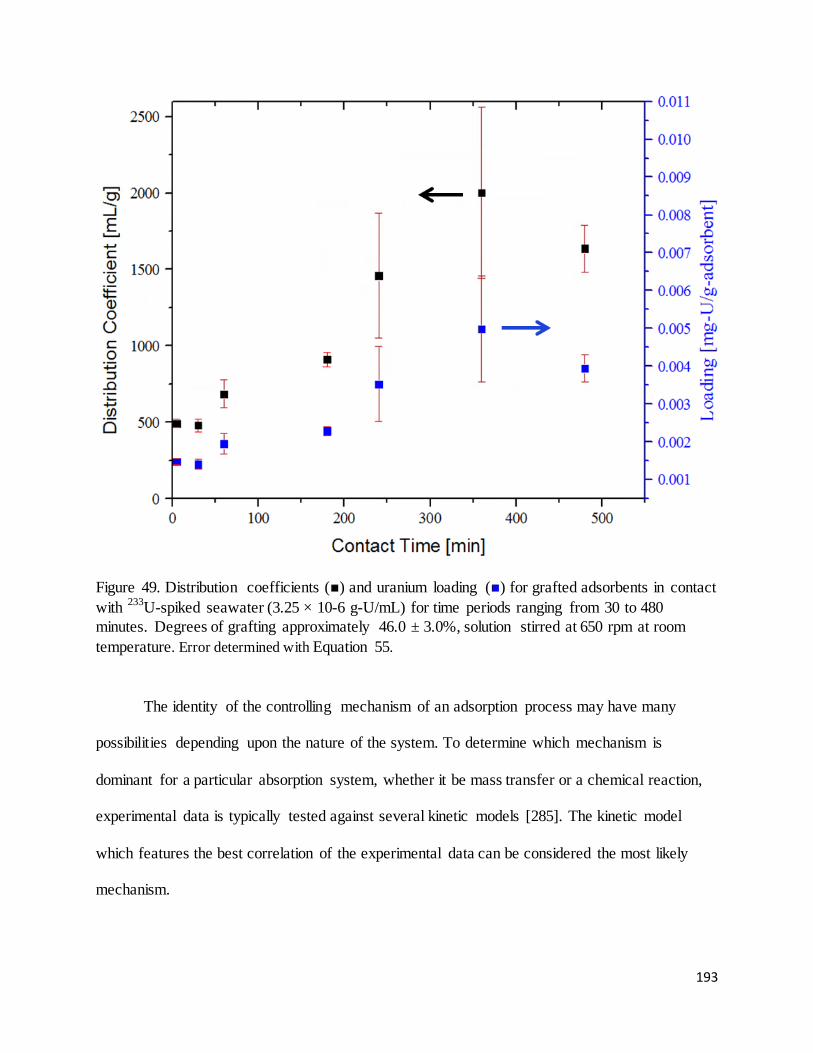
193
Figure 49. Distribution coefficients ( ) and uranium loading ( ) for grafted adsorbents in contact with 233U-spiked seawater (3.25 × 10⁻⁶ g-U/mL) for time periods ranging from 30 to 480 minutes. Degrees of grafting approximately 46.0 ± 3.0%, solution stirred at 650 rpm at room temperature. Error determined with Equation 55.
The identity of the controlling mechanism of an adsorption process may have many
possibilities depending upon the nature of the system. To determine which mechanism is
dominant for a particular absorption system, whether it be mass transfer or a chemical reaction,
experimental data is typically tested against several kinetic models [285]. The kinetic model
which features the best correlation of the experimental data can be considered the most likely
mechanism.
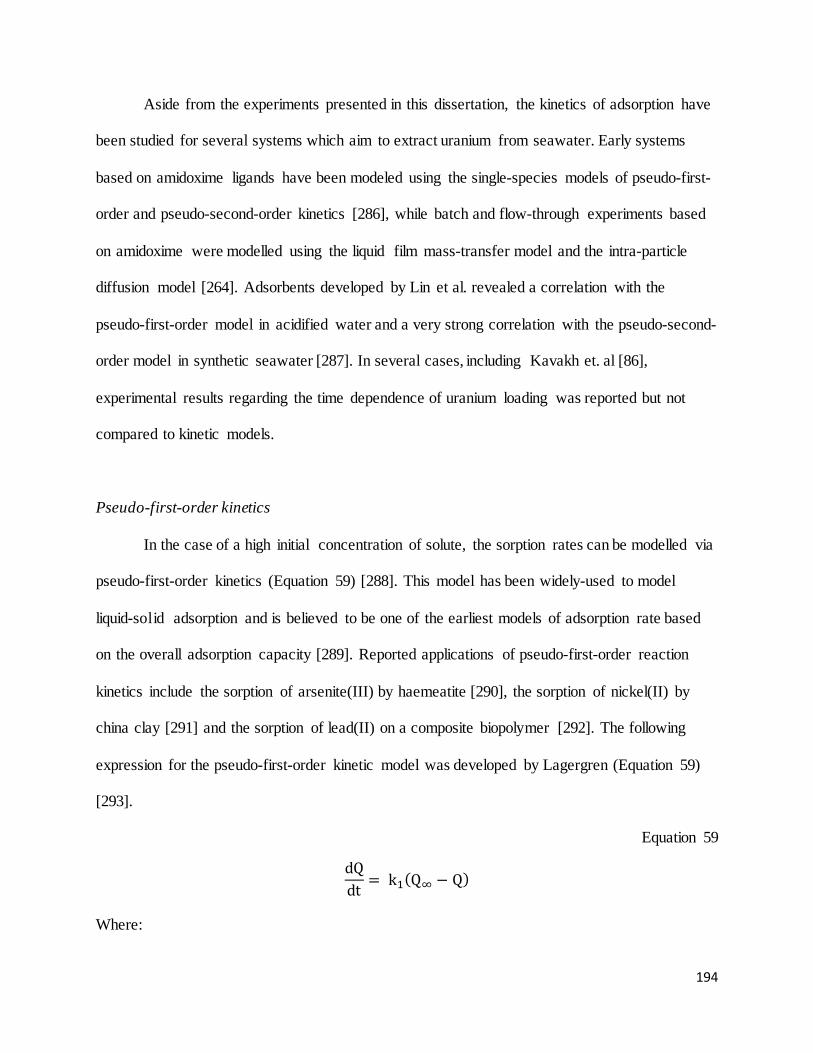
194
Aside from the experiments presented in this dissertation, the kinetics of adsorption have
been studied for several systems which aim to extract uranium from seawater. Early systems
based on amidoxime ligands have been modeled using the single-species models of pseudo-first-
order and pseudo-second-order kinetics [286], while batch and flow-through experiments based
on amidoxime were modelled using the liquid film mass-transfer model and the intra-particle
diffusion model [264]. Adsorbents developed by Lin et al. revealed a correlation with the
pseudo-first-order model in acidified water and a very strong correlation with the pseudo-second-
order model in synthetic seawater [287]. In several cases, including Kavakh et. al [86],
experimental results regarding the time dependence of uranium loading was reported but not
compared to kinetic models.
Pseudo-first-order kinetics
In the case of a high initial concentration of solute, the sorption rates can be modelled via
pseudo-first-order kinetics (Equation 59) [288]. This model has been widely-used to model
liquid-solid adsorption and is believed to be one of the earliest models of adsorption rate based
on the overall adsorption capacity [289]. Reported applications of pseudo-first-order reaction
kinetics include the sorption of arsenite(III) by haemeatite [290], the sorption of nickel(II) by
china clay [291] and the sorption of lead(II) on a composite biopolymer [292]. The following
expression for the pseudo-first-order kinetic model was developed by Lagergren (Equation 59)
[293].
Equation 59 dQdt = k1(Q∞ − Q)
Where:
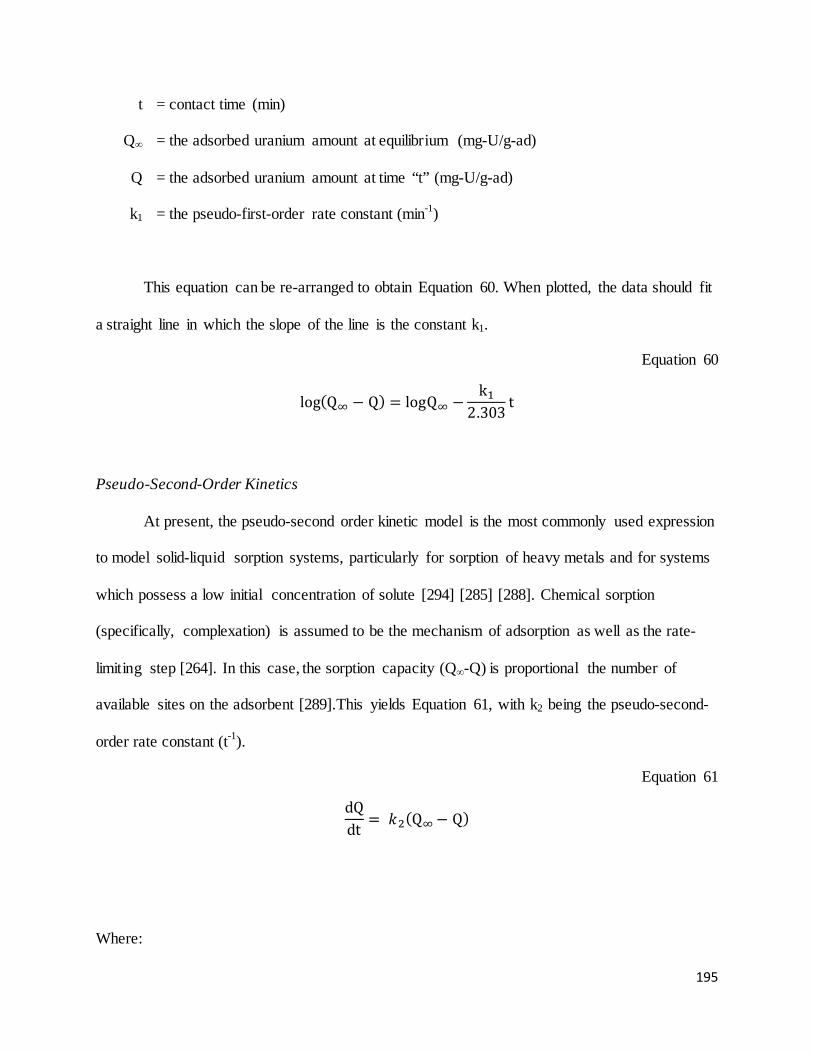
195
t = contact time (min)
Q∞ = the adsorbed uranium amount at equilibrium (mg-U/g-ad)
Q = the adsorbed uranium amount at time “t” (mg-U/g-ad)
k1 = the pseudo-first-order rate constant (min-1)
This equation can be re-arranged to obtain Equation 60. When plotted, the data should fit
a straight line in which the slope of the line is the constant k1.
Equation 60
log(Q∞ − Q) = logQ∞ −k1
2.303 t
Pseudo-Second-Order Kinetics
At present, the pseudo-second order kinetic model is the most commonly used expression
to model solid-liquid sorption systems, particularly for sorption of heavy metals and for systems
which possess a low initial concentration of solute [294] [285] [288]. Chemical sorption
(specifically, complexation) is assumed to be the mechanism of adsorption as well as the rate-
limiting step [264]. In this case, the sorption capacity (Q∞-Q) is proportional the number of
available sites on the adsorbent [289].This yields Equation 61, with k2 being the pseudo-second-
order rate constant (t-1).
Equation 61
dQdt = 𝑘2(Q∞− Q)
Where:
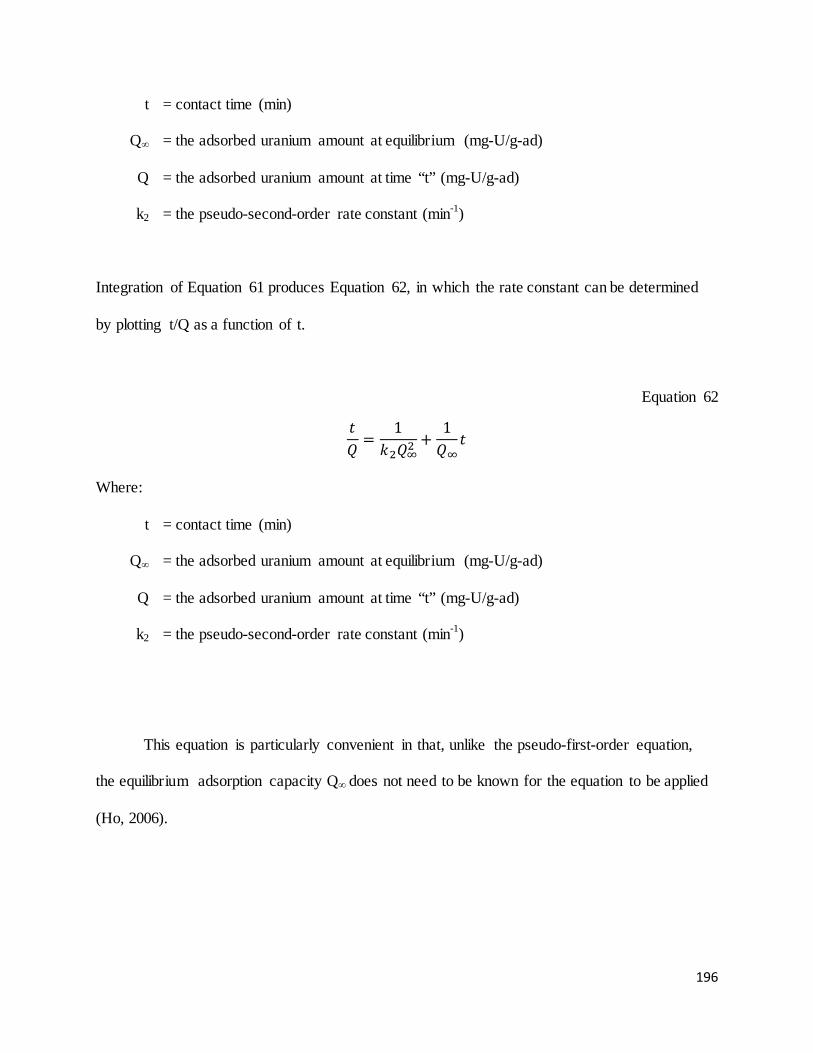
196
t = contact time (min)
Q∞ = the adsorbed uranium amount at equilibrium (mg-U/g-ad)
Q = the adsorbed uranium amount at time “t” (mg-U/g-ad)
k2 = the pseudo-second-order rate constant (min-1)
Integration of Equation 61 produces Equation 62, in which the rate constant can be determined
by plotting t/Q as a function of t.
Equation 62
𝑡𝑄 =
1𝑘2𝑄∞2
+1𝑄∞
𝑡
Where:
t = contact time (min)
Q∞ = the adsorbed uranium amount at equilibrium (mg-U/g-ad)
Q = the adsorbed uranium amount at time “t” (mg-U/g-ad)
k2 = the pseudo-second-order rate constant (min-1)
This equation is particularly convenient in that, unlike the pseudo-first-order equation,
the equilibrium adsorption capacity Q∞ does not need to be known for the equation to be applied
(Ho, 2006).
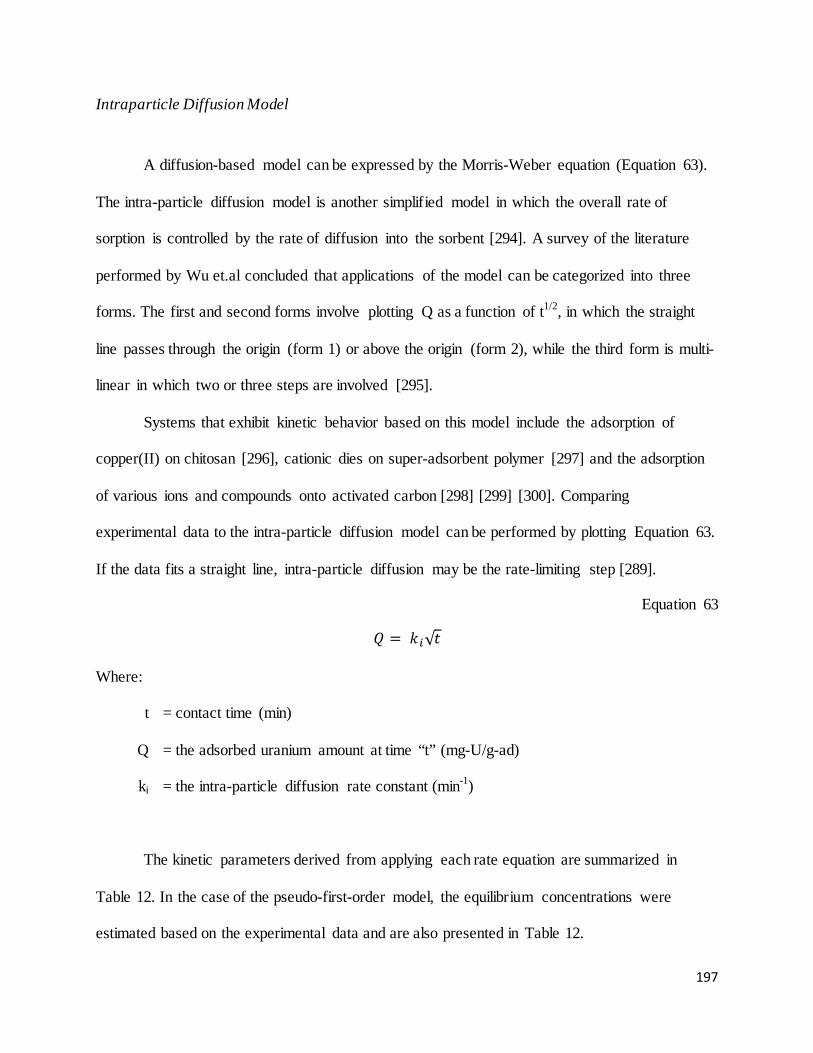
197
Intraparticle Diffusion Model
A diffusion-based model can be expressed by the Morris-Weber equation (Equation 63).
The intra-particle diffusion model is another simplified model in which the overall rate of
sorption is controlled by the rate of diffusion into the sorbent [294]. A survey of the literature
performed by Wu et.al concluded that applications of the model can be categorized into three
forms. The first and second forms involve plotting Q as a function of t1/2, in which the straight
line passes through the origin (form 1) or above the origin (form 2), while the third form is multi-
linear in which two or three steps are involved [295].
Systems that exhibit kinetic behavior based on this model include the adsorption of
copper(II) on chitosan [296], cationic dies on super-adsorbent polymer [297] and the adsorption
of various ions and compounds onto activated carbon [298] [299] [300]. Comparing
experimental data to the intra-particle diffusion model can be performed by plotting Equation 63.
If the data fits a straight line, intra-particle diffusion may be the rate-limiting step [289].
Equation 63
𝑄 = 𝑘𝑖√𝑡
Where:
t = contact time (min)
Q = the adsorbed uranium amount at time “t” (mg-U/g-ad)
ki = the intra-particle diffusion rate constant (min-1)
The kinetic parameters derived from applying each rate equation are summarized in
Table 12. In the case of the pseudo-first-order model, the equilibrium concentrations were
estimated based on the experimental data and are also presented in Table 12.
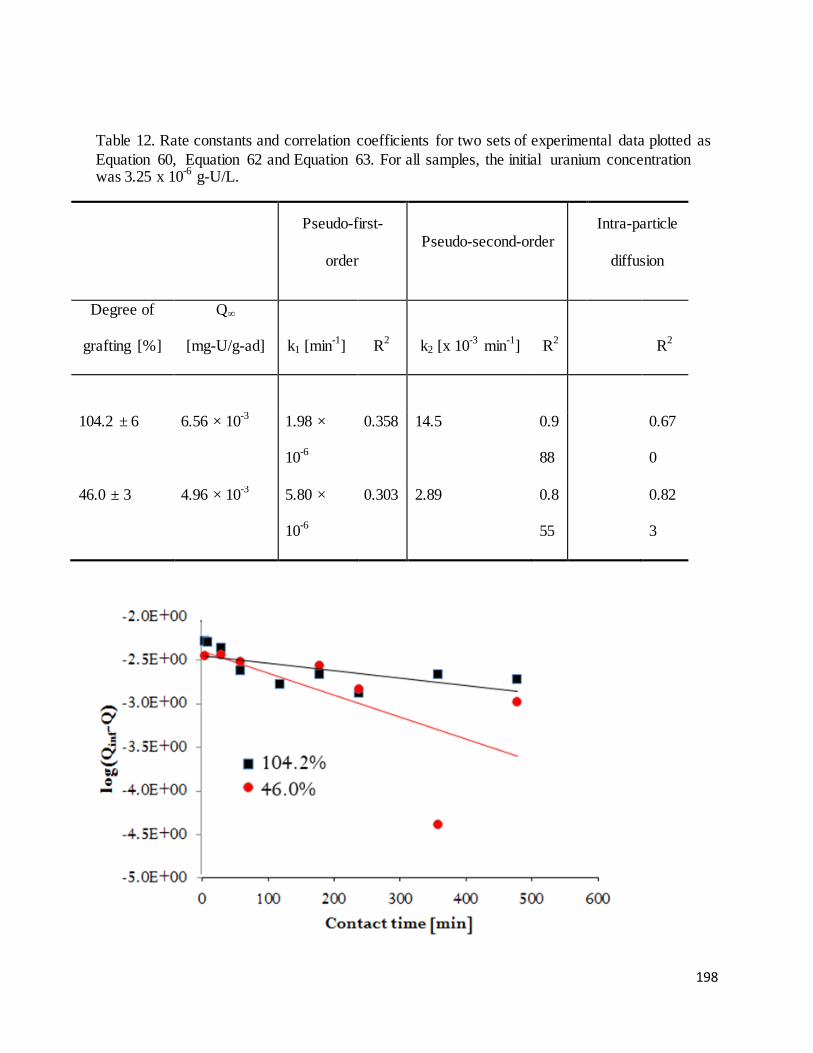
198
Table 12. Rate constants and correlation coefficients for two sets of experimental data plotted as Equation 60, Equation 62 and Equation 63. For all samples, the initial uranium concentration was 3.25 x 10⁻⁶ g-U/L.
Pseudo-first-
order Pseudo-second-order
Intra-particle
diffusion
Degree of
grafting [%]
Q∞
[mg-U/g-ad] k1 [min-1] R2 k2 [x 10-3 min-1] R2 R2
104.2 ± 6 6.56 × 10⁻³ 1.98 ×
10-6
0.358 14.5 0.9
88
0.67
0
46.0 ± 3 4.96 × 10⁻³ 5.80 ×
10-6
0.303 2.89 0.8
55
0.82
3
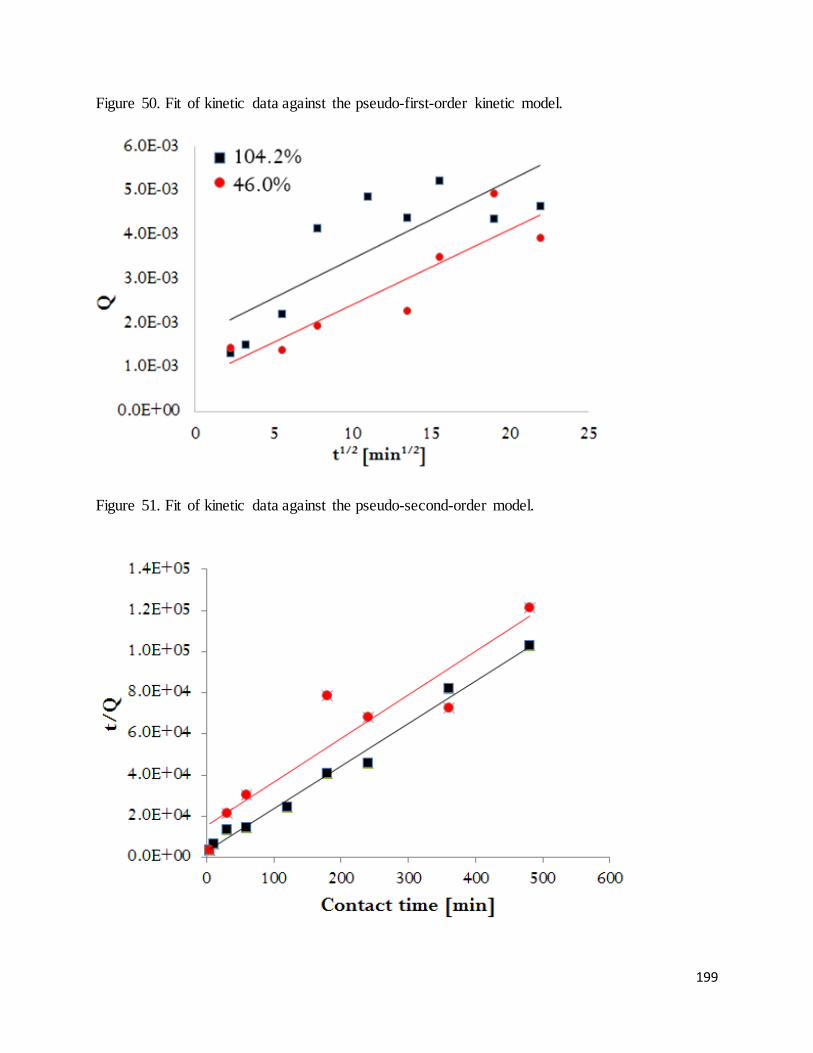
199
Figure 50. Fit of kinetic data against the pseudo-first-order kinetic model.
Figure 51. Fit of kinetic data against the pseudo-second-order model.
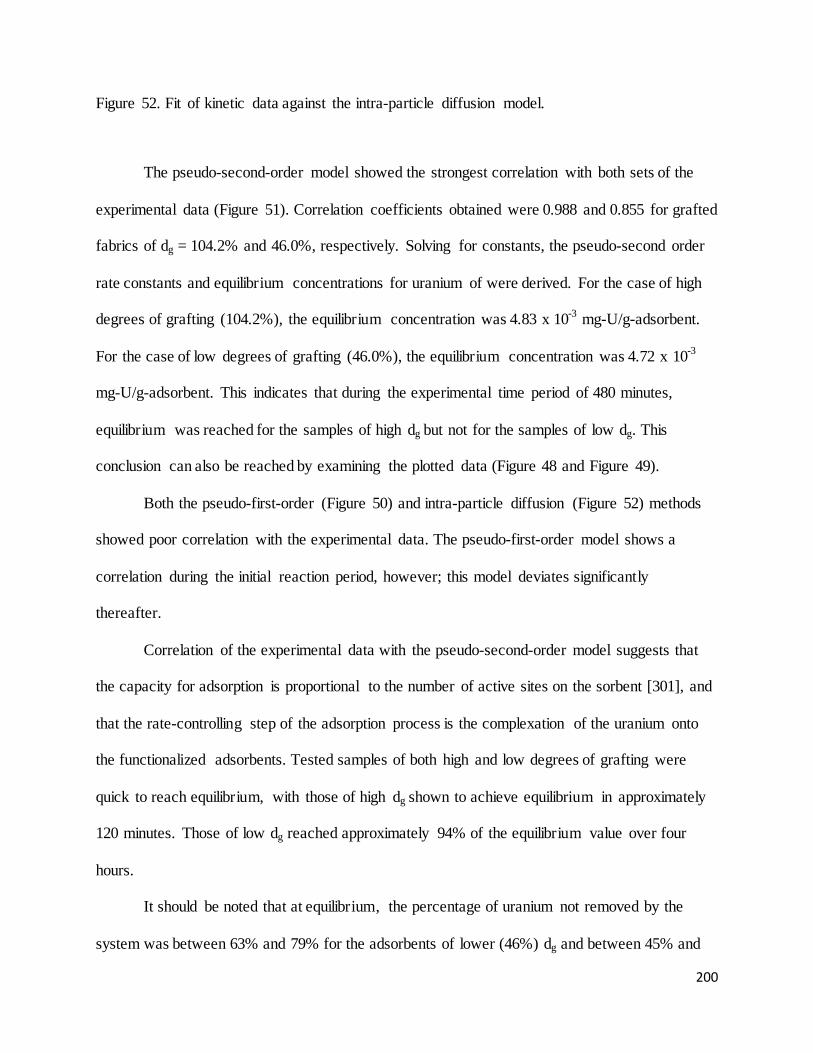
200
Figure 52. Fit of kinetic data against the intra-particle diffusion model.
The pseudo-second-order model showed the strongest correlation with both sets of the
experimental data (Figure 51). Correlation coefficients obtained were 0.988 and 0.855 for grafted
fabrics of dg = 104.2% and 46.0%, respectively. Solving for constants, the pseudo-second order
rate constants and equilibrium concentrations for uranium of were derived. For the case of high
degrees of grafting (104.2%), the equilibrium concentration was 4.83 x 10⁻³ mg-U/g-adsorbent.
For the case of low degrees of grafting (46.0%), the equilibrium concentration was 4.72 x 10⁻³
mg-U/g-adsorbent. This indicates that during the experimental time period of 480 minutes,
equilibrium was reached for the samples of high dg but not for the samples of low dg. This
conclusion can also be reached by examining the plotted data (Figure 48 and Figure 49).
Both the pseudo-first-order (Figure 50) and intra-particle diffusion (Figure 52) methods
showed poor correlation with the experimental data. The pseudo-first-order model shows a
correlation during the initial reaction period, however; this model deviates significantly
thereafter.
Correlation of the experimental data with the pseudo-second-order model suggests that
the capacity for adsorption is proportional to the number of active sites on the sorbent [301], and
that the rate-controlling step of the adsorption process is the complexation of the uranium onto
the functionalized adsorbents. Tested samples of both high and low degrees of grafting were
quick to reach equilibrium, with those of high dg shown to achieve equilibrium in approximately
120 minutes. Those of low dg reached approximately 94% of the equilibrium value over four
hours.
It should be noted that at equilibrium, the percentage of uranium not removed by the
system was between 63% and 79% for the adsorbents of lower (46%) dg and between 45% and
201
67% for the adsorbents grafted to higher (104.2%) dg. This indicates that the adsorbing sites on
the grafted fabrics were completely consumed before the uranium available in the solution could
be further depleted. Given the presence of non-uranium ions such as Mg, Na and Al in
extremely-high concentrations in seawater, it should be considered that these ions may be
competing for adsorption sites and may ultimately limit the capacity for uranium adsorption at
low uranium concentrations.
Despite this hindrance, experimentation with these competing ions is necessary in order
to understand the behavior of the grafted adsorbents in real seawater. Section 5.5.3 describes the
Energy-Dispersive X-ray (EDS) analysis of a grafted fabric after contact with the 233U-spiked
seawater. Many elements, including Mg, Na and Cl, were discovered on the surface of the
grafted fabric at concentrations far exceeding uranium.
Alternatively, the affinity of the adsorbent for ions other than uranium could be
considered an advantage if these ions are either desired as minerals or to be removed for
remediation purposes. The simultaneous extraction of uranium along with As and V [259], Ti,
Co, Ni, and Pb [12] has been reported using functionalized polymeric adsorbents.
For any future work, it is strongly suggested to compare the kinetics of adsorption
between seawater systems containing various concentrations of 233U. Kinetic studies have been
perform on many adsorbents for uranium, but comparison of the time-to-equilibrium of the
grafted fabrics described to that of other technologies requires testing of the grafted fabrics at
similar (higher) uranium concentrations. In addition to affecting the time-to-equilibrium, it has
been mentioned in several published studies that a change in ion concentration may affect the
sorption behavior of a system. For example, Azizian et al. predicts that a sorption process may
follow pseudo-first-order kinetics at high solute concentrations and pseudo-second order kinetics
202
and lower solute concentrations [288]. The kinetic behavior of the phosphate-grafted adsorbents
under conditions of very high uranium concentration may also provide information on how the
equilibrium concentration is effected by the presence of competing ions.
5.4.4 Extraction Temperature
A change in extraction temperature may have several effects. For one, it may alter the
equilibrium capacity of the adsorbent. An increase in temperature has been observed to increase
the rate and capacity of uranium adsorption from seawater in several studies [264].
To assess the effects of temperature on the phosphate-grafted nylon adsorbents,
distribution coefficients for six samples (dg = 90.7 ± 1.9 %) were determined at three different
extraction temperatures, low (3.1 ± 1.7 °C), intermediate (22.3 ± 0.5°C) and high (39.1 ± 7.9 °C).
Temperatures were selected to simulate the range of natural coastal seawater
temperatures. The global average seawater temperature (20th century average) is 15.5 °C [302].
The lowest temperatures are found in the Earth’s polar regions, where seawater coexists with ice
and its temperatures can be as low as -5 °C [303]. In certain regions, the temperature of shallow
coastal waters can reach 32 °C [304], with temperatures sometimes exceeding 38 °C.
All grafted fabrics were contacted with synthetic seawater (3.25 x 10⁻⁶ g-233U/L) in a
stirred solution for 240 minutes. Intermediate temperatures were achieved by performing the
extraction at room temperature. The highest temperatures were achieved with use of a stirring-
heating combination plate, which produced the largest variations in temperature of the entire
experiment (between 30.7 and 52.8 °C). Low-temperature data was obtained by immersing the
flask containing the adsorbent-seawater system in an ice bath and replacing the ice at 30 minute
intervals. Regardless of the extraction temperature, all aliquots removed to determine sample
203
activity were obtained at room temperature to eliminate any possible effects from variations in
solution density.
Figure 53 and Figure 54 reveal an increase in uranium adsorption capacity with an
increased temperature of extraction. This is in agreement with the behavior of uranium uptake in
seawater observed by studies on other polymeric adsorbents, including those based on
amidoxime. By increasing the temperature 17 degrees, the loading of uranium on the grafted
fabric was shown to increase by 29%. Similarly, a 19 °C decrease in temperature produced a
29% decrease in uranium loading.
The data on temperature dependence acquired in this experiment can only provide a
comparison of the extraction capacity of the adsorbent for a fixed time (240 minutes) and a fixed
uranium concentration. Should these experiments have been expanded to provide kinetic data
(and hence, reaction rate constants) at various temperatures, an Arrhenius plot could reveal the
activation energy of the adsorption process. This could enable determination of the rate constant
at any temperature. Similarly, the thermodynamic parameters of ΔH (reaction enthalpy) and ΔS
(entropy change) could be derived from the Van’t Hoff equation by plotting lnkd vs. 1/T [305].
The results of this experiment conclude that, if full-scale testing should occur, higher
extraction efficiencies may be obtained by selected ocean sites with higher average temperatures.
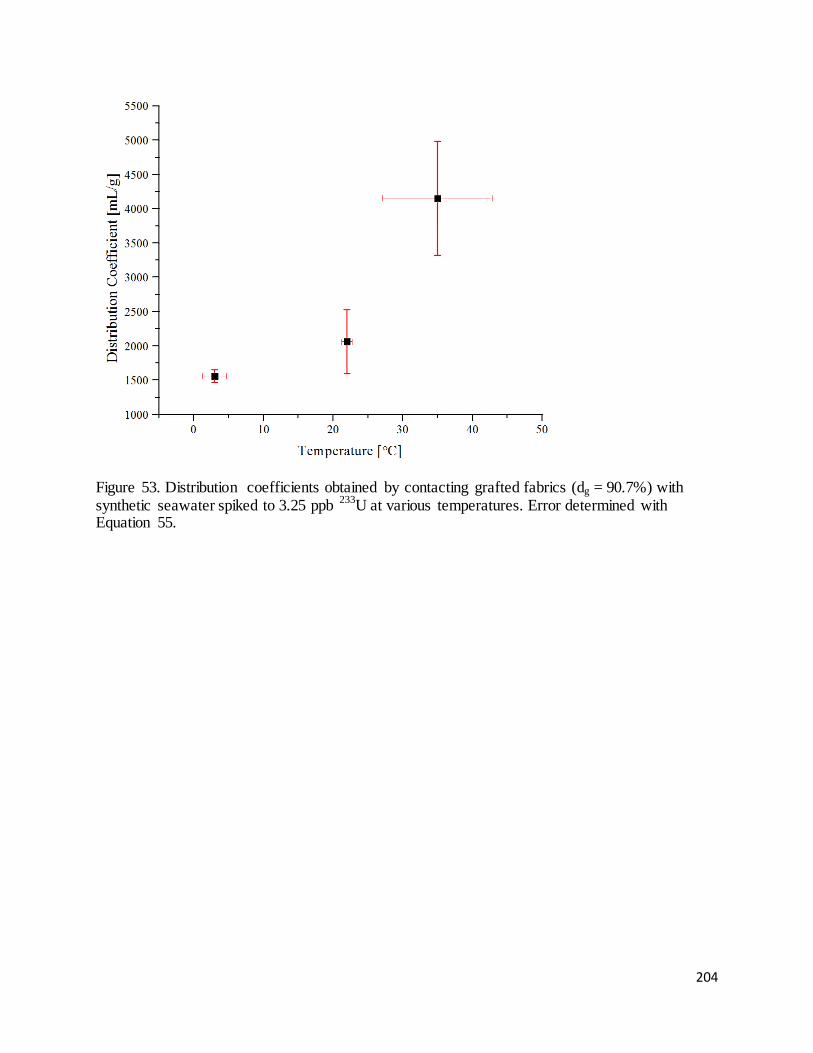
204
Figure 53. Distribution coefficients obtained by contacting grafted fabrics (dg = 90.7%) with synthetic seawater spiked to 3.25 ppb 233U at various temperatures. Error determined with Equation 55.
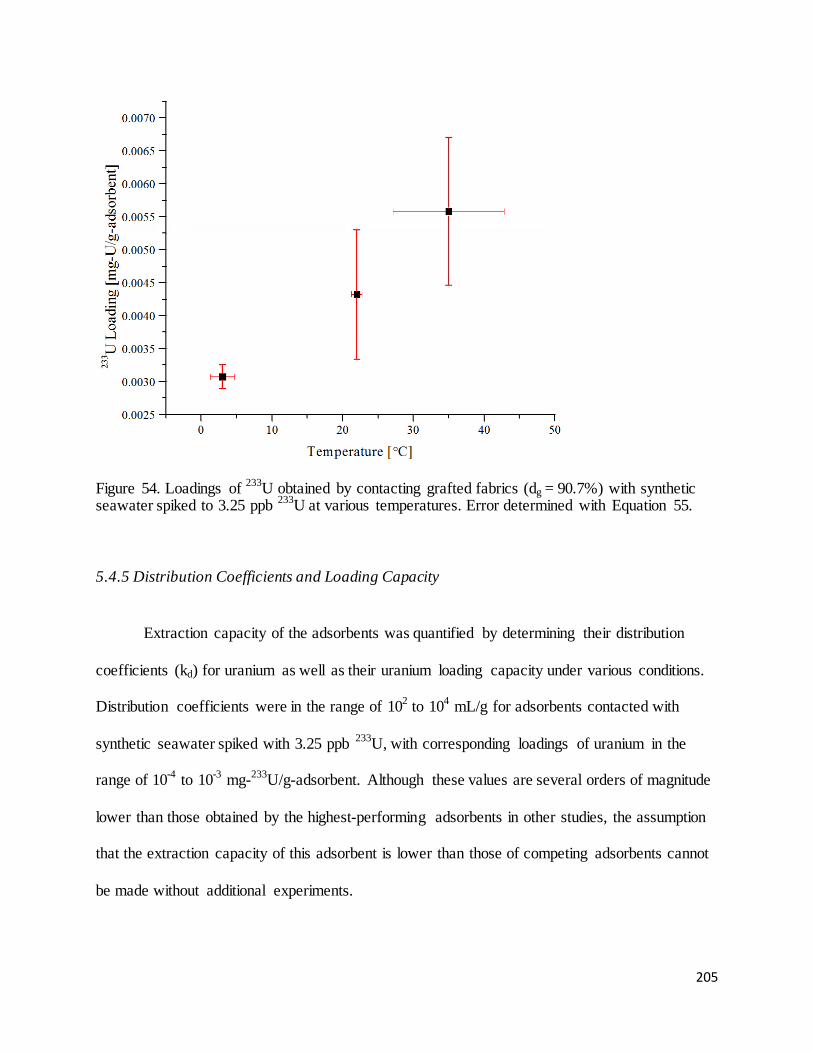
205
Figure 54. Loadings of 233U obtained by contacting grafted fabrics (dg = 90.7%) with synthetic seawater spiked to 3.25 ppb 233U at various temperatures. Error determined with Equation 55.
5.4.5 Distribution Coefficients and Loading Capacity
Extraction capacity of the adsorbents was quantified by determining their distribution
coefficients (kd) for uranium as well as their uranium loading capacity under various conditions.
Distribution coefficients were in the range of 102 to 104 mL/g for adsorbents contacted with
synthetic seawater spiked with 3.25 ppb 233U, with corresponding loadings of uranium in the
range of 10-4 to 10-3 mg-233U/g-adsorbent. Although these values are several orders of magnitude
lower than those obtained by the highest-performing adsorbents in other studies, the assumption
that the extraction capacity of this adsorbent is lower than those of competing adsorbents cannot
be made without additional experiments.
206
A comprehensive summary of the loading capacity for uranium of various adsorbents in
different media (synthetic solution, soil, fresh water, etc.) is provided by Aly and Hamza [306].
Additionally, a comparison of the uranium loading capacities of amidoximated polymeric
adsorbents is provided by Kavakh et. al [86], however; many (if not all) of these experiments
were performed at initial uranium concentrations of 100 ppb or more. In fact, these extraction
experiments are routinely performed at concentrations in the range of parts-per-million, over one
thousand times greater than those in this dissertation. Because the magnitude of the distribution
coefficient is dependent upon the uranium concentration in solution, it is not appropriate to
compare distribution coefficients obtained at different concentrations.
Similarly, values for loading of uranium on the adsorbent are limited by the overall
amount of uranium in the solution. For a fixed volume, a solution of 1.0 ppm uranium will
possess one thousand times the mass of uranium than a system at 1.0 ppb. The system of lower
concentration (although more representative of the concentration of uranium in nature) cannot
obtain the high values for loading that are possible with the system of lower concentration.
Indeed, is was not possible for the grafted adsorbents tested in this thesis to obtain a loading
greater than 1.89 × 10⁻² mg-233U/g-adsorbent based on 38 mL of testing solution at 3.25 ppb
233U.
For a fixed concentration, the limitations on uranium loading due to the overall mass of
uranium in the system can also be avoided by using either a continuous feed system or by
performing the extraction in a very large volume, such as the ocean. Several experiments with
amidoxime-based adsorbents for uranium were conducted either in-ocean or with a continuous
flow of real seawater (~3.3 ppb), however; these studies differ significantly from this thesis in
that the adsorbents were in the open ocean and therefore contacted with an unlimited supply of
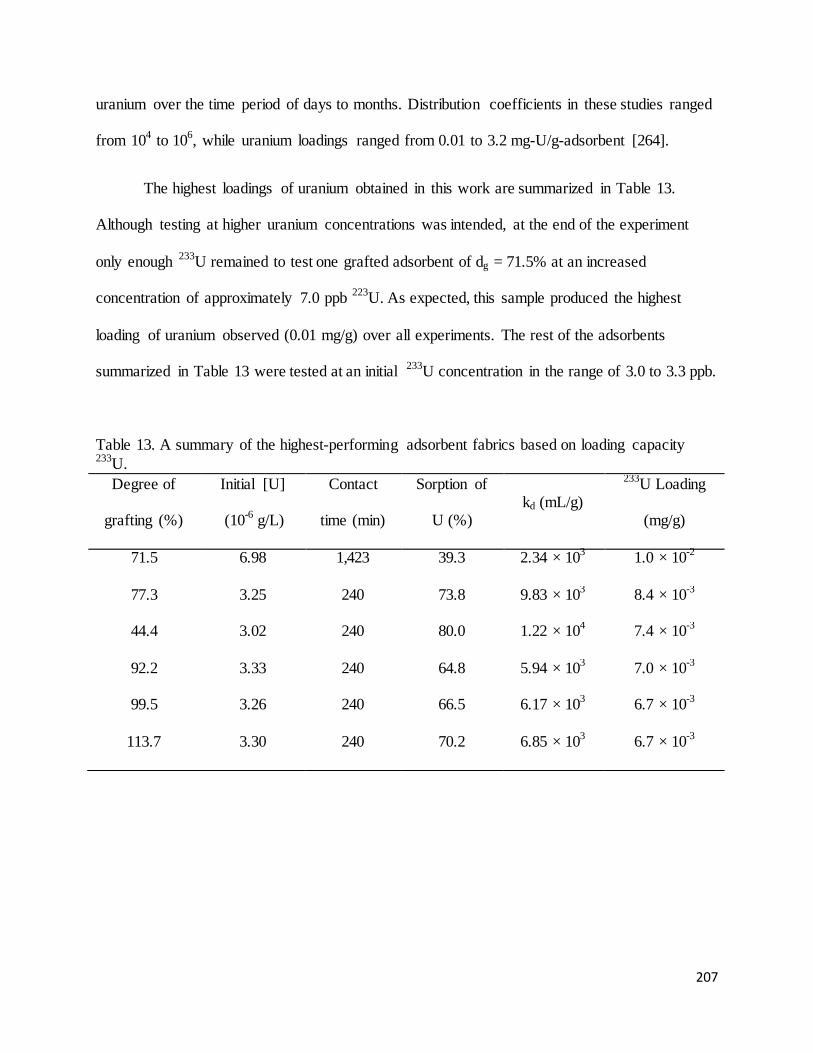
207
uranium over the time period of days to months. Distribution coefficients in these studies ranged
from 104 to 106, while uranium loadings ranged from 0.01 to 3.2 mg-U/g-adsorbent [264].
The highest loadings of uranium obtained in this work are summarized in Table 13.
Although testing at higher uranium concentrations was intended, at the end of the experiment
only enough 233U remained to test one grafted adsorbent of dg = 71.5% at an increased
concentration of approximately 7.0 ppb 223U. As expected, this sample produced the highest
loading of uranium observed (0.01 mg/g) over all experiments. The rest of the adsorbents
summarized in Table 13 were tested at an initial 233U concentration in the range of 3.0 to 3.3 ppb.
Table 13. A summary of the highest-performing adsorbent fabrics based on loading capacity 233U.
Degree of
grafting (%)
Initial [U]
(10-6 g/L)
Contact
time (min)
Sorption of
U (%) kd (mL/g)
233U Loading
(mg/g)
71.5 6.98 1,423 39.3 2.34 × 10³ 1.0 × 10⁻²
77.3 3.25 240 73.8 9.83 × 10³ 8.4 × 10⁻³
44.4 3.02 240 80.0 1.22 × 10⁴ 7.4 × 10⁻³
92.2 3.33 240 64.8 5.94 × 10³ 7.0 × 10⁻³
99.5 3.26 240 66.5 6.17 × 10³ 6.7 × 10⁻³
113.7 3.30 240 70.2 6.85 × 10³ 6.7 × 10⁻³
208
5.4.6 Experimental pH
Ideally, all experiments would be performed at pH values simulating that of natural
seawater, which features a range of pH from 7.5 to 8.5 [304]. It was mentioned in a previous
section that the chemical form of uranium is highly dependent on pH, with uranyl tricarbonate
(UO2(CO3)34-) being the dominant chemical form in the pH range of seawater. Due to the
importance of pH on the chemical form and binding mechanism of uranium in seawater, such
experiments have been described in the works of Zhang et al. [307], Yamashita et al. [308], Saito
et al. [309] and many more.
The values of pH used in this experiment were consistently between 6 and 8 as measured
with pH test strips. An exact pH is not known as samples were not accurately tested with a pH
meter. Because the 233U stock solution was in the form of uranyl nitrate in dilute nitric acid (pH
1), it would be expected for the solution pH (at 3.25 ppb 233U in seawater) to be near or below
the pH seawater. This depends upon the buffering power of the synthetic seawater. Should the
work presented in this dissertation be continued, determining the pH of the solutions utilized in
this solution should be a priority. Additionally, an experiment to determine the extraction
efficiency of identical grafted fabrics at different levels of pH should also be conducted.
5.4.7 Extraction Capacity Summary
A radiotracer was used to characterize the extraction efficiency of the grafted fabrics by
determining their distribution coefficients and loadings of uranium after contact with synthetic
seawater solutions containing added 233U. This was achieved by determining the activity of the
extracting solution through gross alpha counting. Derived from the sample activity, the mass of
uranium removed from the solution was used to calculate the percent sorption of uranium from

209
the solution, the loading of uranium on the grafted fabrics and the distribution coefficient for
uranium of the grafted fabrics. Such results were obtained by contacting the grafted fabrics with
synthetic seawater spike with 233U at natural (3.25 ppb) uranium concentrations.
Uranium uptake was shown to increase with degree of grafting, until an equilibrium was
reached at approximately 76%. At 292% degree of grafting, the adsorption capacity decreased
substantially. Based on these observations, the ideal range of degree of grafting to achieve the
highest uranium uptake with the lowest radiation dose and consumption of monomer was
determined to be 76 - 100%.
A set of adsorbent fabrics grafted to 104% was shown to reach equilibrium after
approximately 120 minutes of contact time with 233U-spiked synthetic seawater. A similar set
grafted to 46% did not reach equilibrium during the experimental time of 480 minutes. Data from
both experiments was tested against the pseudo-first-order, pseudo-second-order and intra-
particle diffusion kinetic models. A strong correlation was found with the pseudo-second-order
kinetic model, indicating that the rate-limited step of the process was the formation of chemical
bonds between the functionalized adsorbent and uranium. At such low concentrations of
uranium, was also suggested that the equilibrium capacity of the adsorbents was strongly
affected by the presence of competing ions.
The uranium loading capacity of the grafted fabrics was shown to increase with
temperature, with a 19 ˚C temperature increase to 39 °C corresponding to a 29% increase in
uranium loading for fabrics grafted to 90.7%. This is in agreement with similar technologies,
suggesting that maximum extraction efficiency for full-scale testing can be achieved at locations
with higher seawater temperatures. The pH of the 233U-spiked synthetic seawater solutions used

210
to determine the distribution coefficients and uranium loadings were not accurately measured,
but pH test strips revealed pH values between 6 and 8.
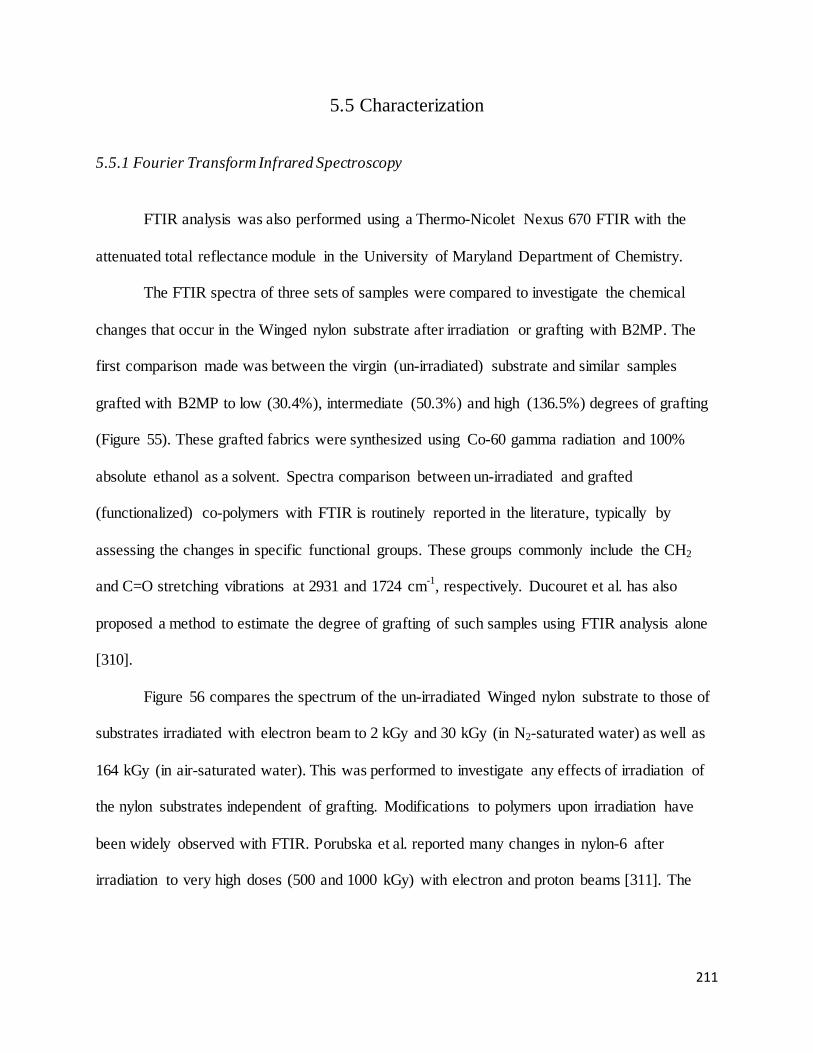
211
5.5 Characterization
5.5.1 Fourier Transform Infrared Spectroscopy
FTIR analysis was also performed using a Thermo-Nicolet Nexus 670 FTIR with the
attenuated total reflectance module in the University of Maryland Department of Chemistry.
The FTIR spectra of three sets of samples were compared to investigate the chemical
changes that occur in the Winged nylon substrate after irradiation or grafting with B2MP. The
first comparison made was between the virgin (un-irradiated) substrate and similar samples
grafted with B2MP to low (30.4%), intermediate (50.3%) and high (136.5%) degrees of grafting
(Figure 55). These grafted fabrics were synthesized using Co-60 gamma radiation and 100%
absolute ethanol as a solvent. Spectra comparison between un-irradiated and grafted
(functionalized) co-polymers with FTIR is routinely reported in the literature, typically by
assessing the changes in specific functional groups. These groups commonly include the CH2
and C=O stretching vibrations at 2931 and 1724 cm-1, respectively. Ducouret et al. has also
proposed a method to estimate the degree of grafting of such samples using FTIR analysis alone
[310].
Figure 56 compares the spectrum of the un-irradiated Winged nylon substrate to those of
substrates irradiated with electron beam to 2 kGy and 30 kGy (in N2-saturated water) as well as
164 kGy (in air-saturated water). This was performed to investigate any effects of irradiation of
the nylon substrates independent of grafting. Modifications to polymers upon irradiation have
been widely observed with FTIR. Porubska et al. reported many changes in nylon-6 after
irradiation to very high doses (500 and 1000 kGy) with electron and proton beams [311]. The
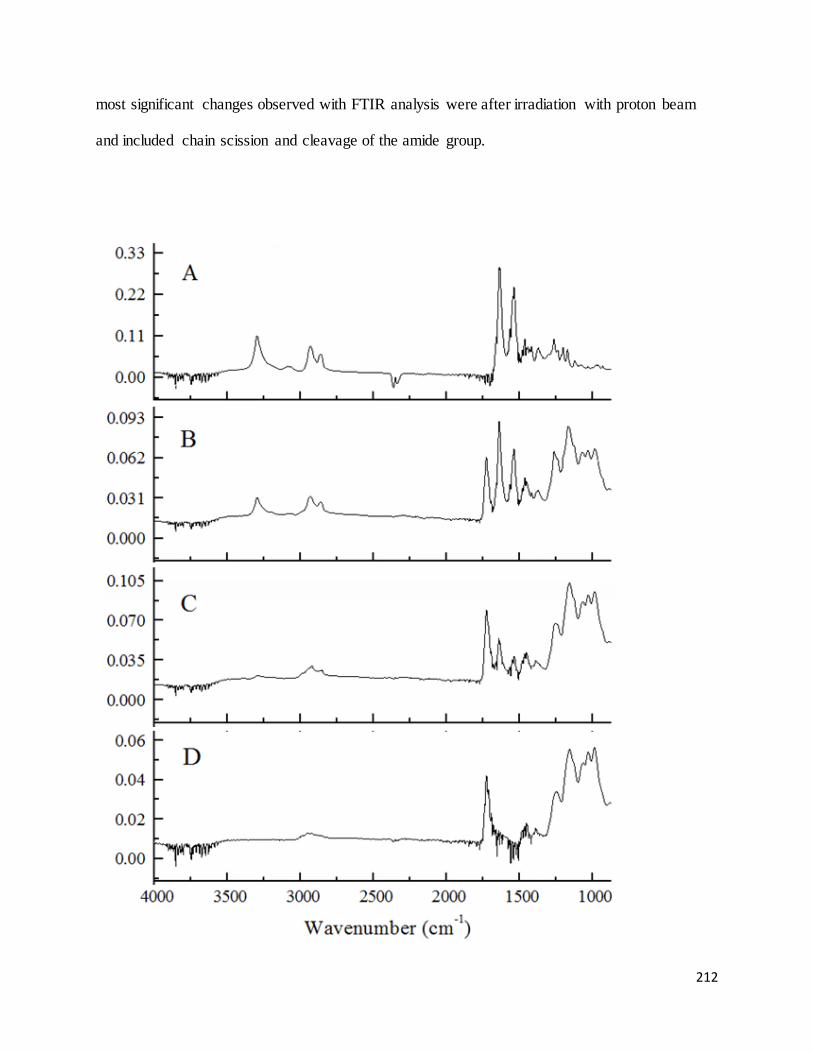
212
most significant changes observed with FTIR analysis were after irradiation with proton beam
and included chain scission and cleavage of the amide group.
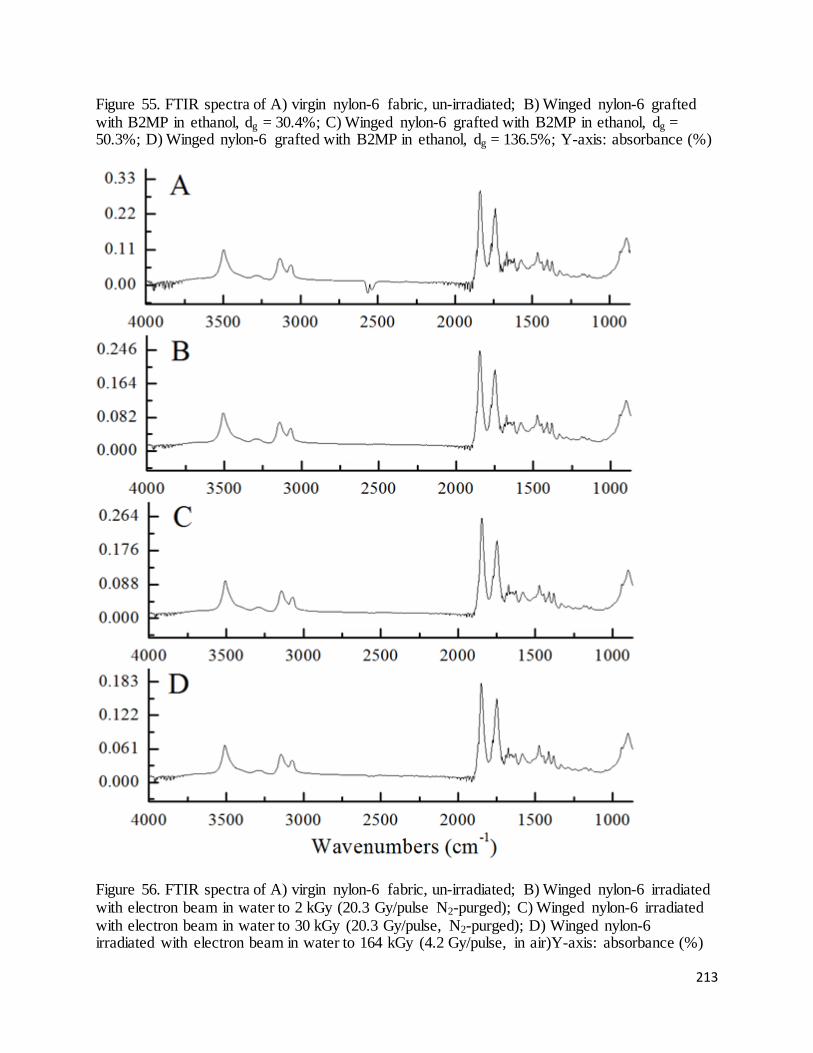
213
Figure 55. FTIR spectra of A) virgin nylon-6 fabric, un-irradiated; B) Winged nylon-6 grafted with B2MP in ethanol, dg = 30.4%; C) Winged nylon-6 grafted with B2MP in ethanol, dg = 50.3%; D) Winged nylon-6 grafted with B2MP in ethanol, dg = 136.5%; Y-axis: absorbance (%)
Figure 56. FTIR spectra of A) virgin nylon-6 fabric, un-irradiated; B) Winged nylon-6 irradiated with electron beam in water to 2 kGy (20.3 Gy/pulse N2-purged); C) Winged nylon-6 irradiated with electron beam in water to 30 kGy (20.3 Gy/pulse, N2-purged); D) Winged nylon-6 irradiated with electron beam in water to 164 kGy (4.2 Gy/pulse, in air)Y-axis: absorbance (%)
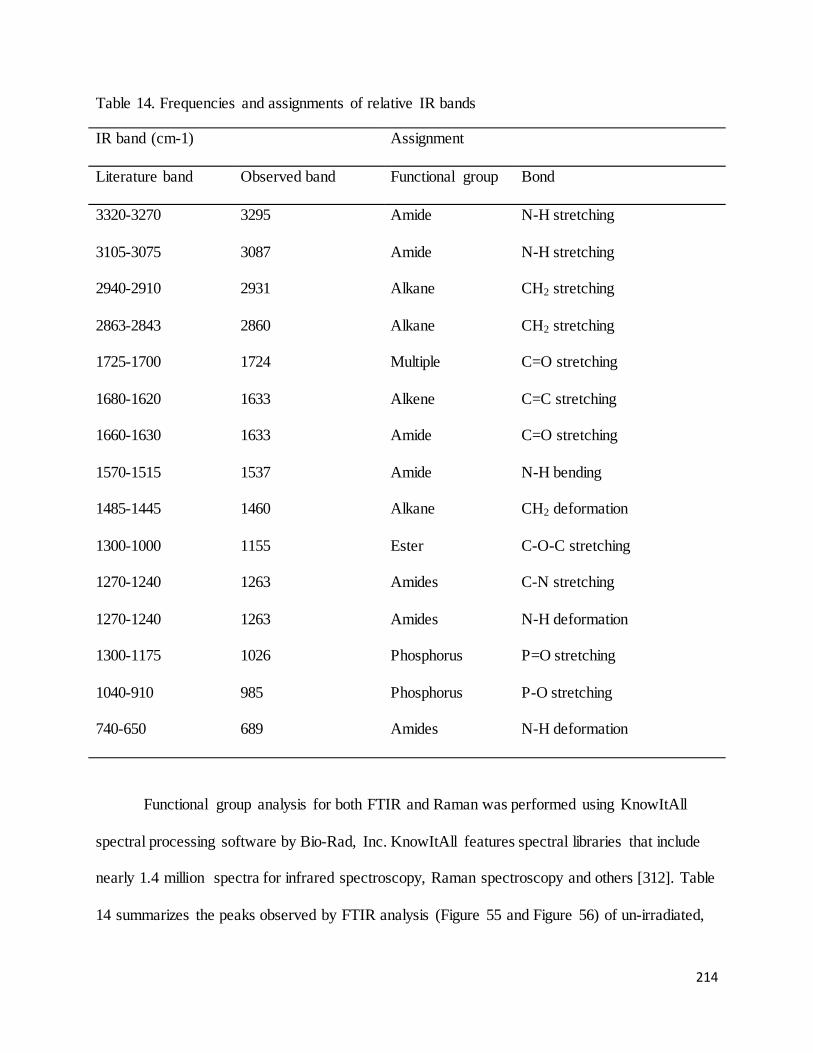
214
Table 14. Frequencies and assignments of relative IR bands
IR band (cm-1) Assignment
Literature band Observed band Functional group Bond
3320-3270
3105-3075
2940-2910
2863-2843
1725-1700
1680-1620
1660-1630
1570-1515
1485-1445
1300-1000
1270-1240
1270-1240
1300-1175
1040-910
740-650
3295
3087
2931
2860
1724
1633
1633
1537
1460
1155
1263
1263
1026
985
689
Amide
Amide
Alkane
Alkane
Multiple
Alkene
Amide
Amide
Alkane
Ester
Amides
Amides
Phosphorus
Phosphorus
Amides
N-H stretching
N-H stretching
CH2 stretching
CH2 stretching
C=O stretching
C=C stretching
C=O stretching
N-H bending
CH2 deformation
C-O-C stretching
C-N stretching
N-H deformation
P=O stretching
P-O stretching
N-H deformation
Functional group analysis for both FTIR and Raman was performed using KnowItAll
spectral processing software by Bio-Rad, Inc. KnowItAll features spectral libraries that include
nearly 1.4 million spectra for infrared spectroscopy, Raman spectroscopy and others [312]. Table
14 summarizes the peaks observed by FTIR analysis (Figure 55 and Figure 56) of un-irradiated,
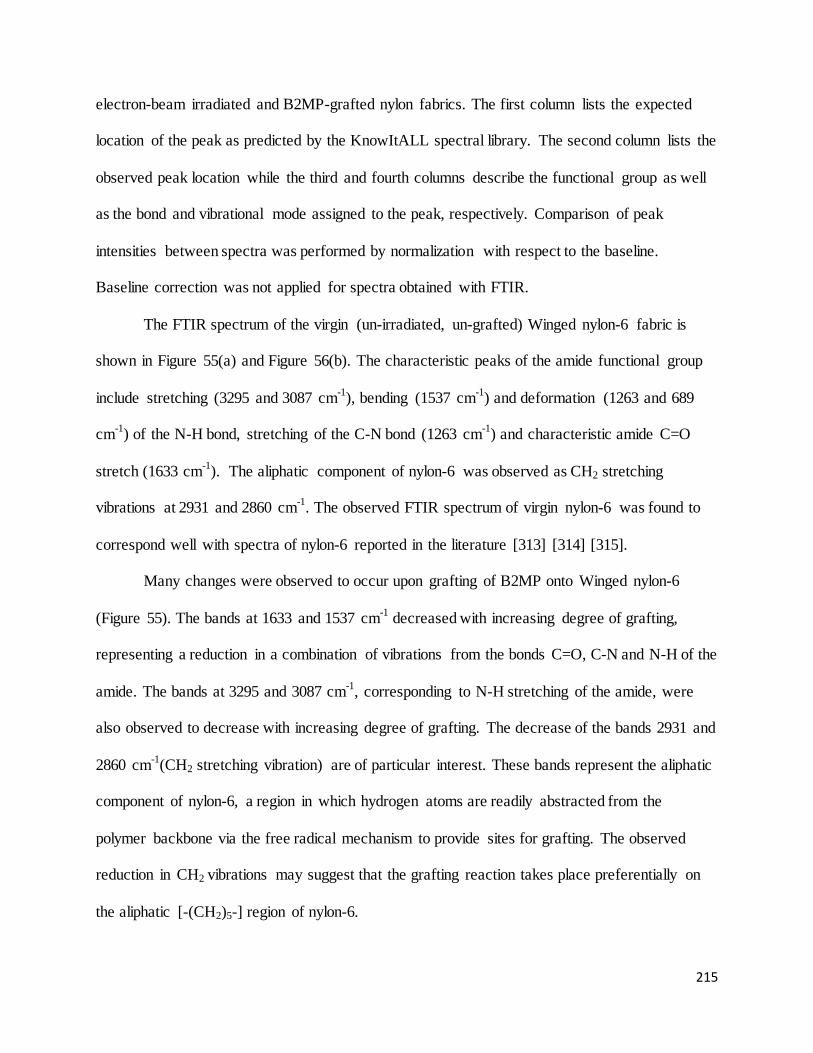
215
electron-beam irradiated and B2MP-grafted nylon fabrics. The first column lists the expected
location of the peak as predicted by the KnowItALL spectral library. The second column lists the
observed peak location while the third and fourth columns describe the functional group as well
as the bond and vibrational mode assigned to the peak, respectively. Comparison of peak
intensities between spectra was performed by normalization with respect to the baseline.
Baseline correction was not applied for spectra obtained with FTIR.
The FTIR spectrum of the virgin (un-irradiated, un-grafted) Winged nylon-6 fabric is
shown in Figure 55(a) and Figure 56(b). The characteristic peaks of the amide functional group
include stretching (3295 and 3087 cm-1), bending (1537 cm-1) and deformation (1263 and 689
cm-1) of the N-H bond, stretching of the C-N bond (1263 cm-1) and characteristic amide C=O
stretch (1633 cm-1). The aliphatic component of nylon-6 was observed as CH2 stretching
vibrations at 2931 and 2860 cm-1. The observed FTIR spectrum of virgin nylon-6 was found to
correspond well with spectra of nylon-6 reported in the literature [313] [314] [315].
Many changes were observed to occur upon grafting of B2MP onto Winged nylon-6
(Figure 55). The bands at 1633 and 1537 cm-1 decreased with increasing degree of grafting,
representing a reduction in a combination of vibrations from the bonds C=O, C-N and N-H of the
amide. The bands at 3295 and 3087 cm-1, corresponding to N-H stretching of the amide, were
also observed to decrease with increasing degree of grafting. The decrease of the bands 2931 and
2860 cm-1(CH2 stretching vibration) are of particular interest. These bands represent the aliphatic
component of nylon-6, a region in which hydrogen atoms are readily abstracted from the
polymer backbone via the free radical mechanism to provide sites for grafting. The observed
reduction in CH2 vibrations may suggest that the grafting reaction takes place preferentially on
the aliphatic [-(CH2)5-] region of nylon-6.
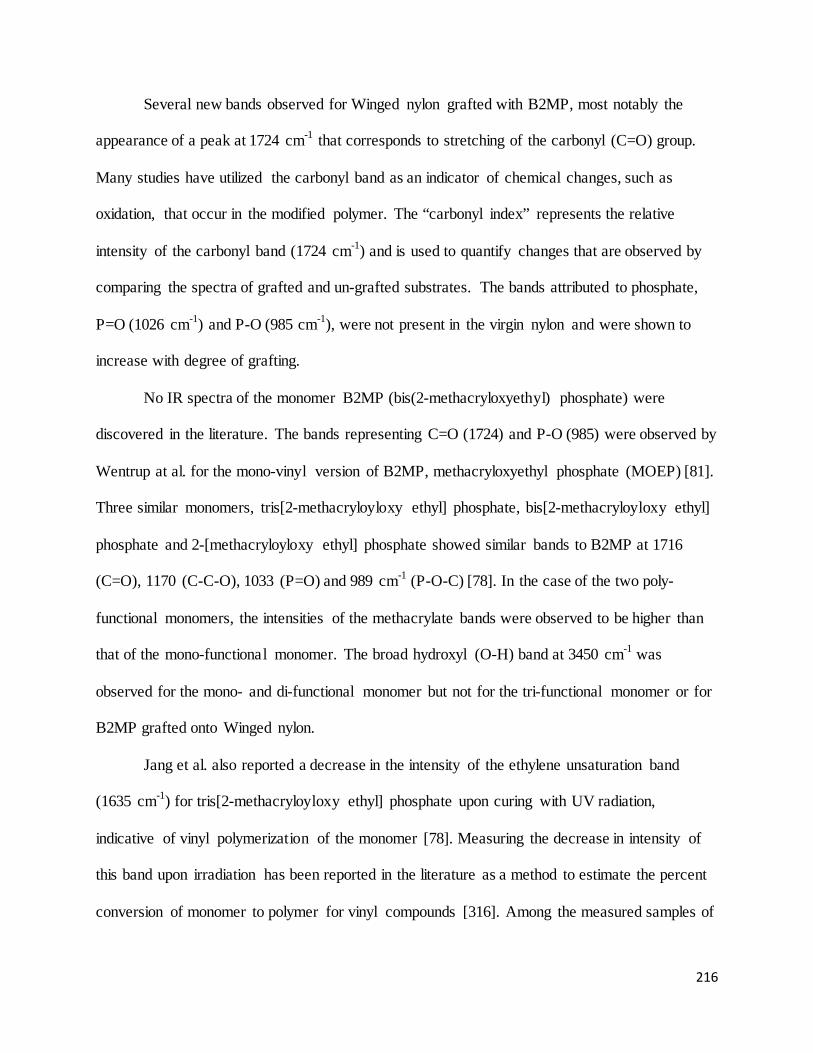
216
Several new bands observed for Winged nylon grafted with B2MP, most notably the
appearance of a peak at 1724 cm-1 that corresponds to stretching of the carbonyl (C=O) group.
Many studies have utilized the carbonyl band as an indicator of chemical changes, such as
oxidation, that occur in the modified polymer. The “carbonyl index” represents the relative
intensity of the carbonyl band (1724 cm-1) and is used to quantify changes that are observed by
comparing the spectra of grafted and un-grafted substrates. The bands attributed to phosphate,
P=O (1026 cm-1) and P-O (985 cm-1), were not present in the virgin nylon and were shown to
increase with degree of grafting.
No IR spectra of the monomer B2MP (bis(2-methacryloxyethyl) phosphate) were
discovered in the literature. The bands representing C=O (1724) and P-O (985) were observed by
Wentrup at al. for the mono-vinyl version of B2MP, methacryloxyethyl phosphate (MOEP) [81].
Three similar monomers, tris[2-methacryloyloxy ethyl] phosphate, bis[2-methacryloyloxy ethyl]
phosphate and 2-[methacryloyloxy ethyl] phosphate showed similar bands to B2MP at 1716
(C=O), 1170 (C-C-O), 1033 (P=O) and 989 cm-1 (P-O-C) [78]. In the case of the two poly-
functional monomers, the intensities of the methacrylate bands were observed to be higher than
that of the mono-functional monomer. The broad hydroxyl (O-H) band at 3450 cm-1 was
observed for the mono- and di-functional monomer but not for the tri-functional monomer or for
B2MP grafted onto Winged nylon.
Jang et al. also reported a decrease in the intensity of the ethylene unsaturation band
(1635 cm-1) for tris[2-methacryloyloxy ethyl] phosphate upon curing with UV radiation,
indicative of vinyl polymerization of the monomer [78]. Measuring the decrease in intensity of
this band upon irradiation has been reported in the literature as a method to estimate the percent
conversion of monomer to polymer for vinyl compounds [316]. Among the measured samples of
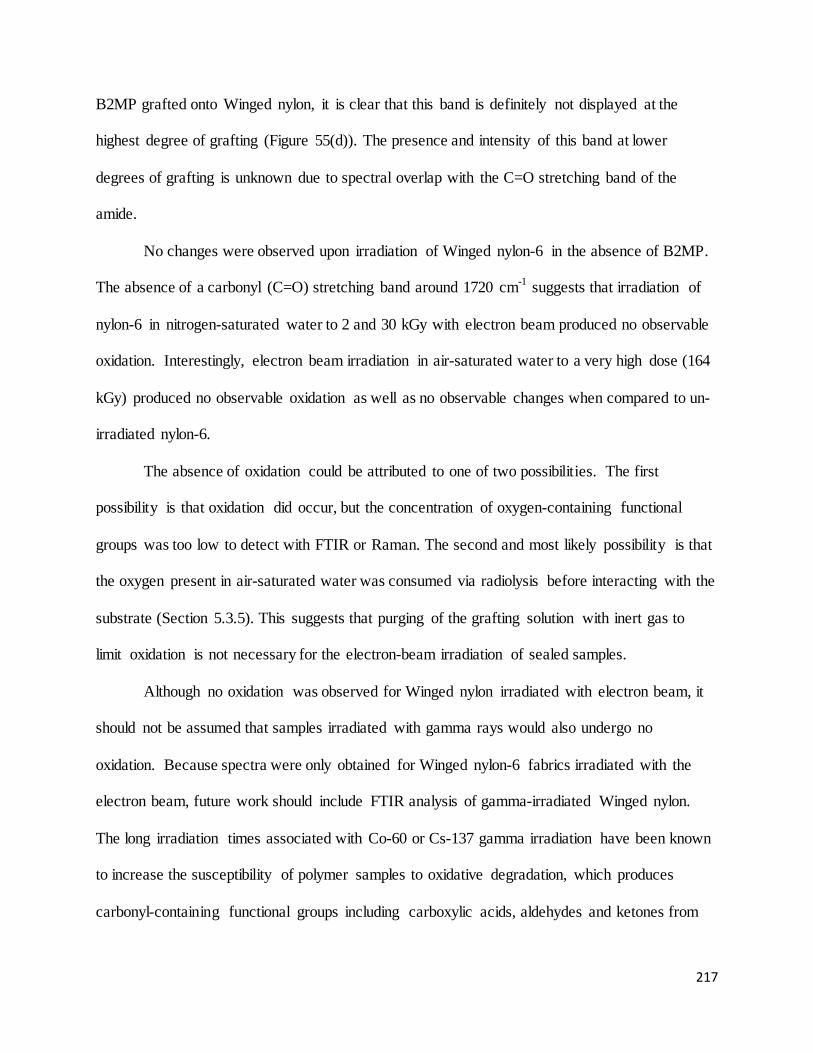
217
B2MP grafted onto Winged nylon, it is clear that this band is definitely not displayed at the
highest degree of grafting (Figure 55(d)). The presence and intensity of this band at lower
degrees of grafting is unknown due to spectral overlap with the C=O stretching band of the
amide.
No changes were observed upon irradiation of Winged nylon-6 in the absence of B2MP.
The absence of a carbonyl (C=O) stretching band around 1720 cm-1 suggests that irradiation of
nylon-6 in nitrogen-saturated water to 2 and 30 kGy with electron beam produced no observable
oxidation. Interestingly, electron beam irradiation in air-saturated water to a very high dose (164
kGy) produced no observable oxidation as well as no observable changes when compared to un-
irradiated nylon-6.
The absence of oxidation could be attributed to one of two possibilities. The first
possibility is that oxidation did occur, but the concentration of oxygen-containing functional
groups was too low to detect with FTIR or Raman. The second and most likely possibility is that
the oxygen present in air-saturated water was consumed via radiolysis before interacting with the
substrate (Section 5.3.5). This suggests that purging of the grafting solution with inert gas to
limit oxidation is not necessary for the electron-beam irradiation of sealed samples.
Although no oxidation was observed for Winged nylon irradiated with electron beam, it
should not be assumed that samples irradiated with gamma rays would also undergo no
oxidation. Because spectra were only obtained for Winged nylon-6 fabrics irradiated with the
electron beam, future work should include FTIR analysis of gamma-irradiated Winged nylon.
The long irradiation times associated with Co-60 or Cs-137 gamma irradiation have been known
to increase the susceptibility of polymer samples to oxidative degradation, which produces
carbonyl-containing functional groups including carboxylic acids, aldehydes and ketones from
218
structures of the type ROOH or ROOR along the backbone of the substrate [39]. If the carbonyl
band is indeed observed upon gamma irradiation, the extent of oxidative degradation observed
under various irradiation conditions could be determined by calculating the “carbonyl index” or
“oxidation index”, a factor representing the relative peak intensity of the carbonyl stretching
band (~1720 cm-1) [317] [318].
5.5.2 Raman Spectroscopy
Characterization with Raman Spectroscopy was performed using the Horiba Yvon
LabRam ARAMIS true confocal Raman microscope in the UMD Surface Analysis Center
(Department of Chemistry). Before use, the instrument was calibrated with a silicon standard by
focusing the confocal microscope at the 10x, 50x and 100x objectives using a real-time camera.
No sample preparation was required, rather, after calibration the individual Winged nylon
samples were placed directly inside the instrument on a glass slide beneath the lenses of the
confocal microscope. The confocal microscope enabled selection of specific surface features to
analyze, during which time spherical structures were discovered on the fibers of the grafted
fabrics. These structures were investigated further with SEM/EDS and are discussed in detail in
Section 5.5.3.
On several occasions, spectra could not be recorded due to high levels of fluorescence in
the sample. Counteracting fluorescence is one of the greatest challenges of performing Raman
spectroscopy. Fluorescence increases the background of the spectrum and can interfere with or
completely hide Raman bands with intensities that are comparable to or smaller than the
fluorescence signal [182]. Unfortunately, fluorescence is a major obstacle to Raman analysis of
polymers and may prevent analysis of 95% of polymer samples [180]. Impurities within the
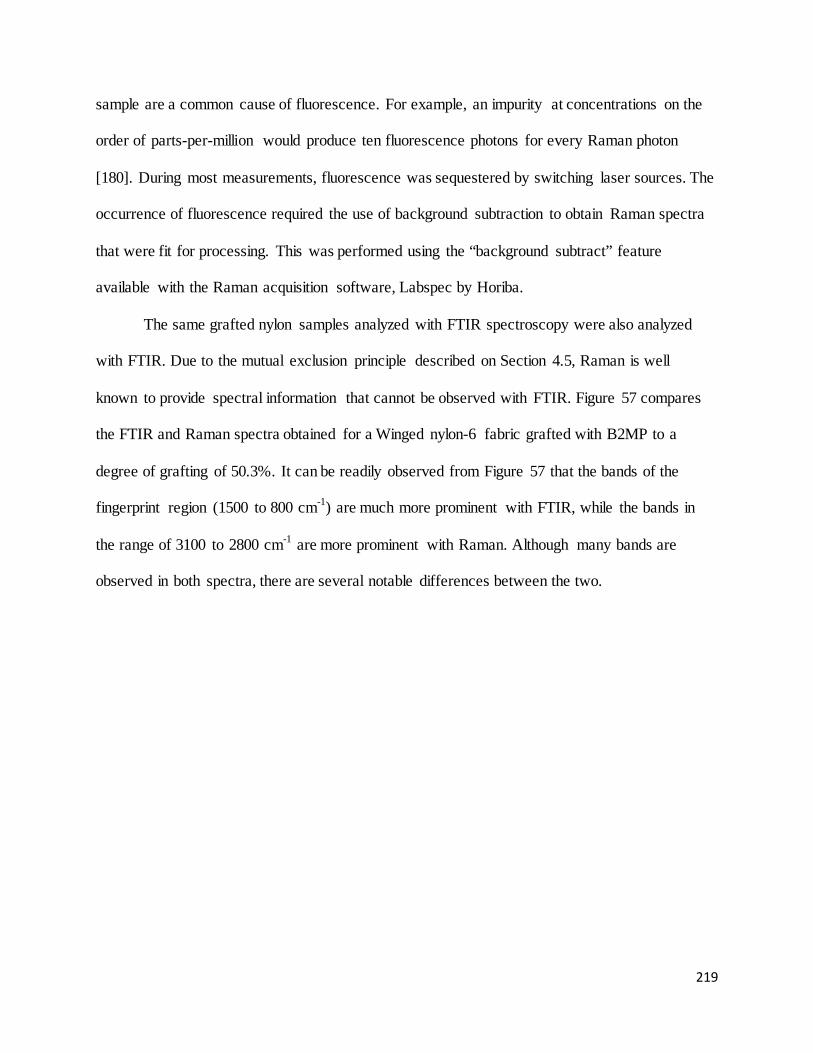
219
sample are a common cause of fluorescence. For example, an impurity at concentrations on the
order of parts-per-million would produce ten fluorescence photons for every Raman photon
[180]. During most measurements, fluorescence was sequestered by switching laser sources. The
occurrence of fluorescence required the use of background subtraction to obtain Raman spectra
that were fit for processing. This was performed using the “background subtract” feature
available with the Raman acquisition software, Labspec by Horiba.
The same grafted nylon samples analyzed with FTIR spectroscopy were also analyzed
with FTIR. Due to the mutual exclusion principle described on Section 4.5, Raman is well
known to provide spectral information that cannot be observed with FTIR. Figure 57 compares
the FTIR and Raman spectra obtained for a Winged nylon-6 fabric grafted with B2MP to a
degree of grafting of 50.3%. It can be readily observed from Figure 57 that the bands of the
fingerprint region (1500 to 800 cm-1) are much more prominent with FTIR, while the bands in
the range of 3100 to 2800 cm-1 are more prominent with Raman. Although many bands are
observed in both spectra, there are several notable differences between the two.
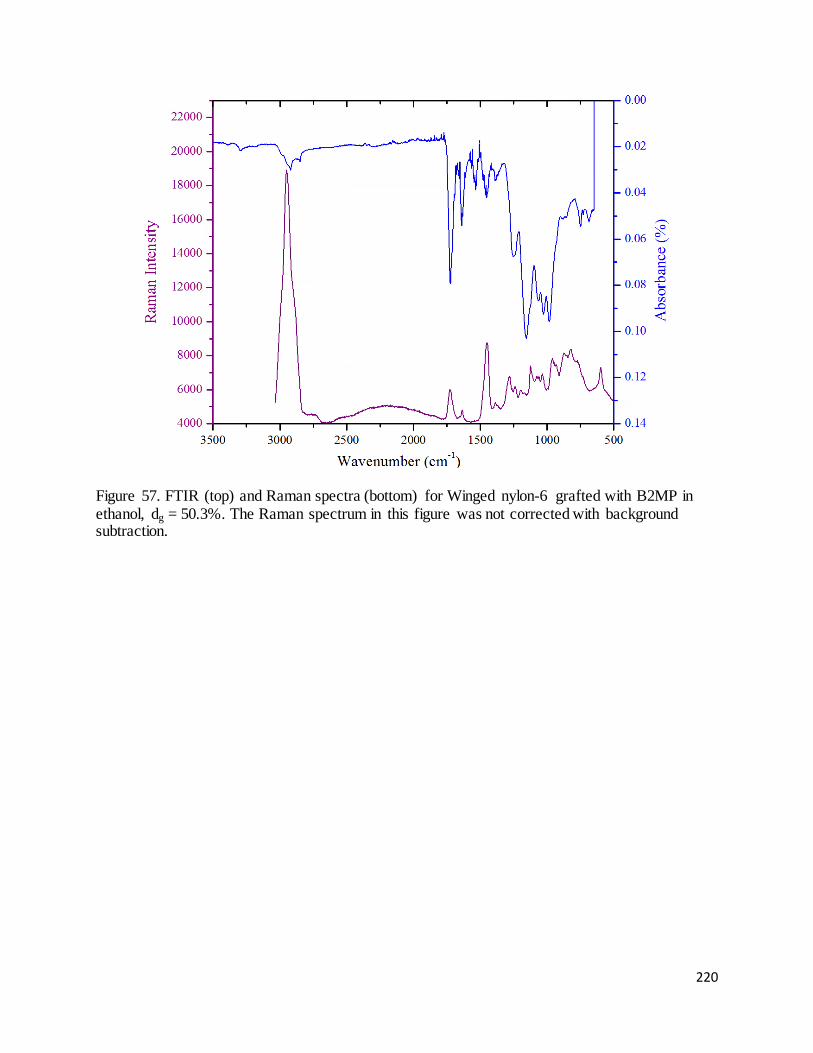
220
Figure 57. FTIR (top) and Raman spectra (bottom) for Winged nylon-6 grafted with B2MP in ethanol, dg = 50.3%. The Raman spectrum in this figure was not corrected with background subtraction.
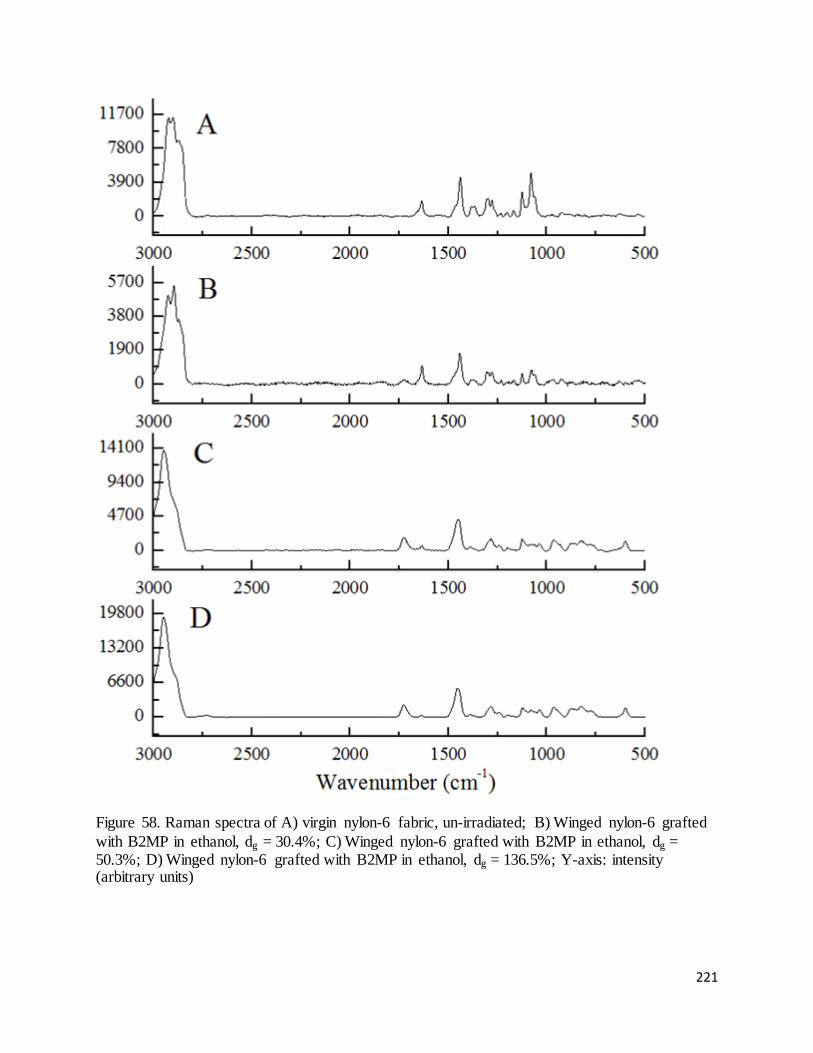
221
Figure 58. Raman spectra of A) virgin nylon-6 fabric, un-irradiated; B) Winged nylon-6 grafted with B2MP in ethanol, dg = 30.4%; C) Winged nylon-6 grafted with B2MP in ethanol, dg = 50.3%; D) Winged nylon-6 grafted with B2MP in ethanol, dg = 136.5%; Y-axis: intensity (arbitrary units)
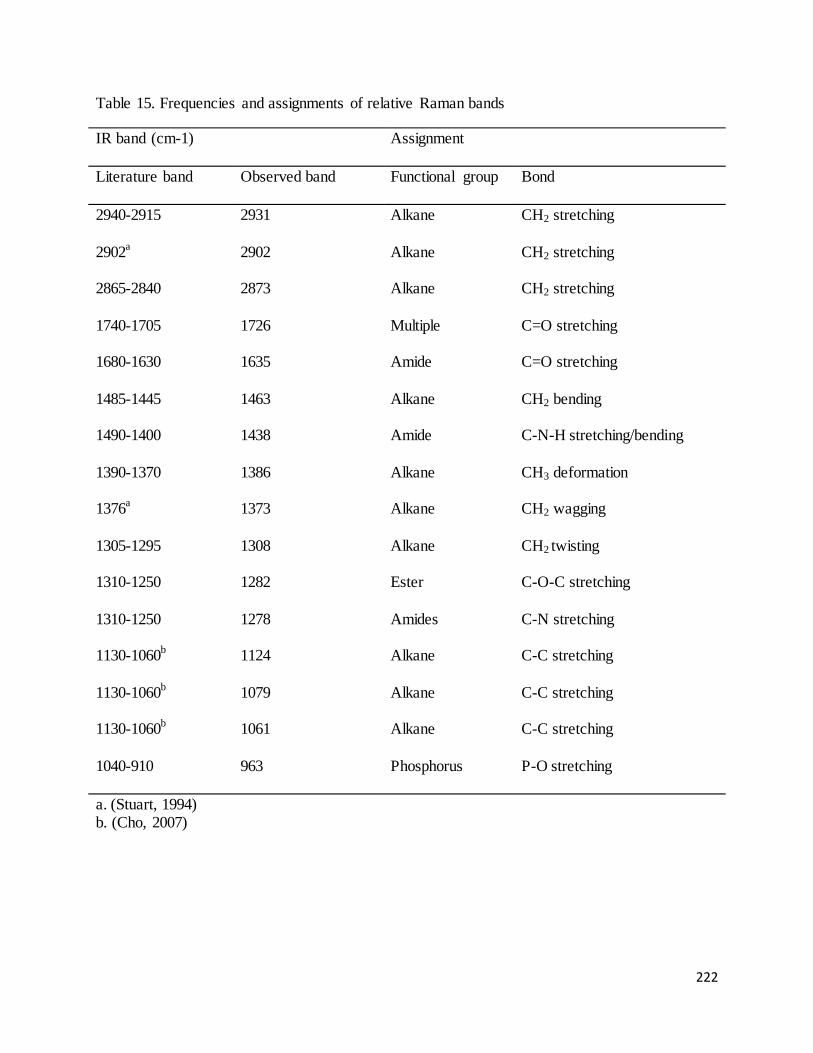
222
Table 15. Frequencies and assignments of relative Raman bands
IR band (cm-1) Assignment
Literature band Observed band Functional group Bond
2940-2915
2902a
2865-2840
1740-1705
1680-1630
1485-1445
1490-1400
1390-1370
1376a
1305-1295
1310-1250
1310-1250
1130-1060b
1130-1060b
1130-1060b
1040-910
2931
2902
2873
1726
1635
1463
1438
1386
1373
1308
1282
1278
1124
1079
1061
963
Alkane
Alkane
Alkane
Multiple
Amide
Alkane
Amide
Alkane
Alkane
Alkane
Ester
Amides
Alkane
Alkane
Alkane
Phosphorus
CH2 stretching
CH2 stretching
CH2 stretching
C=O stretching
C=O stretching
CH2 bending
C-N-H stretching/bending
CH3 deformation
CH2 wagging
CH2 twisting
C-O-C stretching
C-N stretching
C-C stretching
C-C stretching
C-C stretching
P-O stretching
a. (Stuart, 1994) b. (Cho, 2007)
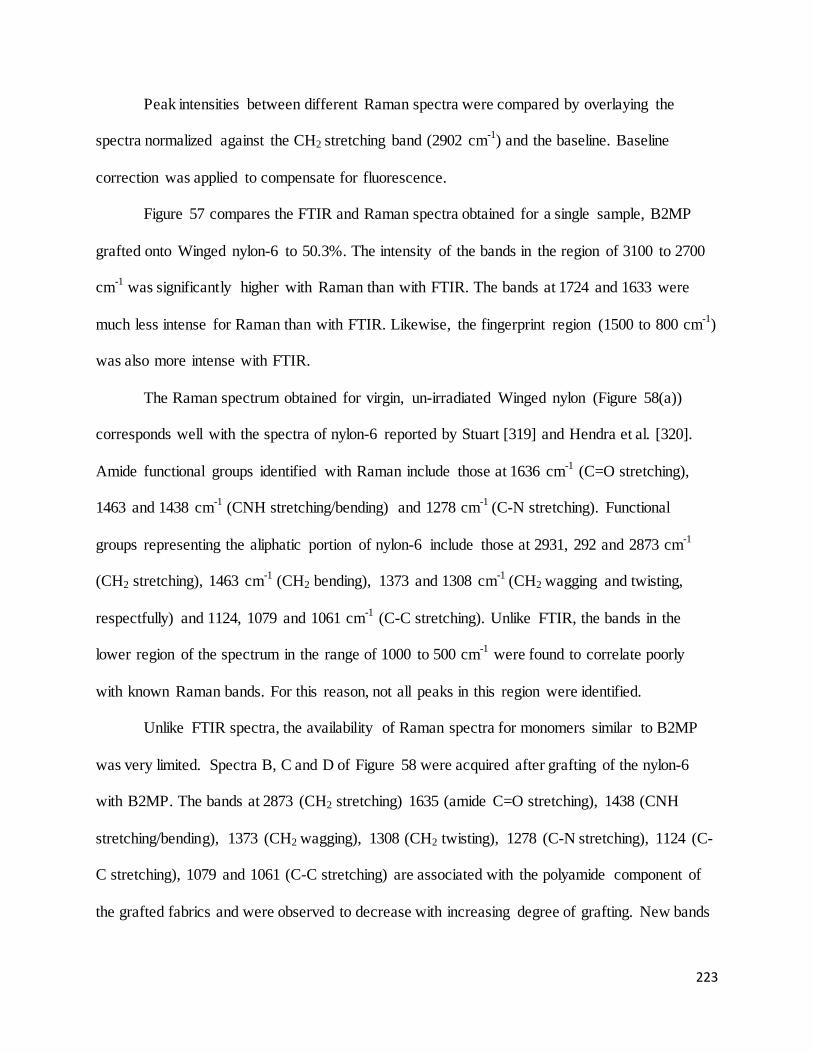
223
Peak intensities between different Raman spectra were compared by overlaying the
spectra normalized against the CH2 stretching band (2902 cm-1) and the baseline. Baseline
correction was applied to compensate for fluorescence.
Figure 57 compares the FTIR and Raman spectra obtained for a single sample, B2MP
grafted onto Winged nylon-6 to 50.3%. The intensity of the bands in the region of 3100 to 2700
cm-1 was significantly higher with Raman than with FTIR. The bands at 1724 and 1633 were
much less intense for Raman than with FTIR. Likewise, the fingerprint region (1500 to 800 cm-1)
was also more intense with FTIR.
The Raman spectrum obtained for virgin, un-irradiated Winged nylon (Figure 58(a))
corresponds well with the spectra of nylon-6 reported by Stuart [319] and Hendra et al. [320].
Amide functional groups identified with Raman include those at 1636 cm-1 (C=O stretching),
1463 and 1438 cm-1 (CNH stretching/bending) and 1278 cm-1 (C-N stretching). Functional
groups representing the aliphatic portion of nylon-6 include those at 2931, 292 and 2873 cm-1
(CH2 stretching), 1463 cm-1 (CH2 bending), 1373 and 1308 cm-1 (CH2 wagging and twisting,
respectfully) and 1124, 1079 and 1061 cm-1 (C-C stretching). Unlike FTIR, the bands in the
lower region of the spectrum in the range of 1000 to 500 cm-1 were found to correlate poorly
with known Raman bands. For this reason, not all peaks in this region were identified.
Unlike FTIR spectra, the availability of Raman spectra for monomers similar to B2MP
was very limited. Spectra B, C and D of Figure 58 were acquired after grafting of the nylon-6
with B2MP. The bands at 2873 (CH2 stretching) 1635 (amide C=O stretching), 1438 (CNH
stretching/bending), 1373 (CH2 wagging), 1308 (CH2 twisting), 1278 (C-N stretching), 1124 (C-
C stretching), 1079 and 1061 (C-C stretching) are associated with the polyamide component of
the grafted fabrics and were observed to decrease with increasing degree of grafting. New bands
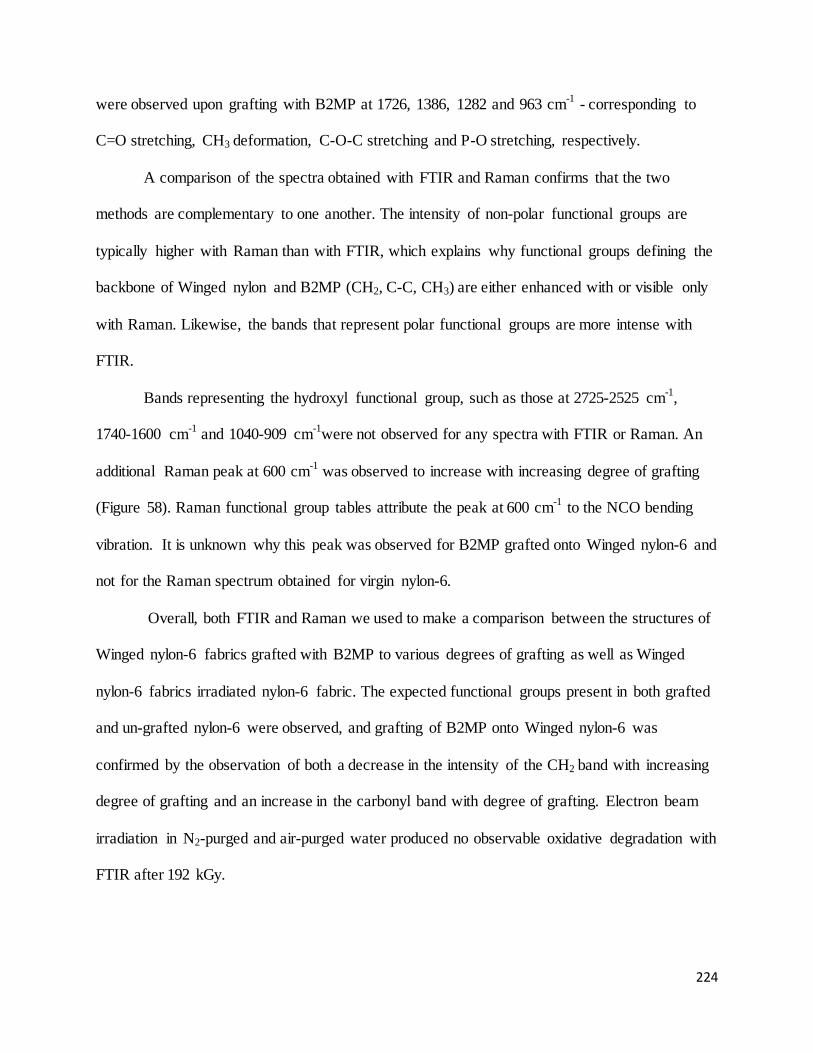
224
were observed upon grafting with B2MP at 1726, 1386, 1282 and 963 cm-1 - corresponding to
C=O stretching, CH3 deformation, C-O-C stretching and P-O stretching, respectively.
A comparison of the spectra obtained with FTIR and Raman confirms that the two
methods are complementary to one another. The intensity of non-polar functional groups are
typically higher with Raman than with FTIR, which explains why functional groups defining the
backbone of Winged nylon and B2MP (CH2, C-C, CH3) are either enhanced with or visible only
with Raman. Likewise, the bands that represent polar functional groups are more intense with
FTIR.
Bands representing the hydroxyl functional group, such as those at 2725-2525 cm-1,
1740-1600 cm-1 and 1040-909 cm-1were not observed for any spectra with FTIR or Raman. An
additional Raman peak at 600 cm-1 was observed to increase with increasing degree of grafting
(Figure 58). Raman functional group tables attribute the peak at 600 cm-1 to the NCO bending
vibration. It is unknown why this peak was observed for B2MP grafted onto Winged nylon-6 and
not for the Raman spectrum obtained for virgin nylon-6.
Overall, both FTIR and Raman we used to make a comparison between the structures of
Winged nylon-6 fabrics grafted with B2MP to various degrees of grafting as well as Winged
nylon-6 fabrics irradiated nylon-6 fabric. The expected functional groups present in both grafted
and un-grafted nylon-6 were observed, and grafting of B2MP onto Winged nylon-6 was
confirmed by the observation of both a decrease in the intensity of the CH2 band with increasing
degree of grafting and an increase in the carbonyl band with degree of grafting. Electron beam
irradiation in N2-purged and air-purged water produced no observable oxidative degradation with
FTIR after 192 kGy.
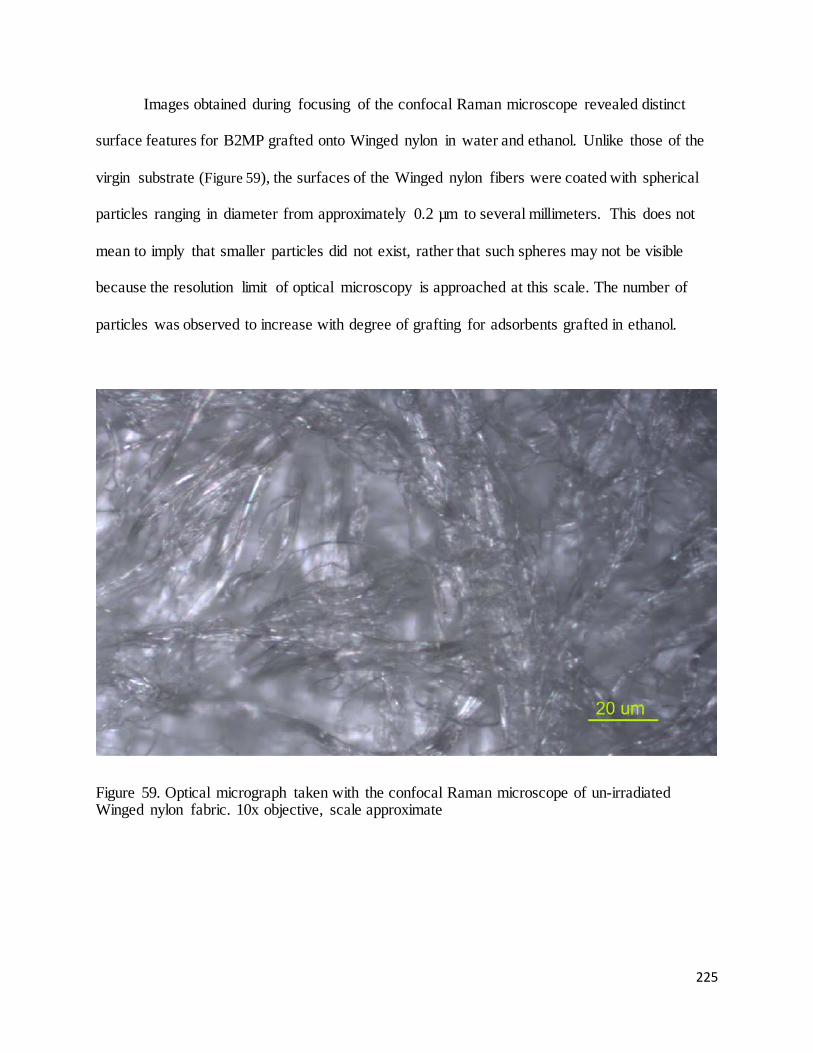
225
Images obtained during focusing of the confocal Raman microscope revealed distinct
surface features for B2MP grafted onto Winged nylon in water and ethanol. Unlike those of the
virgin substrate (Figure 59), the surfaces of the Winged nylon fibers were coated with spherical
particles ranging in diameter from approximately 0.2 µm to several millimeters. This does not
mean to imply that smaller particles did not exist, rather that such spheres may not be visible
because the resolution limit of optical microscopy is approached at this scale. The number of
particles was observed to increase with degree of grafting for adsorbents grafted in ethanol.
Figure 59. Optical micrograph taken with the confocal Raman microscope of un-irradiated Winged nylon fabric. 10x objective, scale approximate
226
Figure 60. Optical micrograph taken with the confocal Raman microscope of B2MP grafted onto Winged nylon to 73.4% in water. 10x objective, scale approximate
Figure 61. Optical micrographs taken with the confocal Raman microscope of B2MP grafted onto Winged nylon to 191.7% in water. 10x objective, scale approximate
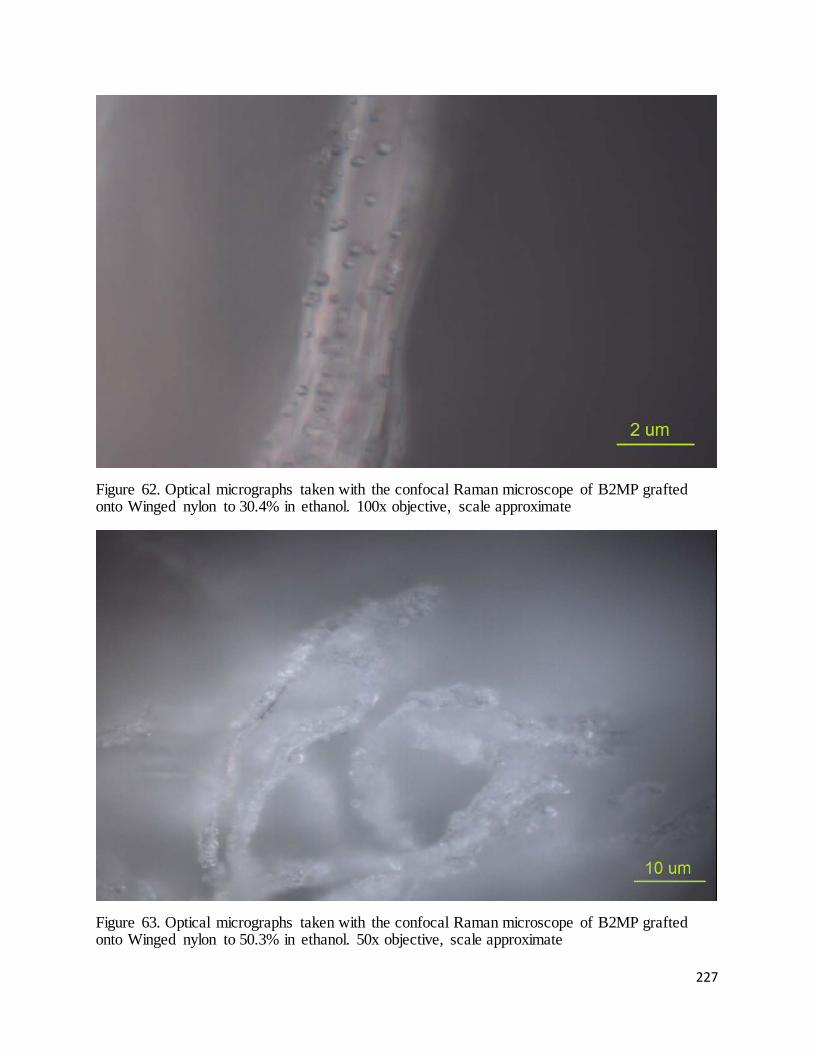
227
Figure 62. Optical micrographs taken with the confocal Raman microscope of B2MP grafted onto Winged nylon to 30.4% in ethanol. 100x objective, scale approximate
Figure 63. Optical micrographs taken with the confocal Raman microscope of B2MP grafted onto Winged nylon to 50.3% in ethanol. 50x objective, scale approximate
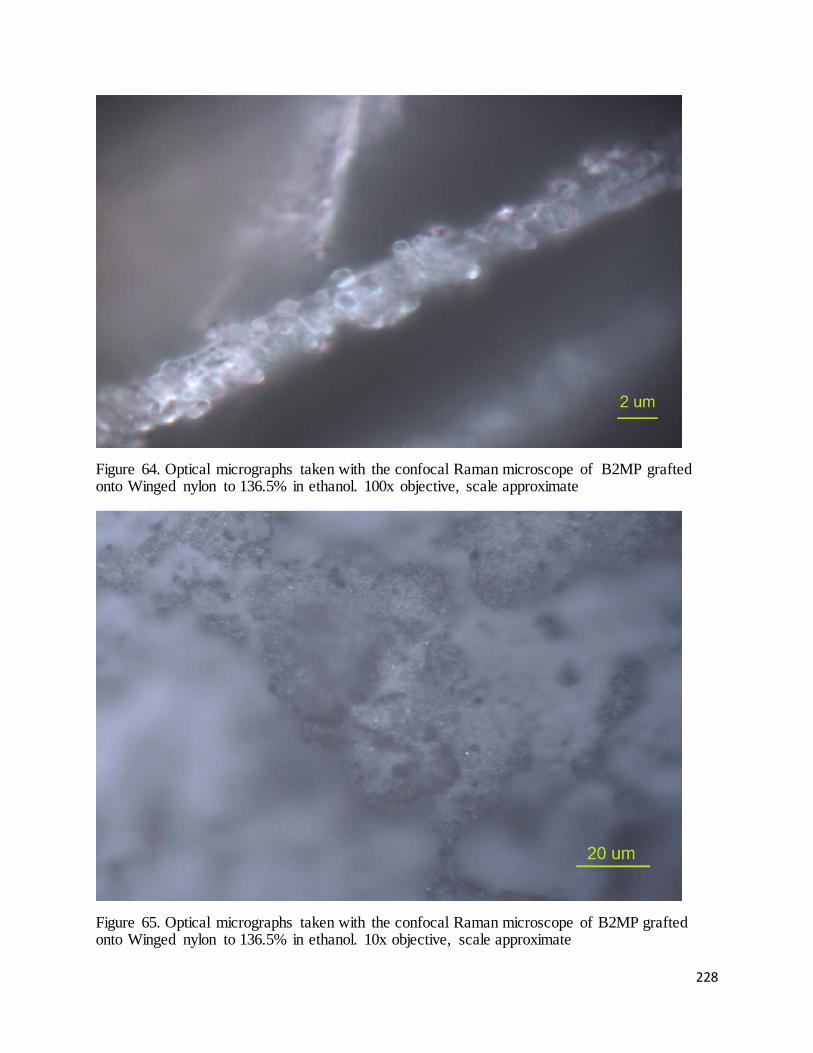
228
Figure 64. Optical micrographs taken with the confocal Raman microscope of B2MP grafted onto Winged nylon to 136.5% in ethanol. 100x objective, scale approximate
Figure 65. Optical micrographs taken with the confocal Raman microscope of B2MP grafted onto Winged nylon to 136.5% in ethanol. 10x objective, scale approximate
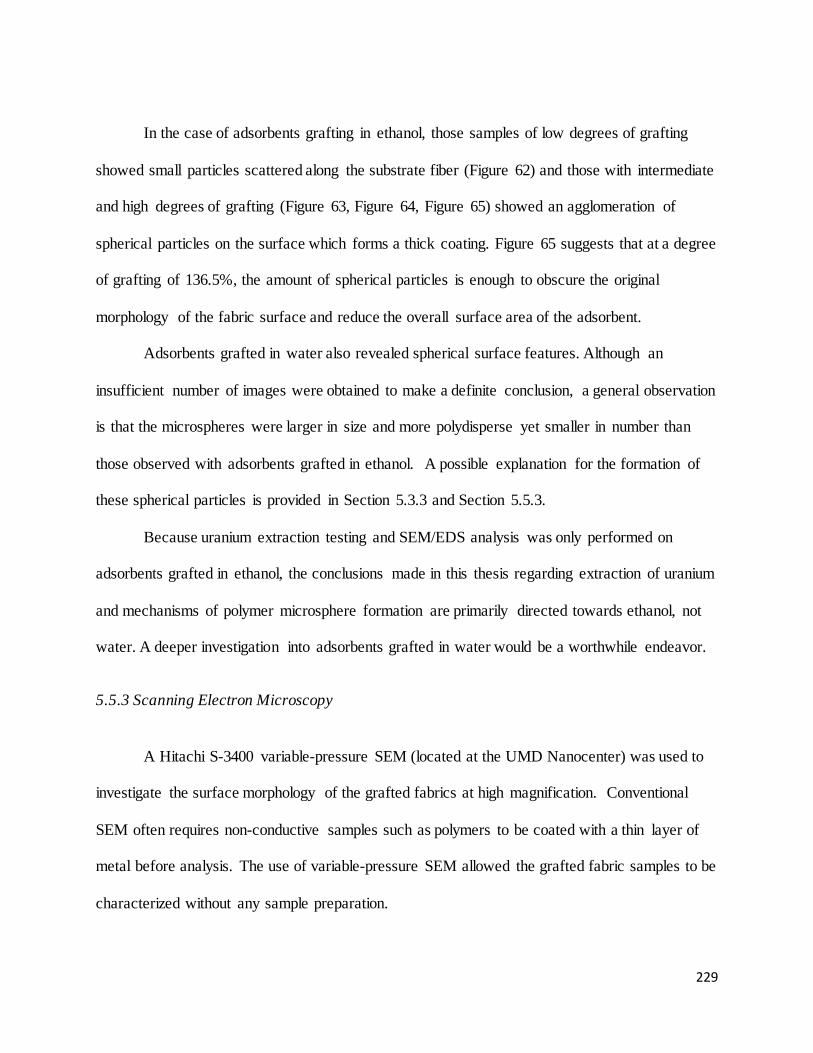
229
In the case of adsorbents grafting in ethanol, those samples of low degrees of grafting
showed small particles scattered along the substrate fiber (Figure 62) and those with intermediate
and high degrees of grafting (Figure 63, Figure 64, Figure 65) showed an agglomeration of
spherical particles on the surface which forms a thick coating. Figure 65 suggests that at a degree
of grafting of 136.5%, the amount of spherical particles is enough to obscure the original
morphology of the fabric surface and reduce the overall surface area of the adsorbent.
Adsorbents grafted in water also revealed spherical surface features. Although an
insufficient number of images were obtained to make a definite conclusion, a general observation
is that the microspheres were larger in size and more polydisperse yet smaller in number than
those observed with adsorbents grafted in ethanol. A possible explanation for the formation of
these spherical particles is provided in Section 5.3.3 and Section 5.5.3.
Because uranium extraction testing and SEM/EDS analysis was only performed on
adsorbents grafted in ethanol, the conclusions made in this thesis regarding extraction of uranium
and mechanisms of polymer microsphere formation are primarily directed towards ethanol, not
water. A deeper investigation into adsorbents grafted in water would be a worthwhile endeavor.
5.5.3 Scanning Electron Microscopy
A Hitachi S-3400 variable-pressure SEM (located at the UMD Nanocenter) was used to
investigate the surface morphology of the grafted fabrics at high magnification. Conventional
SEM often requires non-conductive samples such as polymers to be coated with a thin layer of
metal before analysis. The use of variable-pressure SEM allowed the grafted fabric samples to be
characterized without any sample preparation.
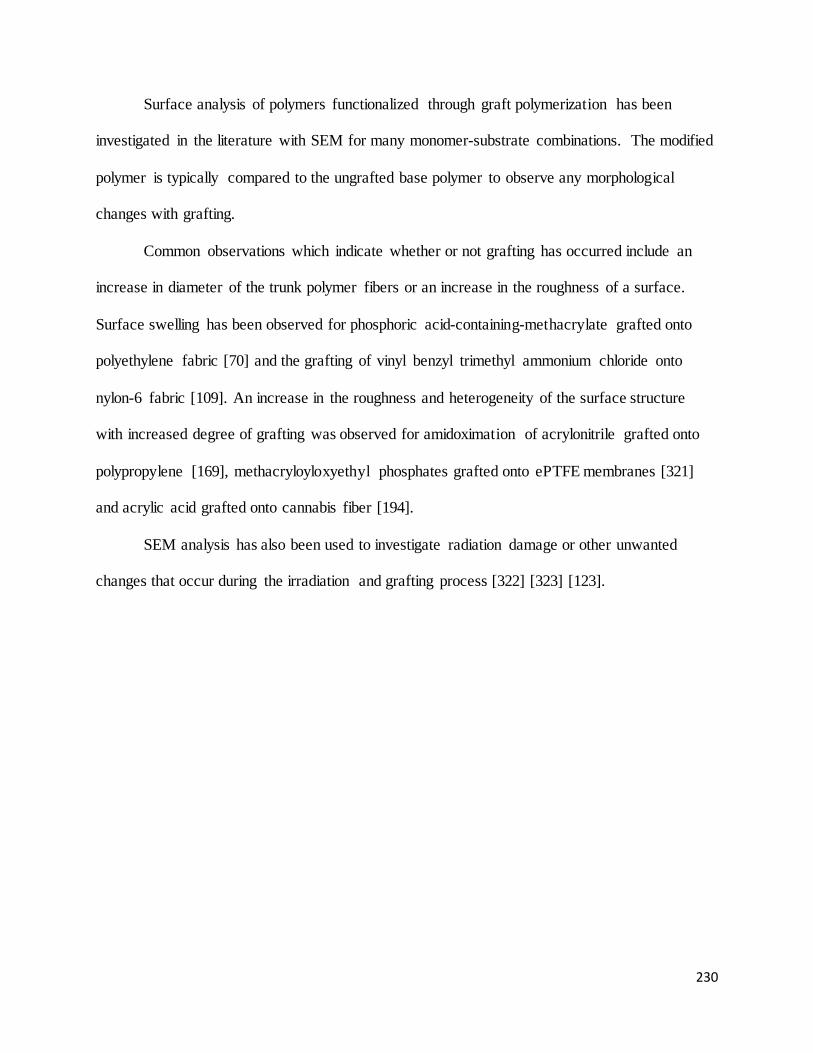
230
Surface analysis of polymers functionalized through graft polymerization has been
investigated in the literature with SEM for many monomer-substrate combinations. The modified
polymer is typically compared to the ungrafted base polymer to observe any morphological
changes with grafting.
Common observations which indicate whether or not grafting has occurred include an
increase in diameter of the trunk polymer fibers or an increase in the roughness of a surface.
Surface swelling has been observed for phosphoric acid-containing-methacrylate grafted onto
polyethylene fabric [70] and the grafting of vinyl benzyl trimethyl ammonium chloride onto
nylon-6 fabric [109]. An increase in the roughness and heterogeneity of the surface structure
with increased degree of grafting was observed for amidoximation of acrylonitrile grafted onto
polypropylene [169], methacryloyloxyethyl phosphates grafted onto ePTFE membranes [321]
and acrylic acid grafted onto cannabis fiber [194].
SEM analysis has also been used to investigate radiation damage or other unwanted
changes that occur during the irradiation and grafting process [322] [323] [123].
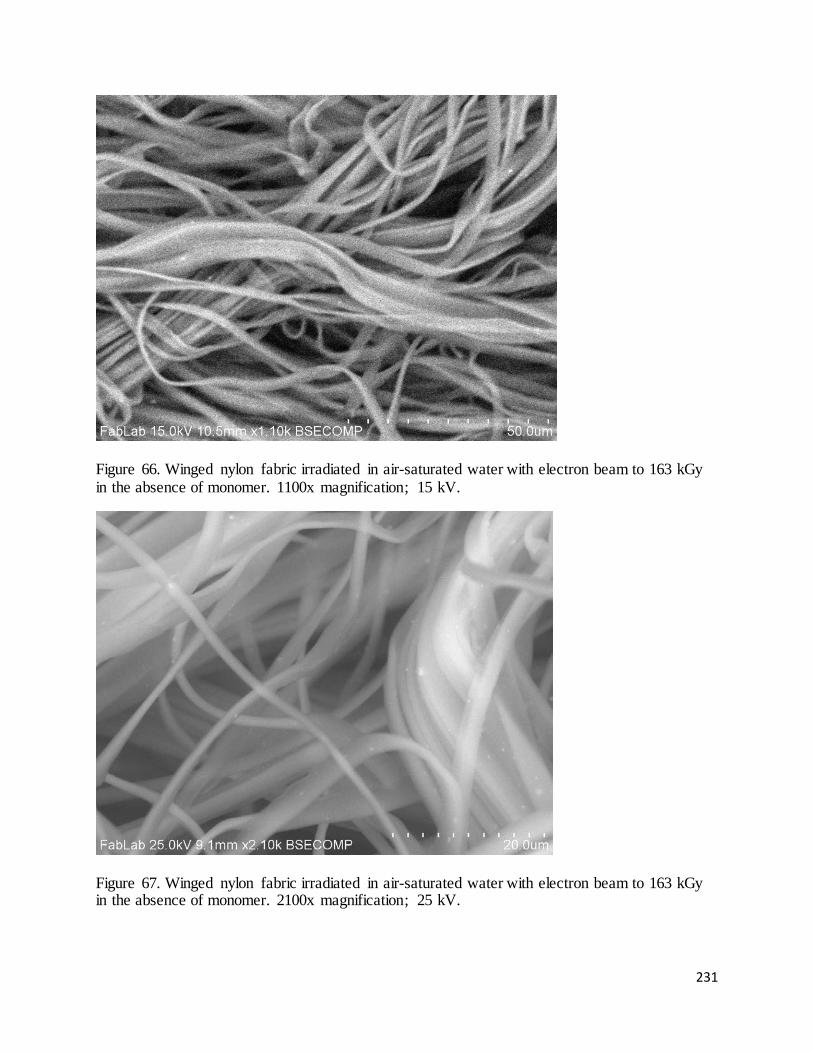
231
Figure 66. Winged nylon fabric irradiated in air-saturated water with electron beam to 163 kGy in the absence of monomer. 1100x magnification; 15 kV.
Figure 67. Winged nylon fabric irradiated in air-saturated water with electron beam to 163 kGy in the absence of monomer. 2100x magnification; 25 kV.
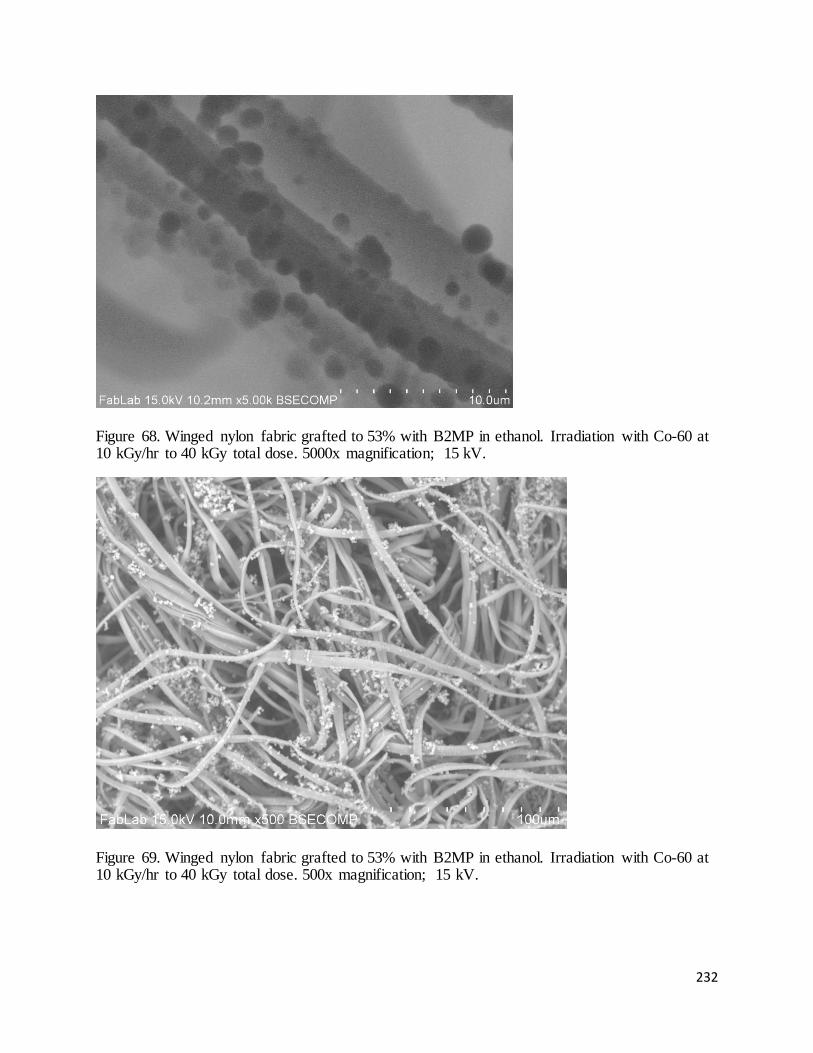
232
Figure 68. Winged nylon fabric grafted to 53% with B2MP in ethanol. Irradiation with Co-60 at 10 kGy/hr to 40 kGy total dose. 5000x magnification; 15 kV.
Figure 69. Winged nylon fabric grafted to 53% with B2MP in ethanol. Irradiation with Co-60 at 10 kGy/hr to 40 kGy total dose. 500x magnification; 15 kV.
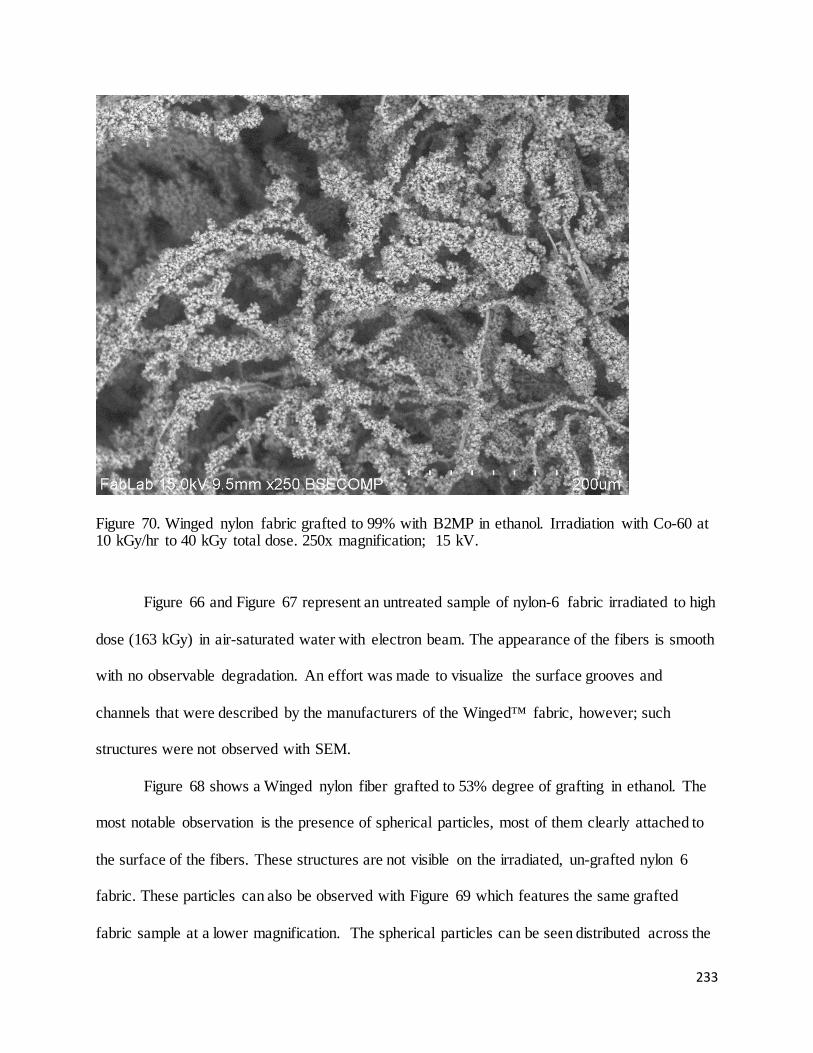
233
Figure 70. Winged nylon fabric grafted to 99% with B2MP in ethanol. Irradiation with Co-60 at 10 kGy/hr to 40 kGy total dose. 250x magnification; 15 kV.
Figure 66 and Figure 67 represent an untreated sample of nylon-6 fabric irradiated to high
dose (163 kGy) in air-saturated water with electron beam. The appearance of the fibers is smooth
with no observable degradation. An effort was made to visualize the surface grooves and
channels that were described by the manufacturers of the Winged™ fabric, however; such
structures were not observed with SEM.
Figure 68 shows a Winged nylon fiber grafted to 53% degree of grafting in ethanol. The
most notable observation is the presence of spherical particles, most of them clearly attached to
the surface of the fibers. These structures are not visible on the irradiated, un-grafted nylon 6
fabric. These particles can also be observed with Figure 69 which features the same grafted
fabric sample at a lower magnification. The spherical particles can be seen distributed across the
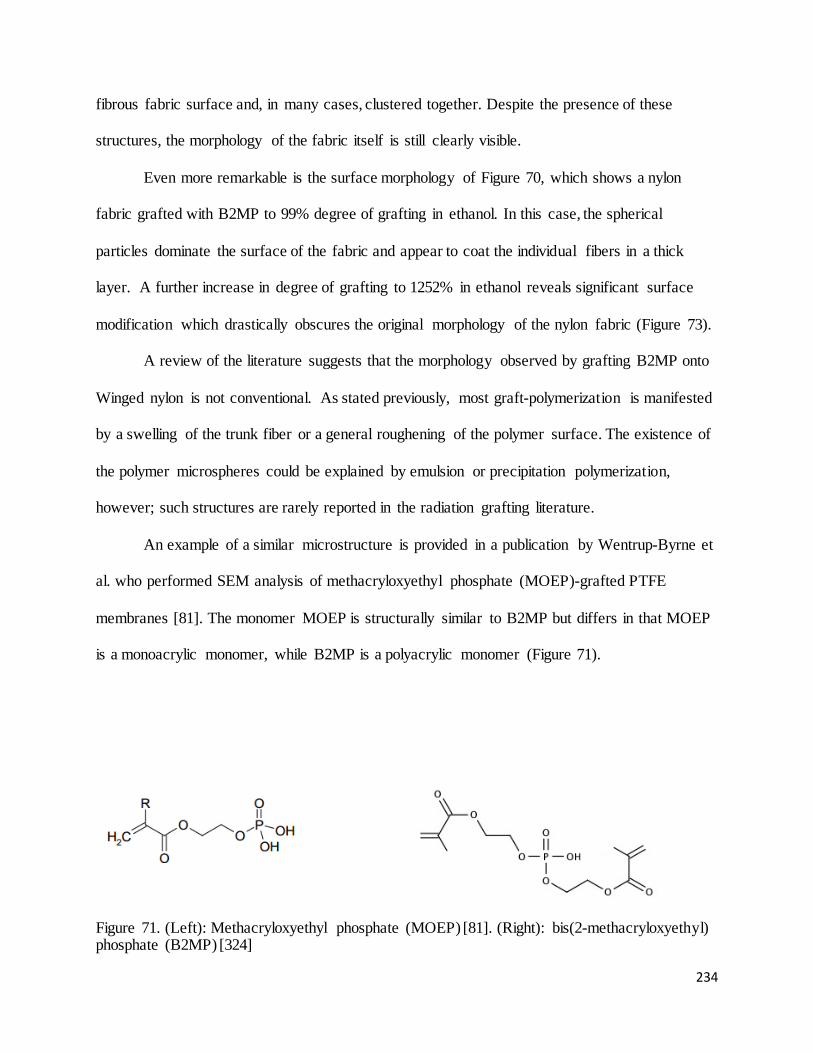
234
fibrous fabric surface and, in many cases, clustered together. Despite the presence of these
structures, the morphology of the fabric itself is still clearly visible.
Even more remarkable is the surface morphology of Figure 70, which shows a nylon
fabric grafted with B2MP to 99% degree of grafting in ethanol. In this case, the spherical
particles dominate the surface of the fabric and appear to coat the individual fibers in a thick
layer. A further increase in degree of grafting to 1252% in ethanol reveals significant surface
modification which drastically obscures the original morphology of the nylon fabric (Figure 73).
A review of the literature suggests that the morphology observed by grafting B2MP onto
Winged nylon is not conventional. As stated previously, most graft-polymerization is manifested
by a swelling of the trunk fiber or a general roughening of the polymer surface. The existence of
the polymer microspheres could be explained by emulsion or precipitation polymerization,
however; such structures are rarely reported in the radiation grafting literature.
An example of a similar microstructure is provided in a publication by Wentrup-Byrne et
al. who performed SEM analysis of methacryloxyethyl phosphate (MOEP)-grafted PTFE
membranes [81]. The monomer MOEP is structurally similar to B2MP but differs in that MOEP
is a monoacrylic monomer, while B2MP is a polyacrylic monomer (Figure 71).
Figure 71. (Left): Methacryloxyethyl phosphate (MOEP) [81]. (Right): bis(2-methacryloxyethyl) phosphate (B2MP) [324]
235
The authors of the paper observed a granular morphology for MOEP grafted onto PTFE
in methyl-ethyl ketone (MEK) which became more pronounced with increased monomer
concentration. SEM analysis revealed that the structure of the PTFE was completely obscured by
the granular structure. Similar analysis of MOEP grafted with methanol did not reveal a granular
structure, which led the authors to conclude that this microstructure was an effect of solvent
properties, not the monomer concentration or degree of grafting [81]. Specifically, the authors
have attributed the microstructure to a lack of solubility of MEOP in MEK, resulting in phase
separation.
Also similar to the work in this thesis was the observation of viscous gels after irradiation
with the effective solvent (methanol) and a turbid solution after irradiation with the non-solvent
(MEK). Large amounts of precipitated homopolymer were also observed. Further SEM analysis
of the homopolymer revealed similar morphologies to the granular structure obtained by grafting
in MEK.
A notable possibility is that ethanol is an effective solvent for B2MP monomer but a poor
solvent for B2MP polymerized to higher molecular weights (homopolymer), while water is a
poor solvent for both monomeric B2MP and B2MP homopolymer. In this case, the precipitate
(homopolymer) would still continue to be formed during irradiation despite initial solubility.
This phenomena is the basis for the precipitation polymerization.
Multi-functional monomers, such as B2MP, are often utilized to promote crosslinking.
Section 3.1 describes the crosslinking of poly-vinyl monomers which have been reported by
Nagaoka et al. to successfully undergo radiation-induced precipitation polymerization in the
absence of additional crosslinkers or additives [325]. Although no studies regarding
236
“precipitation grafting” have been reported, it is possible that the observed surface morphology is
a result of the emulsion (in water) or precipitation (in ethanol) polymerization of B2MP and
subsequent bonding of the formed polymer microspheres to the Winged nylon substrate.
This proposed mechanism may also explain why higher degrees of grafting are generally
obtained using water rather than ethanol, and why extraction performance decreases at very high
degrees of grafting. The non-solvent properties of water result in a larger amount of precipitate
reaching the substrate surface when compared to the amount produced in ethanol. In the case of
high monomer concentration, the homopolymerization reactions (M• + •M → M-M; M• + M →
M-M•) predominate, forming spheres or thick layers of monomer which graft to the substrate but
otherwise obscure the surface morphology of the fabric and drastically reduce the surface area.
Irradiation with ethanol to high doses results in formation of a gel within the
monomer/solvent mixture. The increased viscosity of the gel limits precipitation of the monomer
and hence, contact of the homopolymer with the substrate. This could also explain the reduced
amounts of homopolymer observed when grafting with ethanol.
5.5.4 Energy Dispersive X-Ray
Energy Dispersive X-ray (EDS) analysis was performed on two B2MP-grafted Winged
nylon fabrics, one grafted control sample (Figure 72) and another after contact with synthetic
seawater containing 3.25 ppb 233U (Figure 74). The goal was to investigate the identity and
concentration of non-uranium seawater ions present on the adsorbent after seawater extraction.
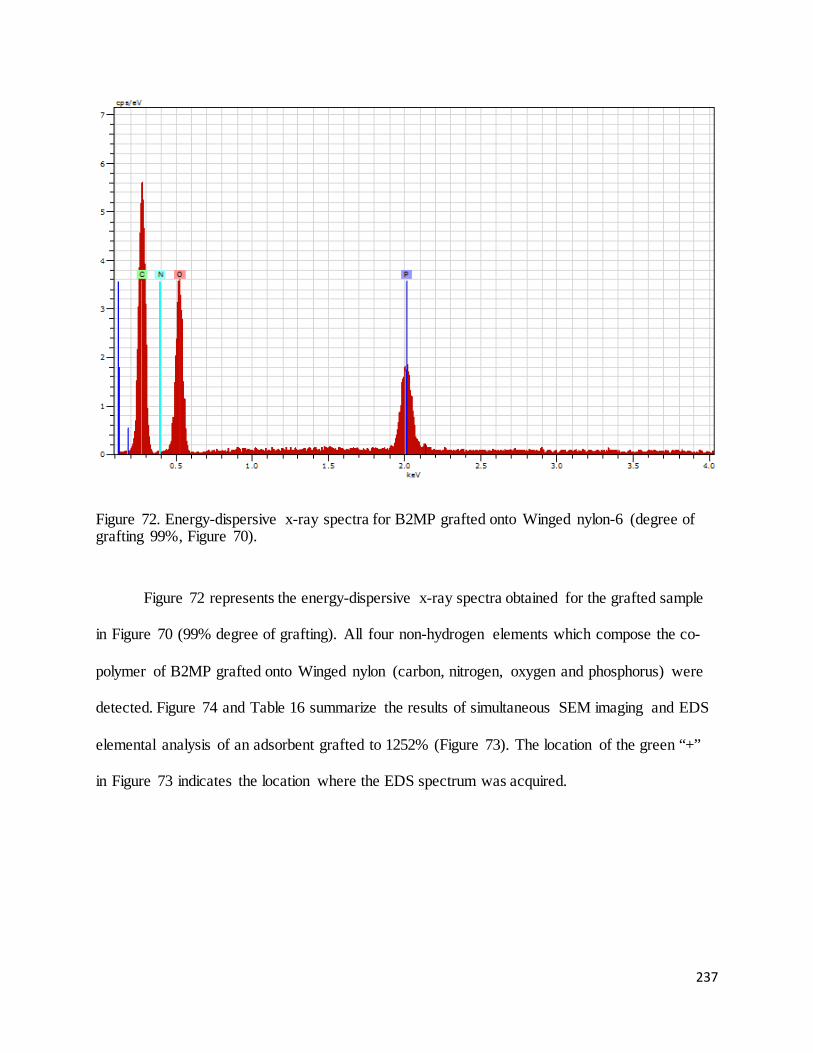
237
Figure 72. Energy-dispersive x-ray spectra for B2MP grafted onto Winged nylon-6 (degree of grafting 99%, Figure 70).
Figure 72 represents the energy-dispersive x-ray spectra obtained for the grafted sample
in Figure 70 (99% degree of grafting). All four non-hydrogen elements which compose the co-
polymer of B2MP grafted onto Winged nylon (carbon, nitrogen, oxygen and phosphorus) were
detected. Figure 74 and Table 16 summarize the results of simultaneous SEM imaging and EDS
elemental analysis of an adsorbent grafted to 1252% (Figure 73). The location of the green “+”
in Figure 73 indicates the location where the EDS spectrum was acquired.
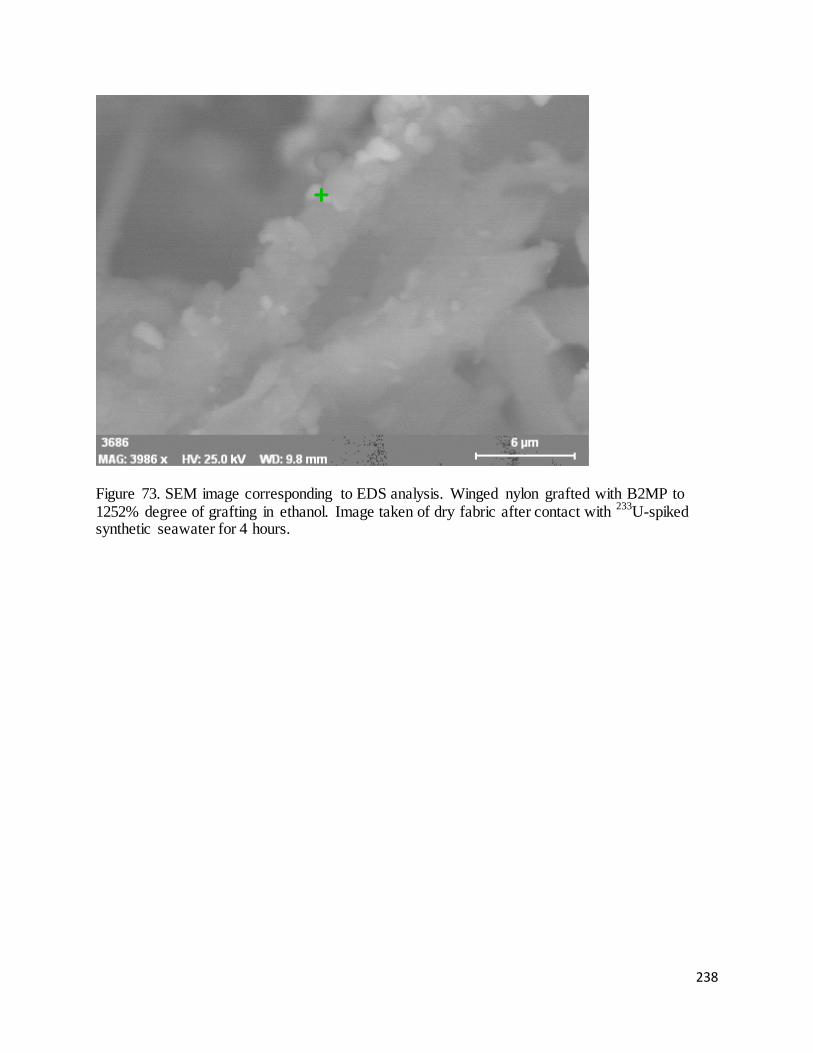
238
Figure 73. SEM image corresponding to EDS analysis. Winged nylon grafted with B2MP to 1252% degree of grafting in ethanol. Image taken of dry fabric after contact with 233U-spiked synthetic seawater for 4 hours.
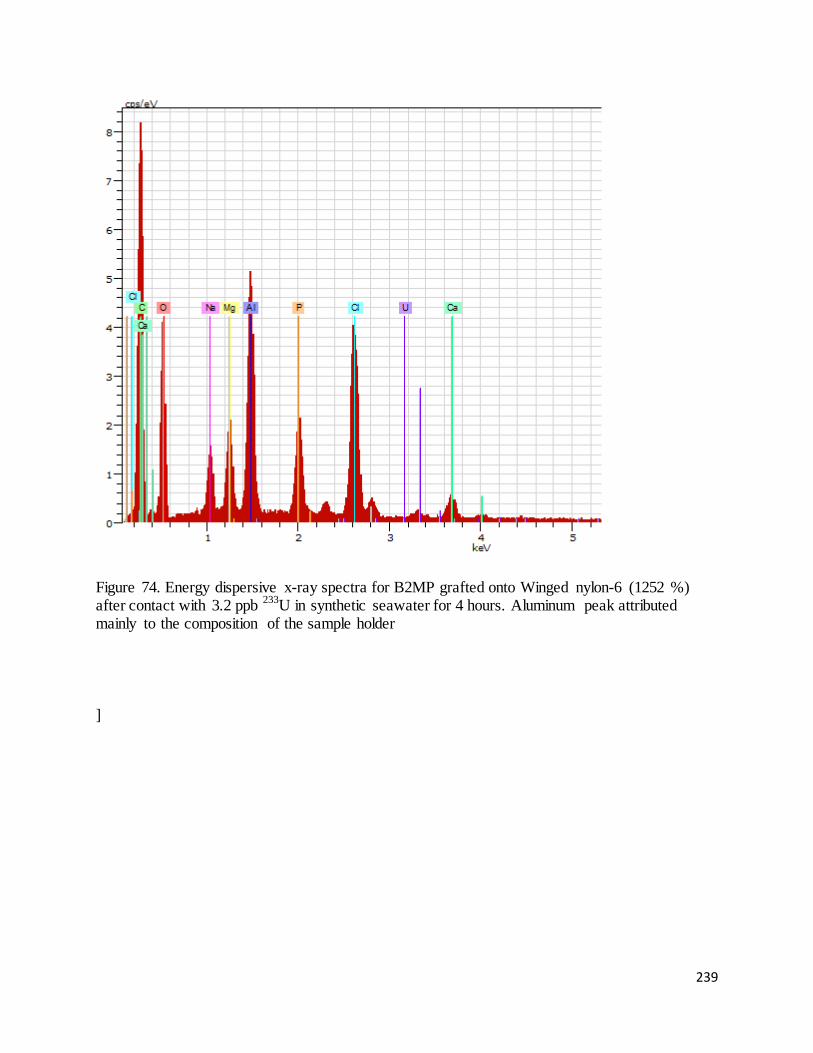
239
Figure 74. Energy dispersive x-ray spectra for B2MP grafted onto Winged nylon-6 (1252 %) after contact with 3.2 ppb 233U in synthetic seawater for 4 hours. Aluminum peak attributed mainly to the composition of the sample holder
]
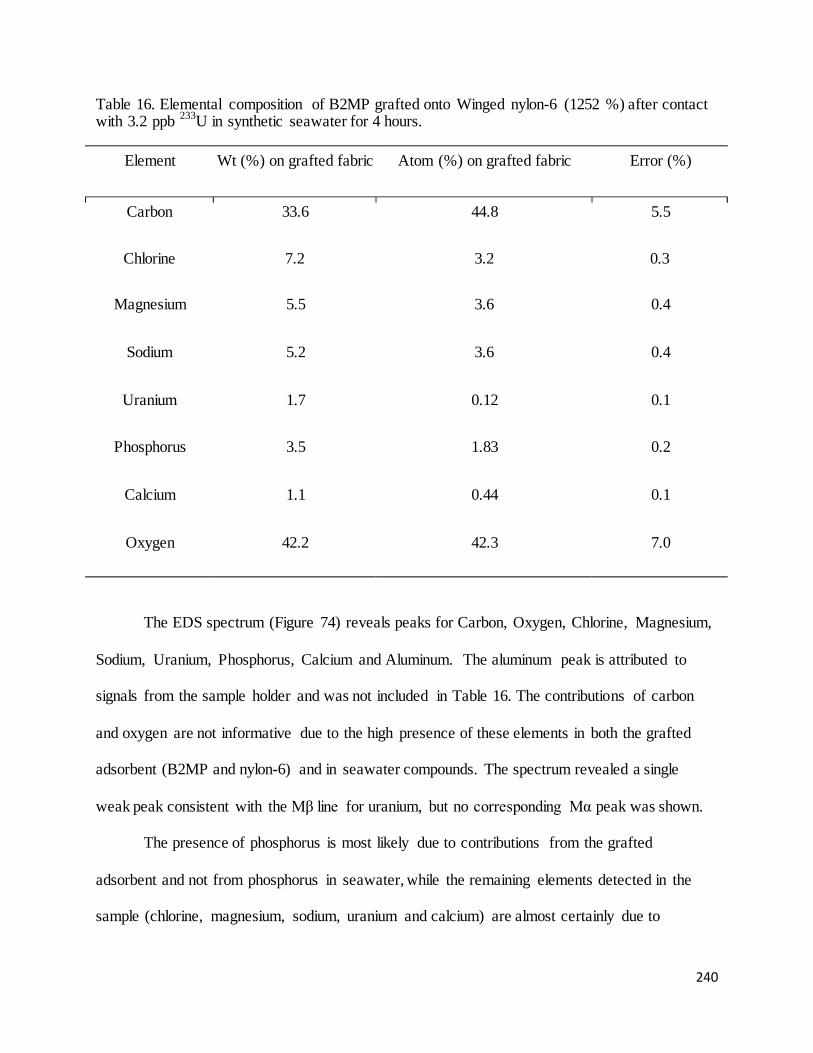
240
Table 16. Elemental composition of B2MP grafted onto Winged nylon-6 (1252 %) after contact with 3.2 ppb 233U in synthetic seawater for 4 hours.
Element Wt (%) on grafted fabric Atom (%) on grafted fabric Error (%)
Carbon 33.6 44.8 5.5
Chlorine 7.2 3.2 0.3
Magnesium 5.5 3.6 0.4
Sodium 5.2 3.6 0.4
Uranium 1.7 0.12 0.1
Phosphorus 3.5 1.83 0.2
Calcium 1.1 0.44 0.1
Oxygen 42.2 42.3 7.0
The EDS spectrum (Figure 74) reveals peaks for Carbon, Oxygen, Chlorine, Magnesium,
Sodium, Uranium, Phosphorus, Calcium and Aluminum. The aluminum peak is attributed to
signals from the sample holder and was not included in Table 16. The contributions of carbon
and oxygen are not informative due to the high presence of these elements in both the grafted
adsorbent (B2MP and nylon-6) and in seawater compounds. The spectrum revealed a single
weak peak consistent with the Mβ line for uranium, but no corresponding Mα peak was shown.
The presence of phosphorus is most likely due to contributions from the grafted
adsorbent and not from phosphorus in seawater, while the remaining elements detected in the
sample (chlorine, magnesium, sodium, uranium and calcium) are almost certainly due to
241
contributions from seawater. Chlorine (Cl-) and sodium (Na+) are by far the most abundant ions
in seawater [326]. Magnesium (Mg2+) and calcium (Ca2+) are also among the most abundant ions
in seawater and contributed to 3.6 and 0.44% of the adsorbent by atom fraction, respectively.
The presence of these elements on the adsorbent at high concentrations indicates that these
elements compete with uranium for binding sites on the adsorbent.
Although only the elements listed in Table 16 were abundant enough to be detected on
the adsorbent, is likely that uranium may compete with additional metal ions present in seawater.
For example, other studies involving amidoxime-based ligands have reported comparable
distribution coefficients between uranium and the metals lead, iron, cobalt and nickel [264].
These interactions could be investigated further with additional analysis with SEM/EDS.
It should be noted that these values are representative only of the region analyzed with
energy-dispersive x-ray and not of the entire adsorbent. A more comprehensive study would
include an elemental mapping of the cross-section of an adsorbent both before and after contact
with the 233U-spiked synthetic seawater. A change in ion concentration throughout the depth of
the adsorbent would reveal whether the sorbed ions are concentrated near the surface or are
evenly distributed throughout the depth of the grafted fabric. Similarly, this same analysis could
also reveal the distribution of phosphate functional groups throughout the depth of the grafted
fabric.
The relatively low abundance of uranium on the adsorbent compared to that of competing
ions may also explain the low adsorption capacity of the grafted fabric for uranium at natural
uranium concentrations. The highest sorption capacities observed during extraction testing were
in the range of 65 to 80%, leaving between 20 and 35% of the 233U spike remaining in the
seawater solution. The possibility of saturation of surface sites by competing ions may explain
242
why a plateau in uranium loading capacity was observed after several hours. To investigate this
possibility, a study involving the kinetics of uptake of these competing ions on the adsorbent
could be performed.
The adsorption of 233U from synthetic seawater was shown to correlated well with the
pseudo-second-order kinetic model (Section 5.4.3), indicating that the dominant mechanism of
adsorption of uranium was complexation with reactive sites on the adsorbent. The adsorption
mechanisms of the competing ions (sodium, chlorine, magnesium and calcium) on the grafted
adsorbent is not known and could be due to either physical or chemical mechanisms. Several
studies regarding the extraction of metals from seawater have investigated the adsorption
mechanisms of ions in competition with the primary ion of interest.
Should the work undertaken in this dissertation be continued, a kinetic study of the
adsorption of sodium, chlorine, magnesium and calcium could be performed through a similar
radiotracer technique to determine the mechanism of adsorption and time-to-maximum loading
of these elements. Alternatively, such elemental analysis could also be performed with ICP-MS.
Should kinetics studies of these elements also reveal a plateau in ion loading within several
hours, saturation of reactive sites on the adsorbent surface could likely be due to contributions
from these elements.
Another experiment that may provide insight into this phenomenon would involve
substantially increasing the concentration of 233U in the synthetic seawater solution. This should
increase the competitiveness between the highly-abundant ions and 233U. Although a higher
concentration would likely reduce the fraction of uranium removed from the solution, the overall
amount of uranium loaded on the adsorbent should theoretically increase.
243
Chapter 6. Conclusions
A polymeric adsorbent for uranium based on radiation-induced grafting was fabricated,
optimized, tested and characterized. After grafting various vinyl phosphate monomers onto two
polymeric substrates, the adsorbent of the highest degree of grafting was determined to be based
on a phosphate-containing poly-acrylate monomer (bis(2-methacryloxyethyl)phosphate) (B2MP)
grafted onto Winged nylon-6 fabric. The effects of radiation dose, dose rate, solvent, purging gas
and monomer concentration on the degree of grafting were investigated under conditions of both
electron beam and gamma irradiation. Grafting was confirmed via FTIR and Raman
spectroscopy and the morphology investigated with SEM/EDS. Adsorbents grafted to various
degrees of grafting were tested in a solution of synthetic seawater spiked with 3.3 ppb 233U
(natural uranium concentrations) to determine distribution coefficients for uranium as well as
uranium loading capacities. The contact times and temperatures of extraction were also varied to
investigate the kinetics and thermodynamics of uranium loading onto the grafted adsorbents.
Fabrication of the adsorbent involved preliminary grafting of the candidate phosphate-
containing monomers to the candidate Winged fabric substrates. Two ultra-high surface area
fabrics, Winged polypropylene and Winged nylon-6, were tested for grafting capacity using both
the indirect and direct grafting methods. Despite successful grafting of vinyl phosphate
monomers onto both fabrics, Winged polypropylene exhibited embrittlement and discoloration
after irradiation at the range of doses and dose rates necessary to obtain high degrees of grafting.
Winged nylon was selected as the polymer substrate for further testing after showing no visible
changes upon irradiation.
244
Five phosphorus-containing vinyl monomers were grafted onto Winged nylon-6 in both
water and ethanol. The degrees of grafting obtained with the four mono-functional monomers did
not exceed 14.1% in either solvent. Degrees of grafting obtained with the poly-functional
monomer B2MP exceeded 80% in both solvents. For this reason, B2MP was selected for all
future testing.
Radiation grafting was performed using both the indirect (pre-irradiation) and direct
(simultaneous) methods. The direct method was selected for future adsorbent synthesis after
displaying higher degrees of grafting at lower doses and with less consumption of time and
materials when compared to the indirect method. Preliminary experiments with B2MP grafting
onto Winged nylon identified water and ethanol as the two solvents which produced the highest
degrees of grafting. Water was determined to be a non-solvent for B2MP after rapid phase
separation of the monomer from the solvent was observed upon mixing, with large amounts of
homopolymer precipitate formed upon irradiation of the unstable monomer mixture. Although
ethanol showed complete solubility of B2MP prior to irradiation, the homopolymer formed also
underwent precipitation upon irradiation.
Interestingly, the homopolymer precipitate formed in the solution upon irradiation was
shown to bond with the substrate rather than inhibit the grafting reaction as observed in most
radiation grafting studies. Degrees of grafting were shown to increase with increasing monomer
concentration for B2MP grafted onto Winged nylon in water, ethanol and water with surfactant
(Tween 20). The synthesis of these grafted fabrics revealed a visible trend in surface morphology
with increasing degree of grafting, particularly the transition of the appearance of the grafted
Winged nylon samples from smooth and seemly un-altered (0 to 60%) to thicker and slightly
245
heterogeneous (61 to 100%) and finally the addition of visible hard spheres or layers of
homopolymer (>100%).
The optimization of irradiation variables was performed using both the University of
Maryland’s 1-9 MeV pulsed electron beam linear accelerator (LINAC) and 100 kCi Co-60
gamma irradiator. Irradiation times for Co-60 irradiation of water-based samples were shown to
be too long to observe trends in total dose. This was attributed to the rapid precipitation of
monomer from the aqueous solution and was accounted for by performing irradiation with
electron beam at high dose rates, reducing the irradiation time by two orders of magnitude. This
technique revealed a steady increase in degree of grafting until a plateau was reached after 40
kGy of absorbed dose. Irradiation of ethanol-based samples with Co-60 also revealed an increase
up to approximately 40 kGy, indicating that doses above value are not necessary to obtain high
degrees of grafting using both water and ethanol as solvents. Adding the surfactant Tween 20 to
aqueous samples was not shown to increase degree of grafting, nor was it shown to form a stable
emulsion. Dependence of degree of grafting on dose rate was observed with electron beam for
water-based samples and with Co-60 for ethanol-based samples. In both cases, degree of grafting
was shown to be highest for samples grafted at lower dose rates.
Based on the results of optimization testing, adsorbents for characterization and
extraction testing were all produced via Co-60 irradiation of B2MP onto Winged nylon at 10
kGy/hr to 40 kGy in pure ethanol. The degrees of grafting of the adsorbents were varied by
adjusting the concentration of B2MP. Under these conditions, degrees of grafting between 0 and
150% were easily obtained for B2MP concentrations in the range of 0.05 to 0.3 M.
The capacity of the adsorbents for extracting uranium from seawater was assessed using
testing solutions composed of synthetic seawater spiked with 233U to 3.3 ppb, simulating the
246
natural uranium concentration of Earth’s oceans. This is notably different from most published
works involving uranium extraction in which concentrations of 102 ppb or more are routinely
used to calculate distribution coefficient and uranium loading. To avoid the complications
involved with traditional detection of ions of low concentration in a medium of very high total
dissolved solids, extraction capacity was determined via liquid scintillation counting by
measuring the change in radioactivity of a 233U-spiked solution before and after contact with the
adsorbent.
Extraction capacity of the adsorbents was quantified by determining their distribution
coefficients (kd) for uranium as well as their uranium loading capacity under various conditions.
Distribution coefficients were in the range of 102 to 104 mL/g for adsorbents contacted with
synthetic seawater spiked with 3.25 ppb 233U. Although these values are several orders of
magnitude lower than those obtained by the highest-performing adsorbents in other studies, a
comparison between the effectiveness of the proposed adsorbent vs. the effectiveness of existing
adsorbents cannot be made without testing at higher concentrations of uranium or in larger
solution volumes.
The distribution coefficients of adsorbents grafted in ethanol to degrees of grafting
between 0 and 292% were derived and plotted. An increase in kd with increasing degree of
grafting was observed until approximately 75%, at which point the values for kd remained
constant until at least 150%. Adsorbents grafted to 292% revealed very poor distribution
coefficients. These results suggest that the dependence of extraction capacity on degree of
grafting may be attributed to an increase in phosphate functional groups through the range of 0 to
75%, followed by a decrease in adsorbent surface area caused by increasing homopolymer
formation on the surface of the nylon fabric.
247
Time-dependent sorption of 233U was studied for two sets of adsorbents, one grafted to
46% and another grafted to 104%. The first set (46%) revealed a slow increase in distribution
coefficient over the study period (480 minutes) while the second set (104%) showed a rapid
increase in kd followed by a plateau between 120 and 480 minutes. The data from both sets were
compared to three kinetic models: the pseudo-first-order model, the pseudo-second-order model
and the intra-particle diffusion model. Both sets corresponded well with the pseudo-second-order
model, indicating the rate-limiting adsorption step as chemisorption, likely the complexation
reaction between the uranium and the grafted phosphate. Extractions performed at 3.1, 22.3 and
39.1 °C revealed that loading of 233U on the adsorbents were shown to be highest when the
extraction was performed at greater temperatures.
Functional group analysis was performed on the adsorbents as well as the virgin Winged
nylon using FTIR (in attenuated total reflectance mode) and confocal Raman spectroscopy. A
comparison between un-irradiated (virgin) Winged nylon to Winged nylon irradiated in water
revealed no observable chemical changes using both FTIR and Raman, even after irradiation to
very high doses. This suggests that, for irradiation and grafting with electron beam, oxidation of
the nylon substrate was not a concern even in somewhat aerobic conditions. Also compared were
virgin Winged nylon along with Winged nylon grafted with B2MP to low (30.4%), intermediate
(50.3%) and high (136.5%) degrees of grafting. Changes that occurred upon grafting included
decreases in the amide (C-N, C=O at 1633 cm-1, N-H) and aliphatic (C-C, CH2) bands
representing the components of nylon-6 and an increase in bands associated with the monomer
B2MP (C=O at 1724 cm-1, P=O, P-O, C-O-C, CH3). These changes correspond well to FTIR and
Raman spectra discovered in the literature which describe nylon-6 as well as monomers
structurally similar to B2MP.
248
Energy-dispersive X-ray analysis was performed for B2MP grafted onto Winged nylon
after contacting the adsorbent with 233U-spiked synthetic seawater. Elemental analysis of the
adsorbent surface revealed several elements abundant seawater. These included chlorine,
sodium, magnesium, and calcium – elements which are present in seawater at concentrations
greater than one million times that of uranium. The presence of these elements on the adsorbent,
combined with the plateau in uranium sorption capacity observed for all adsorbents, indicates
that uranium exists in competition with other seawater elements for reactive sites.
Analysis of the adsorbent surface with scanning electron microscopy revealed a
morphology that is not commonly reported in the literature for graft copolymers. The smooth,
three-dimensional fibrous structure of the virgin Winged nylon fabric was clearly visible with
SEM and confocal Raman while analysis of Winged nylon grafted with B2MP revealed polymer
microspheres on the surfaces of the fibers. These particles were observed to increase in number
with increasing degree of grafting on the fiber surface. At very high degrees of grafting, the
grafted fibers appeared to be obscured by a coating of the polymer microspheres, likely yielding
a decrease in surface area of the absorbent.
Although this morphology is not commonly observed for graft co-polymerization, similar
results were reportedly obtained when grafting the mono-functional monomer methacryloxyethyl
phosphate onto PTFE (Section 5.5.3). The authors of this work attributed the spherical particles
to homopolymer formed upon precipitation of the monomer from the solvent. Likewise, the
formation of homopolymer microspheres observed for B2MP grafted onto Winged nylon could
be explained via the mechanisms of emulsion polymerization (for adsorbents grafted in water)
and precipitation polymerization (for adsorbents grafted in ethanol), although this has not been
proven experimentally. The mechanism behind the bonding of these microspheres to the polymer
249
substrate is also unknown (nor has a review of the literature revealed any similar behavior) but
may be due to crosslinking between sites on the surfaces of the polymer microspheres. These
mechanisms are discussed in Sections 5.3.3 and 5.5.3.
6.1 Future Work
Should investigation of the proposed adsorbents be continued in the future, there are several
recommendations which could serve to improve the adsorbent, prepare the adsorbent for full-
scale testing or better understand the mechanisms behind the synthesis of the adsorbent. A list of
these recommended tasks are as follows.
• Graft B2MP onto different polymer substrates (such as polyethylene) which may provide
higher degrees of grafting, greater radiation stability or more favorable mechanical
properties
• Perform 233U extraction testing on adsorbents fabricated in water, as opposed to ethanol
• Perform SEM analysis on adsorbents fabricated in water, as opposed to ethanol
• Perform uranium extraction testing at higher uranium concentrations to enable
comparison of the grafted adsorbents with competing technology
• Perform pH-dependent uranium extraction studies
• Perform uranium extraction studies in the presence of microorganisms to simulate the
effects of biofouling on the performance of the adsorbents
• Use gel permeation chromatography or dynamic light scattering to compare the
molecular weight distribution and polydispersity of B2MP microspheres produced by
polymerization in water and ethanol

250
• Investigate the mechanisms by which the B2MP microspheres attach to the nylon
substrate
• Use a universal testing machine to compare the mechanical properties of virgin,
irradiated and B2MP-grafted Winged nylon
• Perform temperature-controlled irradiations to determine the effects of increased
temperature on degree of grafting
• Perform FTIR and Raman spectroscopy on Winged nylon subjected to gamma irradiation
to assess extent of oxidation
• Develop a strategy for up-scaling the adsorbent production process
• Develop strategy for elution and regeneration of the adsorbent
• Test regenerative capacity of adsorbent after multiple elution/sorption cycles
• Consider the applicability of the technology towards other applications
o Extraction of rare earths or other desirable minerals from seawater
o Extraction of uranium from the waste brine of desalination plants
251
6.2. Significance of Work
The radiation-induced grafting of the di-functional monomer bis(2-methacryloxyethyl)
phosphate (B2MP) onto Winged nylon-6 fabric was demonstrated with both electron beam and
Co-60 gamma radiation. The proposed adsorbent can be synthesized in the absence of catalysts,
initiators, stabilizers and purging gases via a simultaneous irradiation and grafting process using
either water or ethanol. The irradiation conditions needed for synthesis are typical of most
commercial radiation processing applications using electron beam linear accelerators and high-
activity gamma irradiators.
An alternative method for determining the extraction efficiency of the grafted adsorbents
was developed and utilized with the purpose of testing the adsorbents in seawater at natural
uranium concentrations. Testing was performed using synthetic seawater spiked with a 233U
radiotracer. This enabled the determination of uranium concentrations using liquid scintillation
counting rather than conventional methods which feature an inadequate detection limit and poor
compatibility with seawater.
The adsorbent has been shown to remove uranium from synthetic seawater spiked with 233U
to natural uranium concentrations (~3.3 ppb). The relationship between degree of grafting and
extraction performance, the kinetics of uranium loading and the temperature dependence of
extraction were all determined using this method. The highest distribution coefficient and
uranium loading obtained in this work were 1.22 × 10⁴ mL/g and 1.0 × 10⁻² mg-U/g-adsorbent,
respectively. Although these values are lower than those reported for the highest-performing
adsorbents described in the literature, comparing the effectiveness of this adsorbent to those
produced in other studies is not straightforward due to the substantial differences in uranium
252
concentrations and solution volumes used for testing. A more thorough comparison of this
adsorbent to competing adsorbents would require additional testing at either increased uranium
concentrations or larger seawater volumes.
Aside from the development of an adsorbent, several other significant observations were
made in the course of this study. For one, the monomer B2MP was polymerized and grafted with
electron beam and gamma radiation in water and several alcohols. At this time, no other
application of this specific monomer or its response to radiation has been described.
Additionally, SEM analysis of the grafted adsorbents revealed a unique surface morphology of
which a mechanism has also not yet been described in the literature. Addressing these
developments, as well as the suggested continuation of uranium extraction testing at higher
concentrations, could be the framework of a future study which could further address the
applicability of the proposed adsorbent towards commercial extraction of uranium from
seawater.
253
References
[1] World Nuclear Association, "World Nuclear Power Reactors & Uranium Requirements," 2013. [Online]. [Accessed 27 May 2013].
[2] World Nuclear Association, 2012. [Online]. [Accessed 27 May 2013].
[3] M. Tamada, "Current Status of Technology for Collection of Uranium from Seawater," in Erice Seminar, 2009.
[4] ASTM, "ASTM D1141 - 98(2013) Standard Practice for the Preparation of Substitute Ocean Water," American Society for Testing and Materials, West Conshohocken, PA, 2013.
[5] U.S. EPA, "Uranium," 1 October 2012. [Online]. Available: http://www.epa.gov/radiation/radionuclides/uranium.html. [Accessed 8 June 2014].
[6] L. Zadovska, E. Kosorinova, L. Scerbakova and J. Lesny, "Environmental Chemistry of Uranium," Hungarian Electronic Journal of Sciences.
[7] J. Kim, Y. Oyola, C. Tsouris, C. Hexel, R. Mayes, C. Janke and S. Dai, "Characterization of Uranium Uptake Kinetics from Seawater in Batch and Flow-Through Experiments," Industrial & Engineering Chemistry Research, vol. 52, pp. 9433-9440, 2013.
[8] R. Davies, J. Kenedy, R. McIlroy, R. Spence and K. Hill, "Extraction of Uranium from Seawater," Nature, pp. 1110-1115, 1964.
[9] R. Hester and R. Harrison, Chemistry in the Marine Environment: Issues in Environmental Science and Technology, Royal Socienty of Chemistry, 2000.
[10] M. Rodman, L. Gordon and A. Chem, "Extraction of Uranium from Seawater: Evaluation of Uranium Resources and Plant Siting," Exxon Nuclear Company, 1979.
[11] J. Marinksy and Y. Marcus, Ion Exchange and Solvent Extraction, CRC Press, 1995, p. 121.
[12] L. Rao, "Recent International R&D Activities in the Extraction of Uranium from Seawater," Lawrence Berkeley National Laboratory, Berkeley, 2010.
[13] Tabushi, Y. Kobuke and T. Nishiya, "Extraction of Uranium from Seawater by Polymer-
254
Bound Macrocyclic Hexaketone," Nature, vol. 280, pp. 665-666, 1979.
[14] M. Tsezos and S. Noh, "Extraction of Uranium from Sea Water Using Biological Origin Adsorbents," The Canadian Journal of Chemical Engineering, pp. 559-561, 1984.
[15] H. Omichi, A. Katakai, T. Sugo and J. Okamoto, "A New Type of Amidoxime-Group-Containing Adsorbent for the Recovery of Uranium from Seawater," Separation Science & Technology, vol. 20, no. 2-3, 1985.
[16] T. Kago, A. Goto, K. Kusakabe and S. Morooka, "Preparation and Performance of Amidoxime Fiber Adsorbent for Recovery of Uranium from Seawater," Industrial & Engineering Chemistry Research, pp. 204-209, 1992.
[17] L. Astheimer, H. Schenk, E. Witte and K. Schwochau, "Development of Sorbers for the Recovery of Uranium from Seawater. Part 2. The Accumulation of Uranium from Seawater by Resins Containing Amidoxime and Inidoxime Funtional Groups," Separation Science & Technology, pp. 307-339, 1983.
[18] N. Kabay and H. Egawa, "Chelating Polymers for Recovery of Uranium from Seawater," Separation Science & Technology, pp. 135-150, 1994.
[19] S. Morooka, T. Kato, M. Inada, T. Kago and K. Kusakabe, "Modeling of an Adsorption Unit PAcked with Amidoxime Fiber Balls for the Recovery of Uranium from Seawater," Industrial and Engineering CHemistry Research, vol. 30, no. 1, pp. 190-196, 1991.
[20] N. Seko, A. Katakai, S. Hasegawa, M. Tamada, N. Kasai, H. Takeda and T. Sugo, "Aquaculture of Uranium in Seawater by a Fabric-Adsorbent Submerged System," Nuclear Technology, vol. 144, pp. 274-278, 2003.
[21] N. Seko and M. Tamada, "R&D Towards Recovery of Uranium from Seawater. Annex A - Nuclear Fission Energy".
[22] BBC News, "Uranium from Seawater Idea Boosted with Shrimp Shells," 22 August 2012.
[23] Y. Yue, X. Sun, R. Mayes, J. Kim, P. Fulvio, Z. Qiao, S. Brown, C. Tsouris, Y. Oyola and S. Dai, "Polymer-Coated Nanoporous Carbons for Trace Seawater Uranium Adsorption," Science China, vol. 56, no. 11, pp. 1510-1515, 2013.
[24] T. Prasad, A. Saxena, P. Tewari and D. Amoorthy, "An Engineering Scale Study on Radiation Grafting of Polymeric Adsorbents for Recovery of Heavy Metal Ions from Seawater," Nuclear Engineering & Technology, vol. 41, no. 8, pp. 1101-1108, October 2009.
255
[25] Y. Lu, "Coordination Chemistry in the Ocean," Nature Chemistry, vol. 6, pp. 175-177, March 2014.
[26] L. Zhou, M. Bosscher, C. Zhang, S. Ozcubukcu, L. Zhang, W. Zhang, C. Li, J. Liu, M. Jensen, L. Lai and C. He, "A Protein Engineered to BInd Uranyl Selectively and with Femptomolar Affinity," Nature Chemistry, vol. 6, pp. 236-241, March 2014.
[27] B. Bjoerk and P. Vallander, "Recovery of Uranium from Seawater using Wave Power and Floating Offshore Units," International Atomic Energy Agency, Stockholm, Sweden, 1981.
[28] N. Nobukawa, M. Kitamura, S. Swilem and K. Ishibashi, "Development of a Floating-type System for Uranium Extraction from Seawater using Sea Current and Wave Power," in Proceedings of the Fourth International Offshore and Polar Engineering Conference, Osaka, Japan, 1994.
[29] U.S. EPA, "Understanding Variation in Partition Coefficient, Kd, Values. Volume 1: The Kd Model, Methods of Measurement, and Application of Chemical Reaction Codes.," 1999.
[30] C. Jonah and B. Rao, Radiation Chemistry: Present Status and Future Trends, First ed., Elsevier Chemistry, 2001.
[31] Varian, Inc., Handbook of Sorbent Extraction Technology.
[32] G. Knoll, Radiation Detection and Measurement, Third ed., New York: John Wiley & Sons, 2000.
[33] R. Woods and A. Pikaev, Applied Radiation Chemistry: Radiation Processing, Wiley-Interscience, 1994.
[34] J. Bushberg, J. Seibert, E. Leidholdt and J. Boone, "Chapter 3 - Interaction of Radiation with Matter," in The Essential Physics of Medical Imaging, 2nd ed., Lippincott Williams & Wilkins, pp. 31-60.
[35] R. Bailey, H. Clark, P. Ferris, S. Krause and R. Strong, Chemistry of the Environment, Academic Press, 2002, pp. 522-523.
[36] J. Spinks and R. Woods, An Introduction to Radiation Chemistry, Third ed., New York: Wilery-Interscience, 1990.
[37] M. Loudon, Organic Chemistry, Fifth ed., Greenwood Village, Colorado: Roberts and Company, 2009, p. 211.
256
[38] B. Shaughnessy and J. Yu, "Autoacceleration in Free Radical Polymerization," Physical Letter Reviews, vol. 73, no. 12, pp. 1723-1726, 1994.
[39] K. Makuuchi and S. Cheng, Radiation Processing of Polymer Materials and Its Industrial Applications, John Wiley & Sons, Inc., 2012.
[40] M. Nasef, H. Saidi, H. Nor, K. Dahlan and K. Hashim, "Cation exchange membranes by radiation-induced graft copolymerization of styrene onto PFA copolymer films. I. Preparation and characterization of the graft copolymer," Journal of Applied Polymer Science, vol. 73, no. 11, pp. 2095-2102, September 1999.
[41] L. Gubler, N. Prost, S. Gursel and G. Scherer, "Proton exchange membranes prepared by radiation grafting of styrene/divinylbenzene onto poly(ethylene-alt-tetrafluoroethylene) for low temperature fuel cells," Solid State Ionics, vol. 176, no. 39-40, pp. 2849-2860, December 2005.
[42] M. Liddy, J. Garnett and R. Kenyon, "The Insolubilization of Trypsin by Attachment to Radiation Graft Copolymers of Propylene," Journal of Polymer Science: Polymer Symposia, vol. 49, no. 1, pp. 109-116, 1975.
[43] M. Nasef and O. Guven, "Radiation-Grafted Copolymers for Separation and Purification Purposes: Status, Challenges and Future Directions," Progress in Polymer Science, vol. 37, pp. 1597-1656, 2012.
[44] K. Kato, E. Uchida, E. Kang, Y. Uyama and Y. Ikada, "Polymer Surface with Graft Chains," Progress in Polymer Science, vol. 28, pp. 209-259, 2003.
[45] N. El-Sawy, "Amidoximation of Acrylonitrile Radiation-Grafted onto Low-Density Polyethylene and its Physiochemical Characterization," Polymer International, vol. 49, pp. 533-538, 2000.
[46] I. Ozawa, K. Saito, K. Sugita, K. Sato, M. Akiba and T. Sugo, "High-speed recovery of germanium in a convection-aided mode using functional porous hollow-fiber membranes," Journal of Chromatograftic Analysis, vol. 888, no. 1-2, pp. 43-49, August 2000.
[47] T. Shiraishi, T. M., K. Saito and T. Sugo, "Recovery of Cadmium from Waste of Scallop Processing with Amidoxime Adsorbent Synthesized by Graft-Polymerization," Radiation Physics and Chemistry, vol. 66, no. 1, pp. 43-47, 2003.
[48] S. Nishiyama, K. Saito, K. Saito, K. Sugita, K. Sato, M. Akiba, T. Saito, S. Tsuneda, A. Hirata, M. Tamada and T. Sugo, "High-speed Recovery of Antimony using Chelating Porous Hollow-Fiber Membrane," Journal of Membrane Science, vol. 214, pp. 275-281,
257
2003.
[49] V. Stannett, "Radiation Grafting - State of the Art," Radiation Physics and Chemistry, vol. 35, no. 1-3, pp. 82-87, 1990.
[50] J. Drobny, Ionizing Radiation and Polymers: Principles, Technology and Applications, William Andrew, 2012.
[51] A. Bhattacharya, J. Rawlins and P. Ray, Polymer Grafting and Crosslinking, John Wiley & Sons, Inc., 2009.
[52] P. Cheremisinoff, Handbook of Engineering Polymer Materials, CPC Press, 1997.
[53] N. Tsoulfanidis, Measurement and Detection of Radiation, Second ed., Washington, DC: Taylor & Francis, 1995.
[54] EAG, "ICP-OES and ICP-MS Detection Limit Guidance," May 2014. [Online]. Available: http://www.eag.com/documents/icp-oes-ms-detection-limit-guidance-BR023.pdf. [Accessed 29 June 2014].
[55] Perkin Elmer, "Technical Note: The 30-Minute Guide to ICP-MS," 2011. [Online]. Available: http://www.perkinelmer.com/pdfs/downloads/tch_icpmsthirtyminuteguide.pdf. [Accessed 29 June 2014].
[56] T. Crompton, Analysis of Seawater: A Guide for the Analyst and Environmental Chemist, Springer, 2006, p. 244.
[57] T. Garrison, Oceanography: An Invitation to Marine Science, Cengage Learning, 2006.
[58] S. Barber, S. Keley and R. Rogers, "Highly Selective Extraction of the Uranyl Ion with Hydrophobic Amidoxime-Functionalized Ionic Liquids via n2 Coordination," RSC Advances, vol. 2, pp. 8526-8530, 2012.
[59] S. Alexandratos, "Uranium Separation - Challenges and Opportunities: Recovery of Uranium from Seawater with Solid Sorbents," in Department of Energy Nuclear Fuel Resources Workshop, 2010.
[60] B. Kahn, Radioanalytical Chemistry, New York: Springer Science + Business Media, LLC, 2007.
[61] L. Mathias, "Polymer Science Learning Center," 2012. [Online]. Available: http://www.pslc.ws/. [Accessed 21 June 2014].
258
[62] R. Menzel, "Uranium, Radium and Thorium Content in Phosphate Rocks and their Potential Radiation Hazard," Journal of Agricultural Food Chemistry, vol. 16, no. 2, pp. 231-234, March 1968.
[63] N. Clavier, N. Dacheux, R. Podor and P. Le Coustumer, "Study of Actinides Incorporation in Thorium Phosphate-Diphosphate/Monazite Based Ceramics," Materials Research Society Proceedings, vol. 802, 2003.
[64] D. Corbridge, Phosphorus: Chemsitry. Biochemistry and Technology, Sixth ed., CRC Press, 2013.
[65] Y. Koide, H. Terasaki, H. Sato, H. Shosenji and K. Yamada, "Flotation of Uranium from Seawater with Phosphate Esters of C-Undecylcalix[4]resorcinarene," Bulletin of the Chemical Society of Japan, vol. 69, pp. 785-790, 1996.
[66] S. Das, A. Pandey, A. Athawale, V. Natarajan and V. Manchanda, "Uranium Preconcentration from Seawater using Phosphate Functionalized Poly(propylene) Fibrous Membrane," Desalination and Water Treatment, vol. 38, pp. 114-120, January 2012.
[67] M. Nasef, E. Shamsaei, H. Saidi, A. Ahmad and K. Dahlan, "Preparation and Characterization of Phosphoric Acid Composite Membrane by Radiation Induced Grafting of 4-vinylpyridine onto Poly(ethylene-co-tetrafuoroethylene) Followed by Phosphoric Acid Doping," Journal of Applied Polymer Science, vol. 128, no. 1, pp. 549-557, 2013.
[68] K. Saito, T. Kaga, H. Yamagishi, S. Rurusaki, T. Sugo and J. Okamoto, "Phosphorylated Hollow Fibers Synthesized by Radiation Grafting and Cross-linking," Journal of Membrane Science, vol. 43, no. 2-3, pp. 131-141, May 1989.
[69] Y. Nho, O. Kwon and C. Jie, "Introduction of Phosphoric Acid Group to Polypropylene Film by Radiation Grafting and its Blood Compatibility," Radiation Physics and Chemistry, vol. 64, no. 1, pp. 67-75, April 2002.
[70] F. Basuki, N. Seko, M. Tamada, T. Sugo and T. Kume, "Direct Synthesis of Adsorbent Having Phosphoric Acid with Radiation Induced Graft Polymerization," Journal of Ion Exchange, vol. 14, pp. 209-212, 2003.
[71] R. S. J. Liepins, N. Morosoff, V. Stannett, J. Duffy and F. Day, "Localized Radiation Grafting of Flame Retardants to Polyethylene Terephthalate. II. Vinyl Phosphonates," Journal of Applied Polymer Science, pp. 2403-2414, 1978.
[72] E. Wentryp-Byrne, S. Suzuki, J. Suwanasilp and L. Grondahl, "Novel Phosphate-Grafted ePTFE Copolymers for Optimum in vitro Mineralization," Biomedical Materials, p.
259
045010, 2010.
[73] X. Yunshu, F. Yibei, F. Yoshii and K. Makuuchi, "Sensitizing Effects of Polyfunctional Monomers on Radiation Crosslinking of Polychloroprene," Radiation Physics and Chemistry, vol. 53, pp. 669-672, 1998.
[74] N. Smeets, "Amphiphilic Hyperbranched Polymers from the Copolymerization of a Vinyl and Divinyl Monomer: The Potential of Catalytic Chain Transfer Polymerization," European Polymer Journal, vol. 49, no. 9, pp. 2528-2544, September 2013.
[75] W. Huang, H. Yang, X. Xue, B. Jiang, J. Chen, Y. Yang, H. Pu, Y. Liu, D. Zhang, L. Kong and G. Zhai, "Polymerization Behaviors and Polymer Branching Structures in ATRP of Monovinyl and Divinyl Monomers," Polymer Chemistry, vol. 4, pp. 3201-3211, 2013.
[76] C. Ang, J. Garnett, R. Levot and M. Long, "Polyfunctional Monomers as Additives for Enhancing the Radiation Copolymerization of Styrene with Polyethylene, Polypropylene and PVC," Journal of Applied Polymer Science, vol. 27, pp. 4893-4895, 1982.
[77] J. Fouassier and J. Rabek, Radiation Curing in Polymer Science and Technology, Springer Science & Business Media, 1993.
[78] J. Jang and Y. Jeong, "Synthesis and Flame-Retardancy of UV-Curable Methacryloyloxy Ethyl Phosphates," Fibers and Polymers, vol. 9, no. 6, pp. 667-673, 2008.
[79] H. Strassler, "Self-Etching Resin Adhesives," Inside Dentistry, vol. 3, no. 2, February 2007.
[80] Y. Zhang and Y. Wang, "Improved Degree of Conversion of Model Self-Etching Adhesives through their Interaction with Dentin," Journal of Dentistry, vol. 40, no. 1, pp. 57-63, January 2012.
[81] E. Wentrup-Byrne, L. Gondahl and S. Suzuki, "Methacryloxyethyl phosphate-grafted Expanded Polytetrafluoroethylene Membranes for Biomedical Applications," Polymer International, vol. 54, pp. 1581-1588, 2005.
[82] S. Chen and X. Li, "Molecular Design and Application of Divinyl Monomers to Synthesis of UV-curable Latex," Journal of Coating Technology Research, vol. 5, no. 4, pp. 439-445, 2008.
[83] S. Kizilel, G. Papavasiliou, J. Gossage and F. Teymour, "Mathematical Model for Vinyl-Divinyl Polymerization," Macromolecular Reaction Engineering, vol. 1, pp. 587-603, 2007.
260
[84] Z. Xing, J. Hu, M. Wang, W. Zhang, S. Li, Q. Gao and G. Wu, "Properties and Evaluation of Amidoxime-based UHMWPE Fibrous Adsorbent for Extraction of Uranium from Seawater," Science China, vol. 56, no. 11, pp. 1504-1509, November 2013.
[85] S. Choi and Y. Nho, "Radiation-induced Graft Copolymerization of Mixture of Acrylic Acid and Acrylonitrile onto Polypropylene Film," Korea Polymer Journal, vol. 6, no. 4, pp. 287-294, 1998.
[86] P. Kavakh, N. Seko, M. Tamada and O. Guven, "Adsorption Efficiency of a New Adsorbent Towards Uranium and Vanadium Ions at Low Concentrations," Separation Science & Technology, vol. 39, no. 7, pp. 1631-1643, 2004.
[87] R. Advincula, W. Brittain, K. Caster and J. Ruhe, Polymer Brushes, John Wiley & sons, 2006.
[88] G. Ham, Vinyl Polymerization: Part 1, vol. 1, New York, New York: Marcel Dekker, Inc., 1967.
[89] F. Szocs, M. Klimova and I. Chodak, "Fatique Effects on the Free Radical Stability in Irradiated Polypropylene Filled with Silica," Materials Letters, vol. 31, pp. 287-289, June 1997.
[90] B. Fuller, N. Lane and E. Benson, Life in the Frozen State, CRC Press, 2004.
[91] A. Babanalbandi, D. Hill, J. O'Donnell, P. Pomery and A. Whittaker, "An Electron Spin Resonance Study on y-irradiated Poly(L-lactic acid) and Poly(D,L-lactic acid)," Polymer Degradation and Stability, vol. 50, pp. 297-304, 1995.
[92] J. Rodie, "Quality Fabric of the Month - Featherweight Filtration," September/October 2013. [Online]. Available: http://www.textileworld.com/Issues/2012/September-October/Quality_Fabric_Of_The_Month/Featherweight_Filtration. [Accessed 23 June 2014].
[93] C. Maier and T. Calafut, Polypropylene: The Definitive User's Guide and Databook, Taylor & Francis, 2008.
[94] J. Karger-Kocsis, Polypropylene Structure, Blends and Composites, Springer Science & Business Media, 1995.
[95] J. Silverman, "Radiation Processing: The Industrial Applications of Radiation Chemistry," Journal of Chemical Education, vol. 58, no. 2, pp. 168-173, February 1981.
261
[96] B. Fairand, Radiation Sterilization for Health Care Produces: X-ray, Gamma and Electron Beam, CRC Press, 2001.
[97] M. Szycher and C. Sharma, Blood Compatible Materials and Devices: Perspectives Towards the 21st Century, CRC Press, 1990.
[98] J. Williams, "Chapter 35 - Stability of Polypropylene to Gamma Irradiation," in Radiation Effects of Polymers, American Chemical Society, 1991, pp. 554-568.
[99] S. Kurtz, UHMWPE Biomaterials Handbook: Ultra-high Molecular Weight Polyethylene in Total Joint Replacement and Medical Devices, Academic Press, 2009.
[100] J. Drobny, Radiation Technology for Polymers, CRC Press, 2002.
[101] G. Przybytniak, E. Kornacka, K. Mirkowski, M. Walo and Z. Zimek, "Functionalization of Polymer Surfaces by Radiation-Induced Grafting," Nukleonika, vol. 53, no. 3, pp. 89-95, 2008.
[102] J. Gooch, Encyclopedic Dictionary of Polymers, vol. 1, Springer Science and Business Media, 2010.
[103] M. Chanda and S. Roy, Industrial Polymers, Specialty Polymer, and Their Applications, CRC Press, 2008.
[104] M. Alger, Polymer Science Dictionary, Springer Science & Business Media, 1997.
[105] T. Whelan, Polymer Technology Dictionary, Springer Science & Business Media, 1994.
[106] N. Ramanik, R. Haldar, Y. Bhardwaj, S. Sabharwal, U. Niyogi and R. Khandal, "Radiation Processing of Nylon-6 for Improve Properties and Performance," Radiation Physics and Chemistry, pp. 199-205, 2009.
[107] N. Pramanik, R. Haldar, Y. Bhardwaj, S. Sabharwal, U. Niyogi and R. Khandal, "Radiation Processing of Nylon 6 by E-beam for Improved Properties and Performance," Radiation Physics and Chemistry, vol. 78, pp. 199-205, 2009.
[108] E. Gendy and I. El-Shanshoury, "Factors Effecting Radiation Grafting of N-vinylpyrrolidone onto Nylon-6 Fabric," Indian Journal of Fibre & Textile Research, vol. 30, pp. 437-443, December 2005.
[109] S. Kohle and A. Kumar, "Radiation-Induced Grafting of VInyl Benzyl Trimethyl Ammonium Chloride onto Nylon-6 Fabric," Radiation Physics and Chemistry, vol. 76, no.
262
5, pp. 901-906, 2007.
[110] L. Mascia and K. Hashim, "Carboxylic Acid Funtionalization of Nylon 6 by Radiation Grafting and Conversion to Zinc Salts: Effects on Physical Properties," Colloid Polymer Science, vol. 275, pp. 689-697, 1997.
[111] R. Huang and Y. Xu, "Pervaporation Separation of Acetic Acid-Water Mixtures using Modified Membranes. Part II. Gammaray-indued Grafted Polyacrylic Acid (PAA)-nylon 6 Membranes," Journal of Membrane Science, vol. 43, no. 2-3, pp. 143-148, 1989.
[112] I. Pantchev, P. Farquet, H. Surbeck and T. Meyer, "Surface-Modified Nylon 6,6 and Application for Adsorption and Detection of Uranium in Potable Water," Reactive & Functional Polymers, vol. 67, no. 2, 2007.
[113] P. Dworjanyn, J. Garnett, M. Long, Y. Nho and M. Khan, "Role of Homopolymer Suppressors in UV and Radiation Grafting in the Presence of Novel Additives," in Irradiation of Polymeric Materials, Washington, DC, 1992.
[114] S. Manahan, Fundamentals of Environmental Chemistry, Second ed., CRC Press, 2000.
[115] M. Lancaster, Green Chemistry: An Introductory Text, Royal Society of Chemistry, 2002.
[116] R. Arshady, "Suspension, Emulsion and Dispersion Polymerization: A Methodological Survey," Colloid & Polymer Science, vol. 270, pp. 717-732, 1992.
[117] K. Esumi, Polymer Interfaces and Emulsions, CRC Press, 1999.
[118] M. Nasef and I. Sugiarmawan, "Radiation Induced Emulsion Grafting of Glycidyl Methacrylate onto High Density Polyethylene: A Kinetic Study," Journal of Fundamental Sciences, vol. 6, no. 2, pp. 93-97, 2010.
[119] L. Z., F. Jin, B. Bao and X. Wang, "Modification of Silk Fiber via Emulsion Graft Copolymerization with Fluoroacrylate," Chinese Journal of Polymer Science, vol. 26, no. 3, pp. 353-362, 2008.
[120] X. Tan and Y. Xu, "Radiation Grafting of Maleic Anhydride onto Polypropylene in a Suspension System," Radiation Effects and Defects in Solids: Incorporating Plasma Science and Plasma Technology, vol. 163, no. 2, pp. 107-114, 2008.
[121] F. Khan, S. Ahmad and E. Kronfli, "y-Radiation-induced Emulsion Graft Copolymerization of MMA onto Jute Fiber," Advances in Polymer Technology, vol. 21, no. 2, pp. 132-140, 2002.
263
[122] K. Pietrucha, W. Pekala and J. Kroh, "Radiation Induced Graft Copolymerization of Methyl Methacrylate onto Chrome-tanned Pig Skins," Radiation Physics and Chemistry, vol. 18, no. 3-4, pp. 489-501, 1981.
[123] H. Ma, K. Morita, H. Hoshina and N. Seko, "Synthesis fo Amine-type Adsorbents with Emulsion Graft Polymerization of 4-hydroxybutyl Acrylate Glycidylether," Materials Sciences and Application, vol. 2, pp. 777-785, 2011.
[124] V. Mittal, Polymer Nanocomposites by Emulsion and Suspension Polymerization, Royal Society of Chemistry, 2010.
[125] I. Draganic, The Radiation Chemistry of Water, Elsevier, 2012.
[126] A. Pikaev and B. Ershov, Primary Products of the Radiolysis of Water and Their Reactivity, Defense Technical Information Center, 1968.
[127] M. Tubiana, Introduction to Radiobiology, CRC Press, 2005.
[128] B. Abel, U. Buck and A. D. W. Sobolewsi, "On the Nature and Signatures of the Solvated Electron in Water," Physical Chemistry Chemical Physics, vol. 14, pp. 22-34, 2012.
[129] Farhataziz and M. Rodgers, Radiation Chemistry: Principles and Applications, VCH Publishers, Inc., 1987.
[130] C. Von Sonntag, "Trends of Research in Radiation Chemistry," in Advanced Radiation Chemistry Research: Current Status, Vienna, IAEA, 1995.
[131] K. Nakken and A. Pihl, "On the Ability of Nitrous Oxide to Convert Hydrated Electrons into Hydroxyl Radical," Radiation Research, vol. 26, pp. 519-526, 1965.
[132] G. Gurdag and S. Sarmad, "Cellulose Graft Copolymers: Synthesis, Properties and Applications," in Polysaccharide Based Graft Copolymers, Springer-Verlag Berlin Heidelberg, 2013.
[133] J. Merz and W. Waters, "Some Oxidations Involving the Free Hydroxyl Radical," Journal of the Chemical Society, pp. S15-S25, 1949.
[134] T. McNally, G. McNally, M. Ahmad, W. Murphy and R. Kennedy, "Sorption and Diffusion of Fuel Components in Various Nylons," in ANTEC'97, Toronto, 1997.
[135] T. Ruth, "The Uses of Radiotracers in the Life Sciences," Reports on Progress in Physics, vol. 72, 2009.
264
[136] Eckert & Ziegler Isotope Products, "Eckert & Ziegler Reference & Calibration Sources," [Online]. Available: www.ezag.com. [Accessed 29 November 2013].
[137] BNL, "Chart of the Nuclides," 2011. [Online]. Available: http://www.nndc.bnl.gov/chart/reCenter.jsp?z=92&n=140. [Accessed 20 July 2014].
[138] A. Pearce, "NPL Report IR 6: Recommended Nuclear Decay Data," National Physical Laboratory, 2014.
[139] J. Kang and F. von Hippel, "U-232 and the Proliferation-Resistance of U-233 in Spent Fuel," Science & Global Security, vol. 9, pp. 1-32, 2001.
[140] National Nuclaer Data Center, "Chart of the Nuclides," [Online]. Available: http://www.nndc.bnl.gov/chart/. [Accessed 6 April 2014].
[141] Knolls Atomic Power Laboratory, Nuclides and Isotopes: Chart of the Nuclides, Sixteenth ed., E. Baum, H. Knox and T. Miller, Eds., Lockheed Martin, 2002.
[142] J. Keller, "Applied Radiation Measurements," in Radioanalytical Chemistry , New York, NY, Springer Science+ Business Media, LLC, 2007, pp. 134-163.
[143] F. Monna, D. Mathieu, A. Marques, J. Lancelot and M. Bernat, "A Comparison of PERALS to Alpha Spectrometry and Beta Counting: A Measure of the Sedimentation Rate in a Coastal Basin," Analytica Chimica Acta, vol. 330, pp. 107-115, 1996.
[144] Packard Instrument Company, "Application Note: The Effect of Quenching on Quantitating Alpha Radionuclides by Liquid Scintillation Counting".
[145] J. McKlveen and W. McDowell, "Liquid Scintillation Alpha Spectrometry Techniques," Nuclear Instruments and Methods in Physics Research, vol. 223, pp. 372-376, 1984.
[146] R. Blackburn and M. Al-Masri, "Determination of Uranium by Liquid Scintillation and Cerenkov Counting," Analyst, p. 119, 1994.
[147] H. Prichard and T. Gesell, "Rapid Measurements of 222Rn Concentrations in Water with a Commercial Liquid Scintillation Counter," Health Physics, vol. 33, no. 6, 1977.
[148] M. Cooper and M. Wilks, "An Analytical Method for Radium (226Ra) in Environmental Samples by the Use of Liquid Scintillation Counting," Australian Radiation Laboratory, Yallambie, Victoria, 1981.
[149] A. Younes, G. Montavon, C. Alliot, M. Mokili, F. Haddad, D. Deniaud and J. Champion,
265
"A Route for Polonium-210 Production from Alpha Irradiated Bismuth-209 Target," Radiochimica Acta, p. In Press, 2012.
[150] G. Wallner and S. Ayromlou, "Determining Thorium in Urine by Liquid Scintillation Counting," in Liquid Scintillation Spectrometry, 1994.
[151] S. Pomme, T. Altzitzoglou, R. Van Ammel, G. Sibbens, R. Eykens, S. Rickter, J. Camps, K. Kossert, H. Janssen, E. Garcia-Tarano, T. Duran and F. Jaubert, "Experimental Determination of the 233U Half-Life," Metrologia, vol. 46, pp. 439-449, 2009.
[152] D. Horrocks, "Measurement of Low Levels of Normal Uranium in Water and Urine by Liquid Scintillation Alpha Counting," Nuclear Instruments and Methods, vol. 117, no. 2, pp. 589-595, May 1974.
[153] M. Cooper and M. Wilks, "Liquid Scintillation Counting of Alpha-Emitting Nuclides of the Uranium Series," Australian Radiation Laboratory, Yallamie, Victoria, 1983.
[154] National Diagnostics, "Principles and Applications of Liquid Scintillation Counting," National Diagnostics, 2004.
[155] W. McDowell and B. McDowell, Liquid Scintillation Alpha Spectrometry, CRC Press, Inc., 1994.
[156] PerkinElmer, "Features and Benefits Guide for Tri-Carb Liquid Scintillation Analyzers," PerkinElmer Life and Analytical Sciences, Shelton, CT, 2005.
[157] M. L'Annunziata, Handbook of Radioactivity Analysis, Academic Press, 2012.
[158] L. Currie, "Limits for Qualitative Detection and Quantitative Determination. Application to Radiochemistry," Analytical Chemistry, vol. 40, no. 3, pp. 586-293, March 1968.
[159] R. Faires and G. Boswell, Radioisotope Laboratory Techniques, London, UK: Butterworths, 1981.
[160] Packard, "Cocktail for Acidified Sea Water," Packard Instrument Company, Meriden, CT, 1997.
[161] ThermoNicolet, "Introduction to Fourier Transform Infrared Spectrometry," Thermo Nicolet Corporation, Madison, WI, 2001.
[162] P. Larkin, Infrared and Raman Spectroscopy; Principles and Spectral Interpretation, Elsevier, 2011.
266
[163] B. Smith, Fundamentals of Fourier Transform Infrared Spectroscopy, CRC Press, 2011.
[164] J. Robinson, E. Frame and G. Frame, Undergraduate Instrumental Analysis, Sixth ed., CRC Press, 2004.
[165] R. Young and P. Lovell, Introduction to Polymers, Third ed., CRC Press, 2011.
[166] A. Seidel, Characterization and Analysis of Polymers, John Wiley & Sons, 2008.
[167] Bruker, "Differentiation of Polyamides vis FT-IR Spectroscopy - Application Note AN # 98," 2012. [Online]. [Accessed 5 July 2014].
[168] Z. Li, F. Jin, B. Cao and X. Wang, "Modification of Silk Fiber via Emulsion Graft Copolymerization with Fluoroacrylate," Chinese Journal of Polymer Science, vol. 26, no. 3, pp. 353-362, 2008.
[169] C. Na, H. Park and B. Kim, "Optimal Amidoximation Conditions of Acrylonitrile Grafted Onto Polypropylene by Photoirradiation-Induced Graft Polymerization," Journal of Applied Polymer Science, vol. 125, pp. 776-785, 2012.
[170] T. Dargaville, G. George and D. Hill, "High Energy Radiation Grafting of Fluoropolymers," Progress in Polymer Science, vol. 28, no. 9, pp. 1355-1376, 2003.
[171] N. Walsby, M. Paronen, J. Juhanoja and F. Sundholm, "Radiation Grafting of Styrene onto Poly(vinylidene flouride) Films in Propanol: The Influence of Solvent and Synthesis Conditions," Journal of Polymer Science Part A: Polymer Chemistry, vol. 38, no. 9, pp. 1512-1519, May 2000.
[172] B. Gupta, J. Highfield and G. Scherer, "Proton-exchange Membranes by Radiation Grafting of Styrene onto FEP Films. II. Mechanism of Thermal Degradation in Copolymer Membrances".
[173] V. Barrios, J. Mendez, N. Aguilar, G. Espinosa and J. Rodriguez, "FTIR - An Essential Characterization Technique for Polymeric Materials," in Infrared Spectroscopy - Materials Science, Engineering and Technology, InTech , 2012, pp. 195-214.
[174] PerkinElmer, "FT-IR Spectroscopy: Attenuated Total Reflectance," 2005. [Online]. Available: http://www.utsc.utoronto.ca/~traceslab/ATR_FTIR.pdf. [Accessed 4 July 2014].
[175] L. Sawyer, D. Grubb and G. Meyers, Polymer Microscopy, Third ed., Springer Science & Business Media, 2008.
267
[176] J. Ferraro, Introductory Raman Spectroscopy, Academic Press, 2003.
[177] N. Sharma, B. Tripathi, A. Shrivastava and R. Chauhan, "Laser Raman Studies of Fibrous Polymer - A Review," International Journal of Engineering and Management Sciences, vol. 5, no. 2, pp. 128-139, 2014.
[178] R. McCreery, Raman Spectroscopy for Chemical Analysis, John Wiley & Sons, 2005.
[179] J. Shaver, "Chemometrics for Raman Spectroscopy," in Handbook of Raman Spectroscopy: From the Research Laboratory to the Process Line, CRC Press, 2001.
[180] J. Koenig, Spectroscopy of Polymers, Elsevier, 1999.
[181] T. Crompton, Practical Polymer Analysis, New York: Plenum Press, 1993.
[182] J. Cazes, Analytical Instrumentation Handbook, Third ed., CRC Press, 2004.
[183] Horiba Scientific, "What is Confocal Raman Microscopy?," 2014. [Online]. Available: http://www.horiba.com/us/en/scientific/products/raman-spectroscopy/raman-academy/raman-faqs/what-is-confocal-raman-microscopy/. [Accessed 5 July 2014].
[184] UMD Surface Analysis Center, "SAC-01: H-Y-J Raman Microscope (Chemistry)," 2014. [Online]. Available: https://www.nanocenter.umd.edu/equipment/detail.php?id=sc14d6bd8d4be0e7. [Accessed 21 May 2014].
[185] G. Michler, Electron Microscopy of Polymers, Springer Science & Business Media, 2008.
[186] W. Zhou and Z. Wang, Scanning Microscopy for Nanotechnology: Techniques and Applications, Springer Science & Business Media, 2007.
[187] AMMRF, "Background Information - What is Scanning Electron Microscopy?," 21 February 2014. [Online]. Available: http://www.ammrf.org.au/myscope/sem/background/. [Accessed 15 July 2014].
[188] M. Shin, B. Lee, S. Kim, J. Lee, G. Spinks, S. Gambhir, G. Wallace, M. Kozlov, H. Baughman and S. Kim, "Synergistic Toughening of Composite Fibers by Self-Alignment of Reduced Graphene Oxide and Carbon Nanotubes," Nature Communications, vol. 3, p. 650, 2012.
[189] C. You and D. Jia, "Effect of Styrene-Ethylene/Propylene Diblock Copolymer (SEP) on the Compatibilization of PP/PS Blends," Chinese Journal of Polymer Science, vol. 21, no.
268
4, pp. 443-446, 2003.
[190] W. Ding, A. Eitan, F. Fisher, X. Chen, A. Dikin, R. Andrews, L. Brinson, L. Schadler and R. Ruoff, "Direct Observation of Polymer Sheathing in Carbon Nanotube-Polycarbonate Composites," Nano Letters, vol. 3, no. 11, pp. 1593-1597, 2003.
[191] Z. Qiao, S. Chai, K. Nelson, Z. Bi, J. Chen, S. Mahurin, X. Zhu and S. Dai, "Polymeric Molecular Sieve Membranes via In Situ Cross-linking of Non-Porous Polymer Membrane Templates," Nature Communications, p. In Press, 16 April 2014.
[192] H. Sung, C. Meredith, C. Johnson and Z. Galis, "The Effect of Scaffold Degradation Rate on Three-Dimensional Cell Growth and Angiogenesis," Biomaterials, vol. 25, pp. 5735-5742, 2004.
[193] C. Feng, K. Khulbe, T. Matsuura and A. Ismail, "Recent Progresses in Polymeric Hollow Fiber Membrane Preparation, Characterization and Applications," Separation and Purification Technology, vol. 111, pp. 43-71, 2013.
[194] A. Singha and A. Rana, "Kinetics of Graft Copolymerization of Acrylic Acid onto Cannabis Indica Fibers," Iranian Polymer Journal, vol. 20, no. 11, pp. 913-929, 2011.
[195] L. Li and C. Lin, "SEM-EDS Investigations of Self-Phosphating Coatings," Indian Engineering and Chemistry Research, vol. 33, pp. 3241-3246, 1994.
[196] G. Wei and P. Ma, "Macroporous and Nanofibrous Polymer Scaffolds and Polymer/Bone-like Apatite Composite Scaffolds Generated by Sugar Spheres," Journal of Biomedical Materials Research Part A, vol. 78A, no. 2, pp. 306-315, 2006.
[197] H. Liang, M. Hong, R. Ho, C. Chung, Y. Lin, C. Chen and H. Sung, "Novel Method Using a Temperature-Sensitive Polymer (Methylcellulose) to Thermally Gel Aqueous Alginate as a pH-Sensitive Hydrogel," Biomacromolecules, vol. 5, pp. 1917-1925, 2004.
[198] A. Khursheed, Scanning Electron Microscope Optics and Spectrometers, World Scientific, 2011.
[199] L. Reimer, Scanning Electron Microscopy, Springer Science & Business Media, 1998.
[200] I. Materials Evaluation and Engineering, "Scanning Electron Microscopy," 2009. [Online]. Available: http://mee-inc.com/sem.html. [Accessed 15 July 2014].
[201] K. Kim, Z. Akase, T. Suzuki and D. Shindo, "Charging Effects on SEM/SIM Contrast of Metal/Insulator System in Various Metallic Coating Conditions," Materials Transactions,
269
vol. 51, no. 6, pp. 1080-1083, 2010.
[202] S. Prukop and A. Barron, "SEM and its Applications for Polymer Science," in Physical Methods in Chemistry and Nanoscience, Rice University, 2014.
[203] N. Tuzun, V. Aviyente and K. Houk, "A Theoretical Study on the Mechanism of the Cyclopolymerization of Diallyl Monomers," Journal of Organic Chemistry, vol. 68, pp. 6369-6374, 2003.
[204] A. Matsumoto, T. Kumagai, H. Aota, H. Kawasaki and R. Arakawa, "Reassessment of Free-Radical Polymerization Mechanism of Allyl Acetate Based on End-Group Determination of Resulting Oligomers by MALDI-TOF-MS Spectroscopy," Polymer Journal, vol. 41, pp. 26-33, 2009.
[205] A. Matsumoto, "Polymerization of Multiallyl Monomers," Progress in Polymer Science, vol. 26, pp. 189-257, 2001.
[206] J. Li, X. Ni, J. Ling and Z. Shen, "Snytheses and Properties of Poly(diethyl vinylphosphonate) Initiated by Lanthanide Tris(borohydride) Complexes: Polymerization Controllability and Mechanism," Polymer Chemistry, vol. 51, pp. 2409-2415, 2013.
[207] ASTM, "Standard Practice for Use of Radiochromic Film Dosimetry System," ASTM International, 2004.
[208] ASTM, "Standard Practice for Using the Fricke Reference-Standard Dosimetry System," ASTM International, 2007.
[209] ASTM, "Standard Practice for Use of the Alanine-EPR Dosimetry System (ASTM51607-13)," ASTM International, 2013.
[210] B. C. Niroomand-Rad, B. Coursey, K. Gall, J. Galvin, W. McLaughlin, A. Meigooni, R. Nath, J. Rodgers and C. Soares, "Radiochromic Film Dosimetry: Recommendations of AAPM Radiation Therapy Committee Task Group 55," Medical Physics, vol. 25, 1998.
[211] Far West Technology, Inc., "FWT-60 Series Radiochromic Dosimeters," 2002. [Online]. Available: http://www.fwt.com/racm/fwt60ds.htm. [Accessed 4 August 2014].
[212] KAPL, Chart of the Nuclides, Knolls Atomic Power Laboratory, 2002.
[213] C. Soares, E. Bright and M. Erlich, "NBS Measurement Services: Fricke Dosimetry in High-Energy Electron Beams," NIST Center for Radiation Research, Gaithersburg, MD, 1987.
270
[214] A. Olszanski, N. Klassen, C. Ross and K. Shortt, "The IRS Fricke Dosimetry System," National Research Council - Institute for National Measurment Standards, Ottawa, Ontario, 2002.
[215] M. Morsy, "Simple EPR/Alanine Dosimeter for Medical Application," Open Journal of Radiology, vol. 2, pp. 120-125, 2012.
[216] I. Far West Technology, "FWT-50 Series Alanine Pellet Dosimeters," 2004. [Online]. Available: http://www.fwt.com/racm/fwt50ds.htm. [Accessed 4 August 2014].
[217] E. Bergstrand, K. Shortt, C. Ross and E. Hole, "Photon Energy Dependence of the Electron Paramagnetic Resonance Alanine Dosimetry System: An Experimental Investigation," in Standards and Codes of Practice in Medical Radiation Dosimetry, Vienna, Austria, 1998.
[218] Bruker, "Alanine Dosimeter Reader," 2014. [Online]. Available: http://www.bruker.com/products/mr/epr/e-scan/alanine-dosimeter-reader/overview.html. [Accessed 4 August 2014].
[219] K. Makuuchi and S. Cheng, Radiation Processing of Polymer materials and its Industrial Applications, John Wiley & Sons, 2012.
[220] M. Nasef, "Effect of Solvents on Radiation-Induced Grafting of Styrene onto Fluorinated Polymer Films," Polymer International, vol. 50, pp. 338-346, 2001.
[221] M. Nasef and E. Hegazy, "Preparation and Applications of Ion Exchange Membranes by Radiation-Induced Graft Copolymerization of Polar Monomers onto Non-Polar Films," Progress in Polymer Science, vol. 39, no. 6, pp. 499-561, 2004.
[222] F. Mayo, "Chain Transfer in the Polymerization of Styrene: The Reaction of Solvents with Free Radicals," Journal of the American Chemical Society, vol. 65, no. 12, pp. 2324-2329, 1943.
[223] M. Antonietti and K. Landfester, "Polyreactions in Miniemulsions," Progress in Polymer Science, vol. 27, pp. 689-757, 2002.
[224] W. Smith and R. Ewart, "Kinetics of Emulsion Polymerization," The Journal of Chemical Physics, vol. 16, no. 6, pp. 592-599, 1948.
[225] N. Mohamad, M. Tamada, Y. Ueki and N. Seko, "Emulsion Graft Polymerization of 4-chloromethylstyrene on Kenaf Fiber by Pre-Irradiation Method," Radiation Physics and Chemistry, vol. 82, pp. 63-68, 2013.
271
[226] N. Seko, L. Bang and M. Tamada, "Sytheses fo Amine-type Adsorbents with Emulsion Graft Polymerization of Glycidyl Methacrylate," Nuclear Instruments and Methods in Physics Research B, vol. 265, pp. 146-149, 2007.
[227] Y. Hwang, Y. Lee, C. Oh, Y. Jun and S. Oh, "Preparation and Characterization of PEG-Grafted Silica Particles using Emulsion," J. Ind. Eng. Chem., vol. 12, no. 3, pp. 380-386, 2006.
[228] S. Janickova, I. Capek, P. Vasko, P. Sedlak and P. Capek, "Sterically Stabililized Emulsion Polymerization of 2-ethylhexyl Acrylate," Designed Monomers and Polymers, vol. 7, no. 6, pp. 541-551, 2004.
[229] Y. Bao, C. Wang, Z. Huang and Z. Weng, "Kinetics of Suspended Emulsion Polymerization of Methyl Methacrylate," Chinese Journal of Polymer Science, vol. 22, no. 6, pp. 543-548, 2004.
[230] J. Choi and C. Lee, "Graft Polymerization of Acrylic Acid onto Nylon 6," Journal of the Korean Nuclear Society, vol. 8, no. 3, pp. 159-168, 1976.
[231] R. Schuler, L. Patterson and E. Janata, "Yield for the Scavenging of Hydroxyl Radicals in the Radiolysis of Nitrous Oxide-Saturated Aqueous Solutions," Journal of Physical Chemistry, vol. 84, no. 16, pp. 2088-2089, 1980.
[232] J. Diehl, Safety of Irradiated Foods, CRC Press, 1999.
[233] W. Cooper, R. Curry and K. O'Shea, Environmental Applications of Ionizing Radiation, John Wiley & Sons, 1998.
[234] V. Stannett, "Some Challenges in Grafting to Cellulose and Cellulose Derivatives," in ACS Symposium Series, Washington, DC, 1982.
[235] Z. Hou, S. Chen and K. Sheng, "Distribution of Acrylic Acid Grafted Chains Introduced into Polyethylene Film by Simultaneous Radiation Grafting with Water and Ethanol as Solvents," Journal of Applied Polymer Science, vol. 10, pp. 1570-1577, 2006.
[236] M. Huglin and B. Johnson, "Graft Copolymerization of Acrylic Acid to Nylon-6 by Mutual Irradiation," Kolloid-Z. u. Z. Polymere, vol. 249, pp. 1080-1084, 1971.
[237] C. Bunyakan, L. Armanet and D. Hunkeler, "Precipitation Polymerization of Acrylic Acid in Tolune. II: Mechanism and Kinetic Modeling," Polymer, vol. 40, pp. 6225-6234, 1999.
[238] J. Downey, R. Frank, W. Li and H. Stover, "Growth Mechanism of Poly(divinylbenzene)
272
Microspheres in Precipitation Polymerization," Macromolecules, vol. 32, pp. 2838-2844, 1999.
[239] H. Kawaguchi, "Functional Polymer Microspheres," Progress in Polymer Science, vol. 25, no. 8, pp. 1171-1210, 2000.
[240] B. Gawdzik and M. Maciejewska, "Emulsion Polymerization of Divinyl Monomers Stabilized by Sodium Dodecyl Sulfate and Bis(2-ethylhexyl)sulfosuccinate Sodium Salt," Journal of Polymer Science: Part A: Polymer Chemistry, vol. 40, pp. 3967-3973, 2002.
[241] K. Li and D. Stover, "Synthesis of Monodisperse Poly(divinylbenzene) microspheres," Journal of Polymer Science Part A: Polymer Chemistry, vol. 31, no. 13, pp. 3257-3263, 1993.
[242] S. Shim, S. Yang, H. Choi and S. Choe, "Fully Crosslinked Poly(styrene-co-divinylbenzene) Microspheres by Precipitation Polymerization and Their Superior Thermal Properties," Journal of Polymer Science: Part A: Polymer Chemistry, vol. 42, pp. 835-845, 2004.
[243] S. Yang, S. Shim, H. Lee, G. Kim and S. Choe, "Size and Uniformity Variation of Poly(MMA-co-DVB) Particles Upon Precipitation Polymerization," Macromolecular Research, vol. 12, no. 5, pp. 519-527, 2004.
[244] Y. Naka, Y. Yamamoto and K. Hayashi, "Solvent Effects on the Formation of Crosslinking Microspheres in y-Irradiated Solutions," Radiation Physics and Chemistry, vol. 40, no. 2, pp. 83-88, 1992.
[245] Y. Naka and Y. Yamamoto, "Preparation of Microspheres by Radiation-Induced Polymerization. II. Mechanism of Microsphere Growth," Journal of Polymer Science: Part A: Polymer Chemistry, vol. 30, pp. 1287-1298, 1992.
[246] Y. Naka, I. Kaetsu, Y. Yamamoto and K. Hayashi, "Preparation of Microspheres by Radiation-Induced Polymerization. I. Mechanism for the Formation of Monodisperse Poly(diethylene Glycol Dimethacrylate) Microspheres," Journal of Polymer Science: Part A: Polymer Chemistry, vol. 29, pp. 1197-1202, 1991.
[247] A. Bhattacharya, J. Rawlins and P. Ray, Polymer Grafting and Crosslinking, John Wiley & Sons, Inc., 2009.
[248] S. Gursel, L. Gubler, B. Gupta and G. Scherer, "Radiation Grafted Membranes," Advances in Polymer Science, vol. 215, pp. 157-217, 2008.
273
[249] S. Kalia and L. Averous, Biopolymers: Biomedical and Environmental Applications, John Wiley & Sons, 2011.
[250] J. Silverman, "Radiation Processing: The Industrial Applications of Radiation Chemistry," Radiation Physics and Chemistry, vol. 14, no. 1-6, 1979.
[251] A. Chapiro, "Radiation Induced Polymerization," Radiation Physics & Chemistry, pp. 101-116, 1979.
[252] M. Nasef, H. Saidi and H. Nor, "Proton Exchange Membranes Prepared by Simultaneous Radiation Grafting of Styrene onto Poly(tetrafluoroethylene-co-hexafluoropropylene) Films. I. Effect of Grafting Conditions," Journal of Applied Polymer Science, vol. 76, no. 2, pp. 220-227, 2000.
[253] G. Guclu, G. Gurdag and S. Ozgumus, "Competitive Removal of Heavy Metal Ions by Cellulose Graft Copolymer," Journal of Applied Polymer Science, vol. 9, pp. 2034-2039, 2003.
[254] R. Ramya, P. A. S. Samkar and P. Sudha, "Adsorption of Cu(II) and Ni(II) Ions from Metal Solution using Crosslinked Chitosan-g-acrylonitrile Copolymer," International Journal of Environmental Science, vol. 1, no. 6, pp. 1323-1338, 2011.
[255] T. Anirudhan, S. Rijith and A. Tharun, "Adsorptive Removal of Thorium (IV) from Aqueous Solutions using Poly(methacrylic acid)-Grafted Chitosan/Bentonite Composite Matrix: Process Design and Equilibrium Studies," Colloids and Surfaces A: Physicochemical and Engineeing Aspects, vol. 368, no. 1-3, pp. 13-22, 2010.
[256] T. Maekawa, H. Nishide, E. Tsuchida, H. Ohmichi and J. Okamoto, "Complexation of Samarium Ion with Poly(acrylic acid) grafted onto Polyethylene by Radiation-Induced Method," Journal of Applied Polymer Science, vol. 29, no. 12, pp. 3795-3801, 1984.
[257] H. Omichi, A. Kataki, T. Sugo and J. Okaoto, "A New Type of Amidoxime-Group-Containing Adsorbent for the Recovery of Uranium from Seawater," Separation Science & Technology, vol. 20, no. 2-3, pp. 163-178, 1985.
[258] S. Choi and Y. Nho, "Adsorption of UO2+2 by Polyethylene Adsorbents with Amidoxime, Carboxyl, and Amidoxime/Carboxyl Group," Radiation Physics and Chemistry, vol. 57, no. 2, pp. 187-193, 2000.
[259] N. Kabay, A. Katakai, T. Sugo and H. Egawa, "Preparation of Fibrous Adsorbents Containing Amidoxime Groups by Radiation-Induced Grafting and Application to Uranium Recovery from Sea Water," Journal of Applied Polymer Science, vol. 49, no. 4,
274
pp. 559-607, 2003.
[260] S. Das, A. Pandey, A. Athawale, V. Kumar, Y. Bhardwaj, S. Sabharwal and V. Manchanda, "Chemical Aspects of Uranium Recovery from Seawater by Amidoximated Electron-beam-grafted Polypropylene Membranes," Desalination, vol. 232, no. 1-3, pp. 243-253, 2008.
[261] S. Das, A. Pandey, A. Athawale, V. Natarajan and V. Manchanga, "Uranium Preconcentration from Seawater using Phosphate-Functionalized Poly(propylene) Fibrous Membrane," Desalination and Water Treatment, vol. 38, pp. 114-120, 2012.
[262] C. Hill, An Introduction to Chemical Engineering Kinetics & Reactor Design, Wiley, 1977.
[263] P. Somasundaran, Encyclopedia of Surface and Colloid Science, Second ed., CRC Press, 2006.
[264] J. Kim, C. Tsouris, R. Mayes, Y. Oyola, T. Saito, C. Janke, S. Dai, E. Schneider and D. Sachde, "Recovery of Uranium from Seawater: A Review of Current Status and Future Research Needs," Separation Science and Technology, vol. 48, no. 3, pp. 367-387, 2013.
[265] S. Shinkai, H. Kawaguchi and O. Manabe, "Selective Adsorption of Uranyl Ion (UO22+) to a Polymer Resin Immobilizing Calixarene-based Uranophiles," Journal of Polymer Science Part C - Polymer Letters, vol. 26, no. 9, pp. 391-396, 2003.
[266] J. Martin, Physics for Radiation Detection, Third ed., John Wiley & Sons, 2013.
[267] J. Cooper, K. Randle and R. Sockhi, Radioactive Releases in the Environment, John Wiley & Sons, 2003.
[268] Perkin Elmer, "LSC in Practice: Cocktails for Acidified Seawater," PerkinElmer, Inc, Waltham, MA, 2007.
[269] R. Broda, P. Cassette and K. Kossert, "Radionuclide Metrology using Liquid Scintillation Counting," Metrologia, vol. 44, pp. S36-S52, 2007.
[270] T. Sehgal and S. Ruttan, "Graft-Copolymerization of N-vinyl-2-pyrrolidone onto Isotactic Polypropylene Film by Gamma Radiation Using Peroxidation Method," Indian Journal of Pure & Applied Physics, pp. 823-829, 2010.
[271] M. Nasef, H. Saidi, H. Nor and O. Foo, "Radiation-induced Grafting of Styrene onto Poly(tetrafluoroethylene) films: Part II. Properties of the Grafted and Sulfonated
275
Membranes," Polymer International, vol. 49, no. 12, pp. 1572-1579, 2000.
[272] D. Hegazy, "Selectivity of Acrylic Acid Radiation Grafted Non-Woven Polypropylene Sheets Towards Cu, Ni and Co Heavy Metal Ions," Journal of Chemical Engineering, vol. 1, no. 1, pp. 42-47, 2012.
[273] D. Kim, J. Park, M. Gong and H. Song, "Effect of Grafting Degree and Side PEO Chain Length on the Ionic Conductivities of NBR-g-PEO Based Polymer Electrodes," Polymer Engineering & Science, vol. 34, no. 17, pp. 1305-1313, 1994.
[274] S. Shironita, S. Mizoguchi and M. Umeda, "Electrolytic Membrane Formation of Fluoroalkyl Polymer Using a UV-Radiation-Based Grafting Technique and Sulfonation," in IOP Conference Series: Materials Science & Engineering, 2011.
[275] El-Sayed, A. Hegazy, H. Kamal, N. Maziad and A. Dessouki, "Membranes Prepared by Radiation Grafting of Binary Monomers for Adsorption of Heavy Metals from Industrial Wastes," Nuclear Instruments and Methods in Physics Research B, vol. 151, pp. 386-392, 1991.
[276] M. Grasselli, A. Navarro del Canizo, S. Cameri, F. Wolman, E. Smolko and O. Cascone, "Immobilized Metal Ion Affinity Hollow-Fiber Membranes Obtained by the Direct Grafting Technique," Radiation Physics and Chemistry, vol. 55, pp. 203-208, 1999.
[277] Y. Bondar, H. Kim, S. Yoon and Y. Lim, "Synthesis of Cation-Exchange Adsorbent for Anchoring Metal Ions by Modification of Poly(glycidylmethacrylate) Chains Grafting onto Polypropylene Fabric," Reactive & Functional Monomers, vol. 58, pp. 43-51, 2004.
[278] H. Omichi, A. Katakai, T. Sugo and J. Okamoto, "A New Type of Amidoxime-Group-Containing Adsorbent of the Recovery of Uranium from Seawater. II. Effect of Grafting of Hydrophilic Monomers," Separation Science & Technology, vol. 21, no. 3, pp. 299-313, 1986.
[279] S. Yiacoumi and C. Tien, Kinetics of Metal Ion Adsorption from Aqueous Solutions: Models, Algorithms and Applications, Springer Science & Business Media, 1995.
[280] A. Sandino and J. Burno, "The Solubility of (UO2)3(PH4)2-4H2O(s) and the Formation of U(VI) Phosphate Complexes: Their Influence in Uranium Speciation in Natural Waters," Geochemica et Cosmochemica Acta, vol. 56, pp. 4135-4145, 1992.
[281] G. Geipel, G. Bernhard and V. Brendler, "Complex Formation of Uranium(VI) with Phosphate and Arsenate," in Uranium in the Aquatic Environment: Proceedings of the International Conference on Uranium Mining and Hydrogeology III and the International
276
Mine Water Association Symposium, Freiberg, Germany, 2002.
[282] M. Romero-Gonzalez, T. Cheng, M. Barnett and E. Roden, "Surface Complexation Modeling of the Effects of Phosphate on Uranium(VI) Adsorption," Radiochemica Acta, vol. 95, pp. 251-259, 2007.
[283] Gindler, J., "The Radiochemistry of Uranium," National Academy of Sciences - National Research Council, Argonne, Il, 1962.
[284] P. Ilaiyaraja, A. Deb, K. Sivasubramanian, D. Ponraju and B. Venkatraman, "Adsorption of Uranium from Aqueous Solution by PAMAM Dendron Functionalized Styrene Divinylbenzene," Journal of Hazardous Materials, pp. 155-166, 2013.
[285] F. Wu and R. J. R. Tseng, "Kinetic Modeling of Liquid-Phase Adsorption of Reactive Dyes and Metal Ions on Chitosan," Water Research, vol. 35, no. 3, pp. 613-618, 2001.
[286] S. Das, A. Pandy, A. Athawale and V. Manchanda, "Exhanges of Uranium(VI) Species in Amidoxime-Functionalized Sorbents," Journal of Physical Chemistry B, vol. 113, pp. 6328-6335, 2009.
[287] W. Lin, "Development of Novel Sorbents for Uranium Extraction from Seawater," U.S. Department of Energy - Nuclear Energy University Programs, 2011.
[288] S. Azizian, "Kinetic Model of Sorption: A Theoretical Analysis," Journal of Colloid and Interface Science, vol. 276, no. 1, pp. 47-52, A 2004.
[289] H. Qiu, B. Pan, Q. Zhang, W. Zhang and Q. Zhang, "Critical Review in Adsorption Kinetic Models," Journal of Zhejian University Science A, vol. 10, no. 5, pp. 716-724, 2009.
[290] D. Singh, G. Prasad, D. Rupainwar and V. Singh, "As(III) Removal from Aqueous Solution by Adsorption," Water, Air and Soil Pollution, pp. 373-386, 1988.
[291] Y. Sharma, G. Gupta, G. Prasad and D. Rupainwar, "Use of Wollastonite in the Removal of Ni(II) from Aqueous Solutions," Water, Air and Soil Pollution, vol. 49, pp. 69-79, 1990.
[292] H. Seki and A. Suzuki, "Adsorption of Lead Ions on Composite Biopolymer Adsorbent," Indian Engineering and Chemistry Research, vol. 35, pp. 1378-1382, 1996.
[293] R. Tseng, F. Wu and R. Juang, "Characteristics and Applications of the Lagergrens's First-Order Equation for Adsorption Kinetics," Journal of the Taiwan Institute of Chemical Engineers, vol. 41, pp. 661-669, 2010.
277
[294] W. Plazinski, J. Dziuba and W. Rudzinski, "Modeling of Sorption Kinetics: The Pseudo-Second Order Equation and the Sorbate Intraparticle Diffusivity," Adsorption, vol. 19, pp. 1055-1064, 2013.
[295] F. Wu, R. Tseng and R. Juang, "Initial Behavior of Intraparticle Diffusion Model Used in the Description of Adsorption Kinetics," Chemical Engineering Journal, vol. 153, pp. 1-8, 2009.
[296] R. Tseng, F. Wu and R. Juang, "Effect of Complexing Agents on Liquid-Phase Adsorption and Desorption of Copper(II) Using Chitosan," Journal of Chemical Technology and Biotechnology, vol. 74, pp. 533-538, 1999.
[297] R. Dhodapkar, N. Rao, S. Pande, T. Nandy and S. Devotta, "Adsorption of Cationic Dyes on Jalshakti, Super Adsorbent Polymer and Photocatalytic Regeneration of the Adsorbent," Reactive Functional Polymers, vol. 67, pp. 540-548, 2007.
[298] C. Akmil-Basar, Y. Onal, T. Kilicer and D. Eren, "Adsorptions of High Concentration Malachite Green by Two Acticated Carbons having Different Porous Structures," Journal of Hazardous Material, vol. 127, pp. 75-80, 2005.
[299] R. Juang, F. Wu and R. Tseng, "Characterisization and Use of Activated Carbons Pre-prepared from Bagasse for Liquid-Phase Adsorption," Colloids Surface Analysis: Physiochemical Engineering Aspects, vol. 201, pp. 191-199, 2002.
[300] G. McKay, "The Adsorption of Dyestuffs from Aqueous Solution using Activated Carbon. III. Intraparticle Diffusion Process," Journal of Chemical Technology and Biotechnology, vol. 33, pp. 196-204, 1983.
[301] Y. Ho and G. McKay, "Pseudo-Second Order model for Sorption Processes," Process Biochemistry, vol. 34, no. 5, pp. 451-465, 1999.
[302] NOAA, "State of the Climate: Global Analysis for June 2014," NOAA NAtional Climatic Data Center, 2014.
[303] M. Affholder and F. Valiron, Descriptive Physical Oceanography, CRC Press, 2001.
[304] T. Garrison, Oceanography: An Invitation to Marine Science, Cengage Learning, 2012.
[305] A. Hubbard, Encyclopedia of Surface and Colloid Science, CRC Press, 2002.
[306] M. Aly and M. Hamza, "A Review: Studies on Uranium Removal using Different Techniques. Overview," Journal of Dispersion Science & Technology, vol. 34, no. 2, pp.
278
182-213, 2013.
[307] A. Zhang, G. Uchiyama and T. Asakura, "pH Effect on the Uranium Adsorption from Seawater by a Macroporous Fibrous Polymeric Material Containing Amidoxime Chelating Functional Group," Reactive & Functional Polymers, vol. 63, no. 2, pp. 143-153, 2005.
[308] H. Yamashita, Y. Ozawa and F. Nakajima, "The Collection of Uranium from Seawater with Hydrous Metal Oxide. II. The Mechanism of Uranium Adsorption on Hydrous Titanium(IV) Oxide," Bulletin of the Chemical Society of Japan, vol. 53, pp. 1-5, 1980.
[309] K. Saito, S. Yamada, S. Furusaki, T. Sugo and J. Okamoto, "Characteristics of Urnaium Adsorption by Amidoxime Membrane Synthesized by Radiation-Induced Graft Polymerization," Journal of Membrane Science, vol. 34, pp. 307-315, 1987.
[310] C. Ducouret, E. Petersohn, N. Betz and A. Le Moel, "Fourier Transform Infrared Analysis of Heavy Ion Grafting of Poly(vinylidene fluoride)," Spectrochimica Acta, vol. 51A, no. 4, pp. 567-572, 1995.
[311] M. Porubska, O. Szollos, A. Konova, I. Janigova, M. Jaskova, K. Jomova and I. Chodak, "FTIR Spectroscopy Study of Polyamide-6 Irradiated by Electron and Proton Beams," Polymer Degradation and Stability, vol. 97, pp. 523-531, 2012.
[312] Bio-Rad, "KnowItAll ATR/IR ID Expert," 2014. [Online]. Available: http://www.bio-rad.com/en-us/product/knowitall-atr-ir-id-expert . [Accessed 20 August 2014].
[313] E. Rusu, G. Rusu and D. Dorohoi, "Influence of Temperature on Structures of Polymers with e-caplolactam Units Studied by FT-IR Spectroscopy," Polimery, vol. 54, no. 5, pp. 347-352, 2009.
[314] P. Lakshmi, K. Vijayalakshmi and P. Sudha, "Synthesis and Characterization of Graft Copolymers of Nylon 6 with Maleic Anhydride and Methylmethacrylate," Archives of Applied Science Research, vol. 3, no. 6, pp. 351-363, 2011.
[315] Bruker Optics, "Application Note AN # 98: Differentiation of Polyamides via FTIR Spectroscopy," 2012. [Online]. Available: http://www.bruker.com/fileadmin/user_upload/8-PDF-Docs/OpticalSpectrospcopy/FT-IR/ALPHA/AN/AN98_DifferentiationPolyamides_EN.pdf. [Accessed 19 August 2014].
[316] M. Sangermano, P. Meier and S. Tzavlas, "Infrared Spectroscopy as a Tool to Monitor Radiation Curing," in Infrared Spectroscopy - Materials Science, Engineering and Technology, InTech, 2012, pp. 325-336.
279
[317] ASTM International, "Standard Guide for Evaluating the ASTM F2102 - 13: Extent of Oxidation in Polyethylene Fabricated Forms Intended for Surgical Implants," ASTM International, West Conshohocken, PA, 2013.
[318] D. Nagle, G. George and L. Rintoul, "Use of Micro-ATR/FTIR Imaging to Study Heterogenous Polymer Oxidation by Direct Solvent Casting onto the ATR IRE," Vibrational Spectroscopy, vol. 53, no. 1, pp. 24-27, 2010.
[319] B. Stuart, "A Fourier Transform Raman Study of Water Sorption by Nylon 6," Polymer Bulletin, vol. 33, pp. 681-686, 1994.
[320] P. Hendra, W. Maddams, I. Royaud, H. Willis and V. Zichy, "The Application of Fourier Transform Raman Spectroscopy to the Identification and Characterization of Polyamides-I. Single Number Nylons," Spectrochimica Acta Part A: Molecular Spectroscopy, vol. 46, no. 5, pp. 747-756, 1990.
[321] S. Suzuki, L. Grondahl, D. Leavesley and E. Wentrup-Byrne, "In Vitro Bioactivity of MOEP Grafted ePTFE Membranes for Craniofacial Applications," Biomaterials, vol. 26, pp. 5303-5312, 2005.
[322] M. Nasef and H. Saidi, "Surface Studies of Radiation Grafted Sulfonic Acid Membranes: XPS and SEM Analysis," Applied Surface Science, vol. 252, no. 8, pp. 3073-3084, 2006.
[323] C. Aymes-Chodur, N. Betz, M. Porte-Durrieu, C. Baquey and A. Le Moel, "A FTIR and SEM Study of PS Radiation Grafted Fluoropolymers: Influence on the Nature of Ionizing Radiation on the Film Structure," Nuclear Instruments and Methods in Physics Research B, vol. 151, pp. 377-385, 1999.
[324] I. Polysciences, "Bis(2-methacryloxyethyl) Phosphate," 2014. [Online]. Available: http://www.polysciences.com/Catalog/Department/Product/98/categoryid--72/productid--699/. [Accessed 15 January 2014].
[325] N. Nagaoka, A. Safrani, M. Yoshida, H. Omichi, H. Kubota and R. Katakai, "Synthesis of Poly(N-isopropylacrylamide) Hydrogels by Radiation Polymerization and Cross-linking," Macromolecules, vol. 26, pp. 7386-7388, 1993.
[326] A. Gianguzza and S. Pelizzetti, Chemistry of Marine Water and Sediments, Springer Science & Business Media, 2002.
[327] ASTM, "ASTM D1141-98: Standard Practice for the Preparation of Substitute Ocean Water," American Society for Testing and Materials, 2013.
280
[328] G. Tian, S. Teat, Z. Zhang and L. Rao, "Sequestering Uranium from Seawater: Binding Strength and Modes of Uranyl Complexes with Glutarimidedioxime," Dalton Transactions, vol. 41, pp. 11579-11586, 2012.
[329] I. Farhataziz and M. Rodgers, Radiation Chemistry, New York, NY: VCH Publishers, Inc., 1987.
[330] K. Laidler, Chemical Kinetics, Second ed., New York, NY: McGraw-Hill, 1965.
[331] S. Das, A. Pandy, A. Athawale, V. Natarajan and V. Manchanda, "Uranium Preconcentration from Seawater using Phosphate Functionalized Poly(propylene) Fibrous Membrane," Desalination and Water Treatment, vol. 38, pp. 114-120, January 2012.
[332] Y. Yue, X. Sun, R. Mayes, J. Kim, P. Fulvio, Z. Qiao, S. Brown, C. Tsouris, Y. Oyola and S. Dai, "Polymer-coated Nanoporous Carbons for Trace Seawater Uranium Adsorption," Science China, vol. 56, no. 11, pp. 1510-1515, November 2013.
[333] T. Sugo, "Uranium Recovery from Seawater," 23 August 1999. [Online]. Available: http://www.jaea.go.jp/jaeri/english/ff/ff43/topics.html. [Accessed 29 August 2014].
[334] T. Sakaguchi, A. Nakajima and T. Horikoshi, "Adsorption of Uranium from Sea Water by Biological Substances," Nippon Nogeikagaku Kaishi, vol. 53, no. 6, pp. 211-217, 1979.
[335] X. Yunshu, F. Yibei, F. Yoshii and K. Makuuchi, "Sensitizing Effiect of Polyfunctional Monomers on Radiation Crosslinking of Polychloroprene," Radiation Physics and Chemistry, vol. 53, pp. 669-672, 1998.
[336] J. Drobny, Ionizing Radiation and Polymers: Principles, Technology and Applications, William Andrew, 2012.
[337] N. Seko, a. Katakai, S. Hasegawa, M. Tamada, N. Kasai, H. Takeda and T. Sugo, "Aquaculture of Uranium in Seawater by a Fabric-Adsorbent Submerged System," Nuclear Technology, vol. 144, pp. 274-278, 2003.
[338] V. Stannett, "Radiation-Grafting - State-of-the-Art. Section 2.2. Co-Polymerization and Grafting," Radiation Physics and Chemistry, vol. 35, no. 1-3, pp. 82-87, 1990.
[339] J. Fouassier and J. Rabek, Radiation Curing in Polymer Science and Technology: Fundamentals and Methods, vol. 1, Springer Science & Business Media, 1993.
[340] P. Dworjanyn, J. Garnett, M. Long, Y. Nho and M. Khan, "Role of Homopolymer Supressors in UV and Radiation Grafting in the Presence of Novel Additives," in
281
Irradiation of Polymeric Materials, American Chemical Society, 1993, pp. 103-117.
[341] K. Makuuchi and S. Cheng, Radiation Processing of Polymer Materials and its Industrial Applications, John Wiley & Sons', 2012.
[342] S. Le Caer, "Water Radiolysis: Influence of Oxide Surfaces on H2 Production under Ionizing Radiation," Water, vol. 3, pp. 235-253, 2011.
[343] J. Spinks and R. Woods, An Introduction to Radiation Chemistry, John Wiley & Sons, 1990.
[344] G. Knoll, Radiation Detection and Measurement, Third ed., John Wiley & Sons, Inc., 2000.
[345] National Nuclear Data Center, "Chart of the Nuclides," [Online]. Available: http://www.nndc.bnl.gov/chart/. [Accessed 6 April 2014].
[346] A. Faucitano, A. Buttafava, L. Montanari, F. Cilurzo, B. Conti, I. Genta and L. Valvo, "Radiation-induced Free Radical Reactions in Polymer/drug Systems for Controlled Release: an EPR Investigation," Radiation Physics and Chemistry, vol. 67, no. 1, pp. 61-72, May 2003.
[347] P. Reiger, Electron Spin Resonance: Analysis and Interpretation, Cambridge: The Royal Society of Chemistry, 2007.
[348] J. Weil, J. Bolton and J. Wertz, Electron Paramagnetic Resonance. Elemental Theory and Practical Applications, John Wiley, 1994.
[349] F. Khan, S. Ahmad and E. Kronfli, "Gamma-Radiation-Induced Emulsion Graft Copolymerization of MMA onto Jute Fiber," Advances in Polymer Technology, vol. 21, no. 2, pp. 132-140, April 2002.
[350] G. Knoll, Radiation Detection and Measurement, Third ed., New York, NY: John Wiley & Sons, Inc., 2000.
[351] C. Passo and G. Cook, "Handbook of Environmental Liquid Scintillation Spectrometry: A Compilation of Theory and Methods," Packard Instrument Company, Meriden, CT, 1994.
[352] H. Ma, K. Morita, H. Hoshina and N. Seko, "Synthesis of Amine-Type Adsorbents with Emulsion Graft Polymerization of 4-Hydroxybutyl Acrylate Glycidylether," Materials Sciences and Application, vol. 2, pp. 777-785, 2011.
282
[353] MEE-Inc, "Scanning Electron Microscopy," 2009. [Online]. Available: http://mee-inc.com/sem.html. [Accessed 15 July 2014].
[354] P. Painter and M. Coleman, Essentials of Polymer Science & Engineering, Lancaster, PA: DEStech Publications, Inc., 2009.
[355] A. Sen, L. Kandpal, G. Mathur and A. Sen, "Recent Advances in Polymers and Composites," in Proceedings of Recent Advances in Polymers and Composites, Kanpur, 2000.
[356] IAEA, "Absorbed Dose Determination in External Beam Radiotherapy: An International Code of Practice for Dosimetry Based on Standards of Absorbed Dose to Water (IAEA TRS-398)," International Atomic Energy Agency, Vienna, Austria, 2004.
[357] K. Makuuchi and S. Cheng, Radiation Processing of Polymer Materials and its Industrial Applications, John Wiley & Sons, 2012.
[358] P. Cheremisinoff, Handbook of Engineering Polymeric Materials, CRC Press, 1997.
[359] Sigma-Aldrich, "Tween 20," 2014. [Online]. Available: http://www.sigmaaldrich.com/catalog/product/sial/p1379?lang=en®ion=US. [Accessed 11 August 2014].
[360] K. Nakken and A. Pihl, "On the Ability of Nitrous Oxide to Convert Hydrated Electrons into Hydroxyl Radical," Radiation Reserach, vol. 26, pp. 519-526, 1965.
[361] A. Bhattacharya, J. Rawlins and P. Ray, Polymer Grafting and Crosslinking, John Wiley & Sons, Inc., 2009.
[362] T. Ward and K. Ward, "Solubilization in Micellar Separations," in Solubilization in Surface Aggregates, CRC Press, 1995.
[363] H. Ma, K. Morita, H. Hoshina and N. Seko, "Synthesis of Amine-Type Adsorbents with Emulsion Graft Polymerization of 4-Hydroxybutyl Acrylate Glycidylether," Materials Sciences and Applications, vol. 2, pp. 777-785, 2011.
[364] J. Drobny, Ionizing Radiation and Polymers: Principles, Technology and Applications, William Andrew, 2012.
[365] J. Spinks and R. Woods, An Introduction to Radiation Chemistry, John Wiley & Sons, Inc., 1990.
283
[366] N. El-Sawy, E. Hegazy, A. El-Hag Ali, M. Motlab and A. Awadallah-F., "Physicochemical Study of Radiation-Grafted LDPE Copolymer and its Use in Metal Ions Adsorption," Nuclear Instruments and Methods in Physics Research Section B: Beam Interactions with Materials and Atoms, vol. 264, no. 2, pp. 227-234, 2007.
[367] G. Knoll, Radiation Detection and Measurement, John Wiley & Sons, Inc., 2000.
[368] N. Tsoulfanidis, Measurement and Detection of Radiation, Second ed., Taylor & Francis, 1995.
[369] Y. Ho, "Review of Second-Order Models for Adsorption Systems," Journal of Hazardous Materials, vol. 136, no. 3, pp. 681-689, 2006.
[370] G. Eaton, S. Eaton, D. Barr and R. Weber, Quantitative EPR, Springer, 2010.
[371] J. Reuben and B. Malman, "The Fate of Peroxy Radicals in Irradiated Polypropylene: An ESR Investigation with Oxygen-17 Labelling," The Journal of Physical Chemistry, vol. 88, pp. 4904-4906, 1984.
[372] G. Dreyfus, J. Lewiner and M. Legrand, "Electron-spin-resonance Study of Electron-Bombarded Polymer Electrets. I. Radical Formation, Piezoelectric and Pyroelectric Effects," Physical Review B, vol. 20, no. 4, August 1979.
[373] E. El-Gendy and I. El-Shanshoury, "Factors Affecting Radiation Grafting of N-Vinylpyrrolidone onto Nylon-6 Fabric," Indian Journal of Fibre & Textile Research, vol. 30, pp. 437-443, December 2005.
[374] P. Silva, C. Albano and R. Perera, "Use of Electron Paramagnetic Resonance to Evaluate the Behavior of Free Radicals in Irradiated Polyolefins," Revista Latinoamericana de Metalurgia y Materiales, vol. 28, no. 2, pp. 79-90, 2008.
[375] A. Alian, N. El-Assay, F. Abdel-Rehim, N. Amin, W. McLaughlin and H. Roushdy, "Chemical Dosimetry by UV Spectrophotometry of Aqueous Ascorbic Acid Solutions," Radiation Physics and Chemistry, vol. 23, no. 4, pp. 435-440, 1984.
[376] G. Burillo, E. Adem, E. Munoz and M. Vasquez, "Electron Beam Irradiated Polyamide-6 at Different Temperatures," Radiation Physics and Chemistry, vol. 84, pp. 140-144, 2013.
[377] E. Wentrup-Byrne, L. Grongahl and S. Suzuki, "Methacryloxyethyl Phosphate-Grafted Expanded Polytetrafluoroethylene Membranes for Biomedical Applications," Polymer International, vol. 54, no. 12, pp. 1581-1588, 2005.
284
[378] Bio-Rad, Notes: Nylon-6, Bio-Rad Laboratories, Inc., 2013.
[379] S. Kolhe and A. Kumar, "Radiation-Induced Grating of Vinyl Benzyl Trimethyl Ammonium Chloride onto Nylon-6 Fabric," Radiation Physics and Chemistry, vol. 76, pp. 901-906, 2007.
[380] C. Na, H. Park and B. Kim, "Optimal Amidoximation Conditions of Acrylonitrile Grafted onto Polypropylene by Photoirradiation-Induced Graft Polymerization," Journal of Applied Polymer Science, vol. 125, pp. 776-785, 2012.
[381] A. Singha and A. Rana, "Kinetics of Graft Copolymerization of Acrylic Acid onto Cannabis Indica Fibre," Iranian Polymer Journal, vol. 20, pp. 913-929, 2011.
[382] H. Ma, K. Morita, H. Hoshina and N. Seko, "Synthesis of Amine-Type Adsorbents with Emulsion Graft Polymerization of 4-Hydroxybutyl Acrylate Glycidylether," Materials Science and Applications, vol. 2, pp. 777-785, 2011.
[383] J. Williams, "Stability of Polypropylene to Gamma Irradiation," in Radiation Effects on Polymers, Washington, DC, ACS Symposium Series, American Chemical Society, 1991, pp. 554-568.
[384] E. Wentrup-Byrne, L. Grondahl and S. Suzuki, "Methacryloxyethyl phosphate-grafted Expanded Polytetrafluoroethylene Membranes for Biomedical Applications," Polymer International, vol. 54, no. 12, pp. 1581-1588, 2005.
[385] J. Weil and J. Bolton, Electron Paramagnetic Resonance: Elementary Theory and Practical Applications, Second ed., Wiley Interscience, 2007.
[386] G. Verma and A. Peterlin, "Electron Spin Resonance Study of Mechanically Stretched Nylon-6 Fibers," Kolloid-Zeitschrift und Zeitschrift für Polymere, vol. 236, no. 2, pp. 111-115, 1970.
[387] K. Turekian, Oceans, Prentice-Hall, 1968.
[388] H. Stoker, General, Organic and Biological Chemistry, Cengage Learning, 2012, pp. 323-324.
[389] P. Simon, A. Rockenbauer, M. Azori and F. Tudos, "ESR Study of Gamma-Irradiated Nylon-6; Conformational Isomerism of Free Radicals," European Polymer Journal, vol. 13, pp. 189-192, 1976.
[390] P. Silva, C. Albano, R. Perera, J. Gonzalez and M. Ichazo, "An Electron Paramagnetic
285
Resonance Study of PP and PP/SBS Blends Irradiated with Gamma Rays," Nuclear Instruments and Methods in Physics Research B, vol. 226, pp. 320-326, 2004.
[391] Y. Shinohara and D. Ballantine, "Free Radicals in Irradiated Nylon," The Journal of Chemical Physics, vol. 36, pp. 3042-3049, 1962.
[392] Y. Sanchez, C. Albano, R. Perera, A. Karam and P. Silva, "Characterization of LDPE Grafted with Diethylmalaete by Gamma Radiation: Application of FTIR, GPC and SSA Techniques," Macromolecular Symposia, vol. 257, no. 1, pp. 139-146, November 2007.
[393] L. Rao, "Recent International R&D Activities in the Extraction of Uranium from Seawater," U.S. Department of Energy; Office of Nuclear Energy; Fuel Cycle Research, Berkely, CA, 2010.
[394] T. Prasad, A. Saxena, P. Tewari and D. Sathiyamoorthy, "An Engineering Scale Study on Radiation Grafting of Polymeric Adsorbents for Recovery of Heavy Metal Ions from Seawater," Nuclear Engineering and Technology, vol. 41, no. 8, pp. 1101-1108, October 2009.
[395] H. Mark, Encyclopedia of Polymer Science and Technology, Wiley Interscience, 2004.
[396] J. Marinsky and Y. Marcus, Ion Exchange and Solvent Extraction, CRC Press, 1995.
[397] K. Makuuchi and S. Cheng, Radiation Processing of Polymer Materials and its Industrial Applications, John Wiley & Sons', 2012.
[398] C. Maier and T. Calafut, Polypropylene: The Definitive User's Guide and Databook, Taylor & Francis, 2008.
[399] Y. Lebedev and Y. Tsvetkov, "Electron Paramagnetic Resonance Spectra of Radicals Formed by Irradiation of Polypropylene," Journal of Structural Chemistry, vol. 2, no. 5, pp. 558-560, 1961.
[400] M. L'Annunziata, Handbook of Radioactivity Analysis, Academic Press, 2012.
[401] X. Kong, X. Gu, X. Zhu and L. Zhang, "Precipitation Polymerization in Ethanol and Ethanol/Water to Prepare Uniform Microspheres of Poly(TMPTA-styrene)," Macromolecules Rapid Communication, vol. 30, no. 11, pp. 909-914, 2009.
[402] J. Kim, C. Tsouris, R. Mayes, Y. Oyola, T. Saito, C. Janke, S. Dai, E. Schneider and D. Sachde, "Recovery of Uranium from Seawater: A Review of Current Status and Future Research Needs," Separation Science and Technology, pp. 367-387, 2013.
286
[403] P. Kavakh, N. Seko, M. Tamada and O. Guven, "Adsorption Efficiency of a New Adsorbent Towards Uranium and Vanadium Ions at Low Concentrations," Separation Science and Technology, vol. 39, no. 7, pp. 1631-1643, 2004.
[404] J. Jang and Y. Jeong, "Synthesis and Flame-Retardancy of UV-Curable Methacryloyloxy Ethyl Phosphates," Fibers and Polymers, vol. 9, no. 6, pp. 667-673, 2008.
[405] S. Ilie and R. Senetscu, "Polymeric Materials Review on Oxidation, Stabilization and Evaluation using CL and DSC Methods," [Online]. Available: http://cds.cern.ch/record/1201650/files/Ilie_TE_Technical_Notes.pdf?version=1. [Accessed 4 July 2014].
[406] Y. Ikada, F. Horii, Y. Nishizaki, T. Kawahara and H. Uehara, "Radiation-Chemical Yield of Graft Copolymers in Radiation Grafting," Macromolecules, vol. 8, no. 3, pp. 276-279, May-June 1975.
[407] M. Hussein, G. Tay and H. Rozman, "Real-Time Cure Monitoring of Unsaturated Polyester Resin from Ultra-Violet Curing," Journal of Research Updates in Polymer Science, pp. 35-42, 2012.
[408] A. Hoffman, G. Schmer, C. Harris and W. Kraft, "Covalent Binding of Biomolecules to Radiation-grafted Hydrogels on Inert Polymer Surfaces," Transactions - American Society for Artificial Organs, vol. 18, no. 1, pp. 10-16, 1972.
[409] T. Garrison, Oceanography: An Invitation to Marine Science, Cengage Learning, 2012.
[410] R. Faires and G. Boswell, Radioisotope Laboratory Techniques, London, UK: Butterworths, 1981.
[411] Elemental Scientific, "Analysis of Undiluted Seawater - Preconcentration and Matrix Removal," [Online]. Available: http://www.icpms.com/pdf/seaFAST-Flier.pdf. [Accessed 29 June 2014].
[412] R. Ebewele, Polymer Science and Technology, CRC Press, 2000.
[413] G. Eaton, S. Eaton, D. Barr and R. Weber, Quantitative EPR, Springer, 2010.
[414] L. Cho, "Identification of Textile Fiber by Raman Microscopy," Forensic Science Journal, vol. 6, no. 1, pp. 55-62, 2007.
[415] N. Cheremisinoff, Industry Solvents Handbook, Revised and Expanded, CRC Press, 2003.
287
[416] I. Bruker Instruments, "Bruker EMX User's Manual," EPR Division; Bruker Instruments, Inc., Billerica, MA.
[417] F. Basuki, N. Seko, M. Tamada, T. Sugo and T. Kume, "Direct Synthesis of Adsorbent Having Phosphoric Acid with Radiation Induced Graftpolymerization," Journal of Ion Exchange, vol. 14, pp. 209-212, 2003.
[418] V. Barrios, J. Mendez, N. Aguilar, G. Espinosa and J. Rodriguez, "FTIR - An Essential Characterization Technique for Polymeric Materials," in Infrared Spectroscopy - Materials Science, Engineering and Technology, InTech , 2012, pp. 195-214.
[419] C. Andreola, F. Chlanda and J. Huang, "Polysulfone Backbone Grafted to Anionic Addition Polymers". United States of America Patent US5643968 A, 1 July 1997.
[420] National Diagnostics, "Principles and Applications of Liquid Scintillation Counting," National Diagnostics, 2004.
[421] National Nuclear Data Center, "Chart of the Nuclides," [Online]. Available: http://www.nndc.bnl.gov/chart/. [Accessed 6 April 2014].
[422] Y. Hatano, Y. Katsumura and A. Mozumder, Charged Particle and Photon Interactions with Matter: Recent Advances, Applications, and Interfaces, CRC Press, 2010.


![GRAFTED TOMATO - Iserv1].pdf · GRAFTED TOMATO Grafted onto ... Grafting joins the top part of one plant (the scion) to the root ... (TPIE) - January 18-20, 2012 Spring Trials in](https://static.fdocuments.in/doc/165x107/5aa1ea047f8b9a436d8c452d/grafted-tomato-1pdfgrafted-tomato-grafted-onto-grafting-joins-the-top-part.jpg)