Abstract - TIDE
23
Determining impact of a dump site on the Rio Grande river, Southern Belize, using stable isotope and trace elemental analysis of aquatic species of multiple trophic levels C. Halvorson, Geography, environmental Studies Department, University of Victoria, Victoria, British Columbia, Canada In Collaboration with; James Foley, Research & Monitoring Department -Toledo Institute for Development and Environment, Punta Gorda, Toledo, Belize Dr. Nikolaus Gantner, Trent University, Department of Chemistry and Environmental & Resource Science 1600 West Bank Drive, Peterborough, Ontario, Canada K9J 7B8 Dr. Daryl Smith Langarra College, Department of Microbiology, 100 W 49th Ave, Vancouver, BC V5Y 2Z6, Canada Submitted: January 2014 Abstract: This study aims to determine presence/ absence of leachate transfer from the primary municipal dump site in Punta Gorda, Belize to species within the nearby Rio Grande river, through contaminant analysis of stored tissue body burdens and stable isotope analysis of C and N. Particulate organic matter (POM), sediment, algae, and bivalves were collected at four sites on the Rio Grande river, POM was collected in leachate from the dump site as well. Results revealed indicators of impact at Site 2 and Site 3, in comparison to reference Site 1. Dissolved oxygen has decreased at Site 2 to levels deemed to reduce biodiversity by the world health organization and supporting authors. This is supported by diminished species abundance of three macroinvertebrate species at Site 2. In comparison to standards reported in similar studies, water quality analysis revealed high concentrations of ammonia, phosphate, nitrate, chromium and manganese in leachate at the Rio Grande dump site as well as high values of nitrate and chromium at Site 2. Trace element analysis of biota revealed elevated concentrations of zinc, chromium, copper, lead, and iron in sediment at Site 3. High concentrations of zinc, manganese, copper, iron and cadmium in algae were also discovered at Site 2, revealing trends supporting impact from dump site on the Rio Grande river; with values highest at Site 2, slightly lower at Site 3, and further decreasing in concentration at Site 4 to levels found at uncontaminated Site 1. Stable Isotope analysis of δ 13 C and δ 15 N revealed unique signatures at impacted sites, in comparison to reference Site 1, supporting impact from the dump site on the river. δ 15 N values in algae, bivalves and snook at Site 2 in comparison to reference Site 1 are consistently lower. δ 13 C values also showed significant decreases at Site 2 in comparison to reference Site 1 in POM and snook as well as in bivalves. Lastly both δ 13 C and δ 15 N at Site 2 and Site 3 show similarities to signatures found in leachate at the dump site in POM. The Rio Grande dump site is currently within a wetland ecosystem that drains into the Rio Grande river and the adjoining Port Honduras Marine reserve (PHMR). Results support the need for relocation of the dump site to an area that is deemed to be more geographically appropriate, and further, restoration of the immediate area to mitigate further impacts from leachate as the dump site inevitably grows in coming years. Key words: dump site; leachate; contamination; carbon and nitrogen stable isotopes; methanogenic; water quality 1. Introduction: Open dump sites, such as the Rio Grande dump site in Southern Belize, are those that are completely unregulated, with no liner or barrier between waste and soil nor any collection or treatment system to manage runoff passed through the waste mass (leachate); mixtures of dangerous chemicals from leachate can then find natural paths into the surrounding environment. Analyses of leachate impacts are most often conducted on surface and groundwater (1, 2, 3, 4, 5). However, water quality analysis provides only a snapshot of contaminant concentrations. Testing organisms, in contrast, provides information on contaminant concentrations over the entire lifespan of the tested species. Furthermore, uptake of anthropogenic pollutants in food webs, termed bioaccumulation, can cause organisms to accumulate contaminant concentrations several times greater than the water they inhabit and the prey they ingest (6, 7, 8). Analysis of tissues is therefore considered a more accurate representation of contaminant concentrations present in affected ecosystems as well as their route of travel through food webs (9, 10, 28, 29, 30). Results from studies analyzing trace elements in tissues are often inconclusive. There are often several possible nutrient input sources and, in river systems in particular, it is difficult to prove a contaminant came from the area under investigation rather than other sources upriver. Stable isotope analysis (SIA) of carbon (δ 13 C) and nitrogen (δ 15 N) is a well- established tool used to trace transfer of nutrients through food webs. In particular it has been used to determine impact from a specific anthropogenic source and to establish conclusive boundaries of influence from that source into nearby environments (9, 10, 26). This is done by tracing isotopic signatures of δ 13 C and δ 15 N as they are enriched in their ratios of heavy to light isotopes by influence from an anthropogenic source and/or transfer through food webs (31, 32, 3, 25, 26, 21, 34). In all landfills, the breakdown of organics within the waste mass will result in a final methanogenic phase, typically after ten years; at this stage organics are no longer actively decomposing complex molecules, instead they are fully broken down into their elemental constituents, resulting in the release of methane gas and carbon dioxide (12, 13, 14,
Transcript of Abstract - TIDE

Determining)impact)of)a)dump)site)on)the)Rio)Grande)river,)Southern)Belize,)using)stable)isotope)and)trace)elemental)analysis)of)aquatic)species)of)multiple)trophic)levels)
)
)
C. Halvorson, Geography, environmental Studies Department, University of Victoria, Victoria, British Columbia, Canada In Collaboration with;
James Foley, Research & Monitoring Department -Toledo Institute for Development and Environment, Punta Gorda, Toledo, Belize Dr. Nikolaus Gantner, Trent University, Department of Chemistry and Environmental & Resource Science 1600 West Bank Drive, Peterborough, Ontario,
Canada K9J 7B8 Dr. Daryl Smith Langarra College, Department of Microbiology, 100 W 49th Ave, Vancouver, BC V5Y 2Z6, Canada
Submitted: January 2014
Abstract:
This study aims to determine presence/ absence of leachate transfer from the primary municipal dump site in Punta Gorda, Belize to species within the nearby Rio Grande river, through contaminant analysis of stored tissue body burdens and stable isotope analysis of C and N. Particulate organic matter (POM), sediment, algae, and bivalves were collected at four sites on the Rio Grande river, POM was collected in leachate from the dump site as well. Results revealed indicators of impact at Site 2 and Site 3, in comparison to reference Site 1. Dissolved oxygen has decreased at Site 2 to levels deemed to reduce biodiversity by the world health organization and supporting authors. This is supported by diminished species abundance of three macroinvertebrate species at Site 2. In comparison to standards reported in similar studies, water quality analysis revealed high concentrations of ammonia, phosphate, nitrate, chromium and manganese in leachate at the Rio Grande dump site as well as high values of nitrate and chromium at Site 2. Trace element analysis of biota revealed elevated concentrations of zinc, chromium, copper, lead, and iron in sediment at Site 3. High concentrations of zinc, manganese, copper, iron and cadmium in algae were also discovered at Site 2, revealing trends supporting impact from dump site on the Rio Grande river; with values highest at Site 2, slightly lower at Site 3, and further decreasing in concentration at Site 4 to levels found at uncontaminated Site 1. Stable Isotope analysis of δ13 C and δ15N revealed unique signatures at impacted sites, in comparison to reference Site 1, supporting impact from the dump site on the river. δ15N values in algae, bivalves and snook at Site 2 in comparison to reference Site 1 are consistently lower. δ13 C values also showed significant decreases at Site 2 in comparison to reference Site 1 in POM and snook as well as in bivalves. Lastly both δ13 C and δ15N at Site 2 and Site 3 show similarities to signatures found in leachate at the dump site in POM. The Rio Grande dump site is currently within a wetland ecosystem that drains into the Rio Grande river and the adjoining Port Honduras Marine reserve (PHMR). Results support the need for relocation of the dump site to an area that is deemed to be more geographically appropriate, and further, restoration of the immediate area to mitigate further impacts from leachate as the dump site inevitably grows in coming years. Key words: dump site; leachate; contamination; carbon and nitrogen stable isotopes; methanogenic; water quality
1. Introduction:
Open dump sites, such as the Rio Grande dump site in Southern Belize, are those that are completely
unregulated, with no liner or barrier between waste and soil nor any collection or treatment system to manage runoff passed
through the waste mass (leachate); mixtures of dangerous chemicals from leachate can then find natural paths into the
surrounding environment. Analyses of leachate impacts are most often conducted on surface and groundwater (1, 2, 3, 4, 5).
However, water quality analysis provides only a snapshot of contaminant concentrations. Testing organisms, in contrast,
provides information on contaminant concentrations over the entire lifespan of the tested species. Furthermore, uptake of
anthropogenic pollutants in food webs, termed bioaccumulation, can cause organisms to accumulate contaminant
concentrations several times greater than the water they inhabit and the prey they ingest (6, 7, 8). Analysis of tissues is
therefore considered a more accurate representation of contaminant concentrations present in affected ecosystems as well as
their route of travel through food webs (9, 10, 28, 29, 30).
Results from studies analyzing trace elements in tissues are often inconclusive. There are often several possible
nutrient input sources and, in river systems in particular, it is difficult to prove a contaminant came from the area under
investigation rather than other sources upriver. Stable isotope analysis (SIA) of carbon (δ13C) and nitrogen (δ15N) is a well-
established tool used to trace transfer of nutrients through food webs. In particular it has been used to determine impact from
a specific anthropogenic source and to establish conclusive boundaries of influence from that source into nearby
environments (9, 10, 26). This is done by tracing isotopic signatures of δ13C and δ15N as they are enriched in their ratios of
heavy to light isotopes by influence from an anthropogenic source and/or transfer through food webs (31, 32, 3, 25, 26, 21,
34).
In all landfills, the breakdown of organics within the waste mass will result in a final methanogenic phase,
typically after ten years; at this stage organics are no longer actively decomposing complex molecules, instead they are
fully broken down into their elemental constituents, resulting in the release of methane gas and carbon dioxide (12, 13, 14,

15). The Rio Grande dump site has been active for 45 years according to local accounts, implying the onset of
methanogenisis.
2. Parameter selection justification:
Biota Analysis: Zinc, chromium, manganese, nickel, copper, lead, cadmium, and iron were selected for biota (Appendix 6:
Glossary) trace element analysis based on waste composition at the dump site and comparable studies of landfills of similar
age, as well as chemical mobility, contaminant persistence, bioaccumulation, and long range transport based on
environmental conditions of southern Belize (9, 10, 52, 38, 12, 14, 54, 55, 56, 57). Methanogenisis can also alter and enrich
the ratio of heavy to light isotopes of carbon and nitrogen (16, 17, 5, 26). This typically results in enriched signatures in
leachate that can then be traced as they cycle through nearby environments and biota, which will have distinct signatures of
their own (3, 5, 17). This study therefore uses isotopic analysis of δ13C and δ15N, paired with trace elemental analysis
in tissues and organs of indicator organisms of multiple trophic levels to determine the presence or absence of
contaminant impact from the dump site under investigation to the second largest river system in southern Belize,
the Rio Grande river.
Water Quality Analysis: Analysis of biota is complimented by standard water quality analysis of temperature and salinity
to ensure that results cannot be attributed to changes in basic environmental conditions between sites rather than impact
from the dump site. pH was measured for this reason and also to confirm if leachate values are within the typical range of
methanogenic waste sites of similar ages, at 7.5-9.0 (36). Conductivity is a measure of the concentration of dissolved ions
in water and was measured as a result of its tendency to increase as a result of influence from nutrient inputs (37). Lastly, to
determine if possible nutrient input was impacting oxygen availability to species, dissolved oxygen was measured and
referenced to guideline values recommended for healthy ecosystem functionality (6.0 mg l-1) and levels reported by the
world health organization to negatively impact the majority of aquatic species (at 3.2 mg l-1) (38). Furthermore, water was
analyzed for the following trace elements: ammonia, phosphate, nitrate, chromium, manganese and zinc. As many elements
as possible selected for biota analysis were tested in water as well to support the possibility of bioaccumulation in biota
from their aquatic environment.
Macroinvertebrate Surveying: Finally, macroinvertebrate benthic surveying was conducted to determine if biodiversity
and abundance of species were changed above and below point of potential contamination from the dump site. Combined,
all forms of analysis aimed to test the null hypothesis ‘there is no impact from the dump site on δ13C and δ15N signatures of
aquatic species of varying trophic levels in the Rio Grande river, and further, no indication of trace elemental transfer’, and
to meet the following objectives:
i) To establish background levels of nutrients in water sources near the dump site and in the Rio Grande for reference to biota analysis.
ii) To determine if the dump site is affecting species composition and biodiversity in the Rio Grande by contrasting relative species abundance between sites
1_UN_Wil_Lan and 2_Parallel_WaterWay_1.
iii) To determine if leachate is reaching the Rio Grande river and influencing aquatic biota through use of carbon and nitrogen stable isotope signatures to establish point source of impact.#
#
iv) To determine the relationships between C and N stable isotope signatures at upstream control site (1_UN_Wil_Lan) and downstream from the dump site
(2_Parallel_WaterWay_1) and furthermore, to determine relationships between signatures at (2_Parallel_WaterWay_1) and leachate signatures at the
dump site, as established through analysis of particulate organic matter (POM).
v) To test ecologically and economically important species, for bioaccumulation of pollutants and to determine if trophic transfer of pollutants is occurring
between organisms in Rio Grande with increasing trophic position.

3. Materials and Methods:
Area Description: The dump site under investigation is located within the wetland ecosystem that encompasses all the
lower reaches of the Rio Grande River, which in turn, drains into the Port Honduras Marine Reserve (PHMR), co-managed
by the Toledo Institute for Development and Environment (TIDE) and the Belize Fisheries Department. The dump site has
been active and uncontrolled since 1970 and is predominantly used for municipal waste, though there have also been
contributions of commercial waste and chemical toxins (18). Waste quantity is dramatically reduced by open burning. In
this study, four sites were established on the Rio Grande river, each chosen based on relative distance from the dump site,
assuming an inverse relationship between distance and impact (45) and geographical influences, namely topography, to
determine varying levels of impact in comparison to reference Site 1.
Sampling Methodologies: Leachate and benthic water samples from all sites were collected in 250ml hydrochloric acid
washed plastic bottles on seven occasions (Sept 13th-Nov.13th). Samples were immediately put on ice during transport to
the TIDE laboratory. Samples were filtered using a 0.45 µm microfiber filter and analyzed same day to minimize microbial
activity within samples that could alter readings. Concentrations of ammonia, zinc, nitrate, phosphate, manganese and
chromium were determined using a Hach DR2800 spectrophotometer following standard procedures (19). pH and
conductivity were measured before filtration using digital probes. Complimentary standard water quality was conducted
on-site on 26 occasions (June 12th- Nov. 13th) for temperature (°C), dissolved oxygen concentration ([DO]) (mg l-1 and %)
and salinity (ppt) using a YSI 550A probe at the surface and just above the river floor.
!.
!.!.
!.
Legend
!. 1_UN_Wil_Lan
!. 2_Parallel_WaterWay_1
!. 3_DownRiver_WaterWay_2
!. 4_EssoLanding_DownWater
Dump Site
Wetland
WaterWays
ROAD_CLASS
Paved
Roa
d
Major R
oad
Other R
oad
Track
´
Punta Gorda
Rio Grande River
Ü
0 60 120 180 24030Kilometers
PHMR General Use Zone Boundary
Fig. 1: Site map

Macroinvertebrate benthic surveying took place on eight occasions (May 29th 2013- July 05th 2013), at sites
(1_UN_Wil_Lan) and (2_Parallel_WaterWay_1). Three sub-sites were sampled within each site’s 50 m parameter. Two
different trap designs and light sources were used to diversify in attempt to attract a wider range of species. One translucent
fluorescent light trap (appendix 1) and two LED light traps (appendix 2) were deployed before sunset and retrieved before
sunrise the following day to ensure that natural light sources did not entice species out of the traps. All traps were active for
8-10 hours on all occasions and the same combination of traps was used for the same time span each survey.
Trap contents were sifted twice through a 1.1 mm sieve to separate the organisms from water and were preserved
immediately in 40% ethanol alcohol. Species were sorted under a microscope on the same day into groups and counted at
TIDE. Each species was then photographed, given a coded name, and incorporated into an identification key. Species
relative abundance (individuals attracted per hour) was then calculated at both sites for each species by compiling data from
all trips and applying the following equation:
Total number (n) of captures
Total time (t) of trap deployment
Species and tissue selection: A representative trophic pyramid was constructed in the Rio Grande and included particulate
organic matter, sediment, algae, bivalves, and snook. All species were selected based on trophic position, accessibility at all
sites, reported likeliness to bioaccumulate, and diet. Species tissues with the slowest turnover rate were selected for δ13C
and δ15N analysis as these tissues represent dietary information over the longest period of time, allowing exclusion of short
term variability (40, 31, 21, 26). Bivalves were then dissected for adductor muscles (49) while the left dorsal fin tissue was
dissected in snook (9, 34, 39). For trace element analysis snook were dissected for their livers as these contain the highest
concentrations of most elements (47, 48). Whole body excluding the shell was used for trace element analysis of bivalves
due to a large sample weight needed and a small average mass of the bivalves in the Rio Grande (0.25 g).
Sediment was used only in trace elemental analysis, as there is not enough organic content to obtain accurate δ13C and δ15N
isotopic signatures. However sediment is commonly tested in trace elemental analysis studies as a result of high quantities
of stored contamination that tend to be found in sediment, particularly heavy metals (42, 44, 45, 46, 34), which are then
available for uptake by higher trophic levels. This is particularly prevalent among silts and clay sediments, at >0.63 µm (50,
43), which is the case at all sites on the Rio Grande. δ13C and δ15N signatures in algae can be affected by influence from
landfill leachate (3). Algae is also an important food source to many upper trophic level species, including snook
(confirmed via gut content analysis), therefore algae was used in conjunction with POM in both forms of biota analysis to
provide foundational information on trace elemental and isotopic alteration availability for transfer from foundational
trophic species to higher levels. POM is composed of decomposing fauna material and waterborne algae and can become
enriched in 13C and 15N as a result of landfill leachate and can therefore allow impact to be traced great distances (37).
POM therefore provided foundational food web data on availability of suspended pollutants in the Rio Grande for uptake
by higher trophic level bivalves. Bivalves are omnivores and feed on waterborne debris and POM, making them effective
secondary trophic level representatives. The environmental rate of uptake for bivalves greatly exceeds their rate of
metabolism, causing bioaccumulation of pollutants and increasing the chance of isotope detection (6, 7). Snook acted as a
highest trophic level representative in this study. Snook were selected due to their high fat content favoring
bioaccumulation, and their tendency to eat a wide range of species, increasing possibility of exposure from different
channels of contamination (41). All species for stable isotope and elemental analysis were collected within each site’s 50 m
parameter (Table 1).

Table#1:#Species#selection#parameters#
Sample preparation: Species representing five trophic levels were collected from all four sites on the Rio Grande (Oct. 8th-
Dec. 5th). Particulate organic matter (POM) was also collected at an additional site, in leachate at the dump site. Samples were
collected by hand or by scuba diving and were immediately put in labeled plastic bags on ice at <3°C for a maximum of 5
hours during transport, until storage in a -30°C industrial freezer to preserve the samples and prevent changes in isotopic
signatures. In the laboratory, samples were controlled for size (1.18 cm ± 0.03 SE) to eliminate bias from increasing δ15N:size
ratio. Prior to dissection samples were weighed, measured and washed with deionized water to prevent contamination from
outer tissues to targeted internal organs. Tissue wet weight was individually measured and samples were then put in a glass
petri dish to be dried.
POM samples were strained on site with a nitric acid washed Buchner funnel and hand pump through a GF/F 0.7
µm Whatman microfiber filter; separating suspended particles from water. Filter papers were immediately put on ice (<3°C) in
sealed plastic bags. All samples, including tissues, organics, and POM were dried in a laboratory grade oven for at least 48
hours at 60°C (40). Dried tissue and organic samples were ground into a fine powder (<100µm) to achieve homogeneity of the
sample using a laboratory grade pestle & mortar with the exception of POM, which was left on the filter paper to ensure that an
accurate reading was not obstructed by only analyzing the scraped off top layer. All samples were transferred to nitric acid
washed, labeled, plastic sample vials for storage at -30°C in a moisture proof container lined with silica beads to prevent
moisture uptake. All equipment in contact with exposed tissues or water samples was cleaned with phosphate free soap, 1:10
nitric acid and deionized water prior to use.
Samples for C and N stable isotope analysis were then weighed on a microbalance for 0.2-0.3 µg aliquots of material, sealed
into tin capsules, and stored in a desiccation cabinet until shipping. Samples for trace element analysis were digested according
to standard procedures in concentrated nitric and hydrochloric acid at 85-90°C for 2 hours to bring all elements within the
sample into solution (20). Samples were shipped in solution in 6ml polyethane vials. All samples were analyzed at Trent
University’s Dr. Hintelman laboratory.
SpeciesCommon name
Target organ or material
# of replicates per site Collection method
Diet composition Length (cm)
Particulate Organic Matter (a) POM All 5
water grab at benthic layers none none
Sediment (b) Sediment All 5metal sediment grab at benthic layers none <63 !m
Alga (a,b) Algae All 5
retrieved from submerged mangrove roots at surface none none
Unionoida (a,b) Bivalves
Adductor Muscle (a) Whole body
(minus.shell) (b) 5 Scuba Diving
Debris, POM, zooplankton, algae and bacteria 1.37 +- 0.85
Centropamus undecimalis (a,b) Snook
Muscle Tissue (left.dorsal.fin) (a)
Liver(b) 1 Gill netting
Shrimp, algae, small fish, invertebrates 36.5+- 2.5
a: Stable Isotope analysisb: Elemental Analysis

Analysis: δ15N and δ13C were tested using a dual input isotope ratio mass spectrometer (IRMS). Throughout analysis, every
12-15 samples, certified reference material USGS 40 was run through the mass spectrometer for calibration and then with
casein to normalize the data. All results are expressed in standard delta notation (δ) expressed as deviations in ‰ from the
PDB standard & atmospheric N2 respectively. This is the raw ratio of the heavy to light isotope as calculated in an
internationally accepted standard according to the following formula: δR = [(XSAMPLE/XSTANDARD -1)] x 103 (where R = 13Cor 15N and X = 13C/12C or 15N/14N).
Concentrations of copper, chromium, manganese, lead, cadmium, iron, nickel and zinc were tested using an
inductively coupled plasma mass spectrometer (ICP-MS) and reported in parts per million. A blank was run every 16
samples and was then subtracted from all sample results to account for background sources of elemental contamination
acquired during preparation and analysis. To ensure accuracy further, three duplicated samples were run during both stable
isotope and trace element analysis and results compared for consistency; no significant discrepancies were detected.
4. Results:
Benthic Surveying: Throughout all trips, 2,651 specimens were collected, of 34 unique taxa (Appendix 3 for complete
key). Of these, species 2, 3, 5 and 8 (Appendix 4) were captured enough times to provide a reliable sample size, having an
abundance (mean number caught per hour) of 6.8, 14.7, 5.8 and 3.8 respectively. These four species have shown marked
differences in abundance between areas expected to be non-influenced and highly influenced by the Rio Grande dump site
(Appendix 5: relative abundance of all species, Sites 1 and 2 comparison).
Standard Water Quality: Dissolved oxygen continues to support impact from the dump site on the Rio Grande. Values
are highest at Site 1, with little variance between surface (4.4 mg l-1 ± 0.22 SE) and floor (4.3 mg l-1 ± 0.27 SE) readings,
then decrease significantly at Site 2 to 2.9 mg l-1 ± 0.3 SE at the surface and to anoxic levels, at 1.6 mg l-1 ± 0.31 SE at the
floor. Site 3 shows increases to values just below Site 1 at 4.0 mg l-1 ± 0.27 SE at the surface and 3.6 mg l-1 ± 0.48 SE at the
floor. Site 4 has similar values to site 3 at 3.9 mg l-1 ± 0.22 SE on the surface and 3.1 mg l-1 ± 0.37 SE on the floor.
pHConductivity (us/l) Temperature (°C ) Dissolved Oxygen (mg/l) Salinity
Site 1 7.49 ± 0.11 352.56 ± 44.64 Surface: 25.0 ± 0.09 Surface: 4.4 ± 0.22 0
Floor: 25.04 ± 0.10 Floor: 4.3 ± 0.27
Site 2 7.34 ± 0.15 246.44 ± 37.67 Surface: 25.2 ± 0.13 Surface: 2.9 ± 0.30 0
Floor: 25.25 ± 0.11 Floor: 1.6 ± 0.31
Site 3 7.34 ± 0.15 282.42 ± 31.51 Surface: 25.2 ± 0.11 Surface: 4.0 ± 0.27 0
Floor: 25.4 ± 0.22 Floor: 3.6 ± 0.48
Site 4 7.37 ± 0.13 583.62 ± 167.01 Surface: 25.6 ± 0.13 Surface: 3.9 ± 0.22 0
Floor: 26.3 ± 0.33 Floor: 3.1 ± 0.37
Leachate 7.04 ± 0.43 590.49 ± 212.80 ~ ~ ~
Table#2:##Mean#pH,#Conductivity,#Temperature,#Dissolved#oxygen#and#Salinity,#all#sites#

!"#$%#&"' ()&"'*' ()&"'+' ()&"',' ()&"'-'.//01)#'234,5' 676,8' 676,9' 676*8' 676**' 676+,'
67666'
676*6'
676+6'
676,6'
676-6'
67696'
67686'
!"#$%$
&''()*+$,-./0$!1+)$
!"#$%#&"' ()&"'*' ()&"'+' ()&"',' ()&"'-'.)/$'0./1' 232,+' 23*+-' 23245' 23246' 2325,'
23222'232+2'232-2'23242'23272'23*22'23*+2'23*-2'23*42'23*72'
!"#$%
&'()%*&(+%!,-(%
!"#$%#&"' ()&"'*' ()&"'+' ()&"',' ()&"'-'.%/01%#&"0'2.3,4' 56*+7' 56*-*' 56**8' 5659-' 565:-'
56555'565+5'565-5'565:5'56595'56*55'56*+5'56*-5'56*:5'56*95'56+55'
!"#$%
&'()*'+,-%.&/01%!-+2%
!"#$%#&"' ()&"'*' ()&"'+' ()&"',' ()&"'-'.)&/#&"0'1.2,3' 456-7' 4578,' 458,7' 457-9' 45-:-'
45444'
45+44'
45-44'
45744'
45844'
*5444'
*5+44'
!"#$%
&'()*(+,%-&./0%!+*1%
Temperature is relatively uniform across all sites within 0.60 °C on the surface and 1.26 °C on the floor. pH values in the
leachate (7.04± 0.43 SE) support methanogenic conditions within the waste mass, though a higher standard error in
leachate compared to all other sites (0.11-0.15) can be seen as incidences of high rainfall altered conditions within the
waste mass.
Trace elemental analysis of water (Figs. 2-7): In comparison to standards reported in similar studies (1-5, 12, 35-36),
results from water quality nutrient analysis revealed high concentrations of ammonia, phosphate, nitrate, chromium and
manganese in the leachate at the Rio Grande dump site, where zinc proved to be in low quantities in leachate compared to
all sites on the Rio Grande. Nitrate and chromium had highest values at Site 2 (at 0.83 mg l-1± 0.13 SE and 0.032 mg l-1
± .0002 SE respectively), levels even higher than that found in the leachate (0.746 mg l-1 ± 0.01 SE and 0.001 mg l-1± 0.002
SE respectively). Upstream Site 1 revealed relatively high concentrations of many of the tested nutrients; in the case of
ammonia (0.035 mg l-1± 0.02 SE), zinc (0.124 mg l-1± 0.05 SE), phosphate (0.141 mg l-1± 0.04 SE) and manganese (0.563
mg l-1± 0.05 SE) concentrations were higher than Site 2 (at 0.016 mg l-1± 0.01 SE, 0.067 mg l-1± 0.01 SE, 0.115 mg l-1±
0.03 SE, and 0.478 mg l-1± 0.09 SE respectively) and in the case of ammonia, phosphate and zinc, were higher or equal to
values found in leachate (0.035 mg l-1± 0.01 SE, 0.141 mg l-1± 0.02 SE, 0.124 mg l-1± 0.01 SE respectively).
Fig 3: [Zinc] in water, all sites #
Fig 2: [Ammonia] in water, all sites #
Fig 5: [Phosphate] in water, all sites #
Fig 4: [Nitrate] in water, all sites #

!"#$%#&"' ()&"'*' ()&"'+' ()&"',' ()&"'-'.%/01)21'3./4' 56557' 56558' 565*+' 56559' 56558'
56555'
5655+'
5655-'
5655:'
56559'
565*5'
565*+'
565*-'
565*:'
!"#$%
&'()*+,*%-&(.%!/01%
!"#$%#&"' ()&"'*' ()&"'+' ()&"',' ()&"'-'.#/0"1"'2.03' 4567+' 4576,' 45-89' 457,*' 457,7'
45444'
45*44'
45+44'
45,44'
45-44'
45744'
45644'
45844'
45944'
!"#$%$
!&'"&'()($*!'+$!(&'$
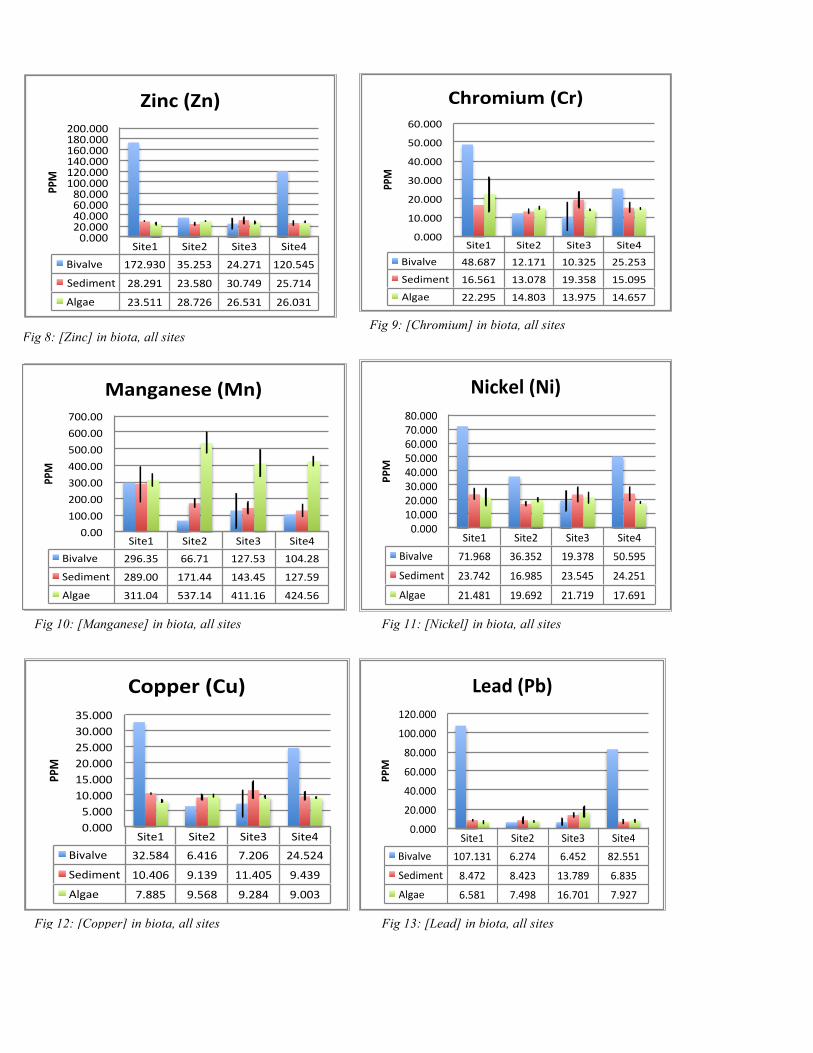
Trace Element Tissue Analysis (Figs. 8-15): Biological Material: In sediment, Site 3 revealed highest
concentrations of zinc, chromium, copper, lead, and iron (30.749 ± 2.21 SE, 19.358± 0.59 SE, 11.405± .46 SE,
13.789± 0.01 SE, 12301.64± 554.13 ppm respectively). None of the tested parameters were highest at Site 2 in
sediment. Site 1 (control) revealed highest values of manganese, nickel, and cadmium (289.0± 35.5 SE, 23.742±
6.04 SE, 0.189± 0.01 SE ppm respectively). In algae however, zinc, manganese, copper and iron levels were
highest at Site 2 (28.726± 1.87 SE, 537.14± 65.18 SE, 9.568± 0.35 SE, 13078.4± 707.68 SE ppm respectively),
and cadmium levels at Site 2 were equal to Site 3 (0.172± 0.01 SE ppm). Site 1 was highest only in chromium
(22.295± 9.33 SE ppm). Elemental concentrations found in bivalves include no standard error due to only one
sample tested per site, with the exception of Site 3, where still only 2 samples were analyzed. Results reveal high
concentrations at Site 1, above all tested samples at all sites, of the following elements: zinc, chromium, nickel,
copper, lead, cadmium and iron (172.93, 48.687, 71.965, 32.584, 107.131, 2.521, 12736.99 ppm respectively).
Among this minute sample size, none of the parameters were highest at Site 2. Site 4 followed in concentration of
zinc, chromium, nickel, copper, lead, and cadmium (120.545, 25.253, 50.595, 24.524, 82.551, 1.237 ppm
respectively).
δ13 C and δ15N Stable Isotope Analysis (Fig 16): Biota: Results from δ15N revealed δ15N enrichment with
average trophic fractionation factor of 3.58 ‰ between species. Algae, bivalve and snook mean δ15N values
were notably lower at Site 2 (1.68± 0.94 ‰ SE, 5.48± 0.14‰ SE, 10.26 ‰ respectively) compared to all other
sites (1.82-2.56‰, 6.02-6.37‰, and 10.41‰ respectively). POM was analyzed for twice as many replicates as
all other tested species and yet δ15N standard error was higher at all sites. POM demonstrated a reversed trend
in comparison to other tested biota; sites expected to be most influenced, being Site 2 and leachate,
demonstrated increases in δ15N and are graphically grouped together, where Sites 1 and 4 are grouped together
at a lower δ15N ‰.
Among all tested biota within the same site, there are increases in δ13 C with increasing trophic level,
with the exception of POM, which tends to have values similar to tested bivalves. Ratios revealed decreases in
δ13 C in all species at Site 2. Site 4 followed in concentration of zinc, chromium, nickel, copper, lead, and
cadmium (120.545, 25.253, 50.595, 24.524, 82.551, 1.237 ppm respectively).
Fig 6: [Manganese] in water, all sites #
Fig 7: [chromium] in water, all sites #
!"#$%& !"#$'& !"#$(& !"#$)&*"+,-+$& .%/012& (1/(3'& %0/(.2& 34/303&
!$5"6$7#& '(/.)'& %1/023& '(/3)3& ')/'3%&
8-9,$& '%/)2%& %0/10'& '%/.%0& %./10%&
4/444&%4/444&'4/444&(4/444&)4/444&34/444&14/444&.4/444&24/444&
!!"#
$%&'()#*$%+#
!"#$%& !"#$'& !"#$(& !"#$)&*"+,-+$& ('./0)& 1.)%1& 2.'31& ')./')&
!$4"5$6#& %3.)31& 7.%(7& %%.)3/& 7.)(7&
8-9,$& 2.00/& 7./10& 7.'0)& 7.33(&
3.333&/.333&%3.333&%/.333&'3.333&'/.333&(3.333&(/.333&
!!"#
$%&&'(#)$*+#
!"#$%& !"#$'& !"#$(& !"#$)&*"+,-+$& %./0%(%& 10'/)& 10)2'& 3'022%&
!$4"5$6#& 30)/'& 30)'(& %(0/37& 103(2&
8-9,$& 1023%& /0)73& %10/.%& /07'/&
.0...&
'.0...&
).0...&
1.0...&
3.0...&
%..0...&
%'.0...&
!!"#
$%&'#(!)*#
!"#$%& !"#$'& !"#$(& !"#$)&*"+,-+$& %.'/0(1& (2/'2(& ')/'.%& %'1/2)2&
!$3"4$5#& '6/'0%& '(/261& (1/.)0& '2/.%)&
7-8,$& '(/2%%& '6/.'9& '9/2(%& '9/1(%&
1/111&'1/111&)1/111&91/111&61/111&%11/111&%'1/111&%)1/111&%91/111&%61/111&'11/111&
!!"#
$%&'#($&)#
!"#$%& !"#$'& !"#$(& !"#$)&*"+,-+$& )./0.1& %'/%1%& %2/('3& '3/'3(&
!$4"5$6#& %0/30%& %(/21.& %7/(3.& %3/273&
8-9,$& ''/'73& %)/.2(& %(/713& %)/031&
2/222&
%2/222&
'2/222&
(2/222&
)2/222&
32/222&
02/222&
!!"#
$%&'()*(#+$&,#
!"#$%& !"#$'& !"#$(& !"#$)&*"+,-+$& './0(1& //02%& %'201(& %3)0'4&
!$5"6$7#& '4.033& %2%0))& %)(0)1& %'201.&
8-9,$& (%%03)& 1(20%)& )%%0%/& )')01/&
3033&%33033&'33033&(33033&)33033&133033&/33033&233033&
!!"#
"$%&$%'('#)"%*#
Fig 8: [Zinc] in biota, all sites# Fig 9: [Chromium] in biota, all sites##
Fig 10: [Manganese] in biota, all sites##
Fig 11: [Nickel] in biota, all sites##
Fig 12: [Copper] in biota, all sites##
Fig 13: [Lead] in biota, all sites##

!"#$%& !"#$'& !"#$(& !"#$)&*"+,-+$& './'%& 0./)%& 0.''1& %.'(2&
!$3"4$5#& 0.%61& 0.%2'& 0.%/%& 0.%/0&
7-8,$& 0.%)6& 0.%2'& 0.%2(& 0.%9/&
0.000&
0./00&
%.000&
%./00&
'.000&
'./00&
(.000&
!!"#
$%&'()'#*$&+#
!"#$%& !"#$'& !"#$(& !"#$)&*"+,-+$& %'.(/011& %//20(3& /.'104(& (4(20()&
!$5"6$7#& %'%./0)/& 14).02/&%'(3%0/)&%333403%&
8-9,$& 1%('0.4&%(3.20)3&%34()03/&%%)()0%1&
3033&'333033&)333033&/333033&2333033&%3333033&%'333033&%)333033&%/333033&
!!"#
$%&'#()*+#
Fig.#16#
Taking into account standard error, all of these decreases were significant with the exception of bivalves, which had only
slightly decreased values. Among apparently impacted biota, being POM at Site 2 and in leachate, bivalves, and snook, δ13
C signatures are all similar, ranging from -28.44‰ -27.92‰. In particular, bivalve δ13 C signatures are nearly identical to
signatures in leachate, at -27.92‰ -27.91‰ respectively. Leachate values in POM were not significantly different to values
at Site 2 and Site 3, as demonstrated with standard error. δ13 C in POM is highest at Site 4 (δ -26.75‰ ± 0.29 SE), followed
by Site 1 (δ -27.09‰ ± 0.28 SE) Site 3 (δ -27.39‰ ± 0.17 SE), leachate (δ -27.91‰ ± 0.58 SE) and Site 2 (δ -28.44‰ ±
0.51 SE).
!"#$%&'()&'*+"$&,-&)%./$0.&&&
,*0%&1&&,*0%&2&&,*0%&3&&,*0%&4&&5%"67"0%&
89:&&;$<"%&&&=*>"$>%&&&,+((?&&&&
Fig 14: [Cadmium] in biota, all sites##
Fig 15: [Iron] in biota, all sites##

5. Discussion
Phase 1: Water Quality and Biodiversity Analysis
Water quality analysis revealed significantly decreased values of dissolved oxygen at Site 2 in comparison
to reference Site 1. With no known additional anthropogenic inputs into the Rio Grande river between these two sites (22),
it is plausible that the dump site is responsible for downstream decreases in this parameter. Values at Site 2 (2.9 mg l-1 ±
0.3 SE on the surface and 1.6 mg l-1 ± 0.31 SE at the floor) (Table 2) are well below levels reported to negatively impact
aquatic species and biodiversity (at 3.2 mg l-1) (23). This is supported with results from macroinvertebrate community
surveying revealing changes in community structure and biodiversity between Site 1 and Site 2 of species 2, 5 and 8.
Analysis of pH in leachate at the dump site, averaging at 7.04 mg l-1± 0.43 SE supported methanogenisis as being within
the waste mass of the Rio Grande dump site and were similar to values reported in studies of waste sites of similar age
(9,10).
Trace elemental water quality analysis revealed high concentrations of many of the tested parameters
expected to be produced by a methanogenic waste mass in leachate and at Site 2. Leachate contained high ammonia,
phosphate, nitrate, chromium and manganese; zinc was the only exception and had relatively low values compared to
tested sites on the Rio Grande. This could indicate naturally high levels of zinc in the Rio Grande, or an alternative
anthropogenic source upriver, or at, Site 1. Phosphates had values at Site 2 (0.115 mg l-1 ± 0.03 SE) comparable to
leachate values (0.127 mg l-1 ± 0.02 SE). Nitrates, zinc and chromium had values at Site 2 (0.836 mg l-1 ± 0.13 SE, 0.07
mg l-1 ± 0.01 SE, 0.012 mg l-1 ± 0.002 SE respectively) that exceeded leachate values (0.746 mg l-1± 0.08 SE, 0.03 mg l-1±
0.01 SE, 0.0007 mg l-1± 0.002 SE respectively). It is possible that these values exceed leachate as a result of Site 2 acting
as a sink for trace elemental accumulation or as a result of leachate inputs mixing with other anthropogenic inputs and
some background levels as well, creating increased values to leachate.
Phase 2: Biota Analysis:
Trace Element Biota Analysis: Of the elements tested both in water and biota, all values, among all samples were
significantly higher in biota. Results then reveal trends demonstrating the possibility of increased contaminant
concentration with increased trophic position, or bioaccumulation. Sites 2 and 3, being within 200m of one another and
both expected to be receiving impact from the dump site, show elevated levels of many of the tested elements. In
sediment, Site 3 had elevated concentrations of zinc, chromium, copper, lead, and iron. Algae analysis revealed more of
an impact at Site 2, with high concentrations of zinc, manganese, copper, iron and cadmium; in algae all of these elements
follow trends supporting impact from dump site on the Rio Grande river; with values highest at Site 2, slightly lower at
Site 3, and further decreasing in concentration at Site 4 to levels found at uncontaminated Site 1. All of the above listed
transition metals are not typically in high concentrations in methanogenic landfills and further, do not typically travel
distances as far as what can be seen in data from this study (5, 13, 2, 27, 35). Many of these elements could then have
been accumulated in biota from natural or other anthropogenic sources.
Possible Trace Elemental Inputs at Site 1: Ammonia, zinc, phosphate and manganese in water analysis and sediment
[manganese], algae [chromium], and all tested elements in bivalves, are highest at Site 1. These results could indicate the
possibility of an unexpected anthropogenic influence upstream, or at Site 1 that could be increasing the concentrations of
these parameters in the Rio Grande River. Agriculture has been shown to input these elements into river systems (33).
Belcampo Belize Lodge and organic farm is just 50m upstream from Site 1 and is built on land that was historically used
for cane and cattle production (51); soil could then be retaining historical levels of elements inputted from these practices.
The Rio Grande river was also used for industrial shipping 70-100 years ago according to numerous local accounts, at

Site 1 lie the remains of rusted metal structures, these historical factors could have an impact outside the scope of this
study at Site 1. It is also possible that influence from the dump site could be reaching Site 1 via a presently unknown
dominant water pathway or groundwater leaching. Lastly, these elements could simply be naturally occurring in high
quantities as a result of the geology of the river.
Nitrogen and Carbon Stable Isotope Analysis: δ15N and δ13 C: δ15N values for each species increased by an average
of 3.58 ‰ with trophic position, each species then shows higher fractionation than the trophic level below with algae and
POM having similar fractionation, and snook and bivalves having clear increases in fractionation compared to the lower
trophic levels sampled. δ13C values in contrast show similar reduced fractionation between trophic levels with the
exception of algae, which shows increased fractionation and/or the uptake of a more negative source of δ13C. Primary
producers like aquatic algae have been shown to have highly variable δ13C signatures as a result of diffusional resistance
of δ13C in water (58), this could explain the significant differentiation of δ13 C in algae in comparison to other tested biota.
Methanogenisis typically results in fractioning and enrichment of δ13C and δ15N with heavy isotopes within
landfill leachate (3, 15, 25). δ15N values did not reveal enrichment in algae, bivalves and snook at Site 2; instead more
negative δ15N values were discovered at (1.68 ‰ ± 0.94 SE, 5.48 ‰ ± 0.11 SE, 10.26 ‰ respectively) compared to other
sites (1.82-2.56‰, 6.02-6.37‰, and 10.41‰ respectively).
δ13 C analysis also revealed more negative values at Site 2 in all species compared to reference Site 1.
Analysis of POM did however demonstrate trends of δ15N enrichment in leachate at 0.736 ‰ ± 0.82 SE, compared to
reference Site 1 at -2.34 ‰ ± 1.57 SE, and enrichment just above leachate values at Site 3 at 1.35 ‰ ± 0.95 SE. Though,
in contrast, δ13 C values in POM decreased, POM values at Sites 2 and 3 demonstrated similarities to leachate signatures
in both parameters.### # Comparable studies report similar trends, being changes in signatures at impacted sites, but instead report
enrichment of tested isotopes as a byproduct of methanogenic bacteria up taking lighter δ12C and δ14N to produce
methane and carbon dioxide (27). δ13C values have been reported to range from -27‰ (5) to +20‰ in leachate (3, 5, 17)
depending on whether organic or inorganic carbon was analyzed. δ15N reports enrichment of +27.42 ‰ (3). Studies
reporting such results are all conducted on water and soil, δ13C and δ15N signatures in biota may not follow trends seen in
comparable studies. Signatures are inevitably changed by geographical and biochemical conditions as leachate is
transferred through an environment (25). Furthermore uptake of leachate affected δ13 C and δ15N by primary producers
and consumers, and eventually to upper trophic level species via bioaccumulation, will inevitably affect the final
signature. Therefore, in contrast to enrichment seen in sediment and water analysis, stable isotopes in biota could
decrease in heavier δ13 C and δ15N isotopes and instead increase in lighter δ12 C and δ14N with input from anthropogenic
solid waste.#
Changes in δ13 C and δ15N signatures in the Rio Grande’s biota at impacted Site 2 and 3, in comparison to reference Site 1,
are likely a result of leachate impact on the river based on the following;
1. Site 2 and Site 3 δ13 C and δ15N POM values show similarities to signatures found in leachate at the
dump site. 2. Consistently more negative δ15N values in algae, bivalves and snook at Site 2 in comparison to reference
Site 1. 3. Significantly decreased δ13 C in POM and snook at Site 2 in comparison to reference Site 1, as well as notable
decreases in δ13 C in bivalves.
6. Conclusions:
Stable isotope analysis of nitrogen (δ15N) and carbon (δ13C) paired with toxicity testing of stored tissue
body burdens in species of various trophic levels, complimented by water quality analysis has resulted in quantitative

assessment of potential bioaccumulation and contaminant transfer from the dump site under investigation to the Rio
Grande river. Results from water analysis indicate that the dump site may be expelling relatively high levels of ammonia,
phosphate, nitrate, chromium and manganese into the Rio Grande river and surrounding environment. Further, notable
changes in both δ13 C and δ15N in POM support the notion that the dump site is influencing the immediate area, and
further, is impacting surface and groundwater that is reaching the Rio Grande, accumulating in inhabiting biota, as
established via trace element and δ13 C and δ15N analysis of biota and tissue. Further contaminant and statistical analysis
is needed to determine unequivocally that this association is a negative one.
Plans for Relocation and restoration: The Solid Waste Management Authority (SWMA) has established the Rio
Grande dump site as a priority for relocation. Currently the organization is relocating the central dump site in Belize City.
The Rio Grande dump site will become priority soon after this existing project is complete, (estimated three years) (30).
Results from this study will inform negotiations over the coming years involving the SWMA, TIDE, Punta Gorda Town
Council, the public, and the Belize Government in regards to relocating the site and reforming solid waste management in
the southern districts.
Recommendations for further analysis/ Limitations of study: It is important to determine the reason for high values of
many of the tested trace elements in both water and biota at Site 1. This could involve testing additional sites even further
upriver and comparing results with an additional river deemed to be similar enough in environmental conditions and
inputs to the Rio Grande. Selection of additional sites must be deemed appropriate after a thorough hydrological and
topographic survey. Lack of confidence in reference Site 1 being uninfluenced by the dumpsite via groundwater leaching
is the greatest limitation in this study and analysis must be done to provide additional confidence in comparing all results
to a more certain reference site. Additional replicates must also be tested to support the conclusions in this paper,
particularly of bivalves and snook. Furthermore an additional species, Mayan cichlids (Cichlasoma urophthalmus) need
to be analyzed as well to provide more location specific isotopic information than what can be achieved through analysis
of higher trophic level snook. Analysis of additional trophic levels will also allow for increased confidence in expected
bioaccumulation of trace elements in. Furthermore, analysis in this project excluded soil analysis in leachate; this must be
included as a reference to discovered trace elemental values in the Rio Grande.!!!
Acknowledgements: A very special thanks to one of the most influential people I’ve met in my whole life, Mr. James Foley. I knew
nothing until I came to Belize to do this project with you and I will always be grateful for your unwavering belief in me and guidance.
Thank you to Dr. Nikolaus Gantner for your intelligence and support, and to the lab technicians Jean Francois and Bastian for
answering my endless questions. Also, Dr. Daryl Smith, your cool headed calmness and rationality has truly saved me when I needed it
most and know that I aspire to be as patient and good humored as you are one day. Giselle Mahung and Matti McAplin (Momma
Mahung and Mc. Mac) for all your help in the lab and in the field, counting invertebrates and preparing samples, I truly couldn’t have
done this without either of you. Thank you to Mrs. Celia for bringing me nutrition on numerous occasions on my late nights in the lab.
Paul Eteinne for helping me realize my very specific video vision. The TIDE rangers: in particular Eugenio, Ishim, Marcus, Delbert,
and Cooks; you guys are truly rockstars and your knowledge and determination to keep TIDE thriving is invaluable. Ms. Stephene, you
are the glue that holds TIDE together and you amaze me. And everyone else: every single one of you were there for me at a moment’s
notice when I needed it and I am so happy to have worked with all of you. Also of course thank you so much to the funders of this
project, KfW and MarFund, this project couldn’t have happened without you. And all the donors to my Indiegogo campaign, I am so
grateful to have support from all my friends and family. !

!References:!1. Suman, Mor., Khaiwal, Ravindra., Dahiya, R. P., Chandra, A. (2006). Leachate characterization and assessment of groundwater pollution near municipal solid
waste landfill site. Environmental Monitoring and Assessment, 118.1-3, 435-456. 2. Bhalla, Barjinder., Saini, M. S., Jha, M. K. (2012). Characterization of leachate from municipal solid waste (msw) landfilling sites of Ludhiana, India: A
Comparative Study. International Journal of Engineering Research and Applications, 732-745. 3. North, Jessica C., Frew, Russell D., Peake, Barrie M. (2004). The use of carbon and nitrogen isotope ratios to identify landfill leachate contamination: Green
Island Landfill, Dunedin, New Zealand. Environment International, 30.5, 631-637. 4. Ogundiran, O. O., Afolabi, T. A. (2008). Assessment of the physicochemical parameters and heavy metals toxicity of leachates from municipal solid waste
open dumpsite. Int. J. Environ. Sci. Tech, 5.2, 243-250. 5. Van Breukelen, Boris M.,#Roling, Wilfred F.M., Groen, Jacobus., Griffioen, Jasper., van Verseveld, Henk W. (2003). Biogeochemistry and isotope
geochemistry of a landfill leachate plume. Journal of Contaminant Hydrology, 65.3, 245-268. 6. Ferris, Jerry L., & Jon H. Van Hassel. (2007). Freshwater bivalve ecotoxicology. CRC Press. 7. Shinsuke, Tanabe. (2006). Bioindicators of POP’s: monitoring in developing countries. Kyoto University Press. 8. Gupta, S. K., & Singh, J. (2011). Evaluation of mollusk as sensitive indicator of heavy metal pollution in aquatic system: a review. iiob j, 2, 49-57 9. Wang, S.,Li, B., Zhang, M., Xing, D., Jia, Y., & Wei, C. (2012). Bioaccumulation and trophic transfer of mercury in a food web from a large, shallow,
hypereutrophic lake (Lake Taihu) in China. Environmental Science and Pollution Research. 19(7), 2820-2831. 10. Kiriluk, R. M., Servos, M. R., Whittle, D. M., Cabana, G., & Rasmussen, J. B. (1995). Using ratios of stable nitrogen and carbon isotopes to characterize the
biomagnification of DDE, Mirex, and PCB in a lake Ontario pelagic food web. Canadian Journal of Fisheries and Aquatic Sciences, 52(12), 2660-2674
12. Kulikowska, D., & Klimiuk, E. (2008). The effect of landfill age on municipal leachate composition. Bioresource Technology, 99(13), 5981-5985. 13. Yusof, N., Haraguchi, A., Hassan, M. A., Othman, M. R., Wakisaka, M., & Shirai, Y. (2009). Measuring organic carbon, nutrients and heavy metals in rivers
receiving leachate from controlled and uncontrolled municipal solid waste (MSW) landfills. Waste Management, 29(10), 2666-2680. 14. Ehrig, H. J. (1983). Quality and quantity of sanitary landfill leachate. Waste Management & Research, 1(1), 53-68. 15. Mohammadzadeh, H., & Clark, J. (2008). Degradation pathways of dissolved carbon in landfill leachate traced with compound-specific 13C analysis of DOC.
Isotopes in Environmental and Health Studies, 44(3), 267-294. 17. Hackley, K. C., Liu, C. L., & Coleman, D. D. (1996). Environmental isotope characteristics of landfill leachates and gases. Ground Water. 34(5), 827-836. 18. Wagnitz, Philip. 2009. Punta Gorda Municipal Waste Report. Toledo Institute for Development and Environment. 19. Belize 2010 population and housing census. http://www.statisticsbelize.org.bz/ 20. Ashoka, S., Peake, B. M., Bremner, G., Hageman, K. J., & Reid, M. R. (2009). Comparison of digestion methods for ICP-MS determination of trace elements
in fish tissues. Analytica Chimica Acta, 653(2), 191-199. 21. Hanas, D., Vollaire, Y., Danger, M., Thomas, M., Oliveira-Ribeiro, C. A., Roche, H., & Ledore, y. (2009). Can we use stable isotopes for ecotoxicological
studies? Effect of DDT on isotopic fractionation in Perca fluviatilis. Chemosphere, 76 (6), 734-739. 22. Requena, Elmar. Human impact mapping of freshwater rivers, Southern Belize. Toledo Institute for Development and Environment. 23. González-Ortegón, E., Rodríguez, A., & Drake, p. (2012). The freshwater shrimp Atyaephyra desmarestii (Millet, 1831) as a bioindicator of hypoxic event
effects on temperate freshwater systems. Ecological Indicators, 18, 236-242. 25. Nada, Miuevic., Dusan, Golobocanin. (2007). Potential use of environmental isotopes in pollutant migration studies. Vinca Institute of Nuclear Sciences,
Belgrade, Serbia, Archives of Industrial Hygiene and Toxicology 58.2 251-262. 26. Timothy. D, Jardine, Karen A. Kidd, Arron T. Fisk (2006) Applications, considerations, and sources of uncertainty when using stable isotope analysis in
ecotoxicology. Canadian Rivers Institute and Department of Biology. University of New Brunswick. 27. Christensen, T. H., Kjeldsen, P., Bjerg, P. L., Jensen, D. L., Christensen, J. B., Baun, A., & Heron, G. (2001). Biogeochemistry of landfill leachate plumes.
Applied Geochemistry, 16 (7), 659-718. 28. Vizzini, S., & Mazzola, A. (2006). The effects of anthropogenic organic matter inputs on stable carbon and nitrogen isotopes in organisms from different
trophic levels in a southern Mediterranean coastal area. Science of the Total Environment, 368 (2), 723-731. 29. Atwell, L., Hobson, K. A., & Welch, H. E. (1998). Biomagnification and bioaccumulation of mercury in an arctic marine food web: insights from stable
nitrogen isotope analysis. Canadian Journal of Fisheries and Aquatic Sciences, 55(5), 1114-1121.30. 30. C. C. M., Li, X. D., Zhang, G., Wong, C. S. C., & Zhang, W. L. (2005). Heavy metal and pH isotopic compositions of aquatic organisms in the Pearl River
Estuary, South China. Environmental Pollution, 138(3), 494-504. 31. Peterson, Bruce J., & Fry, Brian. (1987). Stable isotopes in ecosystem studies. Annual Review of Ecology and Systematics 18. 293-320. 32. Morrissey, C. A., Boldt, A., Mapstone, A., Newton, J., & Ormerod, S. J. (2013). Stable isotopes as indicators of wastewater effects on the macroinvertebrates
of urban rivers. Hydrobiologia, 700(1), 231-244. 33. http://www.fao.org/docrep/003/t0234e/t0234e06.htm, agriculture and consumer protection. 34. Pereira, A. A., van Hattum, B., de Boer, J., van Bodegom, P. M., Rezende, C. E., & Salomons, W. (2010). Trace elements and carbon and nitrogen stable
isotopes in organisms from a tropical coastal lagoon. Archives of Environmental Contamination and Toxicology, 59 (3), 464-477. 35. Kjeldsen, P., Barlaz, M. A., Rooker, A. P., Baun, A., Ledin, A., & Christensen, T. H. (2002). Present and long-term composition of MSW landfill leachate: a
review. Critical Reviews in Environmental Science and Technology, 32 (4), 297-336. 37. Brown, Caldwell. (2001). A guidebook for local governments for developing regional watershed protection plans: Northeast Georgia Regional Development
Center. 38. Chapman, Deborah. (1996): Water Quality Assessments - A guide to use of biota, sediments and water in environmental monitoring - Second Edition. World
Health Organization United Nations Environment Program. 39. Vaslet, A., France, C., Baldwin, C. C., & Feller, I. C. (2012). Dietary habits of juveniles of the Mayan cichlid, Cichlasoma urophthalmus, in mangrove ponds
of an offshore islet in Belize, Central America. Neotropical Ichthyology, 10(3), 667-674. 40. McGeachy, S. A., Paton, C. M., Savoie, M., & Cunjak, R. A. (2003). Stable isotopes in aquatic systems: sample preparation, analysis, and interpretation.
Fisheries and Oceans Canada. 41. Kehrig, H. D. A., Seixas, T. G., Palermo, E. A., Baêta, A. P., Castelo-Branco, C. W., Malm, O., & Moreira, I. (2009). The relationships between mercury and
selenium in plankton and fish from a tropical food web. Environmental Science and Pollution Research, 16 (1), 10-24. 42. Jensen, D. L., Ledin, A., & Christensen, T. H. (1999). Speciation of heavy metals in landfill-leachate polluted groundwater. Water Research, 33 (11), 2642-
2650. 43. Bartram, J., & Ballance, R. (Eds.). (1996). Water quality monitoring: a practical guide to the design and implementation of freshwater quality studies and
monitoring programs. Taylor & Francis.44. Smith, P. N., Cobb, G. P., Godard-Codding, C., Hoff, D., McMurry, S. T., Rainwater, T. R., & Reynolds, K. D. (2007). Contaminant exposure in terrestrial
vertebrates. Environmental Pollution, 150 (1), 41-64. 45. Longe, E. O., & Enekwechi, L. O. (2007). Investigation on potential groundwater impacts and influence of local hydrogeology on natural attenuation of leachate
at a municipal landfill. Int. J. Environ. Sci. Tech, 4(1), 133-140. 46. Ip, C. C. M., Li, X. D., Zhang, G., Wong, C. S. C., & Zhang, W. L. (2005). Heavy metal and Pb isotopic compositions of aquatic organisms in the Pearl River
Estuary, South China. Environmental Pollution, 138(3), 494-504.

47. Alhashemi, A. H., Karbassi, A., Kiabi, B. H., Monavari, S. M., & Sekhavatjou, M. S. (2012). Bioaccumulation of trace elements in different tissues of three commonly available fish species regarding their gender, gonadosomatic index, and condition factor in a wetland ecosystem. Environmental Monitoring and Assessment, 184 (4), 1865-1878.
48. Satyanarayan, S., Muthal, P. L., Krishnamoorthy, K. P., & Kaul, S. N. (1999). Bioaccumulation of organochlorine pesticides in different fish tissues. International Journal of Environmental Studies, 56 (2), 201-213.
49. Gearing, J. N. (1991). The study of diet and trophic relationships through natural abundance 13C. Carbon Isotope Techniques, 1, 201. 50. K. Suyash • N. J. Pawar (2010). Site-specific accentuation of heavy metals in groundwater’s from Ankaleshwar industrial estate, India 51. http://www.belcampobz.com/about/the-belcampo-story.htm 52. Suna Erses, A., & Onay, T. T. (2003). In situ heavy metal attenuation in landfills under methanogenic conditions. Journal of Hazardous
Materials, 99 (2), 159-175.
54. Ward, M. L., Bitton, G., & Townsend, T. (2005). Heavy metal binding capacity (HMBC) of municipal solid waste landfill leachates. Chemosphere, 60 (2), 206-215.
55. Lithner, D., Larsson, Å., & Dave, G. (2011). Environmental and health hazard ranking and assessment of plastic polymers based on chemical composition. Science of the Total Environment, 409 (18), 3309-3324.
56. Boate, Amy. http://wvlc.uwaterloo.ca/biology447/modules/intro/assignments/Introduction2a.htm 57. Herrmann, R. (2001). Chemical and biotic processes affecting the fate and transport of trace organic contaminants in municipal landfills. Journal of
Hydrology (NZ), 40 (1), 43-57. 58. France, R. L. (1995). Carbon-13 enrichment in benthic compared to planktonic algae: food web implications. Marine Ecology Progress Series 124 (1),
307-312. !
#Appendix:!
Appendix!1:!Quatrefoil)Light)trap)design!!!!!###############
######Appendix!2:!Sediment)trap)design)

Full$Macroinvertebrate$Key:$Results$from$Benthic$Surveying$$
!!
$
$$$$$$
!
!
! !!!!!!!!!!!!!!!!!!!!
!!!
!"#$%&$'!(! !
"#$%&$'!)!
!
!"#$%&$'!*!!!!!!!!!!!!!
!"#$%&'()$*)+$"*),-).,/%$,0)'*1&#,23$().&'4,"56)#*,%/,7&%,8$"'9),:3;6,5&*),2*39.,<=1"5),>,%/,=$%6%5)9,7)5)"$#1?,
C. L Halvorson* Geography, Environmental Studies Department, University of Victoria, Victoria, British
Columbia, Canada In Collaboration with:
J. Foley, Research & Monitoring Department -Toledo Institute for Development and Environment, Punta Gorda, Toledo, Belize
Dr. Nikolaus Gantner, Trent University, Department of Chemistry and Environmental & Resource Science, 1600 West Bank Drive, Peterborough, Ontario, Canada K9J 7B8
!
!
!""#$%&'()(
Appendix$3:$Macroinvertebrate,key,

$$$
$$$
!
!
!!!!!!!!!!!!!
!!!!!!!!
!!!!!!
!"#$%&$'!(! !
"#$%&$'!)!!
"#$%&$'!*!
!
!"#$%&$'!+!
!"#$%&$'!,! !
"#$%&$'!-!

$$$
!
!
!!
!!
!!!!!!!!!!!!!!
!!!
!"#$%&$'!()! !
"#$%&$'!((!!
"#$%&$'!(*!
!"#$%&$'!(+!
!"#$%&$'!(,! !
"#$%&$'!(-!

$
!
!
!!!!
!!!!!!!!!!!!
!!!!!!
!!!!!!!!
!"#$%&$'!()! !
"#$%&$'!(*! !"#$%&$'!(+!
!"#$%&$'!(,!
!"#$%&$'!-.! !
"#$%&$'!-(!

$
!
!
!!!
!!!!!!
!!!!!!!!!!!
!"#$%&$'!((! !
"#$%&$'!()!!
"#$%&$'!(*!
!"#$%&$'!(+! !
"#$%&$'!(,! !"#$%&$'!(-!

$
!
!
!
!!!!!
!!!!!!!!!!!!
!"#$%&$'!()! !
"#$%&$'!(*!!
"#$%&$'!+,!
!"#$%&$'!+-! !
"#$%&$'!+(!

$$
!
!
!!!!!!!
!!!!!!
!!
!!!
!!!
!
!"#$%&$'!((!
!"#$%&$'!()!

Appendix(4:(!Key!invertebrate!species!
!!!!!!!!!(((((((((!!!!!
(Appendix(5:(Relative abundance of all species per hour on the Rio Grande River, Sites 1 and 2 (29/05/2013) - (07/05/2013)!
Appendix(6:( Glossary:
• Biota: The total collection of organisms that make up the biosphere.
!
0.0! 2.0! 4.0! 6.0! 8.0! 10.0! 12.0! 14.0! 16.0!1!3!5!7!9!11!13!15!17!19!21!23!25!27!29!31!33!
Relative!abundance!(specimens!found!hrA1)!
Species!ID!#!
Site!1! Site!2!
Fig 4: Species 2 (Family Atyidae) !
Fig. 7: Species 8 (Family unknown)!
Fig. 5: Species 3 (Family Tanaidae)
Fig. 6: Species 5 (Family
unknown)