ABSTRACT Theresa R. Hicks. WHARVES: THE KEYSTONE OF ...
220
ABSTRACT Theresa R. Hicks. WHARVES: THE KEYSTONE OF PLANTATION WEALTH? CASE STUDIES (under the direction of Dr. Lynn Harris) Department of History, April 11, 2012. The Bowling Farm Site (001CSR), a multi-component site comprising Native American and European artifact assemblages, a wharf structure, and a shipwreck, represents a unique clue to early North Carolina history. Located on the Cashie River in Bertie County, this site may be seminal to the history of colonial North Carolina settlement and economy, since little is known about colonial settlement in this area. The primary focus of this thesis is to explore the possibility of a potential correlation between the site’s economic history, wharf construction, and the artifact assemblage by comparing Bowling Farm Site to five other plantation wharf sites located in Maryland, Virginia, North Carolina, and South Carolina. This thesis also aims to promote the importance of archaeology in understanding site history and formation processes on wharf sites while exploring the most appropriate archaeological methodologies to achieve this objective.
Transcript of ABSTRACT Theresa R. Hicks. WHARVES: THE KEYSTONE OF ...

ABSTRACT
Theresa R. Hicks. WHARVES: THE KEYSTONE OF PLANTATION WEALTH? CASE STUDIES (under the direction of Dr. Lynn Harris) Department of History, April 11, 2012.
The Bowling Farm Site (001CSR), a multi-component site comprising Native American
and European artifact assemblages, a wharf structure, and a shipwreck, represents a unique clue
to early North Carolina history. Located on the Cashie River in Bertie County, this site may be
seminal to the history of colonial North Carolina settlement and economy, since little is known
about colonial settlement in this area. The primary focus of this thesis is to explore the possibility
of a potential correlation between the site’s economic history, wharf construction, and the artifact
assemblage by comparing Bowling Farm Site to five other plantation wharf sites located in
Maryland, Virginia, North Carolina, and South Carolina. This thesis also aims to promote the
importance of archaeology in understanding site history and formation processes on wharf sites
while exploring the most appropriate archaeological methodologies to achieve this objective.


WHARVES: THE KEYSTONE OF PLANTATION WEALTH? CASE STUDIES
A Thesis
Presented to
The Faculty of the Department of History
East Carolina University
In Partial Fulfillment
of the Requirements for the Degree
Masters of Arts in History
by
Theresa R. Hicks
April 2012

© copyright
Theresa R. Hicks

WHARVES: THE KEYSTONE OF PLANTATION WEALTH? CASE STUDIES
by
Theresa R. Hicks
APPROVED BY:
DIRECTOR OF THESIS _________________________________________________________ Lynn Harris, Ph.D.
COMMITTEE MEMBER ________________________________________________________ Bradley Rodgers, Ph.D.
COMMITTEE MEMBER ________________________________________________________ Carl Swanson, Ph.D.
COMMITTEE MEMBER ________________________________________________________ Tony Boudreaux, Ph.D.
CHAIR OF THE DEPARTMENT OF HISTORY _____________________________________ Gerald J. Prokopowicz, Ph.D.
DEAN OF THE GRADUATE SCHOOL____________________________________________ Paul Gemperline, Ph.D.

Everyone has a mother and father, but not everyone receives parents who make for
an excellent research assistant and a great proof-reader! Thank you.

ACKNOWLEDGMENTS
My sincerest thanks to: Dr. Lynn Harris, Program in Maritime Studies, ECU Dr. Brad Rodgers, Program in Maritime Studies, ECU Dr. Carl Swanson, Program in Maritime Studies, ECU Dr. Tony Boudreaux, Department of Anthropology, ECU Robert Bowling, Bowling Farms Becky Bowling, Bowling Farms Ben Bowling, Bowling Farms Charles H. Carter III, Shirley Plantation Charles Saunders, J. Sargeant Reynolds Community College Taft Kiser, Cultural Resources Inc. Students of the 2009 Program in Maritime Studies Fall Field Semester, ECU

TABLE OF CONTENTS
INTRODUCTION…………………………...……………………………………………………1
CHAPTER 1. RESEARCH METHODOLODY………….………………………………………6
CHAPTER 2. ARCHAEOLOGICAL METHODOLOGY COMPARISON……………………21
CHAPTER 3. BRITISH MERCANTILISM AND THE COLONIAL SOUTH………………...69
CHAPTER 4. THE VOYAGE OF THE JOANNAH…………………………………………….92
CHAPTER 5. P LANTATION HISTORY AND WHARF DESCRIPTIONS………………...112
CHAPTER 6. WHARF CONSTRUCTION AND ECONOMIC PROSPERITY……………...165
CONCLUSIONS AND RECOMMENDATIONS......……………………………...………….184
BIBLIOGRAPHY………………………………………………………………………...…….186

LIST OF FIGURES
FIGURE 2.1. SAMPLE LOCATIONS TAKEN FROM MULBERRY LANDING WHARF FOR DENDROCHRONOLOGY ANALYSIS………………………………………………………..25 FIGURE 2.2. SECTION 1 OF THE COOPER RIVER SURVEY……………………………...27 FIGURE 2.3. UNDERWATER METHODOLOGIES AT MIDDLEBURG PLANTATION….31
FIGURE 2.4. TERRESTRIAL METHODOLOGIES AT MIDDLEBURG PLANTATION LANDING……………………………………………………………………………………….32
FIGURE 2.5. INVESTIGATORS DOCUMENTING WHARF PILING POSITIONS USING SUB-METER GPS………………………………………………………………………………34
FIGURE 2.6. INVESGIGATORS LIFITING A CORE SAMPLE FROM THE JAMES RIVER ADJACENT TO THE WHARF COMPLEX….………………………………………………...35
FIGURE 2.7. CHARLES H. CATER III INSTUCTING VOLUNTEERS ON SHORELINE SURVEY METHODS…………………………………………………………………………...36
FIGURE 2.8. REDBANKS LANDING SITE MAP SHOWING FIELD METHODS………….39
FIGURE 2.9. BOWLING FARM SITE METHODOLOGY MAP……………………………...42
FIGURE 2.10. DR. BRADLEY A. RODGERS AND DR. LYNN HARRIS ASSEMBLING THE DREDGE HOSE…………………………………………………………………………………44
FIGURE 2.11. GRADUATE STUDENTS STEPHEN DILK, BROWN MIMS, AND JESSICA SMEEKS EXCAVATING A STP AT BOWLING FARM SITE……………………………….46
FIGURE 2.12. 2007 VIRGINIA BASED MAPPING PROGRAM IMAGE OF SHIRLEY PLANTATION WHARF COMPLEX THAT SHOWS THE OUTLINE OF THREE WHARVES VISIBLE ABOVE WATER……………………………………………………………………..55
FIGURE 2.13. POOR SATELLITE CONNECTION CREATED INACCURATE POINT LOCATIONS OF PILINGS IN SHIRLEY PLANTATION WHARF COMPLEX…………….56
FIGURE 2.14. SIDE SCAN SONAR SURVEY OF THE CASHIE RIVER ADJACENT TO THE BOWLING FARM SITE…………………………………………………………………..60
FIGURE 3.1. A 1755 DEPICTION OF THE SOUTHERN COLONIES……………………….69
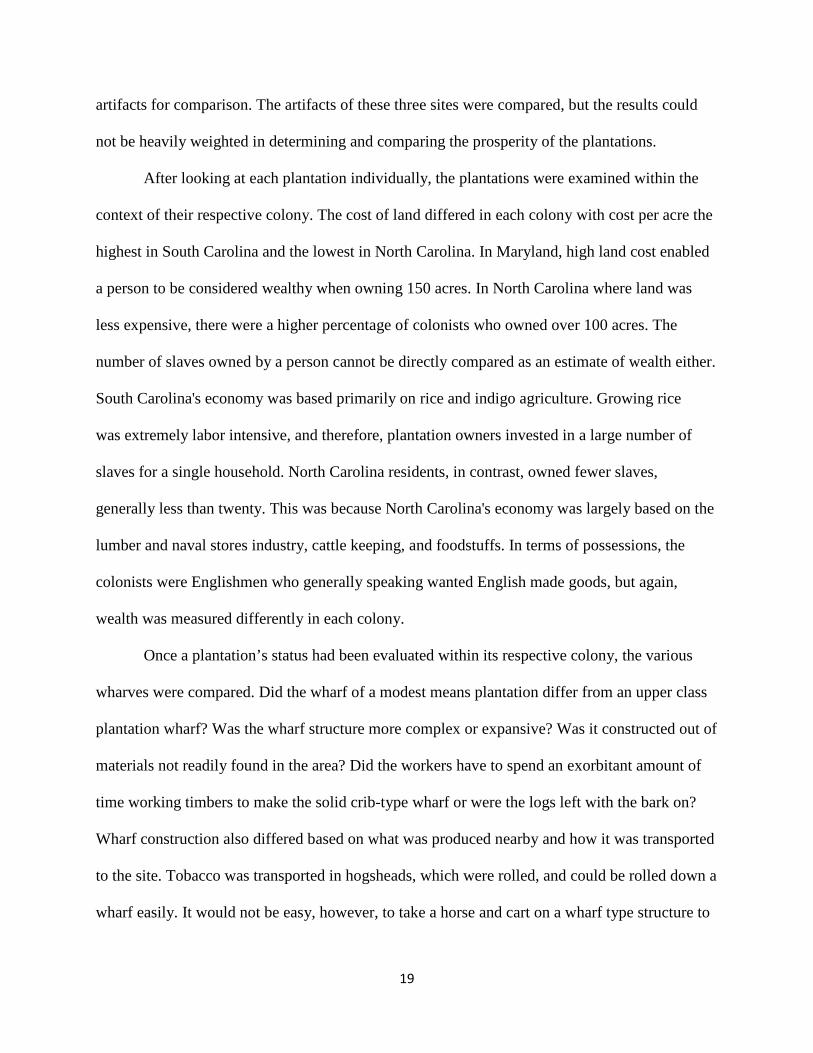
FIGURE 3.2. A 1670 IMAGE OF SLAVES WORKING IN TOBACCO SHEDS ON A VIRGINIA PLANTATION……………………………………………………………………...73

FIGURE 3.3. AFRICAN-AMERICAN SLAVES UNLOADING RICE BARGES IN SOUTH CAROLINA CA. 1800…………………………………………………………………………..76
FIGURE 3.4. STAGES OF INDIGO PROCESSING IN SOUTH CAROLINA IN THE EIGHTEENTH CENTURY……………………………………………………………………...77
FIGURE 3.5. PITCH AND TAR EXPORTED FROM AMERICA TO GREAT BRITAIN COMPARING NEW ENGLAND, THE UPPER SOUTH, AND THE LOWER SOUTH……...80
FIGURE 3.6. TURPENTINE EXPORTED FROM AMERICA TO GREAT BRITAIN COMPARING NEW ENGLAND, THE UPPER SOUTH, AND THE LOWER SOUTH……...80
FIGURE 3.7. SLAVES WORKING THE FIELDS …………………...………………………..83
FIGURE 3.8. SLAVE POPULATION AS A PERCENTAGE OF TOTAL POPULATION OF THE TOTAL COLONY IN 1750………………………………………………………………..85
FIGURE 4.1. A PAGE FROM THE LOGBOOK OF THE JOANNAH, 1767-1768…………....96
FIGURE 4.2. NORTH CAROLINA PORTS AND THE REGIONS THEY SERVICE………..97
FIGURE 4.3. COOPERS AT WORK CREATING BARRELS……………………………….100
FIGURE 4.4. 1918 MAP OF THE CASHIE AND ROANOKE RIVERS CONVERGENCE WITH THE ALBEMARLE SOUNG…………………………………………………………..105
FIGURE 5.1. CONJECTURAL DRAWING OF THE DOUGLAS WHARF, NEW LONDON, CONNECTICUT, AS AN EXAMPLE OF A COBB-TYPE WHARF………………………...113
FIGURE 5.2. SOLID CRIB-TYPE WHARF…………………………………………………..114
FIGURE 5.3. TIMBER AND STONE WHARF……………………………………………….114
FIGURE 5.4. STONE WHARF CONSTRUCTION…………………………………………...115
FIGURE 5.5. BOWLING FARM SITE PLAN………………………………………………...119 FIGURE 5.6. INTERIOR PROFILE OF WHARF CRIBBING, BOWLING FARM SITE…...120 FIGURE 5.7. BOWLING FARM VESSEL SITE PLAN……………………………………...121 FIGURE 5.8. BOWLING FARM VESSEL CROSS-SECTION………………………………123 FIGURE 5.9. ETCHED CLEAR GLASS FROM BOWLING FARM SITE ARTIFACT ASSEMBLAGE………………………………………………………………………………...126 FIGURE 5.10. GUNFLINTS FOUND AT THE BOWLING FARM SITE…………………...127

FIGURE 5.11. MULBERRY LANDING WHARF ARCHAEOLOGICAL PLAN…………...132 FIGURE 5.12. BIRD’S EYE VIEW OF SHIRLEY PLANTATION WHARF STRUCTURE..143 FIGURE 5.13. REDBANKS LANDING SITE PLAN………………………………………...152 FIGURE 5.15. MEPKIN ABBEY DOCK SITE PLAN………………………………………..156 FIGURE 5.16. MEPKIN ABBEY DOCK ARTIFACT SCATTER…………………………...156 FIGURE 5.17. CEDAR GROVE PLANTATION CAUSEWAY……………………………...160 FIGURE 6.1. PERCENTAGE OF AVERAGE ANNUAL COMMODITY EXPORTS OF THE SOUTHERN COLONIES 1768-1772………………………………………………………….172 FIGURE 6.2. PERCENTAGE OF TOTAL LAND AND SLAVE WEALTH FOR THE SOUTHERN COLONIES, 1774……………………………………………………………….173 FIGURE 6.3. LAND WEALTH AND SLAVE WEALTH AS A PERCENTAGE OF TOTAL PHYSICAL WEALTH PER PLANTATION………………………………………………….177 FIGURE 6.4. TOTAL LAND AND SLAVE WEALTH COMPARED TO TOTAL PHYSICAL WEALTH……………………………………………………………………………………….177 FIGURE 6.5. SHIRLEY PLANTATION WHARF COMPLEX SEEN AT LOW TIDE……...179
FIGURE 6.10. PERCENTAGE OF CERAMIC TYPES FOUND WITH ‘N’ EQUALING THE TOTAL NUMBER OF CERAMICS…………………………………………………………...182

LIST OF TABLES
TABLE 2.1. ARCHAEOLOGY METHODOLOGY COMPARISON ANALYSIS……………23 TABLE 3.1. RISE AND DECLINE OF THE IMPORTANCE OF TOBACCO AND RICE AS AMERICAN COLONIAL EXPORT COMMODITIES………………………………………...74 TABLE 3.2. AVERAGE ANNUAL EXPORTS OF BRITISH NORTH AMERICAN SOUTHERN COLONIES 1768-1772…………………………………………………………...81 TABLE 4.1. CARGO COLLECTED BY THE BRIGANTINE JOANNAH ON THE CASHIE RIVER……………………………………………………………………………………………97 TABLE 4.2. EXPORTS OF NAVAL STORES FOR NORTH CAROLINA…………………...99 TABLE 4.3. LENGTH OF THE JOANNAH’S PORT STAYS………………………………...108 TABLE 4.4. LENGTH OF THE JOANNAH’S SEA VOYAGES……………………………...109 TABLE 6.1. 1774 RURAL LAND PRICE PER ACRE FOR 500+ ACRE PLOTS BY PROVIDENCE IN POUNDS, SHILLINGS, AND PENCE STERLING.……………………..168 TABLE 6.2. SLAVE WEALTH AS A PERCENTAGE OF TOTAL WEALTH IN SOUTH CAROLINA, 1722-1767………………………………………………………………………..169 TABLE 6.3. 1774 SLAVE VALUE IN POUNDS STERLING BY COLONY……………….171
TABLE 6.4. AVERAGE ANNUAL COMMODITY EXPORTS OF THE SOUTHERN NORTH AMERICAN COLONIES 1768-1772 IN POUNDS STERLING……………………………...171 TABLE 6.5. AVERAGE LAND AND SLAVE PHYSICAL WEALTH IN POUNDS STERLING PER WEALTHHOLDER BY COLONY IN 1774……………………………….172 TABLE 6.6. SOUTHERN PLANTATIONS TOTAL LAND AND SLAVE WEALTH ESTIMATES WITH WORTH REPRESENTED IN POUNDS STERLING………………….174
TABLE 6.7. VALUE OF LAND AND SLAVES USING AVERAGE OF ALL SOUTHERN LAND AND SLAVE VALUES IN POUNDS STERLING FOR SLAVE AND ACRE……...175 TABLE 6.8. TOTAL ACRE WORTH AND TOTAL SLAVE WORTH AS PERCENTAGES OF INDIVIDUAL PLANTATION TOTAL LAND AND SLAVE WORTH USING REAL VALUES AND AVERAGED SOUTHERN VALUES………………………………………..176 TABLE 6.9. WHARF CONSTRUCTION COMPARISON BY TYPE, LENGTH, AND WIDTH…………………………………………………………………………………………178

INTRODUCTION
Water transportation enabled commercial and agricultural industries to develop in the
immense river systems of the colonial South where it provided the conduit for early development
and prosperity. From the initial explorations and settlements of the sounds, bays, and estuaries, to
the construction of a network of roads leading to creeks, streams, rivers, and sounds, water was
the primary means of transportation. Waterfront landings and features, such as wharves,
represent interface archaeological sites that symbolize the connection between colonial outposts,
rural plantations, villages, trading sites, and manufacturing facilities and the British Atlantic
trade network. It is, as yet, unclear in the archaeological record just what Bowling Farm site
represents. Preliminary analysis suggests this is a multi-component occupation exhibiting a
combination of traits from several of the aforementioned possibilities. This thesis, however, will
concentrate on the plantation part of the use hypothesis because historical documentation shows
that Bowling Farm site was definitively a plantation in 1719.
This thesis investigates wharf sites in the North American Southeast as essential facilities
for mercantilism as well, and explores the possibility of correlating the complexity of landing
construction and the composition of the artifact assemblage with the particular plantation’s
economic prosperity. Combining the analysis of the archaeological remains of five colonial
plantation landings with surviving historical documentation demonstrates that the boat landing
was the central connection between the rural plantation and the colonial Atlantic economy.
Archaeological investigations at the Bowling Farm Site, 001CSR, Bertie County, North
Carolina, presented the opportunity to analyze a plantation wharf where there was a lack of
historical records to provide details about function and construction. The multi-component site
with plantation use dating to the eighteenth century consists of a single-cell, cob-style landing

2
structure, a partial ship skeleton used to extend the landing, and various artifacts spanning a
period from prehistory to 1800. This site is adjacent to elevated land surrounded by low-lying
swamp. Students participating in the East Carolina University (ECU) Program in Maritime
Studies Fall 2009 Field Semester documented the site conducting a Phase I terrestrial survey of
the high land adjacent to the landing and shipwreck, a Phase II survey of the landing and wreck,
and a bathymetric survey of the river. Artifact analysis indicated that the site’s use pre-dates the
1800s. The shipwreck itself is the most intriguing find since there are no excavated ship’s cribs
in the archaeological record associated with a colonial plantation.
Rather than performing a processual, single site oriented analysis, this thesis incorporates
Bowling Farm Site into a broader post processual, comparative analysis of other southern
colonial plantation wharf sites located in Maryland, Virginia, North Carolina, and South
Carolina. Unfortunately, Georgia does not have any known documented plantation wharves from
this period. The comparative wharves include Mulberry Landing Wharf, Wicomico County,
Maryland; Shirley Plantation Dock complex, Charles City County, Virginia; Bowling Farm Site,
Bertie County, North Carolina; Red Banks Landing, Pitt County, North Carolina; Mepkin Abbey
Dock, Berkeley County, South Carolina; and Cedar Grove Landing, Dorchester County, South
Carolina. Middleburg Plantation, Berkeley County, South Carolina is included in archaeological
analysis because of archaeological methodology used to survey the Cooper River and adjacent
land for the location of its landing site. The survey did not result in the finding of the landing,
hence its omittance from the site comparative analysis. Historical documentation, such as deeds,
wills, probate records, and tax lists, have been analyzed for comparative indicators of wealth and
prosperity focusing on acres of land and number of slaves owned. While the types and quality of
household goods, business ventures external of daily plantation activities, and prominence within

3
the individual’s colony are important indicators as well, not all of the sites have enough useful
information. For example, no documentation has survived pertaining to the Bowling Farm Site
during the colonial period except deeds, one land owner’s will, and a few tax lists. The
information those documents provide does not compare to the quantity and quality of
information available for Pemberton Hall Plantation, Shirley Plantation, and Mepkin Plantation.
Taken into account is the difference in each colony’s economy; consequently, simple across-the-
board comparisons of land and slaves are not possible. Instead, each plantation is first placed
within that colony’s economic hierarchy of upper, middle, and lower class before a comparison
concerning wharf construction methodology can be attempted.
This thesis combines the theoretical perspectives involving central place theory, cultural
landscape theory, maritime cultural landscape theory, and waterscape archaeology theory. While
no single theory can create an absolute understanding of the past, a theoretical combination may
result in a more thorough interpretation. The theoretical framework emulates the research of
Kathy Ann Welliver Southerly (2006) and James Errante (1993). Southerly combined the use of
central place theory, maritime cultural landscape theory, and cultural landscape theory in her
study of “Redbanks Landing on the Tar River, Greenville, North Carolina.” Southerly (2006:26)
argued that “favorable environmental conditions influence the placement of infrastructure sites
[such as landings] and are central to the development of a community.” Errante (1993), in his
thesis “Waterscape Archaeology: A Survey for 18th-century Boat Landings at Middleburg
Plantation, Berkeley County, South Carolina,” sought to create a research design for
incorporating waterscape archaeology into the overall historical and archaeological analysis of
South Carolina plantations. He suggested that the maritime environment and associated
underwater features were a critical and neglected extension of the terrestrial landscape. Errante

4
argued for the inclusion of the underwater archaeology for waterfront sites such as Middleburg
Plantation where the manor house is located within viewing distance of the landing.
Utilizing Southerly and Errante’s insights, this thesis argues that colonial plantation sites
possessing a landing should include both terrestrial and underwater archaeology. Landings
connect the terrestrial and maritime landscapes, whether or not the manor or outbuildings are
located within the vicinity of the landing. This thesis extensively analyzes available historical
records relating to the southern plantation economy in colonial Atlantic trade in order to
understand the purpose for colonists building and maintaining plantation landings.
This thesis advocates for the combination of terrestrial and underwater investigations into
a single archaeological study, and addresses a range of theoretical and methodological questions:
How significant is terrestrial archaeology to understanding the site formation processes of a
wharf site? Are archaeologists missing most interface sites through gaps in survey techniques in
both underwater and terrestrial archaeology? What archaeological methodologies prove
beneficial to studying land-water interface sites? Another objective is to assess the
methodological procedures the archaeologists used when documenting colonial wharves.
Comparing methodologies provides a clearer view of how important combined terrestrial and
underwater methodologies are to understanding site formation processes. While unified
archaeological methodology steers the cultural remains side of the study, historical function
questions create a basis for the necessity of developing research designs that incorporate a
thorough archival documentation of associated wharf sites.
This thesis is broken up into six chapters. Chapter 1 provides the research methodology
established for comparing wharf construction to economic prosperity and the comparative study
of archaeological methodology of interface sites such as wharves. Chapter 2 describes and

5
analyzes archaeological methodologies used to document each wharf structure. This chapter
evaluates the differences in each documented site’s archaeological methodologies and purpose
for the archaeologist’s undertakings. Chapter 3 focuses on the historical context of the wharves
by analyzing the role of the southern colonies in British mercantilism. This chapter concentrates
on the colonies of Maryland, Virginia, North Carolina, and South Carolina because these are the
localities that contain archaeologically documented plantation wharves. Chapter 4 focuses on the
brig Joannah as a case study of a mercantile vessel participating in coastal and transatlantic
trade, including trade at plantation wharves on the Cashie River near the Bowling Farm Site.
Chapter 5 presents the individual site history and construction methods of each of the six wharf
case studies. Chapter 6 compares each wharf based on specific attributes of the associated
plantation and the construction of the wharf itself. Finally, there are conclusions and
recommendations for further research.

CHAPTER 1
RESEARCH METHODOLOGY
Introduction
The primary objective of the historical research and fieldwork research design was to
discern the age, function, construction, and significance of colonial plantation wharves and
assess the principal investigator’s archaeological methodology. Research objectives focused on
providing the historical context for each of the six studied sites in the British colonial maritime
and economic world and the added Middleburg Plantation for the methodology comparison.
Historical Research
Historical research was essential to gaining a full understanding of colonial British
mercantilism and the historical context of each individual wharf site. Special attention was given
to the Bowling Farm Site, because there was no previously published work relating to its specific
history.
Primary Sources
The Bertie County Courthouse holds a number of vital historical sources such as property
deeds that trace property ownership to the landowners who may have constructed and used the
landing on the Bowling Farm Site. Finding the property owners aided in the search of the
property’s economic activity that in turn necessitated the landing. Other records include the
record of wills, record of estate, and tax lists found in the North Carolina Collection at East
Carolina University’s (ECU) Joyner Library. Wills, estate records, and tax lists at times provide
information about land use. The North Carolina Collection also contains County Court Records

7
transcribed by Wynette Parks Haun (1976-1979). Additionally, the County Court of Pleas and
Quarter Sessions Minutes (1724-1743, 1758-1868) contain information about commercial
taxation and infrastructure development.
The North Carolina State Archives in Raleigh maintains the largest collection of
historical sources pertaining to the mercantile history of the Albemarle Sound and Bertie County.
Within this archive, the Charles E. Johnson Collection and the Treasurer’s and Compeller’s
Office Records contain the surviving records for Port Roanoke. This port, located in Edenton,
was the check point for vessels entering and exiting the Albemarle Sound during the 1700s and
later. While the records are incomplete before 1750, they contain pertinent information such as
vessel name, type, year of launching, locale of construction, owner, master, and cargo. These
records are invaluable sources for the study of Bertie County’s maritime cultural landscape and
provide information about ships, people, and the frequency and types of commerce. The archive
also maintains various Edenton merchant papers dating sporadically through the 1700s.
Merchants represented in the archive include George Blair, 1771-1772; James Hurst and Anna
Fortescue, 1726-1769; and Webb, Bryer, and Company, 1781-1786. While all these merchants
were centered in Edenton, their documentation contains information on Bertie County trade
because the port city remained the commercial center for the colonial Albemarle community
even after Bertie County gained Windsor, its own maritime port, in 1768 (Crittenden 1936:72).
The most revealing source concerning maritime trade on the Cashie River and the role
plantation landings played comes from the Duke University Rare Book, Manuscript, and Special
Collections Library in the form of the “Journal of the Brig Joannah, 1767-1768.”Joannah sailed
up the Cashie River in 1768.The vessel stopped first at Edenton before venturing up the Cashie
River to various landings seeking cargo. While this logbook only presents one instance of

8
commerce on the river, it does provide an understanding of the river’s sailing qualities, typical
cargo, and major plantation landings during the period. This source is also significant as it is the
only surviving logbook of a colonial vessel sailing up the Cashie River for economic purposes.
The logbook demonstrates that merchants conducted business with individual plantations, not
simply at major port cities. This document may reveal as much by what is does not say as for
what it does say, possibly revealing terminus post quem for the Bowling Farm Landing is not
mentioned in 1768. As large and important as this landing has been revealed to be in the
archaeological record, it seems odd the captain of the Joannah does not make mention of it. It is,
therefore, a possibility that the wharf was no longer in service, or the primary wharf for the
plantation, by the third quarter of the 18th century (Bradley A. Rodgers, pers. comm.
02/18/2012).
The University of North Carolina at Chapel Hill houses the Southern Historical
Collection, which contains a number of papers from colonial residents residing along the Cashie
River. Three important collections are the Gray Family Papers, the Jonathan Jacocks Papers, and
the Stark Armistead Papers. The Armistead collection was especially useful, because the
Armistead family owned the property that is now the Bowling Farm Site during colonial times.
The collection did not contain many documents dating to the colonial period as most dated post
1820, but it still provided some useful material such as deeds and letters that described life in
Bertie County. These collections consist of letters, deeds, indentures, plats, and legal papers
directly relating to the Bowling Farm Site and other prominent families living along the Cashie
River. The papers provided clues as to the origin and use of the property and the Bowling Farm
Site wharf where ECU conducted archaeological investigations in 2009.

9
The Library of Virginia contained several useful primary documents relating to Shirley
Plantation. An abstract of “Lists of Captains and ships for six ports in Virginia, 1698-1707,”
provides information relating to vessels and cargo that traded in the Upper James River District.
Edward Hill II acted as customs collector for this district in 1699-1700. Another valuable source
located at the Library of Virginia is “Virginia Naval Officers- James River District: Manifest
Book, 1773-1775.” The manifest contains names, marks, and quantities of cargo shipped by
individuals. Charles Carter Esq., owner of Shirley Plantation from 1771-1806, is among the
names listed. The surviving “Charles City County Land Tax Books” for Shirley Plantation
during 1782-1830 provided acreage and land values during his period.
The South Carolina Department of Archives and History contains the Inventory of Walter
Izard, 3 January 1750. This probate record provides detailed information regarding Cedar Grove
Plantation during the first half of the eighteenth century, including the number of slaves,
household goods, and farm equipment. Also relating to South Carolina plantation history and the
history and use of Mepkin Abbey Dock are The Papers of Henry Laurens, Vols. 1-16 (Homer et
al. 1968-2002). Henry Laurens was a wealthy South Carolinian planter and politician. His papers
contain personal and professional correspondences, advertisements, and military and political
records. The records relating to plantation activities and signs of his wealth and prosperity were
invaluable to the study of plantation wharves.
The 1790 census is the only source providing information for each of the plantations
discussed for the same year. While the 1790 census is in the post-colonial period, it provides the
number of slaves owned by each head of house for that year and is useful because not all tax lists
for each of the relevant counties have survived.
10
Secondary Sources
Major published works on colonial North America’s involvement in Atlantic trade
include James F. Shepherd and Gary M. Walton’s (1972) Shipping, Maritime Trade, and the
Economic Development of Colonial North America and John J. McCusker and Russell R.
Menard’s (1985) The Economy of British America, 1607-1789. Shepherd and Walton argued that
the development of overseas markets was vital to the growth of the colonial North American
economy, while reduced risk from cargo loss during the eighteenth century allowed for larger
cargo movement and the subsequent expansion in market size. McCrusker and Menard suggested
that the export-based colonial economy created a rapidly growing market that was relatively
strong throughout the American colonies.
Trevor Burnard’s (2002) Creole Gentlemen: The Maryland Elite, 1691-1776 analyzed
colonial Maryland’s privileged society. Burnard examined colonial probate records from four
Maryland counties on individuals with a net wealth over £650 to determine what constituted the
elite society. Burnard emphasized that while wealth was a major indicator of status, it was not
the only determining factor. James Horn’s (1994) Adapting to a New World: English Society in
Seventeenth-Century Chesapeake and Arthur Pierce Middleton’s (1953) Tobacco Coast: A
Maritime History of Chesapeake Bay in the Colonial Era discussed society and the economy of
the Chesapeake Bay colonies, Maryland and Virginia. Horn focused his work on the
transplantation of English customs to the Chesapeake area. He argued that the English settlers in
the Chesapeake region accepted the traditional English gentry rule as necessary to social order
and, therefore, culture exerted more influence on society than the environmental influences they
encountered. Middleton emphasized maritime commercial activities in the Chesapeake areas of
Maryland and Virginia underscoring the significance of the tobacco and slave trade to this

11
region. He argued that these endeavors promoted the plantation system stressing the importance
of large estates, tobacco, slavery, and dependence on England for manufactured goods.
North Carolina studies have focused on the impact of various ports to their associated
regions. Major studies on this topic include Charles C. Crittenden’s (1936) The Commerce of
North Carolina 1763-1786, Harry Roy Merrens’ (1964) Colonial North Carolina in the
Eighteenth Century: A Study in Historical Geography, and A. Roger Ekirch’s (1981) “Poor
Carolina”: Politics and Society in Colonial North Carolina. While the texts were published a
number of years ago, they remain quintessential in today’s literature. Crittenden argued that
while North Carolina’s coastal geography may have made navigation difficult, it did not hinder
the development of colonial trade. He further argued that North Carolina was a unique southern
colony in that it produced for export a wide variety of goods such as naval stores and provisions,
while other southern colonies generally exported only one primary product. Merrens focused on
the varied North Carolina geography and how it affected population growth and town
development. He postulated that North Carolina’s geography contributed to its unusual
settlement pattern, with colonization occurring from north to south not originating in the east and
moving west. Ekrich analyzed colonial North Carolina’s social and political development
resulting from the colony’s harsh economy. He argued that while North Carolina was politically
unstable and the poorest of the southern colonies, the vast quantities of land available for
purchase made the colony ideal to the poor man.
South Carolina’s economic, commercial, and social history in the colonial period is best
described in Jack P. Green’s (2001) Money, Trade, and Power: The Evolution of Colonial South
Carolina’s Plantation Society. Green’s text is a collection of essays with the purpose of
examining society in colonial South Carolina. The essays emphasize how the colonists of this

12
region adapted English customs to suit their needs in the New World with a focus on social and
economic development, slave society, and settlement patterns. Peter A. Coclanis’ (1989) The
Shadow of a Dream: Economic Life and Death in the South Carolina Lowcountry: 1670-1920
“explains the economic rise and fall of one small, but intriguing part of the American South” (i).
The text is an analysis of South Carolina’s economic rise and decline, focusing on the eastern
geographic region. Coclanis argued that South Carolina’s economic failure resulted from the
decline of the old product markets that gave South Carolina its wealth in the colonial and
antebellum eras and its inability to adjust to new markets.
Previous Research
Several theses contributed to the formulation of the research questions selected for the
study of the Bowling Farm Site. Andrea J. Heintzelman’s (1985) M.A. thesis, “Late Seventeenth
and Eighteenth Century Wharf Technology: Historical and Archaeological Investigations of
Three Eastern U.S. Examples,” remains the primary study of colonial wharf construction. She
sought to determine how the environment, economy, and social factors contributed to various
wharf designs, arguing that an increase in commercial activity near a location of good anchorage
directly correlated with the port’s growth and prosperity.
Kellie Michelle VanHorn’s (2004) M.A. thesis, “Eighteenth-Century Colonial American
Merchant Ship Construction” studied eighteenth-century merchant ship construction based on
archaeological and historical evidence. The author focused on factors that influenced ship
construction methods, construction trends, the divergence between British- and colonial
American-built vessels, and questioned if contemporary literary sources support archaeological
evidence. While all this research is relevant, there is no concise study of the influence mercantile
trade exerted on the colonists of the Cashie River, nor has a study been performed on the use of

13
ships as wharf cribbing. Archaeological investigations of vessel cribs such as the Ronson Ship
(Manhattan, New York) and McCraken’s Cove (Sturgeon Bay, Wisconsin) merely document
their existence. The historical and archaeological study of Alexandria, Virginia’s waterfront,
acknowledged their existence through historical research of that area, but did not attempt to place
the site in a wider analysis (Reiss and Smith 2006; Rodgers et. al. 2006; Shepherd 2006).
In the absence of other archaeological studies of wharf sites on the Cashie River or
Albemarle region, this thesis analyzes and compares the wharf construction and fill of the
Bowling Farm Site to similar investigations of archaeological sites in the southeastern United
States. Literature containing information about wharf studies includes articles available in
professional journals such as Historical Archaeology and International Journal of Nautical
Archaeology. These archaeological publications, along with master’s theses and doctoral
dissertations, were consulted for possible comparison sites.
According to North Carolina archaeological records, the Bowling Farm Site and
Redbanks Landing were the only two colonial plantation landing sites excavated in North
Carolina. Therefore, it is imperative to understanding plantation wharf construction and use to go
beyond North Carolina to other wharves excavated in the southern states. Three southern
plantation landings have been documented: Cedar Grove Landing, Mepkin Abbey Dock, and
Mulberry Landing. David Beard (1990, 1997) excavated the Cedar Grove Plantation landing
(38DR155) on the Ashley River in South Carolina. He categorized the landing as general-
purpose use rather than used for a single purpose such as a brick or lime transport point.
Avocational divers recorded Mepkin Abbey Dock (38BK48) as part of the Cooper River Survey
in South Carolina. Mepkin Abbey Dock originally supported Mepkin Plantation, owned by
Henry Laurens beginning in 1762. The Cooper River Survey’s purpose was to promote diver

14
education and to identify underwater cultural resources (Harris, Moss, Naylor 1993:i). Susan
Langley (2000) studied the construction of Mulberry Landing wharf at Pemberton Hall,
Maryland. Located at the mouth of Bell Creek on Wicomico River, dendrochronology has dated
this particular wharf to 1741-1747.
The investigation of Shirley Plantation’s wharf complex in Charles City, Virginia, does
not yet possess an archaeology report, but its current findings will be discussed in this thesis.
Shirley Plantation’s history has been extensively researched and published. Most historical data
will be derived from a report of archival research by Martha W. McCartney titled, (1997) “The
History of Shirley Plantation Charles City County, Virginia.” McCartney provided a detailed
analysis of the history of Shirley Plantation using historical documents found in the United States
and Great Britain.
Many wealth studies, both expansive and micro, have been conducted on the American
colonies and early America including James G. Gibb (1996) The Archaeology of Wealth:
Consumer Behavior in English America; Lee Soltow (1989) Distribution of Wealth and Income
in the United States in 1798; Michael J. O’Brien and Teresita Majewski (1989) “Wealth and
Status in the Upper South Socioeconomic System of Northeastern Missouri”; Richard
Waterhouse (1988) “Economic Growth and Changing Patterns of Wealth Distribution in
Colonial Lowcountry South Carolina”; Alice Hanson Jones (1980) Wealth of a Nation to Be: The
American Colonies on the Eve of the Revolution; Gloria T. Main (1977) “Inequality in Early
America: The Evidence from Probate Records”; Russell Menard, P.M.G. Harris, and Lois Green
Carr (1974) “Opportunity and Inequality: The Distribution of Wealth on the Lower Western Sore
of Maryland, 1638-1705”; Bruce C. Daniels (1973) “Long Range Trends in Wealth Distribution
in Eighteenth Century New England”; James T. Lemon and Gary B. Nash (1968) “The

15
Distribution of Wealth in Eighteenth-Century America: A Century of Change in Chester County,
Pennsylvania, 1693-1802”; and James Henretta (1965) “Economic Development and Social
Structure in Colonial Boston” to name a few. The most significant of those mentioned above was
Alice Hanson Jones’ expansive wealth distribution study of colonial America.
Jones’ (1980) study focused on wealth and its distribution among people in the American
thirteen colonies in 1774 and based on an unbiased sample of 919 probate inventories: 318 from
New England, 217 from the Middle Colonies, and 298 from the South. She sought to measure
the economic performance of the colonies by calculating per capita, distribution, and the
composition of wealth owned by freeholders in the colonial era and comparing the findings to
later estimates of per capita wealth and gross national product. Information provided in the study
include real and personal estate owned including land, slaves, buildings, crops, and animals, with
distinctions made between producer and consumer goods, durable and perishable inventories.
Jones used this information to infer potential growth and suggest how colonists invested their
income. The study concluded that colonists in 1774 had attained substantial wealth that
compared to “ordinary people” of Great Britain and Europe, and possibly not far behind the
wealth of the lords and barons. The level of living for the white freeholders, according to Jones,
was substantial enough for a comfortable life even for the “poor” (Jones 1980:340-341). Jones
(1977) presented more details of study in three supplementary volumes titles American Colonial
Wealth, Documents and Methods. The supplementary volumes provided transcriptions of
inventories, the regression procedures used to estimate land values, and the characteristics of
each estate in pounds sterling.

16
Problems in Historical Research
Numerous problems arise in every researcher’s journey through history. Material
becomes illegible from ink fading, unfamiliar penmanship, and torn or burnt pages. The biggest
culprit is, and always will be, document survival. Even the most meticulously recorded
documents where multiple copies were made and stored for safe keeping, such as deeds and tax
records, disappear.
Following Bowling Farm’s property chain of title proved difficult, because the clerk and
master of Bertie County as well as former property owners lost deeds and copies of deeds. The
consecutive deed of sale stopped in 1871 with the death and attempted sale of William
Mooring’s property (including what is now Bowling Farm), because of the loss of Bertie
County’s copy and the owner’s original deed (Bertie County Deed Book OO:475). While the
county drafted a new deed to replace the missing one, pertinent information such as the previous
landowner and original date of sale were unclear. It also appeared that William Mooring
accumulated a vast amount of adjoining land, adding significant acreage to the original 750 acre
tract (Bertie County Deed Book XX:415). One hundred and fifty years earlier, the same instance
occurred when William Armistead began accumulating tracts of land ranging from 20 to 300
acres resulting in the 750-acre plantation (Bertie County Deed Book I:451; K 458; L:199; Bertie
County Land Entries 1783-1784:71, 74). Before Armistead, only two land owners could be
traced, although never to the original land grant. Property boundary descriptions also relied on
natural features such as trees and springs that no long existed on Armistead’s land; therefore, it
was impossible to identify the exact location of the Bowling Farm Site on Armistead’s land
preventing further deed research (Bertie County Deed Book Y:330-331).

17
Few family documents have survived dating from the colonial era. Prominent families on
the Cashie River such as the Jacocks, Armistead, and Gray left some records now accessible in
university archives (Stark Armistead Papers 1716-1832; Gray Family Papers, 1722-1879;
Jonathan Jacocks Papers, 1732-1908). Unfortunately, the surviving materials provide little
information relating to the use of their plantations and corresponding finances. Another research
shortcoming is the paucity of logbooks from the thousands of vessels that entered Port Roanoke
during the colonial era and perhaps sailed up the Cashie River. Only one has been found, but it is
rich in detail and applies directly to the river’s commerce in 1768.
Archaeological Survey Methods Comparison
The second portion of the thesis explains the significance of incorporating the survey and
documentation of underwater cultural resources associated with a given plantation into the
overall research design of the site, because the waterways were the main sources of
transportation, thereby signifying the importance of wharves to the sustainability and growth of a
plantation's wealth (shown by the time, effort, and capital put into construction and sustainment
of a wharf). This portion of the thesis breaks down the various survey and recording techniques,
analyzes their use, advantages and disadvantages, and presents the findings so that a variety of
sound methodologies are available to archaeologists for future plantation wharf documentation.
The plantation wharf by virtue of its construction and use will always be found along the
river banks and in the tidal zone. This poses a problem for widely-used technological survey
methods such as side scan sonar, magnetometer, and sub-bottom profiler that do not perform
well in shallow water because of sound scatter projected back by sand and rock that line shores.
With this in mind, the archaeological methodologies of the six sites analyzed in the wharf
comparison section will be viewed to create a data set outlining the archaeological research

18
objectives including how the site was discovered, what survey methods were used during the
documentation process, the results of the survey/documentation, and any problems encountered
with the chosen methodology.
Wharf Comparison Methodology
The documented colonial plantation wharves have been analyzed and compared with the
wealth of the plantation/owner. The framework for the data analysis intended to include acreage
of land owned for the specific plantation’s wharf, the number of slaves, political offices held,
careers outside of farming (merchant/trader, lawyer, tavern owner, etc.), and possessions
(including but not limited to vessels, boats, furniture, wares, farm equipment, cattle,
and carpentry equipment) as presented in Jones’ (1980) study. Each of the comparable landing
sites has at least some surviving information in each category; however, unlike Jones’, plantation
wharf sites that have been documented do not all have the necessary surviving information for
such a detailed study. Only Shirley Plantation and Cedar Grove Plantation have surviving
probate records for one of their colonial owners. Some information regarding possessions has
survived in wills. The wills of each owner, however, are not specific enough to give an adequate
estimate of non-human physical wealth, nor do the wills date to the same year. Instead, wealth
will be calculated based solely on ownership of land and slaves similar to Michael J. O’Brien
and Teresita Majewski (1989) study “Wealth and Status in the Upper South Socioeconomic
System of North Eastern Missouri.” O’Brien and Majewski sought to reconstruct consumer
profiles for households in Northeastern Missouri and link differences in found archaeological
materials to economic positions. While this wharf study also sought to emulate O’Brien and
Majewski in comparing archaeological artifacts found at the wharf sites, only three sites, Shirley
Plantation, the Bowling Farm Site, and Red Banks Landing, harbored any substantial amount of
19
artifacts for comparison. The artifacts of these three sites were compared, but the results could
not be heavily weighted in determining and comparing the prosperity of the plantations.
After looking at each plantation individually, the plantations were examined within the
context of their respective colony. The cost of land differed in each colony with cost per acre the
highest in South Carolina and the lowest in North Carolina. In Maryland, high land cost enabled
a person to be considered wealthy when owning 150 acres. In North Carolina where land was
less expensive, there were a higher percentage of colonists who owned over 100 acres. The
number of slaves owned by a person cannot be directly compared as an estimate of wealth either.
South Carolina's economy was based primarily on rice and indigo agriculture. Growing rice
was extremely labor intensive, and therefore, plantation owners invested in a large number of
slaves for a single household. North Carolina residents, in contrast, owned fewer slaves,
generally less than twenty. This was because North Carolina's economy was largely based on the
lumber and naval stores industry, cattle keeping, and foodstuffs. In terms of possessions, the
colonists were Englishmen who generally speaking wanted English made goods, but again,
wealth was measured differently in each colony.
Once a plantation’s status had been evaluated within its respective colony, the various
wharves were compared. Did the wharf of a modest means plantation differ from an upper class
plantation wharf? Was the wharf structure more complex or expansive? Was it constructed out of
materials not readily found in the area? Did the workers have to spend an exorbitant amount of
time working timbers to make the solid crib-type wharf or were the logs left with the bark on?
Wharf construction also differed based on what was produced nearby and how it was transported
to the site. Tobacco was transported in hogsheads, which were rolled, and could be rolled down a
wharf easily. It would not be easy, however, to take a horse and cart on a wharf type structure to

20
unload staves. In the case of animal assist loading and unloading, large cobb/crib type wharves
were most beneficial, because a horse and cart needed to be turned around. River depth was
another consideration. A river with a gentle slope toward shore required a long wharf or wharf to
extend into deep water so that large vessels could approach. A plantation bordering a river where
deep water was close to shore did not require as much infrastructure.
Conclusion
Comparing archaeologically documented plantation landing sites with historical
documentation allowed the author to conduct a comprehensive analysis of six plantation owners’
wealth and social ranking. This historical analysis data set was then compared to the construction
techniques of their respective landings. Chapter two describes the field methodology undertaken
by the archaeologists and volunteer surveyors for the seven plantation wharf sites documented in
the colonial South and assesses the fieldwork methodology used for the documentation of the
associated plantation wharf interface sites. Comparing methodologies provided a clearer view of
the benefits in combining both terrestrial and underwater methodologies in understanding site
formation processes.

CHAPTER 2
ARCHAEOLOGICAL METHODOLOGY COMPARISON
Introduction
The definition of maritime archaeology as the portion of archaeological research that
takes place underwater has expanded, resulting in archaeological research design moving
towards a broader framework (Staniforth and Nash: 2006:69). Maritime archaeology, therefore,
is defined as “[the] study of human interaction with the sea, lakes, and river through the
archaeological study of manifestations of maritime culture, including vessels, shore-side
facilities, cargoes, and even human remains” (Delgado 1997:259). The unification of the land
and sea research in archaeology has resulted in archaeologists focusing on a greater range of
questions, methodological approaches, and sites. The outcome has resulted in more partnerships
between the archaeological sub-disciplines and other sciences, but more specifically historical
archaeology as it overlaps maritime archaeology in both historical interests, artifacts, and data
(Staniforth and Nash 2006:69-70).
James Errante developed the concept of waterscape archaeology in 1989 to address
cultural remains found at the land-sea interface. The interface deals directly with both
underwater and terrestrial components that the colonial plantation wharf and associated cultural
remains represent. Errante proposed that underwater and terrestrial archaeology should be
theoretically and methodologically coordinated for the documentation of interface sites.
Waterscape archaeology advocates the use of both terrestrial and underwater archaeological
methods such as survey, testing, or extensive excavation across both the land and water
components of the site. Errante stressed that it is important that both land and water portions of

22
the site are not separated from each other because of the differences in environment. Although
archaeological techniques may vary, sampling strategies should be consistent and comparable
across the entire archaeological site. Errante further suggested that archaeologists should employ
a continuous grid or baseline in the research design for all phases of work (Errante 1993:3, 5, 10,
85-86).
Compliance projects for new development performed by cultural resource management
(CRM) firms rarely identify the underwater environment as a potential impact zone. Errante
hypothesizes that ignorance of the existence of underwater archaeological sites, or the
assumption that development of land near water will not impact underwater features are reasons
that sites in the foreshore are rarely considered threatened. Yet riverside property development
often includes wharves and erosion control with construction of devices such as rip rap,
bulkheads, or embankments that often directly affect underwater cultural resources (Errante
1993:9).
This chapter describes the field methodology undertaken by the archaeologists and
volunteer surveyors for seven plantation wharf surveys in the South (Table 2.1). The sites listed
below are interface sites consisting of both terrestrial and underwater features and therefore they
require a combination of terrestrial and underwater survey methods. The purpose of this analysis
is to assess the fieldwork methodology used for the documentation of plantation wharf interface
sites. Comparing methodologies provides a clearer view of the benefits in combining both
terrestrial and underwater methodologies in understanding site formation processes.
Mulberry Landing Wharf
No archaeological surveys occurred within the vicinity of the Mulberry Landing Wharf in
the Wicomico River during previous professional and avocational excavations. The wharf is

23
Site Principle Investigator (s) Year Wharf Type Phase Field
Methods Terrestrial
Component Dendrochronology Remote Sensing
Remote Sensing Target Acquired
Mulberry Landing
Head Underwater Archaeologist,
Maryland Historical Trust
1995-1996
Solid crib-type Wharf Phase II Baseline-
offsets Y Y N N
Shirley Plantation
Dock Complex
Senior Geologist; Terrestrial
Archaeologist; Agricultural Specialist
2010-2011 Pilings Pre-
disturbance
GPS, Sedimentation
Coring, Baseline
Y N Y1 UNK
Bowling Farm Site
Professor of Underwater
Archaeology; Assistant
Professor of Underwater Archaeology
2009 Cobb-type
wharf; vessel crib
Phase II Baseline-offsets Y Y Y N
Redbanks Landing
Assistant Professor of Underwater
Archaeology; Professor of
Anthropology
2000 Pilings Phase II Baseline-offsets Y N Y Y
Cedar Grove
Landing
Underwater Archaeologist,
SCIAA 1990 Solid crib-
type wharf Pre-
disturbance Not to Scale Y N N N
Mepkin Dock
Avocational Divers 1992 Cobb-type
wharf Pre-
disturbance Not to Scale N N Y N
Middleburg Landing
Archaeology Graduate Student 1989 UNK Phase I Baseline Y N Y N
TABLE 2.1. Archaeological Methodology Comparison Analysis.
1 Shirley Plantation had not yet conducted a remote sensing survey of the James River adjacent to the wharf complex. The plantation owner has contracted the Virginia Institute for Marine Science to perform side-scan sonar and sub-bottom profile survey in Spring 2011.

24
located in a tidal zone resulting in portions of the site being uncovered during low tide. Instead of
using underwater methodology, the crew worked when the tides were at their lowest, utilizing
lunar phases to extend excavation time. They also used excavated material to create mud dikes
that extended the time that the wharf remained uncovered (Langley 2000:342).
During the periods of inactivity, the investigators covered the excavated portions of the
site with plastic tarps to make the clearing process easier for the next excavation period to ensure
the timbers did not experience a drop in moisture level resulting in subsequent wood shrinkage.
Project managers deemed the usage of a cofferdam to enable archaeologists a continuous field
season impractical and beyond allocated budgets. Instead, archaeologists dug a small pit within
the wharf’s vicinity in the river to drain the site during excavation. No excavations were
performed on land where features were not immediately visible. Volunteers and hobbyists
assisted in the surface survey utilizing both the naked eye and metal detectors to locate
diagnostic artifacts along the creek’s shore and the remnants of the historic wharf roadway
(Langley 2000:342, 347).
Dendrochronology
The wharf structure proved to be an excellent candidate for dendrochronology analysis
because of the presence of bark layer on the frames’ interior and exterior wharf faces. This
signified that the entire diameter of the tree remained intact providing an accurate date range
between 1-2 years. Langley enlisted the help of Jack Heikkenen of Dendrochronology, Inc.,
Blacksburg, Virginia, to perform the analysis. Heikkenen removed fourteen samples: twelve
from the wharf headers and two from the tie-backs (Figure 2.1). The purpose of the analysis was
to determine species, date of initial construction, and differentiate periods of construction
(Langley 2000:347).

25
FIGURE 2.1. Sample locations taken from Mulberry Landing Wharf for dendrochronology
analysis (Langley 2000:340).
Mepkin Abbey Dock (38BK48)
Previous projects in the west branch Cooper River involved salvage operations and a
side-scan sonar survey. In May 1975, the South Carolina Underwater Archaeology Division
issued four salvage licenses for the recovery of artifacts and fossils in the Cooper River. The
license agreement granted the salvor ownership of 75 percent of the recovered material after the
state recorded and analyzed the artifacts. The state could keep up to 25 percent of the artifacts for
its collections. The salvors were required to maintain a daily log of all activities detailing
recovered artifacts and their provenience, sketches and photographs of the environment and
recovery site, and changes in personnel, equipment, and administration (Harris, Moss, Naylor
1993:6).

26
Karen Lindsay of South Carolina Institute of Archaeology & Anthropology (SCIAA)
initially documented 38BK48, a half mile stretch of the Cooper River licensed to Lee Spence for
salvage rights. This section of the river not only included the Mepkin Abbey Dock but also the
Mepkin Abbey Shipwreck. By November 1975, SCIAA revoked all salvage licenses because of
numerous violations to the terms of agreement. Salvors were selective in their recovery,
collecting only artifacts and fossils for commercial marketing. Other violations included the
salvor not presenting all recovered artifacts to the Underwater Division, utilizing destructive
conservation methods, poor artifact labeling, inaccurate and inadequate maps depicting
provenience, and unauthorized personnel changes. The violations led to the formulation of the
South Carolina Underwater Antiquities Act of 1983 declaring that salvors cannot be selective in
their recovery. They must recover all artifacts regardless of their monetary worth or condition
(Harris, Moss, Naylor 1993:7-8).
The second major undertaking involving the location of Cooper River’s cultural
resources was a side scan sonar survey conducted in 1980 by the Underwater Archaeology
Division. Financed by the United States Department of the Interior, Heritage Conservation and
Recreation Service, the survey’s purpose was to “update topographic maps and National Oceanic
and Atmospheric Administration (NOAA) charts; to integrate submerged cultural site data into
SCIAA’s statewide site inventory; to submit information on fossil beds to the South Carolina
Museum Commission” (Harris, Moss, Naylor 1993:8). The survey located fifteen targets in the
Cooper River’s west branch. The targets fell into three categories: cultural remains, log jams, and
geological features. Mepkin Abbey Dock was not among the targets. The survey did, however,
relocate the Mepkin Abbey Shipwreck (T15), reported previously to SCIAA by sport divers
(Harris, Moss, and Naylor 1993:9).

27
In 1992, SCIAA carried out the Cooper River Survey fieldwork one weekend a month
between July and November. Jimmy Moss, an avid diver and amateur historian, played a leading
role in the organization and direction of the fieldwork, with SCIAA staff advising the volunteer
divers on the implementation of field survey, using field notebooks, and establishing an artifact
cataloging system. The survey covered a portion of the Cooper River’s western branch from
Mepkin Abbey to Strawberry Ferry. The investigators then divided the survey area into twelve
sections with only sections 1-9 being completed. Each section represented an area between two
river bends with sections 1-3 encompassing both river banks and section 4-9 covering one side of
the river each. Section 1 (Figure 2.2) contained both the Mepkin Abbey Dock and the Mepkin
Abbey Shipwreck (Harris, Moss, Naylor 1993:24).
FIGURE 2.2. Section 1 of the Cooper River Survey (Harris, Moss, Naylor 1993:27).
Divers conducted swim searches extending the length of the designated section and
swimming between the bank and 20 ft. (6.1 m.) into the channel. When divers encountered an
artifact scatter, shipwreck, or submerged structure, they secured a buoy in the site’s approximate
center and noted its location with three compass bearings. The divers then collected a
representative sample of the artifacts within the area making sure not to collect artifacts requiring

28
conservation such as metal, organics, or composites unless the divers were willing to undertake
the conservation process at their own expense. The divers did not collect artifacts from any
shipwrecks. Volunteers labeled each artifact bag with appropriate provenience information:
diver’s allotted number, buoy number, and dive date. SCIAA instructed the divers to include in
their field notes mud maps depicting buoys in relation to their river section and surrounding
landscape as well as personal observations relating to site composition, diving conditions, and
bottom substrate. SCIAA and Jimmy Moss undertook preliminary documentation on two
shipwreck sites, a barge and sailing vessel in section 9, and the Mepkin Abbey Dock (Harris,
Moss, and Naylor 1993:2, 24, 26).
Cedar Grove Landing (38DR155)
When developers scheduled a community wharf to be constructed on the Ashley River
within the vicinity of Middleton Place Plantation, SCIAA conducted an underwater cultural
resources survey on January 23, 1990, to search for cultural resources as per the South Carolina
Underwater Antiquities Act of 1982 S.C. Code of Laws (Sect 54-7-400 et seq). The project area
consisted of a 328 ft. by 82 ft. (100 m. by 25 m.) search zone, parallel to the north bank of the
river. Its location was 0.9 mi. (1.49 km.) upstream of Middleton Place Plantation. The riverbank
consisted of tidal marshes. Archaeologists found a landing, hesitantly dated to the Antebellum
Period (Beard 1990:iii, 1, 7).
At the head of the causeway in the Ashley River, the survey team anchored an 82 ft.
(25 m.) search line. They then conducted a circle search beginning at the extant of the line and
moved 13.1 ft. (4 m.) in after the completion of each circle. Next, the team performed a visual
line search parallel with the eastern shore both upstream and downstream of the causeway.
Finally, the archaeologists inspected the exposed shoreline at the head of the causeway and along

29
its west bank to locate artifact concentrations for diagnostic information and indication of
cultural activities. During the survey, the archaeologists noted the locations of artifacts or
archaeological features in their field notebooks and to the shore personnel, and documented the
general locations in the rough site map (Beard 1990:2, 7).
Middleburg Plantation Landing
James R. Errante surveyed Middleburg Plantation’s waterscape as the archaeological
basis for his M.A. thesis in anthropology at the University of South Carolina. He utilized the
concept of waterscape archaeology to locate and date the plantation landings, analyze the
construction characteristics, and determine the landing’s location in relation to the physical
environment and the structures and activities that occurred on land. Methodologies employed in
the archaeological survey include surface reconnaissance, systematic shovel testing, underwater
line and circle searches, and remote sensing (Errante 1993:59-60).
Mapping
Errante established a primary datum and a series of waypoints on shore, along the
waterfront of Middleburg Plantation and farther inland with a transit. He mapped the locations of
underwater features using triangulation methods from three known points mapped on land
(Errante 1993:75-76).
Errante selected survey areas with the use of the 1786 Middleburg plat, 1989 United
States Geological Survey (USGS) aerial photograph, and a 1950 USGS topographic map of the
area. The 1786 plat depicted two boat landings along the Middleburg riverfront. The USGS
photograph and topographic map located probable areas for the landings’ locations (Errante
1993:61-62).

30
Surface Reconnaissance
Surface reconnaissance of the waterscape included a terrestrial surface survey and a boat
survey based on the property boundaries depicted in the 1786 plat. The reconnaissance’s purpose
was to search for visible land forms and features that would provide clues in discerning the
location of the landings. The terrestrial surface survey covered areas of the mainland and
adjoining rice fields that were accessible to pedestrians. The boat survey consisted of searching
the plantation’s entire eighteenth-century waterfront. Investigators identified high probability
areas and further methodologies concentrated on these areas (Errante 1993:62-63).
Remote Sensing
Errante conducted remote sensing along the waterfront searching for cultural features on
the river bottom using a Lowrance X-16 Computer Sonar and a jon-boat. The remote sensing
survey consisted of parallel transects, 300 meters in length, adjacent to the river section believed
to contain the landings. Errante spaced the transects at 10 ft. (3.05 m.) intervals with the
exception of a 25 ft. (7.62 m.) increment in the river’s channel. He made two passes across the
river, perpendicular to the shore, to view cross-sections of the river channel. Investigators used
readings from the sonar to produce a bathymetric map of the river bottom adjacent to the project
area to provide information concerning depth and shape of the river and channel. The remote
sensing survey noted four anomalies that the underwater survey team then investigated (Errante
1993:65-67).
Underwater Survey
The underwater survey included line and circle searches (Figure 2.3). Errante conducted
five visits to the project site between fall 1989 and fall 1990 to complete the project’s underwater

31
phase. Visibility underwater ranged from two feet to several inches. To negate the hardships of
poor visibility underwater, the line search utilized a baseline to guide the diver. Errante
conducted three baseline searches each 620 ft. (188.98 m.) in length and set at 10 ft. (3.05 m.)
intervals from the shore. The first two began at the mouth of the canal and ran downstream
ending west of the probable location of the storehouse landing. The third baseline began 250 ft.
(76.2 m.) downstream of the canal and extended 250 ft. (76.2 m.) past the end points of transects
1 and 2. When Errante identified cultural remains, he released a buoy to mark the feature’s
location for future investigation and recording purposes. He mapped three features using baseline
offset and trilateration recording methods (Errante 1993:67-70).
FIGURE 2.3. Underwater methodologies at Middleburg Plantation (Errante 1993:92).

32
Terrestrial Survey
The terrestrial survey focused on the main bank location believed to have contained the
storehouse identified on the 1786 plat, aiming to identify evidence of activity in the area related
to the landing’s use or the landing’s structural remains. Errante placed a series of 7, 19.68 by
19.68 in. (50 by 50 cm.) shovel test pits (STPs) systematically and dry screened through 0.25 in.
(0.64 cm.) mesh (Figure 2.4). Excavation averaged 19 in. (50 cm.) below surface 15.5 in. to 30
in. (ranging 40 cm. to 77 cm.). He used coordinate point identified as “Post A” as the datum
point for the terrestrial survey (Errante 1993:72-74).
FIGURE 2.4. Terrestrial methodologies at Middleburg Plantation Landing (Errante 1993:93).
Errante placed STPs 1 through 4 at 33 ft. (10.06 m.) intervals parallel to the river on a
linear transect. Bank erosion and flooding cause a 66 ft. (20.12 m.) gap between STP 4 and 5.
He dug STPs 6 and 7 landward of STPs 1 through 5 and south-southeast of STPs 4 and 5 to
obtain comparative samples from the built up section of the bank (Errante 1993:74-75).

33
Shirley Plantation Dock Complex
Shirley Plantation maritime survey commenced in October 2010 under the direction of
terrestrial archaeologist Taft Kieser, geologist Chee Saunders, and plantation owner Charles H.
Carter III. The survey’s purpose was to document maritime cultural resources along Shirley
Plantation’s river front to better understand the plantation’s history and the role it played in
Britain’s Atlantic trade network. The river front survey has thus far uncovered a large wharf
complex upriver from the manor house, two smaller wharves parallel to the manor, and a
plethora of artifacts along the river bank. Three core samples have been taken on either side of
the wharf complex. The project is on-going; only the fieldwork survey for the wharf complex has
been completed. A preliminary site report has not yet been published.
Wharf Complex Survey
Over the course of three survey days, the crew performed a walking survey of the river at
and around low tide to locate, flag, and record the location of pilings. A team completed both a
walking and snorkel survey of the area to determine the complex’s outer reaches. Using probes
ANTC located pilings and cultural material beneath the silted river bottom. Once the surveyors
located a piling, they flagged it for the recording process. A crew member sat in a jon-boat with a
sub-meter GPS, while other crew members directed the boat to record the location of each
discovered piling (Figure 2.5). The GPS data was loaded into computer software and upload onto
a geo-rectified map to create the site plan.

34
FIGURE 2.5. Investigators documenting wharf piling positions using sub-meter GPS. (Photo by
Taft Kiser; courtesy of Charles H. Carter III, Shirley Plantation, Charles City, VA.)
Core Sampling
The crew collected three core samples of river sediments around the wharf complex to
determine stratigraphy and the degree of sediment accumulation since the first European
colonists inhabited and farmed along the James River (Figure 2.6). The crew used a vibracore
braced on an aluminum A-frame with the engine seated within an anchored jon-boat while taking
two samples upriver and one sample just downriver from the wharf complex. The 7 ft. (2.13 m.)
depth cores were taken and stored in 3 in. (7.6 cm) wide by 10 ft. (3.05 m.) long aluminum
casings.

35
FIGURE 2.6. Investigators lifting a core sample from the James River adjacent to the wharf
complex. (Photo by author, 2010.)

36
Terrestrial Survey
The terrestrial survey involved a "catch and release" collection of historic artifacts to
analyze occupation and use dates of the riverfront (Figure 2.7). The goal was to sample enough
of the shoreline's historic artifacts to determine whether there are concentrations of 17th, 18th, or
19th century artifacts in proximity to known cultural landscape markers such as wharf sites and
outbuildings. If there are no known reasons for artifact concentrations in a specific area, it could
represent a hitherto unknown location of a wharf site or terrestrial structure.
FIGURE 2.7. Charles H. Carter III instructing volunteers on shoreline survey methods.
(Photo by author, 2011).

37
Surveyors used rebar to mark the bends in the river and as data points upon which to
attach a baseline for the survey. They separated the baseline into 10 ft. (3.05 m.) units and
collected all historic artifacts within each unit to be cataloged. Once cataloged, the investigators
released the artifacts back within their unit with a few exceptions: several prehistoric blades, one
woodland pottery sherd, and a German stoneware ceramic sherd. Thus far, investigators have
documented roughly 450 ft. (137.16 m.) of the shoreline from the wharf complex upriver to the
manor house.
Future Fieldwork
Future fieldwork includes the completion of the terrestrial river bank survey downriver to
where the 20th-century sand mining operations began. The survey will then commence upriver
from the wharf complex until the edge of the historic eighteenth-century property line for Shirley
Plantation. This includes the present Upper Shirley property no longer owned by the Hill-Carter
family. Further work will include GPS pilings found outside of the wharf complex including
other wharves and fence pilings located parallel to the manor house and on the Upper Shirley
property. The crew also intends to document the recently discovered ballast pile at Upper
Shirley, noting its location and determining if wooden hull structure is present. Other related
fieldwork involves contracting the Virginia Institute of Marine Science (VIMS) at the College of
William and Mary to perform side-scan sonar and sub-bottom profiling of the James River along
the historic Shirley Plantation river front as well as further taking of core samples of the river
bottom and performing radiometric analysis to determine rate of sedimentation. VIMS could
provide information related to the maritime activity and history of Shirley Plantation that a visual
underwater survey might miss under the silt.

38
Red Banks Landing
Kathy Southerly, as part of her M.A. in Maritime Studies at East Carolina University,
documented the Red Banks Landing in Pitt County, North Carolina. The survey commenced in
March 2000 and comprised of two field crews: a terrestrial crew of students from ECU’s
Department of Anthropology and an underwater team from ECU’s Program in Maritime Studies.
The surveys’ goals were to determine any existing intact archaeological deposits or stratigraphy
on the river banks, assess artifact typology recovered from shovel testing, establish the extent of
the landing structure, and assess the Tar River’s physical characteristics to determine the cause
for a landing to have been built in this particular location (Southerly 2006:45-46).
Mapping
Parker’s Creek to the northwest and a sandpit operation downriver to the southeast
delineated the boundaries for the field project. Archaeologists set up an arbitrary datum at the
site as a point of reference for mapping purposes (Figure 2.8). They tied the datum into the
benchmark near Arthur Tripp Memorial Bridge using two control points for establishing precise
location for geo-referencing. A Lietz total station shot in the datum, shoreline, and STP locations
from a waypoint on the opposite bank. Archaeologists established the waypoint across the river
to achieve the optimal vantage point in obtaining data using the total station. They downloaded
the data collected from the total station into AutoCAD 2000 to create the site map. The site map
depicted all archaeological activity that transpired at Red Banks Landing (Southerly 2006:46-47,
49-50).
Terrestrial Archaeology
Archaeologists commenced a pedestrian survey to determine the site location and

39
FIGURE 2.8. Redbanks Landing Site Map showing field methods (Southerly 2006:57).
boundaries. They systematically laid out shovel test pits (STPs) in 30 ft. (9.14 m.) increments
over 3 transects, labeled A, B, and C, for optimum coverage of undisturbed site areas. The
transects began in the northwest corner of the site located at Parker’s Creek and continued
southeast for 150 ft. (45.72 m.) totaling 34 STPs. The team dug to sterile soil and soil
stratigraphy and recorded the STP’s depth. They sifted soil through 0.25 in. (0.64 cm.) mesh
screen and bagged and labeled all artifacts with provenience. Excavators opened one test unit 3
ft. by 6 ft. (0.914 m. by 1.83 m.) for stratigraphic analysis of STPs to determine if distinct soil
layers still existed (Southerly 2006: 46-47, 50-51).
Underwater Archaeology
Maritime archaeology students conducted three underwater surveys and a bathymetric
survey to gain information on the depth and contour of the river. A rope with 10 ft. (3.05 m.)
N
Tar River Pitt County, NC

40
interval marks ran across the river to maintain perpendicular transects. Students used a measure
probe to gain the river depth, and entered the information into Surfer 7 to develop a three
dimensional representation of the river bottom (Southerly 2006: 53-54).
To determine the extent of the landing’s remains and if cultural material associated with
the landing’s construction still remain on the river’s bottom, the archaeologists conducted an
underwater visual survey. Buoys marked the ends of two search lanes that ran parallel to the
shore within and adjacent to the visible wharf pilings. Survey teams probed the river bottom at
10 ft. (3.05 m.) intervals and noted the presence or absence of cultural material, and ground-
truthed where material appeared to be present. Visual surveys using snorkel gear assessed
whether the material found related to the life and use of the landing. The crew used a total station
to mark the locations of significant material and each wharf piling for the site map (Southerly
2006:55-56).
Remote Sensing
The crew conducted a side-scan sonar survey of the river using a MarineSonics Sea Scan
side-scan sonar with a 600khz tow-fish. The boat made several passes along the bank to ensure
the best reading possible of the underwater site. Archaeologists interpreted the data using
SeaScan PC review software (Southerly 2006:56).
Bowling Farm Site
ECU’s Program in Maritime Studies conducted archaeological investigations that
commenced in September 2009 at the Bowling Farm Site. The site yielded numerous historic and
prehistoric artifacts, a cobb-style landing, and a partial pre-1750s shipwreck with ballast
extending over the entire underwater site.

41
The Bowling Farm Site is located on the Cashie River roughly eight miles downriver
from Windsor, North Carolina, the county seat of Bertie. The site is situated in a small bay
before a turn in the river. Swamps surround the adjacent land. The field school team had several
research objectives: record a plan and cross-section of both the vessel and wharf, perform a
random terrestrial survey of the property adjacent to the underwater component of the site, and
undertake a bathymetric survey of the river within the site’s vicinity (Figure 2.9).
Visual Survey
Before archaeological fieldwork commenced, the students performed a visual underwater
and terrestrial survey. There were three separate archaeological features in the water: the
shipwreck to the east, the wharf structure centered, and a disjointed mass of worked timbers to
the west (Figure 2.9). No terrestrial archaeological features were visible during the land survey.
Archaeologists designated a datum at WGS 84 18s 0334479E; 3977216N within a raised garden
bed on the Bowling property. Rebar cemented into the ground physically represented the datum.
Investigators oriented the zero point facing magnetic north and visually based off the west side
of a poplar tree at coordinates WGS 84 18s 0334469E; 3977242N.
Three points designated as points A, B, and C represented the beginning, turn, and end of
the steel baseline. “A” began at 10 ft. (3.05 m.) on the baseline and ran directly centered on the
keelson to bisect the wreck port and starboard until it reached point “B” at 30 ft. (9.14 m.). From
point B, the baseline made a 63 degree west turn. It then ran along the outer edge of the wharf’s
header and past the disarticulated timbers to point C, 94.5 ft. (28.8 m.) on the baseline.
Archaeologists then plotted the baseline from the datum using a theodolite and an Electronic
Distance Measurer (EDM).

42
FIGURE 2.9. Bowling Farm Site methodology map. (Map by Bradley A. Rodgers; courtesy of East Carolina University, Greenville, NC.)
A
B C

43
Shipwreck
Students recorded the wreck in situ resulting in measured drawings at a 1:1 foot scale,
using the baseline-offset recording method. They removed ballast one foot from the port side
along the length of the wreck to record the placement of the frames. To make a profile drawing
at 30 ft. (9.14 m.) on the baseline and to reduce the risk of danger to divers during the dredging
process, students removed ballast closest to the vessel’s forward most frame (F5).
Dr. Rodgers, the principal investigator, dredged sand from under the vessel’s hull and
around the keel to take measurements for the profile and to search for sheathing. The students
established an arbitrary baseline running perpendicular to the baseline at 30 ft. (9.14 m.) to
complete this process, and took baseline offsets off the arbitrary baseline at 1 ft. (0.3 m.)
intervals to get the curvature of the frame and placement of the strakes, keelson, and keel.
The team also dredged three bilges between Chocks 1, 2, and 3 for diagnostic artifacts
(Figure 2.10). Aft of the vessel between the wreck and the shoreline, students probed the water
and sediment for disarticulated timbers locating a portion of the rudder, the position of which the
students recorded via the datum and measured in situ. Scuba divers performed a circle search
around point B on the baseline every 5 ft. (1.52 m.) out to 70 ft. (21.34 m.) into the river to
visibly search for any other portion of the vessel of significant features relating to the
waterscape. Students also performed a line survey along the river’s northern and southern shores
visible from the archaeological site. The students spaced themselves 5 ft. (1.52 m.) apart to a
maximum depth of 10 ft. (3.05 m.), skin diving in low water visibility. The survey’s purpose was
to search for any other feature related to the original plantation.

44
FIGURE 2.10. Dr. Bradley A. Rodgers and Dr. Lynn Harris assembled the dredge hose.
(Photo by author, 2009.) Wharf
After the baseline had been laid, students first labeled each of the wharf components (S1,
S2, etc. for Stretcher 1 and Stretcher 2; and H1, H2, etc. for Header 1 and Header 2) and visually
marked the components from the water’s surface with buoys. Students documented visible wharf
structure using baseline offsets to create a 1:1 scale drawing. To record the features between the
shipwreck and the wharf, the students created a grid using tape measures placed at 4 ft. (1.22 m.)
intervals on the B-C segment of the baseline.
Students excavated a test trench with the purpose of revealing the full extent of the wharf
construction beneath Stretcher 2 and retrieving diagnostic artifacts from the wharf’s fill. The

45
trench began at the intersection of Header 2 and Stretcher 2 and ran 3 ft. (0.91 m.) across Header
2 and 18 ft. (5.49 m.) down Stretcher 2. The investigators marked the trench’s western border of
the trench with a tape measure attached to the baseline running parallel with Stretcher 2, and
removed ballast and fill from the surface and throughout the trench to expose buried timbers. To
prevent slumping, students spread out the ballast northwest of the trench and dredged the rest of
the fill, sifting through a 0.25 in. (0.64 cm) mesh floating screen. They bagged and labeled
recovered diagnostic artifacts with appropriate provenience information. Upon completing the
documentation of exposed timbers, students backfilled the trench and dredged three more 2 ft. by
2 ft. (0.61 m. by 0.61 m.) test pits outside of the wharf structure at 4 ft. (1.22 m.) intervals off the
76.1 ft. (23.2 m.) mark on baseline segment B-C to discover the extent of artifact distribution and
possible external wharf features. They screened the fills for diagnostic artifacts, and the test pits
backfilled upon completion.
Bathymetric Survey
Students conducted a bathymetric survey of the river directly in front of the
archaeological site to discern the river profile. A deep river would enable large vessels to
navigate up river while a shallow river would limit river traffic to small plantation vessels such
as schooners, sloops, and river flats. The students laid five transects across the river using
numbered buoys. Three transects had 16 buoys, while two had 15 as one was lost. The students
recorded the buoys’ positions using a theodolite and an EDM, and also measured the depth at
each buoy using a hand-held sonar device. The students then recorded each buoy’s location on
the overall site map.

46
Terrestrial Survey
The terrestrial survey consisted of two components, the recording of the site perimeter
and a Phase I terrestrial survey (Figure 2.11). Students recorded the perimeter of the survey
location and both shorelines of the Cashie River within view of the permanent datum using the
theodolite and EDM. They also recorded interior features such as flood streams, trees, modern
garden beds, and existing structures on the overall site map.
FIGURE 2.11. Graduate students Stephen Dilk, Brown Mims, and Jessica Smeeks excavating a STP at Bowling Farm Site. (Photo by author, 2009.)
The Phase I survey consisted of twenty-eight, 1 ft. sq. by 2 ft. (0.31 m. sq. by 0.61 m.)
depth shovel test pits (STPs) with positions recorded via datum. The STPs’ locations were
picked semi-randomly with the locations spread throughout the interior land site, although
concentrating more STPs near the shore line, and gradually spaced farther apart the farther

47
inland. Archaeologists chose this method primarily to provide a better understanding of the use
of the wharf, but also to allow for the possible discovery of significant archaeological features
such as housing quarters or wharf support structures and the identification of artifact distribution.
Dendrochronology and Speciation
Bowling Farm Site analysis included the harvesting of speciation and dendrochronology
of wood samples from both the shipwreck and the wharf structure. The 2010 Advanced
Conservation class performed speciation analysis comparing grain type and specific gravity to
known wood types. The class then compared the identification of wood types with other sites to
detect common or unique wood usages in wharf and ship construction and to discern whether the
vessel is American or European built. Whitney Minger of the 2010 Advanced Conservation class
set out to perform dendrochronology analysis using NOAA Paleoclimatology data to date the
wharf and shipwreck, but the lack of dendro data for comparison in eastern North Carolina
resulted in an unsuccessful attempt.
Magnetometer and Side Scan Sonar Survey
On October 24-25, 2009, the Advanced Methods for Maritime Archaeology class of the
Program in Maritime Studies, ECU, performed a magnetometer and side-scan sonar survey of
the Cashie River. The survey was part of a lesson on the use of advanced survey techniques and
equipment for the discovery and identification of underwater cultural resources. The class
conducted the survey in the length of the river visible from the Bowling Farm Site. The side scan
sonar consisted of six lanes to get the largest coverage available.

48
Archaeological Methodology Comparison Analysis
The principal investigators of each compared archaeological site designed a research
methodology that differed based on the direction of the research questions, environment, site
condition, technology, man power, and time available. Not all sites described produced the same
quality of information, and it is evident through this comparison that the sites surveyed using
proven archaeological methodologies have produced the most information. In comparison, rarely
used archaeological techniques borrowed from other fields of science, such as geology and
biology, have generated data and helped formulate conclusions otherwise unavailable to
archaeologists through standard survey techniques. The techniques that proved greatest in
providing an understanding of history, use, and purpose of a wharf site came from the union of
both terrestrial and underwater methodologies.
Archaeological Investigators
Different occupational groups within the scientific field have conducted the
archaeological investigations to study colonial plantation wharf sites in southeast America.
Predominantly, professionally trained underwater archaeologists have led the archaeological
investigations. At the time of the investigations, a total of three underwater archaeologists and
one terrestrial archaeologist holding a doctorate have investigated three different sites: Mulberry
Landing in 1995-1996 by Dr. Susan Langley; Redbanks Landing in 2000 by Dr. Nathan Richards
and Dr. Charles Ewen; and Bowling Farm Site in 2009 by Dr. Bradley A. Rodgers and Dr. Lynn
B. Harris. Of all the wharf investigations, none of the principal investigators have investigated
more than one colonial plantation landing. David V. Beard, M.A. in Maritime History and
Underwater Archaeology, conducted the fieldwork for Cedar Grove Landing. James Errante,
who led the Middleburg Plantation wharf survey, was a graduate student in the Department of

49
Anthropology at the University of South Carolina. Three scientists lead the Shirley Plantation
Dock Complex Survey. Taft Kiser of Cultural Resource, Inc. was the project’s terrestrial
archaeologist with 26 years of archaeological experience. Charles Saunders was the project’s
geologist with an M.S. in Geology working as the senior geologist for Marshall Miller &
Associates. Charles H. Carter III is the current owner of Shirley Plantation and director of
Waenack Land Limited Partners. Avocational divers documented Mepkin Dock as part of the
Cooper River Survey. The divers received instruction in basic archaeological surveying
techniques from SCIAA to assist in proper documentation and handling of artifacts.
Visibility in River Environments
Visibility was the most significant problem encountered in the documentation of the
shipwreck and wharf structure at Bowling Farm. While the Cashie River is slow moving with
little to no current within the archaeological site’s vicinity, tannic acid produced by the
abundance of cypress trees created a black water environment. This made any viewing of the
archaeological site in a larger scale than the available flashlight beam virtually impossible. The
river bottom conditions exacerbated the visibility when diver stirred silt clouded into the water
and created a brown water environment that lowered the visibility to mere inches. With careful
attention to movement the divers were, for the most part, able to contend with the situation and
record the structures with accuracy to within an inch.
Hans K. Van Tilburg wrote the first publication on archaeology in a zero visibility
environment as a chapter in Maritime Archaeology: A Reader of Substantive and Theoretical
Contributions (Babits and Van Tilburg 1998:513-517). ECU archaeologists diving on the Maple
Leaf (Cantelas and Rodgers 1994) encountered zero-visibility conditions in Florida’s St. John’s
River. The river current carried silt preventing all visibility even with the assistance of halogen

50
lights. Van Tilburg’s publication has presented training techniques for archaeologists working in
an underwater zero-visibility environment. The same techniques can be used in low visibility
water at Bowling Farm Site and Redbanks Landing in the Cashie River and the Tar River
respectively in North Carolina (Van Tilburg 1998:513).
Van Tilburg has provided various solutions to some problems encountered in the zero-
visibility environment of the St. John’s River during the Maple Leaf project. These include
individual tag lines, object feelers, gear attachment points, visibility bags, cutting clippers, game
bags, survey tape floats, coveralls, and search lines. Individual tag lines are 8-10 ft. (2.44-3.05
m.) of polypro line with a snap shackle. The lines are attached to a known point on the site and
allow for an increase distance away from fixed guidelines. Object feelers warn divers of any
obstacle in the immediate vicinity. Van Tilburg suggested using plastic wire ties attached to the
face mask projects above the head to warn the diver of an overhead object (Van Tilburg
1998:515).
Gear attachment points secure equipment to the diver’s person to prevent loss of tools in
zero visibility. Tools equipped with a scuba cam strap and carabineer clip could be secure to a d-
ring on the diver’s buoyancy compensator or wrist to prevent loss. To read surveying tapes and
dive slates underwater, archaeologists activated a chemical light source such as a cylume stick
placed in a sealable plastic bag filled with water. The visibility bag, when placed on the
surveyor’s tape allowed the archaeologist to read underwater. Cutting clippers similar to what
gardeners use were suggested for working in a zero-visibility environment, because they work
more efficiently than a dive knife for cutting through monofilament or polypro line that can
entangle a diver (Van Tilburg 1998:515-516).

51
Mesh bags known as game bags are useful underwater for storing large amounts of
polypro line. Van Tilburg initiated using small rounded Styrofoam floats as survey tape floats.
By attaching survey tape floats to the tape while pulling it across a site, the tape would float
above protrusions on the archaeological site preventing it from becoming entangled. Coveralls
have worked well in water when temperatures are too warm for the protective covering of a wet
suit. The coveralls protected the diver from abrasions and other injuries from sharp iron or wood
protrusions that could be encountered underwater, but not visible in a silted environment.
Coveralls also provided pockets for the storage of necessary tools while documenting a site (Van
Tilburg 1998:516).
The solutions to some problems encountered by underwater archaeologists working in
zero-visibility sites offered divers the ability to accomplish work in a hazardous environment. As
the rivers were the locations of colonial plantation wharf sites in southeastern America, future
archaeological work in this area of study will encounter low or zero-visibility. Techniques
described by Van Tilburg could be employed to make documentation more efficient while
protecting the divers from harm (Van Tilburg 1998:516-517).
Field Methods
There are different phases of archaeological methods, whether terrestrial or underwater,
that archaeological research design and the questions determine which to use: pre-disturbance
survey, phase I, phase II, and phase III. Archaeology of the seven landing sites involved pre-
disturbance, phase I, or phase II archaeological survey. None of the sites carried out a phase III
full excavation of all archaeological remains as phase III excavation completely destroys the
archaeological site.

52
Shirley Plantation Dock Complex, Cedar Grove Landing, and Mepkin Abbey Dock
projects carried out pre-disturbance survey as their primary research design. The goal of a pre-
disturbance survey is to document it as it exists (Green 2004:88). Cedar Grove Landing and
Mepkin Abbey Dock were both documented with sketches and mud maps with few
measurements of the wharves. Archaeologists documenting the Shirley Documentation Dock
Complex recorded the location of each piling. They performed a surface survey of the shoreline
but are not removing any artifacts or disturbed the wharf complex. Mulberry Landing Wharf and
Cedar Grove Landing survey teams both performed surface surveys around the vicinity of the
wharf looking for artifact scatter associated with the landing.
A phase I survey such as that performed at Middleburg Landing tested a possible
archaeological site for the presence of cultural remains as well as determining the horizontal and
vertical extent of the possible site. The archaeologist at Middleburg Landing attempted to
discover the location of the plantation’s two colonial wharves that had been documented
historically. He accomplished his survey by conducting a series of shovel test pits (STPs) across
the shoreline to locate cultural remains associated with the wharf site. STPs are generally one to
two feet in diameter and their depth reaches to undisturbed soil (Neumann and Sanford 2001:85-
86). Bowling Farm Site archaeologists dredged test pits underwater. This method cannot provide
information on sediment stratigraphy like STPs in terrestrial archaeology, but it determined the
extent of the artifact scatter around the plantation wharf.
Mulberry Landing Wharf, Bowling Farm Site, and Redbanks Landing all had phase II
components within the research design. The purpose of the more intrusive phase II archaeology
is to gain a better understanding of the culture and period of a known archaeological site, the
integrity of the archaeological deposits, and the site’s spatial limits and its chronology (Neumann

53
and Sanford 2001:123). Mulberry Landing Wharf and Bowling Farm Site investigators both
excavated large trenches in their respective wharves to document wharf construction. The team
dredged the shipwreck located at Bowling Farm Site to locate artifacts associated with its
original use. Redbanks Landing crew excavated a test unit on the shore adjacent to the landing
site in order to determine the stratigraphy of the site.
Archaeology at Mulberry Landing Wharf, Shirley Plantation Dock Complex, Bowling
Farm Site, Redbanks Landing, and Middleburg Landing all employed the use of a baseline for
some portion of archaeological research. A baseline was placed across the longitudinal portion of
the site and could be used as an orientation guide and for documenting the archaeological site. A
permanent baseline served as a datum for future archaeological work. Baseline-offset
measurements, such as those used to document Mulberry Landing Wharf, Bowling Farm Site,
Redbanks Landing, and Middleburg Plantation Landing were utilized to take the offset distance
from the baseline in order to measure the wharf. This method, however, requires the ability to
define a right angle. Middleburg Plantation Landing was the only site where archaeologists used
trilateration as a method to document a site (Green 2004:89, 95-96).
Archaeologists of Shirley Plantation Dock Complex and Middleburg Landing utilized the
baseline for different purposes. Shirley Plantation archaeological staff anchored a baseline on
shore for a shoreline artifact deposit survey. The crew marked every tenth foot on the baseline to
create equal width units. They documented surface deposit artifacts within the unit but did not
collect. The archaeologist for Middleburg Landing used a baseline as a guide in an underwater
reconnaissance survey to locate the wharf structure. This technique is essentially a one person
swim-line survey that easily allows the archaeologist to document the location of the survey area
so future survey work does not overlap (Green 2004:51).

54
Bowling Farm Site and Middleburg Landing archaeologists used circle searches as part of
their survey methodology. Circle searches rely on a measured line fixed to a point to swim
around. At the completion of one circle, the diver gradually decreases or increases the length of
the line a set amount and continues the circle. Circle searches are useful in either noting a known
object that the archaeologist neglected to document accurately its location or to sample the
riverbed for cultural material. The circle search does not provide total coverage of search area,
but is useful in low visibility conditions (Dean et al. 2000:134-135; Green 2004:55). Bowling
Farm Site archaeologists used circle searches at the end of baseline markers to discern the extent
of the site had been located. Middleburg Landing archaeologists performed circle searches at the
location of possible features.
Redbanks Landing and Bowling Farm Site used two similar yet different position fixing
tools, the total station and the theodolite coupled with an electronic distance measurer (EDM).
The theodolite measures angles while the EDM measures distance using a reflector attached to a
pole resting on a point on the site. Both are easy to use and accurate. The EDM is fixed atop the
theodolite. The theodolite itself is attached to a stable base on a tripod. The theodolite telescope
can be adjusted both vertically and horizontally. The recorder takes down the angle and distance
measurements and then plots them on the site map. A Total Station operates like a theodolite
with a built in EDM, and is capable of measuring slope distance, horizontal angle, and vertical
angle among others. A Total Station is accurate to millimeters. Neither the Total Station or
theodolite-EDM combination can be taken underwater, and archaeologists in shallow
environments such as wharf sites place the reflector on a poll and raised above water level to
mark the location of important points on the site (Dean et al. 2000:118-119; Green 2004:40-42).

55
While Redbanks Landing and Bowling Farm Site archaeologists utilized GPS’s for
documenting their permanent datum point, the Shirley Plantation Dock Complex survey team
used a Trimble Geo XH Trimble GeoExplorer Series with a GeoBeacon Receiver to document
each post location of the four wharves situated in the complex. The Trimble provided subfoot
accuracy at roughly 30 cm. or less accuracy with its internal antenna. The Trimble works well
with large data sets plotted on maps such as the numerous pilings in the Shirley Plantation Wharf
Complex. The data set acquired by this GPS can be downloaded and plotted in advanced
mapping systems like ArcGIS. One disadvantage to this mapping system is the reliance on good
satellite connection as shown in the comparison between Figures 2.12 and 2.13. Poor connection
can result in skewed data (Trimble Navigation Limited 2011).
FIGURE 2.12. 2007 Virginia Based Mapping Program image of the Shirley Plantation Wharf
Complex that shows the outline of three wharves visible above water. (Image by Virginia Polytechnic Institute and State University.)

56
FIGURE 2.13. Poor satellite connection created inaccurate point locations of pilings in Shirley
Plantation Wharf Complex. (Map by Charles Saunders; courtesy of Charles H. Carter III, Shirley Plantation, Charles City, VA.)

57
Remote Sensing
On four of the seven sites archaeologists conducted remote sensing surveys: Bowling
Farm Site, Redbanks Landing, Mepkin Abbey Dock, and Middleburg Plantation Landing. This
entailed primarily conducted side scan sonar, with the exception of Bowling Farm Site
operations which also including a magnetometer survey. As an on-going archaeological
documentation, the documentation team contracted VIMS to conduct remote sensing using side
scan sonar and sub-bottom profiling in spring 2011 field season. Of the four sites where
archaeologists conducted remote sensing operations, only Redbanks Landing displayed a target
signature for the landing. Remote sensing methods did not locate Bowling Farm Site, Mepkin
Abbey Dock, or Middleburg Plantation Landing. The locations of the multiple landing sites
shown on historical documents for Middleburg Plantation still remain unknown.
A magnetometer detects variations in the earth’s magnetic field strength caused by the
presence of ferrous objects. The magnetometer’s ability to detect ferrous material underwater is
affected by the magnetic permeability, shape, and orientation of the object. Distance also plays a
major role in detection. The farther away a magnetometer is from the object, the weaker the
return signal. The magnetometer fish must also be towed sufficiently far away from the boat and
any other remote sensing fish so that they are not detected and skew the results. The fish should
also be towed as close to the river bed as possible, especially if searching for small massed
ferrous objects. A benefit of the magnetometer is that it can detect ferrous object beneath
sedimentation build-up. One disadvantage is that the location of the target can be difficult to
discern if a systematic search pattern is not maintained (Dean et al. 2000: 142-143).
Side scan sonar remote sensing provides an image of objects on the river floor.
Archaeologists drag a towfish through the river in lanes similar to a magnetometer. The towfish

58
of a sidescan, however, emits two separate fan shaped beams on either side of the fish to the
magnetometer’s one. The side scan fan angle is generally at a 40 degree angle, but archaeologists
can avoid a large gap between the two fan beams by adjusting the angle and allowing for
operation at different distances from the river floor. The advantage of the side scan soar method
is its ability to detect objects projecting from the river floor made from materials other than just
iron. Once the towfish detects an object, multiple passes around and over the object would
provide more detailed information including side views of the object. If archaeologists know the
distance of the towfish from the riverbed, then it is possible to calculate the height of projections
on the object image (Dean et al. 2000: 143-144).
Like the magnetometer, sub-bottom profilers are able to detect buried objects, but they
can also detect non-ferrous objects like a side scan sonar. Sub-bottom profilers use a low
frequency to penetrate the sand and silt on the river floor. The fish has a mounted transducer that
a boat tows close to the river bed to reduce the amount of signal lost to water penetration. The
transducer emits a cone-shaped pulse downwards and picks up signals reflected off the seabed,
layers of strata, and archaeological materials. The disadvantages of using the sub-bottom profiler
are the cost and the narrow lanes necessary to cover the entire river bed in the search area;
therefore, using the sub-bottom profiler in conjunction with a side scan sonar is the most cost-
efficient. While the sub-bottom is not ideal for 100 percent coverage of the search area, it is
useful in quantifying the amount of wharf or vessel structure existing beneath river
sedimentation after a target has been located with the side scan sonar (Dean et al. 2000:14).
A significant problem discovered during the use of advanced survey equipment at the
Bowling Farm Site showed the limitations technology still has in the search for underwater
cultural sites. Neither the sidescan sonar nor the magnetometer surveys detected the wharf and

59
shipwreck (Figure 2.14). It is understandable that the magnetometer did not recognize the
features since there was very little iron present on the vessel or in the wharf. The side scan sonar,
however, should have detected the wharf and wreck with its size and distinctive shape. The site
is located in proximity to shore that the boat towing the fish could not get close enough. The
depth the fish is suspended depends on the depth of the body of water. The greater the depth, the
deeper the fish needs to swim. During the Cashie River survey, archaeologists towed the fish at
2 ft. (0.61 m.) because of its relatively shallow depth; therefore, getting close to the shore should
not be as difficult. The problem arises with the probability of hitting a snag (personal comm.
Nathan Richards, 08/06/2010). It is therefore extremely hazardous for this expensive piece of
equipment to be towed close to the shoreline. Of the four sites that performed remote sensing
surveys, only Redbanks Landing registered as a target. It can be deduced that since pilings of
Redbanks Landing reach above the water level, the archaeologists could more easily estimate
how close the boat could come to the landing without causing equipment damage.
The inability for side scan and magnetometer surveying equipment to locate the wharf
and shipwreck at the Bowling Farm Site suggests that many underwater cultural sites have been
missed in river surveys when the submerged resource is close to shore. This would exclude many
wharf structures and grounded vessels from being identified unless a diver physically searches
the shore line such as the case of Bowling Farm Site, Mepkin Abbey Dock, and Middleburg
Plantation Landing. Middleburg Plantation Landing might also be buried underneath river
sediment buildup as the investigator suggested after discovering side scan sonar and underwater
visual survey methods could not locate the wharf (Errante 1993:80).

60
Figure 2.14. Side scan sonar survey of the Cashie River adjacent to the Bowling Farm Site.
(Image by Nathan Richards; courtesy of East Carolina University, Greenville, NC.)
Cofferdams in Maritime Archaeology
The Mulberry Landing Wharf documentation employed the use of a mud dike to block
the incoming tide and a sink pit to drain water from the site to turn the submerged archaeological
site into a terrestrial excavation. Archaeologists considered using a cofferdam for this operation
but deemed it too expensive and largely impractical. Two noteworthy cofferdams have been
Bowling Farm Site

61
employed in the United States in conjunction with archaeological excavations of underwater
sites: 44YO88 known as the Yorktown Shipwreck Archaeology Project and the excavation of the
Belle. Normally, cofferdams are impractical and expensive when excavating and documenting
underwater sites, as Langley mentioned concerning the Mulberry Landing Wharf; they do
provide some benefits when the conditions and expenses are met.
Archaeological projects have been accomplished successfully from cofferdams or other
permanent structures when a location is close to shore. Cofferdams are advantageous in
providing a structure to deploy equipment easily and maintain a headquarters as well as ensure
easy access to the archaeological site. There are many disadvantages. Cofferdams incur high
costs in their construction, maintenance, and removal. There is always the danger of
misinterpreting the archaeological site’s boundaries and thereby driving steel pilings through a
portion of the site. If archaeologists use the cofferdam to turn an underwater site into a terrestrial
site, there is the danger of exposing organic material to a new environment and new micro and
macro organisms that could potentially cause deterioration (Dean et. al. 2000:63).
An alternative to the cofferdam is the possibility of mooring unpowered barges or
pontoons over the site. This method does not provide the option of pumping the archaeological
site dry for excavations, but it does allow the same staging advantages as the cofferdam.
Platforms and cofferdams have the added benefit of maintaining lockable storage on site, cutting
time and man power in establishing and dismantling equipment after each workday. There are
several disadvantages to the barge/pontoon method. A cofferdam near shore generally has access
via a pier structure. A moored barge or pontoon still requires the use of a boat to gain shore
access. Creating secure moorings for anchoring the platform for long period can become
problematic, often making it necessary to establish emergency plans for safely navigating the

62
barges to a secure location during inclement weather. Cost is the main disadvantage of the
moored platform (Dean et. al. 2000:63-64).
In 1982, the Yorktown Shipwreck Archaeology Project (known as 44YO88 by Virginia’s
Department of Historical Resources) was the first to use of a cofferdam in the United States for
the documentation of the collier Betsy. The British military purposefully sunk the Betsy at the
Battle of Yorktown in the York River in 1781 by cutting a hole into the starboard side to prevent
a French assault from the river (Bass 2005:203, 205).
Archaeologists elected to construct a cofferdam around the Betsy because zero-visibility
conditions in the York River and strong currents and choppy waves hindered documentation
efforts. To fix these problems, archaeologists built the cofferdam out of steel pilings around the
site to eliminate currents and to filter the river water within the enclosure until visibility reached
upwards of 30 ft. (9.14 m.). The archaeologists proposed to keep water within the cofferdam
instead of pumping it out as per normal practices to prevent the ship timbers and artifacts from
accelerated decomposition when exposed to air. Workers constructed a pier between the shore
and the cofferdam to provide access for staff and archaeologists and public viewing. The
increased visibility allowed for a more efficient excavation and the added advantage of
photography to document the site (Bass 2005:202).
The Belle is the oldest French shipwreck discovered and excavated in the Western
Hemisphere. Led by Robert Cavelier, sieur de La Salle, Belle was the last of four ships on an
expedition to establish a settlement at near the mouth of the Mississippi River when it ran
aground in Montagorda Bay, Texas, in 1687. When archaeologists proposed excavating and
recovering the shipwreck, they decided to employ the use of a cofferdam to create a controlled,
dry environment (Bruseth and Turner 2005:48).

63
Construction for the cofferdam began in 1996 and cost $1.5 million. The cofferdam
contained a rectangular steel inner wall surrounding the shipwreck and an exterior steel oblong
octagonal wall driven 57 ft. (17.37 m.) into the bay floor and rising 5 ft. (1.52 m.) above the
water’s surface. Sand filled the space between the two walls to create an added barrier between
the shipwreck and the water. Workers also constructed a canopy over the shipwreck to protect
the archaeologists and the wreck from exposure (Bruseth and Turner 2005:48-49, 51).
The advantage to this construction was that archaeologists artificially created better
underwater visibility conditions and could recover artifacts from the bay floor with the same
precision as terrestrial excavators. Archaeologists recovered delicately preserved materials such
as brain matter from a man’s skull and insect parts that may not have been located if a
conventional low visibility underwater excavation had been carried out. Archaeologists could
also work during most inclement weather, as the cofferdam protected the site from all but the
worst storms (Bruseth and Turner 2005:48, 56).
There were many disadvantages to the use of the cofferdam. While the double steel walls
and sand barrier enabled the archaeologists to pump the well dry, water continued to seep into
the protected area requiring four pumps to maintain the relatively dry conditions. This required
one of two large diesel engines located on site to be running at all hours to provide electricity to
the pumps. Several times during storms the engines failed and caused several days’ delay in
excavations. The pumps almost continually clogged with sediment and required an entire crew to
work constantly to keep the pumps running. As archaeologists removed the sediment over the
shipwreck, they found it difficult not to stand on the fragile ship timbers. To remedy this
situation, the workers placed a network of aluminum and wooden boards around and across the
wreck to allow the workers to remain off the wreck while excavating. Bruseth and Turner note

64
that this caused uncomfortable positions for the archaeologists, as they were always reaching and
leaning downwards. To prevent the shipwreck and artifacts from damage due to changes in
environment, archaeologists rigged a pump system that channeled water through hoses into the
cofferdam to keep the fragile timber and artifacts wet. Another disadvantage was the site
location. Cofferdams are advantageous to archaeologists when used close to shore. The Belle
was located 15 mi. (24.14 km.) from shore and required a 1 hour and 15 minute boat ride to site.
This required all tools and supplies to be brought to the site beforehand, and unexpected
occurrences set the project back. The long distance made it difficult for the archaeologists to
reach the cofferdam during bad weather days. Budget constraints created several other
disadvantages. Operating and maintaining the cofferdam cost roughly $100,000 per month, and
several times the project found itself about to be shut down. The project heads originally hired
security guards to watch over the site at night but eventually discontinued this practice. To
alleviate these problems, archaeologists worked 12 hour days, 7 days a week and took over
security of the site once the hired security guards were let go (Bruseth and Turner 2005:48, 51,
54-56).
Designing the documentation of Mulberry Landing Wharf as a terrestrial site had both its
advantages and disadvantages. Because the project did not have a long duration of time as did
Bowling Farm Site and Redbanks Landing archaeological sites, Langley worked within the four
hour slot with mud dikes when tides were at their lowest. By protecting the site with a tarp,
archaeologists more easily cleared any debris the subsequent tides deposited over the site and
minimized extra work involved in clearing the site for the next excavation day. The tarp also
prevented the wooden wharf timbers from rapidly decaying as a result of sun exposure and drop
in moisture content causing cellular collapse and shrinkage. Archaeologists could also

65
meticulously excavate the wharf site similar to that of Belle as both were excavated in a
terrestrial environment. The disadvantages of this method included constrained working hours,
as a normal eight hour work day included two tidal changes and lowered work efficiency. This
created a longer project season (Langley 2000:342, 347).
Dendrochronology
Archaeologists conducted dendrochronoly on two wharf sites: Mulberry Landing Wharf
and Bowling Farm Site. Dendrochronology is a “chronometric dating method that can yield an
age by counting the rings of certain species of wood to determine when that wood grew” (Sutton
and Arkush 2002:359). The method is absolute and can produce precise dates to the year,
sometimes to the season the tree was felled. Climate conditions change a tree’s growth patterns
varying the tree ring width. Archaeologists use a skeleton plot compiled from numerous samples
of the same species to determine year and season of the archaeological sample (Dean 2000: 46-
46; Sutton and Arkush 2002:305).
Dendrochronology for Mulberry Landing Wharf proved successful in dating the latest
wharf timber to 1747. The wharf structure proved to be an excellent candidate for
dendrochronology analysis because of the presence of the bark layer on the frames’ interior and
exterior wharf faces. Susan Langley hired an expert dendrochronologist who removed 14 small
samples from various parts of the wharf structure. The analysis determined species, date of initial
construction, and differentiated periods of construction (Langley 2000:347).
Archaeologists at Bowling Farm Site took three wood samples for dendro analysis: two
samples from the shipwreck from a chock and a floor timber, and one sample from the cob-type
wharf structure. The team extracted 8 in. (20.32 cm.) of the end of the chock and floor timber
and a 1 in. (2.54 cm.) slice of wharf timber. Further research into dendrochronology of the

66
southern yellow pine of eastern North Carolina through NOAA, found that no dendrochronology
record exits. The closest sources were 100 mi. (160.93 km.) west of the Bowling Farm Site and
from trees in an entirely different environment (NOAA 2011).
Several factors should be taken into consideration for the tree-ring dating process. A
skeleton plot must exist for the species within the specific area of the archaeological tree sample.
Archaeologists cannot perform dendrochronology on certain trees of the complacent species such
as juniper because they do not produce a tree ring for every year (Sutton and Arkush 2002:305).
The analysis was a success for the dating of Mulberry Landing Wharf, but not for Bowling Farm
Site. The Program in Maritime Studies at East Carolina University has recently proposed the
possibility of creating a skeleton plot for the southern yellow pine since one does not currently
exist (pers. communication with Dr. Bradley A Rodgers, 02/03/2011). It is possible that in the
future, archaeologists will discover the exact year of the wharf construction at the Bowling Farm
Site.
Sedimentation Coring
Shirley Plantation Dock Complex is the only landing site where the investigators
conducted sediment studies by taking core samples of the river bed. This is usually a method
geologists use. Coring objectives are generally relevant to reconstructing site physiography and
identifying dates of buried strata through radio carbon, biological, or chemical analysis (Stein
1986:509). The purpose of the Shirley Plantation Dock Complex core sampling was to obtain
information regarding sedimentation buildup in the James River and discover the depth of water
at the wharf site during different periods of historical use. Coring is the best means to obtain
information relating to an underwater archaeological site’s vertical and horizontal horizons,
cultural and non-cultural deposit relations, and the sampling of subsurface sediment. A core is

67
defined as “a continuous section of sediment or rock obtained by using a hollow cylinder called a
corer or coring device” that is minimally disturbed (Stein 1986:505). As it is virtually impossible
to view river bed stratigraphy underwater, and especially in the low-visibility environments of
rivers where wharf sites are located, core sampling has provided archaeologists with an easy
effective solution. Cores collected at archaeological sites provide archaeologists with insights
into the site formation processes and underwater sediment stratigraphy (Horlings 2009:5).
Conclusion
Analysis of the archaeology methodologies of the seven colonial plantation wharf sites
suggests that archaeologists are aware and understand that wharves are part of the land-water
interface and thereby require both underwater and terrestrial survey documentation. Mepkin
Abbey Dock survey is the exception. The purpose of the Cooper River Survey was to “conduct a
preliminary assessment of these [salvage] operations and the salvage collections” (Harris, Moss,
and Naylor 1993:1). This exclusion of terrestrial operations was related to the jurisdiction of the
state underwater archaeology division of SCIAA (now the Maritime Research Division) of the
riverine bottomland and state mandate to oversee public stakeholders’ interests in submerged
cultural resources. The property adjacent to the wharf was owned by a Trappist Monastery and
does not fall within the management mission or jurisdiction of the state (Mepkin Abbey 2011).
Only Shirley Plantation Dock Complex and Cedar Grove Landing surveys followed Errante’s
theory that waterscape archaeology should contain comparable methodologies of both the
terrestrial and underwater components performing both a pre-disturbance survey of the terrestrial
and underwater components. Shirley Plantation researchers went a step further and employed
another science, geology, to gain a better understanding of the site composition.

68
Shallow water archaeological sites such as those found on the foreshore readily become
disturbed by natural forces such as storms and erosion and human exploits such as dredging and
salvaging. Growth in population and modern activities near rivers and shores have endangered
interface sites like plantation wharves and create a decline in the number of intact shallow water
archaeological sites. Agriculture and development create large silt deposits in rivers burying
archaeological sites making them difficult to spot, and the lack of CRM archaeology assessment
of the foreshore has created a large hole in archaeological research (Ruppé and Barstad
2002:105, 643). A lack of success in common survey methodology for site identification, remote
sensing, might be the reason why so few colonial plantation wharf sites have been studied. As
rivers tend to be low visibility environments, remote sensing is the quickest and easiest way to
survey a large area such as a river. A better understanding of the river environment by locating
and marking potential snags might enable remote sensing equipment to be towed closer to shore.
At present, an underwater survey similar to that conducted at Middleburg Landing remains the
best and most accurate survey method for the identification of interface sites.

CHAPTER 3
BRITISH MERCANTILISM AND THE COLONIAL SOUTH
After the American colonists overcame initial problems of surviving in the New World
environment, they expanded their efforts into commercial agriculture. British overseas market
demand meant economic growth for the colonies and pushed new colonists to seek fertile land
near water for transportation. While all thirteen American colonies exported a variety of
agricultural and raw materials, each southern colony (Figure 3.1) specialized in a main staple
export commodity. At the beginning of the eighteenth century, colonial economic activity
devoted to producing for an overseas market was large but declined over the century while still
remaining the majority of the output. Colonial development and the magnitude of trade with an
overseas market relied on the cost of production that differed geographically, in resources, the
continued exportation of colonial products and the colonists’ demand for imported goods.
Maryland and Virginia focused production of staple goods primarily with tobacco and later
wheat.
FIGURE 3.1. A 1755 depiction of the southern colonies. (Courtesy of Library of Congress,
Washington D.C.)

70
North Carolina’s main focus was naval stores and food stuffs, and South Carolina and
Georgia produced the main supply of rice and indigo. Overseas trade differed greatly in
amplifying a colony’s wealth by the late colonial period. Per capita values of exports were higher
in the southern colonies compared to their northern neighbors with the exception of North
Carolina. North Carolina had exceptionally low exports relative to its population and exported its
products mainly to other colonies instead of directly to England. North Carolina’s plantation
agriculture did not correlate with a large agricultural production since only 35 percent of the
labor forces in the late colonial period were slaves (Shepherd and Walton 1972:44-46). Overall,
however, the southern plantation of colonial America exemplified prosperity and success within
the British Atlantic trade network. While North Carolina lagged behind all other southern
colonies in wealth and social class, exports profits allowed colonists to purchase manufactured
goods from Great Britain and African slaves for the purpose of daily living, to further staple
production, and to demonstrate wealth and social status. The limited diversification of southern
colonial products left the south reliant on overseas markets for its success.
Periods of rapid settlement followed in areas where colonists discovered a marketable
product and easy access to an effective transportation network. Initial settlement always occurred
on high fertile land near water for easy transportation of goods to nearby distribution centers.
Further settlement developed farther inland on rivers leading to distribution centers and lastly
inland on less fertile land away from rivers requiring both land and water transportation raising
the costs of production and transportation. With the increase in settlement, the cost of fertile land
on a waterway close to a distribution center raised the cost of rent in comparison to fertile land
on a waterway located farther away from the distribution center. Land located away from
waterways, thereby needing costly road transportation, resulted in low rents but higher

71
production costs. The lack of an effective road system and cost efficient means of transport made
overland shipment expensive. Heavy goods such as tobacco, rice, indigo, fish, wheat, and lumber
found cheaper, easier, and faster movement to distribution centers and buyers by water;
therefore, geographical location influenced prosperity (Shepherd and Walton 1972:20, 25). The
market and the quality of goods produced, according to Shepherd and Walton, “was the main
force in determining what, where, and how goods were produced” (1972:9).
Great Britain was the largest overseas consumer of commodities produced in the
American colonies. The southern colonies dominated trade to Great Britain comprising 86
percent of the total value of goods exported to Britain with tobacco, bread, flour, rice, dried fish,
and indigo comprising 60 percent of total colonial exports (Shepherd and Walton 1972:96, 98).
Other major commodities shipped from the colonies to Great Britain included deerskins, naval
stores, whale oil, bar and pig iron, and potash. The colonies exported a substantial amount of
wood products to Great Britain, but their worth cannot be discerned due to the lack of
information on their value (Shepherd and Walton 1972:98).
Production within the southern colonies varied regionally. The southern colonies focused
on producing primary products and raw materials, exploiting the natural resources such as tar,
pitch, and turpentine from the long leaf pine, and rice, indigo, and tobacco. Sugar maintained the
most dynamic overseas market, but only the West Indies successfully cultivated the commodity
before mid-19th century. Tobacco (Figure 3.2) became the most important product of the
mainland colonies, most successful in the Chesapeake colonies, Virginia and Maryland, and
negligible success in the northeastern portion of North Carolina (Walton and Shepherd 1979:42).
Tobacco production increased over 300 times from the 119,000 pounds exported in 1620
to 36 million pounds by 1700 (Walton and Shepherd 1979:42). Colonial tobacco production in

72
the Chesapeake increased rapidly post 1640s. As the tobacco habit spread throughout Europe,
demand for the product grew. To meet the increased demand, colonists increased production and
the price of tobacco dropped. This drop in price opened tobacco use to lower social classes.
Eventually by the 1680s, the rate of new customers decreased (Clemens 1975a:256). The
decreased market coupled with low prices from a large production output resulted in smaller
profits for planters, but the market for tobacco still increased by the American Revolution,
expanding to over 100 million pounds annually. While the tobacco export increased considerably
over the course of the eighteenth century, it only tripled in size thus showing its growth was
slowing (Walton and Shepherd 1979:42-43).
As population in the tobacco producing colonies increased, so did the tobacco production
rate. The English market became extremely saturated with tobacco by 1660 resulting in
extremely low prices. Prices fell so low that lower qualities of tobacco entered the market as
farmers sought to increase their profit by increasing the volume sold. Eventually, colonial
authorities attempted to fix the problem by reducing the amount of tobacco produced,
standardizing the size of hogsheads, prohibiting farmers from shipping bulk tobacco, and
regulating the quality of tobacco exported (Middleton 1953:112-113).
73
FIGURE 3.2. A 1670 image of slaves working in tobacco sheds on a Virginia plantation.
(Courtesy of learnnc.org.)
Most tobacco cultivation throughout the seventeenth century occurred in the tidewater
region of the Chesapeake Bay along the navigable streams and estuaries, but by the close of the
eighteenth century, production slowed as colonial population increased and settled all quality
fertile land accessible to inexpensive water transportation. The increase of grain production
along Virginia’s Potomac, Rappahannock, York, and Roanoke rivers also explains the slowing
tobacco production, as farmers moved away from tobacco and toward a new commodity sought
after by the overseas market (Walton and Shepherd 1979:42-43). In Maryland, estate records and
tax lists in the 1680-1730 period saw the gap between the rich and poor widening. The tobacco-
saturated market created a decreased opportunity for small landowners and tenant farmers and
created difficulties for increasing a rich planter’s profits. Slave owners, consisting of one-tenth of
Maryland’s free white male population in 1733, received only 6-7 percent returns in their
tobacco cultivation. As a result, the landless whites left the Chesapeake Bay area for cheaper

74
land in the backcountry. High transportation costs forced the poor backcountry farmers to pull
away from the market economy and put more focus on self-sufficiency (Clemens 1975a:257).
The decreased profit from tobacco prompted Virginia and Maryland to embrace a mixed
tobacco-grain production. In Maryland’s eastern shore, at least one-fourth of export trade
consisted of corn and wheat by 1750s. Virginia’s Accomack and lower James River regions and
the northern portion of Maryland’s western shore experienced a parallel economy. Chesapeake
planters became dependant on southern European and West Indian grain markets as they had
previously been on England’s tobacco market (Clemens 1975a:258, 259). Tobacco continued to
dominate the export market into the later colonial period making up almost half of the total
commodity export value in 1750. By the end of the colonial period, tobacco fell to 25 percent of
the total commodity export value as other products such as rice and indigo grew in importance
(Walton and Shepherd 1979:42-43).
Date Range Percentage of
Tobacco Export Percentage of Rice Export
1697-1705 83% <1% 1766-1775 35% 24%
Table 3.1. Rise and decline of the importance of tobacco and rice as American colonial export commodities (Shepherd and Walton 1972:38).
As tobacco declined in importance as an export from its height at 83 percent of total
exported commodities between 1697 and 1705 to 35 percent between 1766 and 1775, rice
exports increased from less than 1 percent between 1697 and 1705 to 24 percent between 1766
and 1775 (Table 3.1; Shepherd and Walton 1972:38). South Carolina became the major producer
of rice exports. Prior to the 1720s, the South Carolina economy was largely naval store and cattle
based, similar to North Carolina. A 1724 bounty on naval stores requiring colonial tar and pitch
to be processed according to stricter regulations for better quality caused a movement away from
naval stores and toward the labor-intensive rice production (Edgar 1998:139). Early rice

75
cultivation occurred on upland dry land using rain to water the crops. Soon planters discovered
that cultivating the crop in marsh land yielded a larger crop, resulting in a shift in crop
cultivation to the coastal marshes, marshes along rivers, and land with manmade irrigation using
ponds or water reservoirs (Chaplin 1993:228).
Rice trade from South Carolina included England, Scotland, the West Indies, and
Southern Europe, and experienced three distinct growth periods between 1722 and 1774. The
first period 1722 to 1738 showed a rapid growth rate with the value of rice exports increasing at
the average rate of £7,046 per year and a compound rate of growth of 13.9 percent per year. The
second period covered the years 1739 to 1763. The value of rice exports during the second
period stagnated, experiencing rapid decreases and increases caused by two periods of war. The
average growth fell to £1,719 per year, an annual compound rate of 1.3 percent. The third period,
1764 to 1774, showed that export rice value grew rapidly, although it varied, with a value of
£9,099 per year and a compound rate of growth of over 3.6 percent per year (Greene, Brana-
Shute, and Sparks 2001:112).
Trade growth in the rice industry resulted from an increase in productivity and market
demands. Slave productivity played a major role in an increase of rice production. Productivity
remained flat from 1720 to 1750, grew by 13 percent in the 1750s, and grew again by 28 percent
in the 1760s.This productivity occurred by contributions made by slaves, not the overseers or
plantation owners. Rice had been cultivated in West Africa, and the plantation rice system placed
much of the responsibilities concerning the organization of work in the hands of slaves with
incentives to work efficiently (Greene, Brana-Shute, and Sparks 2001:116). A preference was
shown in purchasing slaves originating from the rice growing regions of the Windward Coast.
Many of these slaves knew the methods to clear swamps, build dikes, and use tides to irrigate

76
fields, while all knew how to plant rice so that the seeds did not float away when the fields
flooded. Harvesting and processing methods were also noted to be West African techniques
(Edgar 1998:140). The productivity post-1763 occurred as a result of shifting rice cultivation
from tidal areas to inland swamp. These changes increased production per slave by 50 percent in
the late 18th century (Figure 3.3; Edgar 1998:143; Greene, Brana-Shute, and Sparks 2001:116).
FIGURE 3.3. African-American Slaves Unloading Rice Barges in South Carolina ca. 1800.
(Image courtesy of North Wind Picture Archive.)
Rice experienced an increase in the overseas market in Europe and the West Indies that
also contributed to the rice industry’s growth in the later colonial period. The lower cost of rice
over other grains helped contribute to the rise in demand. From 1750 to 1770, rice in Amsterdam
cost less than wheat and rye. The growth in slave population increased the demand for rice. For
example, slaves in the West Indies consumed rice as a main food source. In the 1760s, the slave
population in the West Indies grew from 364,900 to 433,900 and continued to expand until it
reached 519,000 in 1790 (Greene, Brana-Shute, and Sparks 2001:116-117). Of the various raw
commodities exported from South Carolina, rice comprised of 55 percent, while indigo came in
second at 10 percent in 1748 (Conclanis 1989:80). North Carolina’s lower Cape Fear Valley near

77
the South Carolina border tried to capitalize on South Carolina’s rice export success. North
Carolina reached its pinnacle of success in 1771 when it exported 629 barrels of rice, only 4.8
percent of South Carolina’s export (Merrens 1964:126).
FIGURE 3.4. Stages of indigo processing in South Carolina in the eighteenth century. From "A map of the Parish of St. Stephen." (Image by Henry Mouzon, courtesy of Rare Book,
Manuscript, and Special Collections Library, Duke University, Durham, NC.)
Indigo was introduced into South Carolina in 1740s, as the War of Jenkins’s Ear (1739-
1743) erupted between Britain, France, and Spain, cutting out an overseas market for rice.
American colonists searched for a new staple crop to off-set the economic loss from price
reductions of rice and to turn a profit in an unstable market. The start of the War of Jenkins’s Ear
cut British suppliers from the French and Spanish colonies that exported indigo. Indigo became
an excellent crop to grow along side rice in South Carolina and Georgia (Chaplin 1993:192-195).
Indigo was planted in the spring, and because indigo needed little attention the first few
months, planters could focus on sowing rice. Indigo plants had two to three separate harvests, but
the main harvest with the best quality indigo occurred before the height of the rice harvest

78
(Figure 3.4). Inspectors struggled to maintain good quality indigo for export. Timing for
harvesting and the processing method was crucial. Colonists who took time to ensure good
quality indigo received little added profit for their efforts. Quality was sacrificed for quantity
(Chaplin 1993:192-195; Edgar 1998:149).
Indigo’s export value gained importance, as shown by Parliament granting an imperial
bounty of six pence per pound in 1749 around the end of King George’s War. Imperial bounties
encouraged continued production expansion until the American Revolution as shown by a 120
percent production increase over the 1750-1775 period. Under the imperial bounty, which
dropped to four pence per pound in 1764, the quantity and value of indigo increased from
466,201 pounds (at just more than two shillings per pound) in the years 1761-1770 to 795,074
pounds (at almost three shillings per pound) in 1771-1774 (Chaplin 1993:199-200). North
Carolina, mainly in the lower Cape Fear Valley bordering South Carolina, also attempted to
capitalize on South Carolina’s success in growing indigo, as it attempted with the Chesapeake’s
tobacco, but it only produced 0.16 percent of the amount produced by South Carolina and
Georgia. Virginia and Maryland also had minimal success in exporting indigo performing only
marginally better than North Carolina at 0.31 percent of South Carolina and Georgia’s total
indigo exports in 1772 at 777,000 pounds (Merrens 1964:127).
The naval stores and lumber industries were the fourth major export commodities from
colonial South. Motivation from England and the minimal labor required encouraged each
southern colony to produce some amount of naval stores. Only North Carolina, however,
produced naval stores and lumber as its main staple. England encouraged colonial America to
export naval stores and lumber to reduce its dependence on trade with the Baltic region. England
initially placed its support mainly with New England, but it was the South that took the lead and

79
produced most of the naval stores and lumber. The naval stores industry, however, was largely
ignored by colonists during the seventeenth century until Parliament provided incentive
(Middleton 1953:163).
With the War of Spanish Succession in progress, Parliament enacted the English Naval
Stores Act of 1705. The act proposed bounties of on tar, pitch, turpentine, hemp, masts, yards,
and bowsprits. With the enactment of the bill in 1705, the forest industry’s heyday began.
Producers received bounties of £6 per ton of hemp, £4 per ton of tar and pitch, £3 per ton of
turpentine, and £1 per ton of masts, yards, and bowsprits. In 1726 Britain discontinued the
bounty system. When it was restarted three years later, it was with smaller bounties causing
South Carolina to decrease its naval stores production. Bounties became £2 4s. per ton of tar, £1
per ton of pitch, and £1 10s. per ton of turpentine (Ekirch 1981:13). Between 1705 and 1718,
New England exported 86,411 barrels of naval stores to England compared to the 134,212
exported from the Carolinas. Again from 1730 to 1733, the Carolinas exported more than New
England by 26,322 barrels. The numbers are misleading, however. In 1720, Carolina agents
informed the Board of Trade that much of the naval stores New England exported were actually
re-exports from Carolina (Williams 1935:176). Figures 3.5 and 3.6 demonstrate the South’s
outperformance of New England in the naval stores industry with the Carolinas dominating all
others. New England exported more pitch and turpentine than both Virginia and Maryland
(Upper South) and the Carolinas (Lower South) from 1729-1730. Beginning 1730 to the
Revolution, the Lower South took over as leader of in pitch and tar exports. New England
outperformed the Upper and Lower South from 1729 to 1745. By the mid-eighteenth century, the
Lower South’s production drastically increased and New England’s output dwindled.

80
Figure 3.5. Pitch and Tar exported from America to Great Britain comparing New England, the
Upper South, and the Lower South (data for graph derived from Malone 1964:44).
Figure 3.6. Turpentine exported from America to Great Britain comparing New England, the
Upper South, and the Lower South (data for graph derived from Malone 1964:44).
While New England’s re-exportation of Carolina naval stores skewed the data, the
Carolinas still dominated the naval store industry when compared to Virginia, Maryland, and
New England. Of the Carolinas, North Carolina produced more, as naval stores trade remained
its primary export (Malone 1964:44).
0
2000
4000
6000
8000
10000
12000
14000
16000
New England
Maryland and Virginia
The Carolinas
Pitch and Tar (lasts) Exported to Great Britain
0
10,000
20,000
30,000
40,000
50,000
60,000
70,000
New England
Maryland and Virginia
The Carolinas
Turpentine (cwt) Exported to
Great Britain

81
William Tryon, governor of North Carolina from 1765-1771, wrote to the Board of Trade
on February 2, 1767, stating that while the bounty system for naval stores was beneficial, high
expenses prevented the colonists from turning a substantial profit (Saunders 1886:144). During
the mid 1700s, North Carolina exported many different types of goods with nearly every planter
producing some Indian corn. The back country produced most of the colony’s wheat export,
while the northeastern part of the colony produced the most tobacco. Other exported products
included dairy products, beeswax, deerskins, peas, beef, and pork. Forest products were one of
the main commodities exported from North Carolina, which produced 60 percent of all naval
stores exported to Great Britain or other colonies (Ekrich 1981:12). Chapter 4 delves further into
North Carolina’s naval store and lumber industry.
Colony Total Per Capita Per Colonist Maryland £398,00 1.96 2.87 Virginia £783,00 1.75 3.02 North Carolina £76,000 0.39 0.60 South Carolina £463,000 3.73 9.44 Georgia £75,000 3.12 5.88
TABLE 3.2. Average annual exports of British North American southern colonies 1768-1772 (Shepherd and Walton 1992:47).
Even with the dominance in the naval stores industry, North Carolina lacked a staple
agricultural commodity for export unlike the other southern colonies. Table 3.2 shows the wealth
distribution among the southern colonies, depicting the average annual exports from each
southern colonial between 1768 and 1772. North Carolina considerably lagged behind all other
southern colonies in terms of wealth in both per capita (total population including slaves) and per
colonist. South Carolina considerably dominated over the other southern colonies. Low
European population and the high value exports of rice and indigo enabled Georgia to have a
large per capita and per European. A large population and a low valued commodity export in
naval stores and lumber explained North Carolina’s dismal numbers coupled by its lack of good

82
harbors. Wealth could clearly be made in any of the southern colonies with the exception of
North Carolina (Shepherd and Walton 1992:47).
Shepherd and Walton defined economic growth as “increased output per capita”
(1992:7). There were three general sources of productivity change: technological change,
improved skills and abilities of labor, and improvements in society’s economic distribution. In
colonial America, and especially in the early colonial South, land could be purchased cheaply.
The vast acres of land that could be purchased in comparison to the short supply of immigrants
resulted in a labor shortage in the South. This was an inverse of England’s land to labor ratio
problem. There were far too many inhabitants in England than there was land to support them;
therefore, land became a prized commodity and labor could be acquired cheaply. Because of the
seemingly endless supply of land and the far too few laborers to work the soil, colonists farmed
around tree stumps and did little to fertilize their land resulting in nutrient depletion of the soil
(Shepherd and Walton 1972:7).
In the South, colonists initially relied on apprenticeship, indenture, and unskilled labor,
but continued labor shortages and labor intensive agriculture led to human capital. After 1680,
slavery replaced indentured servitude as the most common form of labor in the South (Perkins
1988:95). Initially, slaves were treated similarly to indentured servants. Slaveholders released the
African slaves after a normal term of service or received the opportunity to purchase their
freedom. During the last quarter of the 17th century, dependency shifted from indentured
servitude to slavery. Bacon’s Rebellion in 1676 resulted from tension between large landowners
with government ties and frontier landowners. The frontier gained support from discontented
lower class, namely current and former servants. Bacon’s Rebellion resulted in the movement
away from potentially rebellious servants to slavery, a more controllable and permanent labor

83
source. By 1660, free blacks, once treated similarly to white servants, had been deprived of
political and civil rights. Virginia in 1699 gave freed blacks six months to depart the colony, and
by 1705, slave codes recognized blacks as property (Perkins 1988:99-100).
FIGURE 3.7. Slaves working the fields shown clockwise from upper left: threshing mill;
main flood gates; reaping; the rice flooded; the rice bird; flood gate; ditching. Center, a rice field (Ward 1867:8).
The establishment of a large class of permanent slaves distinguishable by skin color was
one factor in the high extent of unity among all southern white social classes after 1680s. A
second factor resulted from economic improvement in England beginning in 1675 that reduced
the number of indentured contracts, but the continued expansion of the tobacco industry raised
the number of laborers necessary to maintain the fields. The call for more labor made the
establishment of slavery a viable alternative to indentured servitude. Slavery was also not a new
institution, having already been established in the Caribbean and other colonized areas of the
Western Hemisphere. Another additional benefit of slavery was the profit motive. The price of

84
permanent slaves with lower yearly upkeep was only two to three times higher than the cost of
indentured servants during this period, and slaves could be made to work longer and harder days
(Figure 3.7; Perkins 1988:100; Menard 2007:318-320).
Slaves became an economic investment to southern colonists, especially in South
Carolina where the slaves paid for themselves in 4 to 5 years’ time. In 1710, Thomas Nairne of
South Carolina recommended that that South Carolina colonists wishing for a respectable annual
return should invest £1,000 in swamp, 1,000 acres of good rice growing land, and 30 slaves for
labor. Walter Edgar (1998:140, 142) calculated that 80 percent of Nairne’s suggested investment
was in human capital. It was, therefore, in the planter’s interest to ensure his interest survived
and produced. Henry Laurens in 1763 sent his slaves, especially pregnant women, to neighboring
plantations or to Charleston plantations when there was a threat of a small pox breakout on
Mepkin Plantation (Hamer and Rogers 1972:205).
While slaves functioned mainly as field hands, they filled numerous other jobs such as
servants, carpenters, artisans, and notably sailors and pilots. In North Carolina, slaves employed
in maritime positions held a reputation for being the leading boatmen, pilots, and fishermen. The
tidewater regions of the southern colonies with their marshes and swamps were familiar
environments to slaves from West Africa. Christopher Gale in 1732 maintained a boat and two
slaves as rowers in Edenton to assist in the collection of customs at Port Roanoke. Governor
Thomas Tryon noted in 1766 that the dangerous piedmont rivers could only be navigated by a
knowledgeable and dexterous slave. The knowledge black slaves brought over to American
compounded their usefulness and enabled them to become more than unskilled laborers
(Cecelski 2001:4-5; Treasure and Comptroller Papers; Wood 1974:201).

85
Figure 3.8. Slave population as a percentage of total population of the total colony in 1750 (Historical Statistics of the U.S. 1970; Franklin 1988).
Georgia and South Carolina on average imported three times as many slaves as Virginia
and Maryland because of the laborious rice production (Shepherd and Walton 1972:39). During
the 1720s, South Carolina imported 8,817 slaves, of whom three-fourths arrived after rice
became the colony’s major commodity. In 1750, black slaves comprised a large percentage of
the South’s population. South Carolina and Virginia led in the percentage of slave population to
total population at 61 and 43 percent, respectively (Figure 3.8). By 1770, black slaves comprised
of over 20 percent of the American colonial workforce (Historical Statistics of the U.S. 1970;
Franklin 1988; Perkins 1988:98).
Slaves accounted for only one-sixth of North Carolina’s total population and were little
relied on for economic purposes. Ekrich theorized that North Carolina’s characteristic pioneer
economy prevented the colony from gaining the wealth similar to its southern counterparts.
North Carolina possessed scarce labor for the production of a strong agricultural product and
little capital for investment. Without capital, the farmers could not purchase the labor force
needed to produce a marketable commodity. This shortage of labor reinforced a dependence on
less profitable staples hindering North Carolina economic growth (Ekrich 1981:4, 14). The
0
10
20
30
40
50
60
70
Maryland Virginia North Carolina South Carolina Georgia
1750 Slave Population as a Percentage of the Total Colony Population
Slave Population Percentage

86
agriculture industry employed 85-90 percent of the labor force in the colonies resulting in the
lack of rapid technological advancement that comes with a developing manufacturing industry.
Population growth in the colonies prior to 1640 grew exponentially and became stable in its
growth rate from 1660 onwards (Shepherd and Walton 1972:31).
The lack of a significant labor force for agriculture hindered North Carolina’s prosperity
(Table 3.2). The colony possessed few indentured servants, and slaves did not become more
numerous until the end of the colonial period. Tax lists for 1755 representing 19 of the 22 North
Carolina counties have shown that blacks comprised of only 36.2 percent of taxable population
and less than 19.9 percent of the total population. Tax lists for 1767 for 22 of the 29 counties
showed that the black population rose to 44.1 percent of the taxable population and 25.7 percent
of the total population. Of the 16 coastal plains counties, the black population comprised a larger
percentage of the taxable population, 56.5 percent, and 32.6 percent of the total North Carolina
coastal plain population. In comparison, blacks comprised 42 percent of Virginia’s population
and 61 percent of South Carolina’s population in the late colonial period (Ekrich 1981: 10-11,
12). The abundance of labor and land relative to capital and the limited size of market stunted the
development of manufacturing industry in the colonies. The labor to land ratio in the colonies
raised wages and gave an advantage to the development of the agricultural industry in the
colonies (Shepherd and Walton 1972:23).
Capital derived from exports allowed the colonists to purchase manufactured items from
England. While a market for manufactured goods developed quickly in the colonies, England did
not encourage the development of a colonial manufacturing industry that would compete with its
exports. The lower cost of producing manufactured goods overseas than in the colonies, enable
the colonies, especially the South, to remain producers of staple goods and imported

87
manufactured goods through Britain. British imports varied considerably in category and
consisted of a high number of re-exported goods. The North American colonies imported linens
and woolens from Great Britain and Ireland as well as a variety of metal objects in brass, copper,
and iron such as nails, pots, pans, and tools. Other imports included glass, ceramics, gun powder,
shot, paper, silk, leather, pewter utensils, and drugs, while re-exports included tea, hemp,
German and Russian linens, spices, and drugs. The composition of imports the colonists bought
from Great Britain did not change drastically over the eighteenth century. Imports typically
included woolens, British and Irish linens, hardware, metal products, and re-exports from
England including tea, spices, drugs, and German linens. Imports into the American colonies
from the West Indies, southern Europe, and the Wine Islands were tropical foodstuffs that could
not be produced cheaply or at all in the colonies. The settlements imported salt and wine from
Southern Europe and coffee, cotton, molasses, rum, salt, muscavado sugar, and wine from the
West Indies (Shepherd and Walton 1972:20, 40, 102, 107; Treasurer’s and Comptroller’s Papers
1731-2010).
North Carolina possessed no real wealthy plantation class equal to the ranks of South
Carolina and Virginia. Less than 1 percent of all households owned more than 20 slaves. In
comparison, 6 percent of households in tidewater Virginia in the 1780s owned over 20 slaves. In
the 1780s in North Carolina, only 1.5 percent of adult white males owned 20 slaves or more.
North Carolina colonists owned a substantial amount of property for the comparatively few
slaves that they owned. Reasons for this trend include extensive agriculture, forestry industry,
and land speculation. Simply put, land was cheap in North Carolina. The close of the colonial
period saw an increase in North Carolina’s economic prosperity. Between 1740 and 1770 the
number of ships entering coastal ports annually rose from 153 to 473. Slaves became more

88
numerous, and the value of North Carolina exports rose from £8,000 in 1736 to £76,000 from
1768-1772 (Ekrich 1981:17, 23).
Decreased land value was a result of the lack of good ports in North Carolina. Much of
the land holdings remained as wilderness due to the swamps bordering the rivers and streams and
the lack of sufficient labor force. Seventy percent of Europeans in North Carolina who owned
land owned more than 100 acres (Ekrich 1981:25). The Quitrent lists were published in 1735
giving acreage of land holders for seven northeast North Carolina counties. The list showed that
land owners in each county were generally small to middling landowners. Bertie County was the
exception. Landholdings there were more substantial. The majority of landowners held over 250
acres with very few owning more than 1,000 acres. Only four landholders are known to have
owned more than 5,000 acres. In Perquimans County in 1720, 72 percent of all households
owned land signifying that land in North Carolina could be bought cheaply (Ekrich 1981:20).
North Carolina society across the colony was less stratified than its neighbors, Virginia
and South Carolina. North Carolina had many “husbandmen, yeomen and white laborers
scattered throughout the country” instead of “herds of negroes and tawny slaves” as stated by
Josiah Quincy, Jr. in 1773 (Ekrich 1981:28). Less than one-third of white males were landless
laborers or servants, but owning property did not ensure prosperity in North Carolina. Most
possessed few slaves and an uncultivated tract. The average planter did not possess many
furnished goods or luxury items. Dire poverty was rare, however, because of wide ownership of
land and North Carolina’s long growing season. The planters simply produced their own food.
William Byrd II stated that “provisions here are extremely cheap and extremely good, so that
people may live plentiful at a trifling expense” (Ekrich 1981:29). North Carolina colonists
maintained a self-contained life. People rarely concentrated in towns, settling instead in widely

89
scattered farms separated by large tracts of pine forests, swamps, and sandy plains (Ekrich
1981:29).
The leading North Carolina planters, merchants, and lawyers were not restricted to a
subsistence living. They represented new emerging elite. Most of the new elite class did not have
the ancestral history of the small preexisting wealthy class such as the Harveys and Pollocks who
could claim ancestral heritage dating back to the 17th century. The new elite class resulted from
rapid population growth and settled territory that characterized the mid-1700s from the opening
of the Tuscarora territory in 1718. A larger population created new opportunities for the creation
of an elevated status and position (Ekrich 1981:33).
Colonists in North Carolina elevated their status more easily than other colonists
primarily because there was not an established elite. Most of the wealthiest North Carolinian
colonists were first or second generation settlers. Many newcomers married into an established
family bringing their own wealth, elevating themselves within into the upper class. As a result of
a missing elite class, there was not the compact circle of interrelated elite families common to
Maryland, Virginia, South Carolina, and Georgia’s upper class. North Carolina’s society instead
created small pockets of family clans scattered throughout the state resulting in a less cohesive
elite leadership. Three other factors stalled the creation of a cohesive elite class. After the
Tuscarora Wars, there were few European-Native American conflicts except in the backcountry.
Slave population in North Carolina was small, engendering little fear of a slave uprising, and the
coastline, which hindered commerce, also protected North Carolina from external attacks such as
those during the American Revolution. North Carolina, therefore, became the temporary depot
for Virginia and stored supplies for areas as far north as Philadelphia (Ekrich 1981:37).

90
North Carolina had distinct social regions by the mid-eighteenth century creating a
diffusion of the upper class. In comparison, South Carolina revolved around the highly
centralized city-state of Charleston, and Virginia organized around a homogenous tidewater
gentry linked by kinship ties and common economic interests. North Carolina was divided into
two major districts: the North consisting of the Old Albemarle counties and the South centralized
around the lower Cape Fear. The Albemarle economy was geared toward tobacco, Indian corn,
shingles, staves, beef, and pork production, while the Cape Fear region produced naval stores,
sawed lumber, rice, and indigo. Trade from these regions was funneled through ports or overland
to Virginia or South Carolina. There were few ties connecting the two regions together such as
intermarriages or a regular mail service. Neither region had a common urban center, resulting in
the capital shifting back and forth between Edenton, Bath, New Bern, and Wilmington. It was
not until 1765 that the seat was firmly situated in New Bern (Ekrich 1981:38-39). Even with a
slowly emerging economy and elite social class, by the late colonial period many upper class
planters in North Carolina expressed their opinion that the luxury of Virginia and Maryland elite
caused a moral decline within their society. “Provincial prosperity was thought to breed
extravagance, spiritual apathy, and immorality” according to Ekrich (1981:47), a possible
expression of jealousy.
Southern plantation prosperity was directly linked to maintaining an ever increasing
market demand for a raw product, an environment suitable to sustain agriculture, an extensive
network of waterways extending inland from the ocean to allow for an economical means of
transportation, and, most importantly, a large inexpensive labor force. Without a large labor
force that Maryland, Virginia, South Carolina, and Georgia enjoyed, North Carolina relied on
producing raw materials such as naval stores that did not require as many workers. As a result,

91
North Carolina never benefited from a high revenue return from its products thus establishing a
loop of short capital that purchased less labor, which in turn constricted production. North
Carolina’s environment prevented large ships from entering ports thus limiting the quantity of
goods for export. Only the Cape Fear River Valley experienced large economic growth, and only
doing so by piggybacking on South Carolina’s success.

CHAPTER 4
THE VOYAGE OF THE JOANNAH
On Wednesday, March 2, 1768, the brigantine Joannah departed Edenton, North
Carolina, the center for Port Roanoke, and sailed up the Cashie River. As its journey progressed,
the vessel and its crew faced cold weather, a bout of snow, and the slow, difficult process
navigating up a narrow channel. It took the Joannah 20 days to travel roughly 40 mi. (64.37 km.)
to reach its final destination at the wharf belonging to William Gray (Logbook of the Joannah).
The Joannah took part in a large overseas trade network that involved Maine, the West Indies,
North Carolina, and England. By acquiring marketable naval stores, staves, and shingles, the
vessel participated in an emerging economy. The colony’s dangerous coast and shallow sounds,
the lack of high-value marketable goods, and a small population that inflated the currency and
the price of imported goods caused North Carolina to develop more slowly than other markets
(Combs 2003:1). Wharf construction was a crucial corollary to plantation prosperity,
highlighting the brigantine’s significance conducting business at a plantation wharf. Central
place theory (Christaller 1966) explained that vessels loaded their cargos at strategic locations
such as major commercial towns or government sanctioned landings and warehouses, but in the
case of North Carolina and the Joannah, without a strong central town, plantation landings
became the plantations’ chief economic link to the Atlantic trade network and for the region’s
economic development.
Walter Christaller developed central place theory in the 1930s explain why some towns
developed more rapidly than others. Scholars previously used Christaller’s work to elucidate
settlement patterns and archaeological sites (Crumley 1976; Dacey 1966; Kasakoff and Adams
1977; Smith 1979). Central places were settlements that provided services for surrounding

93
population in a hierarchal order. Low order settlements provided basic supplies, while high order
settlements provided specialized services and were surrounded by low order settlements.
Dispersed places were listed as agricultural areas, point bound settlements, and harbors. Rural
inhabitants gravitated to centers that offered and dispersed resources
(Christaller 1966:14, 16-17).
Order was the key component in central place theory. Christaller theorized that order is
necessary for thinking, imagination, and expression, but it was not the ruling factor.
Centralization existed as an intrinsic pattern of matter. The centralization of community life was
an expression of order and was shown in the form of public buildings such as city hall, church,
forum, and school. In economics, Christaller elucidated that a town’s principal function was to
operate as the mediation between local commerce and the outside world. Settlements became
central places by goods offered and services rendered. Trade was almost exclusively center-
oriented, with the peddler being the exception, as well as banking, handicraft industries,
administration, cultural and spiritual offerings, professional and business organizations,
transportation, and sanitation (Christaller 1966:16-17, 20).
Kathy Ann Southerly (2006:31) made the observation that water transportation and its
influence on the settlement process was the primary weakness of Christaller’s central place
theory, primarily because he labeled periphery places that did not fit into his model as dispersed
places. Dispersed places were “all those settlements which are bound to certain points of the
surface of the earth, i.e., bound at absolute points… for instance, bridges and fords, border or
custom places, and especially harbors” (Christaller 1966:16). Southerly concluded that
Christaller failed to account for these dispersed places as key economic components in a larger
transportation network for distribution of goods. He also failed to explain how central place

94
theory fit areas without strong commercial centers such as North Carolina where only
Wilmington could be constituted as a high order settlement (Southerly 2006:31). The Logbook of
the Joannah decisively shows that concerning plantation trade, individual plantation landings
had far greater significance in Atlantic trade networks than the small port of Edenton.
Harry Roy Merrens in Colonial North Carolina in the Eighteenth Century (1964:91-92)
used the logbook to illustrate the difficulties North Carolina experienced during the colonial
period in respect to trade. Merrens argued that the logbook confimed the narrow inlets and the
shallow sounds made trade with North Carolina ports difficult and time consuming. Joannah lost
time “because of the difficult job of loading a cargo from numerous landings, the hazards of
shallow water, and the necessity for lightering in a couple of places” (Merrens 1964:92). The
Chronicle, a magazine publication by the Bertie County Historical Association, published an
article in 1968 titled “Trade Life on the Cashie River.” The Chronicle published an excerpt of the
logbook beginning when Joannah entered the Albemarle Sound and ending with its departure
from there. The publication did not attempt to analyze the information, merely publishing it for
knowledge’s sake. Neither of the two publications stressed the significance of the logbook nor
extensively analyzed the information it contains.
The Journal of Brig Joannah, 1767-1768 is an invaluable source for examining trade
patterns and plantation landing use. The logbook depicts three voyages: two voyages made from
its home port Piscataqua, Maine, to the West Indies and back, and one from Piscataqua to the
West Indies, to North Carolina, and finally ending in London. After it completed its journey,
Joannah’s account ends with the crew transferred to the Grizzel to work for passage to America
sailing from London to Boston. The logbook has provided an enormous amount of detail
pertaining to navigation and the act of sailing (Figure 4.1). The vessel master documented knots,

95
courses, and wind direction every second hour, as well as overall distance traveled, latitude, and
longitude. For each day the master recorded the weather: clear skies, overcast, strong gales,
tumbling seas, sailing clouds, light breeze, and squarely winds. Other notations include
information about the breaching of water, pork, and bread barrels, and the establishment of food
allowances. The logbook describes the sighting of other vessels along the routes. If the vessels’
commanders spoke to one another, there was an entry of the port of origin and destination. A
large part of each day’s description noted changes in the rigging. A common entry proceeds as
follows:
This 24 Begins with Cloudy Weather This 24 hours begins with cloudy weather & Little Wind And Large Sea and little wind and large sea. At 4 Breeze a 8 P:m Under At 4 pm breeze, at 8 pm under Fore S & 2 Rff MS Lay too Under fore stay sail and double reefed main sail. Lay too under Fore S in a hard gale of Wind fore stay sail in a hard gale of wind. At 2 A:m Wore Head to Eastw:d At 2 am wore head to eastward. In the Morning a Violent Gale In the morning a violent gale Continues, Over cast Weather ~ continues, overcast weather. No Observ:a to Day No observation today.
(Logbook of the Joannah, 1767-1768. Duke University, Durham, NC.)
The most substantial information that enhances the plantation wharf study are the
descriptions of cargo, insights into the variability of the market, and the example of river trade in
the Cashie River in Bertie County, North Carolina. While the logbook did not directly mention
William Armistead or his wharf (Bowling Farm Site), it does provide insight into river trade and
the use of landings as central points in colonial Atlantic trade.

96
FIGURE 4.1. A page from the Logbook of the Joannah, 1767-1768. (Image by author; courtesy of Duke University, Durham, NC.)

97
FIGURE 4.2. North Carolina Ports and the regions they service (Merrens 1964:87).
Joannah conducted extensive trade on the Cashie River loading cargoes of naval stores
and lumber, while delivering rum. Many port records at the approximate time Joannah visited
the Cashie River have survived mostly intact during 1768-1772 and separate 1771-1774 records
kept under James Iredell, customs officer for Port Roanoke (Combs 2003:3). Joannah, however,
does not make an appearance in existing 1768 records.
The brigantine Joannah conducted trade at three individual landings: Gray’s Landing,
Blackman’s Landing, and Steele’s Landing. Joannah took aboard 165 barrels of pitch, 812
barrels of tar, 4 barrels of turpentine, 6300 staves, and 1500 shingles. Broken down, Joannah
collected most of the cargo at Gray’s Landing including all of the pitch, over half of the tar, all of
the turpentine, and just under half of the staves (Table 4.1).
Pitch Barrels Tar Barrels Staves Turpentine Barrels Shingles
165 812 6300 4 1500 TABLE 4.1. Cargo collected by the brigantine Joannah on the Cashie River.

98
North Carolina documented its commerce by dividing the colony into five districts: Port
Currituck, Port Roanoke, Port Bath, Port Beaufort, and Port Brunswick (Figure 4.2). The Cashie
River, and all other rivers connecting to the Albemarle Sound, fell into Port Roanoke district.
Each port maintained a customs office at a central location. Edenton, located at the mouth of the
Chowan River on the western end of the Albemarle Sound, served as the central location for all
cargo inspection and customs collection in Port Roanoke.
The late colonial period saw the biggest commercial boom for North Carolina ports.
Export trade in Port Roanoke, for example, increased from 3,479 barrels of naval stores in 1755
to 19,533 barrels in 1770 making a 550 percent increase over 15 years (Treasurer and
Comptroller’s Papers Port Roanoke 1682-1760; Merrens 1964:90-91). During 1768 when
Joannah traded on the Cashie River, Port Roanoke hit a record high.
North Carolina’s export trade focused mainly on coastal trade. Port Roanoke exports to
North American coastal ports comprised 38 percent of all trade in 1768-1772 and fell to 20
percent in 1771-1774. The West Indies came in second in export destination in 1768-1772 at 29
percent, and rose to become the highest export location at 34 percent in 1771-1774. During both
periods, Massachusetts grossed the highest number of exports from Port Roanoke, over one-third
of all exports to North American colonies during both periods. North Carolina’s North American
coastal trade suggested a strong economic link to Massachusetts ports. Export trade to Great
Britain and southern Europe remained steady during both periods with 22 percent to Great
Britain from 1768-1772 and 20 percent from 1771-1774. Southern Europe remained steady
during both periods at 11 percent. Items exported and their percentage varied between the port
districts with Port Brunswick leading North Carolina in exporting naval stores, indigo, and rice,
and Port Roanoke leading in tobacco, shingles, staves, and provisions (Combs 2003:13).

99
Ports 1768 1769 1770 1771 1772 Number
of barrels
% of N.C. total
Number of
barrels
% of N.C. total
Number of
barrels
% of N.C. total
Number of
barrels
% of N.C. total
Number of
barrels
% of N.C. total
Roanoke 21,702 17 22,254 20 19,533 19 21,682 17 15,538 24 Bath 11,078 9 6,080 5 6,736 7 13,104 10 11,316 18 Beaufort 31,652 25 31,221 28 23,276 23 29,118 23 27,082 42 Brunswick 63,265 49 53,524 47 52,425 51 63,223 50 10,379 16 Total 127,697 100 113,079 100 101,970 100 127,127 100 64,315 100
TABLE 4.2. Exports of Naval Stores from North Carolina (Merrens 1964:90-91).
The years 1768-1772 showed variability in North Carolina exports (Table 4.2). The naval
stores trade reached its peak in 1768 with a total of 127,697 barrels of naval stores exported. Port
Roanoke ranked third behind Port Brunswick and Port Beaufort. The naval stores trade slowed
the next two years, saw a revival in 1771, but decreased significantly in 1772 by almost 50
percent from the previous year. Each port’s contribution changed over the five years. Port
Brunswick maintained an average of 50 percent of all naval stores exported, except for 1772
when it suddenly dropped to producing only 16 percent, and Port Beaufort rose to 42 percent.
Port Roanoke averaged about 19 percent over the five year period and rose from third largest
producer to second in 1772. Port Brunswick is misrepresented by incomplete data; therefore, the
port’s role in the export trade was not properly reflected in the historical record
(Merrens 1964:88, 90-91).
Wood products such as shingles, boards, and staves comprised another important export
commodity in North Carolina. North Carolina exported 80 percent of its shingles to the West
Indies with the remainder exported to mainland colonies. The West Indies also received over 80
percent of North Carolina’s exported sawn lumber with the remainder sent to mainland colonies
and Great Britain. North Carolina shipped just under half of its staves to the West Indies with the
remainder exported to Great Britain, mainland colonies, and southern Europe in varying
quantities. Most sawn lumber, averaging 72 percent in the 1768-1772 period, came from Port
Brunswick. Port Roanoke exported a mere 5 percent, the second lowest producer in North

100
Carolina. Port Roanoke, however, was the highest exporter of both shingles and staves,
averaging 38 percent of all shingles and 57 percent of all barrel staves (Merrens 1964:94-96).
FIGURE 4.3. Coopers at work creating barrels. Painting by Sidney E. King
(Cotter and Hudson 1957:56). Merrens concluded in his study that affluent colonists concentrated in the lower Cape
Fear valley produced mainly sawn lumber. Lumber cost more to produce because saw mill
construction required capital upfront. While lumber required minimal labor to process, the
production of shingles and staves demanded time and effort to shape (Figure 4.3). Shingles and
staves were made out of rot resistant hardwoods such as white oak, post oak, and live oak. Oak
grew throughout the eastern region of North Carolina along the bottomland and swamps, mainly
in the Albemarle region. Although Port Brunswick’s wealth would have been able to support the
production of staves and shingles, it lacked abundance in appropriate trees
(Merrens 1964:100-106).

101
Naval stores and wood products’ importance rose over the course of the eighteenth
century. The slow rise in production resulted from the lack of market. Large scale production of
these commodities occurred once market demand increased enough to create a profit. Degrees of
specialization resulted from landholding and slave holding, size, nature of port facilities, wealth
available, and the locally available natural resources (Merrens 1964:106-107).
Planters shipped their cargoes from their landings to more centrally located landings for
Joannah to load. For example, 108 barrels of pitch and 66 barrels of tar were sent from the
“upper landing” down to Joannah at Gray’s Landing; 10 barrels of pitch came from Lewis’
Landing, and 24 barrels of tar came from Tar Landing. While Bertie County’s government seat,
Cashy, sat on the Cashie River upriver of Gray’s Landing, commercial business was not
centralized. At the time of Joannah’s arrival, the town leaders were in discussion about moving
the courthouse to the location of either Gray’s Landing or Blackman’s Landing (Clark 1096:248;
Logbook of the Joannah). As the discussion lengthened, Bertie County citizens continued to
petition to move the courthouse to a better location. The old Bertie County courthouse in Cashy
had not yet reached twenty years but was already experiencing considerable decay. The court
appointed a committee to scout promising sites for a new courthouse and town. The committee
returned with the verdict that William Gray’s landing best suited the county’s needs, but the act
to build “a Courthouse, Clerk’s Office, prison, pillory, and stocks” was not passed until 1773.
Even before the court ordered the construction of the courthouse, it initiated orders for road,
landing, bridge, and ferry construction. Eventually in 1772, the courthouse was built at Gray’s
Landing, and the town was called Windsor (Thompson 1967:11-12). The captain’s choice to
have the Joannah visit both Gray’s Landing and Blackman’s Landing on the Cashie River most
likely did not directly correspond with the court’s discussion of a town being built at either of

102
those two landing’s. Instead, it was most likely that the county’s leaders noted the river
accessibility of the two locations as large tonnage vessels like Joannah could safely make their
way upriver. In this respect commerce could grow and develop at a central location. Without that
central location, individual plantation landings continued to be significant.
It was common in the colonial South for business to be conducted at plantation landings
instead of city centers. Even with the town of Cashy close to ending in 1768, Joannah could
have filled its hold at Edenton where warehouses existed. The same could have taken place at
Jamestown or Williamsburg on the James River, Virginia. Edward Hill II of Shirley Plantation
served as custom’s officer for the Upper James River District at his plantation from 1698-1700
(List of captains and ships for six district ports in Virginia, 1698-1707). The Burgesses tried to
pass a law to construct a warehouse at City Point/Bermuda Hundred in 1659, but plantation
owners did not support the notion. They preferred to continue conducting business and trade at
their own plantations (McCartney 1997: 59-61).
Imports into Port Roanoke during the period 1768-1772 followed the same hierarchy of
origin as export destination. Most imports originated from the 13 colonies (51 percent) with 29
percent arriving from Massachusetts (Combs 2003:12-13). Port Roanoke received 27 percent of
its imports from the West Indies, 15 percent from Great Britain, and 6 percent from Southern
Europe; little changed during 1771-1774. Coastal Imports from coastal ports decreased by 3
percent but still remained the largest importer. The West Indies increased by 2 percent with half
of the imports coming from Antigua and Jamaica. Great Britain increased by 1 percent and
Southern Europe decreased by 1 percent. The relatively little change of imports’ origination
demonstrated that over a seven year period imported characteristics did not vary significantly.
Imported goods were typically manufactured items not produced in the colonies and imported to

103
all 13 American colonies. British textiles and manufactured items such as glassware and
ceramics made up the highest percentage, followed by molasses, sugar, and rum from the West
Indies, tea from Great Britain, and wine from Southern Europe. Colonists also imported other
specialty items such as nutmeg, cloves, mustard, cinnamon, raisins, and chocolate (Combs
2003:7-8, 12-13). Joannah imported only rum into North Carolina, which was delivered to a
captain of a schooner.
Merrens argued that traders avoided North Carolina because of the dangerous waterways
and extensive time it took to collect cargo. In January 1768, Joannah departed the West Indies
and headed for North Carolina to pick of a cargo before continuing for England. By February 25,
the ship’s captain reports sighting Cape Hatteras. The brig then had to be piloted through
Ocracoke Inlet, and the shallow Pamlico and Albemarle sounds prevented the Joannah from
reaching Edenton Bay until March 1st. The following day, Joannah began the process of
navigating up the Cashie River, stopping at different landings to pick up naval stores and barrel
staves for its cargo. It took two months until the Joannah arrived back in Edenton with a full
cargo on April 30 and another week to sail from Edenton on its voyage to England, but the brig
did not successfully navigate through the Outer Banks until May 17th. The voyage to England
took 6 weeks, one month less than the time it spent collecting cargo (Merrens 1964: 91-92).
North Carolina has more than 300 mi. (482.80 km.) of coastline. Most of the coast is
comprised of long, thin, sandy islands formed from wind pushing sand into dunes creating the
Outer Banks. Between the islands are narrow inlets that have opened and closed over time from
which vessels pass through to reach the interior sounds and waterways. Ocracoke Inlet was the
largest and safest channel capable of allowing larger ocean going vessels and ships to enter
North Carolina inland waters. At low tide water the depth was 13 ft. A 1795 description of the

104
inlet mentioned perilous shoals that vessels had to navigate through safely. After safely
navigating the inlet, vessels had to pass through a channel deemed “the Swash” with only 8.5 to
9 ft. depth. Most vessels of any burden had to discharge all cargo into several smaller vessels
called lighters when crossing the Swash or navigating through the waters of the sounds
(Crittenden 1936:1-2, 4-5).
The Cashie River is part of the Albemarle-Pamlico estuary in North Carolina. Figure 1
shows the estuary consisting of six different sounds, the Albemarle and Pamlico being the
largest, ten major rivers, and numerous creeks. The estuary drains more than 30,000 sq. mi. in
southern Virginia and eastern North Carolina. Feeder rivers, streams, and creeks flow south and
east from the mountains, foothills, and farmlands into the ten major rivers and finally the
sounds. The sounds cover more than two million acres of drowned coastal land, an event that
occurred more than 13,000 years ago. The sounds themselves are relatively shallow being no
more than 26 ft. (7.9 m.) in depth and only two feet in other areas (Turnis 1989:7-8). For
example, the base of the Cashie River, as shown in Figure 2, has a depth of 33 ft. (10.06 m.),
while many portions of Bachelor’s Bay leading to the Cashie River ranges from 5 to 31 ft. (from
1.5 to 9.45 m.; Figure 4.4).
The Albemarle did not contain deep-water facilities and thus was unfavorable to large
ships. A Frenchman who traveled the colonies in 1765 noted that the port town of Edenton had a
dozen vessels in port of which he identified brigs, sloops, and schooners carrying grains such as
wheat and corn and naval stores such as pitch, tar, and turpentine. The Outer Banks, the
Frenchman claimed, hurt the settlers on the Albemarle rivers. Many North Carolina colonists
thus sent their goods to ports outside of North Carolina such as Charleston, South Carolina, or

105
FIGURE 4.4. 1918 map of the Cashie and Roanoke Rivers convergence with the Albemarle Sound. (Courtesy of the Library of Congress, Washington, D.C.)
Petersburg, Virginia. There, farmers received better prices for their goods than in Albemarle
ports (unknown, American Historical Review 1921:738). Small vessels mainly traded at Edenton,
Albemarle’s main port, but they also sailed up the main rivers, because the rivers matched the
sound in depth (Merrens 1964:91). These vessels include rowboats, canoes, and periaugers for
shallow creeks, streams, and rivers, while the sloops, schooners, and brigs carried commerce in
and out of the Albemarle Sound to other ports along the American coast and to England (Clonts
1926:17). During North Carolina’s proprietary period, 1663-1729, rowboats, canoes, and
periaugers were the most commonly used watercraft for travel and transportation in the
Albemarle region. Rowboats plied in shallow streams and calm water (Clonts 1926:17, 20).
Dugout canoes were the most versatile craft in the North Carolina, hewn from cypress, and
carrying one to two passengers (Watson 1996:105). Cheap and easy to construct, canoes reached
Bachelor’s Bay
Albemarle Sound
Cashie River
Roanoke River

106
20 ft. in length. Because of their limited carrying capacity, colonists used other, larger vessel
forms (Fleetwood 1995: 42-43).
In addition to canoes, North Carolina colonists used periaugers for plantation
transportation. Periaugers were modified dugouts formed from of one or two cypress logs to
which colonists added strakes for stability and increased seaboard. The vessels possessed two
masts and could be rowed or sailed. Late 17th and early-18th-century periaugers had an average
carrying capacity of seven to fifteen tons (Fleetwood 1995: 29, 40; Perquimans County
Restoration Association 2010).
Vessels constructed at a plantation were distinguished by their crudely hewn, unfinished
timbers. Long and narrow beamed schooners were the best vessel types for upriver trading, and it
was not unusual for colonists to adapt barges for sail to serve the open marshes of tidal rivers.
The average schooner size according to a survey of the South Carolina Gazette advertisements
between 1753 and 1763 had a keel length from 40 to 45 ft. (12.2 to 13.7 m.), a beam measured to
be 20 to 25 percent of the keel length, a draft of roughly 5 to 6 ft., and an average of 20 to 25
tons burden (Crittenden 1931:2; Pecorelli 2003:91, 104). By the end of the 18th century, the
increase in need for cargo transport caused schooners to increase in size and proportion
(Fleetwood 1995:49).
Not always were the plantation schooners roughly made and small. Plantation schooners in the
Carolinas during the colonial period made numerous trips to Bermuda, the West Indies, and the
northern colonies (Treasure and Comptroller Papers). These schooners were decked and painted,
contained figureheads on the bowsprit, decked, and on average carried a crew of one master and
four slaves. Carpenters and shipwrights did not use construction plans to build a schooner or
sloop but instead relied on time honored rules of thumb and personal experience in the craft

107
(Fleetwood 1995:53, 55). The average vessel tonnage employed in the western Atlantic and the
West Indies increased very little before the American Revolution, and overall vessel size did not
change significantly. Colonial America had numerous small and scattered markets that offset the
labor saving benefits of using large trading vessels. There was a greater probability that a larger
vessel would be underutilized leading to longer in port times and subsequent port fees. The
average miles a vessel traveled per ton were less for small vessels and increased as the vessel
size grew. This meant that small vessels spent less time in ports filling their holds than large
vessels (Shepherd and Walton 1972:75-76). Transatlantic trade within the Albemarle was
generally too hazardous for many of the larger ships to take the risk of grounding the vessel in
the Albemarle Sound or in one of the many rivers (Alliance for Progress 1980:6).
The lack of serviceable roads, bridges, and ferries made water as a means of
transportation extremely important. Bertie County was no exception. Before the creation of
Bertie County, a bridge had been constructed over the Cashie River but few roads led to it. Bertie
County Court made its first public order for road construction to the Cashie Bridge in 1732
connecting the bridge with Colonel West’s plantation. Many more roads such as these soon
began construction. A sketch map of the road system in 1877 showed the few roads proposed
and eventually constructed throughout the colonial period. Roads connected landings on the
Cashie and Roanoke rivers with the main Cashie Road and to connect roads to each other.
Colonists located near the proposed road, bridge, or landing supplied workers to construct and
maintain these structures (Huan 1976:35, 46-47, 75, 79). Thomas Whitmell, for example,
received job to construct a second bridge over the Cashie River in 1770, and the court wrote out
the exact measurements of the construction material and mandated his workers and slaves to
build it (Huan 1978:95). Only one bridge over the Cashie River before the 1770 court order

108
would have caused delays for foot and wheeled traffic if not the ferries that carried passengers,
carts, and animals across the river.
The familiarity of the market and currency exchange caused merchants to send their ships
where they regularly traded. Because it was easy to misread unfamiliar markets, communication
between the merchant and the factor was important to minimize risk and possible loss. Shipping
cargo in round trips from home port to destination and its return to home port reduced the
amount of time spent in foreign ports thus lowering port costs. Ship masters had the difficult job
of finding the best ports for commodities, which at times required them to visit more than one
port. Poor harvest, currency exchange rate, and communications compounded difficulties in
making a profit (Shepherd and Walton 1972:53).
The average time spent in a port fell over the colonial period with the exception of
Boston. In the Chesapeake and in Barbados, vessels spent twice as long in ports between 1694-
1701 than they did between 1762-1768. Shepherd and Walton theorize that the introduction of
Scottish traders in 1707 made the tobacco trade more efficient by cutting time bartering and the
ship’s time in port (Shepherd and Walton 1972:80). Joannah spent most of its port time in the
West Indies and its home port of Piscataqua, Maine. Table 4.3 illustrates this showing a log book
entry from Joannah which spent eighty-two days in Maine and seventy-three days in the West
Indies.
Voyage Length of Time in Port (days) ME-Granada 73 Granada-ME 43 ME-Nevis 17 Nevis-ME 82 ME-Barbados 21 Barbados-NC 38 NC-London 15+
TABLE 4.3. Length the Joannah’s of port stays. The bolded port corresponds to the time spent. (Logbook of the Joannah; courtesy of Duke University, Durham, NC.)

109
Voyage Length of Voyage (days) ME-Granada 38 Granada-ME 29 ME-Nevis 32 Nevis-ME 18 ME-Barbados 33 Barbados-NC 51 NC-London 74
TABLE 4.4. Length of the Joannah’s sea voyages. (Logbook of the Joannah; courtesy of Duke University, Durham, NC.)
The length of time increased as the brig waited for its next shipment in the homeport
while also searching for a port to trade cargo in the West Indies (Table 4.4). Time in port
diminished when there was an immediate selling and lading of cargo. The Joannah’s records,
therefore, do not necessarily favor the West Indies over North Carolina in terms of length in port.
The port time for three West Indian visits only averages one day less than a port stay in North
Carolina (Logbook of Joannah).The colonial North Carolina shipping records show that the bulk
of all shipping participated mainly in intercoastal trade with other English colonies from New
England to the West Indies (Treasure and Comptroller Papers, North Carolina State Archives).
British owned shipping dominated routes between Britain and the southern colonies and
Britain and the West Indies. Colonial owned shipping outnumbered British owned shipping in
coastal trade and routes between colonies and overseas areas other than the British Isles. A single
agent generally undertook marketing and shipping, which were not seen as separate operations.
Merchant owners shipped their goods in their own vessels. Other traders dispatched goods to
designated ports paying for the freight directly to the owner. In other cases a group of merchants
chartered a vessel in whole or part and paid a monthly fee for the space in the vessel rather than
the quantity of cargo and the length of voyage (Shepherd and Walton 1972:51).
While North Carolina became the fourth most populated colony in British North America
due to a population boom in the 18th century, shortages in capital, labor, and a marketable cash

110
crop made it the least productive colony in the South. The major limitations specifically to North
Carolina trade were its protective coastline and sandbars, and lack of a labor population (Ekirch
1981:3). Bad ports developed overland trade with Virginia and South Carolina where the ports
were more easily accessible to ships. Backcountry planters sent their crops via overland routes to
Petersburg, Virginia, or the Peedee River in South Carolina for sale. North Carolina exported
only about half of its production through its own ports. Consequences were severe. Lack of a
large export commodity and good ports stunted coastal town growth with towns remaining small
through the mid-18th century. The mid-18th century populations of Edenton, New Bern, and
Wilmington remained fewer than 1,500 at the start of the American Revolution. High overland
freight prices, markup of imported goods, trade duties, and currency restrictions caused a rise in
cost and served as another consequence (Ekrich 1981:16).
The difficulties of navigating the Outer Banks inlets, sounds, and rivers were not new to
the colonial traders. The Joannah’s voyage is a testament that similar trade must have taken
place for the region to continue to thrive and expand; however, it is known that New England
dominated trade to North Carolina occurring within the Albemarle Sound during the early
eighteenth century with at least half of the trade originating from Massachusetts. By trading
within the colonies, the Albemarle Sound trade reinforced and diversified its goods and retained
its small-scale production (Alliance for Progress 1980:6).
Joannah’s logbook is the only surviving source of its kind that specifically relates to the
maritime commercial endeavors of the farmers and plantation owners who utilized the Cashie
River as a means to participate in the Atlantic trade network. Information provided within its
pages allowed insight into the difficulties faced by farmers such as William Armistead of
Armistead Plantation, now Bowling Farm. Without a strong commercial center nearby as

111
dictated in Christaller’s central place theory, plantation wharves became central to the
continuation of the exchange of goods and the making of profit.

CHAPTER 5
PLANTATION HISTORY AND WHARF DESCRIPTIONS
Introduction
Waterscape development during the colonial period evolved from the lack of good and
convenient roads. Wharves, jetties, docks, piers, and landing sites were transfer points from
which cargo, people, and information moved from land to sea and back again highlighting the
significance of water travel and a plantation’s access to this transportation network (Errante
1993:82; Staniforth and Nash 2006:95). This chapter defines the different types of transfer
points found on the seven colonial plantation sites analyzed and provides a general description of
the history of each plantation focusing on ownership, social standing, and wealth. The
comparative analysis attempted to combine historical and archaeological information to answer
whether or not the wealth of the plantation was reflected in the complexity and expansiveness of
wharf construction. Unfortunately the low number of documented plantation wharf sites
prevented a thorough comparison.
Waterscape Infrastructure
Waterscape infrastructure sites on colonial plantations developed from a plantation’s
necessity to access commercial centers in the colonies and overseas. Wharves, jetties, piers, and
docks provided economic links to the market for plantations. In modern terms, the definitions of
these constructions used in waterscape infrastructure are interchangeable; however, each has a
specific meaning. William Falconer in 1769 published the Universal Dictionary of the Marine.
By using this dictionary, the waterscape structures can be categorized in the colonists’
terminology. Falconer defines the various types of waterscape infrastructure studied in this

113
thesis. Wharves are defined as “a perpendicular building of wood or stone raised on the shore of
a road or harbour, for the convenience of lading or discharging a vessel by means of cranes,
tackles, capsterns, &c. A wharf is built stronger or lighter, in proportion to the effort of the tide
or sea which it is to resist, and to the weight which it is intended to support” (Falconer
1769:1495). Wharves could have a jetty or jetty-head attached. A jetty or jetty-head was defined
by Falconer was “a name usually given, in the royal dock-yards, to that part of a wharf which
projects beyond the rest; but more particularly the front of a wharf, whose side forms one of the
cheeks of a dry or wet dock” (Falconer 1769:742).
Heintzelman categorized wharf construction into timber, timber and stone, and stone. The
crib wharf was a common wharf style. Colonists formed the crib wharf by anchoring either rough
or cut timbers called “stretchers” into the shore and running them out into the river and another
timber, “header”, placed over the stretchers on the ends of the stretchers. A crib wharf commonly
possessed a floor built of planks or smaller logs. Sand, silt, cobbles, ballast, tree debris, and
refuse commonly filled the wharf. There were two types of crib wharves: the cobb-type wharf
(Figure 5.1) and the solid crib-type wharf (Figure 5.2).
FIGURE 5.1. Conjectural drawing of the Douglass wharf, New London, Connecticut, as an
example of a cobb-type wharf (Heintzelman 1985:11).

114
FIGURE 5.2 . Solid Crib-Type Wharf with A. stretchers dovetailed into headers; B. posts;
C. sod; D. mud and layer brush fill; E. earth fill to cover surface; F. fender piles (Heintzelman 1985:9).
The cobb-type wharf (Figure 5.1) timbers were uncut with the tree bark either still present or
removed, while the solid crib-type wharf (Figure 5.2) had cut timbers laid flat against each other.
A timber and stone wharf was a solid crib-type or cob-type wharf with a stone wall in between
two columns of stretchers (Figure 5.3).
FIGURE 5.3. Timber and Stone Wharf with A. lofting timbers for bollards; B. fender piles; C.
Stone; D. Timber platform; E. ballast fill; F. clay, sod, and mud fill; G. gravel surface layer (Heitzelman 1985:12)
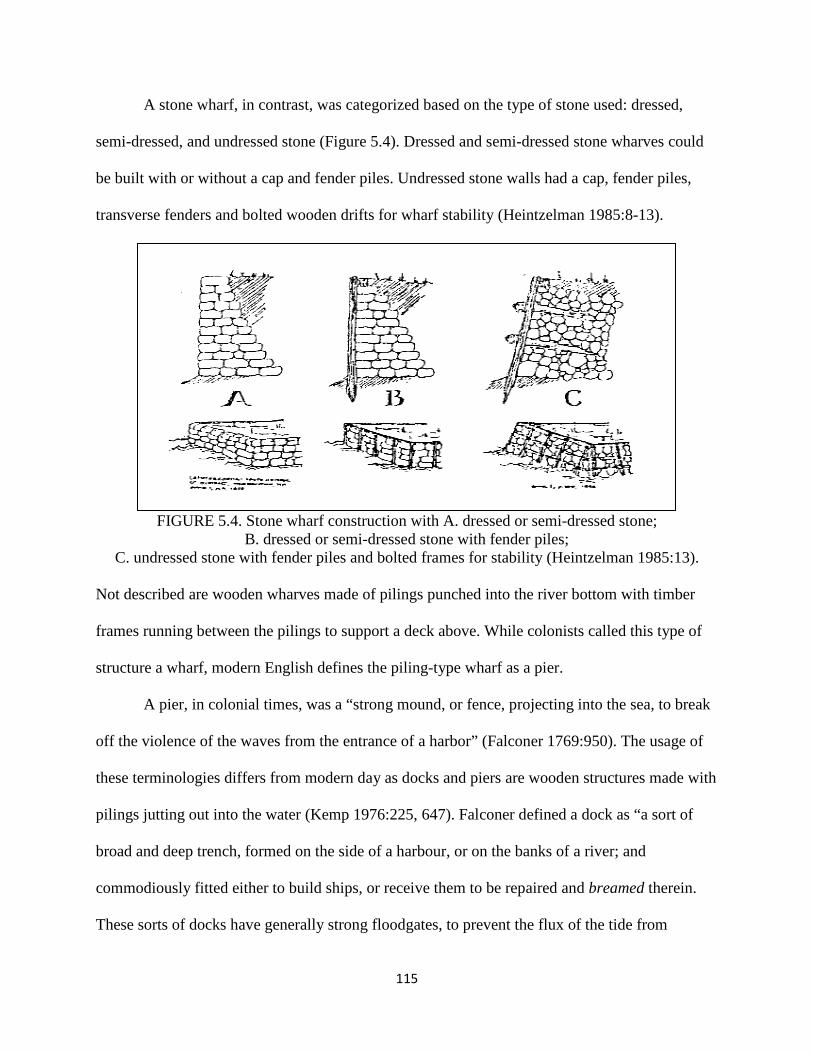
115
A stone wharf, in contrast, was categorized based on the type of stone used: dressed,
semi-dressed, and undressed stone (Figure 5.4). Dressed and semi-dressed stone wharves could
be built with or without a cap and fender piles. Undressed stone walls had a cap, fender piles,
transverse fenders and bolted wooden drifts for wharf stability (Heintzelman 1985:8-13).
FIGURE 5.4. Stone wharf construction with A. dressed or semi-dressed stone;
B. dressed or semi-dressed stone with fender piles; C. undressed stone with fender piles and bolted frames for stability (Heintzelman 1985:13).
Not described are wooden wharves made of pilings punched into the river bottom with timber
frames running between the pilings to support a deck above. While colonists called this type of
structure a wharf, modern English defines the piling-type wharf as a pier.
A pier, in colonial times, was a “strong mound, or fence, projecting into the sea, to break
off the violence of the waves from the entrance of a harbor” (Falconer 1769:950). The usage of
these terminologies differs from modern day as docks and piers are wooden structures made with
pilings jutting out into the water (Kemp 1976:225, 647). Falconer defined a dock as “a sort of
broad and deep trench, formed on the side of a harbour, or on the banks of a river; and
commodiously fitted either to build ships, or receive them to be repaired and breamed therein.
These sorts of docks have generally strong floodgates, to prevent the flux of the tide from

116
entering the dock while the ship is under repair” (Falconer 1769:434). The modern definition of a
dock is the same as Falconer’s 1769 definition, but it is also used in a similar way as the modern
definition of pier. In this regard, the colonists called all their landing structures for vessels at the
plantation "wharves.” regardless of their construction methods.
Bowling Farm Site
Archaeological excavations occurred at Bowling Farm Site in September and October
2009. The purpose was to determine and document the extent of archaeological remains found
by the property owners Bob and Becky Bowling. The site was located in Bertie County, North
Carolina, in the Cashie River.
Plantation History
Bowling Farm's plantation history begins around 1715 when the Cashie River was
opened to European settlers after the Tuscarora were moved to a reservation on the Roanoke
River, now known as Indian Woods. Much of the earliest records pertaining to the land’s
occupation are lost or never existed. The land was surveyed into 100-400 acre parcels with much
of the pocosin ignored. The original survey map or transcription of the area no longer exists, but
Edward Smithwick Sr surveyed at least a portion of the property before the sale of 400 acres
adjacent to the Cashie River in 1715 (Chowan County Deed Book B1:209). The properties
eventually were brought together under William Armistead Sr. beginning in 1759 (Bertie County
Deed Book I:451). William Armistead migrated from Virginia and settled in Bertie County in
1759. He married Sarah Jordan, the daughter of Joseph and Ruth Jordan, who previously owned
the 295 acres her husband purchased on the Cashie River in 1759. He continued purchasing land
surrounding his original plot including 124 acres from Joseph Griffin in 1765 and 20 acres

117
upriver from his landing situated in a small cove (Bertie County Deed Books K:458; L:199). He
also received two land grants from Bertie County for 120 acres in 1790 and 100 acres in 1791
(Bertie Co. land Entries 1783-1794: 71, 74). William Armistead Sr. died in 1791 and left his
property now consisting of roughly 750 acres to his two youngest sons, Jordan and Stark
Armistead, with the contingency that his wife, Sarah, would occupy the property until her death
(Bertie County Will Book D:173-176).
Jordan Armistead sold his share of the Armistead property to his mother in 1797, who in
turn sold it to Stark in 1804 (Bertie County Deed Book R:389; T:70). Sarah Armistead died in
1818, and immediately Stark sold the property out of the family to William Maer (Bertie County
Deed Book Y:330-331). The property then quickly passed through many hands. Maer sold the
property that same year to Edmond Fleetwood who two years later sold it to William Sparkman.
During this sale the property increased from 750 acres to 777 acres (Bertie County Deed Book
Y:316-317; Z:167). Sparkman sold the property four months later to William Blanchard. The
size of the property decreased to 752 acres (Bertie County Deed Book Z:336). William
Blanchard remained on the property for ten years. Currently, the main road leading to Bowling
Farm is named Blanchard Road, and until 1884, the property retained the Blanchard name. In
1830 Blanchard sold the property to Thomas Spelling and included 750 acres of the original
Armistead Plantation and 45 and 2/3 acres of an adjacent property (Bertie County Deed Book
CC:154).
Thomas Speller sold the 750 acres plus the added 45 and 2/3 acres (but described as 49
and 2/3) to Peter Rascoe, still calling the property “Armistead Plantation” (Bertie County Deed
Book CC:835). Rascoe died in 1844 and stated in his will that he would loan the property to his
daughter Martha for her natural life (Bertie County Will Book G:360). Martha and her new

118
husband, John G. Roulhac, sold the Armistead property to Thomas Bond in 1846 when they
moved to Florida (Bertie County Deed Book GG:561). Unfortunately, there is a missing deed
between Thomas Bond and the next known property owner, William Moring. Thomas Bond died
in 1854 and left the property to his son James Bond (Bertie County Will Book H:6-7). James
sold the 750 acre property plus additional unknown plots to William Morring in the Court Spring
Term of 1857. When William Morring died in 1871, he willed his property to be sold off and the
money given to his heirs, but to sell the property, the lost deed had to be rewritten and signed by
Morring’s administrators and James Bond (Bertie County Deed Book OO:475). The property,
now 1406 acres, was eventually sold to William Peebles in 1882 who, seven months later, sold
the property to Thomas G. Tarkenton (Bertie County Deed Book YY:201). Robert Bowling, the
current property owner with his wife Becky, is the great grandson of Thomas G. Tarkenton.
Thomas Tarkenton split the property in half based on Blanchard Road to a family member and
retained the portion that contains the Bowling Farm Site. When Robert Tarkenton, son of
Thomas Tarkenton, died, he split the property into long segments containing roughly 67 acres
each. Robert Bowling’s mother, Flora Tarkenton, inherited one segment and passed it on to her
two children, including her son Robert Bowling (Bertie County Deed Book 304:281; 660:589).
Wharf Description
The entire wharf contains three cells or units angled around the shoreline (Figure 5.5).
The eastern-most cell, Cell 1, contains the remains of a vessel in a secondary use as cribbing. A
large log (Header 1) lies just north of the sawn section of the vessel, but there were no visible
notches for securing it to the vessel. This log may have served as a reinforcement to contain the
fill within the vessel crib (Bowling Farm Site Journals 2009).

119
FIGURE 5.5. Bowling Farm Site Plan. (Courtesy of Bradley A. Rodgers, Program in Maritime
Studies, East Carolina University, Greenville, North Carolina.)
Cell 2 is west of cell one. Its most notable features include a large disarticulated log that
lies angled just west of Header 1 and runs towards Cell 3. Large amounts of ballast and wood
chip scatter comprise the fill of Cell 2 (Bowling Farm Site Journals 2009). Cell 3 contains a
cobb-style wharf unit. Logs, termed stretchers, are stacked three high and run perpendicular to
the shore 26 ft. (7.93 m.) out from the cypress grove. Each stretcher is notched to receive an 11
ft. (3.35 m.) header running parallel to the shore (Figure 5.6). Only one intact header/stretcher
combination remains on the lower stretcher. The notch suggests that this is a cross-lap fitting via
squared off notches. Excavation did not discover a floor underneath the base of the cribbing
suggesting that there could possibly be more wharf structure remains underneath. Archaeologists

120
did not discover remains of the decking that would generally cover the wharf to create a flat
surface. The decking remains could exist to the west of this third cell as many disarticulated logs
and finished timbers were discovered but project time constraints prevented its documentation.
This cell’s construction created a crib in which ballast and cobbles were deposited to sink the
cribbing. Between the stretchers lay ballast rock, most likely placed there to keep the wharf fill
from sliding out into the river. Ballast type consisted of granite, quartz, chert, limestone,
metamorphic, basalt, brick, and kaolin and ochre nodules. One hundred and twenty-eight
diagnostic artifacts were recovered from the trench including a significant number of unused
gunflints, pipe fragments, prehistoric and historic ceramic fragments, glass, and wrought nails.
Most artifacts were found within the upper two layers of the trench. The artifact analysis
provides information about the periods in which the wharf was in use
(Bowling Farm Site Journals 2009).
FIGURE 5.6. Interior profile of wharf cribbing, Bowling Farm Site. (Courtesy of Bradley A.
Rodgers, Program in Maritime Studies, East Carolina University, Greenville, North Carolina.)
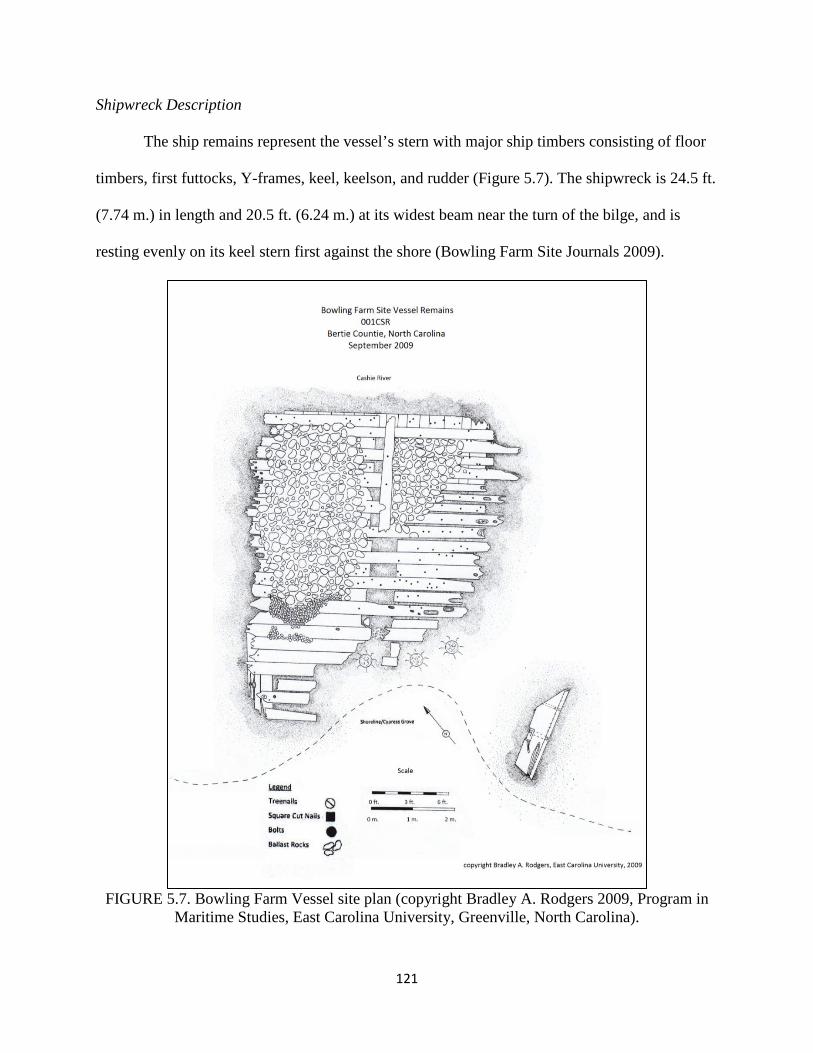
121
Shipwreck Description
The ship remains represent the vessel’s stern with major ship timbers consisting of floor
timbers, first futtocks, Y-frames, keel, keelson, and rudder (Figure 5.7). The shipwreck is 24.5 ft.
(7.74 m.) in length and 20.5 ft. (6.24 m.) at its widest beam near the turn of the bilge, and is
resting evenly on its keel stern first against the shore (Bowling Farm Site Journals 2009).
FIGURE 5.7. Bowling Farm Vessel site plan (copyright Bradley A. Rodgers 2009, Program in
Maritime Studies, East Carolina University, Greenville, North Carolina).

122
Of the frames, 8 Y-frames, 8 floors, and 15 first futtocks remain (8 port and 7 starboard).
All of the vessel’s timbers are solidly packed, but the Y-frames contain no space between them
while there was a varying degree of 0.0ft to 0.2 ft. (0.0 m. to 0.61 m.) of space between the floors
and futtocks. Each frame was located on 2 ft. (0.61 m.) centers. Average molded dimensions of
the frames are 1.2 in. (3.05 cm.). The seven intact bilges measure 1 ft. by 2 ft.
(.31 m. by .61 m.). The floors contain two limber holes cut in an odd convex four-sided
polygram. Samples taken from select frames concluded that they were made from southern
yellow pine. The cross-section revealed that the vessel’s frames have relatively little curvature
until the turn of the bilge signifying that it was likely a full bodied merchant or transport vessel
(Bowling Farm Site Journals 2009).
From visual inspection the keel is believed to be oak, although no formal tests for
speciation have been conducted. The keel averages 1.3 ft. (.40 m.) sided and 1 ft. (.31 m.)
molded with no discernible shoe (Figure 5.8). Interestingly, the keel is slightly wider at its
bottom than its top by 0.1 in. forming a trapezoidal shape. This suggests that the ship was made
with the intention of being able to ground and rest its keel. The keel was the major load bearing
device on the ship. When shaped like an upside down keystone of an arch, the keel when
grounded would disperse the ship’s weight across the widest side thereby preventing the keel
from breaking. Another interesting discovery is that the keel had not been broken as previously
thought. After viewing the outer hull planking in conjunction with the keel, it was discerned that
the ship had been sawed cleanly through, severing the keel, keelson, and outer hull planking in a
clean line (Bowling Farm Site Journals 2009).
The keelson is badly eroded and shows signs of charring especially at its most forward
end and was not tested for speciation. It is fastened through the floors to the keel’s with iron drift

123
pins at 2 ft. (.61 m.) intervals. The remains measure 9ft. (2.74 m.) in length, 1 ft. (.31 m.) sided,
and 1.4 ft. (.43 m.) molded. The keelson is notched to accept the floors. There was no evidence
of a hogging piece to provide extra longitudinal support over the keelson or of mast steps and
saddles (Bowling Farm Site Journals 2009).
FIGURE 5.8. Bowling Farm Vessel cross-section. (Courtesy of Bradley A. Rodgers, Program in
Maritime Studies, East Carolina University, Greenville, North Carolina.)
The outer hull planking is crafted from southern yellow pine and averages 1 ft. (.31 m.)
sided and 0.16 ft. (0.05 m.) molded. The planks are fasted to the frames with treenails, and there
was no sign of sheathing by the visible hull section at the severed planks and keel. Several planks
appeared to be superimposed below the turn of the bilge, but it was unclear if those planks were
merely disarticulated. The garboard strake is 1.8 ft. (0.55 m.) sided and 0.2 ft. (0.06 m.) molded.
The garboard strake is rabbeted into the keel 0.1 ft. (0.3 m.) from the keel’s top. The ship’s

124
ceiling planking no longer remains, but remaining fasteners demonstrate that ceiling planking
was at least 0.1 ft. (0.3 m.) molded dimension (Bowling Farm Site Journals 2009).
The remains of the rudder were located 10 ft. (3.05 m.) south of the last Y-frame. It is the
lower portion of the rudder fore piece with a total length of 7 ft. (2.13 m.), 1.8 ft. (0.55 m.) sided,
and 0.4 ft. (.12 m.) molded. It was mortised for the pintol supports and pierced internally to
attach the fore-piece to the main rudder piece with a tennon (Bowling Farm Site Journals 2009).
Two types of ballast existed on the vessel remains. Ballast situated on the port side, aft
most portion are small and angular. Ballast filling the rest of the port side and the forward
portion of the starboard side are large and rounded, resembling the ballast spread across the
wharf complex (Bowling Farm Site Journals 2009).
Bathymetric Survey
The maximum river depth discovered was 27 ft. (8.23 m.) while averaging 21 ft.
(6.40 m.) in the river’s middle. At the edge of the wharf complex, the river’s depth averages 7 ft.
(2.13 m.). Such a depth would allow for large vessels of significant tonnage to sail up river to
various plantation landings (Bowling Farm Site Journals 2009).
Magnetometer and Side Scan Sonar
The magnetometer and side scan sonar surveys conducted by the Program in Maritime
Studies, ECU, Advanced Nautical Archaeology Methodology 2009 class did not result in any
locations of targets within the vicinity of the Bowling Farm Site in the Cashie River (Bowling
Farm Site Journals 2009).

125
Artifact Analysis
The terrestrial survey team recovered mainly Native American pottery sherds with only a
few lithics and historic artifacts. The few historic artifacts found, however, resembled the historic
artifacts recovered from the wharf: gun flints, wrought nails, glass fragments, stoneware, and red
earthenware (Bowling Farm Site Journals 2009). A consultation with ECU prehistoric
archaeologist I. Randolph Daniel suggested that prehistoric ceramics dated to the Early and Late
Woodland periods (pers. comm. with Dr. Randolph Daniel 2009).
Most diagnostic artifacts found within the wharf test trench come from the upper two
stretchers. This suggests that discarded items filled the wharf after ballast, used as fill, sank the
wharf. The owner removed dirt and refuse from the land near the site and dumped it into the
wharf crib as fill. Fill would have continued to be added during the length of the wharf’s life as
the river slowly leeched the sand and silt out of the crib (Bowling Farm Site Journals 2009).
The test trench contained 53 glass artifacts; 68 percent were thin light olive green bottle
shards. Light olive green glass had a long date range spanning 1600-1900. Two thin clear glass
fragments that fit together contain hand etchings (Figure 5.9). These delicacy of the glass shards
suggest that they most likely came from a wine glass (Bowling Farm Site Journals 2009).
Analysis of historic and prehistoric pottery percentages on land versus in water suggest
two hypotheses: The adjacent “island” was scraped for additional fill to go along with the ballast,
or the fill came from another location. Prehistoric ceramics from the STPs on land equate to 91
percent of the total assemblage with historic ceramics less than 5 percent. From the wharf trench,
prehistoric ceramics make only 10 percent of the assemblage, while historic ceramics comprise
90 percent. This reversal of assemblage percentages supports both hypotheses of how the fill

126
came to be in the wharf. Both on land and in the water, there is an absence of projectile points in
the artifact assemblage (Bowling Farm Site Journals 2009).
FIGURE 5.9. Etched clear glass from Bowling Farm Site artifact assemblage (Photo by Lynn B.
Harris; courtesy of Program in Maritime Studies, East Carolina University, Greenville, NC.)
Kaolin pipe fragments represent 14 percent of the diagnostic artifacts from the wharf
assemblage. Using the Harrington model, the wharf pipe fragments date the entire site spanning
the 1700s: 6 percent representing 1680-1720, 47 percent representing 1720-1750, 47 percent
representing 1750-1800. This would fit the use of the site from the opening of the lands on the
Cashie River to European settlers in 1715 through the ownership of William Armistead. Using
the Binford Model the mean occupation date from pipe stem analysis comes to 1756, which is
mid-occupation period given by Harrington (Deetz 1996:27).
Gunflints comprise 10 percent of the wharf’s assemblage. The flints were found
unbroken and unworn, and therefore likely not used, suggesting munitions stores (Figure 5.10;
Bowling Farm Site Journals 2009). There were two basic types of gunflints during the colonial
era: flints made from flakes struck from prepared blade cores and ones developed from spalls
struck from nodules or cores. Flake flints appear prismatic and were first made by the French,
and by 1780 the British discovered manufacturing technology (Hamilton 1987:141). French

127
flints are a glossy, translucent honey color. They are wider than they are long but almost square
by the 19th century. British gunflints in comparison are made from a dull gray to solid black flint
and are longer than they are wide (Hamilton and Emery 1988:13). There are two hypotheses to
explain the presence of the gunflints. First, they were unintentional losses in a flint knapping area
in Europe or on board a vessel, and subsequently became part of a ship’s ballast. Ships regularly
discharge ballast at port when taking on cargo and therefore could have ended up as part of the
crib fill during this process as a secondary disposition. The second hypothesis states that the
flints were produced on site. Much of the ballast used as wharf fill at the Bowling Farm Site is
chert, the primary rock out of which gunflints are made. Excavations at the colonial fort, Fort
Argyle, on the Ogeechee River found numerous gunflints. The archaeologists speculate that the
residents produced gunflints on site from flint cobbles as large quantities of chert flakes were
found in the wharf fill at Bowling Farm Site (pers. comm. Lynn Harris and Brad Rodgers 2009).
FIGURE 5.10. Gunflints found at the Bowling Farm Site. (Photo by Lynn B. Harris; courtesy of
Program in Maritime Studies, East Carolina University, Greenville, NC.)
Physical qualities and manufacturing techniques characterize gunflints. French gunflints
were honey or blonde colored and could include white inclusions or a whitish chalk cortex.

128
France began producing blonde flints around 1675 and remained the most commonly used
gunflints in England, France, and the American colonies prior to 1800. Around 1790, at the start
of the Napoleonic Wars, Britain began producing its own gunflints from the chert deposit in
Suffolk County. British flints were a black to gray color that could be translucent or opaque.
Before 1790, British manufactured gunflints were brown and banded and quarried in southern
England. Native Americans began manufacturing gunflints with the introduction of guns into the
area and ended with the establishment of a reliable European gunflint source. Native Americans
knapped gunflints were squarer than European gunflints prior to 1700 and used locally available
or non-local source material. Where French and English gunflints were prismatic and with a
bevel formed from blade scars, Native American gunflints reflect the bifacial reduction
technology associated with projectile point making. The gunflints at Bowling Farm Site appear
to be English and French imports (Kenmotsu 1990:95-97, 114).
Fauna remains across the entire site include burnt bones of deer or cow found on land,
and fish bones found within the wharf fill and the ship fill. These remains could represent food
refuse consumed by the property owners (Bowling Farm Site Journals 2009).
Site Formation Processes
Finding a vessel stern first into shore is unusual because typically the stern draws more
water than the bow. Stern first would signify that the skeg and rudder grounded, most surely
leading to significant damage to the keel and rudder. If the vessel was intentionally grounded, the
processes difficulty would suggest that the vessel was already cut into a manageable floating
piece. The lack of evidence that the rest of the vessel is within the vicinity of the Bowling Farm
Site suggests that the cutting of the vessel occurred elsewhere and it was then floated down the
river before being grounded at its current position. The rudder most likely came to in its current

129
position when the stern post and transom deteriorated to the extent that the rudder could no
longer be supported (pers. comm. Bradley A. Rodgers 2009).
Mulberry Landing Wharf
Archaeological excavations at Mulberry Landing Wharf were carried out sporadically
between 1995-1996. Their purpose was to “determine the extent, configuration, and age of the
wharf remains frequently exposed there at low tide” (Langley 2000:339).The site is located in
Wicomico County, Maryland, at the mouth of Bell Creek on the Wicomico River. The wharf is
part of the Pemberton Historical Park, which is 2 mi. (3.21 km.) southwest of Salisbury on
Maryland’s Eastern Shore. Pemberton Historical Park was designed to protect the remains of an
18th century plantation known as Pemberton Hall, which includes the manor house, outbuildings,
and Mulberry Landing Wharf (Langley 2000:339).
Plantation History
Colonel William Stevens received the grant for Pemberton Tract in 1679, when the tract
was part of Somerset County. Somerset County soon divided, and Pemberton Tract became part
of Wicomico County. The original grant consisted of 900 acres, and it remained undeveloped as
it was deeded to various individuals including Thomas Pemberton, the tract’s namesake (Langley
2000:340).
In 1726, Colonel Isaac Handy acquired the property in the same year he married his wife,
Anne Dashiell. Handy resurveyed the tract in 1730 adding 70 acres to the existing 900. His
property also included an adjacent island known by various names throughout history: Mulberry,
James, Net, and Bell. A small house existed on the island and it is believed to be the quarters of
the Handy family until Pemberton Hall was constructed in 1741. Pemberton Hall is a 1.5 story, 3

130
bay, Flemish-bond brick house, and is known to be one of the earliest gambrel-roofed structures
in Maryland. The exact construction date, 1741, is derived from a dated brick located above a
side door that is now enclosed within a 1970s reconstructed, single-store kitchen. Between 1741
and 1747, Isaac Handy built the wharf (Langley 2000: 339-340, 347).
The same year Handy built his house, he also began his shipping business with England.
Having inherited a partial interest in the sloop William and Mary from his father in the 1720s and
purchasing the 40-ton sloop George, he exported products produced on his estate: tobacco, wool,
linen cloth, and cider. George Handy, son of Isaac, acted as captain and master of George. Upon
Isaac Handy’s death in 1763, the estate was divided between the four sons with the youngest,
Henry, inheriting the home tract. Henry continued to produce the same items as his father while
also adding cotton. He and his brother George, who inherited the adjacent tract, disputed over
property matters including rights to use Mulberry Landing Wharf. By Henry’s death in 1787, the
home tract amounted to 437 acres (Langley 2000:340-341).
Henry Jr. inherited the home tract from his father and added a commercial tannery before
his death in 1803. With Henry Handy Jr.’s death, the property went through land divisions, sale,
and legal disputes until 1835 when Jehu Parsons purchased it. Parsons moved away from the
previous Handy ventures, although he maintained the cider facilities, and instead focused on
mixed farming. Still, Parsons continued to utilize, develop, and maintain Mulberry Landing
Wharf. In 1859 Alison Parsons, son of Jehu, inherited the property. His estate records indicate
that he owned six vessels ranging in size from canoe to schooner, 1600 ft. (487.68 m.) of pine
and chestnut wharf logs and posts, and ships’ stores consisting of anchor chain, spars, sails, and
turpentine. A store house and its office were also mentioned in equity files as support structures
for commercial ventures centered at the wharf. An 1865 plat depicts the wharf extending over

131
100 ft. (30.48 m.) onto adjacent property. In 1868, the property changed hands again and
continued to do so until it was sold to the Maryland Historical Trust in 1963. The Maryland
Historical Trust in turn conveyed the manor to the Pemberton Hall Foundation in 1977. In 1978
and again in 1987, Wicomico County Department of Recreation and Parks bought surrounding
property to protect the integrity of Pemberton Hall from encroaching suburban development
(Langley 2000:341-342).
Wharf Description and Analysis
Mulberry Land Wharf was constructed in the bulkhead style with three sides and the
shore making the fourth (Figure 5.11). The headers run straight without any dock-like extensions
and both the stretchers and tie-backs anchor into the shore. Archaeological documentation
showed that there were two definite courses. Disarticulated timbers both downstream and
external of the wharf’s center show evidence that at one time there was a third course. The wharf
timbers were squared both at the top and bottom. This enabled the courses to lay flat upon each
other. The timbers within a course were joined by lapped scarf joints. The courses were
connected using both treenails and wrought iron drift pins (Langley 2000:343).
The end timbers and tie-backs, which can also be described as stretchers, were dovetailed
into the headers and anchored by the wharf fill and the shore. The butt ends of the tie-backs are
held down by wooden poles that were angled over the tie-backs and driven into the creek bottom.
These anchoring points occurred at 10 ft. (3.05 m.) intervals along the headers. The dovetailed
joints at the tie-back/header intersection varied between worked dovetailed joints and naturally
occurring shapes of wood. Langley does not believe that the naturally shaped dovetail resulted
from hasty replacement or time management. Instead, she believes the thought and methodology
were similar to that of the shipbuilding practice. Shipbuilders used compass timbers, naturally

132
FIGURE 5.11. Mulberry Landing Wharf archaeological plan (Langley 2000:340).
occurring bend in tree limbs that held the desired shape for vessel frames or knees. Compass
timbers were believed to contain superior strength and durability in the natural growth and shape
of the wood grain in comparison with worked frames and joints (Langley 2000:343).
The headers together ran 168.9 ft. (51.48 m.) parallel to the shore with a 13.1 ft. (3.99 m.)
extension upstream. The timbers averaged 19.1 in. (48.51 cm.) in width with the bark layer
included and 14.9 in. (37.86 cm.) in thickness. The tiebacks averaged 3.9 in. (9.9 cm.) in width
and 1.5 in. (3.81 cm.) in thickness (Langley 2000:343).
Wharf fill consisted of saplings, branches, and earth. No man-made artifacts or ballast
were discovered. Artifacts recovered from outside the wharf include Native American pottery
sherds of the Late Woodland Townsend pottery (AD 900-contact), discovered along the creek
shore and a few 18th-century buttons found within the vicinity of the historic wharf road.

133
Archaeologists did not locate any diagnostic artifacts within the wharf structure itself, but they
did find a mid-nineteenth-century shipyard jack external of the wharf (Langley 2000:343, 347).
Dendrochronology verified that the wharf’s entire framing structure was constructed of
pine and determined that the latest frame dated to 1747, while many of the other timbers dated
earlier. This led to the conclusion that the wharf was constructed before 1748, because no insect
damage could be found on any of the samples. Insect damage would indicate that the wood was
stored for a period of time before being used as part of the wharf. The anaerobic environment of
the creek’s mud subsequently protected the frames from toredo worm damage; therefore the
wharf must have been assembled soon after the trees were felled (Langley 2000:347).
Shirley Plantation Wharf Complex
Shirley Plantation is located in Charles City County, Virginia, on the north side of the
James River, 33 mi. (53.10 km.) west of Jamestown, Virginia. Archaeological documentation at
Shirley Plantation Wharf Complex was carried out sporadically beginning in August 2010 and
will continue into spring 2011 by Charles H. Carter III, Charles Saunders, Tarft Kiser, and the
author. Their purpose was to determine the extent of archaeological remains along the Shirley
Plantation shoreline. The presence and absence of artifacts along the James River was indicative
of activity or the lack thereof along the James River.
Plantation History
On January 6, 1614, Sir Thomas Dale, Virginia’s marshal and deputy-governor,
established seven communities upriver from Jamestown on the James River. This included West
and Shirley Hundred, where Shirley Plantation now sits. Dale derived the name from Sir Thomas
West, a major Virginia Company investor, and West’s father-in-law, Sir Thomas Shirley. By

134
June of that year the settlers of West and Shirley Hundred had constructed wooden buildings on
the property. John Rolfe in 1616 reported 25 people settled there under the command of Captain
Isaac Madison. They exclusively cultivated tobacco to exchange for clothing and other
communal supplies. In total, West and Shirley Hundred comprised approximately 3,500 acres of
land beginning roughly from Causey’s Care, upstream toward Turkey Island Creek, abutting
Diggs Hundred and enveloping part of Eppes Island (McCartney 1997:13, 15-16, 18, 21, 27-30,
35, 38).
Captain Isaac Madison in 1617 cleared land for himself in West and Shirley Hundred.
The Virginia Company granted him two shares of land and two apprentices. The population grew
to 45 residents around 1620. By this time, Sir Thomas West had died, and his wife and son
owned West and Shirley Hundred, and small amounts of acreage began to be sold to individuals.
Colonists here now attempted to manufacture iron, wine, and silk along with agricultural
experiments in tobacco. By 1625 there were 17 houses constructed on West and Shirley
Hundred, and the community possessed 21 cattle, 61 swine, 263 poultry, and 2 horses, while two
residents owned boats (McCartney 1997:27-30, 35, 38).
Population increase continued through immigration and natural production, and by 1634,
511 people lived between Shirley Hundred and Weyanoke. By August 1646, a man named
Walter Aston had purchased three tracts of land in West and Shirley Hundred totaling 1,336
acres. Part of Aston’s land would eventually became Shirley Plantation when his widow married
Edward Hill I (McCartney 1997:45, 48).
On August 20, 1656, Daniel Llewelyn I sold to Edward Hill I a 60 acre tract in Shirley
Hundred, his first land possession in the area. Housing already existed on this property, as
Thomas Noathway had been permitted to remain in residence. The Quarter Court granted

135
Edward Hill I 850 acres of land in Shirley Hundred in 1659. In 1660, Hill acquired another 1,626
acres of property making a total of 2,536 acres within the vicinity of Shirley Hundred
(McCartney 1997: 59-61).
Edward Hill I was a member of the governor’s council, and as a colonel, Charles City
County’s highest ranking military officer and commander of the local militia, although he had a
tarnished reputation from losing a battle against the Native Americans and skirting official non-
political/military duties. Hill I’s house was designated in 1659 as the location to collect taxes in
the form of corn. Hill I continued to gain property, receiving an unknown amount of acreage
from Lt. Colonel Walter Aston’s widow, Hannah. In December 1660, Hannah Aston married
Hill I, but he died three years later (McCartney 1997:64-68).
Edward Hill II inherited his father’s Shirley tract. He enhanced his wealth by holding
many public offices, like his father, such as surveyor of the highways on the north side of the
James River in Charles City County. He was also a member of the Westover Parish vestry,
owner and operator of the county courthouse, jail, and tavern, and finally the commander of the
county militia. He also served as the first judge of the admiralty court of Virginia and the
Carolinas and as collector of customs for the Upper James River District (McCartney 1997:71-
72, 84).
Hill II, a successful planter, bought and sold land adding 68 acres and selling 50 acres.
He acquired 2,200 acres in New Kent County, 2,717 acres in New Kent and Rappahannock
Counties, and 908.5 acres in Charles City County on the south side of the James River in 1681.
When the assembly passed an act to establish ports and towns in Virginia, one site listed was
Bermuda Hundred across the James River from Shirley Plantation. Most Virginians, however,

136
preferred to conduct their business and trade at their respective wharves instead of at an urban
center (McCartney 1997: 80, 85-86).
During Bacon’s Rebellion, Hill II sided with Governor Wilson Berkeley and raised 30
men to assist in quelling the uprising. In the aftermath, Bacon supporters who were not hanged
filed grievances against Hill II. His response showed some activities on the farm. He raised
sheep, hogs, and cattle and cultivated wheat, barley, oats, and Indian corn of which 700 to 800
bushels had been destroyed. He stored brandy, wine, and cider. He lost much of his writings,
bills, and bond accounts to the value of 40,000 pounds of tobacco. In 1700, Hill II died, and his
son, Edward Hill III, inherited Shirley Plantation (McCartney 1997:80).
Edward Hill III maintained an active role in public office like his predecessors: member
of the College of William and Mary’s Board of Governors, colonel of the Charles City County
Militia, member of the vestry of Westover Parish, and a Price George County burgess. In 1716
he was appointed customs collector for the James River. He also served as the Royal African
Company’s factor between 1701 and 1702 and sold slaves to other planters (McCartney 1997:87-
91).
Hill III also enhanced his land holdings and in 1704 accrued 2,100 acres in Charles City
County, 3,000 acres in King William, and 1,000 acres in Prince George. He used slave labor on
his property, and Perry Lane and Company of London serves as his factor. He owned sailing
vessels that regularly made trips to England with cargos of tobacco in exchange for
manufactured goods. The diaries of William Bryd II noted that Hill III undertook shipbuilding on
his property at Shirley and named one of his vessels Henrietta. He also maintained a ferry that
plied the James River regularly. He grew apricots, cherries, and raspberries aside from tobacco
(McCartney 1997:87-91).

137
Edward Hill III died sometime before to August 26, 1726, and his son Hill IV had died at
a young age from tuberculosis, thereby makings his three daughters his sole heirs. His youngest
daughter, Elizabeth, became the heir to the Virginia property, and on October 3, 1723, she
married John Carter (McCartney 1997:91-92).
John Carter took up residence at Shirley Plantation soon after he married Elizabeth Hill.
Together they produced four children: John, Charles, Elizabeth, and Edward. Carter was a
member of the governor’s council beginning in 1724 and by spring 1726 he was named secretary
of the colony. Quickly Carter also began enlarging Shirley Plantation by renting 50 acres in
Henrico County on Turkey Island Creek for 99 years use, 5 acres in Charles City County
abutting Shirley Plantation and Turkey Island Creek, and 155 acres in the northwest portion of
the High Hills tract near Shirley’s eastern border (McCartney 1997:94-95).
A 1738 letter showed John Carter moved his family back and forth from Shirley to his
Crotoman property, which he had inherited from his father, and found moving his belongs to be
an inconvenience. Therefore he deemed it necessary to purchase double the necessary household
furnishings, linens, and tableware. His letter book described the importation of cotton, hoes, bar
iron, and coarse cloth, plaid stockings, and coarse blankets for slaves. He also imported farming
equipment, shoemakers’ thread, paint, machinery for milling operations, fittings for his sloop,
and household items including sheets, linens, books, and dried citron. He also imported beer,
wine, and ale. Reference to stonework and masonry at Shirley Plantation in 1739 suggested that
the present mansion was in the process of construction (McCartney 1997:96-100).
Carter used both indentured servants and slaves to support his everyday activities and
farming operations. Carter grew tobacco, including a “stout Oronoko” tobacco specifically
intended for the Irish market. He also purchased tobacco from other plantations and resold it in

138
England enabling him to send a full cargo to his factor in England in his ships. In 1733, Carter
also exported wheat, corn, and lumber to the island of Madeira in trade for wine to resell in
Virginia. Carter participated in salt and copper mining ventures, but they failed to produce a
profit. His other business venture was slave trade. Between 1737 and 1739, Carter sold slaves
from Guinea and other parts of Africa on behalf of Foster Cunliffe of Liverpool (McCartney
1997:100-102). In late July 1742, John Carter died, and his will stipulated that his wife was to
receive life rights to the property she inherited from her parents and named his son Charles
Carter II heir. John Carter’s death resulted in a 1742 survey of the 640 acres that comprised
Shirley Plantation (McCartney 1997:103).
The surveyor used letters to delineate important structures on the property. Down by the
river were the orchards, gardens, park, and all houses except the Great Quarter. Just upriver were
the bake-house and the smith’s shop. Downriver was the mansion, and adjacent to the mansion
was the boat house. The map also indicated the location of tobacco houses. A side notation
included the existence of 146 acres of swamp land and 77 acres on an island bringing the
property total to 863 acres. The wharf’s location was not shown on the map. After Carter’s death,
his executors published advertisements to sell certain tracts of his accumulated property: 8,000
acres on the Opechan in Frederick County, 6,000 acres on Goose Creek in Fairfax and Prince
William counties, and 100,000 acres on the branches of the Roanoke River (McCartney
1997:103-105).
Elizabeth Hill Carter remarried Bowler Cocke, and they took up residence at Shirley, but
did not work to keep up the manor. An Englishman on a tour of Virginia noted the beauty of the
plantation and home but that it was also falling into disrepair from neglect. During Cocke’s
residence at Shirley, the 1771 major flood damaged the plantation and surrounding countryside.

139
A news account noted that the flood drove the ships at Shirley Hundred from their mooring’s
down to City Point (McCartney 1997:107-108).
Bowler Cocke died in 1771, while her husband soon followed. Upon his death, Cocke’s
executors sought compensation for slave use and the increase of livestock from the heir Charles
Carter. A lawsuit followed, which was resolved in Charles Carter’s favor. Carter, at the time he
inherited Shirley, served as county justice and local burgess in Lancaster County until 1775-1776
term. Carter had eight children with his first wife, Mary, and another 15 with his second wife,
Anne Butler Moore. In 1773, he had moved his entire family to Shirley Plantation and within
two years shipped a great amount of tobacco, a total of 247 hogsheads, from Shirley Plantation.
He also made improvements to the manor’s interior (McCartney 1997:108-111).
Carter contributed greatly to the American Revolution by signing the non-importation
agreement until the repeal of the Townsend Acts and also endorsed the 1770 and 1774 non-
importation resolutions. He served as a delegate to the 1775 March and December Virginia
Conventions, and served in the Charles City County militia in 1776. Carter supplied cattle to
General Thomas Nelson’s men, and used Shirley as a supply depot collecting military stores at
the request of the Marquis de Lafayette (McCartney 1997:111-112).
The first real estate tax rolls for Charles Carter in 1782 showed Shirley Plantation
contained 740 acres and that Carter also maintained 1,515 acres elsewhere in the county. He later
added to his holdings 170 acres on the Chickahominy River for which he already maintained
property, and added 2.6 acres on Shirley’s northern property line. Upon his death in 1806, Carter
maintained property in many areas of Virginia: 1,000 acres in King William County, 15,620
acres in Fauquier County, 3,497 acres in Richmond County, 4,165 acres in Hanover County, 500
acres in Westmoreland County, 2,200 acres in Prince George County, and 5,886 acres in

140
Caroline County. In 1783, personal property tax rolls showed Carter owned 88 slaves over the
age of 16 and 103 under the age of 16. He also possessed 10 horses, 115 cattle, and 2 passenger
vehicles. In 1791, the county tax commissioner listed personal property specifically by location.
Shirley had 61 slaves over 16 years of age and 16 slaves under the age of 16, 23
horses/mules/asses, and 2 passenger vehicles. A maximum of 92 slaves total at Shirley Plantation
were noted in 1804. M. Lynn concluded in her master’s thesis on the history of Shirley
Plantation that Charles Carter’s investments surpassed all other Virginians (Lynn 1967:74;
McCartney 1997:114-116).
Upon his death, Charles Carter left life rights to his wife, Ann Butler Carter and gave her
use of all Charles City County houses, lands, slaves, and stocks including the Shirley,
Chickahominy, and Harden properties, and the Mill. After her death, the property transferred to
their son Robert, who died just before inheriting his father’s property. Charles Carter honored
Robert’s request to leave Shirley to Robert’s son, Hill. Charles Carter’s 1806 estate inventory
showed that 143 of his total 591 slaves worked at Shirley, which also housed his most valuable
personal property. His household and kitchen furniture totaled $2,068. Upon Anne Butler’s death
in 1809, the executors for Charles Carter sold the Chickahominy estate. Hill did not come of age
and inherit the property until 1818 (McCartney 1997:118, 121-122).
Hill, a naval officer in the War of 1812, maintained 52 slaves age 16 and older in 1817,
but invested more in his 19 horses/mules/asses. By 1820, his slave population decreased to 44
slaves aged 12 and older. In May 1820, Jessee Ladd, a Charles City County surveyor, made a
plat of Shirley Plantation. He noted that the plantation comprised of 822 acres. South of the
mansion lot, in the same location as the 1742 plat, was the boat house. Unfortunately, the 1820
plat did not show the dock complex. In 1824, Hill Carter sold part of Eppes Island reducing

141
Shirley’s 742 acres to 665 acres. In 1851, Hill built new wharves along the waterfront
(McCartney 1997: 126, 128).
An 1862 map by an anonymous surveyor indicated a far greater complexity of roads
through the fields, 10 buildings in the manor tract and only one quarter building. Shirley’s
landing was depicted as a “T” wharf at the location of the current wharf complex north/upriver of
the manor house. The 1867 Gilmer map showed Shirley Plantation with three main buildings and
six quarters. Also included was the Shirley wharf in the present location of the wharf complex,
depicted as a large square jutting out into the James River (McCartney 1997:145).
After the Civil War, Hill Carter turned his farming operations over to his sons and broke
up Shirley Plantation, then 925 acres, into two parts giving to his son Robert Randolph Carter the
half with the manor and the other half, Upper Shirley, to William Fitzhugh Carter. An early-mid
1870s map depicts numerous changes to the plantation. The boat house and bake house were
absent as well as two outbuildings that had flanked the manor. Two L-shaped buildings now
stood to the rear of the manor complex. The wharf still stood to the north of the manor tract. Hill
Carter died in 1875. The plantation remained divided between the two sons with Robert
Randolph Carter receiving the southern portion of 590 acres and William Fitzhugh Carter the
northern portion consisting of 450 acres of arable land and 140 acres of swamp (McCartney
1997:146-150).
Another map from roughly the same period (1866-1874), contained more river front
details. It showed a square wharf site upriver (north) from the domestic complex, two fence lines
running into the river on either side of the manor tract and a second wharf on the south end of the
former location of the boat house. Patterson’s 1877 map depicted the wharf north of the mansion
tract with a road leading from the road parallel to the river to the wharf. A fence line ran along

142
the south side of the manor tract into the river, but it is unclear if the wharf on the south side of
the former boat house tract still existed (McCartney 1997:150).
Robert Randolph Carter died without a male heir to inherit the plantation. His daughter
Alice took a keen interest in agriculture before his death and took over the farming operations. In
1888, the LaPrade map still depicted the Shirley wharf as “T” shaped just north of the manor
complex. When Alice retired from handling the farming operations at Shirley, she arranged for
her first cousin Charles Hill Carter of High Hills to take over the agricultural management. Hill
Carter and his family took up residence at Shirley, and his son Charles Hill Carter II inherited the
plantation. Presently, Hill Carter II’s son, Charles Hill Carter III, resides at and operates Shirley
Plantation, maintaining the same commercial farming business started on the property in 1614
(McCartney 1997:153-154).
Wharf Construction
Shirley Plantation Wharf Complex consisted of four separate structures: two T-shaped
piling-type wharves (T1 and T2) and two smaller pier-type wharves (W1, W2) (Figure 5.12). T1
was the southernmost wharf structure followed by W1, T2, and W2 to the north. All four
wharves were constructed using a series of wooden pilings averaging 1 ft. (.31 m.) in diameter.
T1 was 80 ft. (24.38 m.) wide at its head and 150 ft. (45.72 m.) in overall length. The base of T1
was 12 ft. (3.66 m.) wide and the perpendicular rows making the head of the wharf 24 ft. (7.32
m.) wide. The cap of T1 is comprised of 3 rows and 11 columns. It butts under the southeast side
of T2 thereby making it the earlier of the two T-shaped wharves as the position of T2 would have
become a hazard to vessels mooring at T1 as well as departing as vessels would have
encountered pilings in their sailing path (Carter III 2010).

143
FIGURE 5.12. Bird’s eye view of Shirley Plantation Wharf structures
(Courtesy of Charles H. Carter III.)
T2 had a total width of 84 ft. (25.60 m.) at the cap, an overall length of 154 ft. (46.93 m.)
and 12 ft. (3.66 m.) spacing between the pilings comprising the ramp connecting the land to the
cap. The cap of T2 is comprised of three rows and eleven columns. T2 is longer than T1,
although it rests farther into the river due to the nature of the shoreline. The shoreline juts out
farther into the river at the location of T2 than the location of T1. The interior pilings of T1 and
T2 were single in number, while the exterior pilings were in groups of two to six pilings called
dolphins. Dolphins are used as sacrificial piles to protect the boat and pier (Carter III 2010).
W1 and W2 both had a width of 12 ft. (3.66 m.) and a total length of 60 ft. (18.29 m.).
Both W1 and W2 consisted of 34 surviving pilings each above sedimentation. Neither W1 nor
W2 had a cap on its river side to create a T-shape. The pilings of W1 and W2 were more

144
degraded than T1 and T2 with W1 columns showing the most overall deterioration. T1 columns
showed more signs of decomposition that T2. This suggests that W1 was constructed first
followed by W2, T1, and finally T2 (Carter III 2010).
At the base of T1 was what could possibly be a sleeper frame to anchor the shore end of
the wharf into the ground. It measured 14.1 ft. (4.29 m.) overall in length and 0.9 ft. (0.27 m.) in
width. The sleeper frame contained two mortises, a 1.1 ft. by 0.6 ft. (0.34 m. by 0.18 m.) mortise
at the 2 ft. (0.61) mark and a second mortise measuring 0.9 ft in length at the 11.55 ft. (3.52 m.)
mark. A large frame rested on top of the river sediment 115 ft. (35.05 m.) back from the head of
T1 and on its south side. It measured 6 ft. (1.83 m.) in length, 2 in. (5.08 cm.) in thickness, and 6
in. (15.24 cm.) in width. This frame would have been used as joists to support the decking
(Carter III 2010).
Artifact Analysis
Artifact analysis consisted of 450 ft. (137.16 m.) of shoreline surface collection from the
wharf complex heading south. Archaeologists documented 749 artifacts including prehistoric
ceramics, lithics, historic ceramics, glass, fasteners, brick, roof tile, pipe stems, manufactured
items, ballast, stone building material, and organic materials (Carter III 2010).
The primary objective of the shoreline survey was to identify concentrations of historic
artifacts along the James River. Prehistoric artifacts including lithics and ceramics were not
documented, although archaeologists collected a few exceptional projectile points and ceramics
for future study. Prehistoric ceramics consisted of four woodland pottery sherds found in units
20-30 ft. (6.09-9.14 m.) south, 350-360 ft. (106.68-109.73 m.) south, and 360-370 ft. (109.73-
112.78 m.) south. One sherd was net-impressed, while the surfaces of the other three were too
degraded for the purposes of further analysis. The few prehistoric ceramics found were

145
insufficient to draw substantive conclusions about Native American presence on the site (Field
Journals, Carter III 2010).
Investigators found 12 whole or partial projectile points. Of these, investigators noted two
came from the Archaic period in unit 20 ft. to 30 ft. (6.09 m. to 9.14 m.) south, and two from the
Woodland Period in units 50 ft. to 60 ft. (15.24 m. to 18.29 m.) South and 170 ft. to 180 ft.
(51.82 m. to 54.86 m.) south. Because the investigators did not save every whole or partial point
or lithic debitage, analysis of these prehistoric artifacts remain inconclusive (Field Journals,
Carter III 2010).
Investigators found a wide range of historic ceramics totaling 28 individual sherds. The
quality of the ceramics ranged from utilitarian to fine ceramics. Ceramic types included
American stoneware, Westerwald stoneware, white salt glazed stoneware (English), Chinese
Porcelain (blue and white, Canton, flower pattern, blue and white lined flower, blue and white
XXX pattern), Asian porcelain (transfer print), pearlware, pearlware (blue shell edge),
Bennington, whiteware, redware (black lead glaze), and yellowware. Seventy-nine percent of the
historic ceramics dated to the nineteenth century, while 21 percent dated to the colonial period
ranging from the seventeenth to the eighteenth centuries with one only possible seventeenth
century ceramic. Highest concentrations of historic ceramics sherds occurred in the first 100 ft.
(30.48 m.) with a total of 12 ceramics, within the close vicinity of the wharf complex.
Concentrations dropped off with only two ceramics found between units 100 ft. and 200 ft.
(30.48 m. and 60.96 m.). Concentrations rise to a total of 7 ceramic fragments between units 200
ft. and 350 ft. (60.96 m. and 106.68 m). The spike occurred between units 250-300 ft. (76.20-
91.44 m.) with a total of 3 ceramics found. Finally, concentrations rose again to a total of 8
ceramics between 350 and 400 ft. (106.68 m. and 121.92 m.). The rise in ceramic concentration

146
might signify the location of structural remains on the adjacent land (Field Journals, Carter III
2010).
There were only 8 ceramics dating to the colonial period, 17th-century and 18th-century,
found in the 450 ft. (137.16 m.) of shoreline survey. Because there are so few ceramics, analysis
of location and density would not provide more than generalizations. Three colonial ceramics
were located in units 0 ft. to 150 ft. (0.0 m. to 45.72 m.). The ceramics show that the wharf site
was in use during the colonial period. Colonial ceramics appear again in between units 250 ft. to
400 ft.(76.20 m. to 121.92 m.), 5 sherds total. It is possible that these small spikes correlate to
activities or structures on land (Field Journals, Carter III 2010).
Archaeologists discovered 156 glass shards in the 450 ft. (137.16 m.) of survey. Shard
types include bottle glass in black, olive, dark green, green, light green, amber, aqua, and
lavender; a shard from a clear goblet with an American pattern, a fragment from a Seville olive
jar, and a wine goblet with a folded foot. Of these, 70 percent (109 shards) date to the colonial
period. Eight other shards have a date range that extends beyond the colonial period. The first
50 ft. (15.24 m.) of survey area closest to the wharf complex held the highest concentration of
glass shards from all periods with 48 shards. The lowest concentration was between
200 and 250 ft. (60.96 and 76.20 m.) with only 1 shard found. Concentrations increased again
afterwards, the highest concentration being at 450 ft. (137.16 m.) with 26 shards (Field Journals,
Carter III 2010).
When taking into account glass produced only in the colonial period, the highest
concentration existed in the first 50 ft. (15.24 m.) of the survey with a total of 25 colonial shards.
The concentration declines from 50 ft. to 250 ft. (15.24 m. to 76.20 m.) with the smallest
concentration of 1 shard in units 200 ft. to 250ft. (60.96 m. to 76.20 m.). Concentrations

147
increases between 250 ft. and 450 ft. (76.20 m. and 137.16 m.) reaching a peak of 24 colonial
glass shards at 400 ft. to 450 ft. (121.92 to 137.16 m.) (Field Journals, Carter III 2010).
Archaeologists only discovered three pipe stems in the 450 ft. (137.16 m.) of survey area.
This is insufficient for analysis. All three pipe stems, however, dated to the colonial period using
the Harrington Model (Field Journals, Carter III 2010; Deetz 1996:27). Roof tiles littered the
shoreline. Archaeologists documented 129 individual tile fragments with the highest
concentration from 290 ft. to 450 ft. (88.39 m. to 137.16 m.). It is unknown when exactly the
Shirley Plantation house had a tiled roof, but historic documentation places the possibility in the
colonial era (Carter III 2010). In 1816 after Hill Carter returned to Shirley Plantation, he found
that the manor’s lead roof had been removed to make bullets (McCartney 1997:125).
Investigators counted 235 brick fragments along Shirley Plantation’s shoreline.
Concentrations of brick varied along the shoreline with its highest count within units
400 ft. to 450 ft. south (121.92 m. to 137.16 m. south) and its lowest concentration between units
150 ft. to 200 ft. south (45.72 m. to 60.96 m. south). Bricks, whole and fragmented, were counted
not weighed. This skewed the data as some fragments were very small while others were whole
bricks (Field Journals, Carter III 2010).
Other building material besides brick and roof tiles included cut stone and flagstone
material that could have been used during the construction of the current manor or a previous one
that stood on this site. The four stone fragments were found in units 240 ft. to 250 ft. south
(73.15 m. to 76.20 m. south) (2 fragments), 410 ft. to 420 ft. south (124.97 m. to 128.02 m.
south) (1 fragment), and 420 ft. to 430 ft. south (128.02 m. to 131.06 m. south) (1 fragment)
(Field Journals, Carter III 2010).

148
Investigators documented 45 fasteners including nails, spikes, straps, hooks, bolts, chain,
and leaf spring. Of the fasteners, 14 were nails, and 23 were spikes. A significant concentration
of fasteners occurred within units 250 ft. to 300 ft. south (76.20 m. to 91.44 m. south) numbering
19 in total. A total of 7, the second largest concentration existed in units 50 ft. to 100 ft. south
(15.24 m. to 30.48 m. south). All other 50 ft. (15.25 m.) units contained 4 or fewer nails with
units 150 ft. to 200 ft. south (45.72 m. to 60.96 m. south) not containing any fasteners from the
surface documentation. The high concentration of fasteners indicates a possible structure having
been built nearby (Field Journals, Carter III 2010).
Three fragments of gray British flint were found in units 140 ft. to 150 ft. south (42.67 m.
to 45.72 m. south), 350 ft. to 360 ft. south (106.68 m. to 109.73 m. south), and 410 ft. to 420 ft.
south (124.97 m. to 128.02 m. south) The flint fragments were not shaped. It is likely that these
fragments arrived on site as ballast from vessels visiting Shirley Plantation (Field Journals,
Carter III 2010).
Investigators documented 27 various types of manufactured items most of which
corrosion and concretion made unidentifiable. Manufactured items included iron kettle
fragments, bracelet, buckles, rods, wheel, buckle loop, hoe, and pipe. It also included an iron and
brass box lock, a bronze bushing, and a stamped brass rosette. Consistent concentrations of
manufactured items ranging 4 to 6 in count every 50 ft. (15.24 m.) existed between 0 ft. and 250
ft. south (0.0 m. and 76.20 m. south). The number dropped to 0 to 4 items found every 50 ft.
(15.24 m.) from 250 ft. to 450 ft. south (76.20 to 137.16 m. south) on the baseline. The majority
(9 in total) of the identifiable manufactured domestic items were found within the first 100 ft.
(30.48 m.) of the baseline, closest to the wharf complex (Field Journals, Carter III 2010).

149
Oyster shell fragments rose exponentially along the shoreline beginning 250 ft. (76.20
m.) on the baseline. The number totaled 75 shell fragments. This sharp rise in shell numbers
possibly indicated a shell midden eroding out of the river bank. As oysters are not native to this
area of the James River, the oysters had to be transported inland to the site. Most likely the
Native Americans transported, consumed, and deposited the shells in their current location (Field
Journals, Carter III 2010).
Redbanks Landing
Redbanks Landing was located in Pitt County, North Carolina. The landing was situated
in the Tar River on the north bank. The purpose of the excavation was to determine and
document the extent of archaeological remains at the landing site and to establish a connection
between landings, historical settlements, the evolution of commerce, and resource allocation
(Southerly 2006:1).
Plantation History
The first owner of Redbanks Landing, John Speir, emigrated to North Carolina in the
early 1700s from Virginia after the Tuscarora War ended in 1713 and built the Redbanks
Landing upon his arrival. Very soon afterwards Speir’s landing became a tobacco inspection
station for the Tar River.
Beaufort County did not grant the patent for the property, however, until 1744 describing
the property as 412 acres of land accessible to the river. The year before, North Carolina’s
government passed an act that gave the justices of Beaufort County the right to construct a
warehouse at Redbanks for the collection of taxes, levies, and inspection of goods. These goods
included tobacco, beef, pork, rice, naval stores, fish, flour, butter, flax-seed, staves, heading,

150
sawed lumber, and shingles. By 1764 the Assembly made provisions to establish a ferry and an
inn at Redbanks to accommodate an increase of population and travelers in the area (Southerly
2006:65, 67).
John Speir left his property of Redbanks to his daughter Clare upon his death in 1764.
His wife, Elizabeth inherited all the cattle and a black boy. There was no probate made or other
descriptions found relating to the property and its use during John Speir's life. Clare married
Robert Slater, and they owned Red Banks Landing and its associated property through the
American Revolutionary War. Robert Slater was a member of the Pitt County Safety Committee,
formed to promote Whig propaganda, prevent insurrections, prepare military for colonial revolt,
and patrol for escaped slaves. In 1771 he became the county sheriff and he was the regiment
captain under Brigadier-General John Ashe in 1776. He also participated in the Assembly from
1777 to 1779. In 1791, Robert Slater gave Redbanks, now 320 acres, to his son John Slater, who
owned 8 slaves when he took over Redbanks and the control over the landing (Southerly 2006:
67-68, 70).
In 1811, John Slater sold Redbanks to Archibald Parker. The deed was the first reference
to activities that occurred on the property. Dead pine stumps, known as lightwood stumps,
referred to the practice of boxing trees to collect sap for the processing of turpentine. The slaves
later harvested the tree for burning in the production of tar. The tar and turpentine are examples
of naval store products that North Carolina colonists widely produced. Redbanks Landing
Plantation owners would have sent naval stores via the landing into a plantation boat to carry to
market. In 1846, Parker sold Redbanks to Arden Hatton. By the second half of the 19th century,
the landing became obsolete as a means of transporting goods to market with the introduction of

151
the railroad. By the twentieth century, the landing declined further as it turned into a recreational
point and finally a derelict (Southerly 2006:71, 75-77).
Wharf Construction
The landing site consisted of three rows of pilings running parallel with the shore,
partially submerged planking along the shore in the northwestern most portion of the site, and
pilings along the shore in the central portion of the site used as a retaining wall (Figure 5.13).
The site stretched 294 ft. (89.61 m.) along the shoreline and reached a maximum of 48 ft. (14.63
m.) into the river. The depth of the river at the end of the structure reached 4 ft. (1.22 m.). The
first row of pilings existed 12 ft. (3.66 m.) from the shore and totaled 15 in number. The second
row of pilings sat 36 ft. (10.97 m.) from shore numbered 55 in total. Piling number 13 of row 2,
beginning upriver, had a cluster of three other pilings within its vicinity existing between rows 2
and 3. Beginning with piling 24, all pilings running downriver existed in doubles with the
exception of the very last piling in row 2. The third row ran 48 ft. (14.63 m.) from shore and only
comprised of 18 pilings total (Southerly 2006:58).
Artifact Assemblage Redbanks Landing artifact assemblage contained 211 diagnostic artifacts including
prehistoric and historic ceramics, lithics, metal, glass, brick, coal, pipe stems, and organic
material. Prehistoric ceramics consisted of 82 Cashie phase dating to AD 1150- AD1425 and
other unidentifiable ceramics. Archaeologists also recovered forty-nine flakes and debitage
resulting from flint knapping or projectile point production. Stone for flint knapping included red
jasper, green Carolina slate, quartz, quartzite, and rhyolite. Archaeologists recovered one paleo-
Indian pre-form made of rhyolite that is consistent with rhyolite quarried in the Uwharrie

152
Mountains of western North Carolina. This type of pre-form has a date of 8,000 BC. Analysis of
the prehistoric finds at Redbanks suggested that the site participated in a larger trade network
before European occupation (Southerly 2006:79-84).
FIGURE 5.13. Redbanks Landing site plan (Southerly 2006:48).
Archaeologists recovered 111 historic ceramics, although some specimens were
unidentifiable. The ceramic collection did not contain any fine ceramic pieces but included
utilitarian or inexpensive tableware. Ceramic types included yellow ware, delftware,
annularware, creamware, feather edged (creamware), poluchrome painted, transfer print, Bristol
slipware, spongeware, pearlware (hand painted), pearlware (flow blue), pearlware (shell edged),
stoneware (Rhenish), Albany slipware, white salt glazed stoneware, porcelain (modern),
porcelain (English), and redbody slipware. The utilitarian ceramics found support the hypothesis
of an ordinary or inn existing by the landing as instructed by the Assembly with the
establishment of the ferry at Redbanks Landing. Most ceramics fell between the date range of
1750 and 1800 and gave a mean date range of 1784, which suggested that this was the heaviest
use of the landing site. The overall date range for the site falls between 1575-1950,

153
demonstrating a long period of site use although the few ceramics found could not give a
definitive date range (Southerly 2006:84-87).
Archaeologists recovered five pipe stem fragments, which provided too small a sample
for an accurate site date range. Only four fragments contained dateable bore diameter, and all
had 1/16th or 4/64th in. This is a consistent date range of 1710 to 1800 using Harrington’s model
for dating pipe stems (Harrington 1978:63-65; Binford 1978:66-67; Southerly 2006:88).
Scattered across Redbanks were large quantities of coal, mainly in three large mounds. The
presence of coal corresponds with the use of the landing site during the steamboat era, suggesting
that steamboats docked at the landing in the nineteenth and early twentieth centuries (Southerly
2006:89). All brick fragments found on site were modern, uniform in colors and tightly grained.
Archaeologists did not find any whole bricks in the assemblage (Southerly 2006:89). Fastener
finds include seven hand wrought nails with a long date range between seventeenth to nineteenth
centuries. None of the wrought nails had their heads intact thereby preventing a more accurate
date. Also found was one machine cut nail dating post 1830 and two square wrought iron spikes
dating to the late nineteenth and early twentieth centuries (Southerly 2006:90). Glass fragments
recovered from the landing consist of modern bottle glass, modern window glass, and molded
glass of clear, blue, brown, and green colors. Archaeologists could not use the glass as a dating
tool because most was modern and other examples too small for dating purposes (Southerly
2006:91-92).
Archaeologists recovered organic materials from the site including burned wood, shell
material, a pig tooth, and two small unidentifiable bone fragments. None of the organic materials
were large enough or in great number for a conclusive statement about the purpose of their
presence on site (Southerly 2006:92).

154
Modern artifact inclusions included .22 caliber bullet casings, plastics, soda tabs, and
wine cork. These modern inclusions support the hypothesis that Redbanks Landing, once
discontinued as a commercial base, became a recreational site. This also supports the notion that
commercial landing sites remain in better repair than recreational landings as Redbanks did not
fall in disrepair until the steamboat era ended in the early twentieth century and landings were no
longer significant in the movement of goods to market (Southerly 2006:92-93).
Mepkin Abbey Dock (38BK48)
Mepkin Abbey Dock is located in Berkeley County, South Carolina, on the west branch
of the Cooper River adjacent to Mepkin Abbey, formerly Mepkin Plantation. The Cooper River
is one of three rivers that empties into Charleston Harbor and has a drainage area of 12,484 sq.
mi. (20,091.05 sq km.) (Harris, Moss, Naylor 1993:5). The wharf is situated in the freshwater
marshes 164.04 ft. (50 m.) upstream of Mepkin Abbey Shipwreck (38BK48) at UTM Easting
597600 Northing 3664240. Former home of Henry Laurens, Mepkin Plantation and its wharf fall
within the Cooper River Historic District (Edmonds 2003:11). The wharf itself was recorded
during the 1992 Cooper River Survey. The objective of the survey was to update South Carolina
Institute of Archaeology and Anthropology (SCIAA) site files, locate and research new sites, and
create a report that would present previously unpublished archaeological information and
provide a compilation of data for future research (Harris, Moss, Naylor 1993:1).
Plantation History
The 3,000 acres of land for what is now Mepkin Abbey, formerly Mepkin Plantation, was
granted to three brothers, Peter, Thomas, and James Colleton. James Colleton had the good
fortune to survive both brothers and therefore, as customary of joint ownership, become the sole

155
owner. When he died in 1706, James left Mepkin Plantation to his eldest son John Colleton, who
sold the plantation to Henry Laurens in 1762. Laurens, widely known as the wealthiest colonist
pre-revolutionary war (National Register Nomination 2003:31), was not only the owner of
several plantations and a prominent planter, but also a merchant, ship owner, and slave trader.
Rice production used 500 acres of the 3,000 estate. The Mepkin Dock is located where there
once was a rice field or reserve on the east side of the Cooper River (Harris, Moss, Naylor
1993:19-20; National Register Nomination). When Laurens returned to America after his release
from British capture in 1784, he found his Mepkin Plantation house burned by the British. He
subsequently moved into the overseer’s cottage at Mepkin until a new house was built. He died
in 1792. The plantation stayed in the family until 1916 when it was sold. In the 1960s the
property was donated to the Trappist monks of the Cistercian Order establishing Mepkin Abbey
(Harris, Moss, Naylor 1993:19-20).
In 2003 the plantation manor complex and Mepkin Abbey Dock was incorporated into
the newly created Cooper River Historic District as part of 30,020 acres. The District’s purpose
is to protect cultural resources spanning from the 18th to the 20th centuries including
archaeological sites, historic buildings and structures, landscape features, and submerged cultural
sites (National Register Nomination).
Wharf Description and Analysis
Mepkin Abbey Dock is a bulkhead style wharf with cribbing comprising three sides and
the shore the fourth (Figure 5.14). Fashioned in the cobb-style, the wharf has three rows of
stretchers anchored into the shore and one row of header logs. The wharf runs 42.6 ft. (12.98 m.)
from the shoreline bluff into the river and is 32.8 ft. (9.99 m.) wide. The central stretcher is
located at 17.8 ft. (5.43 m.) from the south side of the wharf. Each side of the wharf consists of
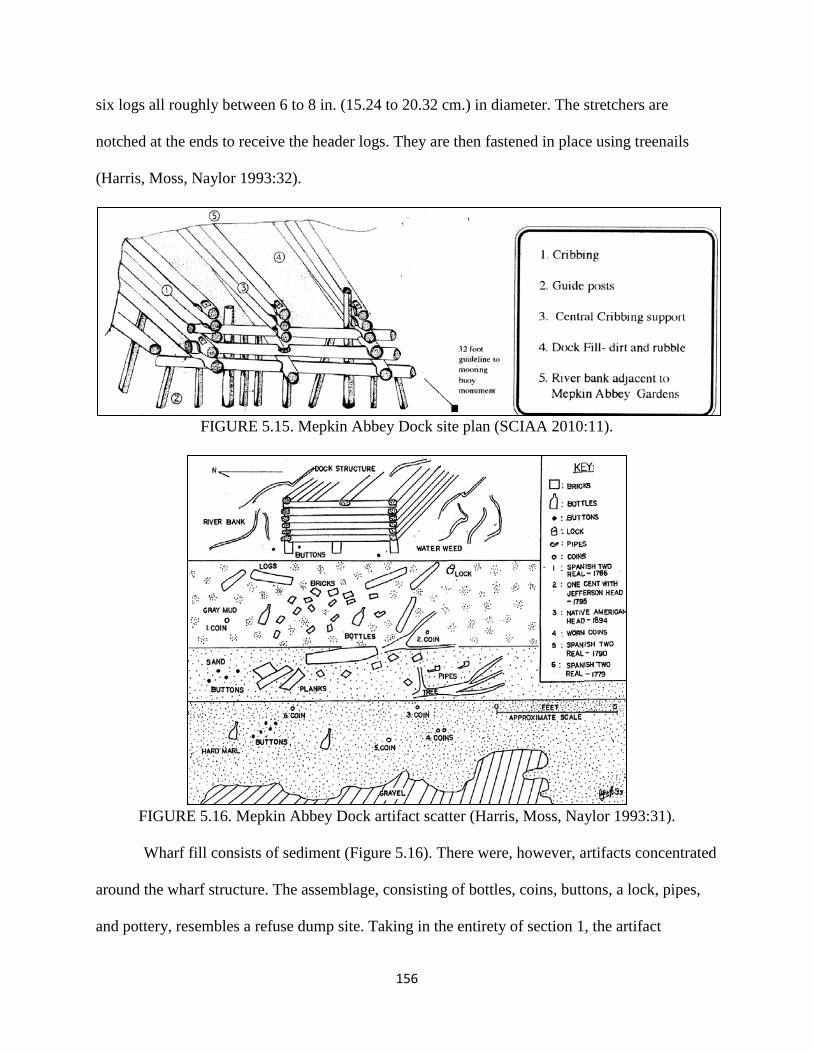
156
six logs all roughly between 6 to 8 in. (15.24 to 20.32 cm.) in diameter. The stretchers are
notched at the ends to receive the header logs. They are then fastened in place using treenails
(Harris, Moss, Naylor 1993:32).
FIGURE 5.15. Mepkin Abbey Dock site plan (SCIAA 2010:11).
FIGURE 5.16. Mepkin Abbey Dock artifact scatter (Harris, Moss, Naylor 1993:31).
Wharf fill consists of sediment (Figure 5.16). There were, however, artifacts concentrated
around the wharf structure. The assemblage, consisting of bottles, coins, buttons, a lock, pipes,
and pottery, resembles a refuse dump site. Taking in the entirety of section 1, the artifact

157
assemblage was concentrated the most in this area in comparison to the other eight sections
consisting of 56 percent of the entire artifact assemblage for the survey with historic period
artifacts dominating over prehistoric artifacts. Pipe fragments comprised 62 percent of the
section 1 assemblage while buttons constituted 18 percent. Other section 1 artifacts were musket
balls, a trigger guard, coins, glass, prehistoric ceramics and projectile points, historic ceramics,
locks, nails, lamp parts, hardware, shoe buckles, lead and copper sheathing, and colonoware.
Section 1 had a larger percentage of colonoware than any other section in the survey area. This is
believed to be a result of Mepkin Plantation having been inhabited primarily by slaves.
Charleston was Henry Laurens and his family’s primary residence. Other historic ceramics found
were creamware, whiteware, blue transferred-printed porcelain, and salt-glazed stoneware
(Harris, Moss, Naylor 1993: 32, 48).
Cedar Grove Plantation Landing (38DR155)
Cedar Grove Plantation landing is located on the north bank of the Ashley River in
Dorchester County, South Carolina. Situated at 32° 54’ 07’/80° 07’ 15”, the site is 0.9 mi.
(1.45 km.) from Middleton Place Plantation and Gardens. The landing was discovered during a
cultural resource survey of the construction site of a proposed wharf off the Whitehall
Subdivision. South Carolina citizens became concerned for the landscape integrity of the nearby
historic Middleton Place Plantation and Gardens, which prompted SCIAA to perform the survey
(Beard 1990:1-2).
Plantation History
During the colonial period, the Ashley River was the major artery of transportation and
key to economic growth for those who owned plantations on or near its waters. The river led to

158
the major port city of Charleston, the commercial hub for South Carolina. South Carolina
colonists engaged in the rice, cotton, and timber trade to best use the available natural resources
such as forests and swamp land. Major plantations located on the river include Drayton Hall,
Archdale Hall, Middleton Place, and Cedar Grove (Beard 1990:5).
Cedar Grove Plantation in Dorchester County, South Carolina, was originally part of a
370 acre tract granted in 1684 to Francis Turgis of Hampshire, England. His daughter, Mary,
married Walter Izard Sr. bringing Cedar Grove into the Izard family (“Izard of South Carolina”
1901:227). It is believed that the plantation house was built by Izard sometime between 1740 and
1750 (Beard 1990:5). He served on the Commons House of Assembly for Berkeley County from
1713 to 1730 and for St. Bartholomew’s and Colleton County from 1734 to 1738. He was also in
the Commission of the Peace for Berkley until his death in 1750 (“Izard of South Carolina”
1901:227).
When Walter Izard Sr. died in 1750, his executors compiled his probate in 1751. It
showed that he owned a total of 255 slaves, of whom 85 lived and worked Cedar Grove
Plantation. On Cedar Grove he maintained a stock of cattle, a stock of hogs, 40 sheep, and 9
horses. He also owned one-half share in a schooner (Inventory of Walter Izard 1751).
The property passed through the Izard family from Walter Izard Sr. to his son Walter
Izard Jr., served as justice of the peace and was elected to the Commons for St. George’s from
1736 to 1747. He then represented St. James Goose Creek from 1755 to 1756, and finally
represented St. George’s again from 1757 until his death. He also served as an officer in the
provincial army and made colonel of the Berkley Regiment. Walter Izard Jr. died in 1759. He
left Cedar Grove to his son John Izard. Water Izard Jr.’s probate showed that Izard owned 89
slaves at Cedar Grove Plantation (“Izard of South Carolina” 1901:231-232).

159
John Izard was a member of the Commons for St. James, Goose Creek in 1744. He also
served on the First Provincial Congress and in the Commission of the Peace for Charleston
District in 1775 and 1776 (“Izard of South Carolina” 1901:232-233). He died in 1780 having left
the property to his sister, Mary Izard Middleton, the wife of Arthur Middleton of Middleton
Place across the Ashley River (Beard 1990:5). The Middleton family held the property until
1820 when John Izard Middleton sold the property out of the family (Smith 1919:40). During the
Civil War, union troops destroyed the brick plantation house and it was never rebuilt and was
described to be nothing more than a pile of bricks in 1906 (Beard 1990: 5, 7).
Wharf Description and Analysis
Cedar Grove Landing archaeological site consisted of an earthen causeway running from
the end of a dirt lane, across a tidal marsh, and ending on the north bank of the Ashley River
(Figure 5.17; Beard 1990: 2). A nineteenth-century newspaper article depicts the landing as “a
cause-way, leading to a boat and wood landing in front of the house” connecting the land to the
river (Charleston Daily Courier 08/21/1857). A 1791 plat of Archdale Hall on the Ashley River
shows a similar causeway used to access the river from the main land (Zierden et. al. 1986:35).
The causeway is comprised of soil, brick rubble, stone, and shell fill. No diagnostic artifacts
were found during the visual survey of the causeway. Archaeologists believe that a canal once
ran along the northern side of the causeway. Evidence is given by an absence of marsh
vegetation whereas vegetation butts up against the causeway on the opposite side (Beard
1990:2).
At the extant of the causeway, archaeologists found the articulated remains of a landing
structure. Visible at low tide are a series of pilings or puncheons, squared posts, and squared
horizontal timbers. Archaeologists believed that these timbers formed the foundation of a wharf

160
(Feature 1). Four bricks bonded together by mortar were found near the wharf. It is believed that
it once was part of the wharf’s fill material. At the mouth of the canal along the west side of the
causeway is a 3 in. by 12 in. (7.62 cm. by 30.48 cm) plank and disarticulated rough-cut trimmed
timbers fastened perpendicular to each other (Feature 2). Farther in the river were plank
fragments and disarticulated finished timbers. They are not believed to be related to the wharf
site or Feature 2 (Beard 1990:7, 9).
FIGURE 5.17. Cedar Grove Plantation Causeway (Beard 1990:8)
Archaeologists noted a lack of diagnostic artifacts on the wharf site, in the causeway, and
along the shoreline. Only one grey stoneware sherd with a blue hand-painted design was found,
but not collected. Heavy siltation of the wharf site is believed to explain the absence of artifacts
at what was once a busy cultural site. The artifacts are most likely buried beneath the silt along
with the remaining wharf structure and possibly other archaeological features. The river bottom
is comprised of light sand, silt, and mussel shell from the banks that extend 19.69 ft. (6 m.) out

161
into the river. Gradually it changes to a silt and sand combination towards the middle of the river
(Beard 1990:5, 9).
Middleburg Plantation Landings
Middleburg Plantation is situated on the East Branch of Cooper River in Berkeley
County, South Carolina, in the Low Country of the Coastal Plain. The tract is 25 mi. (40.23 km.)
from Charleston, and originally maintained roughly 7,260 ft. (2212.85 m.) of river front but
currently only holds 3,300 ft. (1005.85 m.). The area believed to have contained the plantation
landings exists 1,900 ft. (579.12 m.) northwest of the main house. The main depth of the river
channel adjacent to the proposed boat landing locations was roughly 15 ft. to 20 ft. (4.57 m. to
6.09 m.) with main tidal fluctuations of 2 ft. (0.61 m.). The river is fresh water at the plantation
and the tidal fluctuations created fresh water marshes suitable for the extensive rice production
during the late 18th and early 19th centuries (Errante 1993:46-47).
Plantation History
Benjamin Simmons I received a land warrant in 1697 for 100 acres. By his death in 1717,
Simmons I had come into possession of 1,545 acres and established Middleburg Plantation. His
son, Benjamin Simmons II, inherited the property and died in 1772, leaving Middleburg to his
eldest son, Benjamin Simmons III. When Simmons III died in 1789, the property was divided
amongst his three daughters, Lydia, Catherine, and Mary. Lydia, the eldest received the main
Middleburg tract, while Catherine received Halidon Hill, and Mary received Smokey Hill. Lydia
Simmons married Jonathan Lucas Jr., and the main Middleburg Tract remained in the Lucas
family until 1872. In 1872, John Coming Ball purchased the Middleburg Tract and through
marriage, he acquired both the Halidon Hill and the Smokey Hill tracts, reuniting the 1,545 acres

162
of Middleburg Plantation. Upon Ball’s death, Middleburg passed on to his daughter Marie
Guerin Ball, wife of Edward Von S. Dingle, until the main tract was purchased by the Hill family
of Charleston (Errante 1993:49-50).
The inventory of Benjamin Simmons II who owned Middleburg Plantation from 1717 to
1772 showed that there was a wide diversity of activities occurring on the plantation including
barrel making, black smithing, lumbering, saddler, shoemaking, spinning, and tanning. Animal
husbandry also occurred as the inventory lists 58 hogs, 63 sheep, 35 working oxen, 21 bulls, 19
yearlings, 31 calves, and 11 horses. The plantation produced corn, peas, oats, and rice. Errante
hypothesized that of the various activities and productions occurring on the plantation, only
livestock, lumber, and rice were the marketable commodities. All other activities and products
contributed to the needs of daily living. To support the plantation activities, Simmons owned 87
slaves, 1 large canoe, 1 flat, 1 small canoe, and co-owned the schooner Two Brothers (Errante
1993:55-56).
Wharf Description and Analysis
Archaeological investigations of the two landing sites shown on the 1789 plat of
Middleburg Plantation did not result in the location and analysis of the landings. The 1789 land
plat documented the presence and location of a main house, dikes, rice fields, a store house, a
machine shop, slave houses east of the main house, and two boat landings. The Simmons family
constructed two boat landings at critical points on the main bank where cross banks intersect on
either side of the main house. Both the upstream and downstream landings connected to a road
that originated near the main house, traveled to the rice fields, extended along a cross bank, and
ended at the landing. The downstream landing had a small island with a store house that was
used for keeping goods designated for export. The Simmons family modified the cross banks as

163
extensions of the road for easy movement of goods to and from the boat landings (Errante
1993:51, 53-54).
Errante hypothesized that the construction of the rice toll-mill on the property in 1800
destroyed the upstream landing. The rice mill on the Middleburg Plantation was the first to be
constructed in South Carolina. The plantation used the mill to remove the rice kernel’s outer
husk. For a fee, other planters could use the mill. This prompted more boat travel to Middleburg
Plantation and created the need to construct a canal to the mill to support boat traffic. The mill
existed at the head of a small creek that flowed out of Middleburg between rice fields and into
the Cooper River. The plantation owner widened the canal after the mill’s construction allowing
visiting vessels to enter and moor at the mill. Errante hypothesized that the process of creating
the canal destroyed the upper boat landing, because it existed adjacent to the mill creek (Errante
1993:54-55).
The underwater archaeological survey resulted in the identification of two features,
designated as Feature 1 and Feature 2. Feature 1 was a pile of broken bricks and rock. Located
132 ft. (40.23 m.) downstream of the storehouse landing, it rested in 5 ft. (1.52 m.) of water. The
brick and stone deposit averaged 30 ft. (9.14 m.) in diameter. Errante also collected a colonoware
ceramic sherd from the deposit and hypothesized that it could be a seventeenth-to eighteenth-
century Native American pottery sherd, or an eighteenth-to nineteenth-century African American
or Euro-American pottery sherd. Errante hypothesized that Feature 1 was a ballast pile. As rock
outcrops are not natural to the low country of South Carolina, colonial planters used brick as a
substitute for ballast (Errante 1993:77-79).
Feature 2 existed as a small deposit of rock and gravel located 16.5 ft. (5.03 m.) from the
main bank at the storehouse landing on the 1786 plat. The deposit sat in 5 ft. (1.52 m.) of water

164
and ranged 13 to 14 ft. (3.96 to 4.27 m.) in diameter. Errante did not find any associated cultural
artifacts to date the deposit. He hypothesized that the deposit could have been a ballast pile from
a vessel or material used to fill the eighteenth-century landing (Errante 1993:79-80).
Conclusion
Waterscape archaeology plantation history, focusing on the colonial period, combined
with archaeological documentation, will provide a clear idea of the landowner’s wealth. While
archaeological studies have provided information on wharf construction methodologies, artifact
type and distribution, and plantation history, they did not easily define the use of a wharf.
Chapter 4 provides an example of colonial trade at plantation wharves and creates a clear idea of
the importance and attention colonists applied to their physical connection to the world outside
their plantation.

CHAPTER 6
WHARF CONSTRUCTION AND ECONOMIC PROSPERITY
Studies of wealth comparisons in the colonial era are numerous and focus on specific
localities, regions, or encompassed all British colonies from Canada to the West Indies. The date
ranges have encompassed the whole of English settlement in North America to one specific year.
The research is often broad to compensate for shortfalls of information; much sought after data
no longer exist. It is evident that wealth and economic comparisons are complex and often
overwhelming to accomplish. This chapter attempts to correlate plantation wharf construction
methodology and plantation wealth. Plantation wealth is measured in land and slave value and
compared to the individual plantation’s colony for status. Only by understanding a North
Carolina plantation’s status within the colony can it be compared to a plantation in South
Carolina.
To thoroughly calculate wealth a detailed list of information is needed that may no longer
exist: age of death, occupation(s), evaluation of inventoried items, value of real estate, and the
amount of financial liabilities (Jones 1980:xxvii). There are many data sources including
property tax lists, export records, reports of provincial governors to the Lords of the Council for
Trade and Plantation in London, probate inventories, abstracts of wills, histories of wages and
prices of agriculture and manufacture, contemporary newspaper advertisements, account books,
diaries, and traveler’s observations (Jones 1980:3). All the possible sources of information may
have limitations. Only probate inventories give detailed, individual wealth appraisals and none,
except probate inventories and wills, are available by year and location. Probates, however, are
rare as they were rarely done in the South, and few survive. Probates have many benefits as
sources. They allow across the broad examination of private wealth between colonies during a

166
single year or period. The relative completeness of an individual’s itemized wealth makes it
possible to summarize the kinds of wealth held by each individual as these records clearly show
the accumulated possessions at the time of a person’s death (Jones 1980:7-8). Probate inventories
showed various values including pounds, shillings, and pence, local currency such as bills and
notes of the provincial government, credit or debts valued in pounds, shillings, and pence of the
particular colony, and personally signed notes bearing interest (Jones 1980:8).
It is important to understand the terminology used in studying colonial plantation wealth
to properly distinguish the implications. Wealth refers to anything that holds market value
whether monetary or exchange and includes such physical assets as land, tangible man-made
goods used for production or for consumption, and intangible assets such as claims against
others. Capital is the stock of physical goods used to further the production of more goods.
Capital is reproducible and usually durable and includes tangible assets such as tools, equipment,
buildings, and improvements to land. Capital can wear out with use, and its value can depreciate.
The depreciated goods must be replaced or strengthened by increased production above current
consumption if the capital stock is to remain the same or increase. Capital can also be a stock of
money value resulting from savings in currency or a financial claim. Capital can also be anything
that yields future income and also offsets the future cost of its maintenance, such as human
capital and nonhuman capital (Jones 1980:15-17).
Income is a current flow of money or in-kind service during a period resulting from the
use of capital or durable goods. Income may be received as a payment for services rendered as
wages, salary, or from rent of land. Property is the legal right or claim to a particular asset, and
the absolute control over the tangible asset whether land, building, animal, or human. Lastly, net-

167
worth is equity, or what is owned. Net-worth can be calculated by taking the sum of all the
individual’s legal wealth assets and subtracting all that is owed to others (Jones 1980:18).
Wealth and capital are nearly identical terms. Wealth is a broader term, but both
contribute to future consumption, may be considered as a stock of physical or financial assets or
a combination of the two. Both may also include wealth in the form of human capital (Jones
1980:18). A high present level of wealth implies that past production yielded a surplus above the
level of consumption. It also promises a relatively high future consumption as it will yield future
income that after replacement of wear and tear, can be used for future immediate consumption or
investment in durable consumer goods, producers’ goods, or land (Jones 1980:19).
The compared plantations’ wealth and status was calculated by adding their hypothesized
land value to the owners’ human capital. Whereas most colonial wealth distribution studies
considered all or most aspects of capital, income, and net worth in their analysis (Jones 1980;
Lemon and Nash 1968; Main 1977; Menard, Harris, Carr 1974; Walton and Shepherd 1979), that
was not viable when considering specific plantations as dissimilar quantities and qualities of
historic records pertaining to wealth exist for each plantation. It was therefore necessary to find a
way to analyze wealth with the minimum information available, but at the maximum level of
quality allowed.
Michael J. O’Brien and Teresita Majewski (1989:65, 72, 91) attempted to reconstruct
consumer profiles for households in northeastern Missouri and possibly link differences in
material items to the household’s economic position. In order to do so, the scholars analyzed
discarded ceramic materials from two middle class households. To discern social rank, they used
land and slave values. Choosing land and slave values avoided problems of using tax lists as
described by James T. Lemon and Gary Nash (1968) in their “Distribution of Wealth in

168
Eighteenth-Century America: A Century of Change in Chester County, Pennsylvania, 1693-
1802”. Lemon and Nash used largely complete tax lists to plot wealth distribution and economic
mobility, but cautioned on the level of accuracy. While tax returns often gave separate
assessments for some physical wealth, not all forms of wealth were reported and taxed. The
second cause for concern resulted because assessors “had a marked tendency to undervalue the
estates of the more affluent property owners (Lemon and Nash 1968:8).” This caused a reduction
of the average values of estates and compressing the range. Lemon and Nash (1968:9) suggested
correlating tax lists with inventories of estates in probate records to provide a more accurate
description of wealth, but acknowledge that doing so was not a viable solution as estate
inventories were infrequently completed or filed, and land values rarely included. O’Brien and
Majewski (1989:65) attempted to avoid complications with tax lists by simplifying wealth
indicators to land and slave values, a large percent of a colonist’s wealth. While Lemon and Nash
(1968:9) found that land composed the largest part of assembled wealth in rural areas of Chester
County, Pennsylvania, slaves held that honor in the southeast.
Maryland Virginia North Carolina South Carolina
Cost per Acre 1-08-10 0-12-07 0-10-02 1-10-02 TABLE 6.1. 1774 rural land price per acre for 500+ acre plots by colony
in pounds, shillings, and pence sterling (Jones 1980:1742-1752).
Land values reflect natural attributes such as soil fertility and location as well as man
made changes and enhancements (Wright 2006:58). Jones (1980:1742-1752) in her 1774 wealth
study of the thirteen American colonies calculated land value per acre based on probate records
and land assessments (Table 6.1). She subdivided the cost based on 50, 100, 500 acre plots and
whether the plots were riverfront properties. This thesis used the calculated cost per acre of 500
acre plots on the river as the basis of land value calculation as each property had river access and

169
exceeded 500 acre plots with the exception of Redbanks, which was a 320 acre plot. Redbanks
acreage fell more closely to the 500 acre category than the 100 acre, and as there is only a four
pence difference between the two costs per acre calculations, the difference is negligible in this
comparison. Jones’ land value calculation is for the year 1774, late in the colonial era. While an
earlier land value calculation might be more accurate for comparing the plantations in this study,
extensive research has failed to provide an alternative. The plantation acreage used in this study
came from various sources that provided plantation details. No single year could be chosen for
comparison purposes unless using the 1790 Federal Census. Even so, slave population and
acreage were derived from the 1790 Federal Census as a last effort to find the necessary
information.
Period Percentage 1722-26 45 1727-31 48 1732-36 40 1737-41 48 1742-46 48 1747-51 50 1752-56 51 1757-62 51
TABLE 6.2. Slave wealth as a percentage of total wealth in South Carolina, 1722-1762 (Coclanis 1989:87).
Slavery was considered a form of human capital. Ownership claims to slaves and
indentured servants were legal in colonial America. The value of a slave equated to the product
produced by the slave and capitalized subtracted from the costs of slave purchase, rearing, and
maintenance. Colonists had legal claim to the product of the slave’s or indentured servant’s
work. The owner was therefore responsible for the worker’s maintenance. Because the slave or
indentured servant was considered capital, he or she could be sold. In the creation of wealth,

170
slaves and indentured servants were product agents whose value could be coupled with other
producers’ goods as an element of capital used in production (Jones 1980:23-24, 33).
Jones (1980:24, 100-106) claimed that it is important to include the value of human
capital when considering wealth because it was what chiefly gave the South its wealth
advantage. Owners benefited from the product of slaves’ work with considerable real income.
Slave offspring were legal property of their parents’ owners and worked alongside their parents
at a young age producing far above the cost of their maintenance. The only cost of slaves was
purchase and upkeep, which owners recouped in just a few years, especially in South Carolina.
Coclanis (1989:87) calculated that in the 1722-1762 period slaves comprised roughly 50 percent
of a colonist’s total wealth (Table 6.2). Jones (1980:104) averaged the components of private
wealth for the southern colonies, excluding Georgia, and found that human capital comprised 34
percent and land 46 percent of a wealthholder’s total physical wealth. This makes human capital
and land worth 80 percent of a wealthholder’s total physical wealth and agreeing with Walter
Edgar’s (1998:142) assessment. Those who possessed slaves or indentured servants were,
therefore, richer than those who did not because of a high productivity rating (Edgar 1998:140).
Because this study used Jones’ calculated land values of cost per acre, it seemed prudent
to use her average value per slave. Jones (1980:114n) used a random sampling technique to
choose the provinces from which to derive her average values. Her samples from each colony
include: Queen Anne and Ann Arundel for Maryland; Charlotte-Halifax, Southampton-
Brunswick-Mecklenburg, and Chesterfield-Fairfax-Spotsylvania county groups for Virginia;
Orange and Halifax in North Carolina; and Charleston District in South Carolina. Her values for
each colony (Figure 6.3) reflect “the skills, health condition, age, and sex of the particular slaves
held by the sample descendants” (Jones 1980:114). Sex and value of human capital associated

171
with a plantation in this wharf study only extends to Cedar Grove Plantation (Izard 1750).
Because all other plantations only have numbers of slaves but no corresponding values, Jones’
sample value fits best. The year representing the slave value sample and the land value also
correspond and thus produce a more representative comparison for plantation wealth.
TABLE 6.3. 1774 slave value in pounds sterling by colony (Jones 1980:114).
Discerning ranking of wealth by colony was considered two ways: first by the average
annual commodity exports of the southern colonies and by average wealth per free person. As
Coclanis (1989:87), Jones (1980:104), Edgar (1998:142) agreed that land and slave wealth
comprised 80 percent of a colonist’s wealth, average slave and land value per colonist gave an
indicator of the overall wealth of the colony. If disregarding population, Virginia produced the
largest value of exports, comprising 45.5 percent of the total followed by South Carolina,
Maryland and finally North Carolina (Table 6.4 and Figure 6.1). When the totals averaged per
capita and per European, South Carolina became the clear frontrunner at £9.4 per European
followed by Virginia (£3.02), Maryland (£2.87), and finally North Carolina (£0.6) (Table 6.4).
Although
Colony Total Per Capita Per European Maryland 398,000 1.96 2.87 Virginia 783,000 1.75 3.02 North Carolina 76,000 0.39 0.6 South Carolina 463,000 3.73 9.44
TABLE 6.4. Average annual commodity exports of the southern North American colonies 1768-1772 in pounds sterling (Shepherd and Walton 1972:47).
Colony No. of Slaves No. of Owners
Avg. No. of Slaves per Owner
Avg. Value Per Slave
Maryland 325 41 8.0 25.9 Virginia 428 49 8.7 32.7 North Carolina 328 37 8.7 37.9 South Carolina 2,346 70 33.5 45.8 South Total 3,422 197 17.4 35.5

172
FIGURE 6.1. Percentage of average annual commodity exports
of the southern colonies 1768-1772 (Shepherd and Walton 1972:47).
Although Virginia ranked first in total average export value, it came second to South Carolina in
terms value per capita and per European because Virginia’s larger population. Similary, North
Carolina’s dismal numbers can be explained. North Carolina produced lower valued
commodities, but maintained a large population, which resulted in a low average. The same
colony ranking occurs when comparing physical wealth in terms of human capital and land
value.
Physical Wealth Maryland Virginia North Carolina South Carolina Total Human Capital 214.2 382.7 269.5 1772.3 2638.7 Land Value 513.3 587.7 140.2 558.3 1799.5 Total Value 727.5 970.4 409.7 2330.6 4438.2
TABLE 6.5. Average land and slave physical wealth in pounds sterling per wealthholder by colony in 1774 (Jones 1980:380).
Derived from Jones’ (1980:380) sampling of 1774 wealthholders in the southern
colonies, the analysis provides similar results in wealth distribution (Table 6.5). South Carolina
by far held the largest quantity of physical wealth per wealthholder with an average of £2330.6
or 53 percent of total physical wealth (Figure 6.2). The rank continues in the same descending
order seen in Table 6.4. The only differences occur when viewing human capital and land value
23.1
45.5
4.4
27
0
10
20
30
40
50
Maryland Virginia North Carolina South Carolina
Percentage of Export Value, 1768-1772
Percentage of Export Value, 1768-1772

173
individually. South Carolina ranked second in land value behind Virginia, while North Carolina
ranked third in front of Maryland in slave value.
Jones justified the greater land value in Virginia than in South Carolina as a result of city
land holding lower value to agricultural land. South Carolina’s sampling included Charleston.
The “great amounts of improvement, not only in buildings but in drainage and other
improvements on the tobacco, rice, and indigo land” (Jones 1980:109) created higher agricultural
land values than city land values.
Jones (1980:116) explained that the discrepancy in human capital value could be derived
from the lower value of indentured servants. The 1774 study found that of the southern colonies,
indentured servants were most frequently found in Maryland records but were negligible
elsewhere. Jones hypothesized that the economic importance of indentured servants in 1774
ranked far less than the slaves who were vital to the production of high value export products of
tobacco, rice, and indigo. She further hypothesized that Maryland slave values were lowest
because Maryland planters in the sample providences were switching from tobacco to grain
production, a less profitable commodity (Jones 1980:118; Klingaman 1969:279).
FIGURE 6.2. Percentage of total land and slave wealth for
the southern colonies, 1774 (Jones 1980:380).
16.4 21.9
9.2
52.5
0 10 20 30 40 50 60
Maryland Virginia North Carolina
South Carolina
Percentage of Total Land and Slave Wealth
Percentage of Total Physical Wealth

174
Ranking the southern colonies by export value and wealth distribution allowed for the
construction of a base to explain the individual wealth status of each plantation in this wharf
study. In total wealth, including land worth and slave worth, the South Carolina plantations
ranked highest with Mepkin Plantation’s total worth at £18173-08-00 followed by Cedar Grove
Plantation at £6562-15-00. Virginia’s Shirley Plantation ranked third, followed by North
Carolina’s Armistead Plantation (Bowling Farm Site), Maryland’s Pemberton Hall (Mulberry
Landing Wharf), and finally North Carolina’s Redbanks. The ranking order of wealth for the
plantations appears slightly out of order with Pemberton Hall falling behind Armistead
Plantation. In both Figures 6.1 and 6.2, Maryland is ranked third behind South Carolina and
Virginia with North Carolina last. This puts into question the Pemberton Hall’s position in
Maryland’s wealth hierarchy.
Plantation Acres Acres Worth Slaves Slaves Worth Total Worth
Pemberton Hall 970 (1732) 1398-08-04 16 (1762) 414-08-00 1812-16-04 Shirley Plantation 740 (1782) 465-11-08 134 (1787) 4381-16-00 4847-07-08
Armistead Plantation 750 (1791) 381-05-00 79 (1790) 2994-02-00 3375-07-00 Redbanks 320 (1790) 162-13-04 8 (1790) 303-04-00 465-17-04
Mepkin Plantation 3000 (1762) 4525-00-00 298 (1790) 13648-08-00 18173-08-00 Cedar Grove Plantation 1770 (1750) 2669-15-00 85 (1750) 3893-00-00 6562-15-00 TABLE 6.6. Southern plantations total land and slave wealth estimates with worth represented in pounds sterling (Somerset County Records 1732; Prerogative Court 1763; McCartney 1997; Bertie County Register of Deeds; 1790 Census; Chesnutt 1972; Inventory of Walter Izard 1750).
Trevor Burnard (2002:35; 38) found that colonists needed 350 acres and a work force of
over ten slaves to combat soil exhaustion in the settled parts of the Chesapeake. Pemberton
Hall’s large tract of land put it with in upper ranks of Maryland’s elite land ownership. It ranked
third in land values amongst this study’s plantations, but it had low slave holding numbers (Table
6.6), a mere 16 slaves for 970 acres compared to Armistead Plantations’ 79 slaves for 750 acres.
This showed that production rate for Pemberton Hall would have been was low. Each slave at
Pemberton, assuming all 16 worked in the fields and all 970 acres were worked, that equates to

175
roughly 60 acres per slave. For Armistead Plantation, each slave only had to work roughly 9
acres. Shirley Plantation worked fourth in land values behind Pemberton Hall, but second in
slave values. This also reflects land quantity versus labor. A slave’s production ability was
valued more than a single acre of land. This explains Shirley Plantation 134 slaves’ ability to
produce more agricultural goods on 740 acres of land at 5.5 acres per slave, than Cedar Grove
Plantation’s production ability at 20.8 acres per slave.
Plantation Acres Acres Worth Slaves Slaves Worth Total Worth Pemberton Hall 970 (1732) 989.4 16 (1762) 568.0 1557.4
Shirley Plantation 740 (1782) 754.8 134 (1787) 4757.0 5511.8 Armistead Plantation 750 (1791) 765.0 79 (1790) 2804.5 3569.5
Redbanks 320 (1790) 326.4 8 (1790) 284.0 610.4 Mepkin Plantation 3000 (1762) 3060.0 298 (1790) 10579.0 13639.0
Cedar Grove Plantation 1770 (1750) 1805.4 85 (1750) 3017.5 4822.9 TABLE 6.7. Value of land and slaves using average of all southern
land and slave values in pounds sterling for slave and acre.
In contrast, this study removed export worth as a variable and used an average value of
land and slaves as the standard to calculate plantation physical wealth (Table 6.7). The average
slave value for the southern colonies of Maryland, Virginia, North Carolina, and South Carolina
was £35, and the average cost per acre of land for the same colonies was £1.02. By comparing
plantations without regards to output, it is possible to see the significance of the commodity
produced and its value. Mepkin Plantation’s position never changed; the plantation had the
largest number of slaves and the most land. Shirley Plantation ranked second in total wealth and
slave values; the plantation’s outcome was largely influenced by having the second largest
numbers of slaves owned. Shirley ranked seconded lowest in land value simply because the
plantation possessed the second fewest acres. Land worth made little difference when comparing
plantation worth because worth was higher per slave than per acre; therefore, rank of total worth
was dependent on number of slaves owned and progressed as followed: Mepkin Plantation (298

176
slaves), Shirley Plantation (134 slaves), Cedar Grove Plantation (85 slaves), Armistead
Plantation (79 slaves), Pemberton Hall (16 slaves), and Redbanks (8 slaves).
Plantation Real Acres % Avg. Acres % Real Slave % Avg. Slave % Pemberton Hall 77.1 63.5 22.9 36.5 Shirley Plantation 9.6 13.7 90.4 86.3 Armistead Plantation 11.3 21.4 88.7 78.6 Redbanks 34.9 53.5 65.1 46.5 Mepkin Plantation 24.9 22.4 75.1 77.6 Cedar Grove Plantation 40.7 37.4 59.3 62.6 TABLE 6.8. Total acre worth and total slave worth as percentages of individual
plantation total land and slave worth using real values and averaged southern values. The southern plantations in this study invested greatly in slaves. With the exception of
Pemberton Hall, all other plantations held over 50 percent of their wealth in slaves (Table 6.8).
Referring back to Table 6.2 and Coclanis’ (1989:87) and Jones’ (1980:104) findings regarding
slave values as a percentage of a plantation’s total worth, these five of the six plantations in this
study exceed their findings. Supposing that land value and slave value composed 100 percent of
total physical wealth, and all other commodities such as animals, equipment, and household
goods held no value, the average percentage that owners invested in slaves as a portion of their
total physical wealth exceeded 60 percent for the real slave value (66.9%) and the average slave
value (64.7%). The top three plantations far exceeded the 66.9 percent. Shirley Plantation owners
invested 90.4 percent of their physical wealth in slaves; Armistead Plantation owners invested
88.7 percent; and Mepkin Plantation owners invested 75.1 percent. These high percentages
stresses the importance plantations placed on slaves as part of their overall physical wealth when
wealth is measured only in land and slaves.
Finally, considering Walter Edgar’s (1998:142) and Jones’ estimate that 80 percent of
total physical wealth was in land and slaves, the added 20 percent of other physical wealth made
a difference in understanding of slave and land wealth as a portion of physical wealth. Data for

177
Figure 6.3 were derived from the understanding that slave and land value make up 80 percent of
total wealth. The comparison showed that Shirley Plantation and Armistead Plantation invested
FIGURE 6.3. Land wealth and slave wealth as a percentage
of total physical wealth per plantation. the most in slaves and the least in land, whereas Pemberton Hall invested the most in land and
the least in slaves. When comparing total physical wealth with total land and slave wealth
(Figure 6.4), it is clear ranking order did not change and the added 20 percent other physical
wealth to the 80 percent land and slave wealth made little difference.
FIGURE 6.4. Total land and slave wealth compared to total physical wealth.
0 10 20 30 40 50 60 70 80
Land Wealth %
Slave Wealth %
0
5000
10000
15000
20000
25000
Total Land and Slave Wealth
Total Physical Wealth

178
Mepkin Plantation remains the wealthiest plantation of the six cases in this study with the other
South Carolina plantation, Cedar Grove, in second, followed by Virginia’s Shirley Plantation,
North Carolina’s Armistead Plantation, Maryland’s Pemberton Hall, and finally North Carolina’s
Redbanks.
Wharf Construction Type Width (ft.) Length (ft.)* Mulberry Landing Wharf (Pemberton Hall) Solid crib-type Wharf 182 19.6 Shirley Dock Complex (Shirley Plantation) Pilings 134** 154 Bowling Farm Site (Armistead Plantation) Cobb-type wharf; vessel crib 60 26 Redbanks Landing (Redbanks) Pilings 245 25 Mepkin Abbey Dock (Mepkin Plantation) Cobb-type wharf 32.8 42.6 Cedar Grove Causeway (Cedar Grove Plantation) Solid crib-type wharf unknown unknown
*Length from shore. **Width of total complex.
TABLE 6.9. Wharf construction comparison by type, length, and width.
Wharf construction type did not seem to correspond with plantation prosperity. It had
been hypothesized that the wealthier the plantation, the more complex the construction.
Pemberton Hall, Armistead Plantation, and Cedar Grove Plantation had the most complex crib
wharves. Pemberton Hall and Cedar Grove Plantation had solid crib-type wharves with their
fashioned headers and stretchers that fit snugly against each other, a more complex wharf
construction than cobb-type. Southern pine heartwood is moderately resistant to marine borers, a
common problem in wood exposed to water, and would extend the life of a wharf (Heintzelman
1985:22). Armistead Plantation’s wharf has a cobb-type wharf with an adjacent vessel crib.
Cobb-type wharves were constructed using unfashioned logs, sometimes with the bark in place.
The Armistead headers and stretchers possessed no bark and were made out of southern yellow
pine, a common tree type in eastern North Carolina. The vessel crib was not constructed for
wharf use originally but was the vessel’s secondary use. When vessels at Bowling Farm Site

179
became unseaworthy, the vessel owner intentionally reclaimed vessel parts, and a portion of the
skeleton was reused to extend the wharf face. Creating a vessel crib wharf was more economical
than disposing and abandoning the vessel (Rodgers 2006:1).
Both Shirley Plantation and Redbanks Landing had pilings used as the basis for their
wharves. It is unknown exactly when the wharves were constructed for both sites. Both wharf
site locations were in use from their initial construction in the eighteenth century, possibly the
seventeenth century for Shirley Plantation. There are five known wharf structures in the Shirley
Plantation Wharf Complex all at different stages of decay, only three of which are visible from
the surface (Figure 6.5). Without the use of dendrochronology it will be impossible to determine
if any of the Shirley Plantation or Redbanks Landing pilings were associated the original colonial
wharf.
FIGURE 6.5. Shirley Plantation Wharf Complex seen at low tide (Photo by Taft Kiser, courtesy
of Charles H. Cater III).
Mepkin Abbey Dock was surprisingly the least complicated construction of all six wharf
sites with its uncomplicated cobb-type construction. Alonzo De F. Quinn (1972:267) stated that
“Wharf design and composition were often related to the socio-economic conditions and
ingenuity of the individual owner of the collective circumstances of a group of individuals, the

180
availability of raw materials, the intended permanency, the size of ships which were to use it,
water activity, direction of wind, and soil conditions.” Considering Mepkin Plantation’s vast
wealth and the large number of slaves available, it was hypothesized that Mepkin Plantation’s
wharf would be the most intricate and permanent in construction, but it was constructed in a
manner no more complicated than Armistead Plantation’s cobb-type wharf. This suggests that
construction type relied on labor availability and timeframe for wharf construction. A plantation
in the colonial period relied on its wharf to transport agricultural product to the Atlantic market.
It was possible that wharves were constructed in haste for immediate accessibility to water
transportation. Without the water access, transportation costs would exponentially increase from
overland travel.
All wharf types in this study were constructed of wood. Wharves were constructed using
available materials with timber being the most widely used material in all colonies. Rock
wharves were not typically seen in the southern coastal plain because there are no readily
available sources. Stone, mostly ballast deposited off visiting vessels, was generally used as filler
for stability (Heintzelman 1985:16). Post wharves like Shirley Wharf Complex and Redbanks
Landing had no need for stone fill for stability, but ballast was found in Bowling Farm Site.
Cedar Grove Causeway and Mepkin Abbey Dock did not show signs of having ballast fill,
however, the two wharves were not excavated. Archaeologists partially excavated Mulberry
Landing Wharf and found only organic debris. Bowling Farm Site had both a ballast fill in the
cobb-type wharf and the vessel crib. They were also filled with historic artifacts, most likely
thrown there during wharf use, or the artifacts were mixed in the fill removed from adjacent land.
Fill and construction type for the six case sites show that plantation owners used whatever was

181
readily available and with weighted options of whether to spend time to ensure the longevity of a
wharf by hewing wharf frames, or spend time repairing.
Wharf size did not appear to be a major wealth indicator (Table 6.9). The two plantations
with the least amount of total physical wealth, Redbanks and Pemberton Hall, had wharf sizes
over 180 ft. in width while the largest total physical wealth plantation, Mepkin Plantation, had
the smallest wharf at only 32.8 ft. wide. Dendrochronolgy analysis on Pemberton Hall showed
that latest construction date was 1747 with many of the frames dating to earlier periods. The
various dates on the wood frames suggested that the wharf was built in stages with possible
extensions and repairs as needed. Shirley Plantation shows a similar theme with five wharves
grouped near each other. This suggests the location site was repeatedly used with a new wharf
built adjacent to the derelict old wharf. Cedar Grove Plantation’s wharf is of unknown size
because most of the wharf was silted over when archaeologists performed a predisturbance
survey.
Only four sites had an abundance of artifacts associated with the wharves: Shirley Wharf
Complex, Bowling Farm Site, Redbanks Landing and Mepkin Abbey Dock. Michael J. O’Brien
and Teresita Majewski’s (1989:60, 85) study measured status through consumer profiles based
on ceramics excavated at specific building sites. The authors based their wealth assessment on
George L. Miller’s (1980) economic scaling of nineteenth-century manufactured ceramics. The
authors based wealth values of the ceramic artifacts provided a set value to each ceramic
category and then ranking the vessel percentage of the assemblage. The values were then
multiplied by the assigned rank number and the scores summed for each site.
Instead of assigning values, this wharf study ranked the ceramics in order of estimated
worth from most refined to most utilitarian: porcelain, refined earthenware, stoneware, and

182
coarse earthenware. Mepkin Abbey Dock artifact assemblage contained no ceramics and was not
included in this ceramic analysis.
FIGURE 6.10. Percentage of ceramic types found with ‘n’ equaling the total number of
ceramics.
Using O’Brien and Majewski’s ceramic analysis methodology, the scoring indicated that
Shirley Plantation had greater wealth and social status with a ceramic score of 27, followed by
Redbanks Landing with 24, and Bowling Farm with 21. This contradicts total physical wealth
analysis which would rank the plantations with Shirley Plantation remaining first but with
Redbanks Landing ranking last. A large factor influencing the scoring system is the quantity of
ceramics in the artifact assemblages. Shirley Plantation’s score was based on eight colonial
ceramics found in a 450 ft. surface survey. Both Bowling Farm Site and Redbanks Landing sites
were similarly excavated with both terrestrial and underwater excavation components. Bowling
Farm recovered 87 colonial ceramic sherds, while Redbanks Landing recovered only 31. This
vast difference in assemblage size greatly affected the ceramic value and ranking for each
plantation. The ranking idea is sound and worth further investigation, but a more comparable
collection size would be needed for each site.
Mepkin Abbey Dock documented other wealth indicator artifacts during a surface survey
such as buttons, a lock, and several coins. The volume of manufactured artifacts and coins
0
10
20
30
40
50
60
70
Porcelain Refined Earthenware
Stoneware Coarse Eathenware
Bowling Farm Site n=87
Redbanks Landing n=31
Shirley Plantation n=8

183
suggest Mepkin Abbey Dock saw high volume of usage. Most likely the coins were accidently
lost in the river, and the lock could have been discarded as garbage. No other similar artifacts of
the manufactured variety were found in the other five wharf sites for comparison, but as Mepkin
Abbey was found to be the largest wealth producer in the total physical wealth analysis, high
valued artifacts would be expected to be found in its artifact assemblage. A Phase II
archaeological investigation of Mepkin Abbey Dock would likely expose a larger artifact
collection to compare with other similar wharf sites.
While in theory wharf size, construction, and artifact assemblage would provide an
indicator to plantation wealth, this was not the case in this study. Wharf construction varied
greatly between the six wharves with Mepkin Abbey, the highest in ranking of total physical
wealth, have the least complicated wharf construction. Redbanks Landing and Pemberton Hall,
the two lowest in total physical wealth, had the largest wharf size. While Shirley Plantation
ranked highest in ceramic value analysis, its ranking was based on an extremely small sample
size. The significance that water transportation played in a plantation’s wealth factor warrants
further investigation into wharves and their excavation as an insight into plantation wealth
because a small sample size is inadequate to provide conclusive arguments.

CONCLUSIONS AND RECOMMENDATIONS
Water was the primary transportation thoroughfare in the American colonial era, and
wharves acted as the interface between rural plantations and the British Atlantic trade network.
This study attempted to determine that a plantation’s prosperity could be determined by a
wharf’s construction type, size, and artifact collection. The study failed to generate any
conclusive findings.
Problems arose in analysis that could potentially be avoided in a future study. Similar
excavation levels need to be achieved to ensure that the data potential is equal at each wharf site.
While Redbanks Landing, Mulberry Landing Wharf site, and Bowling Farm all performed Phase
II archaeological excavations of the wharf structures that obtained detailed information regarding
construction, Cedar Grove Plantation Causeway’s predisturbance survey obtained little
information beyond guesswork as to wharf size and construction. Only Redbanks Landing and
Bowling Farm Site performed Phase II underwater and terrestrial excavation that led to a wealth
of artifacts. A similar excavation at the other four archaeological sites has the potential to
provide similarly large collection for better comparison analysis. Finally, six plantation sites
scattered across the colonial South is not a large enough data set to base an economic study.
Perhaps one hundred wharf sites of different social and economic statuses similarly documented
and excavated throughout the American colonial South would provide more accurate and
conclusive findings.
James Errante’s waterscape archaeology is sound in its research design. All
archaeological sites in this case study incorporated both terrestrial and underwater archaeological
methodologies to varying degrees of emphasis and success. The archaeological sites with an
equal weight of the two, Bowling Farm Site and Redbanks Landing, provided a substantial data

185
set and gave a good and fairly accurate idea of the plantation’s prosperity. Further documentation
and excavation of the other four sites, mainly focusing on terrestrial archaeology for Mulberry
Landing Wharf, Shirley Plantation Wharf Complex, and Mepkin Abbey Dock, and both
terrestrial and underwater archaeology for Cedar Grove Plantation Causeway would enable the
wharf sites to provide better and more accurate indications of plantation prosperity.

BIBLIOGRAPHY
Primary Resource Documentation Manuscripts Bertie County Court House 1722-2010 Register of Deeds, Bertie County Court House, Windsor, NC. Duke University 1767-1768 Journal of the Brig Joannah, 1767-1768, Special Collections Library,
Duke University, Durham, NC. East Carolina University 1724-1743 Bertie County: County Court of Pleas and Quarter Sessions Minutes, ,
North Carolina Collections, East Carolina University, Greenville, NC. 1728-1871 Bertie County: Record of Estates, 1728-1871, North Carolina Collections,
East Carolina University, Greenville, NC. 1755-1860 Tax Lists, 1755-1860, North Carolina Collections, East Carolina
University, Greenville, NC. 1758-1868 Bertie County: County Court of Pleas and Quarter Sessions Minutes,
North Carolina Collections, East Carolina University, Greenville, NC. 1761-1911 Record of Wills, 1761-1911, North Carolina Collections, East Carolina
University, Greenville, NC. 2009 Bowling Farm Site Field Journals, Bradley A. Rodgers. Learn NC 1670 Slaves working in 17th-century Virginia. http://www.learnnc.org. Library of Congress 1918 United States—east coast, North Carolina: Albemarle Sound. United
States Coast and Geodetic Survey, Washington, D.C. Library of Virginia 1698 List of captains and ships for six district ports in Virginia, 1698-1707,
Archives and Manuscript Room, Library of Virginia, Richmond, VA. 1773-1775 Virginia Naval Officers-James River District: Manifest Book, 1773-1775,
Archives and Manuscript Room, Library of Virginia, Richmond, VA. 1782-1830 Charles City County Land Tax Books, 1782-1830, Archives and
Manuscript Room, Library of Virginia, Richmond, VA. North Carolina State Archives and History 1685-1875 Charles E. Johnson Collection, North Carolina State Archives and History, Raleigh, NC. 1726-1764 James Hurst, North Carolina State Archives and History, Raleigh, NC.

187
1731-2010 Treasurer’s and Comptroller’s Office Records, North Carolina State Archives and History, Raleigh, NC. 1761-1892 Josiah Collins Papers, North Carolina State Archives and History, Raleigh, NC. 1764-1769 Anna Fortescue [James Hurst], North Carolina State Archives and History, Raleigh, NC. 1764-1787 William Luten, North Carolina State Archives and History, Raleigh, NC. 1771-1772 George Blair, North Carolina State Archives and History, Raleigh, NC. 1776-1790 William Righton, North Carolina State Archives and History, Raleigh, NC. 1781-1787 Webb, Bryer, and Company, North Carolina State Archives and History, Raleigh, NC.
1782-1783 Bell, Smith, and Company, North Carolina State Archives and History, Raleigh, NC. 2010 North Carolina Maps. http://www.lib.unc.edu/dc/ncmaps/index.html.
North Wind Picture Archives 2011 North Wind Picture Archives. http://www.northwindpictures.com. Shirley Plantation 2010 Shirley Plantation Field Journals, Charles H. Carter III. South Carolina Department of Archives and History 1750 Inventory of Walter Izard, 3 January 1750, Volume B, 375-377, Secretary
of State, Recorded Instruments, Inventory of Estates, 1736-1774. South Carolina Department of Archives and History, Columbia, SC.
University of North Carolina- Chapel Hill 1722-1879 Gray Family Papers, 1722-1879 (bulk 1846-1879), Southern Historical
Collection, University of North Carolina- Chapel Hill, Chapel Hill, NC. 1732-1908 Jonathan Jacocks Papers, 1732-1908, Southern Historical Collection, University of North Carolina- Chapel Hill, Chapel Hill, NC. 1716-1832 Stark Armistead Papers, 1716-1832, Southern Historical Collection, University of North Carolina- Chapel Hill, Chapel Hill, NC. U.S. Census Bureau 1790 1790 Census. http://www.census.gov.
Printed Primary Sources, Public Documents, and Reminiscences
Books Bellis, Vincent, Michael P. O’Connor, and Stanley R. Riggs 1975 Estuarine Shoreline Erosion in the Albemarle-Pamlico Region of North Carolina. Sea Grant Program, Raleigh, NC.

188
Casey, Thomas L. 1897 Report of Capt. Thomas L. Casey, Corps of Engineers. Annual Reports of the War
Department for the Fiscal Year Ended June 30, 1897: Report of the Chief of Engineers, pp. 1381-1383. Washington, DC.
Falconer, William 1769 Universal Dictionary of the Marine. Thomas Cadell, London. Hamer, Phillip M., George C. Rogers Jr., David R. Chesnutt, and Peggy J. Clark (editors) 1968-2002 The Papers of Henry Laurens. Vol. 1-16, University of South Carolina
Press, Columbia SC. Haun, Wynette Parks
1976 Bertie County, North Carolina County Court Minutes, 1724 thru 1739. Wynette Parks Haun, Durham, NC.
1977 Bertie County, North Carolina County Court Minutes, 1740 thru 1743: 1758 thru 1762. Wynette Parks Haun, Durham, N.C.
1978 Bertie County, North Carolina County Court Minutes, 1763 thru 1771. Wynette Parks Haun, Durham, N.C.
1979 Bertie County, North Carolina County Court Minutes, 1772 thru 1780. Wynette Parks Haun, Durham, N.C.
Hinman, F. A.
1885 Survey of Cashie River, from its Mouth to the Town of Windsor in Bertie County, North Carolina. Report of the Secretary of War; Being Part of the Message and Documents Communicated to the Two Houses of Congress at the Beginning of the First Session of the Forty-nine Congress, pp. 1053-1058. Washington, DC.
Kemp, Peter (editor) 1976 The Oxford Companion to Ships and the Sea. Oxford University Press, London. McCall, Marguerite Butler (editor)
1988 Business as Usual: Edenton Merchant Ledgers, 1759-1819. County of Chowan, Edenton, NC.
Saunders, William Lawrence
1886 The Colonial Records of North Carolina. Vol. 1-26. P.M. Hale, Printer to the State, Raleigh, NC. Reprinted 1993-1994 by Broadfoot Publishing Company, Wilmington, NC.
Stephenson, Richard A. and William N. Still, Jr. (editors) 1994 The Submerged Cultural Resources of Swansboro. Program in Maritime Studies, East Carolina University, Greenville, NC.

189
Terrell, Bruce G. 1991 The James River Bateau: Tobacco Transport in Upland Virginia 1745-
1840. ECU research report, no. 7. S.l: East Carolina University, Greenville, NC. Tursi, Frank
1989 The Albemarle-Pamlico Sounds: Where the Rivers Meet the Sea. University of North Carolina-Chapel Hill Environmental Research Project, Raleigh, NC.
U.S. Bureau of the Census 1975 Historical Statistics of the United States Colonial Times to 1970, Bicentennial
Edition. Parts 1 and 2, Washington, D.C. Articles unknown
1921 Journal of a French Traveller in the Colonies, 1765, I. American Historical Review 26 (4): 726-747.
Newspaper Ward, Art 1867 “Rice Cultivation on the Ogeechee River, near Savannah, Georgia.” Harper’s
Weekly, January 5, 1867. Charleston Daily Courier 08/21/1857
Secondary Sources Books Alliance for Progress 1980 Cultural Change and Stability in the Albemarle Region: A Historical and Archaeological Study: Final Narrative Report. Alliance for Progress, Colerain, NC. Babits, Lawrence and Hans Van Tilburg (editors) 1998 Maritime Archaeology: A Reader of Substantive and Theoretical Contributions.
Plenum Press, New York, NY. Barrow, Thomas C.
1967 Trade and Empire: The British Customs Service in Colonial America, 1660-1775. Harvard University Press, Cambridge, MA.

190
Bass, George Fletcher 2005 Beneath the Seven Seas: Adventures with the Institute of Nautical Archaeology.
Thames and Hudson, London. Berlin, Ira and Philip D. Morgan (editors)
1993 Cultivation and culture: Labor and the Shaping of Slave Life in the Americas. University Press of Virginia, Charlottesville, VA.
Braund, Kathryn E. Holland 1993 Deerskins and Duffels: The Creek Indian Trade with Anglo-America, 1685-1815.
University of Nebraska Press, Lincoln, NB. Bruseth, James E. and Toni S. Turner 2005 From a Watery Grave: The Discovery and Excavation of La Salle’s Shipwreck:
La Belle. Texas A&M University Press, College Station, TX. Burnard, Trevor 2002 Creole Gentlemen: The Maryland Elite 1691-1776. Routledge, New York, NY. Carrington, Selwyn H. H. 2002 The Sugar Industry and the Abolition of the Slave Trade, 1775-1810. University
Press of Florida, Tampa, FL. Cecelski, David S. 2001 The Waterman’s Song: Slavery and Freedom in maritime North Carolina. The
University of North Carolina Press, Chapel Hill, NC. Chapelle, Howard I.
1935 The History of American Sailing Vessels. W.W. Norton & Company, INC., New York, NY.
Chaplin, Joyce E. 1993 An Anxious Pursuit: Agricultural Innovation and modernity in the Lower South,
1730-1815. University of North Carolina Press, Chapel Hill, NC. Christaller, Walter 1966 Central Places in Southern Germany, Carlisle W. Baskin, translator. Prentice
Hall Inc., Englewood Cliffs, NJ. Clemens, Paul G. E. 1980 The Atlantic Economy and Colonial Maryland’s Eastern Shore: From Tobacco to
Grain. Cornell University Press, Ithaca, NY. Coclanis, Peter A. 1989 The Shadow of a Dream: Economic Life and Death in the South Carolina
Lowcountry. Oxford University Press, New York, NY.

191
2005 The Atlantic Economy during the Seventeenth and Eighteenth Centuries: Organization, Operation, Practice, and Personnel. University of South Carolina Press, Columbia, SC.
Corbitt, David Leroy (editor)
1953 Explorations, Descriptions, and Attempted Settlements of Carolina, 1584-1590. State Department of Archives and History, Raleigh, NC.
Cotter, John L. and J. Paul Hudson 1957 New Discoveries at Jamestown. U.S. Department of the Interior, Washington,
D.C. Crittenden, Charles Christopher
1936 Commerce in North Carolina, 1763-1789. Yale University Press, New Haven, CT.
Davis, Ralph 1973 English Overseas Trade, 1500-1700. Macmillan Press LTD., London. Dean, Martin, Ben Ferrari, Ian Oxley, Mark Redknap, and Kittie W. Watson 2000 Archaeology Underwater: The NAS Guide to Principles and Practice. Blackwell
Publishing, Malden, MA. Deetz, James
1996 In small Things Forgotten, an Archaeology of Early American Life. Anchor Books Doubleday, New York, NY.
Delgado, James P. 1997 Encyclopedia of Underwater and Maritime Archaeology. Yale University Press,
New Haven, CT. Dunn, Richard S. 1972 Sugar and Slaves: The Rise of the Planter Class in the English West Indies, 1624-
1713. University of North Carolina Press, Chapel Hill, NC. Edelson, S. Max 2006 Plantation Enterprise in Colonial South Carolina. Harvard University Press,
Cambridge, MA. Edgar, Walter 1998 South Carolina, A History. University of South Carolina Press, Columbia, SC. Egnal, Marc 1998 New World Economics: The Growth of the Thirteen Colonies and Early Canada.
Oxford University Press, New York, NY.

192
Ekirch, A. Roger 1981 “Poor Carolina”: Politics and Society in Colonial North Carolina, 1729- 1776. University of North Carolina Press, Chapel Hill, NC. Evans, Cerinda W. 1957 Some Notes on Shipbuilding and Shipping in Colonial Virginia. Virginia 350th
Anniversary Celebration Corporation, Williamsburg, VA. Fairchild, Bryon 1954 Messrs. William Pepperrell: Merchants at Piscataqua. Cornell University Press,
Ithaca, NY. Fleetwood, William 1995 Tidecraft: the Boats of South Carolina, Georgia, and northeastern Florida, 1550- 1950. WBG Marine Press, Tybee Island, GA. Franklin, John Hope and Alfred A. Moss Jr.
1988 From Slavery to Freedom: A History of African Americans. Alfred A. Knopf, New York, NY.
Genovese, Eugene D. 1972 Roll, Jordon, Roll: The World the Slaves Made. Vintage Books, New York, NY, Gibb, James G. 1996 The Archaeology of Wealth: Consumer Behavior in English America. Plenum
Press, New York, NY. Goldenberg, Joseph A. 1976 Shipbuilding in Colonial America. University Press of Virginia, Charlottesville, VA. Greene, Jack P. and J.R. Pole (editors) 1984 Colonial British America Essays in the New History of the Early Modern Era.
The John Hopkins University Press, Baltimore, MD. Greene, Jack P., Rosemary Brama-Shute, and Randy J. Sparks (editors) 2001 Money, Trade, and Power: The Evolution of Colonial South Carolina’s
Plantation Society. University of South Carolina Press, Columbia, SC. Green, Jeremy 2004 Maritime Archaeology: A Technical Handbook, 2nd editions. Elsevier Academic
Press, San Diego, CA. Hamilton, T.M. 1987 Colonial Frontier Guns. Pioneer Press, Union City, TN.

193
Hamilton, T.M. and K.O. Emery 1988 Eighteenth-Century Gunflints from For Michilimackinac and Other Colonial
Sites. Archaeological Completion Report Series No. 13. Mackinac Island State Park Commission, Mackinac Island, MI.
Hoffer, Peter Charles (editor) 1988 Commerce and Community: Selected Articles on the Middle Atlantic Colonies.
Garland Publishing, Inc., New York, NY. Hoffman, Ronald, John J. McCusker, Russel R. Menard, and Peter J. Albert (editors) 1988 The Economy of Early America: The Revolutionary Period, 1763-1790.
University Press of Virginia, Charlottesville, VA. Horn, James 1994 Adapting to a New World: English Society in Seventeenth-Century Chesapeake.
University of North Carolina Press, Chapel Hill, NC. Hugh, Thomas 1997 The Slave Trade: The Story of the Atlantic Slave Trade. Simon & Schuster
Paperbacks, New York, NY. Jones, Alice Eley 2004 Within the Hope Plantation Household: A Cultural History of Bertie County, 1550-1828. Minnie-Troy Publishers, Murfreesboro, NC. Jones, Alice Hanson 1977 American Colonial Wealth: Documents and Methods, Vol. 1-3. Arno Press Inc.,
New York, NY. 1980 Wealth of a Nation to Be: The American Colonies on the Eve of the Revolution.
Columbia University Press, New York, NY. Land, Aubrey C. 1981 Colonial Maryland, A History. KTO Press, Millwood, NY. Malone, Joseph J. 1964 Pine Trees and Politics: The Naval Stores and Forest Policy in Colonial New
England, 1691-1775. University of Washington Press, Seattle, WA. Matson, Cathy (editor) 2006 The Economy of Early America: Historical Perspectives and New Directions.
Pennsylvania State University Press, University Park, PA. McCusker, John J. and Russell R. Menard 1985 The Economy of British America, 1607-1789. University of North Carolina Press, Chapel Hill, NC.

194
McIlvenna, Noeleen 2009 A Very Mutinous People: The Struggle for North Carolina, 1660-1713. The
University of North Carolina Press, Chapel Hill, NC. Menard, Russell R. 2006 Sweet Negotiations: Sugar, Slavery, and Plantation Agriculture in Early
Barbados. University of Virginia Press, Charlottesville, VA. Merrens, H. Roy 1964 Colonial North Carolina in the Eighteenth Century; A Study in Historical Geography. University of North Carolina Press, Chapel Hill, NC. Middleton, Arthur Price 1953 Tobacco Coast, A maritime History of Chesapeake Bay in the Colonial Era. The
Mariner’s Museum, Newport News, VA. Milne, Gustav, Colin McKewan, and Damian Goodburn 1998 Nautical Archaeology on the Foreshore. Royal Commission on the Historical
Monuments of England, Swindon, England. Neumann, Thomas and Robert M. Sanford 2001 Cultural Resources Archaeology: An Introduction. Altamira Press, Walnut Creek,
CA. Perkins, Edwin J. 1988 The Economy of Colonial America, 2nd edition. Columbia University Press, New
York, NY. Price, Jacob M. 1980 Capital and Credit in British Overseas Trade: The View from the Chesapeake,
1700-1776. Harvard University Press, Cambridge, MA. Rainbolt, John C.
1974 From Prescription to Persuasion: Manipulation of Eighteenth Century Virginia Economy. Kennikat Press, Port Washington, NY.
Ray, Worth S. 1968 Old Albemarle and its Absentee Landlords. Genealogical Publishing Company,
Baltimore, MA. Reiss, Warren and Sheli O. Smith
2006 175 Water Street Manhattan: The Ronson Ship. PAST Foundation, Columbus, OH.

195
Rodgers, Bradley A., James D Moore III, Annalies Corbin, Jacqueline D. Piero, and Andrew Pietroszka
2006 From Quarry to Quay: Shipwrecks of McCracken’s Cove: The 2001-2002 Sturgeon Bay Wreck and Wharf Investigation at the Birmingham Site. Program in Maritime Studies, East Carolina University, Greenville, NC.
Ruppé, Carol and Jan Barstad (editors) 2002 International Handbook of Underwater Archaeology. Plenum Publishers, New
York, NY. Schlesinger, Arthur Meier 1957 Merchants and the American Revolution, 1763-1776. Frederick Ungat Publishing,
CO. New York, NY. Shepherd, James F. and Gary M. Walton 1972 Shipping, Maritime Trade, and the Economic Development of Colonial North America. Cambridge University Press, Cambridge. Sheridan, Richard B. 1973 Sugar and Slavery: An Economic History of the British West Indies, 1623-1775.
The John Hopkins University Press, Baltimore, MD. Smallwood, Arwin D. 2002 Bertie County, and Eastern Carolina History. Arcadia Publishing, Charlestown, SC. Soltow, Lee 1989 Distribution of Wealth and Income in the United States in 1798. The University of
Pittsburg Press, Pittsburg, PA.
Staniforth, Mark and Michael Nash (editors) 2006 Maritime Archaeology Australian Approaches. Springer, New York, NY. Steele, Ian 1986 The English Atlantic 1675-1740: An Exploration of Communication and
Community. Oxford University Press, New York, NY. Sutherland, Stella H. 1936 Population Distribution in Colonial America. Columbia University Press, New
York, NY. Sutton, Mark Q. and Brooke S. Arkush 2002 Archaeology Lab Methods: An Introduction, 3rd edition. Kendall-Hunt Publishing
Company, Dubuque, IA.

196
Syrett, David 1970 Shipping and the American War, 1775-83: a Study of British Transport Organization. The Athlone Press, University of London. Thompson, Harry Lewis 1967 The Lost Town of "Cashy". H.L. Thompson, Windsor, NC. Walton, Gary M. and James F. Shepherd 1979 The Economic Rise of Early America. Cambridge University Press, New York,
NY. Watson, Alan D.
1982 Bertie County: A Brief History. North Carolina Department of Cultural Resources, Division of Archives and History, Raleigh, NC.
1980 Money and Monetary Problems in Early North Carolina. North Carolina Department of Cultural Resources, Division of Archives and History, Raleigh, NC. 1996 Society in Colonial North Carolina. North Carolina Department of
Cultural Resources, Division of Archives and History, Raleigh, NC. 2000 Society in Early North Carolina: A Documentary History. North Carolina Department of Cultural Resources, Division of Archives and History, Raleigh, NC.
Wallace, David Duncan 1915 The Life of Henry Laurens, with a sketch of the Life of Lieutenant-Colonel John
Laurens. G.P. Putnam’s Sons, New York, NY. Wood, Peter H. 1974 Black Majority: Negroes in Colonial South Carolina from 1670 through the Stono
Rebellion. W.W. Norton & Company, New York, NY. Yeargin, Billy 2008 North Carolina Tobacco, a History. History Press, Charleston, SC. Articles/Book Chapters Acemoglu, Daron, Simon Johnson, and James Robinson 2005 The Rise of Europe: Atlantic Trade, Institutional Change and Economic Growth.
The American Economic Review 95(3):105-114. Ackermann, Eric G. 1991 Economic Means Index: A Measure of Social Status in the Chesapeake, 1690-
1815. Historical Archaeology 25(1):26-36.

197
Adams, William H., and Sarah J. Boling 1989 Status and Ceramics for Planters and Slaves on Three Georgia Coastal Plantations. Historical Archaeology Proceedings 23(1):69-96.
Balicki, Joseph F. 1998 Wharves, Privies, and the Pewter: Two Colonial Period Sites on the Shawmut Peninsula, Boston. Historical Archaeology 32(3):99-120. Barr, William B.
1995 Childsbury and Ashley Ferry Town: Elements of Control in the Economic Landscape of Colonial South Carolina. In Underwater Archaeology Proceedings from The Society for Historical Archaeology Conference, Washington, D.C. 1995, Paul Forsythe Johnston, editor, pp. 88-93. The Society for Historical Archaeology, Tuscon, AZ.
Beard, David 1991 Causeways and Cribbing: Now You Can Get There from Here. Underwater
Archaeology Proceedings. Society for Historical Archaeology, Richmond, VA. 1997 Good Wharves and Other Conveniences: An Archaeological Study of Riverine
Adaptation in the South Carolina Lowcountry. Carolina Historical Landscapes: Archaeological Perspectives. Linda F. Stine (editor). University of Tennessee Press, Knoxville, TN.
Bedell, John 2000 Archaeology and Probate Inventories in the Study of Eighteenth-Century Life.
Journal of Interdisciplinary History 31(2):223-245. Bellamy, Donnie D. 1977 Slavery in Microcosm: Onslow County, North Carolina. The Journal of Negro
History 62(4):339-350. Binford, Lewis R. 1978 A New Method of Dating from Kaolin Pipe Stem Samples. Historical
Archaeology: A Guide to Substantive and Theoretical Contributions. Robert L. Schuyler, editor, p. 66-67. Baywood Publishing Company, NY.
Bourcier, Paul G. 1990 Prosperity at the Wharves: Providence Shipping, 1780-1850. Rhode Island History 48(2):34-49. Breen, T.H. 1986 An Empire of Goods: The Anglicanization of Colonial America, 1690-1776. The
Journal of British Studies 25(4):467-499.

198
Burnham, Michelle 2000 Merchants, Money, and the Economics of “Plain Style” in William Bradford’s of
Plymouth Plantation. American Literature 72(4):695-720. Byrd, John E. 1999 Ceramic Types and Typology in Northeastern North Carolina: the View from the Davenport Site (31BR28). North Carolina Archaeology 48(1):95-106. Cantelas, Frank J. and Bradley A. Rodgers 1994 The Maple Leaf: a case study in cost-effective zero visibility riverine
archaeology. International Journal of Nautical Archaeology 23(4):271-282. Carney, Judith 1996 Rice Milling, Gender and Slave Labour in Colonial South Carolina. The Past and
Present Society (153):108-134. Clemens, Paul G. E. 1975a From Tobacco to Grain: Economic Development of Maryland’s Eastern Shore,
1660-1750. The Journal of Economic History 35(1):256-259. 1975b The Operation of an Eighteenth-Century Chesapeake Tobacco Plantation.
Agricultural History 49(3):517-531. Clonts, F. W. 1926 Travel and Transportation in Colonial North Carolina. North Carolina
Historical Review 3(1):16-36. Coclanis, Peter A. 1990 The Wealth of British America on the Eve of the Revolution. The Journal of
Interdisciplinary History 21(2):245-260. Combs, Edwin L. III 2003 Trading in Lubberland: Maritime Commerce in Colonial North Carolina. North Carolina Historical Review 8(1):1-27. Corbin, Annalise and Bradley A. Rodgers 2002 Shipwreck in a Swamp: the Burrough's Site at Edenton, N. Carolina, USA. International Journal of Nautical Archaeology 31(2): 228-236. Cosgrove, Denis 1985 Prospect, perspective and the Evolution of the Landscape Idea. Transactions of
the Institute of British Geographers 10(1):45-62. Crittenden, Charles Christopher
1931a Ships and Shipping in North Carolina. The North Carolina Historical Review 8(1):1-13.

199
1931b Overland Travel and Transportation in North Carolina, 1763-1789. The North Carolina Historical Review 8(3):239-257.
Crumley, Carol L. 1976 Toward a locational definition of state systems of settlement. American
Anthropologist 78:59-73. Dacey, Michael F. 1966 A county-seat model for the areal patter of an urban system. Geographical Review
56(4):527-542. Daniels, Bruce C. 1973 Long Range Trends in Wealth Distribution in Eighteenth Century New England.
Exploration in Economic History 11(2):123-135. Edelson, S. Max 2007 Clearing Swamps, Harvesting Forests: Trees and the Making of a Plantation
Landscape in the Colonial South Lowcountry. Agricultural History 81(3):381- 406.
Gray, L.C. 1930 Economic Efficiency and Competitive Advantages of Slavery under the
Plantation System. Agricultural History 4(2):31-47. Griffin, Katherine 1993 Ship’s Logs in the Collections of the Massachusetts Historical Society.
Proceedings of the Massachusetts Historical Society 105:96-123. Harrington, J.C. 1978 Dating Stem Fragments of Seventeenth and Eighteenth Century Clay Tobacco
Pipes. Historical Archaeology: A Guide to Substantive and Theoretical Contributions. Robert L. Schuyler, editor, p. 63-65. Baywood Publishing Company, NY.
Harris, Lynn, Jimmy Moss, and Carl Naylor 1993 The Cooper River Survey: An Underwater Reconnaissance of the West Branch.
Research Manuscript Series. Book 196. South Carolina Institute of Archaeology and Anthropology, University of South Carolina, Columbia, SC.
Harrold, Frances 1989 Colonial Siblings: Georgia’s Relationship with South Carolina During the Pre-
Revolutionary Period. The Georgia Historical Quarterly 73(4):707-744. Hatch, Charles E. Jr. 1942 An Old Wharf at Yorktown, Virginia. William and Mary Quarterly, 2nd Ser., 22(3):224-228.

200
Haywood, Clarence Robert 1956 The Mind of the North Carolina Advocates of Mercantilism. North Carolina Historical Review 33(2):139-165. Heintzelman, Andrea J. 1986 Colonial Wharf Construction: Uncovering the Untold Past. The Log of Mystic Seaport 31(4):124-135. Henretta, James A. 1965 Economic Development and Social Structure in Colonial Boston. The William
and Mary Quarterly 22(1):75-92. Herbert, Joseph M. 1999 Prehistoric Pottery: Series and Sequence on the Carolina Coast. The North
Carolina Archaeological Society and the Research Laboratories of Archaeology 8:1-127.
Hocker, Frederick M. 1992 The Brown’s Ferry Vessel: An Interim Hull Report. In Underwater Archaeology
Proceedings from the Society for Historical Archaeology Conference, Kingston, Jamaica 1992, Toni L. Carrell and Donald H. Keith, editors, pp. 20-25. The Society for Historical Archaeology, Tuscon, AZ.
Horlings, Rachel 2009 An effective diver-operated coring device for underwater archaeology. Technical
Briefs in Historical Archaeology 4:1-6. Howson, Jean E. 1990 Social Relations and Material Culture: A Critique of the Archaeology Plantation Slavery. Historical Archaeology Proceedings 24(4):78-91. Huey, Paul R. 1984 Old Slip and Cruger’s Wharf at New York: An Archaeological Perspective of the
Colonial American Waterfront. Historical Archaeology 18(1):15-37. Joseph, J.W.
1989 Pattern and Process in the Plantation Archaeology of the Lowcountry of Georgia and South Carolina. Historical Archaeology Proceedings 23(1):55-68. 1993 White Columns and Black Hands: Class and Classification in the Plantation Ideology of the Georgia and South Carolina Lowcountry. Historical Archaeology Proceedings 27(3):57-73.
Kasakoff, A.B. and J.W. Andrews 1977 Spatial location and social organization: an analysis of Tikopian patterns. New
Man Series 12(48-64).

201
Kenmotsu, Nancy A. 1990 Gunflints: A Study. Historical Archaeology 24(2):92-124. Langley, Susan D. M.
2000 Tongues in Trees: Archaeology, Dendrochronology, and the Mulberry Landing Wharf. Maryland Historical Magazine 95(3):338-348.
Lemon, James T. and Gary B. Nash 1968 The Distribution of Wealth in Eighteenth-Century America: A Century of Change
in Chester County, Pennsylvania, 1693-1802. Journal of Social History 2(1):1-24. Leone, Mark P. and Silas D. Hurry 1998 Seeing: The power of Town Planning in Chesapeake. Historical Archaeology 32(4):34-62. Levy, Philip 2004 A New Look at an Old Wall, Indians, Englishmen, landscape, and the 1634
Palisade at Middle Plantation. The Virginia Magazine of History and Biography 112(3):226-265.
Littlefield, Daniel C. 1986 Charleston and Internal Slave Redistribution. The South Carolina Historical
Magazine 87(2):93-105. Lutz, Lara 2005 Pemberton Plantation Prevails Amid Winds of Time. Chesapkeake Bay Journal
15(9):www.bayjournal.com. Main, Gloria L.
1997 Inequality in Early America: The Evidence from Probate Records of Massachusetts and Maryland. Journal of Interdisciplinary History 7(4):559-581.
Mancall, Peter C., Joshua L. Rosenbloom, and Thomas Weiss 2001 Slave Prices and the South Carolina Economy. The Journal of Economic History
61(3):616-639. Menard, Russell R. 2007 Plantation Empire: How Sugar and Tobacco Planters Built their Industries and
Raised an Empire. Agricultural History 81(3):309-332. Menard, Russel, P.M.G. Harris, and Lois Green Carr 1974 Opportunity and Inequality: The Distribution of Wealth on the Lower Western
Shore of Maryland, 1638-1705. Maryland History Magazine 69(2):169-184.

202
Merrens, H. Roy 1969 The Physical Environment of Early America: Images and Image makers in
Colonial South Carolina. Geographical Review 59(4):530-556. 1972 A View of Coastal South Carolina in 1778: The Journal of Ebenezer Hazard. The
South Carolina Historical Magazine 73(4):177-193. 1984 Dying in Paradise: Malaria, Mortality, and the Perceptual Environment in
Colonial South Carolina. The Journal of Southern History 50(4):533-550. Moody, Robert Earle (editor) 1943 Massachusetts Trade with Carolina 1686-1709. The North Carolina Historical
Review 20:43-53. Morgan, Kenneth 1998 Slave Sales in Colonial Charleston. The English Historical Review 113(453):905-
927. Nash, R.C. 1992 South Carolina and the Atlantic in the Seventeenth and Eighteenth Centuries. The
Economic History Review 45(4):677-702. 1995 Trade and business in Eighteenth-Century South Carolina: The Career of John
Guerard, Merchant and Planter. The South Carolina Historical Magazine 96(1):6-29.
Nettels, Curtis P. 1952 British Mercantilism and the Economic Development of the Thirteen Colonies.
The Journal of Southern History 12(2):105-114. O’Brien, Michael J. and Teresita Majewski 1989 Wealth and Status in the Upper South Socioeconomic System of Northeastern
Missouri. Historical Archaeology 23(2):60-95. O’Brien, Susan 1986 A Transatlantic Community of Saints: The Great Awakening and the First
Evangelical Network. The American Historical Review 91(4):811-832. Orser, Charles E. Jr. (editor)
1988 The Archaeological Analysis of Plantation Society: Replacing Status and Caste with Economics and Power. American Antiquity 53(4):735-751.
1990 Historical Archaeology on Southern Plantations and Farms. Historical Archaeology Proceedings 24(4):i-126. 1989 On Plantations and Patterns. Historical Archaeology Proceedings 23(2):28-40.
Pastron, Allen G. and James P. Delgado 1991 Archaeological Investigations of a mid-19th-Century Shipbreaking Yard, San Francisco, California. Historical Archaeology 25(3):61-77.

203
Perry, Percival 1968 The Naval-Stores Industry in the Old South, 1790-1860. Journal of Southern History 34(4):509-526. Platt, Virginia B. 1971 Tar, Staves, and New England Rum: The Trade of Aaron Lopez of Newport, Rhode Island with Colonial North Carolina. North Carolina Historical Review 48(1):1-22. Potter, Parker B. Jr. 1991 What Is the Use of Plantation Archaeology? Historical Archaeology Proceedings
25(3):94-107. Reinhart, Theodore, and Judith A. Habicht 1984 Shirley Plantation in Eighteenth-Century: A Historical, Architectural, and
Archaeological Study. The Virginia Magazine of History and Biography 92(1):29-49.
Riley, Edward M. 1952 Suburban Development of Yorktown, Virginia, during the Colonial Period. The
Virginia Magazine of History and Biography 60(4):522-536. Schein, Richard H. 1997 The Place of Landscape: A Conceptual Framework for Interpreting an American
Scene. Annals of the Association of American Geographers 87(4):660-680. Sellers, Charles G Jr. 1951 Private Profits and British Colonial Policy: The Speculations of Henry McCulloh.
The William and Mary Quarterly 8(4):535-551. Shepherd, Steven J. 2006 Reaching the Channel: Some Documentary and Archaeological Evidence of Extending Alexandria’s Waterfront. Alexandria Chronicle: 1-16. Singleton, Theresa A. 1990 The Archaeology of the Plantation South: A Review of Approaches and Goals. Historical Archaeology Proceedings 24(4):70-77. Sluyter, Andrew 2001 Colonialism and Landscape in the Americas: Material/Conceptual
Transformations and Continuing Consequences. Annals of the Association of American Geographers 91(2):410-428.
Smith, Henry A. M. 1919 The Ashley River: Its Seats and Settlements. The South Carolina Historical and
Genealogical Magazine 20(1):3-51.

204
Steele, I.K. 1974 Time, Communications and Society: The English Atlantic. American Studies
8(1):1-21. Stine, J.K. 1986 Coring Archaeological Sites. American Antiquity 51:505-527. Walsh, Lorena S. 2001 The Chesapeake Slave Trade: Regional Patterns, African Origins, and Some
Implications. The William and Mary Quarterly 58(1):139-170. Walton, Gary M. 1966 A Quantitative Study of American Colonial Shipping: A Summary. Journal of Economic History 26(4):595-598. Waterhouse, Richard 1988 Economic Growth and Changing Patterns of Wealth Distribution in Colonial
Lowcountry South Carolina. The South Carolina Historical Magazine 89(4):203- 217.
Wilkie, Laurie A. 1996 Glass-Knapping at a Louisiana Plantation: African-American Tools? Historical
Archaeology Proceedings 30(4):37-49. Williams, Justin 1935 English Mercantilism and Carolina Naval Stores, 1705-1776. Journal of Southern History 1(2):169-185. Zierden, Martha A. and Jeanne A Calhoun 1986 Urban Adaptation in Charleston, South Carolina, 1730-1820. Historical Archaeology 20(1):29-43. Theses and Dissertations and Other Unpublished Works Beard, David 1990 Reconnaissance Survey Report: Underwater Archaeological Investigations of the
Cedar Grove Plantation Causeway in the Ashley River, Dorchester County, South Carolina. Report, South Carolina Institute of Archaeology and Anthropology, University of South Carolina, Columbia, SC.
Bowers, Angus Wyane Jr. 2006 Feature Erosion and Ethnoliguistic Alignment: The Case of Bertie County, North
Carolina. Master’s thesis, Department of English, North Carolina State University, Raleigh, NC.

205
Byrd, John E. 1991 Taphonomy, Diversity, and Seasonality of Cashie Phase Faunal Assemblages from the Jordan’s Landing Site, 31BR7, North Carolina. Master’s thesis, Department of Anthropology, University of Tennessee, Knoxville, TN. Charden, Roland (editor) 1981 Studies in Historical Geography. Academic papers, Department of Geography and
Anthropology, Louisiana State University, Baton Rouge, LA. Dodds, Tricia J. 2009 The Schooner as an Economic Tool in the Development of North Carolina’s Commerce. Master’s thesis, Department of History, East Carolina University, Greenville, NC. Doran, David Joseph Jr. 2006 Wharves to Waterfalls: A Geographical Analysis of the Massachusetts Political Economy from 1763 to 1825. Master’s thesis, Department of Anthropology and Geography, Georgia State University, Atlanta, GA. Edmonds, Mary W. 2002 Cooper River Historic District National Register Nomination. South Carolina
Department of Archives and History, Columbia, SC. Errante, James R. 1993 Waterscape Archaeology: A Survey for 18th-century Boat Landings at Middleburg
Plantation, Berkeley County, South Carolina. Master’s thesis, Department of Anthropology, University of South Carolina, Colombia, SC.
Goodall, Katherine 2003 The Burroughs Wreck: A key to Eighteenth Century Ship Construction Techniques and the Life and Death of the Port of Edenton. Master’s thesis, Department of History, East Carolina University, Greenville, NC. Harris, Lynn 1997 The Ashley River Survey: Assessing Nineteenth-Century Inland Workboats.
Presented at the 1997 Society for Historical Archaeology Conference, Corpus Cristi, TX.
Heintzelman, Andrea J. 1985 Late Seventeenth and Eighteenth Century Wharf Technology: Historical and
Archaeological Investigations of Three Eastern U. S. Examples. Master of Arts, Department of Anthropology, American University. University Microfilms International, Ann Arbor, MI.
206
Lamb, Roy E. 1981 The Maritime History of Edenton: 1768-1773. Master’s thesis, Department of History, East Carolina University, Greenville, NC. Lewandowski, Bonny A. 1998 Landscape in Peril: A Cultural Assessment of Thomas’s Wharf and Woodlands Farm, Northampton County, Eastern Shore, Virginia. Master’s thesis, Department of Landscape Architecture, Virginia polytechnic Institute and State University, Blacksburg, VA. McCartney, Martha 1997 The History of Shirley Plantation, Charles City County, Virginia: Report of
Archival Research. Manuscript, Shirley Plantation, LLC., Charles City County, VA.
Mitchell, Amy 1994 A Comparison of Wood use in Eighteenth-Century Vessels. Master’s thesis.
Program in Maritime History and Nautical Archaeology, Department of History, East Carolina University, Greenville, NC.
Neidinger, Adrianne Askins 2000 Archaeological and Historical Site Investigation of the John’s Island Wreck (EDS001). Master’s thesis, Department of History, East Carolina University, Greenville, NC. Norman, Joseph Gary 1987 Eighteenth-Century Wharf Construction in Baltimore, Maryland. Master’s thesis,
Department of Anthropology, College of William and Mary, Williamsburg, VA. Parham, Peter R. 2009 The Late Quarterly Stratigraphy and Geologic History of North Eastern North
Carolina and Southeastern Virginia. PhD dissertation. Coastal Resource Management and the Department of Geological Sciences, East Carolina University, Greenville, NC.
Pecorelli, Harry 2003 Archaeological Investigations of the B&B Wreck (38B1672): An Eighteenth
Century Plantation-Built Vessel Charleston, South Carolina, Master’s Thesis, Program in Maritime Studies, Department of History, East Carolina University, Greenville, NC.
Phelps, David S., and Charles L. Heath. 1998 Cashie Series Ceramics from the Interior Coastal Plain of North Carolina, circa
AD 800-1725. Manuscript, Coastal Archaeology Office, East Carolina University, Greenville, NC.
207
Rosloff, Jay Paul 1986 The Water Street Ship: Preliminary Analysis of an Eighteenth-Century Merchant
Ship’s Bow. Master’s Thesis, Department of Anthropology, Texas A&M University, College Station, TX.
Smallwood, Arwin Doremus 1997 A History of Three Cultures: Indian Woods, North Carolina, 1585 to 1995. Doctoral Dissertation, Department of History. University Microfilms International, Ann Arbor, MI. Smith, Margot W. 1979 The Economics of Physical Location, Western Regional Conference, American
Association of Geographers, Chicago, IL. Southerly, Kathy Ann Welliver 2006 Landscapes in Transition: Redbanks Landing on the Tar River, Greenville, North
Carolina. Master’s thesis, Department of History, East Carolina University, Greenville, NC.
Stephenson, Richard A. and William N. Still Jr. (editors) 1994 The Submerged Cultural Resources of Swansboro, North Carolina. Research
Report. Program in Maritime History and Nautical Archaeology, Department of History, East Carolina University, Greenville, NC.
Thompson, Robert S. 2008 Soil and Slaves: An Environmental History of Northeastern North Carolina, 1584-
1860. PhD Dissertation. University of Houston, Department of History, Houston, TX.
VanHorn, Kellie Michelle 2004 Eighteenth-Century Colonial American Merchant Ship Construction. Master’s thesis, Department of Anthropology, Texas A&M, College Station, TX. Vezeau, Susan Lynn 2004 The Mepkin Abbey Shipwreck: Diving into Mepkin Plantation’s Past. Master’s thesis, Department of Anthropology, Texas A&M, College Station, TX. York, Wilson David 2007 Merchants, Marauders, and Empire in the English West Indies 1627-1688.
Master’s thesis. Department of History, East Carolina University, Greenville, NC.

208
Organizations and Websites
Mepkin Abbey 2011 Mepkin Abbey- Trappist Monestary, Moncks Corner, South Carolina.
http://mepkinabbey.org/wordpress. Perquimans County Restoration Association 2010 Periauger. http://perquimansrestoration.org/Periauger_OVPE.html. South Carolina Institute of Archaeology and Anthropology 2011 Cooper River Underwater heritage Trail: Diving into the Past.
http://www.cas.edu/sciaa/mrd/documents/crhtslatebundle.pdf