Stock assessment of Summer flounder ( Paralichthys dentatus )
326
Southern flounder (Paralichthys lethostigma) stock structure inferred from otolith shape analysis
Stephen R. Midway (contact author)1
Steven X. Cadrin2
Frederick S. Scharf1
Email address for contact author: [email protected]
1 Department of Biology and Marine Biology University of North Carolina Wilmington 601 South College Road Wilmington, North Carolina 28403 Present address for contact author: Coastal Carolina University Department of Biology P.O. Box 261954 Conway, South Carolina 295282 School for Marine Science and Technology University of Massachusetts Dartmouth 200 Mill Road, Suite 325 Fairhaven, Massachusetts 02719
Manuscript submitted 7 August 2013.Manuscript accepted 9 September 2014.Fish. Bull. 112:326–338 (2014). doi:10.7755/FB.112.4.9
The views and opinions expressed or implied in this article are those of the author (or authors) and do not necessarily reflect the position of the National Marine Fisheries Service, NOAA.
Abstract—Examination of otolith morphometric variation has been shown to provide improved descrip-tions of stock structure for several marine fish species. We examined spatial variation in otolith shape of southern flounder (Paralichthys lethostigma) to understand popula-tion structure at the following geo-graphic levels: ocean basin (Atlantic and Gulf of Mexico); regional coastal waters (Texas, Florida) and (Georgia, South Carolina); and local coastal waters (North Carolina). To reduce variability, we considered only age-1 female fish. From digitized otolith images, we extracted descriptions for common shape indices and elliptical Fourier coefficients and found strong evidence for differences at the ocean basin scale, but only weak evidence for structure at either within-basin (i.e., among states) or within-state (local) spatial scales. Our finding of inferred stock structure differences between the ocean basins aligns with the geographic break in the distri-bution of this species—the absence of this species from the southern portion of Florida—as well as with recent genetic findings. Currently, state-level management of southern flounder in both areas does not ac-count for any basin-wide population mixing and, therefore, by default, as-sumes a separate unit stock for each state, although our findings indicate that mixing could be extensive. Ad-ditional sources of information (e.g., genetics, life history traits) collected at appropriate spatial scales should be examined to confirm suspected levels of mixing and to determine suitable management strategies for the conservation of southern floun-der stocks throughout their ranges.
Although many marine populations once were considered to be panmic-tic on the basis of large geographi-cal ranges and larval dispersal over long distances, results from im-proved stock identification methods (e.g., mtDNA, parasite community, and shape analyses) are calling into question some initial assumptions of population homogeneity (Cadrin et al., 2005). For example, although only very small amounts of gene flow may be required to homogenize con-siderable genetic variation without selection (Palumbi, 2003), evidence is accumulating from multiple spe-cies to support the existence of fine-scale geographic structure in several adaptive traits (Conover et al., 2006).
Regardless of their genetic simi-larities or differences, fish stocks possessing variable traits that can affect their responses to harvest still must be delineated clearly to achieve management objectives related to yield maximization and biomass con-servation (Ricker, 1958; Begg et al., 1999; Conover et al., 2006). Spatial structure of fish stocks and the al-location of fishing effort, therefore, should be considerations in the man-
agement of any species (Stephenson, 1999; Ying et al., 2011) because ig-noring population structure can lead to negative outcomes, such as loss of genetic diversity and reduction in the yield-generating potential of a stock (Pawson and Jennings, 1996; Bailey, 1997; Booke, 1999). Within fisheries science, stock definitions vary but are focused largely on consistency of unique traits—the characteristics that distinguish a stock should re-main constant through time and be unique to that stock (Ihssen et al., 1981; Booke, 1999) for both conser-vation and harvest purposes (Cadrin, 2000).
Methods of phenotypic stock iden-tification have expanded greatly from abundance and meristic ap-proaches to now include the use of both natural and artificial tags, ex-amination of life history traits, pop-ulation genetics, and morphometric outlines (reviewed in Cadrin et al., 2005). Recently, the study of closed-form structures, such as otoliths and scales, has increased with the advent of computers that are able to rapidly analyze large amounts of data. In addition, otoliths are collected rou-

Midway et al.: Stock structure of Paralichthys lethostigma inferred from otolith shape analysis 327
tinely for age determination purposes, making large sample sizes available for shape analyses. Consequent-ly, numerous examples of successful discrimination of fish stocks based on otolith morphometrics and shape descriptors exist.
Campana and Casselman (1993) were among the first to use otolith shape as an indicator of stock varia-tion. They conducted an exhaustive study of all 3 types of otolith pairs in which they found evidence of struc-turing among spawning groups of Atlantic cod (Ga-dus morhua) in the Northwest Atlantic, in addition to differences in otolith shape among age groups, sexes, and year classes. Begg and Brown (2000) used otolith shapes to challenge successfully the assumption of a single stock of haddock (Melanogrammus aeglefinus) at Georges Bank, and DeVries et al. (2002) clarified previous tag and genetic data when they used oto-liths to successfully distinguish stocks of king mack-erel (Scomberomorus cavalla) from the Gulf of Mexico and the Atlantic that were sampled during their win-ter mixing off southern Florida. More recently, otolith shape analysis has been done at varying spatial scales for dolphinfish (Coryphaena hippurus [Duarte-Neto et al., 2008]), North Atlantic saury (Scomberesox saurus saurus [Agüera and Brophy, 2011]), and anglerfish (Lophius piscatorius [Cañas et al., 2012]) to help clari-fy questions about geographic population structure.
The southern flounder (Paralichthys lethostigma) oc-curs in the Northwest Atlantic and Gulf of Mexico from North Carolina to Texas; however, this species does not occur around the southern tip of the Florida peninsula (Gilbert1). Southern flounder in the South Atlantic and Gulf of Mexico basins are considered separate genetic stocks (Anderson et al., 2012). Management for the range of this species occurs generally at the individual state level, despite a high likelihood of within-basin mixing during offshore spawning migrations of adults and the possibility of year-round offshore residents (Watterson and Alexander2; Taylor et al.3).
Southern flounder support important commercial and recreational fisheries throughout their range, with females contributing most to the landings be-cause growth is greater in females than in males. In 1990–2010, more than 30,000 metric tons were landed commercially, and the vast majority (~98%) of these
1 Gilbert, C. R. 1986. Species profiles: life histories and en-vironmental requirements of coastal fishes and invertebrates (South Florida)—southern, gulf, and summer flounders. U.S. Fish Wildl. Serv. Biol. Rep. 82 (11.54). U.S. Army Corps Eng. Tech. Rep. TR EL-82-4, 27 p. [Available from http://www.nwrc.usgs.gov/wdb/pub/species_profiles/82_11-054.pdf.]
2 Watterson, J., and J. Alexander. 2004. Southern flounder escapement in North Carolina. Final performance report F-73, Segments 1–3, 41 p. [Available from North Carolina Department of Environment and Natural Resources, Division of Marine Fisheries, P.O. Box 769, Morehead City, NC 28557.]
3 Taylor, J. C., J. M. Miller, and D. Hilton. 2008. Inferring southern flounder migration from otolith microchemistry. Final report for Fishery Resource Grant 05-FEG-06, 27 p. [Available from North Carolina Sea Grant, NC State Univ., Campus Box 8605, Raleigh, N.C. 27695-8605.]
landings took place in North Carolina. Over the same period, recreational landings were about 50% lower in magnitude and were more evenly distributed among states between the Gulf of Mexico and South Atlan-tic basins (NMFS4). However, recreational harvest may be a primary factor that is contributing to population declines in the Gulf of Mexico (Froeschke et al., 2011), and these declines have prompted a new stock en-hancement program in Texas aimed at supplementing natural reproduction.
Because no directed fishery exists for southern flounder in offshore habitats and exchange of individu-als among states is not well understood, state manage-ment agencies assume unit stocks on the basis of state boundaries. However, population structure that does not coincide with state boundaries has been shown with other flounders in the Northwest Atlantic that share geographic ranges of a similar size and life his-tory characteristics with the southern flounder. These flounders include the southern flounder congener sum-mer flounder (P. dentatus [Burke et al., 2000]), winter flounder (Pseudopleuronectes americanus [DeCelles and Cadrin, 2011]), and yellowtail flounder (Limanda fer-ruginea [Cadrin, 2010]).
Interestingly, each of these studies reported stock structuring at varying scales. Summer flounder were found to have structure related to the biogeographic boundary of Cape Hatteras in North Carolina, whereas evidence indicated that winter flounder and yellow-tail flounder had population structures of much finer scales, including the existence of up to 3 stocks within New England waters. Yet despite evidence for within-basin genetic homogeneity (Anderson et al., 2012), flounder residency within specific estuaries for the first few years of life may create regional phenotypic differences that reflect local adaptation. For example, estimates of the von Bertalanffy growth coefficient (K) for female southern flounder vary considerably among states. For fish in Texas, Stunz et al. (2000) estimated K at 0.75, and Fischer and Thompson (2004) estimated K at 0.51 for Louisiana fish. Within the South Atlantic basin, estimates of K have been lower: 0.23 for fish in South Carolina (Wenner et al.5) and 0.28 for fish in North Carolina (Takade-Heumacher and Batsavage6).
4 NMFS (National Marine Fisheries Service). 2011. Per-sonal commun. Fisheries Statistics Division, NMFS, Silver Spring, MD 20910.
5 Wenner, C. A., W. A. Roumillat, J. E. Moran Jr., M. B. Mad-dox, L. B. Daniel III, and J. W. Smith. 1990. Investigations on the life history and population dynamics of marine rec-reational fishes in South Carolina: Part 1. Final report for project F-37, 187 p. Marine Resources Research Institute, South Carolina Wildlife and Marine Resources Department. Charleston, SC. [Available from the Marine Resources Re-search Institute, South Carolina Department of Natural Re-sources, 217 Fort Johnson Rd., Charleston, SC 29412.]
6 Takade-Heumacher, H., and C. Batsavage. 2009. Stock status of North Carolina southern flounder (Paralichthys lethostigma), 91 p. North Carolina Division of Marine Fish-eries, Morehead City, NC. [Available from http://00de17f.netsolhost.com/fmps/downloads/souflounderSA.pdf.]
328 Fishery Bulletin 112(4)
Mean sizes at age have also varied among these studies—mean sizes at age-1 were 288 mm in total length (TL) in South Carolina and 396 mm TL in Loui-siana (Wenner et al.5; Fischer and Thompson, 2004). Emergent patterns from tagging studies of southern flounder also provide evidence that supports the pos-sibility of phenotypically distinct stocks. Several tag-ging studies initiated in North Carolina waters have arrived at the same 2 general conclusions. First, the majority of tagged southern flounder were recaptured very close to the tag site (although this result could be more of a reflection of sampling effort than of actual movement and distribution). Second, those fish that were captured away (>20 km) from the tag site were collected in locations exclusively south of the release location (Monaghan7; Craig and Rice8).
These studies indicate that at least among younger age classes (i.e., age-1 and age-2 fish that dominate commercial and recreational landings), southern floun-der have restricted home ranges and may be isolated geographically from other stocks. Such site fidelity to certain locations and subsequent environmental condi-tions could contribute to phenotypic differences. Ad-ditionally, the documented migration south may oc-cur over considerable distances (individuals tagged in North Carolina have been recaptured in Florida), and even small numbers of migrating individuals could suffice to genetically homogenize basin populations (Palumbi, 2003).
Genetic differentiation of southern flounder at the basin level has been established previously (Anderson et al., 2012), and our objective was to examine varia-tion in otolith shape throughout the range of this spe-cies—in the South Atlantic, in particular— to identify possible phenotypic stocks at the within-basin scale. Although other methods of phenotypic stock identifica-tion (e.g., testing for spatial variation in growth rates or meristics) are also useful, powerful statistical meth-ods to evaluate variation in otolith shape have devel-oped rapidly in recent years (Stransky, 2013). Further, some of the variation in otolith shape is genetically determined, and therefore such variation should be comparatively less sensitive to short-term changes in environmental conditions. Three spatial scales were ex-amined for possible population structure—between-ba-sins (Gulf of Mexico and South Atlantic), within-basin (among sites within the South Atlantic and within the
7 Monaghan, J. P., Jr. 1996. Migration of paralichthid flounders tagged in North Carolina. Study 2. In Life his-tory aspects of selected marine recreational fishes in North Carolina. Completion Report Grant F-43, Segments 1–5, p. 2.1–2.44. North Carolina Department of Environment and Natural Resources, Division of Marine Fisheries, P.O. Box 769, Morehead City, NC.
8 Craig, J. K., and J. A. Rice. 2008. Estuarine residency, movements, and exploitation of southern flounder (Paralich-thys lethostigma) in North Carolina. Final Report Fishery Resource Grant 05-FEG-15, 39 p. [Available from North Carolina Sea Grant, NC State Univ., Campus Box 8605, Ra-leigh, NC 27695-8605.]
Gulf of Mexico), and within-state (among sites within North Carolina). Any descriptions of geographic stocks (or lack of) will be useful both in current management of the stocks and for the design of studies to examine differences in stock production that could inform future regional management of the southern flounder.
Materials and methods
Data collection
Southern flounder were collected in the South Atlantic from state waters (≤3 nautical miles, or 5.6 km, from the coasts) of North Carolina, South Carolina, Geor-gia, and Florida (Fig. 1) and were identified by mor-phological features described in a U.S. Fish and Wild-life species profile (Gilbert1). In the analysis for this study, 289 right otoliths from age-1 southern flounders were used. Sixty-five samples were collected from the Gulf of Mexico, and the remaining 224 came from the Atlantic states (Figs. 1 and 2). Because of low sample sizes from both Florida (Atlantic waters) and Georgia and the close proximity of the sampling locations from which fish were obtained in those 2 states (≤161 km between locations), Florida and Georgia samples were pooled to represent the southern extent of the range in the U.S. South Atlantic. Additionally, where available, samples from the Gulf of Mexico (locations off both Florida and Texas) were included to enable between-basin comparisons.
Given the previously documented genetic differences (Anderson et al., 2012), we expected to also detect suf-ficient contrast in otolith shape of southern flounder between the basins that would aid our interpretation of variation at finer spatial scales. We explored 3 lev-els of spatial resolution for possible stock differentia-tion. The between-basin scale was explored to compare differences in otolith shape with established genetic differences. Within each basin, we examined varia-tion among states because state boundaries delineate current “stocks” for management of southern flounder. We examined variation between 2 states within the Gulf of Mexico and 3 states in the U.S. South Atlan-tic. Finally, we investigated the possible existence of shape differences at a local spatial scale by examining fish from 3 distinct areas within North Carolina (Fig. 2), from which it is unlikely that juveniles would have moved.
Fish were collected in North Carolina during the fall of 2009 and 2010 as part of the North Carolina Division of Marine Fisheries (NCDMF) fishery-inde-pendent gillnet sampling program. Additional samples were purchased from licensed seafood dealers and were obtained through participation in directed commercial trips. Samples from South Carolina, Georgia, and Flor-ida were collected during the fall of 2010 and 2011 as part of existing fishery-independent sampling programs in each state. Additional samples were obtained from

Midway et al.: Stock structure of Paralichthys lethostigma inferred from otolith shape analysis 329
Florida during the fall of 2012 through purchases from licensed seafood dealers and participation in directed commercial trips. Southern flounder were collected from the Gulf of Mexico in the fall of 1996 from inshore and offshore locations in the vicinity of Panama City, Florida, as part of sampling conducted by the NOAA Southeast Fisheries Science Center. Additional Gulf of Mexico samples were collected in Corpus Christi and Aransas bays, Texas, during 2009 and 2011 as part of a separate research program.
Because the age of fish and recent growth histo-ries can have a considerable influence on otolith shape (Campana and Casselman, 1993), the analysis in this study focused on fish captured only during October, No-vember, and December to reduce variability associated with fractional ages (although additional mathematical size corrections are detailed in the Statistical procedure subsection of the Materials and methods section). Fur-thermore, assuming a 1 January birthday for all fish, fall sampling meant that fish had completed the major-ity of their growth for the most recent year. Therefore, the translucent zone closest to the otolith edge was ap-proaching maximum width and thus would allow con-fident annuli identification for aging purposes. Lastly, because the vast majority of individuals collected were
age-1 females, our analysis of otolith shape focused on this sex–age group.
Otolith preparation and image analysis
Otoliths were extracted at the time of collection when additional data were also collected (e.g., TL in millime-ters, mass in grams, and sex). After excision, otoliths were cleaned with isopropyl alcohol to remove any loose tissue, and then dried and stored in paper envelopes. All Atlantic-basin otoliths were aged whole with the NCDMF aging protocol (originally described in Wenner et al.5). Otoliths from the Gulf of Mexico had been aged previously, and those ages were provided for use in this study (Fitzhugh9; Nims10). Otoliths were first scanned on an Epson Perfection V50011 photo scanner (Epson America Inc., Long Beach, CA) at high resolution (1200
9 Fitzhugh, G. 2011. Personal commun. Panama City Lab, Southeast Fisheries Science Center, National Marine Fisher-ies Service, NOAA. Panama City, FL 32408.
10Nims, M. 2012. Personal commun. Univ. Texas Austin, Port Aransas, TX 78373.
11Mention of trade names or commercial companies is for iden-tification purposes only and does not imply endorsement by the National Marine Fisheries Service, NOAA.
Figure 1 Map with sample sizes by state and basin for collections of age-1 female southern flounder (Paralichthys lethostigma) used in this study of the population structure of this species in the South Atlantic and Gulf of Mexico. Sample collections occurred in state waters in these 2 basins, the South Atlantic (North Carolina, South Carolina, Georgia, and Florida) and the Gulf of Mexico (Florida, Alabama, Mississippi, Louisiana, and Texas) in 1996 and in 2009–12 as part of state or federal agency sampling programs and from seafood dealers. Basin sample sizes are the sum of state sample sizes within each respective basin. Although we collected fish from both Georgia and Florida, in order to increase sample size, the samples from these 2 states were combined on the basis of their close geographic proximity.

330 Fishery Bulletin 112(4)
dots per inch), yielding images comparable in quality to those from high-resolution photographs. Use of a flatbed scanner permitted us to scan relatively large batches of samples simultaneously (without the bend-ing error that is a concern with optical microscopy). Southern flounder otoliths are relatively flat, and all otoliths were scanned sulcus-side down in a uniform orientation.
Otolith shapes were described by using 1) ellipti-cal Fourier analysis (EFA) and 2) calculation of uni-variate shape indices. Compared with other types of Fourier transforms (e.g., fast Fourier transform), EFA is thought to provide the most consistent results for this type of application (Mérigot et al., 2007). The EFA method decomposes the closed-form contour into sepa-rate x and y coordinates (Kuhl and Giardina, 1982). Generally, a predetermined number of harmonics is de-fined for analysis, and each harmonic involves 2 para-metric functions that describe 4 coefficients (i.e., ampli-tudes), an, bn, cn, and dn for the nth harmonic.
In this study, elliptical Fourier coefficients (EFCs) were calculated with the program SHAPE, vers. 1.3 (Iwata and Ukai, 2002). SHAPE software extracts the
chain-coded contour of each otolith (Freeman, 1974), and then the software normalizes (i.e., removes any size effects) the chain-code data on the basis of the first 3 coefficients of the first harmonics. As a result of this normalizing, the first 3 coefficients of the first harmonic are de-graded ultimately and are unfit for analysis; the total number of coefficients = (4×Hn) – 3, where Hn represents the number of harmonics investi-gated. This study extracted 10 harmonics, or 37 EFCs, for analysis.
Several size parameters and shape indices (Table 1) were also calculated for each otolith. Otolith area (in square millimeters) was provid-ed as part of the SHAPE output analysis, and perimeter data (in millimeters) were calculated from the chain-code output file. Both otolith length and otolith width were measured (in mil-limeters) with ImageJ software, vers. 1.45 (Na-tional Institutes of Health, Bethesda, MD) ac-cording to otolith dimension definitions provided in Stevenson and Campana (1992). These size variables were then used to calculate several shape indices, including circularity, rectangular-ity, ellipticity, aspect ratio, and form function. Each of these variables is a common shape index used routinely in otolith morphometric investi-gations (Table 1; Russ, 1990).
Statistical procedures
Univariate shape indices were examined for normality through the use of normal quantile–quantile plots, and any non-normal distributions underwent log transformation in an attempt to satisfy the assumption of normality (Cadrin et
al. 2005). To identify and control for the effect of oto-lith size on the shape indices, an analysis of covari-ance (ANCOVA) was used with geographic region as
Table 1
Size parameters, shape indices, and shape formulae used to describe otoliths from female southern flounder (Paralichthys lethostigma) collected in the U.S. South Atlantic and Gulf of Mexico in 1996 and in 2009–12 as part of state or federal agency sampling programs and from seafood dealers for this study of the population structure of southern flounder in these basins.
Size parameter Shape index and formula
Area (A) Circularity = P2/APerimeter (P) Rectangularity = A/(OL×OW)Otolith length (OL) Form function = 4pA/P2
Otolith width (OW) Aspect ratio = OL/OW Ellipticity = (OL–OW)/(OL+OW)
Figure 2Map with sample sizes of age-1 female southern flounder (Paralich-thys lethostigma) collected within the state waters of North Caro-lina in 2009 and 2010 as part of a sampling program of the North Carolina Division of Marine Fisheries (NCDMF) and from seafood dealers. The 3 regions are based on NCDMF sampling areas; howev-er, they are characterized also by different estuaries. The northern region includes Albemarle Sound, the central region consists of the Neuse–Pamlico Estuary, and the southern region is defined by the Cape Fear and New River estuaries.

Midway et al.: Stock structure of Paralichthys lethostigma inferred from otolith shape analysis 331
the factor and otolith length as the covariate. Both oto-lith length and fish TL have been used as covariates in similar analyses and were expected to yield similar results. However, Campana and Casselman (1993) rec-ommended the use of otolith length because this mea-sured variable is more robust to collection and preser-vation effects, in addition to its strong correlation with fish TL (in our study, correlation coefficient [r]=0.90). In the ANCOVA model, if the interaction of region and otolith length was significant (P<0.05), the shape index was excluded from the analysis because it could not be corrected (Tracey et al., 2006). When the interaction was not significant but the effect of otolith size was significant, the shape index was corrected through the use of the common within-group slope (b), whereby the product of the slope and otolith length was subtracted from the shape variable. One-way analysis of variance (ANOVA), followed by Tukey’s honest significant differ-ence (HSD) post-hoc comparisons and Welch’s t-tests (with significance for both tests assessed at α=0.05), was used to examine differences in shape indices and to identify those indices that could be used in a dis-criminant analysis.
To identify the optimal number of harmonics for analysis, we ran cross-validation analyses to explore the descriptive power of harmonics. For this analysis, we started with the first 2 harmonics and subsequently added harmonics until the rate of jackknife reclassi-fication success declined or plateaued, indicating that the additional harmonics no longer were increasing discriminatory power. Preliminarily, we evaluated sepa-rately 15 and 20 harmonics to examine the sensitivity of the analysis to the number of harmonics. With 15 and 20 harmonics, the mean (and standard deviation of the mean) reclassification success rate was nearly identical to or slightly worse—although not statistical-ly significant—than the result from our original analy-sis with 10 harmonics, and, therefore, we limited our analysis to 10 harmonics. In addition to the statistical justification, we viewed 10 harmonics as a compromise between the parsimony of fewer harmonics indicated by cross validation and a larger number of harmonics based on the notion that fine-scale description is of-ten contained in higher-order harmonics (Cadrin et al., 2005) and that cross validation might not detect these small differences.
Linear discriminant analyses were used to examine differences between geographical subsamples (i.e., pu-tative stocks) at all 3 spatial scales. Ideally, the con-struction of discriminant functions for otolith shape benefits from the inclusion of both EFC and shape in-dices (Agüera and Brophy, 2011); therefore, any signifi-cant shape indices were considered for inclusion in the discriminant analysis.
Finally, jackknife reclassification (i.e., leave-one-out cross validation) was used to examine the classification success of the discriminant functions when classifying known-origin otoliths. Rates of reclassification success were compared with the null classification expectation
(i.e., no structure) of 1/g, where g was the number of groups or putative stocks in the analysis (White and Ruttenberg, 2007). Because unbalanced sample sizes can be problematic in discriminant function analysis (DFA) and result in a high rate of reclassification suc-cess by chance (White and Ruttenberg, 2007), we bal-anced our sample sizes on the basis of the smallest sample size in each analysis, and then we ran 1000 DFAs with all groups (except the smallest) randomized without replacement. We also conducted randomization tests of samples so that we would have not only a null point estimate but also a distribution (i.e., an expected range) to provide greater inference for our empirical results.
Results
Otolith shape indices
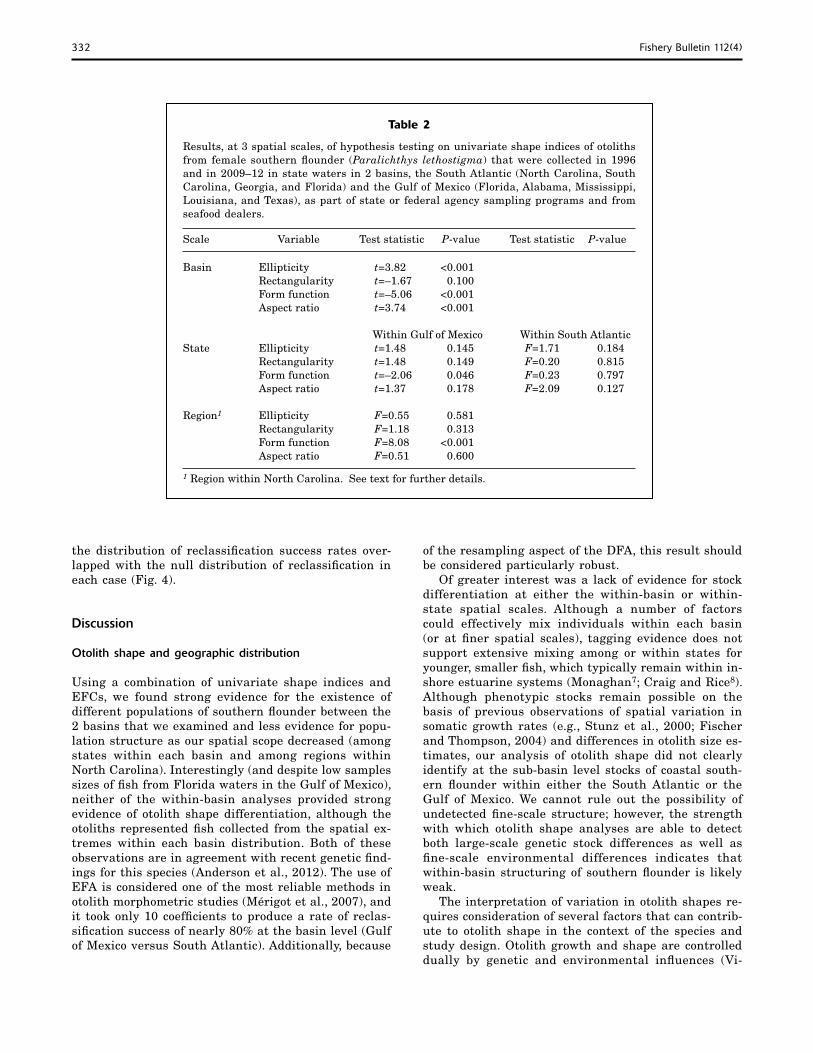
Circularity was the only otolith shape index that was not normally distributed, nor could it be normalized through transformation, and it was, therefore, dropped from the analysis of this study. With analysis of covari-ance, we detected no significant interactions between otolith length and location for any of the 4 remaining shape variables, which then were slope adjusted appro-priately. At the basin level, all shape variables, except rectangularity, were significantly different (Table 2; Fig. 3). At the within-basin level, form function in the Gulf of Mexico was the only shape index that showed significant differences between states; no differences in shape indices were detected among Atlantic states. At a finer spatial scale (areas within North Carolina), dif-ferences in otolith shape indices were largely absent, with the exception of form function (Table 2).
Elliptical Fourier analysis
On the basis of the large number of EFCs (N=37) that were extracted in this study and a lack of high cumulative Fourier power (<70%, including all EFCs; Pothin et al., 2006), the descriptive power of harmonics was explored with analyses of cross validation. In the cross-validation analyses for each geographic scale, the rate of jackknife reclassification success plateaued al-most immediately, indicating that each additional EFC provided minimal explanatory power. This result is in agreement with the finding of low Fourier power. Ulti-mately, all 4 discriminant analyses included the first 10 EFCs and any significant shape indices (Table 3).
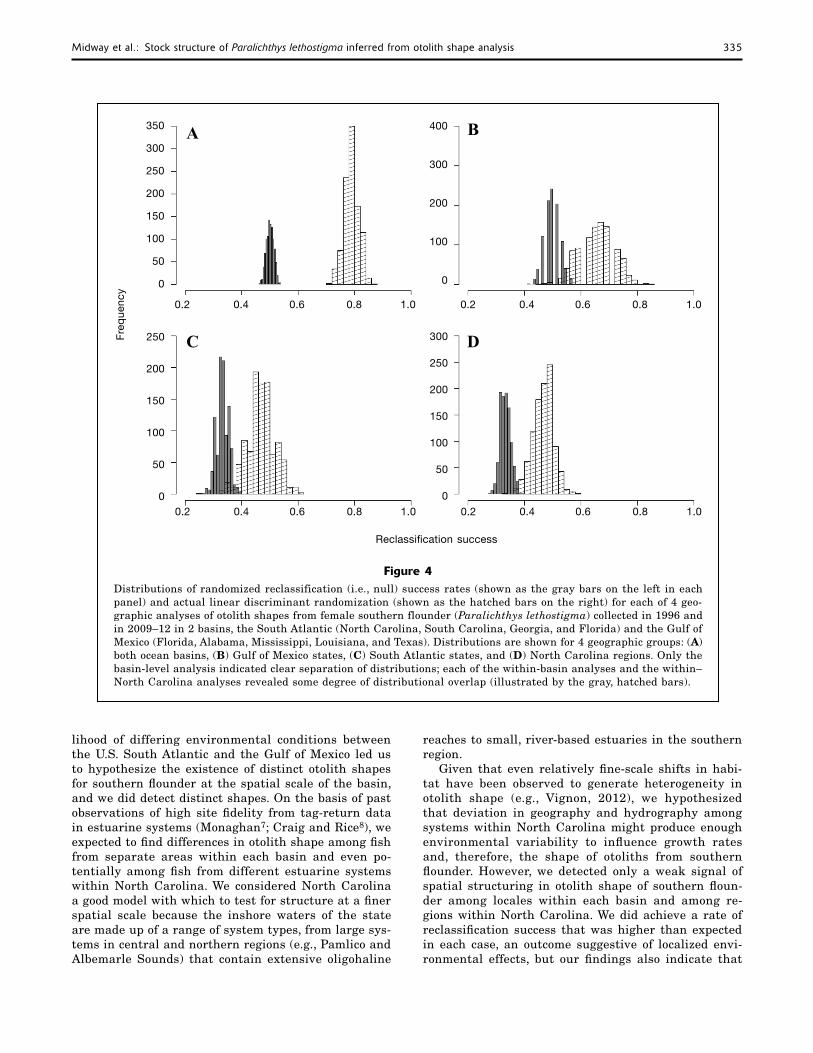
Our basin-scale rate of reclassification success was nearly 80%, the highest level of reclassification success that we detected in any analysis and well outside the upper range of the null distribution (45–56%). Both within-basin reclassifications and the within–North Carolina reclassifications were marginally above—about a 6% improvement in classification—the range of the null expectation distribution (Table 3); however,
332 Fishery Bulletin 112(4)
the distribution of reclassification success rates over-lapped with the null distribution of reclassification in each case (Fig. 4).
Discussion
Otolith shape and geographic distribution
Using a combination of univariate shape indices and EFCs, we found strong evidence for the existence of different populations of southern flounder between the 2 basins that we examined and less evidence for popu-lation structure as our spatial scope decreased (among states within each basin and among regions within North Carolina). Interestingly (and despite low samples sizes of fish from Florida waters in the Gulf of Mexico), neither of the within-basin analyses provided strong evidence of otolith shape differentiation, although the otoliths represented fish collected from the spatial ex-tremes within each basin distribution. Both of these observations are in agreement with recent genetic find-ings for this species (Anderson et al., 2012). The use of EFA is considered one of the most reliable methods in otolith morphometric studies (Mérigot et al., 2007), and it took only 10 coefficients to produce a rate of reclas-sification success of nearly 80% at the basin level (Gulf of Mexico versus South Atlantic). Additionally, because
of the resampling aspect of the DFA, this result should be considered particularly robust.
Of greater interest was a lack of evidence for stock differentiation at either the within-basin or within-state spatial scales. Although a number of factors could effectively mix individuals within each basin (or at finer spatial scales), tagging evidence does not support extensive mixing among or within states for younger, smaller fish, which typically remain within in-shore estuarine systems (Monaghan7; Craig and Rice8). Although phenotypic stocks remain possible on the basis of previous observations of spatial variation in somatic growth rates (e.g., Stunz et al., 2000; Fischer and Thompson, 2004) and differences in otolith size es-timates, our analysis of otolith shape did not clearly identify at the sub-basin level stocks of coastal south-ern flounder within either the South Atlantic or the Gulf of Mexico. We cannot rule out the possibility of undetected fine-scale structure; however, the strength with which otolith shape analyses are able to detect both large-scale genetic stock differences as well as fine-scale environmental differences indicates that within-basin structuring of southern flounder is likely weak.
The interpretation of variation in otolith shapes re-quires consideration of several factors that can contrib-ute to otolith shape in the context of the species and study design. Otolith growth and shape are controlled dually by genetic and environmental influences (Vi-
Table 2
Results, at 3 spatial scales, of hypothesis testing on univariate shape indices of otoliths from female southern flounder (Paralichthys lethostigma) that were collected in 1996 and in 2009–12 in state waters in 2 basins, the South Atlantic (North Carolina, South Carolina, Georgia, and Florida) and the Gulf of Mexico (Florida, Alabama, Mississippi, Louisiana, and Texas), as part of state or federal agency sampling programs and from seafood dealers.
Scale Variable Test statistic P-value Test statistic P-value
Basin Ellipticity t=3.82 <0.001 Rectangularity t=–1.67 0.100 Form function t=–5.06 <0.001 Aspect ratio t=3.74 <0.001 Within Gulf of Mexico Within South AtlanticState Ellipticity t=1.48 0.145 F=1.71 0.184 Rectangularity t=1.48 0.149 F=0.20 0.815 Form function t=–2.06 0.046 F=0.23 0.797 Aspect ratio t=1.37 0.178 F=2.09 0.127 Region1 Ellipticity F=0.55 0.581 Rectangularity F=1.18 0.313 Form function F=8.08 <0.001 Aspect ratio F=0.51 0.600 1 Region within North Carolina. See text for further details.

Midway et al.: Stock structure of Paralichthys lethostigma inferred from otolith shape analysis 333
gnon and Morat, 2010). Although the relative influence of these controls is the subject of ongoing research, ear-ly findings indicate that genetic influences determine the overall shape of an otolith and that environmental effects contribute finer morphological details (Hüssy, 2008; Vignon and Morat, 2010; Vignon, 2012).
Almost undoubtedly, southern flounder ranging from Texas to North Carolina experience a wide range of en-vironmental conditions. Geographic gradients in envi-ronmental conditions may differentiate otolith shape sufficiently enough to enable detection of large-scale population structure, but there also may be consider-able local environmental variation (e.g., salinity, tem-perature, and food) that effectively masks larger geo-graphic patterns. Therefore, the ability to discriminate among even broadly spaced locales (e.g., North Caro-lina versus Florida) can be compromised.
Broad and fine-scale processes that affect coastal en-vironments, which contribute to fish growth, and poten-tially otolith shape also can vary independently in time. One way to limit the influence of variable environmen-
tal effects is by controlling for year class, although sig-nificant year-class effects have been detected in some otolith shape studies (Castonguay et al., 1991) and not in others (Begg and Brown, 2000; Galley et al., 2006). Furthermore, in a study of orange roughy (Hoploste-thus atlanticus), Gauldie and Crampton (2002) ex-plored the idea of balancing selection—an alternating, generational morphology—operating to determine fish otolith morphology (which they observed on a 2-year cycle in their study). This balancing selection results in a persistent otolith polymorphism in populations that consist of multiple age classes. Polymorphism related to year-class effects could have contributed to within-group variation in our study because we included fish from multiple year classes, and polymorphism could have made it more difficult to detect broader regional differences in otolith shape.
Our study was improved by removal of possible sex effects, in addition to our collections being limited to relatively young (age-1) and mostly immature (Midway and Scharf, 2012) individuals. Because variable envi-
A B
Figure 3Boxplots of 4 shape indices for otoliths from female southern flounder (Paralichthys lethostig-ma) collected in 1996 and in 2009–12 in the U.S. South Atlantic and the Gulf of Mexico as part of state or federal agency sampling programs and from seafood dealers. Boxplots for the fol-lowing shape indices are grouped by basin: (A) rectangularity, (B) form function, (C) ellipticity, and (D) aspect ratio. Significant difference (on the basis of Welch’s t-test with α=0.05) between groups is indicated by different shadings of the boxes. Boxes represent the interquartile range; whiskers indicate the first and third quartiles +1.5 × interquartile range; and dots represent points beyond those defined by the whiskers.
C D
SouthAtlantic GuflofMexico SouthAtlantic GuflofMexico
SouthAtlantic GulfofMexico SouthAtlantic GulfofMexico
0.80
0.78
0.76
0.74
0.72
0.70
0.68
0.66
0.8
0.7
0.6
0.5
0.25
0.20
0.15
0.10
0.05
1.6
1.5
1.4
1.3
1.2
1.1
1.0
A B

334 Fishery Bulletin 112(4)
ronmental conditions and growth rates can be major determinants of changes in otolith shape (Campana and Casselman, 1993; Cardinale et al., 2004), we presumed that young southern flounder would most likely reflect the regionally different environments (if sufficient vari-ability existed regionally) and, therefore, would make good candidates with which to detect the effects of those differences on their otolith shape. For instance, if spatial differences existed in growth conditions that were sufficient to generate distinct otolith shapes, then they should be greatest in younger fish at the end of the estuarine phase, when confidence in the spatial segregation of fish is high and the fish are growing rap-idly while occupying habitats in which local conditions can cause variability in growth. Although variability in fine-scale processes, such as recent feeding history, has been shown to be an important determinant of otolith shape (Gagliano and McCormick, 2004; Hüssy, 2008), it was not practical for us to consider smaller spatial scales given the uncertainty in habitat use beyond the system of capture.
Considerable mixing of individuals from broadly separated areas during some phase of their life his-tory also would dampen within-basin and within-state environmental effects on otolith shape. Once they mature, southern flounder emigrate from estuaries to participate in offshore spawning. Within the U.S. South Atlantic, individuals can migrate considerable distances (e.g., North Carolina fish recaptured in Flor-ida; Monaghan7; Craig and Rice8), and therefore mixing of fish from different regions within the basin may be considerable. Therefore, despite the fact that, prior to maturity, many southern flounder likely occupy small home ranges in specific estuaries that span environ-
mental gradients sufficient to generate differences in growth and otolith shape, a high degree of offshore mixing could result in a level of genetic homogeniza-tion that swamps local environmental effects.
One additional and less discussed factor that possi-bly affects otolith shape is time of capture. To minimize variation in body size, all of our fish were collected dur-ing late summer and fall. Each of the age-1 females that we used in this study, therefore, had the oppor-tunity to take advantage of the warm summer grow-ing season, a factor that helped to reduce size vari-ability in our sample. However, this time of capture meant that our samples were taken near the end of a period of rapid otolith growth. In addition to the no-tion that otolith shape is less variable as fish age and mature (Campana and Casselman, 1993), Gauldie and Nelson (1990) also found that faster otolith growth (of-ten occurring among the youngest age groups) resulted in long, thin aragonite crystals. Therefore, it is pos-sible that periods of fast otolith growth can result in a wider variety of otolith shapes present within a stock, making distinctions less apparent among younger age groups. We were not able to address this possibility in our study because southern flounder of older ages are encountered much less frequently in estuarine waters than in offshore waters.
Implications for management
Our examination of variation of otolith shape to de-tect the population structure of southern flounder at 3 geographic scales has possible implications for man-agement. The combination of established genetic dif-ferentiation (Anderson et al., 2012) and the high like-
Table 3
Mean rate and range of jackknife reclassification success, standard error of the mean (SE), null expecta-tions, and predictor variables associated with 3 discriminant function analyses that examined otoliths from female southern flounder (Paralichthys lethostigma) collected in 1996 and in 2009–2012 in the South Atlantic (North Carolina, South Carolina, Georgia, and Florida) and the Gulf of Mexico (Florida, Alabama, Mississippi, Louisiana, and Texas) as part of state or federal agency sampling programs and from seafood dealers. EFC=elliptical Fourier coefficients; g=number of groups.
Within Within Within Basin Atlantic Gulf of Mexico North Carolina
Mean reclassification success 0.79 0.47 0.66 0.47
Reclassification success range 0.74–0.84 0.38–0.56 0.53–0.77 0.39–0.55
SE <0.01 <0.01 <0.01 <0.01
Expected mean (1/g) 0.50 0.33 0.50 0.33
Expected range 0.45–0.56 0.25–0.41 0.40–0.60 0.26–0.40
Predictor variables Ellipticity 10 EFCs Form function Form function Form function 10 EFCs 10 EFCs Aspect ratio 10 EFCs
Midway et al.: Stock structure of Paralichthys lethostigma inferred from otolith shape analysis 335
lihood of differing environmental conditions between the U.S. South Atlantic and the Gulf of Mexico led us to hypothesize the existence of distinct otolith shapes for southern flounder at the spatial scale of the basin, and we did detect distinct shapes. On the basis of past observations of high site fidelity from tag-return data in estuarine systems (Monaghan7; Craig and Rice8), we expected to find differences in otolith shape among fish from separate areas within each basin and even po-tentially among fish from different estuarine systems within North Carolina. We considered North Carolina a good model with which to test for structure at a finer spatial scale because the inshore waters of the state are made up of a range of system types, from large sys-tems in central and northern regions (e.g., Pamlico and Albemarle Sounds) that contain extensive oligohaline
reaches to small, river-based estuaries in the southern region.
Given that even relatively fine-scale shifts in habi-tat have been observed to generate heterogeneity in otolith shape (e.g., Vignon, 2012), we hypothesized that deviation in geography and hydrography among systems within North Carolina might produce enough environmental variability to influence growth rates and, therefore, the shape of otoliths from southern flounder. However, we detected only a weak signal of spatial structuring in otolith shape of southern floun-der among locales within each basin and among re-gions within North Carolina. We did achieve a rate of reclassification success that was higher than expected in each case, an outcome suggestive of localized envi-ronmental effects, but our findings also indicate that
Figure 4Distributions of randomized reclassification (i.e., null) success rates (shown as the gray bars on the left in each panel) and actual linear discriminant randomization (shown as the hatched bars on the right) for each of 4 geo-graphic analyses of otolith shapes from female southern flounder (Paralichthys lethostigma) collected in 1996 and in 2009–12 in 2 basins, the South Atlantic (North Carolina, South Carolina, Georgia, and Florida) and the Gulf of Mexico (Florida, Alabama, Mississippi, Louisiana, and Texas). Distributions are shown for 4 geographic groups: (A) both ocean basins, (B) Gulf of Mexico states, (C) South Atlantic states, and (D) North Carolina regions. Only the basin-level analysis indicated clear separation of distributions; each of the within-basin analyses and the within–North Carolina analyses revealed some degree of distributional overlap (illustrated by the gray, hatched bars).
A B
C D
Reclassificationsuccess
Freque
ncy
0.2 0.4 0.6 0.8 1.0 0.2 0.4 0.6 0.8 1.0
0.2 0.4 0.6 0.8 1.0 0.2 0.4 0.6 0.8 1.0
350
300
250
200
150
100
50
0
400
300
200
100
0
250
200
150
100
50
0
300
250
200
150
100
50
0

336 Fishery Bulletin 112(4)
structure inferred from variation of otolith shape to support the existence of separate stocks within basins or within specific regions of a basin (among estuaries in North Carolina). Additional investigation of stock structure will be necessary, integrating these findings with results from other approaches, such as genetic analyses, acoustic or archival tagging, and analysis of spatial variation in life history traits, to determine the appropriate spatial scales to promote effective manage-ment and conservation of southern flounder stocks.
Acknowledgments
Funding for this research was provided by the NCDMF through the Marine Resources Fund. C. Batsavage and R. Gregory, both of the NCDMF, provided assistance with otolith aging. L. Paramore, K. West, J. Rock, M. Seward, and C. Collier all helped with sample collec-tion in North Carolina as part of the NCDMF fishery-independent sampling program. B. Roumillat and S. Arnott of the South Carolina Department of Natural Resources provided fish from South Carolina, J. Page and E. Robillard of the Georgia Department of Natural Resources provided fish from Georgia, and R. Brodie of the Florida Fish and Wildlife Conservation Commis-sion assisted with collections in Florida. G. Fitzhugh, of the Panama City Lab of the NOAA Southeast Fish-eries Science Center, helped by providing otoliths from fish collected in the Gulf of Mexico, as did M. Nims, then of the University of Texas at Austin. W. White of the University of North Carolina Wilmington helped with aspects of the analysis, and H. Iwata, of the Na-tional Agricultural Research Center in Japan, assisted by providing not only SHAPE software but also ad-ditional R code and troubleshooting. Interpretation of these data and any conclusions drawn are those of the authors and do not necessarily represent the views of the NCDMF.
Literature cited
Agüera, A., and D. Brophy.2011. Use of saggital [sic] otolith shape analysis to dis-
criminate Northeast Atlantic and Western Mediterra-nean stocks of Atlantic saury, Scomberesox saurus sau-rus (Walbaum). Fish. Res. 110:465–471.
Anderson, J. D., W. J. Karel, and A. C. S. Mione.2012. Population structure and evolutionary history of
southern flounder in the Gulf of Mexico and western Atlantic Ocean. Trans. Am. Fish. Soc.141:46–55.
Bailey, K. M.1997. Structural dynamics and ecology of flatfish popula-
tions. J. Sea Res. 37:269–280.Begg, G. A., and R. W. Brown.
2000. Stock identification of haddock Melanogrammus aeglefinus on Georges Bank based on otolith shape analysis. Trans. Am. Fish. Soc. 129:935–945.
levels of mixing within each basin could be sufficient to largely homogenize these effects. However, we cannot rule out the possibility that some fine-scale structure exists at the within-basin spatial scale for southern flounder. Additional investigations to understand the extent of mixing and its impact on spatial variation in vital rates, such as growth, recruitment, and mortality, will be important to fully comprehend harvest effects and to select the appropriate scale for management.
Within both basins, no interjurisdictional manage-ment plan for southern flounder exists, and each state manages its fishery separately. In North Carolina, on the basis of a recent stock assessment, southern floun-der are considered overfished with overfishing occur-ring (Takade-Heumacher and Batsavage6), but other states (South Carolina, Georgia, and Florida) have yet to conduct comprehensive stock assessments for flounder in their waters. In North Carolina, the south-ern flounder has long supported a lucrative commer-cial fishery (NCDMF, http://portal.ncdenr.org/web/mf/commercial-fishing-harvest-statistics), whereas land-ings with commercial gear have historically been much lower in the other states. At the same time, the recre-ational fishery has grown considerably throughout the entire basin; landings have more than doubled since the 1980s (National Marine Fisheries Service, http://www.st.nmfs.noaa.gov/recreational-fisheries/index).
Combined with any increase in participation in com-mercial harvest activities, the steady growth of the rec-reational fishery for southern flounder may necessitate that other states develop comprehensive fishery man-agement plans in the near future. In that event, the likelihood that interstate cooperation will be required through a federal fishery management plan (e.g., under the auspices of the Atlantic States or Gulf States Ma-rine Fisheries Commissions) may increase.
Our findings indicate that southern flounder may exist as separate but well-mixed stocks within the South Atlantic and Gulf of Mexico basins. Alternatively, if population structure exists in the form of multiple stocks that differ in their response to harvest, failure to recognize that structure can lead to overexploitation and depletion of less productive and resilient stocks. Therefore, identification of stock structure is essential for accurate estimation of vital rates and stock assess-ments that promote effective fishery management. Cur-rently, this process is hindered by the lack of under-standing of the underlying structure within the popu-lation of southern flounder in the U.S. South Atlantic.
Conclusions
Previous studies have found genetic differences be-tween southern flounder occupying South Atlantic and Gulf of Mexico waters, and the results from analyses of otolith shape variation presented here provide further evidence of basin-level differentiation. At finer spatial scales, we detected only limited evidence of population

Midway et al.: Stock structure of Paralichthys lethostigma inferred from otolith shape analysis 337
Begg, G. A., K. D. Friedland, and J. B. Pearce.1999. Stock identification and its role in stock assess-
ment and fisheries management: an overview. Fish. Res. 43:1–8.
Booke, H. E.1999. The stock concept revisited: perspectives on its
history in fisheries. Fish. Res. 43:9–11.Burke, J. S., J. P. Monaghan, Jr. and S. Yokoyama.
2000. Efforts to understand stock structure of summer flounder (Paralichthys dentatus) in North Carolina, USA. J. Sea Res. 44:111–122.
Cadrin, S. X.2000. Advances in morphometric identification of fishery
stocks. Rev. Fish Biol. Fish. 10:91–112.2010. Interdisciplinary analysis of yellowtail floun-
der stock structure off New England. Rev. Fish. Sci. 18:281–299.
Cadrin, S. X., K. D. Friedland, and J. R. Waldman.2005. Stock identification methods—an overview. In
Stock identification methods: applications in fishery sci-ence (S. X. Cadrin, K. D. Friedland, and J. R. Waldman, eds.), p. 3–6. Elsevier Academic Press, Burlington, MA.
Campana, S. E., and J. M. Casselman.1993. Stock discrimination using otolith shape analysis.
Can. J. Fish. Aquat. Sci. 50:1062–1083.Cañas, L., C. Stransky, J. Schlickeisen, M. P. Sampedro, and
A. C. Fariña.2012. Use of otolith shape analysis in the stock identifi-
cation of anglerfish (Lophius piscatorius) in the North-east Atlantic. ICES J. Mar. Sci. 69:250–256.
Cardinale, M., P. Doering-Arjes, M. Kastowsky, and H. Mosegaard.
2004. Effects of sex, stock, and environment on the shape of known-age Atlantic cod (Gadus morhua) oto-liths. Can. J. Fish. Aquat. Sci. 61:158–167.
Castonguay, M., P. Simard, and P. Gagnon.1991. Usefulness of Fourier analysis of otolith shape for
Atlantic mackerel (Scomber scombrus) stock discrimina-tion. Can. J. Fish. Aquat. Sci. 48:296–302.
Conover, D. O., L. M. Clarke, S. B. Munch, and G. N. Wagner.2006. Spatial and temporal scales of adaptive divergence
in marine fishes and the implications for conservation. J. Fish Biol. 69:21–47.
DeCelles, G. R., and S. X. Cadrin.2011. An interdisciplinary assessment of winter flounder
(Pseudopleuronectes americanus) stock structure. J. Northwest Atl. Fish. Sci. 43:103–120.
DeVries, D. A., C. B. Grimes, and M. H. Prager.2002. Using otolith shape analysis to distinguish east-
ern Gulf of Mexico and Atlantic Ocean stocks of king mackerel. Fish. Res. 57:51–62.
Duarte-Neto, P., R. Lessa, B. Stosic, and E. Morize.2008. The use of sagittal otoliths in discriminating
stocks of common dolphinfish (Coryphaena hippurus) off northeastern Brazil using multishape descriptors. ICES J. Mar. Sci. 65:1144–1152.
Fischer, A. J., and B. A. Thompson. 2004. The age and growth of southern flounder, Parali-
chthys lethostigma, from Louisiana estuarine and off-shore waters. Bull. Mar. Sci. 75:63–77.
Freeman, H.1974. Computer processing of line-drawing images.
Computing Surv. 6:57–97.
Froeschke, B. F., B. Sterba-Boatwright, and G. W. Stunz.2011. Assessing southern flounder (Paralichthys
lethostigma) long-term population trends in the north-ern Gulf of Mexico using time series analyses. Fish. Res. 108:291–298.
Gagliano, M., and M. I. McCormick.2004. Feeding history influences otolith shape in tropical
fish. Mar. Ecol. Prog. Ser. 278:291–296.Galley, E. A., P. J. Wright, and F. M. Gibb.
2006. Combined methods of otolith shape analysis im-prove identification of spawning areas of Atlantic cod. ICES J. Mar. Sci. 63:1710–1717.
Gauldie, R. W., and J. S. Crampton.2002. An eco-morphological explanation of individual
variability in the shape of the fish otolith: comparison of the otolith of Hoplostethus atlanticus with other spe-cies by depth. J. Fish Biol. 60:1204–1221.
Gauldie, R. W., and D. G. A. Nelson.1990. Otolith growth in fishes. Comp. Biochem. Physiol.
A 97:119–135.Hüssy, K.
2008. Otolith shape in juvenile cod (Gadus morhua): on-togenetic and environmental effects. J. Exp. Mar. Biol. Ecol. 364:35–41.
Ihssen, P. E., H. E. Booke, J. M. Casselman, J. M. McGlade, N. R. Payne, and F. M. Utter.
1981. Stock identification: materials and methods. Can. J. Fish. Aquat. Sci. 38:1838–1855.
Iwata, H., and Y. Ukai.2002. SHAPE: a computer program package for quanti-
tative evaluation of biological shapes based on elliptic Fourier descriptors. J. Hered. 93:384–385.
Kuhl, F. P., and C. R. Giardina.1982. Elliptic Fourier features of a closed contour.
Comput. Vision Graph. 18:236–258.Mérigot, B., Y. Letourneur, and R. Lecomte-Finiger.
2007. Characterization of local populations of the com-mon sole Solea solea (Pisces, Soleidae) in the NW Medi-terranean through otolith morphometrics and shape analysis. Mar. Biol. 151:997–1008.
Midway, S. R., and F. S. Scharf.2012. Histological analysis reveals larger size at matu-
rity for southern flounder with implications for biologi-cal references points. Mar. Coast. Fish. 4:628–638.
Palumbi, S. R.2003. Population genetics, demographic connectiv-
ity, and the design of marine reserves. Ecol. Appl. 13:S146–S158.
Pawson, M. G., and S. Jennings.1996. A critique of methods for stock identification in
marine capture fisheries. Fish. Res. 25:203–217.Pothin, K., C. Gonzalez–Salas, P. Chabanet, and R.
Lecomte-Finiger.2006. Distinction between Mulloidichthys flavolineatus
juveniles from Reunion Island and Mauritius Island (south-west Indian Ocean) based on otolith morphomet-rics. J. Fish Biol. 69:38–53.
Ricker, W. E.1958. Maximum sustained yield from fluctuating envi-
ronments and mixed stocks. J. Fish. Res. Board Can. 15:991–1006.
Russ, J. C.1990. Computer-assisted microscopy: the measurement
and analysis of images, 453 p. Plenum Press, New York.
338 Fishery Bulletin 112(4)
Stephenson, R. L.1999. Stock complexity in fisheries management: a per-
spective of emerging issues related to population sub-units. Fish. Res. 43:247–249.
Stevenson, D. K., and S. E. Campana (eds.).1992. Otolith microstructure examination and analysis,
126 p. Can. Spec. Publ. Fish. Aquat. Sci. 117.Stransky, C.
2013. Morphometric outlines. In Stock identification methods: applications in fishery science, 2nd ed. (S. X. Cadrin, L. A. Kerr, and S. Mariani, eds.), p. 129–140. Academic Press, London.
Stunz, G. W., T. L. Linton, and R. L. Colura.2000. Age and growth of southern flounder in Texas
waters, with emphasis on Matagorda Bay. Trans. Am. Fish. Soc. 129:119–125.
Tracey, S. R., J. M. Lyle, and G. Duhamel. 2006. Application of elliptical Fourier analysis of oto-
lith form as a tool for stock identification. Fish. Res. 77:138–147.
Vignon, M.2012. Ontogenetic trajectories of otolith shape dur-
ing shift in habitat use: interaction between otolith growth and environment. J. Exp. Mar. Biol. Ecol. 420–421:26–32.
Vignon, M., and F. Morat.2010. Environmental and genetic determinant of otolith
shape revealed by a non-indigenous tropical fish. Mar. Ecol. Prog. Ser. 411:231–241.
White, J. W., and B. I. Ruttenberg.2007. Discriminant function analysis in marine ecology:
some oversights and their solutions. Mar. Ecol. Prog. Ser. 329:301–305.
Ying, Y., Y. Chen, L. Lin, and T. Gao.2011. Risks of ignoring fish population spatial structure
in fisheries management. Can. J. Fish. Aquat. Sci. 68:2101–2120.