ABSTRACT - South Central SAS® Users Group · ABSTRACT A scatterplot is one ... SGPANEL procedure...
13
1 Multi-Panel Scatter Plots and Scatter Plot Matrices Paulina A. Kulesz, 1, 2 David F. Francis, 1, 2 Christopher D. Barr 2 1 Department of Psychology, University of Houston, Houston, TX, USA 2 Texas Institute for Measurement, Evaluation, and Statistics ABSTRACT A scatterplot is one of the most common tools utilized in the visual exploration of data. The scatter plot aids researchers in examination of relations between two variables X and Y, as well as reveals degree of symmetry, concentration of data, and possible outliers. A bivariate scatter plot is the simplest form of representing a relation between two variables. More advanced forms such as panel scatter plots and scatterplot matrices allow representing a degree of dependence between multiple variables (taken two at the time) in a comparative way. This paper presents improvements in visualizing data utilizing variations of scatterplots. More specifically, it presents how to create analytical graphs representing bivariate relations between variables in SAS. The SGPANEL and SGSCATTER procedures supporting different statements and options including annotation (SGANNO) and attribute maps (DATTRMAP) are utilized in order to generate graphs useful in enhancing the visual exploration of data. The SGPANEL procedure produces multi-cell classification panels which allow presentation of the data categorized by one or more categorical variables. The SGSCATTER procedure not only generates multi-cell panels, but also offers comparative view of all bivariate relations. Specifically, it helps in comparing relations presented on one scatter plot with the effects presented on another. In sum, advancements provided by Statistical Graphics Procedures in SAS are helpful in generating highly efficient plots, which might help researchers in visualizing data when confronted with page constrains. Furthermore, they allow representing the multi- dimensional data in the two-dimensional space utilizing various statements and options supported by the SGPANEL and SGSCATTER procedures. INTRODUCTION Investigation of complex relations between various variables is commonly encountered in the behavioral sciences. Exploration of those relations not only requires examination of correlation tables but also visual inspection of scatter plots which provide meaningful insights into investigated associations. It is noteworthy that visual inspection of numerous bivariate scatter plots is oftentimes necessary in order to acquire a better understanding of inspected phenomena. Unfortunately multiple bivariate scatter plots are often delivered on multiple pages posing problems with comparison of various relations as well as decreasing readability. It is both complex as well as challenging to clearly deliver and inform recipients about perplexing relations utilizing bivariate scatter plots. The task becomes even more daunting when researchers are confronted with page constraints. SAS offers a relatively simple solution to these problems. More specifically, multi-panel scatter plots as well as scatter plot matrices are highly efficient data visualizations which allow graphical displaying of relations between multiple variables in a
Transcript of ABSTRACT - South Central SAS® Users Group · ABSTRACT A scatterplot is one ... SGPANEL procedure...

1
Multi-Panel Scatter Plots and Scatter Plot Matrices
Paulina A. Kulesz,1, 2
David F. Francis,1, 2
Christopher D. Barr 2
1 Department of Psychology, University of Houston, Houston, TX, USA
2 Texas Institute for Measurement, Evaluation, and Statistics
ABSTRACT
A scatterplot is one of the most common tools utilized in the visual exploration of data. The
scatter plot aids researchers in examination of relations between two variables X and Y, as well
as reveals degree of symmetry, concentration of data, and possible outliers. A bivariate scatter
plot is the simplest form of representing a relation between two variables. More advanced forms
such as panel scatter plots and scatterplot matrices allow representing a degree of dependence
between multiple variables (taken two at the time) in a comparative way.
This paper presents improvements in visualizing data utilizing variations of scatterplots.
More specifically, it presents how to create analytical graphs representing bivariate relations
between variables in SAS. The SGPANEL and SGSCATTER procedures supporting different
statements and options including annotation (SGANNO) and attribute maps (DATTRMAP) are
utilized in order to generate graphs useful in enhancing the visual exploration of data. The
SGPANEL procedure produces multi-cell classification panels which allow presentation of the
data categorized by one or more categorical variables. The SGSCATTER procedure not only
generates multi-cell panels, but also offers comparative view of all bivariate relations.
Specifically, it helps in comparing relations presented on one scatter plot with the effects
presented on another. In sum, advancements provided by Statistical Graphics Procedures in SAS
are helpful in generating highly efficient plots, which might help researchers in visualizing data
when confronted with page constrains. Furthermore, they allow representing the multi-
dimensional data in the two-dimensional space utilizing various statements and options
supported by the SGPANEL and SGSCATTER procedures.
INTRODUCTION
Investigation of complex relations between various variables is commonly encountered in the
behavioral sciences. Exploration of those relations not only requires examination of correlation
tables but also visual inspection of scatter plots which provide meaningful insights into
investigated associations. It is noteworthy that visual inspection of numerous bivariate scatter
plots is oftentimes necessary in order to acquire a better understanding of inspected phenomena.
Unfortunately multiple bivariate scatter plots are often delivered on multiple pages posing
problems with comparison of various relations as well as decreasing readability. It is both
complex as well as challenging to clearly deliver and inform recipients about perplexing
relations utilizing bivariate scatter plots. The task becomes even more daunting when researchers
are confronted with page constraints. SAS offers a relatively simple solution to these problems.
More specifically, multi-panel scatter plots as well as scatter plot matrices are highly efficient
data visualizations which allow graphical displaying of relations between multiple variables in a

2
clear and condensed manner. Importantly they allow for fast and easy generation of multiple
scatter plots on the same page without creating SAS templates.
In the present paper multi-panel scatter plots and scatter plot matrices are used in order to
visualize structure-function relations in spina bifida and typically developing children. The input
data utilized in production of multi-panel scatter plots and scatter plot matrices come from an
archival neuropsychological data which were collected as a part of a larger study examining
cognitive and neurobiological variability in spina bifida meningomyelocele and related disorders.
Investigated relations regard structure-function relations in spina bifida and normal controls.
Variables of interest are behavioral measures assessing efficiency of attentional networks
(Alerting, Orienting, Conflict Resolution) and selected brain measures derived from Magnetic
Resonance Imaging (MRI).
MULTI-PANEL PLOTS USING SGPANEL PROCEDURE
The SGPANEL procedure is designed to produce multiple plots arranged by specific
categorical/grouping variables. More specifically, SGPANEL procedure organizes plots into
multiple panels which are used to compare various plots with regards to their grouping
variable(s). Utilization of the described procedure allows for a fast and easy way of comparing
multiple plots which are conveniently presented on one page.
The SGPANEL procedure can be combined with most of plot statements utilized in the
SGPLOT procedure. In particular, depending on a plot statement, the SGPANEL procedure
produces panels of commonly used plots such as: scatter plots, histograms, box plots, bar plots or
series plots. The SGPANEL procedure can be understood as a way of organizing commonly used
plots in a more efficient way. Furthermore, SGPANEL procedure can be thought as a supplement
of SGPLOT procedure. More precisely, it is a way of arranging plots with regards to a grouping
variable(s).
Various statements and options utilized in modifying legends, axes and reference lines are
supported by the SGPANEL procedure. Moreover, additional options can be specified in a plot
statement (for instance the SCATTER statement) which generates plots of interest. However, it
is important to notice that those options have to be applied into a specific plot statement
supported by SGPLOT procedure. Therefore, the majority of options supported by SGPLOT
procedure can be applied in a given plot statement. It is noteworthy that even though the
SGPANEL procedure is supported by both SAS/GRAPH in SAS 9.2 and Base SAS 9.3, certain
statements and options can by only executed in SAS 9.3. Statements and options supported only
by SAS 9.3 are noted in the text.
The most advantageous statement which is supported by SGPANEL procedure is the
PANELBY statement. The PANELBY statement which is specified right after/below the
SGPANEL procedure statement is mandatory in the SGPANEL procedure. The PANELBY
statement allows for inclusion of grouping variables in order to arrange produced plots
depending on those variables. Distinct panels are formed accordingly to a number of grouping

3
variables and their crossings. The PANELBY statement can be accompanied by the LAYOUT
option allowing for subdivision of the graphing space into differently organized panels.
In the default LAYOUT = PANEL option each panel represents a category of a grouping
variable. This option is especially useful when one is confronted with a grouping variable
consisting of multiple categories. Subdivision of graphing space depending on different
categories of a grouping variable enhances readability of plots with regards to compared
categories.
In LAYOUT = LATTICE option the organization of panels resembles a contingency
table where each panel represents a plot for “a” category of a first variable, and “b”
category of a second variable. In other words, columns represent a first grouping variable
whereas rows represent a second grouping variable. Therefore, LATTICE option requires
two grouping variables. This option id helpful when one arranges graphs with regards to
two grouping variables.
LAYOUT = COLUMNLATTICE (or = ROWLATTICE) panels, supported only by SAS
9.3, form a column or row (respectively) panels with regards to a grouping variable. This
option is useful when one has a limited space on the page. It is noteworthy that this
option can be only used with one grouping variable.
Examination of structure-function relations utilizing multi-panel scatter plots
In the present paper, the SGPANEL procedure is used in order to compare structure-function
relations with regards to etiology or/and gender. Figure 1 presents a reaction time of conflict
resolution (Conflict_Resolution variable) by a volumetric measure of dorsolateral prefrontal
cortex (DLPFC variable) for spina bifida (SB) and typically developing (NC) children. The
relations are arranged using COLUMNLATTICE layout.
The PANELBY statement includes one classification variable (ETIOLOGY). The
NONVARNAME option suppresses variable name in the cell header.
The SCATTER statement displays bivariate relations between Conflict Resolution and
DLPFC variables. MARKERATTRS option modifies SYMBOL and COLOR of
attributes.
COLAXIS and ROWAXIS statements display GRID.

4
Figure 1. Relations between Conflict Resolution and DLPFC by ETIOLOGY in
COLUMNLATTICE Layout
Figure 2 shows two bivariate relations: Conflict Resolution and DLPFC as well as Conflict
Resolution and a volumetric measure of Anterior Cingulate Cortex (CCA) classified by
GENDER. The relations are arranged using ROWLATTICE layout.
PROC FORMAT procedure assigns descriptive labels to data values. One user-defined
format called SEX is assigned. This format is associated with a variable GENDER using
FORMAT statement in the PROC SGPLOT step. However, it is noteworthy that the
FORMAT statement can be used in either PROC or DATA steps.
COLUMNS = 1 creates a one-column panel. This option is especially useful when one
desires to create many panels and display them in a specified number of columns (in this
case one column).
PROC SGPANEL data = sas.dataset ;
PANELBY etiology / LAYOUT = COLUMNLATTICE NOVARNAME ;
SCATTER X = Conflict_Resolution Y = DLPFC
/ markerattrs = (symbol = squarefilled)
markerattrs = (color = CX16A629) ;
COLAXIS GRID ;
ROWAXIS GRID ;
RUN ;

5
Figure 2. Relations between Conflict Resolution and Brain Structures by GENDER
ROWLATTICE Layout
PROC FORMAT ;
VALUE sex 0 = 'Male'
1 = 'Female' ;
RUN ;
PROC SGPANEL data = sas.dataset ;
PANELBY gender / LAYOUT = ROWLATTICE NOVARNAME
COLUMNS = 1;
FORMAT gender sex. ;
SCATTER X = Conflict_Resolution Y = DLPFC
/ markerattrs = (symbol = trianglefilled)
markerattrs = (color = CXCC2B1B) ;
SCATTER X = Conflict_Resolution Y = CCA
/ markerattrs = (symbol = trianglefilled)
markerattrs = (color = CX0000FF) ;
COLAXIS label = 'Brain Structure' ;
ROWAXIS label = 'Conflict Resolution' ;
RUN ;
6
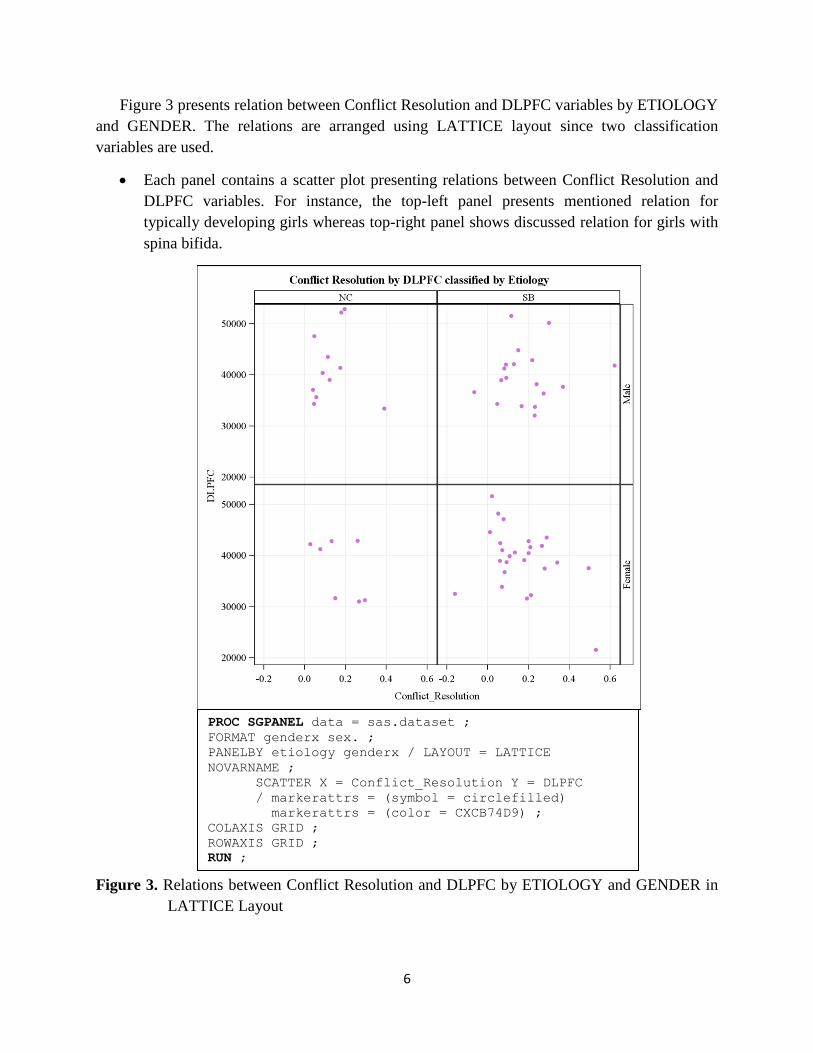
Figure 3 presents relation between Conflict Resolution and DLPFC variables by ETIOLOGY
and GENDER. The relations are arranged using LATTICE layout since two classification
variables are used.
Each panel contains a scatter plot presenting relations between Conflict Resolution and
DLPFC variables. For instance, the top-left panel presents mentioned relation for
typically developing girls whereas top-right panel shows discussed relation for girls with
spina bifida.
Figure 3. Relations between Conflict Resolution and DLPFC by ETIOLOGY and GENDER in
LATTICE Layout
PROC SGPANEL data = sas.dataset ;
FORMAT genderx sex. ;
PANELBY etiology genderx / LAYOUT = LATTICE
NOVARNAME ;
SCATTER X = Conflict_Resolution Y = DLPFC
/ markerattrs = (symbol = circlefilled)
markerattrs = (color = CXCB74D9) ;
COLAXIS GRID ;
ROWAXIS GRID ;
RUN ;

7
Finally, Figure 4 displays relations between Conflict Resolution and DLPFC variables by
ETIOLOGY in the COLUMNLATTICE layout. An attribute map is added in order to modify
appearance of the graph. In general, attribute maps are utilized to customize visual attributes
based on particular data values of classification variable. Importantly, DATTRMAP is only
supported by SAS 9.3.
DATTRMAP option allows creating a data set which contains specified visual
modifications which are applied to a graph. In particular, the data set is utilized in order
to characterize the content of attributes. ID and VALUE are required columns which have
to appear in a created data set. ID creates a column with the ID of attribute map whereas
VALUE creates a column with data values to which attributes will be assigned.
Depending on a desired appearance various attributes such as: symbol, color, line pattern,
line style, fill color, etc. might be modified.
In the present example an attribute map is used in order to specify an appearance of marker
symbol and color. The DATA step utilized to create an attribute map that includes following
information:
Table 1. Attribute map in a data set format
value markersymbol id markercolor
SB starfilled my_id CXFFAA00
NC starfilled my_id CX0000FF
DATTRMAP option allows specifying a data set which will be used in order to modify
the appearance of a plot. DATTRMAP option appears in the SGPANEL procedure
statement.
ATTRID option based on selected ID listed in an attribute map data set assigns the
attribute map to the plot.
NOAUTOLEGEND suppresses displaying a legend.
Specifying the GROUP option in the SCATTER statement forces SAS to assign different
attributes to given panels based on a classification variable (ETIOLOGY). When an
attribute map is used with the SGPANEL procedure it is important to properly assign
attributes for different panels by the GROUP option. If the GROUP option is not
included, SAS will not assign different attributes to different panels arranged by a
classification variable.

8
Figure 4. Relations between Conflict Resolution and DLPFC by ETIOLOGY using
DATTRMAP option
It is important to note that the provided list of options and statements is not exhaustive. For
utilization of additional options and statements readers are referred to www.support.sas.com
website.
DATA attrmap ;
length value $ 9 markersymbol $ 14 ;
retain id 'my_id' markersymbol 'starfilled' ;
input value $ markercolor $;
cards ;
SB CXFFAA00
NC CX0000FF
;
RUN ;
PROC SGPANEL data = sas.dataset DATTRMAP = attrmap
noautolegend ;
PANELBY etiology / LAYOUT = COLUMNLATTICE ONEPANEL NOVARNAME
;
SCATTER X = Conflict_Resolution Y = dlpfc
/ group = etiology
attrid = my_id ;
COLAXIS GRID ;
ROWAXIS GRID ;
RUN ;

9
SCATTER PLOT MATRICES USING SGSCATTER PROCEDURE
The SGSCATTER procedure not only generates multi-cell panels, but also offers
comparative views of all bivariate relations between variables. The SGSCATTER procedure is
supported by various statements and options. The SGSCATTER procedure can be accompanied
by three autonomous statements: PLOT, COMPARE and MATRIX. The present paper focuses
only on the MATRIX statement. Further information about PLOT and COMPARE statements
can be found on www.support.sas.com website.
The MATRIX statement allows for exploration of multiple relations between variables
within the same graph presented on one page. Consequently, The MATRIX statement allows
representing a degree of dependence between multiple variables (taken two at the time) in a
matrix form where all variables are plotted against each other. More specifically, it displays all
possible combinations of bivariate relations among all used variables on the same graph. Each
relation appears in off diagonal cells, whereas diagonal is utilized to display names of variables
(a default setting) or histograms as well as density plots (an optional settings).
Examination of structure-function relations utilizing scatter plot matrices
In the present paper the SGSCATTER procedure with the MATRIX statement is used to
explore multiple relations between behavioral and brain variables. Figure 5 presents a matrix
where Conflict Resolution, DLPFC and CCA variables are plotted against each other. More
specifically, both rows and columns of the matrix include Conflict Resolution, DLPFC and CCA
variables.
The ELLIPSE option displays a confidence ellipse on every scatter plot. Alternatively,
ELLIPSE = (ALPHA = a numeric value between 0.00 and 1.00 TYPE = PREDICTED)
allows specifying a prediction ellipse with a given alpha level.
The DIAGONAL = (HISTOGRAM NORMAL) option displays histograms and normal
density curve for explored variables. It is noteworthy that KERNEL option specifying a
kernel density estimate can be added to a DIAGONAL option.
The GROUP option presents scatter plots with regards to a classification variable
(ETIOLOGY). The addition of a grouping variable does not influence an ELLIPSE
option. In particular an ellipse is drawn with regards to all data despite inclusion of a
classification variable.

10
Figure 5. Relations between Conflict Resolution, DLPFC, CCA using SGSCATTER matrix
Figure 6 presents a scatter plot matrix for the same variables with annotation. The annotation
allows modifying a graph by adding into its space custom drawings. More specifically,
annotation allows drawing text and other graphical features on a graph in order to increase
readability of graphs and provided on them information. Importantly, the annotation is only
supported by SAS 9.3.
SGANNO option allows inserting information provided in an annotate data set into a
graph. Importantly, using SGPANEL and SGSCATTER procedure it is only possible to
draw text and other graphical features within a layout and graph space. SGPLOT
procedure permits drawing of text and other graphical features within a data, wall, layout
and graph spaces.
ROC SGSCATTER data = sas.dataset ;
MATRIX Conflict_Resolution DLPFC CCA
/ ellipse
diagonal = (histogram normal)
group = etiology ;
RUN ;

11
In the present example the annotation is used in order to emphasize that the presented graph
is a working version (called draft). The DATA step used to create annotation includes following
information:
Table 2. Annotation in a data set format
function label textcolor justify textsize transparency width
text DRAFT red center 64 0.5 200
Figure 6. Scatter plot matrix of Conflict Resolution, DLPFC, CCA using annotation
data draft;
retain function "text" label "DRAFT" textcolor "red"
justify "center"
textsize 64 transparency .50 width 200;
run;
PROC SGSCATTER data = sas.dataset SGANNO = draft;
MATRIX Conflict_Resolution DLPFC CCA
/ ellipse
diagonal = (histogram normal)
markerattrs = (color = CX16A629)
markerattrs = (symbol = circlefilled) ;
RUN ;

12
Finally, the %MACRO statement can be used to generate multiple scatter plot matrices
within the SCSCATTER procedure. Provided macro results in generation of scatter plot matrices
which share identical graphical features and only vary with regards to variables specified in the
MATRIX statement. In the presented example the %MACRO statement with positional
parameters is applied.
The %MACRO statement begins a definition of macro, assgins a name to a macro as well
as specfies parameters. The %MACRO statement has to appear before DATA or PROC
steps are specified. In this example the name of macro is “relations”, and specified
paramters are listed in in parentheses (var1, var2, var3).
The %MEND statement ends a macro definition.
%name of macro invokes a macro. In the provided example, it executes generation of two
scatter plot matrices with different variables.
Lastly, it is important to note that the provided list of options and statements is not
exhaustive. For utilization of additional options and statements readers are referred to the
www.support.sas.com website.
CONCLUSIONS
Advancements provided by Statistical Graphics Procedures in SAS are helpful in generating
highly efficient plots, which might help researchers in visualizing data when confronted with
page constraints. Furthermore, they allow representing the multi-dimensional data in the two-
dimensional space utilizing various statements and options supported by the SGPANEL and
SGSCATTER procedures. Finally, SGPANEL and SGSCATTER procedures increase
readability of the graphs by presenting them in a comparative way. Therefore, multi-panel scatter
plots and scatter plot matrices offer a clear and comprehensible visualization of investigated
phenomena by displaying results in a highly efficient and condensed manner.
%MACRO relations (var1, var2, var3) ;
PROC SGSCATTER data = sas.dataset ;
MATRIX &var1 &var2 &var3
/ ellipse
diagonal = (histogram normal) ;
RUN ;
%MEND ;
%relations (Attentional_Control, DLPFC, CCA) ;
%relations (Sustained_Attention, DLPFC, CCA) ;

13
REFERENCES
Cleveland, W. S. (1993). Visualizing Data. Summit, NY: Hobart Press.
Matange, S., Heath, D. (2011). Statistical Graphics Procedures by Example: Effective Graphs
Using SAS. Cary, NY: SAS Institute Inc.
CONTACT INFORMATION
Your comments and questions are valued and encouraged. Contact the author:
Paulina A. Kulesz
University of Houston
E-mail: [email protected]