
Abstract number: 007-0094 Paper title: HOW CAN …...cross-compare the Zara and Benetton to explore...
24
1 Abstract number: 007-0094 Paper title: HOW CAN FLUID DYNAMICS HELP SUPPLY CHAIN MANAGEMENT? An investigation on the relations between supply network configuration and time performance Authors: Prof. Pietro Romano, Ph.D Department of Electrical, Managerial and Mechanical Engineering University of Udine Via Delle Scienze, 208 33100 Udine, Italy Tel +39 0432 558246 – Fax +39 0432 558298 E-mail: [email protected] Dr. Pamela Danese Department of Management and Engineering University of Padova, Stradella S. Nicola, 3 36100 Vicenza, Italy. Tel +39 0444 998789 – Fax +39 0444 998888 E-mail: [email protected] POMS 18th Annual Conference Dallas, Texas, U.S.A. May 4 to May 7, 2007 Acknowledgement: We gratefully acknowledge professor Alfredo Soldati, University of Udine, for his very helpful comments and hints on fluid dynamics and Reynolds number.
Transcript of Abstract number: 007-0094 Paper title: HOW CAN …...cross-compare the Zara and Benetton to explore...

1
Abstract number: 007-0094
Paper title: HOW CAN FLUID DYNAMICS HELP SUPPLY CHAIN MANAGEMENT?
An investigation on the relations between supply network configuration and time
performance
Authors:
Prof. Pietro Romano, Ph.D Department of Electrical, Managerial and Mechanical Engineering University of Udine Via Delle Scienze, 208 33100 Udine, Italy Tel +39 0432 558246 – Fax +39 0432 558298 E-mail: [email protected] Dr. Pamela Danese Department of Management and Engineering University of Padova, Stradella S. Nicola, 3 36100 Vicenza, Italy. Tel +39 0444 998789 – Fax +39 0444 998888 E-mail: [email protected] POMS 18th Annual ConferenceDallas, Texas, U.S.A. May 4 to May 7, 2007 Acknowledgement: We gratefully acknowledge professor Alfredo Soldati, University of Udine, for his very helpful comments and hints on fluid dynamics and Reynolds number.

2
HOW CAN FLUID DYNAMICS HELP SUPPLY CHAIN MANAGEMENT?
An investigation on the relations between
supply network configuration and time performance
Abstract
This paper investigates the relations between three constructs: supply network structure, business
process configuration, and time performance. The study focuses on the time sensitive casual wear
industry. Initially, Zara’s and Benetton’s supply networks are cross-compared to understand the
rational behind their differences in time performance. Starting from this analysis, the paper provides
a model to explain the relations between the three constructs, and applies it to interpret Benetton’s
and Zara’s decisions on supply network and business process configurations, and their impact on
time performance. The proposed model unifies under one framework the different perspectives
existing in literature on the phenomenon under investigation. This research also has interesting
practical implications, as it offers guidance for managers facing programs for supply network
design or re-configuration.
Keywords: Case studies; supply network structure; supply chain management; textile/apparel; time
performance

1
HOW CAN FLUID DYNAMICS HELP SUPPLY CHAIN MANAGEMENT?
An investigation on the relations between
supply network configuration and time performance
INTRODUCTION
Recent trends in global sourcing, production and distribution have both increased supply network
complexity and reinforced the notion that supply network strategies and practices are essential
elements of business strategy (de Treville et al., 2004; Huemer, 2006). This is particularly true for
the so-called “extended global enterprises” (Stock et al., 2000), being them a single multinational
organization with a globally fragmented and dispersed supply network structure or, as it is
increasingly the case, a set of strategically aligned companies which partner to capture specific
market opportunities. In both cases the increased supply network complexity seems to contrast the
need to provide the speed necessary to rapidly respond to windows of market opportunity.
This paper aims to investigate the relations between supply network structure and time
performance. The comparison of the case studies of two widely celebrated companies – Zara and
Benetton – competing in the time sensitive casual wear industry was the spark that triggered the
study. Zara, the flagship brand of the Spanish retail group Inditex SA, is the talk of the academic,
managerial and B-school worlds because of its peerless speed: it can move from identifying a trend
to having clothes in its stores within 30 days (Lewis et al., 2004). The Benetton Group - a world
famous company that for many years represented worldwide the prototype of the “N-Form”
enterprise - is currently one of the world largest garment producers and retailers and it can arrive to
the shelves from the design in about 12-14 months (Camuffo et al., 2001). Though competing in the
same industry, the companies show different time performance. This difference tickled our curiosity

2
to deeply investigate what caused Zara to over-perform Benetton in time performance. In particular,
since literature recognizes that supply network structure and business process configuration can
affect performance (Cooper et al., 1997; Fisher, 1997; Stock et al., 2000), we focus our analysis on
the relations between the structural dimensions of supply networks, those of business processes, and
time performance, with the aim of identifying a framework to interpret the empirical data deriving
from the case studies and to give a theoretical explanation of the phenomenon under investigation.
An analogy with fluid dynamics, the science which studies fluids and their motions, offered us a
clue to address the research issue.
The paper begins by reviewing the literature on the relations between the three constructs of this
research: supply network structure, business process configuration and time performance. Then, we
cross-compare the Zara and Benetton to explore the structure of their supply networks and business
processes. Starting from this analysis we create our model to explain the relations between the three
constructs and apply it to interpret Benetton’s and Zara’s decisions on supply network and business
process configurations and their impact on time performance. The paper closes with the academic
and managerial implications of the proposed interpretative model and with the suggestions for
future research.
SUPPLY NETWORKS AND TIME PERFORMANCE
SCM literature recognizes the importance of supply network structural dimensions as driver of
performance. In their seminal supply chain model, Cooper et al. (1997) argue that the way supply
networks perform depends on how business process are managed. In turn, to properly configure
business processes managers can act on what they call “management components” - such as product
structure, management methods and risk/benefit sharing systems – and on the supply network
structure, further declined in terms of physical and relational structure. Physical structure refers to
supply network length (i.e. number of tiers), number of suppliers and customer for each tier, facility
location and dimensions. Relational structure concerns the nature of the relationships, or links,

3
between supply network members, such as the extent to which a company owns the stages of the
supply networks and the activation of more collaborative network governance structures, such as
partnerships and medium-long term cooperation agreements.
In line with this stream of research Fisher (1997), Stock et al. (2000), and Choi and Hong (2002)
carried on the exploration of relations between structural aspects and performance in supply
network management (table 1).
Fisher (1997) provides one of the models most widely mentioned by academics and most used by
managers, in which he theorizes for the first time the presence of a “matching” between two
specific performance targets for supply networks - i.e. speed vs. efficiency - and the characteristics
the supply network structure should have.
Stock et al. (2000) go into the link between supply network structure and performance, proving that
two supply network structural elements, namely the channel governance and the geographic
dispersion, together with the integration of logistics activities within and across the company
boundaries jointly contribute to affecting supply network performance. According to them, certain
combinations of supply network structure and logistics integration will result in higher performance
than other combinations of these constructs.
Choi and Hong (2002) define first the concept of supply network structural complexity in terms of
vertical, horizontal and spatial complexity. In addition they recognise that there may be other more
intangible measure of complexity, such as the level of coupling between firms in the supply
network as evidenced in the closeness of working relationship.
From table 1 it emerges that Choi and Hong’s four dimensions of supply network complexity
(vertical, horizontal, spatial and relational) seem to capture the main structural elements as dealt
with in the academic debate on supply networks. Literature explores the link between these four
dimensions and time performance. In particular an increase of vertical complexity is generally
associated with an increase in supply network throughput time. The system engineering approach,
which in turn has its foundations in industrial dynamics and in process flow analysis (Towill et al.,

4
1992; Berry et al., 1994; Mason-Jones and Towill, 1999), provided evidence on how time lags and
distortions in material and information flows in supply networks worsen as the number of echelons
increases.
Table 1 - Supply network structural dimensions Cooper et al. (1997) Fisher (1997) Stock et al. (2000) Choi and Hong (2002)
• Physical structure: supply network length (number of tiers), number of suppliers and customers for each tier, facility location and dimension
• Relational structure: degree of vertical integration, activation of collaborative relationships (partnership, medium-long term trading ties)
• Manufacturing focus: few, large, efficient plants with high utilization rate vs. many, small, flexible production units with excess buffer capacity
• Distribution strategy: centralized cost minimizing distribution structures vs. decentralized close-to-customer responsive systems
• Supplier base structure: configurations for cost reduction (multi-sourcing, supplier competition on price) vs. configurations for speed, flexibility and quality (single and dual sourcing, collaboration)
• Channel governance: how the firm’s supply and distribution channel (suppliers, production facilities, distributors and customers) is governed (vertical integration, cooperation, interdependence)
• Geographic dispersion: the extent to which the elements in a firm’s supply network (suppliers, production facilities, distributors and customers) are located across a wide range of geographic regions
• Vertical complexity: the number of tiers in the supply network
• Horizontal complexity: the number of suppliers in each tier
• Spatial complexity: the average distance between two firms engaged in buying and supplying
• The level of coupling between firms in the supply network (closeness of working relationship)
An increase of horizontal complexity is generally associated with an increase in throughput time.
Multi sourcing strategies often cause synchronization problems, difficulties in communication, and
low supplier commitment, all complications that negatively affect time performance (Agrawal and
Nahmias, 1997; Childerhouse et al., 2002).
Also an increase of spatial complexity is generally associated with an increase in throughput time.
Coordination of supply networks requires the physical movement of products from one location to
another. As Stock et al. (2000) and Danese et al. (2006) argued, recent trends in global production
have both increased supply network spatial complexity and reinforced the notion that logistics
strategies and practices are essential elements in determining throughput time. In particular,
logistical complexity increases as organizations move from centralized, vertically integrated, single-

5
site manufacturing facilities to geographically dispersed networks of resources that collectively
create value for the customer. Greater distances and a wider range of locations separating supply
network members would therefore likely have significant implications for time performance. This is
also true with regards to the impact of relational complexity on time performance. Since relational
complexity refers to the level of coupling and closeness of working relationship between firms in
the supply network, several authors argued that strong relationships – such as long-term
collaboration links, partnership and even vertical integration) – facilitate mutual trust, information
sharing, and the interconnection of information systems which can in turn positively affect time
performance (Heikkilä, 2002; Droge et al., 2004; Danese et al., 2006).
According to literature, the second construct affecting performance concerns the way business
processes are designed and managed throughout the supply network (Cooper et al., 1997). Though
focussing their analysis to logistics processes, Stock et al. (2000) demonstrate that the degree of fit
between supply network structure and business process structure can be expected to impact
performance. Similarly, Fisher (1997) maintains that if a company structures its processes and its
supply network accordingly, it can create the “matching” that soars profits. Business process
structural dimensions range from the definition of the primary purpose (e.g. supply predictable
demand efficiently vs. respond quickly to unpredictable demand) to the definition of the strategic
priorities (e.g. shorten lead time as long as it doesn’t increase cost vs. invest aggressively in ways to
reduce lead time), from the integration within the company of the operational activities throughout
the value stream (e.g. inter-functional integration, process approach) to the external integration
across firm boundaries (e.g. splitting activities and responsibilities, upstream and downstream
communications and interconnections, blurred inter-organizational distinctions, activation of inter-
firm coordination mechanisms).
Therefore, to investigate the relations between the dimensions characterising the structure of supply
network and time performance we cannot omit to address also the way process activities are broken
down and coordinated throughout the supply network.

6
COMPARING BENETTON’S AND ZARA’S SUPPLY NETWORKS
Since literature seems to agree that certain combinations of supply network structural dimensions
and business process configurations can result in higher time performance than other combinations,
in the search for an explanation of Zara’s superior time performance corroborated by existing
theory, we decided to explore how Benetton and Zara configured their supply networks. We cross-
compared, on the one hand, the four structural dimensions literature agrees upon and, on the other
hand, the characteristics of their business process.
All data on the cases are from public sources: company sites, annual reports, books and articles
(Camuffo et al., 2001; Slack et al., 2006; Ferdows et al. 2003, 2004; Lo et al., 2004).
Supply network configuration
As to vertical complexity, both the supply networks encompass five phases: first, the garments are
designed, after which raw material are purchased and the clothes are manufactured and then
distributed to the retail outlets. In short, vertical complexity cannot explain the difference in time
performance between the two companies.
The cross-comparison of horizontal complexity requires the investigation of the upstream,
production and downstream networks. As to the upstream network, both companies have a main
supplier for textiles. Zara buys around 40% of its fabric from Comditel, a wholly-owned subsidiary.
Olimpias - 85% controlled by Benetton - provides the Italian company with the 60% of the woven
fabric, 90% of cotton knit fabric and 90% of carded and combed wool. As to the production
network, both Benetton and Zara coordinate several owned operations and a network of smaller
subcontractors. About half of Zara’s products are produced in its network of 20 Spanish and two
foreign plants. Benetton owns 32 production sites dispersed in several production poles which
coordinate networks of subcontractors located in particular geographical regions. Also with regards
to the downstream network the companies share several points in common. Zara sells its products in
992 stores in 63 countries. Benetton has 5,000 selling points in 120 countries. Therefore, both

7
Benetton and Zara are characterized by a very high level of horizontal complexity in their supply
network structure. However, given the large number of production facilities and stores Benetton’s
production and retail networks seem to be more complex than Zara’s ones, though the Italian
company revenues (2 billion euro, sell-in) are lower than those of the Spanish one (4,5 billion euro,
sell out).
Similar considerations can be made with regards to geographical complexity, as both companies
coordinate networks of suppliers, production sites, subcontractors and retail stores dispersed
throughout the world. Zara’s Spain-centred supply network seems to be less dispersed than
Benetton’s one, though a more deep investigation reveals several points in common. In fact,
Benetton has replicated the original Italy-centred model – very similar to Zara’s one, and probably
the forerunner - in the countries where it has re-located to - Tunisia, Croatia, Hungary, China, India,
etc. Foreign poles are composed of a subsidiary (totally or partially owned and directly managed by
Benetton) which co-ordinates the production activities of a group of SMEs, often set up and
managed by ex-Benetton employees or Italian contractors.
The fourth structural dimension is relational complexity. Even in this case the company profiles are
very similar. They both seek to exert their direct control (through equity ownership or semi-
hierarchical ties) on those stages almost unanimously recognised as critical in the textile-apparel
supply chain: textile manufacturing and retailing. As to production activities, they both present
hybrid structures with the simultaneous presence of wholly-owned production facilities, which
concentrate on the more capital intensive production activities such as cutting and dyeing, and large
networks of independent subcontractors. Though supply network structure reveals the efforts of
both companies to forward and backward integration, Zara pushes far forward its downstream
integration as it owns and operates almost its entire store network.
Table 2 summarizes the cross-case comparison along the four dimensions characterising supply
network structure.

8
Table 2 – Comparison of Benetton’s and Zara’s supply network structures Structural dimensions Benetton Zara
Vertical complexity
Design, raw materials supply, manufacture, distribution, retail
Design, raw materials supply, manufacture, distribution, retail
Horizontal complexity
• Upstream network: main supplier Olimpias (owned), hundreds of minor suppliers
• Production network: 32 owned production sites, network of subcontractors
• Downstream network: 5,000 stores
• Upstream network: main supplier Comditel (owned), hundreds of minor suppliers
• Production network: 22 owned production sites, network of subcontractors
• Downstream network: 992 stores
Geographical complexity
• Suppliers, subcontractors and production poles all over the world, especially in Italy, Tunisia, Romania, Croatia, Hungary, India and China
• Selling points in 120 countries
• Suppliers, subcontractors and production facilities all over the world especially in Spain, Portugal, North Africa, Asia and Mexico
• Selling points in 63 countries
Relational complexity
• Direct control (ownership) of critical stages in the supply network (raw materials, capital intensive production activities, retail)
• Externalization of labour intensive activities to a network of subcontractors
• Highly controlled retail network (wholly owned megastores and franchised stores)
• Direct control (ownership) of critical stages in the supply network (raw materials, capital intensive production activities, retail)
• Externalization of labour intensive activities to a network of subcontractors
• Highly controlled retail network (wholly owned stores, some joint ventures and franchises)
Business process configuration
Zara and Benetton share several points in common, but also show interesting differences, when
comparing the way they configure the activities to design, manufacture and distribute the garments
to the retail store.
Zara uses two different channels and configures the processes in its value chain according to the
different primary purposes and strategic priorities (table 3). The first channel aims supply the retail
store with the more basic and therefore less risky products, namely the part of collection that has to
be ready before the beginning of the two typical seasons characterizing the garment industry:
spring-summer and autumn-winter. The second channel is responsible for the rest of the production,
in particular those garments that arrive to the shelves during the season to reinvigorate the basic
collection and to keep up better with the fast changing market trends. In fact, Zara’s strategy doesn’t
exclusively rely on “designed and made in Zara”, but it is also based on extensively monitoring
fashion trends observed at the fashion show and at the point of sale, and on purchasing finished
products from a network of fast suppliers (allowing a purchasing lead time from 4 to 8 weeks).
Since cost is the strategic priority for the first channel, Zara uses volume and long term

9
subcontractors (mainly located in Asia and Mexico) which offer the benefits of low prices, but
generally produce less “fashionable” products. Conversely, the second channel is prioritized to fast
chase the market trends of the moment, and to quickly supply the retail store with high fashion
content products. Here Zara uses a network of subcontractors with design skill, mainly located in
Europe and North Africa, that allow the company to have the “right” product within the shortest
possible procurement lead time, thus completing the flows coming from the company’s own plants.
It’s important to notice that second channel doesn’t chase economies of scale but rather quick
response, therefore garments are produced and distributed in small batches. This way, in a context
where demand for flash collection is unpredictable, Zara stores receive small shipments, carry little
inventory, and the risk of unsold items is reduced. On the other hand, Zara selling policy tolerates
occasional stock-outs for the more fashion items, because the relentless introduction of new
products makes it possible for shoppers to always have new things to choose from.
Table 3 – Business process configuration in Zara
Channel % on total production Primary purpose Strategic
priorities Differences in process activities
1 20
Create, manufacture and
distribute the basic collection
efficiently
Low costs Product
availbility
• Low cost subcontractors mainly located in Asia and Mexico with production skill in less fashionable products
• Large batches in search for economies of scale
• Long term forecast planning (seasons)
2 80
Supply quickly retail store with flash collections
and replenishments
Quick responses to market trends High fashionable
products Relentless new
product introduction
• Fast subcontractors mainly located in Europe and North Africa with design and production skill in high fashionable products
• Small batches for quick response and fast rotation on the shelves
• Stock-out tolerated
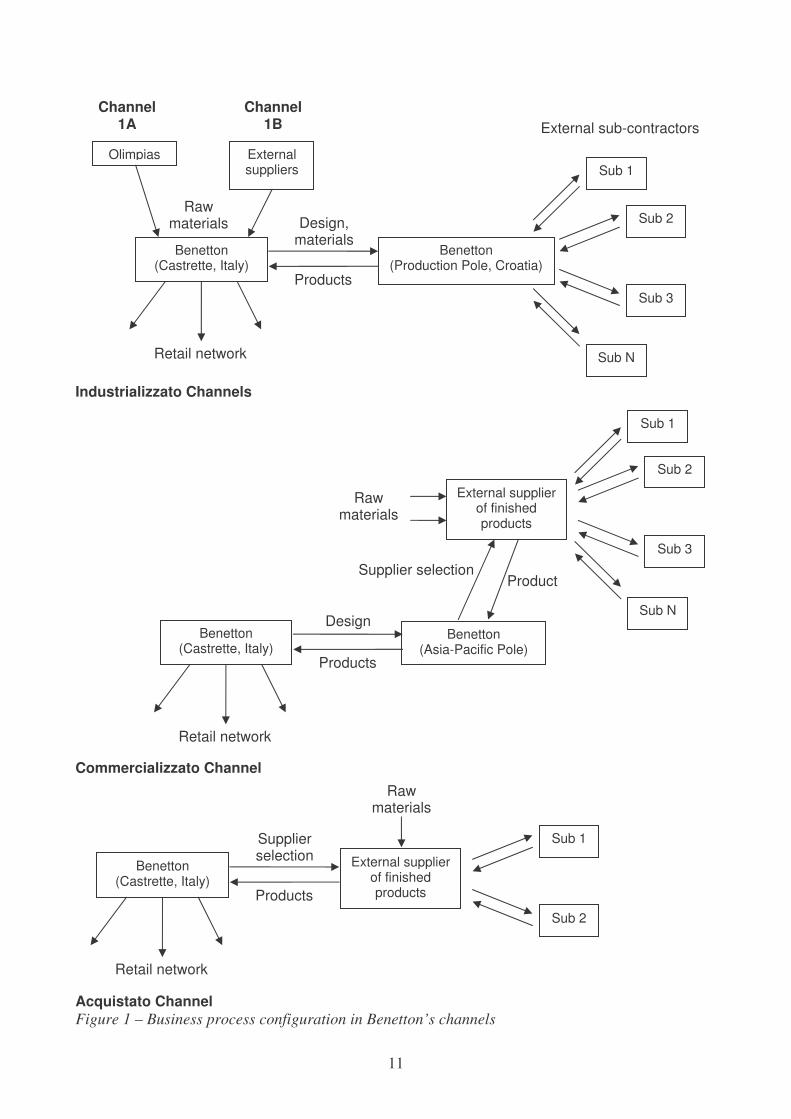
Basically Benetton supplies the retail network through three distinct channels (table 4):
“industrializzato” (industrialized, i.e. internally designed and produced), “commercializzato” (sold,
i.e. internally designed and produced outside) and “acquistato” (bought, i.e. both design and
production outsourced). Such labels betray the primary purpose for each channel: to supply the

10
retailers with products resulting from a different mix of internally/externally design and
manufacture activities. In particular, the “industrializzato” can be divided into two sub-channels: in
the first all design and manufacturing activities are performed internally, whereas in the second raw
materials are supplied by external suppliers. Benetton uses the second option to procure those
materials (e.g. cachemire) whose internal production could be too costly or too difficult, because of
the lack of scale economies or specific know-how, respectively.
Figure 1 represents the main physical and information flows Benetton coordinates to manage the
value adding processes in the three channels. The example on the first channel refers to one of the
company production poles in Europe. The second channel is exemplified by the Asia-Pacific pole, a
sort of sourcing centre, while the third channel refers to procurement from an external supplier.
Table 4 – Business process configuration in Benetton
Channel % on total production Primary purpose Strategic
priorities Differences in process activities
Industrializzato 68,5
Supply the retail stores with products internally designed
and produced
High quality Product
availability
• Subcontractors mainly located in European production poles
• Large batches in search for economies of scale
• Long term forecast planning (seasons)
Commercializzato 30
Supply the retail stores with products internally designed
and externally produced
Low cost Product
availability
• Low cost suppliers mainly located in Asia and Far-east with production skill in less fashionable products
• Large batches in search for economies of scale
• Long term forecast planning (seasons)
Acquistato 1,5
Supply the retail stores with products externally designed
and produced
Quick response to
market trends
• Fast suppliers mainly located in Europe with design and production skill in high fashionable products
11
Industrializzato Channels
Commercializzato Channel
Acquistato Channel Figure 1 – Business process configuration in Benetton’s channels
Benetton (Castrette, Italy)
Retail network
Supplier selection
Products
External supplier of finished products
Sub 1
Sub 2
Raw materials
Benetton (Asia-Pacific Pole)
External supplier of finished products
Raw materials
Product Supplier selection
Sub 2
Sub 3
Benetton (Castrette, Italy)
Retail network
Design
Products
External sub-contractors Channel
1A
Benetton (Castrette, Italy)
Olimpias External suppliers
Raw materials
Retail network
Benetton (Production Pole, Croatia)
Sub 2
Channel 1B
Sub 1
Sub 3
Sub N
Design, materials
Products
Sub 1
Sub N

12
THE INTERPRETATION MODEL
In the previous section we described how Zara and Benetton configured their supply networks and
value adding processes. Here, we propose our framework that provides the theoretical arguments to
interpret the empirical data deriving from the case studies and gives an explanation of the
relationship between the structural dimensions of the analysed supply networks and business
processes and their time performance. In doing so, we borrow an analogy with fluid dynamics, the
science which studies fluids and their motions, considering forces and masses. In our opinion, the
physical problem of a fluid flowing in a pipe and the managerial problem of logistics flows in a
supply network share many points in common. In both cases the flow speed, the characteristics of
the mean carrying the flow (i.e. the pipe or the supply network structure) and the characteristics of
what flows (i.e. the fluid or the product) determine the way in which the flow take place.
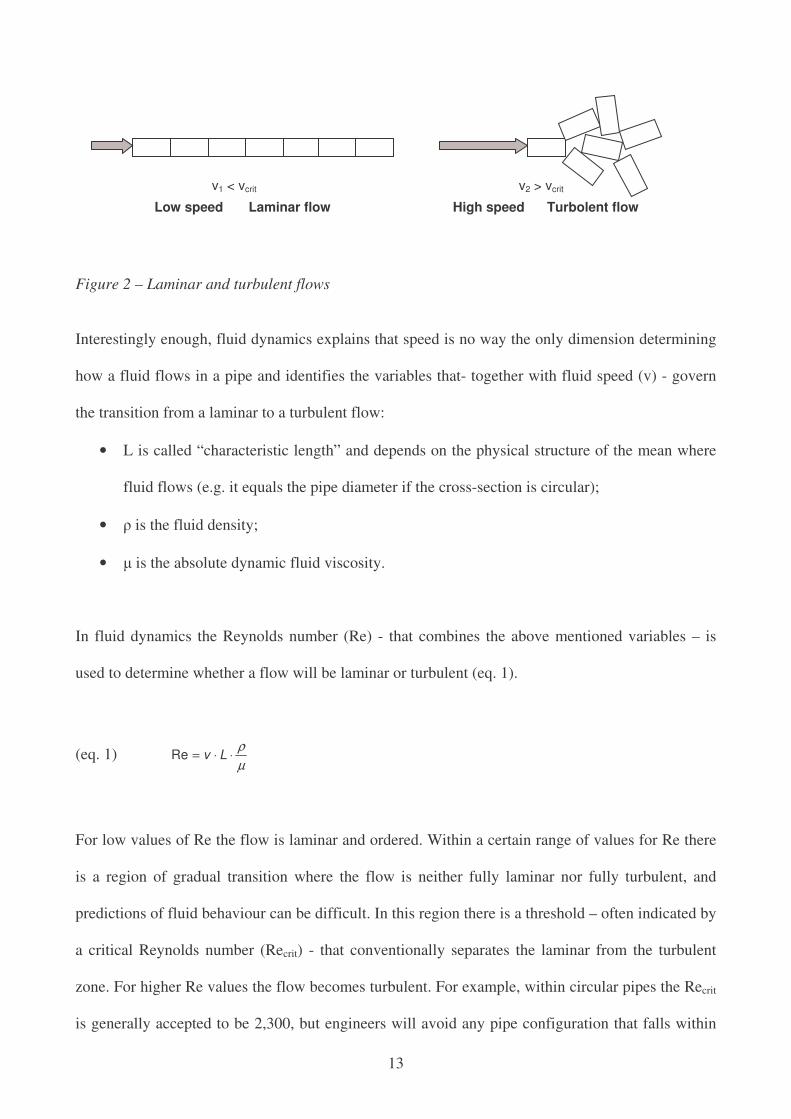
Fluid dynamics scholars use to exemplify the motion of fluid particles in a pipeline with the simple
schematization reported in figure 2. The flow of fluid particles is dynamically similar to the motion
of a line of boxes (or wagons) pushed by a force. As long as the speed is low the boxes move along
in single file, and the motion is ordered or streamlined. In this situation frictions and dissipations
are very low. When speed exceeds a threshold value, boxes start to arrange themselves in a chaotic
and disordered way. Even in this situation boxes continue advancing, but frictions and dissipations
are higher. Therefore, it is well-known in fluid dynamics that the way in which the flow take place
varies as speed varies. When speed is low the flow maintains laminar or streamlined - i.e. the fluid
flows in parallel layers, with no perturbation between the layers. Exceeding a critical speed
threshold the flow becomes turbulent, and is dominated by recirculation, eddies, vortices and
apparent randomness.
13
Figure 2 – Laminar and turbulent flows
Interestingly enough, fluid dynamics explains that speed is no way the only dimension determining
how a fluid flows in a pipe and identifies the variables that- together with fluid speed (v) - govern
the transition from a laminar to a turbulent flow:
• L is called “characteristic length” and depends on the physical structure of the mean where
fluid flows (e.g. it equals the pipe diameter if the cross-section is circular);
• � is the fluid density;
• � is the absolute dynamic fluid viscosity.
In fluid dynamics the Reynolds number (Re) - that combines the above mentioned variables – is
used to determine whether a flow will be laminar or turbulent (eq. 1).
(eq. 1) µρ⋅⋅= LvRe
For low values of Re the flow is laminar and ordered. Within a certain range of values for Re there
is a region of gradual transition where the flow is neither fully laminar nor fully turbulent, and
predictions of fluid behaviour can be difficult. In this region there is a threshold – often indicated by
a critical Reynolds number (Recrit) - that conventionally separates the laminar from the turbulent
zone. For higher Re values the flow becomes turbulent. For example, within circular pipes the Recrit
is generally accepted to be 2,300, but engineers will avoid any pipe configuration that falls within
v1 < vcrit
Low speed Laminar flow High speed Turbolent flow
v2 > vcrit

14
the range of Re from about 2,000 to 4,000 to ensure that the flow is either laminar or turbulent
(Batchelor, 2000).
Since supply networks can be thought as the mean where materials and information flow, we can
export the fluid dynamics explanation of the fluid flow to the supply network context, in search for
an enlightenment on the relations between time performance, supply network structure and business
process configuration. The flow velocity term in Re can be easily viewed as the speed of flows
throughout the supply network or, in other words, the reciprocal ratio of throughput time. Striving
to faster and faster supply market without changing the supply network structure and the business
process configuration can cause a risky drift toward chaos.
The L term in Re refers to the physical structure of the mean where fluid flows. It can be associated
to the pipe section area, shape, surface roughness, all aspect that can either facilitate or complicate
the regular, streamlined fluid flow. In a supply network context, the L term can be associated to the
structural complexity dimensions. In fact, the literature section provided evidence that, given a
product and a speed customer requires, the coordination of logistics flows becomes more and more
complicated – and, at the end, chaotic – when vertical, horizontal, spatial and relational
complexities increase. Therefore, supply network complexity dimensions, just as the L term in Re,
either facilitate or complicate the flow.
The � and µ terms in Re refer to two characteristics of the fluid flowing in the tube. � is density, and
depends on the inertial characteristics of flow particles. High density makes it harder to maintain a
smooth laminar flow at high speed. µ is viscosity, and depends on the viscous interactions between
the flow particles. Strong interactions in viscous fluids facilitate the regular flow even at high speed.
Such properties of fluids flowing in tubes can be associated to the characteristics of products
flowing in supply networks. However, it should be noted that, when talking about supply networks,
the characteristics of products are strictly connected with those of processes companies configure to
design, manufacture, distribute and retail them (Fisher, 1997). Therefore, � finds a parallel in those
product/process characteristics, such as overall dimensions, weight, fragility, variety, and volume,

15
that can complicate managerial task to streamline activity flows at high delivery speed. Instead,
since µ indicates the strength of interaction between the fluid particles, it can be associated to those
product/process characteristics that determine the required level of coupling between the activities
in the process. Strategic priorities for the process seems to be among such characteristics, at least in
the textile-apparel context. The cases analysed show that when strategic priority is fast response to
customer needs, the coupling must be very tight, because, to avoid any possible delay in the flow,
the number of activities, transactions, decisions, interactions that have to come to a successful
conclusion needs to be high. Isolating any failure from its negative consequences is crucial. To
mitigate the impact of anything going wrong on throughput time, both Zara and Benetton use short
channels and sub-contractors located in relatively narrow and close geographical areas. When low
cost is crucial, the minimum number of activities that need a successful end to meet the strategic
priority seem to be more handy. Both companies use long channel and a network of more dispersed
subcontractors. The company behaviour in terms of required coupling between process activities
when quality is the strategic priority appears to be intermediate between the cost and the time case.
According to fluid dynamic, Re should be minor than Recrit in order to have a smooth flow.
Therefore, to avoid a chaotic flow the eq. 2 should be verified, where t is throughput time, the
reciprocal ratio of speed.
(eq. 2) critLv Re<⋅⋅µρ and t
vL crit
crit ⋅=<⋅ ReRe
µρ
As reported in figure 3, the eq. 2 represents a family of hyperbola that get nearer and nearer the axis
origin as long as throughput time lowers (and speed raises). The axes represent the characteristics of
business process and supply network configuration, respectively. Higher values for each
characteristic are associated to higher risk of transition from an ordered to a disordered flow. The

16
area below the curves represents, for a given speed, the configurations of processes and supply
network that can sustain a regular and smooth flow.
Figure 3 – The proposed interpretation model
CASE DISCUSSION
Figure 3 provides the theoretical interpretation of the rational behind Benetton’s and Zara’s
decisions on their supply network and business processes configurations in the time frames their
markets impose. Both companies compete in the fashion garment industry, where fast response to
market trends is crucial. Therefore, chaos frontier in figure 3 is very close to the axes origin.
Chaotic flow
Smooth flow
Ben “industrializzato”
Ben “acquistato”
Ben “commercializzato” Zara 1
Zara 2
Supply network complexity
v1
v2 > v1
t1
t2 < t1
Many tiers Few tiers
Many companies/facilities per tier Few companies/facilities per tier Geographically dispersed Geographically concentrated Arm’s length relationship Cooperation/vertical integration
Business process complexity
Low
cou
plin
g re
quire
men
ts
Hig
h co
uplin
g re
quire
men
ts
Prio
rity:
low
cos
t P
riorit
y: c
ontin
uous
inno
vatio
n
Nar
row
prim
ary
purp
ose
Bro
ad p
rimar
y pu
rpos
e
Low
vol
umes
H
igh
volu
mes

17
Moreover, both companies consider continuous innovation of collections as a strategic priority and
coordinate a very complex supply network. These three conditions increase the risk to trespass the
chaos frontier. To face this potential problem, both companies configured their business processes
according to a multi-channel structure. This way they are able to cope with the extremely high
complexity of their supply network structure by breaking down the total material and information
flow throughout the network, and by channelling it into smaller flows easier to coordinate. This can
be represented by a left shifting in figure 3. In addition, by narrowing the primary purpose for each
channel they position themselves in the lower part of figure 3. Therefore, the analysis below
discusses the positioning in figure 3 of each channel rather than of the whole companies.
The high volumes supplied through the “industrializzato” channel forced Benetton to focus on cost
performance, that, at least in the textile-apparel industry, seems to require lower coupling between
activities than supplying fast fashion. This way Benetton curbs process complexity, lowers its
positions in figure 3 and makes it possible to shift right without falling in the chaos region. In fact,
the supply network structure is rather complex, because the company directly controls several value
adding stages (design, procurement, manufacturing and retail), and uses production poles and
subcontractors dispersed worldwide. The decision to internalise some production activities can be
interpreted as an attempt to keep supply network complexity left of the chaos frontier. This is
particularly important because quality is another strategic priority for the company that tends to
move the positioning towards the top of figure 3.
Zara’s channel 1 is similar to Benetton’s “industrializzato”, apart from time constraints that are
more stringent for Zara (see the chaos frontier left shifting in figure). Had Zara configured this
channel as Benetton did with “industrializzato”, it would have trespassed the chaos frontier. To shift
low its positioning in figure 3, Zara had to loosen the constraint on quality performance, and to
focus on cost only, and to reduce volumes, thus reducing process complexity. Then, it moved left in
figure 3 by decreasing the horizontal and spatial complexity of its supply network.

18
Continuous innovation is the core strategic priority for both Zara’s channel 2 and Benetton’s
“acquistato”. Since this means a shift towards the top of figure 3, both companies had to simplify
the structure of their supply network to avoid chaos. Interestingly enough, being time-based
competition stronger for these channels, their chaos frontiers are a little bit left of those reported in
figure 3. Both companies reduced the channel length, by externalising some activities such as
design, procurement and manufacturing. Since Benetton’s “acquistato” is more horizontally
complex and geographically dispersed than channel 2, the company had to reduce volume not to fall
in the chaos region. Instead, Zara, who moves very high volumes through this channels had to hard
simplify both spatial and horizontal complexity and to loosen the constraints on costs and product
availability, that would be to difficult to meet in this context. The large use of information and
communication technologies makes it possible for the Spanish company to cope with the high
coupling requirement associated with the relentless innovation market requires. Owned retail stores
and collaborative relationship with suppliers contribute to further mitigate supply network
complexity.
Since volume and performance requirement for the Benetton’s “commercializzato” channel are less
stringent than those for the “industrializzato” one, the Italian company can adopt a more complex
supply network configuration, characterized by dispersed sub-contractors and arm’s length
relationships.
CONCLUSIONS AND FUTURE RESEARCH
The underlying conceptual theme of our investigation is the idea of fit between how the supply
network is structured and managed and the speed of material and information flows throughout the
network itself. The basic idea is that supply network structure, business process configuration and
throughput time should be consistent, as certain combinations of choices concerning supply
network and business processes structures are more ‘‘appropriate’’ for time performance in some
sense. The main academic result of this study lies in its attempt to unify under one framework (i.e.

19
the interpretation model proposed in figure 3) some research contributions that analyse the
phenomenon under investigation from different – and, to some extent, partial - perspectives. Fisher
(1997) first explains how to design business processes in supply networks to achieve fast market
response. He also addresses issues concerning the supply network complexity, but without the
theoretical sophistication of the following research specifically dedicated to such topic. Choi and
Hong (2004) have the merits to unveil four structural dimensions of supply network complexity (i.e.
vertical, horizontal, spatial and relational complexity). Stock et al. (2000) explore the link between
two of these dimensions – they refer as channel governance and the geographic dispersion – the
integration of logistics processes, and performance. They don’t specifically address time
performance. Therefore, the interpretation model this paper proposes contributes to existing theory
(1) by declining some structural dimensions of business processes, (2) by linking them with some
structural dimensions of supply networks, and (3) by explaining the relations between such
structural constructs and time performance.
This research also has interesting practical implications, as it offers guidance for managers facing
programs for supply network design or re-configuration. By visualising the mutual interdependence
between supply network structure, business process configuration and time performance, the
proposed framework provides tool to structure brainstorming on what kind of initiatives activate to
speed flows without risking chaos. For instance, manager can start from the investigation of the
nature of the demand for their products, and devise the supply network and process configurations
that best satisfy that demand. Moreover, in certain situations can be useful to trespass the chaos
frontier. Several improvement initiatives, such as the lean management programmes, can be
triggered by a consciously create conditions in which there will be a firm threatening crisis unless
improvement actions are taken (Womack and Jones, 1996). The proposed framework can help
managers to structure their processes and supply network to create such crisis conditions.
Future research may continue this article’s line of inquiry in different ways. A limitation of this
study is that it is grounded on the textile-apparel industry only. But there are several other sectors

20
where time performance is crucial. Does the framework works well also in other industries? What
kind of adjustments are required? Such questions remain open. Another interesting issue for future
research concerns the multi-channel structure. Both companies here analysed use it to cope with
their extremely complex supply network structure, by breaking down and channelling the total flow
into smaller flows easier to coordinate. One can assume that the extent of “flow canalization”
depends on the complexity of the supply network structure and on the innovation rate. When supply
network are very complex and market require fast and continuous innovation – such in the fashion
industry – companies tend to adopt multi-channel structure. But, is this really true? And, what
happens in other industries? Indeed, a definitive explanation for our results must be left for future
research and validation across a more broadly defined sample.
Future research could also seek to better detail the dimensions included in the model. For instance,
the adoption of inter-organizational information and communication systems and the activation of
inter-company coordination mechanisms clearly impact business process configuration. How can
they be included in the model and how do they interact with the other constructs? Similarly as
regards supply network configurations. Choi and Hong (2004) maintains that complexity is only
one dimensions: the other are formalization and centralization. Even such variables can be included
in the model, but where? Within the process structural dimensions or within those related to supply
networks? And, again, how do they interact with the other constructs? Furthermore, a cross-industry
comparison can improve our understanding about the role within the framework of product-related
dimensions such as product complexity, customization, dimension, packaging, etc.
A last reseach opportunity concerns the investigation of what happens at the chaos frontier and
beyond. Fluid dynamics scholars are more interested to turbulent flows than to laminar ones,
because of their properties useful for heat and momentum transfer. Does it exist something similar
in the supply chain management context? This provides an interesting research hint for to be
addressed in the perspective of the organisational theory of complexity which considers the “edge
of chaos” as the best condition be successful in competition (Brown and Eisenhardt, 1998).

21
REFERENCES
Agrawal, N., Nahmias, S. (1997), “Rationalization of the supplier base in the presence of yield
uncertainty”, Production and Operations Management, Vol.6 No.3, pp.291-308.
Batchelor, G.K. (2000), An Introduction to Fluid Dynamics, Cambridge University Press,
Cambridge.
Berry, D., Towill, D.R., Wadsley, N. (1994), “Supply Chain Management in the Electronics Product
Industry”, International Journal of Physical Distribution & Logistics Management, Vol.24 No.10,
pp.20-32.
Brown, S.L., Eisenhardt, K.M. (1998), Competing on the edge, Harvard Business School Press,
Boston.
Camuffo, A., Romano, P., Vinelli, A. (2001), “Back to the Future: Benetton Transforms Its Global
Network”, Sloan Management Review, Fall, pp.46-52.
Childerhouse, P., Aitken, J., Towill, D.R. (2002), “Analysis and design of focused demand chains”,
Journal of Operations Management, Vol.20, pp.675-689.
Choi, T.Y., Hong, Y. (2002), “Unveiling the structure of supply networks: case studies in Honda,
Acura, DaimlerChrysler”, Journal of Operations Management, Vol.20 No.5, pp.469-493.
Danese, P., Romano, P., Vinelli, A. (2006), “Sequences of improvement in supply networks: case
studies from the pharmaceutical industry”, International Journal of Production and Operations
Management, Vol.26 No.11, 2006, pp.1199-1222.
de Treville, S., Shapiro, R.H., Hameri, A.-P. (2004), “From supply chain to demand chain: the role
of lead time reduction in improving demand chain performance”, Journal of Operations
Management, Vol.21, pp.613-627.
Ferdows, K., Lewis, M.A., Machuca, J.A.D. (2003), “Zara”, Supply Chain Forum: An International
Journal, Vol.4 No.2, pp.62-67.
Ferdows, K., Lewis, M.A., Machuca, J.A.D. (2004), “Rapid-Fire Fulfillment”, Harvard Business
Review, November, pp.104–110.

22
Fisher, M. (1997), “What is the Right Supply Chain for Your Product?”, Harvard Business Review,
March-April, pp.105-116.
Heikkilä, J. (2002), “From supply to demand chain management: efficiency and customer
satisfaction”, Journal of Operations Management, Vol.20 No.6, pp.747-767.
Huemer, L. (2006), “Supply Management. Value creation, Coordination and Positioning in Supply
Relationships”, Long Range Planning, Vol.39, pp.133-153.
Lo, J.L.W., Rabenasolo, B., Jolly-Desodt, A.M. (2004), “Leveraging Speed as a Competitive
Advantage: A Case Study of an International Fashion Chain and its competitors”, International
Conference “Innovation, Research and Technological Intelligence - Experiences and Perspectives
for the Fashion Industry”, Madrid, 28–29 September.
Mason-Jones, R., Towill, D.R. (1999), “Total Cycle Time Compression and the Agile Supply
Chain”, International Journal of Production Economics, Vol.62, pp.61-73.
Slack, N., Chambers, S., Johnston, R., Betts, A. (2006), Operations and Process Management:
Principles and Practices for Strategic Impact, Prentice Hall Financial Times, London.
Stock, G.N., Greis, N.P., Kasarda, J.D. (2000), “Enterprise logistics and supply chain structure: the
role of fit”, Journal of Operations Management, Vol.18, pp.531–547.
Towill, D.R., Naim, M.M., Wikner, J. (1992), “The Role of Industrial Dynamics in the Design of
Supply Chains”, International Journal of Physical Distribution and Logistics Management,
Vol.22 No.5, pp.3-13.
Womack, J.P., Jones, D.T. (1996), Lean Thinking, Simon & Schuster, London.
www.benetton.it, last access on February, 28th, 2007.
www.inditex.com, last access on February, 28th, 2007.