ABSTRACT LAMBERTUS, AMANDA JANE. Students’ …
93
ABSTRACT LAMBERTUS, AMANDA JANE. Students’ Understanding of the Function Concept: Concept Images and Concept Definitions. (Under the direction of Karen Norwood.) Misconceptions about the function concept can occur across a variety of representations. These misconceptions may be compartmentalized allowing students to answer questions incorrectly by evoking certain parts of the concept image. The concept image is the mental pictures that students construct for each mathematical concept. The concept definition is a formal definition of a mathematical concept. This study is exploratory nature. The researcher is trying to compare students’ understanding of the function concept by examining their concept images and concept definition when they are introduced to function concept through a formal definition versus an informal approach. The participants were traditional college students enrolled in Intermediate Algebra at a large university in the southeast region of the United States. The students completed a questionnaire that asked them to identify functions and non-functions, mentally construct functions from verbal statements, and provide a definition for the function concept. There is evidence that students do not make connections between their concept images and concept definitions in one class. There are some students that can provide a concept definition even when their classroom instruction does not specifically state one.
Transcript of ABSTRACT LAMBERTUS, AMANDA JANE. Students’ …

ABSTRACT
LAMBERTUS, AMANDA JANE. Students’ Understanding of the Function Concept: Concept Images and Concept Definitions. (Under the direction of Karen Norwood.)
Misconceptions about the function concept can occur across a variety of
representations. These misconceptions may be compartmentalized allowing students to
answer questions incorrectly by evoking certain parts of the concept image. The concept
image is the mental pictures that students construct for each mathematical concept. The
concept definition is a formal definition of a mathematical concept.
This study is exploratory nature. The researcher is trying to compare students’
understanding of the function concept by examining their concept images and concept
definition when they are introduced to function concept through a formal definition versus an
informal approach.
The participants were traditional college students enrolled in Intermediate Algebra at
a large university in the southeast region of the United States. The students completed a
questionnaire that asked them to identify functions and non-functions, mentally construct
functions from verbal statements, and provide a definition for the function concept.
There is evidence that students do not make connections between their concept
images and concept definitions in one class. There are some students that can provide a
concept definition even when their classroom instruction does not specifically state one.

Students’ Understanding of the Function Concept: Concept Images and Concept Definitions
by Amanda Jane Lambertus
A thesis submitted to the Graduate Faculty of North Carolina State University
in partial fulfillment of the Requirements for the Degree of
Master of Science
Mathematics Education
Raleigh, North Carolina
May 12, 2007
Approved by:
______________________________ Karen Norwood (Committee Chair)
_____________________________ Hollylynne Lee
_____________________________ Stephen Campbell

ii
DEDICATION
For my students.

iii
BIOGRAPHY
Amanda Jane Lambertus was born in Terre Haute, Indiana on August 19, 1978. She
attended and graduated from Indiana University, Bloomington in May, 2000 with a Bachelor
of Art degree in Mathematics. She taught one year of high school mathematics in Indiana
and three years in North Carolina before returning to graduate school at North Carolina State
University. She will complete a Master of Science and then pursue a Ph.D. in Mathematics
Education.

iv
ACKNOWLEDGEMENTS
I would like to thank those people who have supported me throughout my education.

v
TABLE OF CONTENTS
LIST OF TABLES ........................................................................................................... vii LIST OF FIGURES ......................................................................................................... viii CHAPTER 1-INTRODUCTION TO THE PROBLEM......................................................1 Misconceptions ..............................................................................................................3 Problem Statement .........................................................................................................4 Research Question .........................................................................................................4 CHAPTER 2-LITERATURE REVIEW .............................................................................5 Background ...................................................................................................................5 Reform ...........................................................................................................................5 Role of Technology........................................................................................................6 Concept Definition/Concept Image ...............................................................................7 Students’ Misconceptions about Functions ...................................................................9 Verbal.......................................................................................................................9 Algebraic................................................................................................................11 Graphical................................................................................................................12 Representations ............................................................................................................14 Curriculum Suggestions ..............................................................................................17 Object & Process Conceptions ....................................................................................19 CHAPTER 3-THEORETICAL FRAMEWORK ..............................................................24 Framework Background...............................................................................................24 Implementation of Framework ....................................................................................27 CHAPTER 4-COMPONENTS AND METHODS ...........................................................28 Context of Study ..........................................................................................................28 Participants...................................................................................................................30 Instruction Sequence....................................................................................................31 Data Collection Instrument ..........................................................................................33 Analysis........................................................................................................................36 CHAPTER 5-ANALYSIS .................................................................................................41 Overall Analysis of Accuracy of Responses................................................................42 Digging Deeper in Comparing the Two Groups..........................................................45 Examining Students’ Justifications for Identifying Functions.....................................50 Treatment Group..........................................................................................................50

vi
Graphical Representations .....................................................................................50 Tabular Representations.........................................................................................51 Symbolic Representations......................................................................................51 Control Group ..............................................................................................................52 Graphical Representations .....................................................................................52 Tabular Representations.........................................................................................52 Symbolic Representations......................................................................................53 Comparison Across Groups .........................................................................................53 Analysis of Students’ Concept Definitions..................................................................54 Comparing Students’ Concept Images and Definition ................................................57 CHAPTER 6-DISCUSSION .............................................................................................62 Implications for Mathematics Education .....................................................................62 Questions for Further Research ...................................................................................64 How the Finding Relate to Those of Other Researchers..............................................65 REFERENCES ..................................................................................................................70 APPENDICES ...................................................................................................................74 Appendix A..................................................................................................................75 Appendix B ..................................................................................................................76 Appendix C ..................................................................................................................78 Appendix D..................................................................................................................82 Appendix E ..................................................................................................................83

vii
LIST OF TABLES
Table 1: Justifications of Survey Questions...........................................................................34
Table 2: Percentage of Correct Answers ...............................................................................43
Table 3: Break Down by Question of Correct Answers ........................................................44
Table 4: Percentage of Students in each of the Concept Definition Categories ....................54
Table 5: Connections between Concept Images and Definitions Control Group..................59
Table 6: Connections between Concept Images and Definitions Treatment Group..............60
viii
LIST OF FIGURES
Figure 1: Split Domain Graph................................................................................................13 Figure 2: Three Representations of a Function......................................................................14 Figure 3: Continuity Linked to Functions..............................................................................39 Figure 4: The Total Number of Correct Answers..................................................................46 Figure 5: Graph Scores ..........................................................................................................47 Figure 6: Comparison of Total Correct Answers Across Representations ............................49 Figure 7: Symbolic Representation of a Function .................................................................52 Figure 8: Number Correct and Definition Type ....................................................................56 Figure 9: Concept Images of Functions .................................................................................67 Figure 10: Errors with Conic Sections...................................................................................68

1
CHAPTER 1
INTRODUCTION TO THE PROBLEM The concept of function is fundamental to the learning and understanding of
mathematics (Bowman, 1997; Dreyfus & Eisenberg, 1982; Eisenberg, 1991; Gagatsis, Elia,
Panaoura, Gravvani, & Spyrou, 2006,). The function concept provides a basis for high
school mathematics courses as well as college courses. In order to help improve students’
knowledge of functions, the National Council of Teachers of Mathematics (NCTM)
emphasizes: students as early as grades 3-5 need to begin looking at representing and
analyzing functions using words, tables, and graphs. Teachers should emphasize the
importance of using and interpreting several representations, while working with functions,
throughout the student’s mathematical education (NCTM, 2000). This emphasis should help
students develop a repertoire of many different types of functions and their respective
representations as they progress through their middle school and high school mathematics
courses. They should be able to manipulate and interpret a variety of functions using several
different representations, graphical, tabular, verbal, and symbolic (Eisenberg, 1991;
Moschkovich, Schoenfeld, & Arcavi, (1993); NCTM, 2000). Representations in this study
are considered the tools for interpreting and depicting functions.
Unfortunately, research indicates that college and high school students do not have a
well developed understanding of the function concept (Breidenbach, Dubinsky, Hawks, &
Nichols, 1992; DeMarois, 1997; Doyle, 1986; Mousoulides & Gagatsis, 2004; Vinner, 1983;
Vinner & Dreyfus, 1989). Students possess a variety of misconceptions and beliefs that
range from continuity issues to conflicts stemming from the representations of functions
(DeMarois, 1997; Doyle, 1986; Dreyfus & Eisenberg, 1982; Vinner, 1983).

2
Vinner (1983, 1991) used the constructs of concept images and concept definitions to
analyze students’ understandings and misconceptions of the function concept. A concept
definition is a verbal description of a mathematical concept that accurately describes the
concept in a non-circular way; whereas, a concept image is the mental picture that is
associated with the concept name in a student’s mind (Vinner, 1983). The use of these two
constructs allows researchers to look at distinctions between the formal definition of a
concept and the students’ images or the way that students think about a concept and the
association it has with the formal definition (Lloyd & Wilson, 1998).
Vinner and Dreyfus (1989) found that students compartmentalize their concept
images and concept definitions; meaning students do not always connect a formal definition
to their mental images. The implication is students can possess different and possibly
conflicting views of what constitutes a function and not be concerned with the fact that these
notions are in conflict. Another option is the students simply do not realize the conflict exists
and therefore are ignorant of it. This compartmentalization can lead to misconceptions
between the concept definition and one’s concept image, misconceptions in the concept
image, and a misunderstanding of the formal definition of a concept.
Students’ evoked concept images often focus on a single image or piece of
information about the function concept that allows the student to answer a particular
mathematics question without consulting the concept definition. Consequently, this partial
use of the concept image prevents the development of conceptual understanding (Vinner &
Dreyfus, 1989). If students’ concept images and definitions are not compatible, in
subsequent mathematics classes students will experience difficulties.

3
Misconceptions
A student’s misconceptions about the function concept may occur for several reasons.
For example, students may not fully understand the formal definition of function. Lack of
understanding a definition may lead to conflicts between students’ images and their concept
definition (DeMarois, 1996; Slavit, 1997; Vinner, 1983; Vinner, 1991; Vinner & Dreyfus,
1989). Early in their high school mathematics careers, students are typically introduced to a
formal definition of function: correspondence between two non-empty sets that assigns to
every element in the first set (the domain) exactly one element in the second set (the co-
domain), (Vinner & Dreyfus, 1989, p. 357). This definition is not unique. A survey of
mathematics textbook revealed many different definitions for the function concept. No
matter what definitions of function students are presented in Algebra courses, the students are
not forced to use the formal definition in a rigorous manner. The definition is noted, and the
teacher moves on in the instruction to help the students create and build concept images. As
a result students will tend to rely on their concept images for function when answering
questions and solving problems.
Typically, students do not consult the formal definition of a concept when presented
with an unfamiliar function (Doyle, 1986; Slavit, 1997; Vinner, 1983; Vinner 1991). This
has led researchers to investigate what alternative strategies are viable for teachers to use
when introducing the concept of function. The fact that the students do not consult their
concept definitions is not unusual. According to Thompson (1994), most people in lay
situations rely on their mental imagery to understand words. “They operate from the basis of
imagery, not from the basis of conventional constraints adopted by a community”
(Thompson, 1994, p. 23). Is it reasonable to expect students to have a better conceptual
4
understanding or at least a more well-defined concept image for function after completing an
Algebra course?
Problem Statement
Mathematical learning may not be able to take place at the higher levels without the
aide of a teacher or textbook. However, given specific teaching strategies, it may be difficult
to determine how much of the learning was due to the learning processes or influenced by the
teacher (Sfard, 1991). How does the type of instruction influence the students’ ability to
form connections between concept images and concept definitions or does it influence the
students’ understanding at all? The purpose of this study is to examine the nature of college
students’ understandings of function when the definition is presented formally versus
informally.
Research Question
Does classroom instruction affect the development and adjustment of the concept
image and definition for the function concept among students in an Intermediate Algebra
college course?

5
CHAPTER 2
LITERATURE REVIEW
Background
This chapter discusses the roles of reform, technology, and representations in
students’ understanding and the development of the function concept in the high school and
college algebra curriculums. It will identify students’ misconceptions in three different
representations (algebraic, graphical, tabular, and verbal) and the effects that these
misconceptions have on student understanding. Due to the fact that representations play an
important role in the NCTM Standards, they will also be discussed. Finally, the chapter will
suggest changes to the curriculum for teaching the function concept based on research and
the object/process conceptions for understanding mathematical concepts.
Reform
The reform movement concerned with teaching the function concept in algebra and
pre-algebra classes has sparked debate. In the past, teaching of the function concept focused
on symbol manipulation skills, drill, and memorization, without linking the concept to any
other representations such as graphs or tables (Brenner et al., 1997; Cates, 2002). The ideas
behind this type of curriculum, where students are expected to master procedures for solving
problems, are that they will be able to apply these procedures in the context of new problems
(Chazan & Yerushalmy, 2003). Current reform movements addressing the teaching of
function emphasize problem solving, the use of multiple representations, connections
between multiple representations, and development of concepts enhanced through the use of
technology (O'Callaghan, 1998; Patterson, 2002).

6
Role of Technology
With calculators and computers widely available in the schools for student use,
technology is also a large factor in reform movements. Using graphing calculators or
computers, students can explore the different representations of functions with relative ease
(Fey, 1989; O’Callaghan, 1998). Having technology in the classroom, allows the teacher to
re-vitalize the methods in which they teach mathematical concepts, and produce more
meaningful lessons that would help the student create meaning and learn for understanding
(Fey, 1989; Kaput, 1992). The visual and exploratory nature of the graphing calculator
provide learning experiences which allow students to form a deeper understanding of the
content they are learning (Cates, 2002; Erbas, Ledford, Polly, & Orrill, 2004; Fey, 1989).
The algebra curriculum needs to be adjusted in order to account for the influx of technology
and the fact that most high school students do not develop the expected levels of proficiency
and understanding in algebra courses (Fey, 1989).
Technology in the classroom can also allow educators to address concerns about
students’ difficulties in translating between different representations (Kaput, 1987). The
graphing calculators allow students to see at least two representations at one time and to view
a third one with the push of a button. The focus of the algebra courses should be redirected
to help students interpret these representations (Fey, 1989; Kaput, 1987). NCTM (2000)
states that with the use of computers and graphing calculators we can change the nature of
what students can do in the classroom with the various representations. The technology will
enable them to view the differences between conventional (static) representations produced
with pencil and paper in which each new representation is create from scratch and the fluent
nature of the representations meaning they can be altered and created with ease, displayed on

7
the calculator.
Concept Definition/Concept Image
Despite NCTM’s (2000) recommendations for students to begin exploring functions
in the third grade, a surprising number of students lack a conceptual understanding of the
function concept when entering college level courses (DeMarois, 1997; Doyle, 1986;
Mousoulides & Gagatsis, 2004; Vinner & Dreyfus, 1989). This does not mean that students
do not have some understanding about functions. Indeed, they have constructed concept
images and memorized formal definitions, but they may not have formed a connection
between the two “cells” (Vinner, 1991). In Vinner’s (1991) description of cells, he states that
the concept image cell remains empty until there is some meaning associated with the
concept name. As soon as meaning (correct or not) is attached, the image cell begins to
“fill”. The concept definition cell is “filled” when the student learns a new concept
definition. It is important to note that the definition does not have to be accurate, if the
student believes that it is. However, there may not be a complete transfer of the definition to
the “cell” if the student does not understanding the meaning behind a formal definition.
Students may only transfer part of the definition or an incorrect interpretation of the
definition. Vinner (1991) believes there is supposed to be “interaction between the concept
image cell and the concept definition cell, although the two cells can be formed
independently” (p. 70). Yet, until meaning between the definition and the images is created
there is little if any interaction between the two cells.
The independent formation of a concept image and concept definition may be a result
of students memorizing a formal definition without connecting meaning to it (Edwards &
Ward, 2004; Vinner 1991). However, once the students have created a concept image the
8
definition may become dispensable with students no longer relying on it to formulate
answers (Vinner, 1991). When formal definitions are introduced early in a mathematics
curriculum, with not much emphasis placed on them, the definitions can be easily pushed
aside in favor of more accessible images. Hitt’s (1998) investigation of in-service teachers
found that the teachers do not rely on their concept definitions when determining if a relation
is a function. It is not surprising then that students do not consult their concept definitions.
Both the students and teachers rely on their concept images to identify functions until the
students have more experiences in mathematics which force them to access and rely on
formal definitions (Gagatsis et al, 2006; Hitt, 1998; Tall & Bakar, 1991).
In several research studies, students were asked to provide definitions for the term
function (DeMarois 1997; Gagatsis, et al, 2006; Tall & Bakar 1991; Vinner & Dreyfus 1989;
Williams 1998). The definitions students provided included complete and appropriate
definition for functions and a partial definition with necessary parts missing, as well as some
students being unable to provide a definition. However, most of the students could provide a
more advanced example of a function than the definition they provided and preferred to do so
rather than state a definition (Breidenbach, Dubinsky, Hawks, & Nichols, 1992; Gagatsis, et
al, 2006). Concept images are a result of the students’ experiences, examples, and familiarity
with a particular mathematical concept (Tall, 1992; Tall & Bakar, 1991; Vinner & Dreyfus
1989). This image however, often does not agree with the concept definition (Gagatsis et al,
2006; Keller & Hirsch, 1998; Tall, 1992; Vinner, 1983). Therefore, it is imperative that
students form an accurate and adaptable concept image. Familiarity of a mathematical
concept refers to different functions in which the students may be acquainted with through
instruction or their own experiences. Students, in mathematics courses, high school through

9
college, construct concept images through a variety of methods. These methods include, but
are not limited to, exploration of examples and non-examples, working problems, classroom
instruction, and applying the definition.
Since, students do not consult their concept definition when confronted with new
situations, it is important that students’ concept images are as accurate as possible. Students
should also be willing to adapt and change their concept images as they progress through
more advanced mathematics. Providing the student opportunities to create, modify and
adjust “definitions” as necessary when they encounter new and different scenarios allows
them to learn to adjust their concept images. Their concept images will continue to grow and
when they encounter a concept definition the students will be able to mesh it together with
the images that they have, or apply that definition to a new problem and add the result to
their concept image.
Students’ Misconceptions about Functions
According to Vinner (1983), students may have expectations of functions that may
not logically relate to the definition (p. 302). Expectations on the students’ part are factors in
their misconceptions of functions. These misconceptions range across the different
representations that the students encounter.
Verbal. One common misconception in the verbal representations are that functions
exist only if mathematicians give names to them - meaning that all quadratics, polynomials,
and trigonometry ratios are functions because those groups of mathematical objects have
specific names (Vinner, 1983; Williams, 1998). It also implies that students may believe that
circles, ellipses, and vertical lines are also functions because they have names and equations
that can be easily written and identified by the students.

10
This type of misconception can be linked to the familiarity issues of teaching
functions in the high school. Typically, teachers present students with these specific types of
functions on a regular basis as part of the classroom instruction. The students become
comfortable with them and understand that quadratics and polynomials are functions without
calling on the concept definition. However, when a student encounters an unfamiliar
equation, for example a split domain equation, they do not consult their concept definitions to
determine if the resulting curve is a function. The student may simply state that it is not a
function, because the do not recognize it and the function does not have a specific
mathematical name.
Students are not the only population to have these verbal misconceptions about
functions. Even and Tirosh (1995) found teachers often have the same difficulties as
students when working with familiar curves and their verbal representations. In their study,
Brian, a teacher could demonstrate that he understood the correspondence requirement for
functions. He demonstrated this knowledge while working with arbitrary functions such as:
“let g(x) equal x, if x is a rational number and zero, if x is an irrational number” (p. 7).
However, he also believed that “familiar graphs such as circles and ellipses are function” (p.
7) even though they do not fulfill the correspondence requirement. Brian seemed unaware of
this conflict in his concept image and concept definition. Not until he was presented with a
situation, in which the definition and the image did not correspond, did Brian confront his
misconceptions. However, instead of adjusting his concept image to match the definition, he
decided that the vertical line test did not work on all functions and that he would only use it
with his students when discussing linear functions.
Tall and Bakar (1992) give an excellent example of how concept images and concept
11
definitions are at odds with a person’s everyday experiences. Normally, a concept would be
developed by looking at examples that one encounters at the outset, and focuses on the
features of those examples. Eventually, the person will encounter an example that does not
fit with the features they have allocated to the concept and adjustments need to be made to
the image. For example: “That is a bird. … A bird flies … it had wings, … and feathers …
and a beak … and lays eggs” (Tall and Bakar, 1992, p. 40). Eventually, one will encounter a
new example that needs to be tested against these features. “Is a Chicken a bird?” (p. 40).
The person will have to adjust their features to include that some birds do not fly. Here we
can see that the person is willing to adjust their criteria for what constitutes a bird. The same
types of opportunities need to be available in the classroom for students that are developing
or adding to their concept images. They develop an organized and complex concept image
without having to memorize a difficult formal definition for a concept.
Algebraic. Algebraic misconceptions come in the following forms of student beliefs:
functions are equations; functions are a process that numbers go through to get a number in
return, a function is given by a rule, and if a variable is missing from the equation, it is not a
function (Tall & Bakar, 1991; Vinner 1983; Vinner & Dreyfus, 1989; Williams, 1998).
These ideas are a direct result of the students using pieces of their evoked concept images to
answer questions, rather than the formal definition. Students that are comfortable working
with functions represented as expression or equations have a challenging time thinking about
functions that can be constructed arbitrarily (Jones, 2006). For example, “Does there exist a
function whose values for integral numbers are non-integral?” (Vinner & Dreyfus, 1989, p
359). Not only is this function statement arbitrary, it can not be written using algebraic
symbols. It has to be written in a verbal form. Therefore, it requires students to use their

12
definition of the function concept to determine if such a function exists. If the concept
definition is incomplete or non-existent, the student will not be able to determine if the
statement represents a function.
Sfard (1992) found that students believed that all functions can be expressed in a
regular manner relating x and y, and that all functions can be expressed by computational
formulas. In other words, if we provided a student with a value for the x term, they can find
the exact value for the y term. According to Vinner (1991), a student should not formulate an
answer without first consulting the formal definition, which should be the student’s concept
definition. But, the students do not use these formal definitions introduced in high school
algebra courses or introductory algebra courses at the college level as they classify functions.
Consequently, the students rarely understand these formal definitions (Gagatsis et. al. 2006;
Tall & Bakar, 1991). Instead, the students rely solely on their concept images. These images
become distorted when elements of the function concept are not introduced nor reinforced;
hence, these element are forgotten (Vinner, 1983).
Graphical. In addition to verbal and algebraic misconceptions, students can also
apply their concept image distortions to graphical representations of functions. Students
often believe that functions are continuous (Jones, 2006). This is not surprising since the
first functions that most students encounter in high school textbooks are graphical
representations of continuous curves. When students are forced to work with split domain
graphs (Figure 1) in the coordinate plane for the first time, they may not categorize these as
functions, because they are unfamiliar and they fail to meet the expectations of the students,
i.e. that functions are curves that are continuous. It is interesting to note that this same idea
of continuity is used to reject functions. For example, a common justification for why a
13
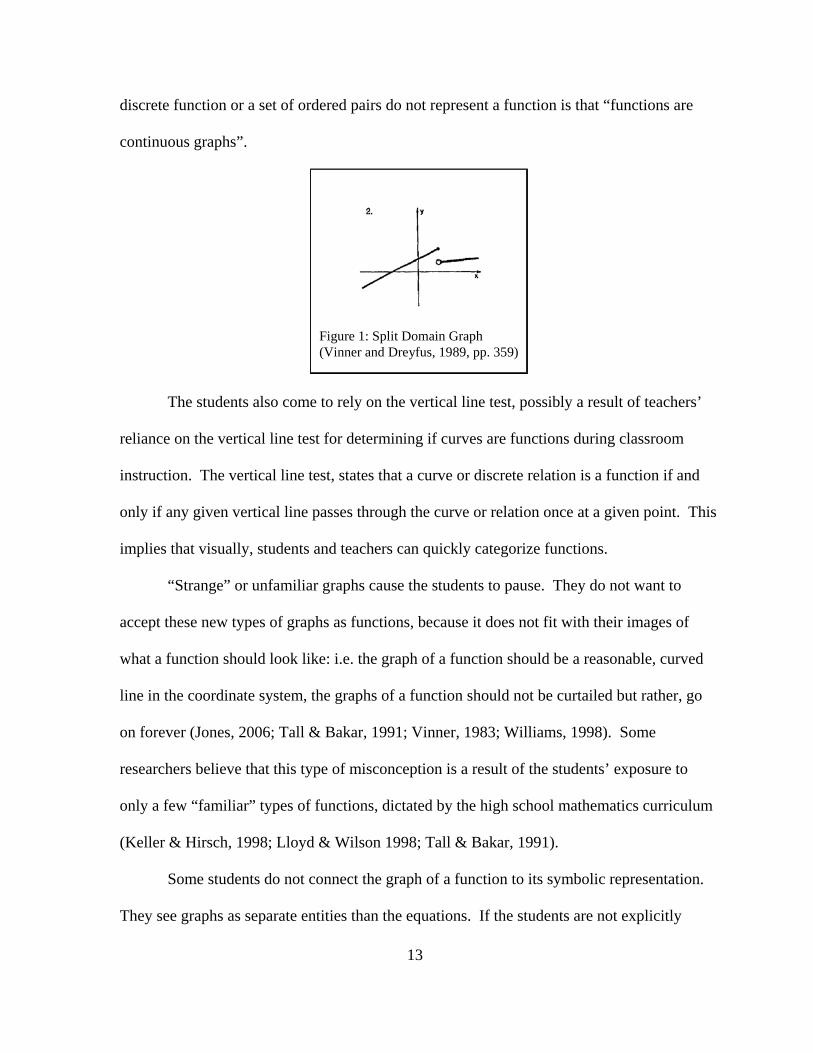
discrete function or a set of ordered pairs do not represent a function is that “functions are
continuous graphs”.
Figure 1: Split Domain Graph (Vinner and Dreyfus, 1989, pp. 359)
The students also come to rely on the vertical line test, possibly a result of teachers’
reliance on the vertical line test for determining if curves are functions during classroom
instruction. The vertical line test, states that a curve or discrete relation is a function if and
only if any given vertical line passes through the curve or relation once at a given point. This
implies that visually, students and teachers can quickly categorize functions.
“Strange” or unfamiliar graphs cause the students to pause. They do not want to
accept these new types of graphs as functions, because it does not fit with their images of
what a function should look like: i.e. the graph of a function should be a reasonable, curved
line in the coordinate system, the graphs of a function should not be curtailed but rather, go
on forever (Jones, 2006; Tall & Bakar, 1991; Vinner, 1983; Williams, 1998). Some
researchers believe that this type of misconception is a result of the students’ exposure to
only a few “familiar” types of functions, dictated by the high school mathematics curriculum
(Keller & Hirsch, 1998; Lloyd & Wilson 1998; Tall & Bakar, 1991).
Some students do not connect the graph of a function to its symbolic representation.
They see graphs as separate entities than the equations. If the students are not explicitly

14
asked to graph a function, they may see the graph as “extra baggage” not essential to the
problem (Eisenberg and Dreyfus, 1994).
Representations
According to NCTM (2000), in “the middle grades, students should be able to
understand the relationships among tables, graphs, and symbols and to judge the advantages
and disadvantages of each way of representing relationships for particular purposes” (p. 37).
However, research has shown that students who have an idea on how to apply the function
concept in one representation have difficulties in applying the same concepts in a different
representation (Eisenberg, 1991). In fact, students may not make the connection that an
equation, table, and graph all communicate the same information in different forms (Figure
2). The difficulty that students have with making connections between the representations
leads to a student who can claim a circle is function because it has a mathematical name in
the verbal or symbolic representations and then can look at the graph of a circle and claim
that it is not a function because the graph does not extend toward infinity or pass the vertical
line test.
-8 -7 -6 -5 -4 -3 -2 -1 1 2
-3-2-1
123456789
10
65)( 2 ++= xxxf
Figure 2: Three representations of a function
x f(x) = x^2 + 5x + 6 -8 30 -7 20 -6 12 -5 6 -4 2 -3 0 -2 0 -1 2 0 6 1 12 2 20 3 30

15
Some students do not view the symbolic and graphical representations as descriptions
of the same object (Eisenberg, 1991). When students or teachers draw or write down a
function, they should realize that the picture or the symbols are only one possible
representation for the abstract concept of function, which in itself can not be experienced by
the five senses (Sfard, 1991). These “different representations often illuminate different
aspects of a complex concept or relationship” (NCTM, 2000), while simultaneously
conveying the same information. Rather, students see the different representations as
separate entities. This poses a problem for the students’ cognitive development and
understanding of the function concept. Students allowed to view the two representations as
separate pieces will continue to compartmentalize their concept images and concept
definition. Moschkovish, Schoenfeld, & Arcavi (1993) discuss the need for students to come
to terms with the different perspectives regarding the functions themselves, while making the
connections between the representations. The two perspectives they discuss are the “process
perspective” and “object perspective” (p. 71). Using a process perspective, the student is
relating the x and y values, however, this relation may be represented as an equation
expression, table or graph. With an object perspective, the student views the function and its
representations as entities.
Further, Mousoulides & Gagatsis (2004) claim most students correctly solve linear
functions algebraically. But, the number of correct solutions drops considerably when the
students are presented with quadratic functions and graphical representations. They argue
that students who can effectively use graphical representations efficiently make more
connections and relations within the function concept.
No matter what the representation may be, the functions can be viewed differently

16
when considered as separate concepts (Bowman, 1993; Eisenberg & Dreyfus, 1994).
Janvier’s Star model provides an aid in helping teachers decide where the gaps or holes are in
instructional methods of the function concept. Janvier’s star suggests that a definition with a
single representation can not encompass all the meaning of a notion; that students need to be
able to translate through the different representations to gain a richer knowledge (Janvier,
1987). It also provides a way to link the different ideas and representations of functions
(Bowman, 1993; Janvier, 1987). Janvier (1987) states that when “a function is envisaged as
a variable, the role of the domain is often played down if not disregarded” (p. 68). However,
on the Cartesian plane the curve is a “natural illustration” of the variable and its domain. The
same functions can also be represented in a variety of different settings and representations
(Dreyfus & Eisenberg, 1982). Examples of these types of settings and representations can be
viewed in the Dreyfus & Eisenberg (1982) study (Appendix A).
The multiple representations can yield a deeper and more flexible understanding of
the function concept (Keller & Hirsch, 1998). The different representations all develop and
display different aspects of a function. Depending on the problem context, setting, and
question, a different representation may be more helpful than another. Consider the
following example, students working with functions in “break even problems” graphically
they can locate a break even point faster. But, interpretation of the meaning of that break
even point and the interpretation of the different functions is still something that the students
need to be taught. In this particular case, a graphical representation provided easier access to
the information than a table or symbolic representation may have provided (Lloyd & Wilson,
1998).
17
Curriculum Suggestions
Due to the fact that students’ concept images are often their only reference for
classifying functions (Tall & Bakar, 1991; Vinner, 1991), it is important that teachers provide
students with experience that will help them create accurate concept images and definitions.
Eisenberg (1982) stated that teachers should “provide the students with a good exposition
and appropriately structured exercise to reveal various aspects of the notions, and students
will understand, internalize and master the notion” (p. 140). In order to provide these
different exercises, the teacher can introduce the function concept in a variety of
representations, contexts, activities, and examples (Eisenberg, 1982; Gagatsis et al, 2006;
Tall & Bakar, 1991). Each of these methods has its own disadvantages as well as
advantages. For example, teaching functions using only examples and non-examples may
lead students to erroneous impressions of the general concept; if the only examples are
continuous functions that extend in both directions, and then the student may think that is the
only type of graph for a function. Therefore, it is important for educators to use a
combination of the methods.
Another teaching technique that challenges the students’ concept image and forces
them to use a definition is to present the students with tasks that cannot be solved correctly
using only a concept image (Vinner, 1991). To help the teacher understand the students’
concept images, Williams (1998) suggests the use of advanced organizers. By having the
students construct concept maps using advanced organizers; teachers can gain insight into
what images the students hold. Concepts maps can also help the teacher create dialogues to
address the different notions and misconceptions held by the students. Advanced organizers
will help both the student and the teacher evaluate the concept image, keeping in mind that

18
there is no possible way for the entire concept image to be placed in an advanced organizer.
Textbooks often start the unit on functions by having the students construct tables of
ordered pairs, plot these ordered pairs on the Cartesian Plane, and then connect the points to
form the corresponding lines. This is a poor technique since students may not be familiar
with the concept of functions; therefore, the students raise barriers against the meaning
behind these constructions because they look strange. On the other hand, graphical
representations and coordinate ordered pairs are familiar to the students and provide a
method for introducing the function as a symbolic representation for a line. This would
provide meaning for the students about the function concept and help the students develop
the skills necessary to move between the different representations (French, 2002).
Mousoulides and Gagatsis (2004) claim a pure algebraic approach to functions gives
students a local image of the function concept, “on the contrary, a geometric approach gives
students a global approach of the concept of function” (p. 386). The geometric approach, in
this case, is referring to using a graphing approach to solve problems involving functions.
By having students use different representations, they can construct mental images of the
functions and build a broader concept image. Using representations “has the potential [for]
making the process of learning algebra more meaningful and effective” (Friedlander &
Tabach, 2001).
Working with the different representations in different problem contexts allows the
students to see the advantages and disadvantages of each, what situations would promote
efficiency for certain representations and accommodate the individual thinking styles of each
student (Friedlander & Tabach, 2001). Further, technology can provide the means with
which different representations can be employed efficiently in the classroom.

19
In many classrooms, the textbook is the sole resource that teachers use. They develop
lessons, retrieve exercises, and use the testing strategies from these books (Jones, 2006).
Also, teachers often will use the definitions for concepts provided by the textbooks. Using
these definitions without questions can cause issues for the students later, as every textbook
publishes its own version of the definition. For example, the following are definitions for
function found in high school and college texts.
1. “A function is a relation in which no two different ordered pairs have the same first coordinate.” (Bello, 1998, p. 124)
2. “A variable y is a function of a variable x if each value of x determines a unique value for y.” (Kime & Clark, 2001, p. 16).
3. “A function is a relation that pairs each element in a domain D with exactly one element in a range R.” (Hall, 1994, p. 502).
4. “A function is a correspondence between a first set, called the domain, and a second set, called the range, such that each member of the domain corresponds to exactly one member of the range.” (Bittinger & Ellenbogen, 1998, p. 75).
5. “A function is a correspondence that matches each input value with exactly one value of the output variable.” (Hall & Mercer, 2007, p. 133).
From examining these different definitions of the function concept, we can see that teachers
who rely solely on textbooks and their definitions may miss some of the ideas behind the
concept. For example, Bello (1998) has chosen to define a function in terms of ordered pairs.
A student first learning this difficult concept may think that all functions have to be
represented as ordered pairs. However, Sfard (1991) suggests that defining mathematical
concepts as abstract objects is not the only option, and that it might be helpful to the students
to have a more concrete definition that the can build on as they encounter new ideas
connected to the function concept.
Object & Process Conceptions
To understand the function concept means to go beyond the manipulation of symbols
and formulas and using the vertical line test. Eisenberg and Dreyfus (1994) state “a central

20
aspect to function sense is the use of more than one representation for the same mathematical
situation” (p. 46). Students should be able to “make sense of a situation by constructing a
mental process that transforms (mental) objects” (Breidenbach, et al, 1992, p. 247).
Sfard (1991) refers to student understanding of the function concept from structural
and operational points of view. In an operational conception, students are thinking of
transformations as process, algorithms, and actions. In the structural conception, the student
can think of functions as static objects which they can manipulate (Sfard, 1991). These two
conceptions are not distinct entities. For the same mathematical concept, such as functions,
these conceptions are often blended together to help the student create meaning. Students
often begin thinking of functions in an operational manner. For example, given f(x) = x2 +
5x +6, they want to “do something”. That something ranges from graphing the function to
finding the roots often without any instruction. Students do not see f(x) = x2 + 5x +6 as an
object. However, graphing a function may provide a link from the operational to structural
conceptions in that the graph represents all “the infinitely many components of the function”
(Sfard, 1991, p. 6) represented as a continuous smooth line. The students can see the
function as a whole on the plane.
Visualization is an important aspect of students’ understanding of the function
concept. It makes abstract ideas more accessible and the key to solving many problems
concerning functions (Eisenberg & Dreyfus, 1994; Sfard, 1991). However, visualization
does have disadvantages. Many students that prefer to visualize are not able to move beyond
the concreteness of the image (Eisenberg & Dreyfus, 1994). A good concept image can
support the structural conception, because they can be manipulated similar to real objects and
the present a holistic construction of the mathematical concept (Sfard, 1991). However, this

21
structural conception does not occur in students without the help of teachers, it “is a lengthy,
often painfully difficult process” (Sfard, 1991, p. 16).
For a student to possess an operational view of the function concept, they would still
be working in a stage where computation was necessary. They would be relying on
algorithms to help them manipulate the functions, Breidenbach et al (1992) calls these
algorithms and manipulations actions (p. 249). However, if the entire manipulation or
transformation is internal, Breidenbach and his colleagues (1992) refer to the action as being
interiorized and thus it becomes a process (p. 249).
In their study, Breidenbach et al (1992) asked pre-service teachers, “What is a
function?” followed by “Give an example.” (p. 252). They then classified the participants’
answers into four categories, prefunction, action, process, and unknown. A typical
prefunction response was “I do not know”, “a mathematical equations with variables”, “a
mathematical statement that describes something”, or “a social gathering”. An action
response was one in which the students emphasized substituting numbers for input and
output, but did not state that one starts with a value and does something to get a new value,
the procedure was tied to an equation, or the input was restricted. A process response had the
input, some sort of transformation, and output, but the statement was general (see
Breidenbach et al, 1992, for specific examples). Of the sixty-two responses, 64% were at the
prefunction or action level, and 21% were unknown.
Researchers grouped the examples provided by the participants into eight different
categories;
I. Something that could not really be interpreted as function II. Omitted III. An equation in two or more variables IV. A graph

22
V. F(x) = some algebraic or trigonometric expression VI. Y = some algebraic or trigonometric expression VII. An algebraic or trigonometric expression alone VIII. Some attempt to describe a process (p. 253)
What is interesting about their findings is that 64 % of the participants gave examples
in either category V. or VI. (p. 253). Another interesting fact is that prior to the experiment,
the pre-service teachers which were questioned, only 3.7% gave a process example of
function and none of them gave an example of a function in graphical form (p. 254). If the
concept definitions are dispensable when students and teachers form concept images, it
would not be uncommon that they could provide examples that are more complex than the
definitions they provided. This is true with other concepts not related to mathematics as
well. For example, if one was to ask a group of people what they thought the definition of a
tree would be, there would be a variety of answers. However, those people would be able to
provide may examples of trees, many of them may be more complex and encompass many of
the attributes of trees than the definition they supplied. In fact, one may not even know the
definition for the concept of trees, in order to provide examples. Incidentally,
Dictionary.com defines a tree as “a plant having a permanently woody main stem or trunk,
ordinarily growing to a considerable height, and usually developing branches at some
distance from the ground”. One can see here that a formal definition can be very broad to
encompass all the possible outcomes. However, definitions provided by people may be more
specific if the person is thinking of certain families of trees or the definition could become
cumbersome if a person tries to include all the things that they know about trees. The same
is true for mathematical examples as well. Therefore it is important to have definitions that
meet the requirements of the course and the needs of the students.

23
It should not be surprising, therefore that some of the misconceptions students have
are enriched by their teachers’ misconceptions of the function concept. These teachers do
not have a well developed understanding of the subject matter. In a study by Even and
Tirosh (1995), they found that teachers are able to provide definitions for functions that
include the univalence requirement and they are able to classify functions and non-functions.
However, further investigation into the teachers’ subject matter knowledge revealed that their
knowledge of functions was shallow. (The univalence property of functions is the
correspondence of one element in the domain to exactly on element in the range.)
Breidenbach et al.’s (1992) process understanding is still at Sfard’s (1991) operational
conception of function. It is not until the process is encapsulated that it becomes an object.
Encapsulation occurs when an action transforms a process into an object (Breidenbach et al.,
1992). However, this operational conception, while unconditionally necessary and adequate
for problem solving, it can not be easily processed. It is stored “in unstructured, sequential
cognitive schemata”… “it must be processed in a piecemeal, cumbersome manner” (Sfard,
1991, p. 26). This operational conception may lead to insufficient understanding of the
concept.
Students possess a variety of misconceptions and inaccurate concept images about the
function concept. These misconceptions include thinking: that functions are continuous, that
functions are rules, formulas, or equations, that functions need to have specific names, and
that functions should be familiar. Students also have difficulty in connecting the graphical,
tabular, and symbolic representations of functions. These representations are viewed as
separate entities and do not relate to one another. Further, once a student has constructed a
concept image, they no longer refer to the concept definition.

24
CHAPTER 3
THEORETICAL FRAMEWORK
There is a wide range of misconceptions that students may possess when it comes to
understanding the nature of functions. As a result, the framework chosen to analysis the
nature of the students’ concept images had to be versatile enough to allow for all the types of
misconceptions and still look at the relationship between the concept images and concept
definitions. Therefore, the objective of this chapter is to discuss Vinner and Dreyfus’s (1989)
study which informed the framework for the study described in this paper. This chapter will
also describe the adjustments made to the categories described by Vinner and Dreyfus (1989)
and how the framework was applied to this study.
Framework Background
Vinner and Dreyfus’s (1989) work focused on the concept images of 271 college
students and 36 junior high school teachers. They compared the participants’ images to their
concept definitions for the function concept. Their study explored the following questions:
1. What are the common definitions of the function concept given by college students before they start their calculus course?
2. What are the main images of the function concept that these students us in identification and construction tasks?
3. Are there statistically significant differences between groups of students with different majors in the way they conceive functions?
4. How frequently do students compartmentalize their formal definition of function and their image of the function concept? p. 357
The researchers separated the students into groups determined by the level of mathematics
courses their chosen degrees would require. The teachers were participating in an in-service
training program. The participants were asked to fill out a questionnaire concerning
functions. The questionnaire contained seven questions; the first four were identification

25
problems, the fifth and sixth were construction problems and the seventh question asked the
students to provide their definition for the concept function. The identification problems
were designed to elicit participants’ images of function, i.e. whether or not they could
identify a function. The construction problems were probing the participants’ definition of
function and their ability to apply it to a particular situation. Finally, Vinner, Dreyfus and a
research assistant, analyzed the answers.
The researchers categorized students’ definitions into six categories – a refinement of
Vinner’s (1983) previous work and they categorized students’ concept images as revealed
through their work on problems 1-6 into four categories. The six categories the researchers
used to describe students’ concept definitions included: “correspondence”, “dependence
relation”, “rule”, “operation”, “formula”, and “representation” (Vinner, 1983, Vinner and
Dreyfus, 1989, p. 359-360).
Correspondence refers to a function in the formal definition (Dirichlet-Bourbaki
definition), meaning that a function is expressed as a correspondence where every element of
the domain is paired with exactly one element of the range. Dependence relations are
definitions in which the students stated that one variable would be dependent on the other.
Student responses did not state what this dependence might be or how it affected the different
variables. Rule suggests that the students expect there to be regularity between the variables,
not an arbitrary correspondence. The category operation, states, “a function is an operation
or manipulation” (pg 360). The student acts on a number (input) by a given set of algebraic
and arithmetic operations then the output is then considered the image. Formula is similar to
operation; however, the student states that the function is a formula, expression or equation.
The student did not discuss correspondence between variables or set. The final category is

26
representation. Vinner and Dreyfus (1989) state that the “function identified, in a possibly,
meaningless way, with one of its graphical or symbolic representations” (pg 360). The
analysis showed that students giving some version of the correspondence category responses
increased with the level of the mathematics courses that the students were taking. Also, the
higher the level of mathematics required by the students’ the more correct answers and
explanations they provided.
The four categories for concept images (in order of importance for considering what
objects might be functions according to Vinner & Dreyfus (1989)) included: “one-
valuedness”, “discontinuity”, “split domain”, “exceptional point” (pg 361). One-
valuedness focused on assigning correspondence between exactly one value to every element
of the domain. The students with this type of response primarily used a version of the formal
definition. Discontinuity centered on graphs that had gaps, holes, or jumps in function.
Some students would use these gaps as a reason for a graph to not be a function, while others
used discontinuity as a reason for accepting a graph as a function. Split domains created
graphs that may not have smooth flowing curves. Rather, the domain of the graph was split
into different parts called sub-domains which may have different rules of correspondence.
Again, the split domain reasoning was used for both rejecting and accepting graphs as
functions. Finally, the exceptional point category focused on the graph having a point in
which the given correspondence did not hold. For example, in the graphx
y 1= , zero would
be an exceptional point.

27
Implementation of Framework
The purpose of the current study is to determine if there is a difference in students’
understanding of the function concept by examining students’ concept images and concept
definitions after the students are introduced to the function concept using different
instructional strategies, rather than to compare their concept images and definitions based on
the number of mathematics classes they have taken. Findings from Vinner and Dreyfus’
(1989) research served as a framework for describing students’ understandings of function.
The framework of Vinner and Dreyfus (1989) served as a basis for categorizing the
students’ concept images and concept definitions since both Vinner and Dreyfus’s study and
this study collected data on college students’ understanding of the function concept. The
students in this study were mostly incoming freshman.
Vinner and Dreyfus (1989) used this framework in an attempt to evaluate students’
knowledge in their ability to answer questions about functions. Further, the researcher used
the framework in the current study to look at students’ understanding about the concept
definition for the function concept and their ability to identify functions in different
representations.
28
CHAPTER 4
COMPONENTS AND METHODS
The components of the study and the methods for conducting the study will be
described will be discussed in this chapter. The study is exploratory in nature meaning that it
is looking for evidence of a difference in students’ understanding of the function concept
using different classroom instruction methods for introducing functions. Therefore some
time will be spent describing the different students and the setting of the study. Further, the
data collection process and analysis will be introduced and discussed.
Context of Study
The study was situated in an Intermediate Algebra course at a large southern urban
university. Students enrolled in the course do not earn mathematics credit towards their
degree, and thus it is considered a remedial course. The course focused on using technology,
specifically a graphing calculator, and multiple representations to teach algebraic concepts.
The students enrolled in the course must have competed at least Algebra I, Algebra II and
Geometry at the high school level or in the community college. The students opting to take
the course either did not take the college math placement test, placed into the course, or
chose to take the course as a refresher returning to college after several years in the work
place. Credit for the course is only given if the student passes the class with a C, 70% or
better. Although the course does not satisfy the one of the mathematics requirement for
general education requirements, the grade is calculated in the students’ grade point average.
The course required that the students be able to use a graphing calculator efficiently.
Throughout the course, the instructors teach the students how to use the technology. A
course design was to have the students use the graphing calculator on all of the quizzes,

29
exams and homework assignments. The students were expected to be fluent in the use of the
technology and move between the three representations of functions with confidence.
Furthermore, the students were expected to look at the three representations of a function and
understand their meanings, and be able to answer questions about them. By using the
graphing calculator, students were able to move through the different representations of
functions with the fluency expected and focus on the interpretation of the representations.
The researcher chose to use participants from four classes taught by herself and
another instructor for a variety of reasons. First, having four classes would permit greater
participation in the study. Second, it initially balanced the number of students in the
treatment and control groups. Third, the instructor of the remaining sections not used in the
study was not as experienced in teaching the course. This was her first year semester
teaching the Intermediate Algebra courses.
The researcher has considerable more teaching experience than the instructor of the
control group. The researcher spent four years teaching algebra, geometry, and technical
mathematics in public high schools, one year teaching undergraduate mathematics at Indiana
University, and three years teaching the Intermediate Algebra courses, for a total of nine
sections. The control group instructor has no experience teaching in the public school
system. However, she had taught the Intermediate Algebra for a year prior to the study. For
this reason, the researcher taught the treatment classes, and the other instructor taught the
control group.
Both instructors have taken the same graduate level courses for teaching mathematics
at the master’s level. These classes have provided many opportunities for the instructors to
gain confidence in teaching with technology. Therefore, both of them were comfortable

30
using the graphing calculators as part of the instruction as well as comfortable demonstrating
how to use the graphing calculators. In the planning stages of the study, the two instructors
talked about the misconceptions of students’ understanding of the function concept, and
possible strategies for teaching a control and treatment group.
Participants
Forty six of the 62 students enrolled in four sections of Intermediate Algebra in Fall
2006, initially participated in the study. Two sections were taught by the researcher and
served as the treatment group (n =22), in which students were introduced to functions
without providing a formal definition of function. In the two section serving as the control
group (n=24), taught by an experienced Intermediate Algebra course instructor, students
were introduces to the function concept with the use of a formal definition. However, not all
of the volunteers were kept in the study.
Three of the four classes used in the study had similar demographics. Meaning, the
average student was a traditional incoming freshman. The students all had similar
mathematics background in high school, and were almost split fifty-fifty by gender. These
classes met during the morning hours, Monday through Friday for fifty minutes each day.
The evening class had a different make-up of students as consistent with previous night
classes. Many of the students in this class were older and many had previous college
mathematics courses. Most of these students were returning to school for second degrees of
degrees beyond Associates. They were enrolled in the course for a refresher to mathematics.
While the evening class provided a different type of student, it was still valuable to look at
their concept images and concept definitions.
Several participants were removed from the sample because of their experiences and

31
age. The night class traditionally provides a different variety of students in the Intermediate
Algebra courses. Since many of these students are returning for further degrees, they should
not be compared to traditional students as a whole, unless one is comparing the two groups
understanding of function. This however was not in the scope of this particular study.
Instruction Sequence
The instructor teaching the treatment group was the researcher. She used an
alternative method to the formal definition for introducing the function concept (Appendix
B). This included allowing the students to create their own classroom definitions for the
function concepts, as well as presenting a variety of functions and non-functions for them to
apply their definition to. The students in the treatment classes created their own definition of
function based on their prior experiences, concept images, examples and non-examples
provided by the instructor, and classroom discussion. Initially, the definition started out
vague. However, it was gradually expanded to include all the necessary parts.
The control group instructor taught the function concept by introducing a formal
definition. This definition was taken from the textbook: “A function is when exactly one
element in the range corresponds to each element in the domain” (S. Wilson, personal
communication, October 3, 2006). See her lesson outline in Appendix C. The students used
this definition and the vertical line test while looking at several examples and non-examples
to determine whether or not they were functions.
The instruction of the treatment classes and the control classes was similar in the fact
that both instructors used many examples and non-examples to demonstrate the differences
between functions and non-functions as well as a definition. The definitions and examples
varied depending on the section. For treatment classes, the students used their constructed

32
definitions, and the control classes used the formal definition from the textbook. The course
focused on using multiple representations, therefore these representations were used in all
classes to present functions in alternative ways to the symbolic notation, in particular, graphs
and tables. The students were all assessed using the same quizzes, tests, and homework
assignments. The students in all the classes were also provided the same review assignments
to help them prepare for quizzes and exams. The three morning classes followed the same
schedule throughout the semester. The night class followed a faster paced schedule, since
they met three days a week instead of five.
The biggest difference in the classes was the teaching style of the two instructors.
The instructor of the control groups presents the material in an organized and methodical
manner. She uses a variety of graphs, tables, drawings and other visual aides to supplement
the lecture and to ensure student understanding. While the instructor of the treatment classes
also uses a wide range of representations, the class discussed the different concepts and
produced definitions based on the discourse. The instructor of the treatment group was more
flexible in the order of the material covered and often allowed the students to dictate the
direction of the class.
The participants volunteered to complete the survey. The decision to participate in
the study had no effect on the students’ grades for the course. All students read, signed, and
were given a copy of a consent form as required by the IRB, the Institutional Review Board,
at the participating university (Appendix D). Since the data was originally collected as part
of an academic class, the Principle Investigator listed on the IRB is the instructor of that
class.
33
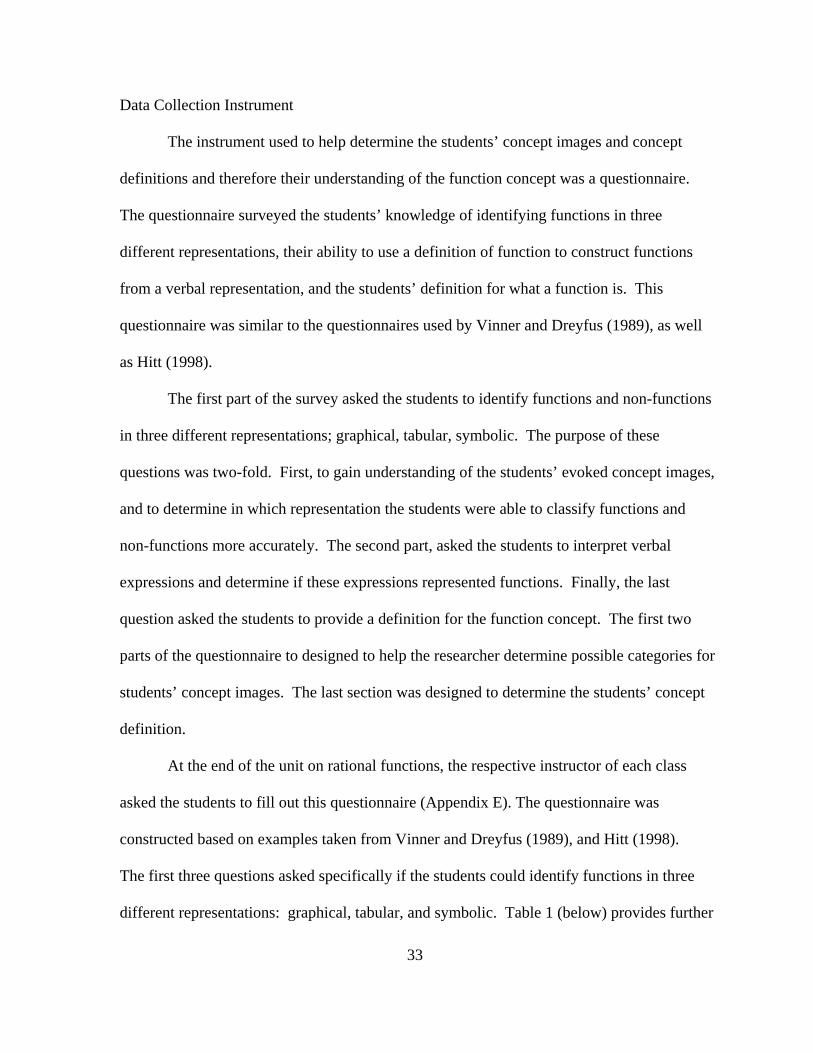
Data Collection Instrument
The instrument used to help determine the students’ concept images and concept
definitions and therefore their understanding of the function concept was a questionnaire.
The questionnaire surveyed the students’ knowledge of identifying functions in three
different representations, their ability to use a definition of function to construct functions
from a verbal representation, and the students’ definition for what a function is. This
questionnaire was similar to the questionnaires used by Vinner and Dreyfus (1989), as well
as Hitt (1998).
The first part of the survey asked the students to identify functions and non-functions
in three different representations; graphical, tabular, symbolic. The purpose of these
questions was two-fold. First, to gain understanding of the students’ evoked concept images,
and to determine in which representation the students were able to classify functions and
non-functions more accurately. The second part, asked the students to interpret verbal
expressions and determine if these expressions represented functions. Finally, the last
question asked the students to provide a definition for the function concept. The first two
parts of the questionnaire to designed to help the researcher determine possible categories for
students’ concept images. The last section was designed to determine the students’ concept
definition.
At the end of the unit on rational functions, the respective instructor of each class
asked the students to fill out this questionnaire (Appendix E). The questionnaire was
constructed based on examples taken from Vinner and Dreyfus (1989), and Hitt (1998).
The first three questions asked specifically if the students could identify functions in three
different representations: graphical, tabular, and symbolic. Table 1 (below) provides further

34
explanations on why each of the questions was chosen.
Table 1: Justifications of Survey Questions Representation Question Justification for Using
-6.28319 -3.14159 3.14159 6.28319
-4
-3
-2
-1
1
2
3
4
Sine Function: f(x) = sin (x)
This was a nice continuous graph with a mathematical name and is easily recognized by students with some trigonometry background.
-10 -8 -6 -4 -2 2 4 6 8 10
-10
-8
-6
-4
-2
2
4
6
8
10
Rational Function: f(x) = 1/x
This graph represents a discontinuous function, and was representative of the functions graphed by the students in their rational function chapter.
-5 -4 -3 -2 -1 1 2 3 4 5
-5
-4
-3
-2
-1
1
2
3
4
5
Circle: x2 + y2 = 4
To test the misconception that a named curve is a function.
Graphical
-10 -8 -6 -4 -2 2 4 6 8 10
-10
-8
-6
-4
-2
2
4
6
8
10
Rational Function: f(x) =
43
2 −−
xx
This graph was chosen to address the misconceptions involving continuity. The students in these particular classes should have recognized both rational curves as functions without being told specifically what the domain in each of the pictures was. This would have been a result of the instructional strategies in the course.

35
x y1(x)-5-4-3-2-10123456789
5642302012620026
12203042
This table represents some of the ordered pairs for a particular parabola. The interesting piece is the two zeros in the center of the table. Having studied how to use the different representations for solving quadratic functions, the researcher wanted to see how changing the question from find the roots to is it a functions would affect the students interpretation of the table.
x y1(x)-5-4-3-2-10123456789
1.81.75
1.666671.5
1undef
32.5
2.333332.252.2
2.166672.14286
2.1252.11111
This particular table was chosen to see how the students would react to the “undefined term’ in the y1(x) column.
Tabular
These two particular tables were chosen to challenge the students thinking, that in a function the numbers in each respective column must be different.

36
2yx = 4−= xy
y = 2x + 5 1243 2 +−= xxy
The first four questions were used to find out if students would be able to recognize square root, linear, and quadratic functions as well as curves that are not functions. For the first problem, the students in the study would have thought x was still the independent variable. This has to do with the fact that the students used graphing calculators throughout the course.
Symbolic
⎩⎨⎧
=01
y
This question was used to test their concept definition. Most of the students would not have seen functions of this sort.
The next three questions asked the students to use their concept images and definitions to
construct a function from a verbal representation. Since the students did not answer these
construction questions, they were removed from the analysis. The final question asked the
students to provide their definition for a function. The questionnaire asked students to
provide justification for all of their answers in the form of a few words or a sentence.
The instructor of each of the classes gave the questionnaires during a regular
classroom session and the students completed them during that time.
Analysis
Initially, all questionnaires collected were analyzed, including those where the
student(s) replied with question marks or “I don’t know”. Later, the researcher decided to
remove those questionnaires from the study in which the students did not take the questions
if x is even if x is odd

37
seriously and the questionnaires in which every answer was “I don’t know”. The researcher
did not feel that the students who responded with justifications such as “No, really!” would
improve the knowledge base of research on students’ understanding of the function concept.
Also, students whose answers were simply that they did not know, may not have had enough
time to complete the questionnaire, did not take the questionnaire seriously, or simply did not
know the answers to the questions. In any case these students were left in the study and
included in the analysis. Further, there is a gap between being able to answer a mathematical
question and being able to communicate why that particular answer was chosen. Therefore,
questionnaires with answers and not justifications were also kept in the analysis.
The questionnaire asked the students to identify functions and non-functions, as well
as, to provide justification for the decisions. The identification of functions and non-
functions was based on correct yes or no responses. For each representation, the students
were given four graphs and tables and five equations, in which to classify as functions or not.
By looking at the responses in each of the two groups, the researcher was able to find a
percentage of correct answers in each of the representations for both the treatment group and
the control group. The questionnaire was scored as either having correct answers or incorrect
answers for each of the representations during this part of the analysis. There was not an
analysis for comparing total scores on the questionnaire for the treatment and the control
groups.
The justifications from the questionnaire were used to evaluate the students’ evoked
concept images. It was not important whether or not the student correctly classified the
functions and non-functions for this part. It was the justification for the decision that they
made that was important in helping to evaluate the evoked concept images. For example, if a

38
student incorrectly labeled the fourth table as a function, the researcher was interested in
knowing why they thought that was a function. Based on the justification, they could be
“placed” into a category representing their concept image. The justifications were not scored
per se. Rather the researcher grouped the justifications into respective types and these types
were compared to the categories adopted from Vinner and Dreyfus’s (1989) framework. The
definitions provided by the students were also grouped according to the categories from
Vinner and Dreyfus (1989).
The questionnaire responses were analyzed using both Excel and Fathom. Fathom is
a statistical software program that will create graphs, calculate statistical measures, and
perform tests on data. The data can be entered by hand or imported from other spreadsheets
such as Excel. The software has some unique features that allow the user to click on pieces
of a specific histogram and see where those students fell in the other graphs or on in the
table. Excel was used to help organize the data and look at relationships students have
between their concept images and concept definition.
The researcher looked at the answer to each of the questions and then the
justifications on the questionnaire given to the participants. The justifications for the answers
were used to place students in a particular category for describing their concept images and
concept definitions. For example, in the fourth graph on the questionnaire, Figure 3, a
student stated that this was not a function, because it was not continuous. This student would
fall in the category “discontinuity”.

39
-10 -8 -6 -4 -2 2 4 6 8 10
-10
-8
-6
-4
-2
2
4
6
8
10
Figure 3: Continuity Linked to Functions
If we look at one of the definitions: “f(x), what is the equation that will solve or x.” Here,
one can see that the student does not have a clear understanding of the definition of a
function. The researcher would categorize this definition as a “formula”, because the student
has demonstrated that they desire a rule that will allow them to solve for x.
The questionnaire provided the researcher the opportunity to formally investigate the
students’ understanding of function after several weeks of instruction. The students provided
their justifications and definitions for the function concept. The students’ responses provide
a brief snapshot of their concept images, and understanding. It is by no means an entire
summary of what they believe to be true about functions.
One should note, however, that the researcher does not believe that the categories are
all inclusive, or that a single category may describe the entire concept image of a student. As
a teacher, we may never “see” the entire concept image of a student for the function concept.
First, concept images are a dynamic representation of the students’ beliefs. Second, the
40
students only evoke parts of the image when considering problem solving approaches and
solutions to problems.
After classifying students’ understanding of the function concept, the researcher
looked to see if there was a difference in the students’ understandings based on the
instruction of the class. To help the researcher find differences in the students’
understandings, we are going to look at the various justifications and how consistent the
students were in applying their definition throughout the questionnaire.

41
CHAPTER 5
ANALYSIS
The results and the findings of the study are presented in this chapter. They describe
the results for the two different groups as well as a comparison between the two groups. The
chapter will start with an overall analysis of the students’ accuracy on the questionnaire. It
will then describe the findings after looking closer at comparing the two groups. The
justifications which the students used will be examined and described. Finally, the
researcher will look at comparing the students’ concept images and concept definitions.
The treatment class spent a period discussing in small groups and answering the
question “what is a function?” From their work, conversations, and whole class discussion
the following definition was reached: “a function is a relation that provides an association
between the domain of a set and the range, and it passes the vertical line test and the x-values
do not repeat.” While this definition does not encompass the mathematical terms found in
textbook definitions, it does a reasonable job of providing a basis for which the students can
determine if a relation is a function. The students’ definition is very concrete; it uses a
testing strategy for part of the definition. However, the vertical line test is useful for the
graphical representation. This means that to employ this definition the students in the
treatment courses are going to have to use multiple representations for determining if a
relation is a function. For example, if given y = )7)(4(3
)2(−+
−xx
x they are going to have to
graph the equation to see if it is a function. However, this technique will only work if the
students are able to produce a graph. In the case of the construction problems, where they
were asked to determine if a function exists that maps integer numbers to non-integer and

42
non-integer numbers to integer numbers. None of the students tried to produce a graphical
interpretation of this problem, they either gave an answer without a justification or the
abstained from answering the question.
Initially, the researcher checked the questionnaires for correct answers. However,
some of the participants were removed; one of the treatment classes, specifically the night
class, had a large percentage of non-traditional students enrolled. The researcher decided to
eliminate these participants also from the sample, as several of these students already had
degrees, and one was a high school mathematics teacher.
Overall Analysis of Accuracy of Responses
The researcher first scored the questionnaires for accuracy and computed the percent
of questions answered correctly in each of the representations. This analysis involved only
right or wrong answers, not justifications. Also, if the students only answered three of the
four questions involving graphs their percentage correct was calculated from the number of
questions answered not the total number of questions. This decision was made due to the
fact that the questionnaires were given during a class period and some students may not have
felt had accurate time to complete the survey as thoroughly as they would have liked. Table
2 shows the percentage of correct answers based on the three representations and separated
by control group and the treatment group. The percentage of correct answers were computed
by looking at each of the participants questionnaires and checking for correct answers and
calculating percentages out of 4 for the graphs and tables, and out of 5 for the equations.
Table 3 shows the percentages and number of students for each of the questions in the survey
and the break down of their scores. The researcher analyzed questionnaire for 22 members
of the control group and 15 members of the treatment group.

43
Table 2
Percentage of Correct Answers Type of Question
Treatment Group (N=15)
Control Group (N=22)
Graphs 70.31% 82.95%
Tables 65.63% 80.68%
Equations 57.81% 50.90%
Totals 64.58% 69.93%

44
Table 3 Break Down by Question of Correct Answers Treatment
Group (N=15) Control Group (N=22)
11 73% 21 95% 4 27% 1 5%
trigonometric function Correct Incorrect Left Blank - - - -
11 73% 16 73% 4 27% 6 27%
rational function with one vertical asymptote
Correct Incorrect Left Blank - - - -
13 87% 21 95% 2 13% 1 5%
circle Correct Incorrect Left Blank - - - -
10 67% 15 68% 5 33% 6 27%
1. Identify function from graph * (#) Numbers in this form are responses of “not sure”, “I don’t know”, or “?”
rational function with two vertical asymptotes
Correct Incorrect Left Blank - - 1 5%
8 53% 17 77% 7 47% 4 18%
Quadratic Function Correct Incorrect Left Blank - - - (1) 5%
12 80% 17 77% 2 13% 5 23%
Rational Function Correct Incorrect Left Blank 1 7% - -
11 73% 17 77% 4 27% 5 23%
Horizontal Line Correct Incorrect Left Blank - - - -
11 73% 20 91% 4 27% 2 9%
2. Identify function from table
Vertical Line Correct Incorrect Left Blank - - - -
5 33% 6 27% 8 53% 12 55%
2yx = Correct Incorrect Left Blank 1 (1) 13% 2 (2) 18%
7 47% 17 77% 6 40% 3 14%
4−= xy Correct Incorrect Left Blank 1 (1) 13% 1 (1) 9%
13 87% 17 77% 1 7% 3 14%
52 += xy Correct Incorrect Left Blank 1 7% 2 9%
10 67% 12 55% 2 13% 5 23%
1243 2 +−= xxy Correct Incorrect Left Blank 2 (1) 20% 3 (2) 23%
2 13% 4 18% 7 47% 6 27%
3. Identify function from an equation
⎩⎨⎧
=01
y Correct Incorrect Left Blank 5 (1) 40% 7 (5) 55%
if x is even if x is odd

45
From the tables and looking at the percentages resulting from this study, there does
not appear to be any significant difference in college algebra students’ ability to determine if
relations are functions in the three representations, when the concept is introduced using
different instructional approaches. The classes with the alternative instruction method
(treatment group) did comparably well when compared to the control group when classifying
functions in their different representations. In fact, the treatment group did slightly better
than the control group with three of questions using the symbolic representation. However,
by examining the separate questions and considering the questions that were left blank; the
two groups appear to have similar notions of the function concept in terms of being able to
identify functions and non-functions.
At an initial glance, the treatment group provided more justification for their answers
and a wider range of definitions. The researcher categorized the justifications by simply
looking to see if the students provided an explanation for their answer and what category this
justification would have fallen into. Also, the treatment group provided a wider variety of
types of definitions in the way that they worded the justifications and the different categories
according to Vinner and Dreyfus (1989).
Digging Deeper in Comparing the Two Groups
Only comparing the treatment and control group with percent correct in each question
does not portray the potential variability that may exist within a group and among the
students. Using the Fathom Software to analyze the data, the researcher created several
graphs and tables. The graph in Figure 4 shows a comparison between the students in the
treatment group and the control group for the total number of questions they each identified
correctly as functions and non-functions (maximum correct of 13—4 graphical, 4 tabular,

46
and 5 symbolic). The vertical lines on the histogram represent the mean (red) and median
(blue). By looking at the graph, one can see that the means for each group are close
together. The treatment group mean is 8.27 correct responses and the mean for the control
group is 9.09 correct answers.
123456
Control
0123456
Treatment
NumberCorrect132 4 6 8 10 12 14
8 6 6
Figure 4: The Total Number of Correct Answers, The red line is the mean, and the blue is the median.
There is an obvious split in the control group’s number of correct responses. This
split could indicate that in the control group the students either had a reasonably accurate
concept image of functions or they did not have a good grasp on the concept. The treatment
group’s responses are more evenly spread across the range of the data set. The number of
students with 9 or more correct answers in the treatment group is 7 or about 47%. The
number of student with 9 or more correct answers in the control group is 12 or about 55%.
The graph suggests that the control group preformed slightly better than the treatment
group on the questionnaire. The students with 9 or more correct answers demonstrated some

47
knowledge of function in all three representations used on the questionnaire. However, the
split in the control group’s responses suggests that the control group students understanding
may have been limited to specific representations for some of the students. This will be
discussed further in a comparison of the concept images and concept definition.
It is interesting to note that all of the students in both groups, who got nine or more of
the questions correct, also got all four graphing questions correct. This accounts for all but
two of the fours in the following figure (Figure 5). In these histograms, the red line indicates
the mean values of correct answers for the two groups. The other two students who also
answered the graphical question correctly, one in the treatment group and one in the control
group, answered 8 of the 13 survey questions on representations accurately.
p
6
12Control
0
6
12Treatment
-1 0 1 2 3 4 5 6TotalGraphScore
Figure 5: Graph Scores By examining the bar graphs in Figure 5, for the students’ number of correct answers
on the graphical questions, we can see that the control group is again split in to two separate
groups. Those that correctly identified all the graphs and those that missed two or more.
Seventy percent of the treatment group and 68% of the control group had correctly identified
all four graphs as functions and non functions. For both groups the two graphs involving
rational functions created the most conflicts in the students’ concept images. For example,
students stated that graphs of rational functions could not be functions because “the line is

48
broken” or “it is not continuous”.
In the treatment group, of the two students who did not answer any of the graphical
questions correctly, one of them had an inaccurate concept image. The justification that this
particular student used was “if the x-axis is crossed more than once, it [the curve] is not a
function.” The other student used the vertical line test as their justification, but it may be that
this student did not understand what the purpose of the vertical line test is or did not
understand the nature of vertical asymptotes.
The histograms in figure 6 show all of the participants’ number of correct answers for
the entire questionnaire and each of the representations. The red color highlights individual
participants who correctly identified function in 9 or more questions and where they fell in
each of the histograms. Using these diagrams, the researcher compared the number of total
correct answers to the number of correct answers in each of the representations. The students
who answered a total of nine or more questions on the survey are highlighted in the other
three graphs, representing the graphical, tabular, and symbolic questions.

49
Figure 6: Comparison of Total Correct Answers Across Representations
Of the students that answered nine or more questions correctly, they identified all four
of the graphs as representing either functions or non-functions (as seen in the graph in the top
right corner). In the control group, these students were able to identify at least three of the
tables as representing functions or not. Most of the students in this group also correctly
identified three or more of the symbolic representations as functions or non-functions. By
examining the distribution of the red color in the control group, it seems that a group of these
students could apply their concept images to the three different representations with some
consistency. However, the other members of the group seem to have demonstrated a lack of
accuracy when applying their concept images.
The treatment group does not clearly show a line of demarcation among its members.
Their number of correct answers has a greater variability throughout the representations, with
the exception of the graphs.

50
Examining Students’ Justifications for Identifying Functions
Treatment Group
Although 15 students were included in the prior analyses, only 12 of these students
provided justifications for their responses. Thus, in this section, only 12 students from the
treatment group were included.
Graphical Representation. Students used a variety of reasons to support their
decision of whether or not a graph represented a function. The graphs were counted as four
different problems for the each of the students, so there were a total of 48 graphs in the
treatment group determined by 12 students to be functions or not. The students used the
vertical line test in 31 of the 48 cases for determining if the graph was a function. This was
by far the most popular justification for the treatment group, and in every case, except for one
student, the students could accurately determine if the curve represented a function. These
students would be difficult to categorize in Vinner and Dreyfus’s (1989) categories, because
implementation of the vertical line test does not mean that the students understand it is a test
for correspondence, or if they think of it as an easy classification method.
One student used continuity as a justification. In the case of the trigonometric
function, he determined the curve to be a function; he also correctly determined the circle to
not be a function on the bases of the vertical line test. However, for the two rational
functions, he incorrectly determined that they were not functions by using a continuity
argument. This person would have a concept image of discontinuity according to Vinner and
Dreyfus (1989). This is also one of the misconceptions found by Tall and Bakar (1991) and
Vinner (1983).
Another student had conflicting answers for the two rational functions. In the first

51
rational function, he correctly applied the vertical line test and concluded that the curve was a
function. However, in the second rational function graph, he stated that it could not be a
function because of the existence of vertical asymptotes. It is clear here that this student has
some confusion between the vertical line test and a vertical asymptote. This student may be
demonstrating the exceptional point category (Vinner and Dreyfus, 1989).
Tabular Representation. The student had a much wider variety of justifications for
this representation than the graphical. For the 48 tables, the most popular justification was
again the vertical line test. However, it was used only 23 times, and five of the tables had
sketches of graphs constructed next to them. The second most widely used justification was
the “x’s don’t repeat”. This justification was used seven times. The seven times that the
students used this justification yielded correct interpretations of the tables; this was not true
for this representation with the vertical line test. It is difficult to tell if the students are using
the uniqueness of x in tables in a correspondence manner or as testing strategy without
further assessment. It is clear though, that some of the students preferred the graphical
representation enough to sketch graphs of the ordered pairs, rather than determine if the
relation is a function from the table.
Symbolic Representation. This representation presented the most difficulty for the
students. Many of the students did not provide justifications. Although, the research saw
many of the students graph these equations on their graphing calculators and presumably
used the vertical line test. Most of the students did not answer the fifth question under this
representation, Figure 7.

52
if x is even if x is odd
⎩⎨⎧
=01
y
Figure 7: Symbolic Representation of a Function
This type of function is novel to the class and was never addressed as part of the course.
Also, the first question switched the order of the variables, i.e. 2yx = . This may have
caused some confusion amongst the students. Regardless, it was included in the analysis.
Control Group
Of the 22 students included in the prior analysis, only 17 provided justifications for why they
chose their answers. Therefore, the following section only includes those 17 students.
Graphical Representation. The control group preformed better than the treatment
group. Their justifications were using the vertical line test, continuity, “no shared x’s”, and
“circles can not be functions”. The vertical line test was the most popular justification. It
was used a total of 58 times on 68 graphs which were in question. Of all these questions, the
vertical line test was used appropriately and achieved the correct classification except in one
instance. The one student, who used the vertical line test incorrectly, did so on the rational
functions. She believed that the curves passed the vertical line test, but sense they had an
exceptional point, “broken”, she stated that the curves were not functions (Vinner and
Dreyfus, 1989).
Tabular Representation. The control group did not use the vertical line test at all for
classifying the tabular questions. Instead, a majority, 46 of 72, justifications were worded
similar to “all x-values are different”. Once again, this does not indicate that the students
understand a correspondence definition or are even thinking about the justification in that
manner. They may just be using a testing strategy similar to the vertical line test which

53
works for tables. None the less, the use of the justification provided a correct answer in cases
in which it was used.
There are some instances of students exhibiting an exceptional point image. A few of
the students say that the second table can not be a function because it has an undefined value
for y at x equals zero. There is also a case of a students using continuity to claim the second
table is not a function. One student used the justification “y repeats” or “y does not repeat”,
for determining if a relation is a function. It seems that this particular student was confused
on the definition of function, but we can not know for sure, without further questioning.
Symbolic Representation. For questions b, c, and d in this section, it appears that the
students graphed these on their calculators and used the vertical line test. The researcher can
not say for certain that this is what happened, as she was not the one to distribute the
questionnaire. But several of the students used the vertical line test as a justification. When
this method was employed, the students answered the question correctly.
Comparison Across Groups
In both groups, we can see that the students used the vertical line test the most often
to determine if curves are functions. When, it comes to the tables, the two groups differ on
their methods for determining if the table represents a function. The symbolic representation
was the most difficult for both groups, in deciding whether the equation represented a
function and in providing a justification. The fact that many of the students in both groups
did not address the construction problems made it impossible to make any generalizations on
this part. In the future, an interview technique would be a good way for bringing their
thinking to light on these kinds of problems. The few that did attempt them did not provide
any justifications for their conclusions.

54
Analysis of Students’ Concept Definitions
Many of the students provided definitions that did not easily fit into one of the
categories proposed by Vinner and Dreyfus (1989). These definitions included: “A function
is a curved line that when it passes through its points can not be touched by a vertical line
more than once.” or “a function passes the vertical line test”. Normally, these types of
definitions would fall into the representation category or a correspondence category, but we
can not know for sure how the students are using the vertical line test without conducting an
interview. Therefore, the researcher assumed there might be a different meaning here that
can not be assigned to one of Vinner and Dreyfus’s (1989) categories for function
definitions. Vinner and Dreyfus’s (1989) categories were modified to include another
category; the definition of function which includes using a testing strategy. The following
table, Table 4, shows the distribution of the types of definitions given by the students in the
two different groups.
Table 4: Percentage of Students in each of the Concept Definition Categories Definition Category Treatment Group
(N=15) n (%)
Control Group (N=22) n (%)
Both Groups (N=37) n (%)
Corresponding 1 (6.67%) 2 (10%) 3 (8.11%) Dependence Relation 0 (0%) 1 (4.50%) 1 (2.70%)
Rule 0 (0%) 0 (0%) 0 (0%) Operation 0 (0%) 0 (0%) 0 (0%) Formula 1 (6.67%) 0 (0%) 1 (2.70%)
Representation 0 (0%) 0 (0%) 0 (0%) Testing Strategy 5 (33.33%) 5 (22.70%) 10 (27.01%)
Do Not Know/No Response 6 (40.00%) 12 (54.5%) 18, (48.65%) Inaccurate Definition 2 (13.33%) 2 (9.10%) 4 (10.81%)
Notice, in the treatment group 6.67% (1 student out of 15) of the students provided a
“correspondence” definition despite the fact that they were not presented a formal definition
55
during classroom instruction. In the control group, 9.10 % or 2 of the 22 students provided a
correspondence definition even though their classes were provided the formal definition as
part of their classroom instruction. Also, there are a larger percentage, over half, of students
in the control group that stated that they did not know a definition for the function concept,
left the questions blank, or provided a wrong definition, than the students in the treatment
group.
The histogram in Figure 8 displays the total number of correct answers on the x-axis
and the different definition categories on the y-axis for all of the participants. The red lines
represent the average number of correct responses in each category. The students that did not
provide a definition on the questionnaire have a lower average of correct answers than any
other category.

56
Def
Cat
1234
C
01234
DR
01234
F
01234
ID
01234
NR
01234
TS
NumberCorrect132 4 6 8 10 12 14 16
Figure 8: Number Correct and Definition Type
As far as looking for misconceptions in the students’ understanding of function, there
does not appear to be any differences in the two groups. All of the students who participated
in the study had most likely already constructed some level of a concept image for the
function concept, since prior mathematics courses were a prerequisite. One of the most
noticeable misconceptions dealt with continuity of curves. In particular, students with this
notion of continuity being necessary did not believe that graphs with vertical asymptotes
were functions; despite the fact, they had just finished a unit on rational functions.
Furthermore, the class examined a variety of functions in the graphical representation that

57
included both continuous curves and discontinuous curves.
For these classes, this implies that regardless of the students’ concept definition or
understanding of the function concept, they can apply testing strategies in the graphical and
tabular representations. However, in the symbolic representation these testing strategies do
not work as fluently unless the students are able to change the representation. The student
either has to change the representation and understand the connections between them, or has
to be familiar with the symbolic notation enough to know if it represents a function or not.
Comparing Students’ Concept Image and Definition
It is important to examine the relationship between students’ concept images and
definitions, because these two “cells” need to be connected in order for the students to have
complete understanding of a mathematical concept such as functions. If the students; do not
form connections between their images and the definition, they may not be aware of
contradicting beliefs within their images. The evoked concept image can provide enough
information for students to answer some questions, but an understanding of the definition
will be needed to answer all questions about a mathematical concept accurately.
For comparing the students concept image to their definitions, the researcher created
eight categories: 1) has concept image they can use to answer some questions but gave no
concept definition; 2) concept image used to answer questions has some inconsistencies with
the definition given; 3) gives correct concept definition but does not seem to have a concept
image useful for answering any of the questions; 4) concept image and concept definition
appear to correspond; 5) not enough evidence for classifying a concept image; 6) gave
inaccurate definition, but have some concept images; 7) evoked concept images has both
correct pieces and incorrect pieces, and 8) image and definition support each other (definition

58
is not a concept definition. For the fifth category, there were students that answered many of
the questions correctly and provided a definition for the function concept, but they did not
justify any of their answers on the questionnaire. Therefore, there is little or no evidence of
what their evoked concept images may look like.
Table 5 shows examples for each of the categories from the control group and the
frequency of participants that fell into each category, except for gives correct concept
definition but does not seem to have a concept image useful for answering any of the
questions; it is unlikely that students at this level of mathematics would fall into this
category. Table 6 shows examples for each of the categories provided from the treatment
group.

59
Table 5 Connections between Concept Images and Definitions Control Group (N=22)
Categories Student Examples Percent of Students 1) Has concept image they can use to answer some questions but gave no concept definition
9002 – image involves continuity, and some testing strategies, no definition 15002 – used testing strategies as justifications, no definition was provided 6001 – student has a concept image that they can apply with accuracy 11 of 13 correct, but gave no definition 3001, 2002, 5002
27.27%
2) Concept image used to answer questions has some inconsistencies with the definition given
5001 – provided a dependence relation definition, and could apply this to most of the questions, conflict with undefined terms.
4.55%
3) Gives correct concept definition but does not seem to have a concept image useful for answering any of the questions
0
4) Concept image and concept definition correspond
6002 -- correctly answered all 13 questions, provided a concept definition 7002 -- correctly answered all 13 questions, provided a concept definition
9.09%
5) Not enough evidence for classifying a concept image
1001 – did not provide any justifications nor a definition 14002 – no justifications provided, 8 of 13 correct, Testing strategy definition provided 11002 – no justifications provided, 5 of 13 correct. No definition given 12002 – provided two justifications “X does not repeat”, no definition provided
18.18%
6) Gave inaccurate definition have some concept image
2001 – correctly answered 11 of 13 questions, did not provide justifications except for VLT on one graph, and the last table. 4002
9.09%
7) Evoked concept image has both correct pieces and incorrect pieces
7001 – correctly applies the VLT, but focuses on repeating or non repeating y values in the tables, no definition given 4001 – correctly applies the VLT but there are problems with graphs that have “breaks” 3002
13.64%
8) Image and Definition support each other, (not a concept definition)
13002 – using testing strategies as justifications, and gives a testing strategy type definition 10002 – using testing strategies as justifications, and gives a testing strategy type definition 1002, 8002
18.18%

60
Table 6 Connections between Concept Images and Definitions Treatment Group (N=15)
Categories Student Examples Percent of Students1) Has concept image they can use to answer some questions but gave no concept definition
8003 – consistently used the VLT to identify functions in the graphical representation, no definition provided 6011 – consistently used the VLT to identify functions in the graphical representation only, not definition given 3003 – used the VLT test for the graphs and tables, did not answer the symbolic questions, no definition given
20%
2) Concept image used to answer questions has some inconsistencies with the definition given
2003 – used testing strategies for answering question, but definition was a formula 5011—could apply the testing strategies to the tables and graphs, had trouble with the equations, provided testing strategy definition
13.33%
3) Gives correct concept definition but does not seem to have a concept image useful for answering any of the questions
0%
4) Concept image and concept definition correspond
5003 – correctly answered questions from every category, had a concept definition, incorrect answers may be a result of not being able to communicate effectively
6.67%
5) Not enough evidence for classifying a concept image
4003 – no justifications, and no definition provided 13011 – justifications do not make sense, and provided and inaccurate definition
13.33%
6) Gave inaccurate definition have some concept image
1003 – could accurately apply the VLT, used discontinuous as justifications for things not being functions, inaccurate definition provided
6.67%
7) Evoked concept image has both correct pieces and incorrect pieces
9003 – could correctly identify function and non function by table, not by graphs, solved some of the equations for x, no definition given 10003 -- could correctly identify function and non function by table, not by graphs, no definition given
13.33%
8) Image and Definition support each other, (not a concept definition)
1011 –successfully applied this definition to the graphical and tabular representations, was not successful with the symbolic representations, testing strategy definition given 7011 – effectively used a testing strategy to answer 10 of 13 questions correctly, a testing strategy definition was given 4011, 3011
26.67%

61
The tables tell us that most of the student have some sort of concept image about the
function concept that they can evoke to answer questions that ask them to identify functions
and non-functions. The tables also show that most of the students are not connecting these
images to concept definitions. Only 33% of the students in the treatment group and 27% of
the students in the control group had formed any connections between their concept images
and definitions.

62
CHAPTER 6
DISCUSSION This chapter will discuss the implications for Mathematics Educations, as well as
questions for further research. Due to the exploratory nature of the study, more questions
arose from the findings than were answered; providing researchers with the opportunity to
explore further.
Implications for Mathematics Education
Using a formal definition for introducing mathematical objects and concepts may not
always be the best educational approach in secondary and early college level mathematics.
While these formal definitions may be unavoidable in higher level college mathematics
classes were alternate approaches are not feasible. For secondary and elementary level
mathematics, there are a variety of alternative methods, such as, using examples and non-
examples to help students build definitions that they can use and make sense to them, using a
variety of different representations to interpret and represent the function concept, arrow
diagrams, tables, algebraic symbolic notation, graphical representations, etc. This implies
teachers do not have to follow the textbook and use formal definitions as the only method for
presenting a concept. They can approach the function topic using a myriad of techniques.
Educators should be aware of the students’ concept images before teaching a concept.
Knowing the students’ concept images would provide a starting point for a lesson. It is
possible that the students do not have an image for a particular concept if it is the first time
they have encountered it. However, the more mathematics class they take the more likely
they will have some previous notion of the concepts. For example, calculus students would
have encountered functions in Algebra I and Algebra II, but they may not have a clear

63
understanding of what a function is. In specific tasks, only part of the students’ concept
image or concept definition may be evoked. Therefore, teachers can not judge a student’s
understanding of any mathematical concept on the basis of one observed behavior (Vinner,
1983).
As an instructor for the course, the researcher noticed that several students used
continuity as part of their justifications. This may be an indication that students are unwilling
to change their previous notions about functions. Instead, they may be adding new
knowledge to their concept images without replacing or removing incorrect images. An
example of the students’ apparent unwillingness to alter their concept images and remove
faulty information was noticed when students presented justifications and definitions stating
that functions needed to be “continuous”. Continuity of graphs was beyond the scope of the
class and whether or not a curve was continuous was not discussed in class.
The teacher should address the students’ concept images if there are distorted images.
As found in this study and others (Vinner, 1983), students will hold on to their concept
images despite conflicting information. Instruction that specifically addresses the inaccurate
concept images may help the students be more willing to let go of their previous images, and
replace them with accurate and non-conflicting images. It is clear that giving the students a
definition and some examples is not satisfactory for the students to form advantageous
concept images (Vinner, 1983). By encouraging students to address their own
misconceptions, teachers help students learn that they can change their concept images and
definitions as they move through a course or the mathematics curriculum. The need to
change concept images and concept definitions is not limited to the function concept. For
example, students may take several years of mathematics believing that the square root of a
64
negative number does not exist. Eventually, the students will have to adjust their concept
image for roots when they are introduced to complex numbers.
Questions for Further Research
In this study, it is difficult to tell if the instructional variation created different
concept image structures or concept definition in the students from the two groups. To gain a
clearer picture, one would need to observe both instructors on multiple days to look for
variations in the teaching styles and methods. The influence of the instructor was not
considered in this study. The instructor of the treatment groups had eight years of experience
teaching, including four years in the public school systems. The instructor of the control
group has one year of teaching experience at the college level. The difference in experience
levels would influence the classroom instruction.
The students previously had formed concept images and possibly “concept
definitions” about functions, from prior experiences and mathematics classes. In some cases,
the students were unwilling to reconstruct their concept images regardless of the new
information. For example, several students were deciding if a graph was a function, based on
continuity, but continuity was not a topic discussed in the course. It is interesting to ask,
“What would happen if the function concept was first introduced with out a formal definition
in a high school or middle school Algebra I class?” We could then follow the students
through their higher level mathematics and study their misconceptions and concept images.
Would the researcher get different results?
Another topic for research is to look at how definitions are used in the mathematics
classroom where proofs are not explicitly a part of the curriculum. How can we recreate the
algebra classroom to use the definitions in a more concise and mathematical way in order to

65
provide students the opportunity to use and learn these formal definitions?
Now that technology, at least the graphing calculators, is in most classrooms, it would
be note worthy to start looking at the misconceptions that technology has fostered. Do
students loose understanding when they compare functions with shifts rather than drawing
the function themselves? Are the misconceptions about the function concept changing or are
they staying the same even with the use of technology? Does the way technology is
implemented in the classroom affect or change the students’ misconceptions?
How the findings relate to those of other researchers?
The students in this study held similar misconceptions about the function concept that
students in previous studies did (Brenner, et al., 1997; DeMarois, 1996; Dreyfus and
Eisenberg, 1982; Eisenberg, and Dreyfus, 1994; Gagatsis et al., 2006; Tall and Bakar, 1991;
Vinner and Dreyfus, 1989 ). In fact, there has been little change in the types of
misconceptions about functions held by students in the last 20 years. Students are still not
gaining a good understanding of the function concept. However, pre-service teachers may
also hold some of the same misconceptions (Breidenbach et al., 1992)
The students in this study preferred graphical representations over the symbolic
representations. They worked more comfortably with this particular representation in
answering and justifying if the curve represented was a function. This may be a result of the
fact that the instructors of the course privileged graphical representations more than the
others and that the course had a focus on using multiple representations and fluency between
them. In the classroom and on other assignments, such as homework, the students also tend
toward this same representation to help them interpret problems and even to solve them.
Mousoulides & Gagatsis (2004) found that students with a strong graphical approach to

66
functions were more effective in solving complex geometric problems than their counterparts
which relied on the algebraic representations. Since, the students in this study preferred the
graphical representation; it would have been interesting to look at their problem solving
strategies as well.
Students in this study were better at determining if a relation was function than
providing an accurate definition. Gagatsis et al. (2006) had similar findings. In their study,
they found that 60.6% of students could provide a mathematically correct definition for
function, but 74.6% could provide an example (p. 140). These findings suggest that students
do not need to have complete understanding of a concept in order to work at an operational
conception (Sfard, 1991). This ability to produce examples without understanding a formal
definition also reinforces Vinner and Dreyfus’s research (1989).
Hitt’s (1998) research focused on in service teachers and their understanding of the
function concept. He found that teachers do not use their concept definitions when
answering questions about functions. He asked thirty teachers to determine if the graph in
Figure 9 was a function. While 29 of the teachers correctly stated that the graph did not
represent a function, their reasoning varied:
• Two teachers used a definition of ordered pairs • Ten wrote that there was more than one image in certain points • Six teachers explicitly used a vertical line cutting the curve in more that point • Eleven teachers said that it was not a function without giving a reason (Hitt, 1998, p.
127).

67
Figure 9: Concept Images of Functions (Hitt, 1998, p. 126)
Notice that the teachers are using evoked concept images to answer and justify their answers,
and only two of the teachers used a definition of function as a justification. It is not
unexpected then, that teachers present a formal definition in the classroom, but they
encourage students to use concept images as a strategy for answering questions. While,
teachers in Hitt’s (1998) study evoked correct concept images for this question that was not
the case throughout his entire study. For example, when the teachers were presented with
conic sections with principal axis on the x-axis (see Figure 10), teachers abandoned their
previous definitions for functions in favor of an algebraic expression (Hitt, 1998). Since,
students frequently make the same connections between an algebraic expression and a
function, misconceptions about functions teachers hold should be addressed so they do not
pass them on to their students.
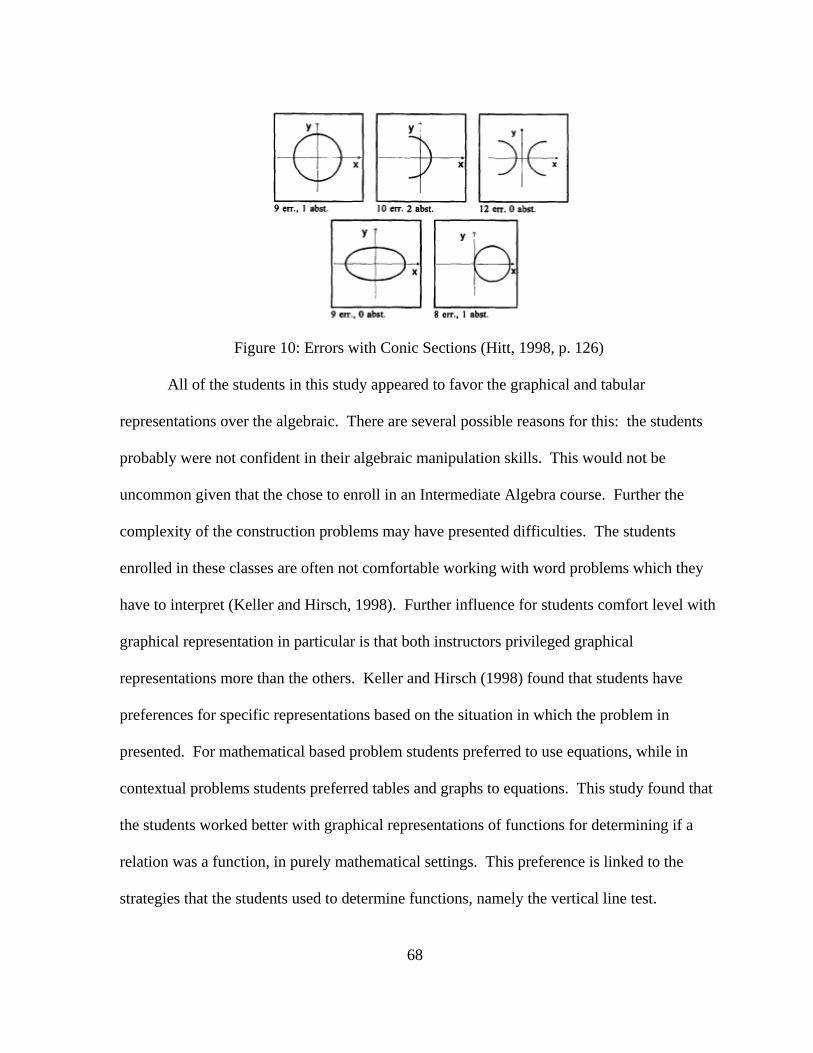
68
Figure 10: Errors with Conic Sections (Hitt, 1998, p. 126)
All of the students in this study appeared to favor the graphical and tabular
representations over the algebraic. There are several possible reasons for this: the students
probably were not confident in their algebraic manipulation skills. This would not be
uncommon given that the chose to enroll in an Intermediate Algebra course. Further the
complexity of the construction problems may have presented difficulties. The students
enrolled in these classes are often not comfortable working with word problems which they
have to interpret (Keller and Hirsch, 1998). Further influence for students comfort level with
graphical representation in particular is that both instructors privileged graphical
representations more than the others. Keller and Hirsch (1998) found that students have
preferences for specific representations based on the situation in which the problem in
presented. For mathematical based problem students preferred to use equations, while in
contextual problems students preferred tables and graphs to equations. This study found that
the students worked better with graphical representations of functions for determining if a
relation was a function, in purely mathematical settings. This preference is linked to the
strategies that the students used to determine functions, namely the vertical line test.

69
It is worth noting that the instructor of the treatment courses taught the class, she was
aware of those misconceptions and worked to help the students overcome them. In the end,
after six chapters on different types of functions, the students still possessed many of the
misconceptions that they had at the beginning. The students just added images and meaning
to their concept image to encompass what they learned in the course. Further, the research
conducted in this study indicates that misconceptions of the function concept are not being
addressed in the mathematics curriculum. The Vinner and Dreyfus (1989) study is still a
good model and framework for categorizing students’ understanding seventeen years later.
This indicates that regardless of the reform movements discussed in mathematics education
circles, they are slow in implementation.
70
REFERENCES
Bello, I. (1998). Intermediate algebra: A graphing approach. Tampa, FL: Brooks/Cole Publishing Company.
Bittinger, M., & Ellenbogen, D. (1998). Intermediate algebra: Concepts and applications
(5th ed.). Reading, MA: Addison-Wesley. Bowman, A. (1993). A theoretical framework for research in algebra: modifications of
Janvier’s “star” model of function understanding. Paper presented at AERA, Atlanta GA, April 12, 1993.
Breidenbach, D., Dubinsky, E., Hawks, J., & Nichols, D. (1992). Development of the
process conception of function. Educational Studies in Mathematics, 23, 247-285. Brenner, M., Mayer, R., Moseley, B., Brar, T., Durna, R., Reed, B., & Webb, D. (1997).
Learning by understanding: The role of multiply representations in learning algebra. American Educational Research Journal, 34(4), 663-689.
Cates, J. (2002). Understanding algebra through graphing calculators. Learning and Leading
with Technology, 30(2), 33-35. Chazan, D., & Yerushalmy, M. (2003). On appreciating the cognitive complexity of school
algebra: Research on algebra learning and directions of curricular change. In J. Kilpatrick, Martin, W., & Schifter, D. (Ed.), A research companion to principles and standards for school mathematics (pp. 123-135). Reston, VA: National Council of Teachers of Mathematics.
DeMarois, P. (1996). Beginning algebra students' images of the function concept. Paper
presented at The 22nd Annual AMATYC Conference, Long Beach, CA. DeMarois, P. (1997). Function as a core concept in developmental mathematics: a research
report. ERIC record, ED415940. Doyle, W. (1986). Using an advanced organizer to establish a subsuming function concept
for facilitating achievement in remedial college mathematics. American Educational Research Journal, 23 (3), 507-516.
Dreyfus, T. & Eisenberg, T. (1982). Intuitive functional concepts: A baseline study on
intuitions. Journal for Research in Mathematics Education, 13(5), 330-380. Edwards, B. & Ward, M. (2004). Surprises from mathematics education research: Student
(mis)use of mathematical definitions. American Mathematical Monthly, 111(5), 3-20.

71
Eisenberg, T. (1991). Functions and associated learning difficulties. In D. Tall (Ed.), Advanced Mathematical Thinking (pp. 140-152). Dordrecht, The Netherlands: Kluwer Academic Publishers.
Eisenberg, T., & Dreyfus, T. (1994). On understanding how students learn to visualize
function transformations. In E. Dubinsky, Schoenfeld, A., & Kaput, J. (Ed.), Research in collegiate mathematics education 1 (Vol. 4, pp. 45-68). Providence, RI: American Mathematical Society.
Even, R., & Tirosh, D. (1995). Subject-matter knowledge and knowledge about students as
sources of teacher presentations of the subject matter. Educational Studies in Mathematics, 29(1), 1-20.
Erbas, A. K., Ledford, S., Polly, D., & Orrill, C. (2004). Engaging students through
technology. Mathematics Teaching in the Middle School, 9(6), 300-305. Fey, J. (1989). School algebra for the year 2000. In S. Wagner, & Kieran, C. (Ed.), Research
issues in the learning and teaching of algebra (pp. 199-213). Hillsdale, NJ: Lawrence Erlbaum Associates.
French, D. (2002). Chapter 6: Functions and graphs. In Teaching and learning algebra (pp.
81-98). London: Continuum. Friedlander, A., & Tabach, M. (2001). Promoting multiple representations in algebra. In A.
Cuoco (Ed.), The role of representations in school mathematics (pp. 173-185). Reston, VA: National Council of Teachers of Mathematics.
Gagatsis, A., Elia, I., Panaoura, A., Gravvani, K., & Spyrou, P. (2006). An empirical four-
dimensional model for the understanding of functions. Proceedings 30th Conference of the International Group for the Psychology of Mathematical Education, 3, 137-144.
Hall, J. (1994). Algebra for college students (2nd ed.). Boston: PWS Publishing. Hall, J., & Mercer, B. (2007). Intermediate algebra: The language and symbolism of
mathematics. Boston: McGraw Hill. Hitt, F. (1998). Difficulties in the articulation of different representations linked to the
concept of function. Journal of Mathematical Behavior, 17(1), 123-134. Janvier, C. (1987). Representation and understanding: The notion of function as an example.
In C. Janvier (Ed.), Problems of representation in the teaching and learning of mathematics (pp. 67-71). Hillsdale, NJ: Lawrence Erlbaum Associates.
Jones, M. (2006). Demystifying functions: The historical and pedagogical difficulties of the
concept of the function. Rose-Hulman Undergraduate Math Journal, 7(2), 1-20.

72
Kime, L., & Clark, J. (2001). Explorations in college algebra (2nd ed.). New York: John Wiley & Sons.
Kaput, J. (1987). Representation systems and mathematics. In C. Janvier (Ed.), Problems of
representation in the teaching and learning of mathematics (pp. 19-26). Hillsdale, NJ: Lawrence Erlbaum Associates.
Kaput, J. (1992). Technology and mathematics education. In D. Grouws (Ed.), Handbook of
research on mathematics teaching and learning (pp. 515-556). New York: Macmillan.
Keller, B., & Hirsch, C. (1998). Student preference for representations of functions.
International Journal of Mathematical Education in Science and Technology 29 (1), 1-17.
Lloyd, G. M. & Wilson, M. (1998). Supporting innovation: The impact of a teacher’s
conceptions of functions on his implementation of a reform curriculum. Journal for Research in Mathematics Education, 29(3), 248-274.
Moschkovich, J., Schoenfeld, A., & Arcavi, A. (1993). Aspects of understanding: On
multiple perspectives and representations of linear relations and connections among them. In T. Romberg, Fennema, E., & Carpenter, T. (Ed.), Integrating research on the graphical representations of function (pp. 69-100). Hillsdale, NJ: Lawrence Erlbaum Associates.
Mousoulides, N. & Gagatsis, A., (2004). Algebraic and geometric approach in function
problem solving. . Proceedings 28th Conference of the International Group for the Psychology of Mathematical Education, 3, 385-392.
National Council of Teachers of Mathematics (2000). Principles Standards for School
Mathematics. Reston, VA: Author. O'Callaghan. (1998). Computer-intensive algebra and students' conceptual knowledge of
functions. Journal for Research in Mathematic Education, 29(1), 21-40. Patterson, N. (2002). A case study of an experienced vs. novice teacher in the
implementation of a new intermediate algebra curriculum. Unpublished doctoral dissertation, North Carolina State University, Raleigh, NC.
Sfard, A. (1991). On the dual nature of mathematical conceptions: Reflections on processes
and objects as different sides of the same coin. Educational Studies in Mathematics, 22, 1-36.
Slavit, D. (1997). An alternative route to the reification of function. Educational Studies in
Mathematics, 33, 259-281.

73
Tall, D. (1992). The transition to advanced mathematical thinking: functions, limits, infinity. In D. Grouws (Ed.), Handbook of Research on Mathematics Teaching and Learning (pp. 495-514). New York: Macmillan Publishing Company.
Tall, D. & Bakar, M. (1991). Students’ mental prototypes for function and graphs.
Proceedings 15th Conference of the International Group for the Psychology of Mathematical Education, 1, 104-111.
Tall, D., & Bakar, M. (1992). Students' mental prototypes for functions and graphs.
International Journal of Mathematical Education in Science and Technology, 23(1), 39-50.
Thompson, P. (1994). Students, functions, and the undergraduate curriculum. In E.
Dubinsky, Schoenfeld, A., & Kaput, J. (Ed.), Research in collegiate mathematics education 1 (Vol. 4, pp. 21-44). Providence, RI: American Mathematical Society.
tree. (n.d.). Dictionary.com Unabridged (v 1.1). Retrieved February 28, 2007, from
Dictionary.com website: http://dictionary.reference.com/browse/tree Vinner, S. & Dreyfus, T. (1989). Images and definitions for the concept of function. Journal
for Research in Mathematics Education, 20(4), 356-366. Vinner, S. (1983). Concept definition, concept image, and the notion of function.
International Journal of Mathematics Education in Science and Technology, 14(3), 293-305.
Vinner, S. (1991). The role of definitions in the teaching and learning of mathematics. In D.
Tall (Ed.), Advanced Mathematical Thinking (pp. 65-81). Dordrecht, The Netherlands: Kluwer Academic Publishers.
Williams, C. (1998). Using concept maps to assess conceptual knowledge of function.
Journal for Research in Mathematics Education 29 (4), 414-421.

74
APPENDICES

75
Appendix A
Dreyfus & Eisenberg, 1982, p. 368

76
Appendix B

77

78
Appendix C

79

80

81

82
Appendix D

83
Appendix E 1. Do the following graphs represent functions? Justify your answer.
-6.28319 -3.14159 3.14159 6.28319
-4
-3
-2
-1
1
2
3
4
-10 -8 -6 -4 -2 2 4 6 8 10
-10
-8
-6
-4
-2
2
4
6
8
10
-5 -4 -3 -2 -1 1 2 3 4 5
-5
-4
-3
-2
-1
1
2
3
4
5
-10 -8 -6 -4 -2 2 4 6 8 10
-10
-8
-6
-4
-2
2
4
6
8
10
2. Do the following tables represent functions? Justify your answers.
x y1(x)-5-4-3-2-10123456789
5642302012620026
12203042
x y1(x)-5-4-3-2-10123456789
1.81.75
1.666671.5
1undef
32.5
2.333332.252.2
2.166672.14286
2.1252.11111

84
3. Determine if the following equations represent functions, Justify your answers. a. 2yx = b. 4−= xy c. y = 2x + 5 d. 1243 2 +−= xxy e. { 1 if x is even y = { 0 if x is odd 4. Is there a function that maps every number different from zero to its square and maps 0 to 1? Explain 5. Is there a function that maps integer numbers to non-integer and non-integer numbers to integer numbers? Explain 6. Is there a function that maps the temperature in degrees Fahrenheit to the temperature in degrees Celsius? Explain 7. What is the definition for a function?