ABSTRACT: Keywords: IJSER · on soft soil, such as the use of lightweight backfill materials,...
8
International Journal of Scientific & Engineering Research, Volume 7, Issue 6, June-2016 370 ISSN 2229-5518 IJSER © 2016 http://www.ijser.org Numerical analysis of a piled foundation reinforced with geosynthetics to support construction of full-height bridge abutments PHAM Anh Tuan University of Science and Technology-The University of Danang, Vietnam. E-mail: [email protected] DO Huu Dao University of Science and Technology-The University of Danang, Vietnam. E-mail: [email protected]. ABSTRACT: The scope of this paper is the analysis of full-height embankment behind abutment on geosynthetic reinforced pile supported (GRPS), with a commercially available finite element software. The analyses of fourteen cases of GRPS system supported under embankment and two untreated foundations are presented in this paper. The factors considered include the construction time, pile center to center spacing, region and length of piles DM (Deep-Mixing). The result presented in this paper include the vertical and horizontal displacement, the maximum and differential settlement, the longitudinal gradient change, and the distribution of stresses consist normal and shear stress in different zones, displacement contour and stress concentration factor for all cases, since they are the most critical parameters of observation and design. The results of this study are intended to provide some guidelines for designers, and to bring insight about the interacting mechanisms into the design process. Keywords: Numerical analysis; piled bridge abutment; displacement; settlement; distribution of stresses —————————— —————————— 1. INTRODUCTION Increased traffic volume and infrastructural development has made it necessary to construct highways, motorways, or expanding roads. However, a lot of works that are built on soft soil with full-height embankment, and one of good examples for this mainly is construction of full-height bridge abutment. The design piled bridge abutments on soft soil is a topic challenging for geotechnical engineers due to the low strength, high compressibility, permeability of the soft clayer. The consolidation of of the soft clay due to the surcharge loads and accompanying of exstrution of soil between the piles, causes lateral pile deflections and bending moments. In some cases, serviceability limit states are exceeded and structural damaged is observed. Fig.1 show typical failures of bridge abutment. Different techniques (Fig.2) have been used in practice to avoid, minimize, or remedy distresses to support for construction of full-height bridge abutment on soft soil, such as the use of lightweight backfill materials, geosynthetic reinforcement, over-excavation and replacement, installation of piles or foundation columns, pre-loading, and a combination of the above alternatives. Foundation columns include but are not limited to deep-mixed column, vibro concrete columns, stone columns, and aggregate piers, etc., which are the focus of this study. Forsman and Uotinen (1999) investigated the effect of geosynthetic reinforcement on the settlement and horizontal displacements of embankment. Han and Akins (1999) reported the use of vibro-concrete columns with geogrid layers above to support widening embankment. Geosynthetic reinforcement may not be needed if the spacing of the columns is close and/or the height of embankment is large. Syawal Satibi investigated the effect of supporting embankment by using stone columns. Besides, previous studies of piled bridge abutments on soft clays include centrifuge tests, analytical and numerical models, and field observation, mostly on the mobilisation of passive lateral loading in the soft clay like as De Bear and Wallays, Tschebotarioff, Polous, Oteo. Although, almost these study mainly focus on considering behaviour of abutment in low and unreinforced embankment cases. But, Kelesoglu and Cinicioglu calculated soil stiffness degradation using free-field instrumentation data and confirrmed that construction of an embankment prior to the pile installation would significantly reduce the lateral thrust exerted toward the piles. Even though construction of full-height bridge abutment on soft soil has been commonly adopted in practical, so far, very limited guidance for design is available for bridge abutment projects. The objective of this study is to investigate the effects of installing Geosynthetic Reinforce Pile Support (GRPS) in the soil beneath embankment with using (Deep Mixing- DM) piles. A 2D finite difference method, incorporated in fast Lagrangian analysis continue (PLAXIS) was adopted in this study through numerical analysis. IJSER
-
Upload
trinhduong -
Category
Documents
-
view
216 -
download
0
Transcript of ABSTRACT: Keywords: IJSER · on soft soil, such as the use of lightweight backfill materials,...

International Journal of Scientific & Engineering Research, Volume 7, Issue 6, June-2016 370 ISSN 2229-5518
IJSER © 2016 http://www.ijser.org
Numerical analysis of a piled foundation reinforced with geosynthetics to support
construction of full-height bridge abutments
PHAM Anh Tuan
University of Science and Technology-The University of Danang, Vietnam. E-mail: [email protected]
DO Huu Dao University of Science and Technology-The University of Danang, Vietnam. E-mail: [email protected].
ABSTRACT: The scope of this paper is the analysis of full-height embankment behind abutment on geosynthetic reinforced pile supported (GRPS), with a commercially available finite element software. The analyses of fourteen cases of GRPS system supported under embankment and two untreated foundations are presented in this paper. The factors considered include the construction time, pile center to center spacing, region and length of piles DM (Deep-Mixing). The result presented in this paper include the vertical and horizontal displacement, the maximum and differential settlement, the longitudinal gradient change, and the distribution of stresses consist normal and shear stress in different zones, displacement contour and stress concentration factor for all cases, since they are the most critical parameters of observation and design. The results of this study are intended to provide some guidelines for designers, and to bring insight about the interacting mechanisms into the design process.
Keywords: Numerical analysis; piled bridge abutment; displacement; settlement; distribution of stresses
—————————— —————————— 1. INTRODUCTION Increased traffic volume and infrastructural development has made it necessary to construct highways, motorways, or expanding roads. However, a lot of works that are built on soft soil with full-height embankment, and one of good examples for this mainly is construction of full-height bridge abutment. The design piled bridge abutments on soft soil is a topic challenging for geotechnical engineers due to the low strength, high compressibility, permeability of the soft clayer. The consolidation of of the soft clay due to the surcharge loads and accompanying of exstrution of soil between the piles, causes lateral pile deflections and bending moments. In some cases, serviceability limit states are exceeded and structural damaged is observed. Fig.1 show typical failures of bridge abutment.
Different techniques (Fig.2) have been used in practice to avoid, minimize, or remedy distresses to support for construction of full-height bridge abutment on soft soil, such as the use of lightweight backfill materials, geosynthetic reinforcement, over-excavation and replacement, installation of piles or foundation columns, pre-loading, and a combination of the above alternatives. Foundation columns include but are not limited to deep-mixed column, vibro concrete columns, stone columns, and aggregate piers, etc., which are the focus of this study. Forsman and Uotinen (1999) investigated the effect of geosynthetic reinforcement on the settlement and horizontal displacements of
embankment. Han and Akins (1999) reported the use of vibro-concrete columns with geogrid layers above to support widening embankment. Geosynthetic reinforcement may not be needed if the spacing of the columns is close and/or the height of embankment is large. Syawal Satibi investigated the effect of supporting embankment by using stone columns.
Besides, previous studies of piled bridge abutments on soft clays include centrifuge tests, analytical and numerical models, and field observation, mostly on the mobilisation of passive lateral loading in the soft clay like as De Bear and Wallays, Tschebotarioff, Polous, Oteo. Although, almost these study mainly focus on considering behaviour of abutment in low and unreinforced embankment cases. But, Kelesoglu and Cinicioglu calculated soil stiffness degradation using free-field instrumentation data and confirrmed that construction of an embankment prior to the pile installation would significantly reduce the lateral thrust exerted toward the piles.
Even though construction of full-height bridge abutment on soft soil has been commonly adopted in practical, so far, very limited guidance for design is available for bridge abutment projects. The objective of this study is to investigate the effects of installing Geosynthetic Reinforce Pile Support (GRPS) in the soil beneath embankment with using (Deep Mixing- DM) piles. A 2D finite difference method, incorporated in fast Lagrangian analysis continue (PLAXIS) was adopted in this study through numerical analysis.
IJSER

International Journal of Scientific & Engineering Research, Volume 7, Issue 6, June-2016 371 ISSN 2229-5518
IJSER © 2016 http://www.ijser.org
Figure 1. Some failure modes of bridge abutment
Geosyntheticreinforcement
sheetpile
Geosyntheticreinforcement
Pile
Figure 2. Remedying techniques used in supporting full-height bridge abutment
2. PROJECT DESCRIPTION
2.1 Analytical and Numerical modelling
A geotechnical software by finite element method, (PLAXIS) was adopted in this study for numerical analysis. The cross-section, boundary conditions, and dimensions for the numerical model used for this parametic study are presented in Figure 3.
The piles were used in solution GRPS is DM piles (Deep Mixing). They were modelled as wall in the plane condition. The properties of the soil, the DM piles, the geosynthetic layers are provided in table 1. Most there figures were refereed and cited from geological data of Tran Thi Ly Bridge project in Danang city (Join-stock company CPU), and several data of Forsman et.al, Ellis and Springman (2011). To ensure the reasonabless of the numerical model to be used for the parametric study, two 3D cases study was modelled as described below for the calibration of this numerical model. The embedded pile model in Plaxis
3D Foundation, in which piles in considered as beam elements, is used to define the structural properties of the pile group (hình 3b). An equipvalent value of soil ground around the pile is assumed to behave elastically and plastically to exclude within that volume so that piles can be considered to be modelled by approciate volume. The soil-pile interaction is modelled by interface elements both along the pile shaft and at the base. Thus, the relative movements are considered in the analyses in the using the lateral displacements between the beam elements nodes and soil nodes.
Skin friction and base resistance of the piles are calculated by the Coyle and Castelo method, which is based on large scale field load test of driven piles in sand. This is a potential source for calibration of numerical results. The moments of inertia for the pile, pile cap and abutment wall are 0.073, 0.0833, 0.0213 m4, respectively. Using the young modulus of the structural materials as 70 GN/m2. The flexiable stiffness is calculated as 5.11, 5.83, and 1.49 GNm2 for the pile, pile cap and abutment wall.
a) Cross section, boundary conditions of numerical model
Cap pile
coïc
8.0
6.0-
10.0
10.0
-14.
01.
0
Vertical drain
Abutmentwall
frontpile
Water level
30.0
soft clay
Stiffersubstratum
Embankment
Sand filter
rearpile
15.0
All dimensions atmodel in metres
b) Plan view of the pile and wall
Abutment wall1.27 0.635
2.0
2.5
2.0
2.5
3.1 6.7 6.7 3.1
Pile cap
c) Numerical model in FE software
Figure 3. Schematic presentation of geometry and boundary conditions in numerical modelling
a b
c
IJSER

International Journal of Scientific & Engineering Research, Volume 7, Issue 6, June-2016 372 ISSN 2229-5518
IJSER © 2016 http://www.ijser.org
Table 1. Material properties used in the numerical analysis γ(kN/m3) kx, kz , ky (m/s) Cc Cs Cα E0(Mpa) einit c' (kPa) φ' (o) ψ (o) υ Soft Clay 17.5 1.16x10⁻⁵ 0.43 0.07 0.006 2.85 0.82 4.3 5.26 0.0 0.4 Substratum 19.5 1.13x10⁻⁶ - - - 22.23 0.67 32.2 26.3 5.0 0.3 Embankment 18.0 2.42x10⁻⁵ - - - 32.0 0.50 25.0 26.8 5.0 0.3 Sand filter 20.0 1.63x10⁻⁴ - - - 35.5 0.52 5.0 30.0 5.0 0.3 DM pile 22.3 - - - - E= 400 - 80 25 - 0.25 Geosynthetic: J=EA =1700kN/m; k=85000kN/m/m; Rinter = 0.8 Note: E0 - Strain modulus; E - Elastic modulus; υ - Poisson's ratio; γ - Unit weight; c' - effective cohesion; φ' - effective friction angle; ψ - dilatancy angle; J - tensile stiffness of geotextile; k - interface shear stiffness between sand and geotextile
The soft clay layer were modelled using both Hardening Soil (HS) and the Soft Soil Creep. Ellis provided the parameters such as Cα, Cc and ψ for both models as in table 1. A Cα/Cc ratio was defined as between 0.012 and 0.015, where Cc, Cα are the primary and secondary indices.
deckAbutment
wallPile cap
Pile
soilmovement
(ii)shear stress
(iii)Passive pressure
(i)Lateral stress acting onthe wall as an equipvalenthorizontal force
Embankment
Soft clay layer
Stiff substratum
Figure 4. Lateral loads acting on the piled abutment wall
The effects of soft clayer thickness and the rate of embankment construction on the soil-structure interaction, and on the resulting lateral structural loading and dispalcements. The crucial importance for full-height abutment of (i) the shear stress transfer onto the pile cap at tge embankment soft layer interface and (ii) the arching of the embankment loads to the retaining structure were identified and lateral loads that are acting on deforming piled bridge abutment were described (Figure 4).
2.2 Study cases for practical project
The selected project is a full-height embankment behind bridge abutment constructed on deep mixing (DM) piles and reinforced with geosynthetic beside Han River and Tran Thi Ly Bridge in Danang city, Vietnam. The soft foundation below embankment consists 6-10m of soft clay and 10-14m of stiffer substratum. The length of piles is 17m and the diameter of DM piles is 1m. The properties of materials are presented in table 1. The height of embankment behind bridge abutment is 7m and the longitudinal gradient along embankment is 2%. The determined Poisson's ratio under conditions is 0,3-0,4. The embankment has a 50mm thick asphalt layer, 200mm thick crushed stone base course and 1m thick
sand working platform above the existing ground. The surchage load of vehicles is 16,7kN/m2.
The cross section, boundary conditions and dimensions for the numerical model used for this parametric study are presented in Fig.5. The piles were modeled as wall in the plane conditions. The diameter of the abutment walls used in this analysis is 0.635m.
Embankment behind bridge abutment is divided into three zones (AB, BC and CD) as in Fig.5. The width of zones is 10m along embanlment. The length and pile spacing of each zone depend on loads condition and the interaction between embankment and abutment. Zone AB will be installed with pile spacing s1 and pile length L1; Zone BC will be installed with pile spacing s2 and pile length L2; Zone CD will be installed with pile spacing s3 and pile length L3.
Cap pile
coïc
8.0
8.0
12.0
1.0
frontpile
Water level
30.0
soft clay
Stiffersubstratum
Sand filter
15.0
All dimensions atmodel in metres
i=2%
Zone CD Zone BC Zone AB
Cap pile
rearpile
AbutmentwallEmbankment
Figure 5. Model for the numerical analysis of project
All cases that is widen to study and analyse overall for full-height bridge abutment by using GRPS solution are presented in Fig.6.
The options of treatment for the foundation soil include no treatment, installing system GRPS under embankment with only a DM pile length but the pile spacing is changed from 1.5D to 3D and installing system GRPS under embankment that have shifted DM pile length in three different zones (8m in zone CD, 10m in zone BC and 12m in zone AB) and the pile spacing is changed from 1.5D to 3D. In the case 3, pile spacing and length of pile that will altered together for the different zones. The result presented in this paper include the vertical and horizontal displacement, the maximum and differential settlement, the longitudinal gradient change, and the distribution of stresses.
IJSER

International Journal of Scientific & Engineering Research, Volume 7, Issue 6, June-2016 373 ISSN 2229-5518
IJSER © 2016 http://www.ijser.org
Figure 6. Parameters used in all the analysed cases 3. ANALYSIS OF RESULTS
3.1. Vertical and horizontal displacement contour Vertical and horizontal displacement contour for the embankment are presented in Fig.7 and Fig.8 for four typical cases. It is shown that the maximum settlement develops on the crest of the embankment due to the traffic loading, the compression of the embankment fill. Fig.7 shows that the differential and maximm settlements have decreased from case 1b (no DM pile) by 78% in case 2b, 54% in case 3b and 65% in case 3e. In addition to, the location of maximum displacement and strain contour is shifted toward installing models of DM piles. In case 1b, the location of maximum settlement has established away from abutment ≈ 12m ( 2sh≅ ). In case 2b, this location moved toward abutment with smaller value, whereas this was toward away abutment in case 3b and case 3e.
Fig.8 shows horizontal displacement contour, and is is shown that the location of mobilisation appeared at
the edge of pile cap and real pile. Therefore, the real pile endured a greater lateral pressure from embankment than front pile). So it is necessarily to consider to design of real pile that has higher strength than front pile to avoid shear and bending failures. As can be seen in Fig. 8 that in the cases has installing of DM piles (2b,3b,3e), the horizontal displacement contour was narrower approximately 63% on both area and value than case 1b( no DM pile). However, the difference between these cases include (2b,3b,3e) is insignificantly with only ≤ 15%. Clearly, the use of the DM piles not only reduces the maximum settlement but also pushes the location of the maximum settlement towards away abutment. In other words, the soft soil under the embankment plays an important role in the maximum settlement, but the length of DM piles less influence to the location of the maximum settlement.
The reason for this is because stiffness of soft soil impact to arching effect. It is obviously that lateral loading due to arching must be considered, in order to perform a realistic design for this problem.
Figure 7. Vertical displacement contour of four typical cases
Pattern Case Treatment Pile spacing (m) Pile length (m) AB, s1 BC, s2 CD, s3 AB, L1 BC, L2 CD, L3
Cap pile
coïc
i=2%
ZoneCD
Cap pileZoneBC
ZoneAB
1a
1b
No treatment
Geotextile
- -
- -
- -
- -
- -
- -
i=2%
2a 2b 2c 2d 2e 2f 2g
Installing GRPS system beneath
embankment, with same pile length
1.5D 2D
2.5D 3D 2D 2D
2.5D
1.5D 2D
2.5D 3D
2.5D 3D 3D
1.5D 2D
2.5D 3D 3D 3D 3D
10m 10m 10m 10m 10m 10m 10m
10m 10m 10m 10m 10m 10m 10m
10m 10m 10m 10m 10m 10m 10m
i=2%
3a 3b 3c 3d 3e 3f 3g
Installing GRPS system beneath
embankment, with different pile
length
1.5D 2D
2.5D 3D 2D 2D
2.5D
1.5D 2D
2.5D 3D
2.5D 3D 3D
1.5D 2D
2.5D 3D 3D 3D 3D
12m 12m 12m 12m 12m 12m 12m
10m 10m 10m 10m 10m 10m 10m
8m 8m 8m 8m 8m 8m 8m
3b
displacement contour
DM pile front pile rear pile
1b 2b
3e
Zone CD Zone BC Zone AB
IJSER
International Journal of Scientific & Engineering Research, Volume 7, Issue 6, June-2016 374 ISSN 2229-5518
IJSER © 2016 http://www.ijser.org
Figure 8. Horizontal displacement contour of four typical cases
3.2. Settlement profile The settlement at the base of embakment is presented in Fig.9. As case 1a is compared with case 1b and case 2a in Fig.9a, the use of DM piles not only reduces the maximum settlement from 20cm (Case 1a) to 5cm (Case 2a-decreasingly 80%), but also help the settlement of embankment is less difference along all embankment ( cm5≈ ).
Fig.9b shows the impact of pile spacing when all zones (AB, BC, CD) are installed by the identical pile length. The avarage settlement of embankment in case 2b is approximately 5.45cm compared to case 2a(≈5.18cm), case 2c( ≈4.9cm), and case 2d( ≈5.5cm). Differential settlement in case 2(a,b,c) is also smaller than case 2d as comparison in table 2. Hence, the settlement in Case 2c (s=2,5D) is lowest and distribution settlement is relatively equal as case 2(a,b). This is result of arching effects and group pile effect.
Fig.9c shows the influence of DM pile spacing when all zones AB, BC, CD are supported by various spacing. The avarage settlement of embankment in cases 2e, 2f, 2g is similarly with approximately 4.7cm for zone AB and và approximately 5.0cm for zones BC, CD. However, the differential settlement in case 2f and case 2g is higher significantly ( ≈10%) than case 2e for area of zone BC and CD. In addition to, the use of DM piles shifted the location of maximum settlement toward away abutment than case 1a and case 1b.
Another analysis was performed for case 2 by changing the length of pile for zones (AB, BC, CD) likely in Fig.9d and Fig.9e. The avarage settlement and differential settlement in case 3d is clearly higher greatly ( ≈19%) than case 3(a,b,c). The settlement
results also has trend decreasingly at position nealy abutment, the difference of settlement between zone AB with BC and CD is aprroximately 30% .
Due to the influence of the strength and length of soft soil under the embankment to various zones(AB, BC, and CD) is differently as discussed above. So, the piles installed under the embankment is shifted pile spacing and length of piles for each zone that was compared and analysed in Fig.9f, Fig.9g, Fig.9h. As case 2(a,b) is compared with case 3(a,b) shown that the settlement in zone AB and CD of case 2(a,b) largely reduce (21.2%) than case 3(a,b).
Fig.9g shows results for comparison of cases have changing pile spacing from 2,5D to 3D and the length of piles has decreased gradually follow supporting zones. With case 3c (s=2,5D), distribution of settlement only slightly increase than case 2c and 2d. The results of comparision also presented similarly for case 2(e,f,g) with case 3(e,f,g) in Fig.9h. And the longitudinal gradient change is defined as distortion (i.e., differnetial settlement/distance) of pavement is relatively small with 0,22%, at in safety limitation (≤ 1.5%)(Ling. et.al ).
Differential settlement ratio Sd (%), that is defined as ratio between settlement on DM pile and settlement of soft ground, as well as longitudinal gradient change, ge , for all cases presented in bảng 2. As can be seen that GRPS solution has significantly reduced settlement of embankment(5,5cm-treatment and 25,1cm-untreatment). Also, GRPS solution help decreasing longtitudoinal gradient change by settlement of embankment, as case 1a with ge =1,89% over limited value (1.5%), but avarage value ge in other cases only 0,11%. Case 2c and 3c show the best suitable results include all factors are displacement, differential settlement, gradient change.
Table 2. Settlement, differential settlement, longitudinal gradient change of embankment Case 1a 1b 2a 2b 2c 2d 2e 2f 2g 3a 3b 3c 3d 3e 3f 3g Settlement at at crest , cm 28.8 29.0 8.8 9.1 8.9 8.8 8.8 8.8 8.9 8.6 8.6 9.1 9.95 9.0 9.1 9.2 Settlement at Base, cm 25.1 25.1 5.2 5.5 5.6 5.5 6.5 5.5 5.5 5.8 5.7 6.0 6.8 6.0 6.4 6.3 Settlement of Fill, cm 3.7 4.1 3.6 3.6 3.3 3.3 2.3 3.3 4.4 2.8 2.9 3.1 3.2 3.0 2.7 2.9 Differential settlement, % 0 0 0.1 0.5 3.0 9.2 14.2 10 12.8 0.8 1.2 5.8 13.3 8.2 8.5 8.8 Gradient change ge, % 1.89 1.45 0.06 0.13 0.06 0.1 0.1 0.1 0.1 0.1 0.11 0.12 0.16 0.12 0.13
displacement contour
1b 2b
3b 3e
IJSER

International Journal of Scientific & Engineering Research, Volume 7, Issue 6, June-2016 375 ISSN 2229-5518
IJSER © 2016 http://www.ijser.org
0.14
-30
-25
-20
-15
-10
-5
0
-30 -25 -20 -15 -10 -5 0
Horizontal distance away from the abutment wall (m)
Verti
cal s
ettle
men
ts (c
m
Case 1aCase 1bCase 2a
Maximum settlement
-5.8
-5.6
-5.4
-5.2
-5
-4.8
-4.6
-4.4
-4.2
-4
-30 -25 -20 -15 -10 -5 0
Horizontal distance away from the abutment wall (m)
Verti
cal s
ettle
men
ts (c
m
Case 2aCase 2bCase 2cCase 2d
-7
-6.5
-6
-5.5
-5
-4.5
-4
-30 -25 -20 -15 -10 -5 0
Horizontal distance away from the abutment wall (m)
Verti
cal s
ettle
men
ts (c
m
Case 2eCase 2fCase 2g
-8
-7.5-7
-6.5-6
-5.5-5
-4.5-4
-3.5-3
-30 -25 -20 -15 -10 -5 0
Horizontal distance away from the abutment wall (m)
Verti
cal s
ettle
men
ts (c
m
Case 3aCase 3bCase 3cCase 3d
-7
-6.5
-6
-5.5
-5
-4.5
-4
-3.5
-3
-30 -25 -20 -15 -10 -5 0
Horizontal distance away from the abutment wall (m)
Verti
cal s
ettle
men
ts (c
m
Case 3eCase 3fCase 3g
-6.5
-6
-5.5
-5
-4.5
-4
-3.5
-3
-30 -25 -20 -15 -10 -5 0
Horizontal distance away from the abutment wall (m)
Verti
cal s
ettle
men
ts (c
m
Case 2aCase 2bCase 3aCase 3b
-8-7.5
-7-6.5
-6-5.5
-5-4.5
-4-3.5
-3
-30 -25 -20 -15 -10 -5 0
Horizontal distance away from the abutment wall (m)
Verti
cal s
ettle
men
ts (c
m
Case 2cCase 2dCase 3cCase 3d
-7
-6.5
-6
-5.5
-5
-4.5
-4
-3.5
-3
-30 -25 -20 -15 -10 -5 0
Horizontal distance away from the abutment wall (m)
Verti
cal s
ettle
men
ts (c
m
Case 2eCase 2gCase 3eCase 3g
Figure 9. Settlement profile at the base of embankment behind bridge abutment
3.3. Vertical stress distribution Eight typical cases for distribution of stress at the base of embankment are presented in Fig.10. As compared with case 2a, Fig.10a shows that there are a good agreement about distribution of stress along embankment in cases(1a,1b,2a). But, for zone AB, stress has increasingly steadily in case 2a rather than the reduction in case 1. Fig.10b shows the comparision between case 2a and 2b, and most stress shifted in zone AB with the difference only from 3% to 5%. This had
indicated distribution of stress were impacted greatly by arching effects. Simultaneously, the results also shows that the interaction area of embankment and bridge abutment is suitable with value 2 hs (hs-the depth of soft clay), nearly only in zone AB.
Fig.10c and Fig.10d shows influence of pile spacing DM to distribution of stress for other cases. The maximum value of stress appeared suddenly at the edge of pile cap (≈550÷700kN/m2) when has the change of pile spacing (2D ÷ 3D). Thus, this position might be destroyed higher significantly than other locations.
a b
c d
e f
g h
IJSER

International Journal of Scientific & Engineering Research, Volume 7, Issue 6, June-2016 376 ISSN 2229-5518
IJSER © 2016 http://www.ijser.org
Fig.10e and Fig.10f show comparision on distribution of stress between cases 3(a,b,c,d). The distribution of stress on DM pile cap in case 3b is higher approximately 17% than case 3a and also quite similarly with case 3c and 3d in zone AB. Fig.10g
shows that stress value is not differently much between case 3a and 3g, but much higher (≈32%) compared to case 3a and 3b. Besides, stress concentration ratiowas analysed from all cases has remained about 1÷ 5 and less depend on the change of DM pile length.
-180
-160
-140
-120
-100
-80
-60
-40
-20
0
-30 -25 -20 -15 -10 -5 0
Horizontal distance away from the abutment wall (m)
Verti
cal s
tress
(kN
/m2
Case 1aCase 1bCase 2a Maximum
stress
a
-160
-150
-140
-130
-120
-110
-100
-30 -25 -20 -15 -10 -5 0
Horizontal distance away from the abutment wall (m)
Verti
cal s
tress
(kN
/m2
Case 2a
Case 2b
Zone CD Zone BC Zone AB
b
-700
-600
-500
-400
-300
-200
-100
0
-30 -25 -20 -15 -10 -5 0
Horizontal distance away from the abutment wall (m)
Verti
cal s
tress
(kN
/m2
Case 2cCase 2d
Zone CD Zone BC Zone AB
c
-600
-500
-400
-300
-200
-100
-30 -25 -20 -15 -10 -5 0
Horizontal distance away from the abutment wall (m)
Verti
cal s
tress
(KN
/m2
Case 2eCase 2fCase 2g
Zone CD Zone BC Zone AB
d
-600
-500
-400
-300
-200
-100
0
-30 -25 -20 -15 -10 -5 0
Horizontal distance away from the abutment wall (m)
Verti
cal s
tress
(kN
/m2
Case 3a
Case 3b
Zone CD Zone BC Zone AB
e
-600
-500
-400
-300
-200
-100
0
-30 -25 -20 -15 -10 -5 0
Horizontal distance away from the abutment wall (m)
Verti
cal s
tress
(kN
/m2
Case 3cCase 3d
Zone CD Zone BC Zone AB
f
-600
-500
-400
-300
-200
-100
0
-30 -25 -20 -15 -10 -5 0
Horizontal distance away from the abutment wall (m)
Verti
cal s
tress
(kN
/m2
Case 3eCase 3g
Zone CD Zone BC Zone AB
g
-700
-600
-500
-400
-300
-200
-100
0
-30 -25 -20 -15 -10 -5 0
Horizontal distance away from the abutment wall (m)
Verti
cal s
tress
(kN
/m2
Case 2cCase 3c
Zone CD Zone BC Zone AB
h
Figure 10. Vertical stress distribution at the base of embankment behind bridge abutment
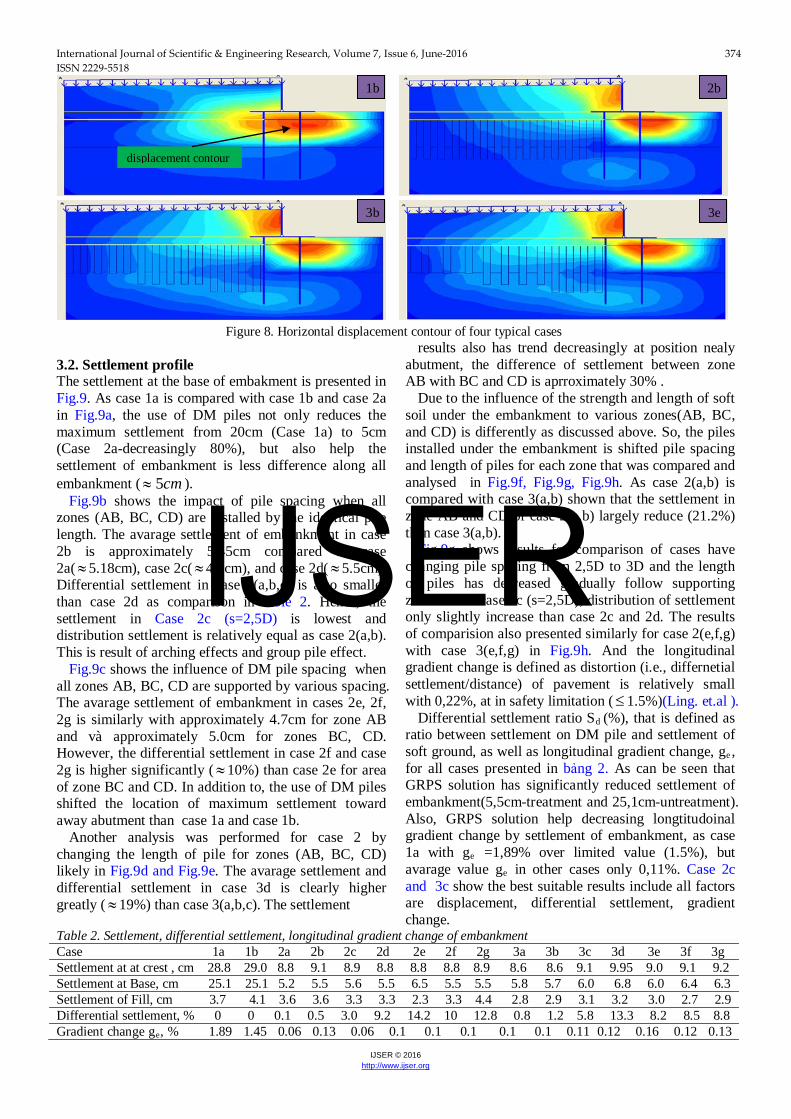
3.4. Strain of embankment Fig.11 presents normal strain of some typical cases for embankment behind bridge abutment. The results show that the strain area and the degree of strain in case 1a is higher significantly( ≈ 61%) than cases where use GRPS solution. Additionally, the maximum strain
location is at nearly with the position 2 hs from away abutment wall. As can be seen in Fig.11b, the degree of strain in case 3c is much smaller (≈49%) than case 2c, this has confirmed that the length of DM pile has strongly influenced to the increase of strain of embankment. For the shear strain, Fig.11d shows that shear strain in case 2c is significant smaller than case 3c.
IJSER
International Journal of Scientific & Engineering Research, Volume 7, Issue 6, June-2016 377 ISSN 2229-5518
IJSER © 2016 http://www.ijser.org
A similar comparison also was taken beween case 2a with case 3a and case 3b as in Fig.11c. Evidently, the
length of DM piles has strongly impacted to the stranfer of shear stress from embankment on pile cap.
-0.2
-0.15
-0.1
-0.05
0
0.05
-30 -25 -20 -15 -10 -5 0
Horizontal distance away from the abutment wall (m)
Nor
mal
stra
in (%
)
Case 1aCase 1bCase 2aCase 3aCase 3b
a
-0.2
-0.15
-0.1
-0.05
0
0.05
-30 -25 -20 -15 -10 -5 0
Horizontal distance away from the abutment wall (m)
Nor
mal
stra
in (%
)
Case 2cCase 3cCase 3e
Zone CD Zone BC Zone AB
b
-0.4
-0.3
-0.2
-0.1
0
0.1
0.2
-30 -25 -20 -15 -10 -5 0
Horizontal distance away from the abutment wall (m)
Shea
r stra
in (%
)
Case 1bCase 2aCase 3aCase 3b
c
-0.4
-0.3
-0.2
-0.1
0
0.1
0.2
-30 -25 -20 -15 -10 -5 0
Horizontal distance away from the abutment wall (m)
Nor
mal
stra
in (%
)
Case 2cCase 3cCase 3e
Zone CD Zone BC Zone AB
d
Figure 11. Normal and shear strain at the base of embankment behind bridge abutment
4. CONCLUSION
Mechanism pertaining to bridge abutment constructed on piled foundation through soft soil have mostly been investigated using numerical analyses presented in this paper. The findings are summerised based on Fe numerical software as follows:
Deformation zone by interaction between embankment and bridge abutment mainly happen during domain approximately 2 hs away from abutment wall. Depth of clay layer (hs) and variation of cu with depth are factors that influenced significantly.
The reduction of displacement, differential settlement and deformation can be achieved by installing DM piles. The best performance can be obtained by optimizing the pile spacing under embankment from 2D to 2,5D.
Installing DM piles with a spacing is 2,5D and shift the length of DM piles based on supporting zone might help embankment get the reduction of differential settlement and longitudinal gradient change as well as get a good aggrement with the distribution of stress. longitudinal gradient change should be controlled to be avoid possible failure (≤1,5%).
In the deformation zone behind abutment(AB and BC), stress distributed and focused extremely large at the location of edge of pile cap with cases has treated by GRPS and at the location 2 hs - untreatment cases.
The stress concentration ratio for the GRPS systems ranged from 1 to 5, and nearly less influence to the length of DM piles. But, the shear stress transfer on pile cap depend significant on the length of DM piles.
Foundation piles can provide shear resistance to the shear stress induced by embankment. It is necessarily to
install DM piles with larger length in zone 2 hs from abutment to avoid possible failure or dmage of roadways and bridge abutment. 4. REFERENCES Jie Han, Sadik Oztopraka, Robert L. (2007), Numerical
analysis of foundation columns to support widening of embankment.Computer and geotechnics 34, Elsevier Ltd. pp 435-448.
M.K Kelesoglu, S.M Springman. (2011), Analytical and 3D numerical modelling of full-height bridge abutment. Computer and geotechnics 38, Elsevier Ltd. pp 934-948.
E.A. Ellis. (1996), Soil-structure interaction of piled bridge abutments constructed on soft clay. Ground Engineering, University of Cambridge. pp 42-44.
CA. Jones, DI Stewart, CJ Danilewicz. (2008), Bridge distress caused by approach embankment settlement. geotechnics Engineering, Elsevier Ltd. pp 63-74.
De Beer EE. (1972), Piles subjected to static lateral loads. Proceedings of 9th European conference on soilmechanics and foundation engineering, Tokyo, 1972. pp. 1–14.
Tschebotarioff GP.(1973), Foundations, retaining and earth structures. 2nd ed. New York: McGraw-Hill; 1973. p. 365–414.
Brinkgreve, R.B.J and Vermeer, P.A. (1998), Plaxis - Finite Element Code for Soil And rock Analysis - Version 7, A.A. BalkemaPublishers,Netherlands.
IJSER