ABSTRACT - Food and Agriculture Organization · ABSTRACT . Research and engineering appropriate...
102
-
Upload
duongthuan -
Category
Documents
-
view
218 -
download
0
Transcript of ABSTRACT - Food and Agriculture Organization · ABSTRACT . Research and engineering appropriate...


ABSTRACT
Research and engineering appropriate BRDs for developing the eco-friendly trawl net in Indonesia were conducted on fishing ground around Dolak islands waters in Arafura sea from November 29 to December 9, 2007. The flume tank demonstration was performed at Fishing Technology Laboratory, Department of Fisheries Resources Utilization, Bogor Agricultural University. The objectives of the research were to evaluate technical performance of BRDs (TED super shooter, square mesh window, and fish eye); to collect baseline data on the catch composition of trawl net without BRD; to compare effectiveness of three different types of BRDs tested in reducing the by-catch from a commercial shrimp trawl fishery in Arafura sea in term of changes in catch composition, catch weight and catch value; and to demonstrate the BRDs performance in the laboratory flume tank.
The result of the study showed that the square mesh window and fish eye showed similar good technical performance in comparison with the US-TED. Although the US-TED has low technical performance, it was better than the standard TED, particularly from the view point of material used that give a little bit simple in handling compared to the standard TED. The total of 26 hauls were carried out successfully consisted of 45 species of fish, 2 species of shrimp, and some species of crabs. From those species of fish, 21 species of economic fish was utilized by the fishers. The fish eye has high effectiveness in reducing bycatch up to 13.36%, and then followed by square mesh window (reduced the bycatch up to 5.98%). The US-TED, however, failed to reduce the bycatch (conversely increased the bycatch by 4.66%). All the BRDs used have influenced on the shrimp loss i.e., 21.25% for the fish eye, 22.13% for the square mesh window, and 32.29% for the US-TED.
Flume tank observation from the three different types of BRDs showed a significant technical performance and escaping behaviour of fish. The highest escapement of fish was from square mesh window. Whilst the and fish eye and US-TED and fish eye have low escapes. The position of fish eye and exit hole of the US-TED has an effect to the escapement process. The grid angle of 57.1º was suitable for allowing the unwanted animal to escape.
It is recommended that three BRDs can be implemented. Although there are needed further study to increase the effectiveness of the square mesh and fish eye, mainly to decide the appropriate position of those BRDs on the codend for optimum function of the BRDs to reduce the bycatch. Further research need to be conducted in long duration of fishing trials that representing the fishing season. Keywords: appropriate BRDs, eco-friendly, technical performance, catch composition,
effectiveness, by-catch, Arafura sea

Research Team 1. Prof. Dr. Ir. Ari Purbayanto, M.Sc.
Team Leader, Faculty of Fisheries and Marine Sciences, Bogor Agricultural University, Bogor.
2. Ir. Ronny Irawan Wahyu, M.Phil. Faculty of Fisheries and Marine Sciences, Bogor Agricultural University, Bogor.
3. Ir. Suhariyanto Fishing Technology Development Center, Semarang.
4. Drs. Widodo.
Fishing Technology Development Center, Semarang. 5. Suparman Sasmita, S.Pi, M.Si.
Fishing Technology Development Center, Semarang. 6. Mochammad Riyanto, S.Pi.
Faculty of Fisheries and Marine Sciences, Bogor Agricultural University, Bogor.
Supporting Team 1. Ir. Tyas Budiman, MM.
Directorate General of Capture Fisheries, Ministry of Marine Affairs and Fisheries. Jakarta.
2. Ir. Jainur Manurung, MM. Directorate General of Capture Fisheries, Ministry of Marine Affairs and Fisheries. Jakarta.
3. Imron Rosyidi, S.Pi. Directorate General of Capture Fisheries, Ministry of Marine Affairs and Fisheries. Jakarta.
4. Muklis, S.Pi. Directorate General of Capture Fisheries, Ministry of Marine Affairs and Fisheries. Jakarta.
5. Adi Susanto, S.Pi. Faculty of Fisheries and Marine Sciences, Bogor Agricultural University. Bogor.
6. Indra Supiyono Solihin, S.Pi. Faculty of Fisheries and Marine Sciences, Bogor Agricultural University. Bogor

Resource Persons 1. Dr. Ir. Dedy H. Sutisna, M.Si.
Directorate General of Capture Fisheries, Ministry of Marine Affairs and Fisheries. Jakarta.
2. Ir. Suardoyo, M.Si. Fishing Technology Development Center, Semarang.
3. Prof. Dr. Ir. Mulyono S. Baskoro, M.Sc. Faculty of Fisheries and Marine Sciences, Bogor Agricultural University, Bogor.
4. Dr. Ir. Wudianto, M.Sc. Capture Fisheries Research Center, Marine and Fisheries Research Agency, Ministry of Marine Affairs and Fisheries. Jakarta.

PREFACE
As the followed up of signing Letter of Agreement between Food and Agriculture
Organization of the United Nations and Fishing Technology Development Centre (BBPPI)
Semarang on carrying out “Research and Engineering Appropriate BRDs for Developing
the Eco-friendly Trawl net in Indonesia”, we submit a final report. This report explains
research background, review on by-catch reduction devices, research methods, results
and discussions, conclusions and recommendations.
The fishing trials using double rigged trawl nets with four different types of BRDs
(standard TED supper shooter, US-TED super shooter, fish eye, and square mesh
windows) in comparison with trawl nets without BRD (control net) were successfully
conducted in Arafura sea on December 1-8, 2007. A commercial shrimp fishing boat, i.e.,
M.V. Laut Arafura owned by PT. Sinar Abadi Cemerlang was used during trials. The flume
tank demonstration on BRDs performance and behaviour of fish inside the net codend
was conducted at Fishing Technology Laboratory, Department of Fisheries Resources
Utilization, Faculty of Fisheries and Marine Sciences, Bogor Agricultural University in
January 21-28, 2008.
In this opportunity the research team would like to express their gratitude to :
1. Dr. Frank Chopin from FAO-Rome, for his valuable comment and suggestion
during this research activity,
2. Mr. Thomas Phoulsen from FAO-Rome, for his assistance during fishing trials in
Arafura sea,
3. Dr. Benny Sormin from FAO-Jakarta, for his support on this research activity,
4. Mr. Slamet Hernowo and Mr. Budidjaja Santoso, management of PT. Sinar Abadi
Cemerlang for their support and help that make possible to conduct fishing trials in
Arafura sea using M.V. Laut Arafura, and
5. All supporters of this research activity.

We hope this final report is useful as scientific data for setting regulation on the
development of eco-friendly trawl fisheries in Indonesia. Critics and comments to improve
this report are welcome.
Thank you.
Research Team Leader,
Prof. Dr. Ir. Ari Purbayanto, M.Sc
Research and Engineering Appropriate BRDs
ii

CCoonntteennttss
Preface ..................................................................................................................... i Contents ..................................................................................................................... iii List of Tables ................................................................................................................ v List of Figures ............................................................................................................... vi List of Appendices ........................................................................................................ ix 1. INTRODUCTION .................................................................................................. 1
1.1 Background....................................................................................................... 1 1.2 Objectives ........................................................................................................ 3
2. REVIEW ON BY-CATCH REDUCTION DEVICES ................................................. 4
2.1 World View ...................................................................................................... 4 2.2 Indonesian View .............................................................................................. 5
2.2.1 Existing Bycatch reduction Devices (BRDs) .............................................. 5 2.2.2 Potency and composition of by-catch in Arafura sea............................... 8
3. RESEARCH METHODS ........................................................................................ 12
3.1 Time and Location ........................................................................................... 12 3.2 Material and Methods ...................................................................................... 12
3.2.1 Field experiments ................................................................................... 14 (1) Material and equipments ................................................................... 14 (2) Experimental procedure ..................................................................... 20 (3) Data collection ................................................................................... 21 (4) Data analysis ..................................................................................... 22
3.2.2 Laboratory demonstration ....................................................................... 22 (1) TED super shooter ............................................................................. 23 (2) Fish eye ............................................................................................. 24 (3) Square mesh windows ....................................................................... 25
4. RESULTS ................................................................................................................ 27
4.1 Technical Performance of Tested BRDs during Fishing Trial ......................... 27 4.2 Catch Composition of Trawl Net without and with BRDs ............................... 28
4.2.1 Catch composition of control net and trawl net with TED ...................... 28 4.2.2 Catch composition of control net and trawl net with square mesh window .............................................................................. 30 4.2.3 Catch composition of control net and trawl net with fish eye ................. 32
4.3 Effectiveness of BRDs in Reduction By-catch ................................................. 34 4.3.1 Catch composition ................................................................................ 34 4.3.2 Catch weight ......................................................................................... 36 4.3.3 Catch value ............................................................................................ 44
4.4 Flume Tank Demonstration ............................................................................. 48 4.4.1 Escapement level of fish ........................................................................ 48 4.4.2 Behaviour of the experiment fish ........................................................... 49
5. DISCUSSIONS ....................................................................................................... 52
Research and Engineering Appropriate BRDs
iii

5.1 Technical Performance of Tested BRDs during Fishing Trial ......................... 52 5.2 Catch Composition of Trawl Net without and with BRDs ............................... 53
5.2.1 Trawl without and with TED .................................................................. 53 5.2.2 Trawl without and with square mesh window ......................................... 54 5.2.3 Trawl without and with fish eye .............................................................. 54
5.3 Effectiveness of BRDs in Reducing By-catch .................................................. 55
6. CONCLUSIONS AND RECOMMENDATION ....................................................... 58 6.1 Conclusions ...................................................................................................... 58 6.2 Recommendation.............................................................................................. 59
REFERENCES APPENDICES
Research and Engineering Appropriate BRDs
iv

List of Tables
LLiisstt ooff TTaabblleess
Table 1. Estimation of by-catch potency in Arafura sea ........................................... 8
Table 2. The by-catch in samples taken from a trawler fishing in Arafura sea .......... 9
Table 3. Composition of fish caught by shrimp trawl in Arafura sea ......................... 10
Table 4. Catch species of shrimp trawl (KM. Aru Pearl) during observation in Arafura sea .................................................................................................. 11
Table 5. General specification of MV. Laut Arafura ................................................... 15
Table 6. Specification of trawl net used in the fishing trials ....................................... 15
Table 7. Specification of BRDs: TED super shooter (A), square mesh panel (B), and fish eye (C) used in the experiment ...................................................... 16
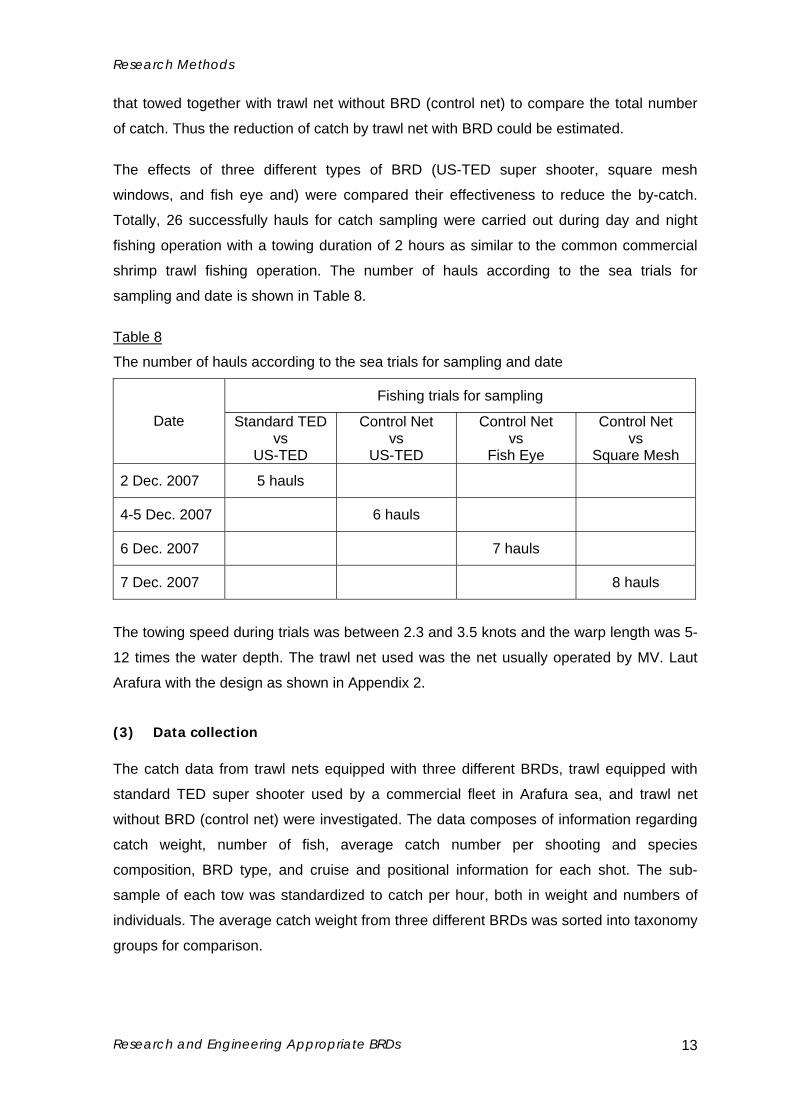
Table 8. The number of hauls according to the sea trials for sampling and date ..... 21
Table 9. Laboratory flume tank dimension................................................................. 23
Table 10. Evaluation of technical performance of BRDs during fishing trials............... 27
Table 11. The by-catch reduction and shrimp loss of the BRDs tested compared to the control net .............................................................................................. 48
Table 12. The average escapement level of experimental fish from three different type of BRDs ............................................................................................... 49
Research and Engineering Appropriate BRDs
v

LLiisstt ooff FFiigguurreess
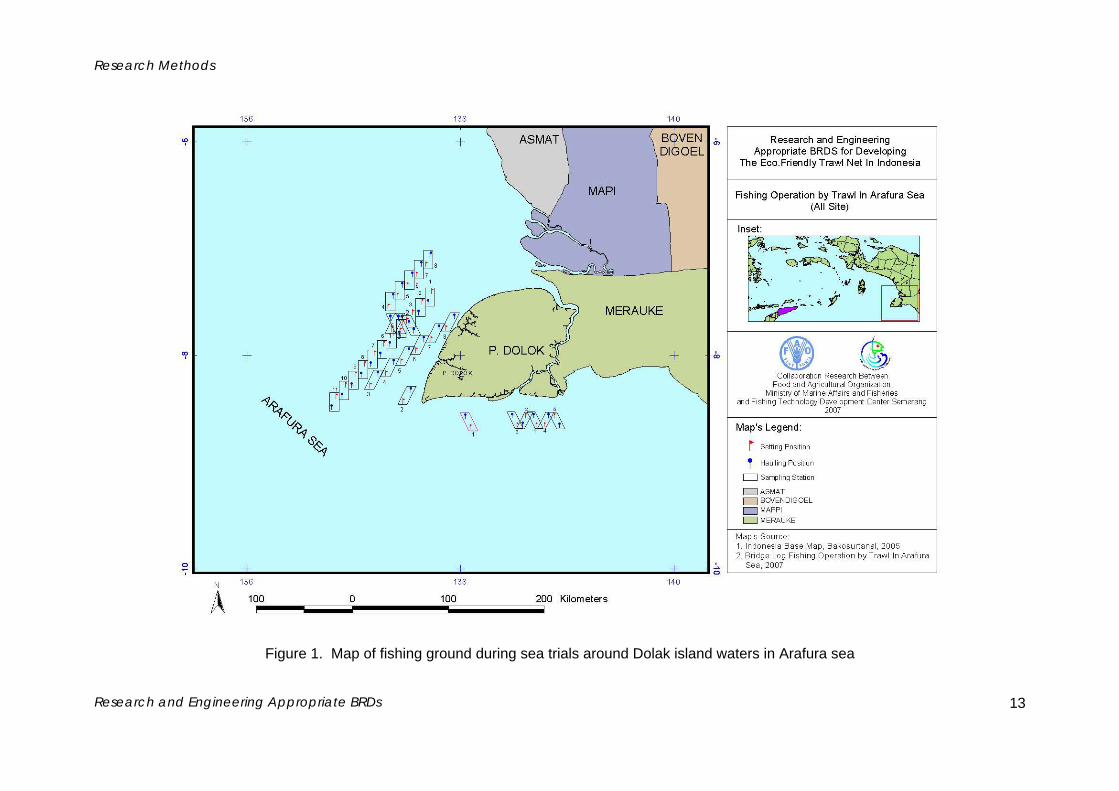
Figure 1. Map of fishing ground during sea trials around Dolak island waters in Arafura sea ................................................................................................. 13
Figure 2. Flow diagram of research and engineering for development of eco-friendly trawl net in Indonesia .................................................................... 14
Figure 3. Design and construction of TED super shooter and setting position on the cod-end .................................................................................................. 18
Figure 4. Design and construction of square mesh windows and setting position on the cod-end ............................................................................................. 19
Figure 5. Design and construction of square mesh windows and setting position on the cod-end ............................................................................................. 20
Figure 6. Laboratory flume tank at Department of Fisheries Resources Utilization, Bogor Agricultural University........................................................................ 23
Figure 7. The small-scaled TED Super Shooter fitted in the codend .......................... 24
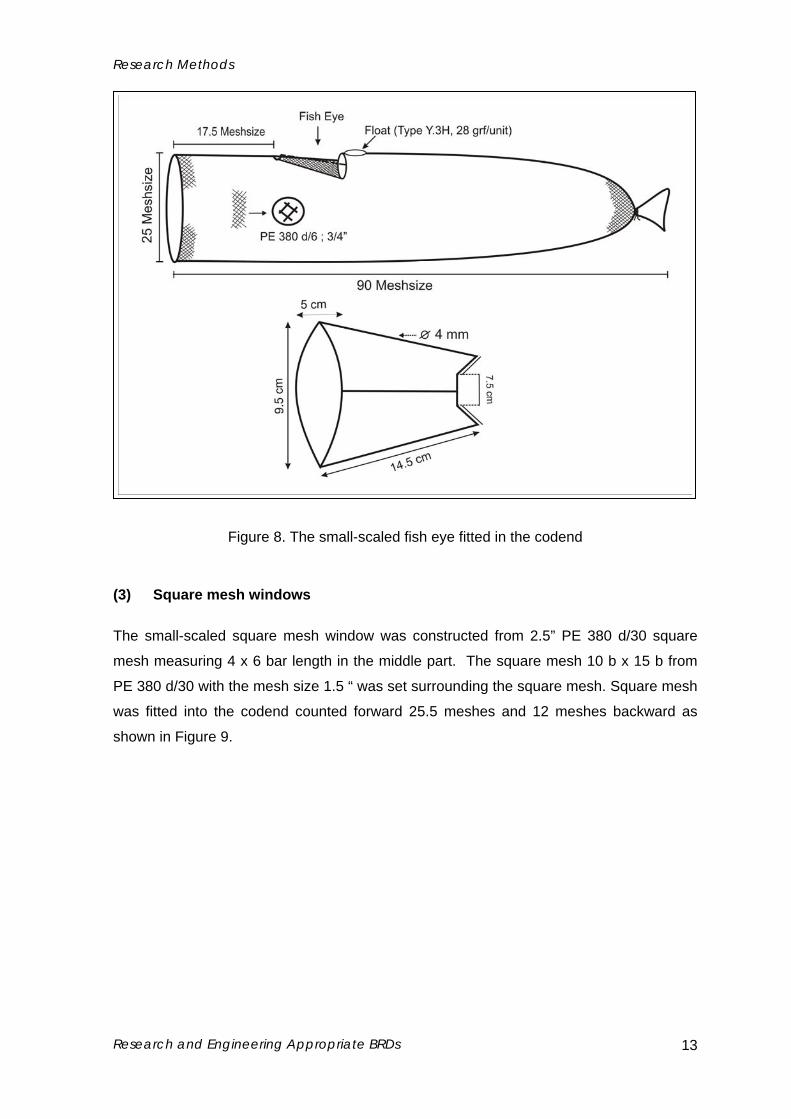
Figure 8. The small-scaled fish eye fitted in the codend ............................................. 25
Figure 9. The small-scaled square mesh window fitted in the codend........................ 26
Figure 10. Catch composition of discarded fish from control net................................... 28
Figure 11. Catch composition of discarded fish from trawl net with US-TED ................ 28
Figure 12. Composition of the economic fish from the control net................................. 29
Figure 13. Catch composition of the economic fish from the trawl net with US-TED .... 30
Figure 14. Catch composition of discarded fish from control net................................... 30
Figure 15. Catch composition of discarded fish from the trawl net with square mesh window ......................................................................................................... 31
Figure 16. Catch composition of economic fish from control net ................................... 31
Figure 17. Catch composition of economic fish from the trawl net with square mesh window ......................................................................................................... 32
Figure 18. Catch composition of the discarded fish control net ..................................... 32
Figure 19. Catch composition of discarded fish from the trawl net with fish eye ........... 33
Figure 20. Catch composition of economic fish from the control net ............................. 33
Figure 21. Catch composition of the economic fish from the trawl net with fish eye ..... 34
Figure 22. Comparison of number of species reduction among BRDs used in shrimp trawl net............................................................................................ 36
Figure 23. The reduction of the number of species within BRDs.................................. 36
Research and Engineering Appropriate BRDs
vi

Figure 24. Average catch of the control net and trawl net with US-TED ....................... 37
Figure 25. Catch of the control net and trawl net with US-TED according to towing number......................................................................................................... 37
Figure 26. Average catch of shrimp from the control net and trawl net with US-TED ... 38
Figure 27. The catch of shrimp from the control net and trawl net with TED per towing........................................................................................................... 38
Figure 28. The average catch of control net and trawl net with fish eye........................ 39
Figure 29. The comparison of catch between control net and trawl net with fish eye according to towing number ........................................................................ 39
Figure 30. The average catch of shrimp from control net and trawl net with fish eye.... 40
Figure 31. The catch of shrimp from control net and trawl net with fish eye for every towing........................................................................................................... 40
Figure 32. Average catch of control net and trawl net with square mesh windows ....... 41
Figure 33. Catch of control net and trawl net with square mesh window for every towing........................................................................................................... 41
Figure 34. The average catch of shrimp from control net and trawl net with square mesh windows ............................................................................................. 42
Figure 35. The catch of shrimp from control net and trawl net with square mesh windows for every towing............................................................................. 42
Figure 36. The average weight of trawl net with standard TED and US-TED ............... 43
Figure 37. The total weight of trawl net with standard TED and US-TED for every towing........................................................................................................... 43
Figure 38. The average weight of shrimp from trawl net with standard TED and US-TED........................................................................................................ 44
Figure 39. The weight of shrimp from trawl net with standard TED and US-TED for every towing................................................................................................. 44
Figure 40. The comparison of catch value between control net and trawl net with US-TED........................................................................................................ 45
Figure 41. The comparison of catch value between control net and trawl net with fish eye......................................................................................................... 46
Figure 42. The comparison of catch value between control net and trawl net with square mesh window ................................................................................... 46
Figure 43. The comparison of catch value between trawl net with standard TED and US-TED................................................................................................. 47
Figure 44. The escapement process of experimental fish from the TED....................... 50
Figure 45. The process of fish with the body width bigger than the distance of grid space ........................................................................................................... 50
Research and Engineering Appropriate BRDs
vii

Figure 46. Escapement process of experimetal fish from the square mesh window .... 51
Figure 47. The escapement process of fish from the fish eye....................................... 51
Research and Engineering Appropriate BRDs
viii

List of Appendices
Appendix-1. Fishing unit specification used during sea trials..................................... AP-1 Appendix-2. Design of double rig shrimp trawl net used in fishing trials .................... AP-2 Appendix-3. BRDs (US-TED, square mesh window, fish eye) construction............... AP-3 Appendix-4. Vessel (MV. Laut Arafura) used during sea trials................................... AP-5 Appendix-5. The BRDs (US-TED, square mesh window, and fish eye) set in the cod- end ................................................................................................. AP-6 Appendix-6. Fishing ground in Arafura sea ................................................................ AP-7 Appendix-7. Bridge Log Fishing Operation by Trawl in Arafura Sea ........................... AP-8 Appendix-8. Catch sampling composition of control net and trawl net with TED on December 4-5, 2007 .............................................................................. AP-10 Appendix-9. Catch sampling composition of economically species from control net and trawl net with TED on December 4-5, 2007 .................................... AP-11 Appendix-10. Catch sampling composition of control net and trawl net with square mesh windows on December 6-7, 2007..................................... AP-12 Appendix-11. Catch sampling composition of economically species from control net and trawl net with square mesh windows on December 6-7, 2007........ AP-13 Appendix-12. Catch sampling composition of control net and trawl net with fish eye on December 5-6, 2007 ............................................................ AP-14 Appendix-13. Catch sampling composition of economically species from control net and trawl net with fish eye on December 5-6, 2007 ............................... AP-15 Appendix-14. Catch sampling composition of trawl net with standard TED and USA TED on December 2-4, 2007.................................................. AP-16 Appendix-15. Catch sampling composition of economically species from trawl net with standard TED and USA TED December 2-4, 2007 ........................ AP-17 Appendix-16. Catch weight (kg) comparison of trawl net with standard TED and trawl net with US-TED..................................................................... AP-18 Appendix-17. Catch weight (kg) comparison of control net and trawl net TED ............ AP-19 Appendix-18. Catch weight (kg) comparison of control net and trawl net with square mesh windows .................................................................... AP-20
Research and Engineering Appropriate BRDs

List of Appendices
Appendix-19. Catch weight (kg) comparison of control net and trawl net with fish eye AP-21 Appendix -20. Fitted US-TED, square mesh window and fish eye into the codend ...... AP-22 Appendix -21. Shrimp capture during fishing trials in Arafura sea ................................ AP-23 Appendix -22. By-catch during fishing trials in Arafura sea ........................................... AP-25 Appendix -23. Behavior of the experiment fish in flume tank ........................................ AP-26
Research and Engineering Appropriate BRDs
x

11 IINNTTRROODDUUCCTTIIOONN
1.2 Background
In recent years, there has been
increased global concern over the
impacts of fishing activity on non-target
species termed as “by-catch”. Most of
the conventional shrimp trawl typically
are poorly selective fishing gears and so
retain large quantities of by-catch (Saila
1983). In particular, shrimp trawl
fisheries in tropical waters have come
under increased scrutiny due to the
capture and drowning of turtles caught in
trawl nets.
The by-catch may include undersized individuals of target species, and non-target
species. These include mixed fish and trash fish, which comprised of small individual fish
and almost of the fish discarded at sea. There are major concerns on discarding of the by-
catch: (1) wastes potentially good food; (2) reduces stocks of target and commercially
valuable non-target species and (3) disrupts ecological process on the seabed (Saila
1983; Gulland and Rothschild 1984).
Trawling for shrimp occurs throughout the majority of the world’s oceans, providing a total
catch of up to 2.9 million tones per year (FAO 1992), about 3.5 % of the total production
from the world’s marine fisheries (82.5 million tones). In 1994, by-catch from shrimp trawl
was estimated to be around 11.2 million tones worldwide (Alverson et al. 1994). Whilst
the by-catch from legal shrimp trawlers in Arafura sea Indonesia was estimated around
332,186 tones per year (Purbayanto et al. 2004).
The mortality of large quantities of the by-catch has resulted in the introduction of stringent
legislation requiring the implementation of measures to prevent this problem. According to
Research and Engineering Appropriate BRDs

Introduction
presidential decree No.39/1980, the trawl was banned in all over Indonesia waters since it
was issued in 1980. Only the trawl equipped with By-catch Excluder Device (BED) that is
allowed to be operated in Arafura sea and its adjacent waters. These shrimp trawls were
used to capture shrimp as target species and demersal fish as the by-catch.
Discarding of the by-catch and catching juvenile fish are serious regional problem in
fisheries management. The situation today is that many fish stock are grossly over
exploited and unwanted catch contributes to the reduction of fish stocks. It is now vital that
the natural resources must be harvested selectively to improve the yield. Future fishing
development is governed by the availability of sustainable fish stock, which dictates the
need for the juveniles and immature fish to be released. These must be released to reach
maturity and reproduce to maintain harvestable numbers of stock.
Development of selective fishing techniques that has been used to achieve ecosystem
objectives for example Turtle Excluder Device (TEDs) in commercial trawling in Arafura
sea has reduced the by-catch for more than 40%, eventhough the shrimp losses were still
occurred about 5% (Nasution 1997). Actually, the small reduction in amount of shrimp
caught can be reduced by changes in the net design to accelerate the water, and shrimp,
flow through the TED’s (Sainsbury 1996).
There are some well developed By-catch Reduction Device (BRD) designs (such as fish
eye, square mesh windows, and nordmore grid) available to be implemented on the
shrimp trawls in Arafura sea with the better performance that can maximize the escape
probability of the by-catch while minimize shrimp loss. However, the implementation of the
BRDs and its effectiveness on Indonesian shrimp trawl fisheries should be investigated
through laboratory as well as field experiments. The implementation of these devices in
fishing practices is expected to optimize yield, and minimize the by-catch and wastage.
The Ministry of Marine Affairs and Fisheries (MOMAF) is in the process of developing a
management plan for the trawl fishery. In relation to improve the trawl net selectivity,
MOMAF will release the recommendation to increase the minimum mesh size and to
implement the appropriate BRDs for shrimp trawl fisheries in order to develop the eco-
friendly trawl fisheries in Indonesia.
1.2 Objectives
Research and Engineering Appropriate BRDs
2

Introduction
1) To evaluate technical performance of BRDs (TED super shooter, square mesh
window, and fish eye) used on shrimp trawl net.
2) To collect baseline data on the catch composition of trawl net without BRD.
3) To compare effectiveness of three different types of BRDs tested in reducing the
by-catch from commercial shrimp trawl fishery in Arafura sea in terms of
changes in catch composition, catch weight, and catch value.
4) To demonstrate the BRDs performance in the laboratory flume tank.
Research and Engineering Appropriate BRDs
3

22 RREEVVIIEEWW OONN BBYY--CCAATTCCHH RREEDDUUCCTTIIOONN
DDEEVVIICCEESS
2.1 World View
Unwanted catch of fish and other species in shrimp trawling were perceives as a problem
mainly in the south-eastern of United States during 1970s. In the shrimp trawls operated in the
Gulf of Mexico, sea turtles were recognized as by-catch, in addition to jellyfish and fish
species (Shiode and Tokai 2004). Against this background, the US National Marine Fisheries
Service (NMFS), in collaboration with others, developed the TED (Watson et al. 1986). The
technological improvement of TEDs advanced as they were developed and introduced to
other countries in the world.
The experiment in Tampa Bay, Florida in 1996-1997 using two BRDs-the Extended Mesh
Funnel (EMF) and the Florida Fish Eye (EFE)- were evaluated in otter trawls with net mouth
circumferences of 14 m, 17 m, and 20 m and total net areas 45 m2. The by-catch principally
composed by finfish (44 fish were captured); horseshoe crabs and blue crabs seasonally
predominated in some trawls. Ten finfish species composed 92% of the total finfish catch;
commercially or recreationally valuable species accounted for 7% of the catch (Steele et al.
2002)
Several research projects have evaluated some types of TED and BRD in the Queensland
east coast trawl fishery in Australia (Robins-Troeger 1994 cited by Robins et al. 1999). These
research trials suggested varying degrees of efficiency of the by-catch reduction technology.
However, the location of the trials and the associated quantity and composition of the by-catch
was probably the most influential factor determining the efficiency of the particular location. As
expected, TEDs were very efficient in excluding large animals such as rays Rhynchobatus
spp. and Dasystis kuhluii; sea turtles, and sharks. The effect of TEDs upon catch rates of
other by-catch species, such as unwanted fish and sea snakes, was more variable, as
indicated in the large range of by-catch rates observed during research and commercials
tests. Types of TEDs including AusTED, AusTED II, and the Seymour TED were given a
significant reduction of by-catch in the Queensland east coast fishery.
Research and Engineering Appropriate BRDs

Review on By-catch Reduction Devices
TEDs introduced to Southeast Asian countries, including Thailand, Malaysia, and the
Philipines in order to cope with the US regulation, and mainly by initiatives of the Southeast
Asian Fisheries Development Centre (SEAFDEC). Chokesanguan et al. (1997) tested two
types of TEDs (Thai-ku and Thai Turtle Free Device TTDF) that had been jointly developed by
Thailand and SEAFDEC, in addition to three types of US-developed TEDs (Anthony
Weedless, Super Shooter, and Bent pipe) and two types of Mexican-developed TEDs
(Georgia Jumper, Mexican). It resulted that TTFD was the best in experiments and training
programmes aimed at promoting diffusion of TEDs among fishers were carried out in
Malaysia, the Philippines, Indonesia, and Brunei, and the effectiveness of TTFD was widely
recognized. However, fishermen did not venture to use TEDs because: (1) little or no by-catch
of sea turtles occur in ordinary shrimp trawling operations in the region; (2) there is a danger
in handling fishing gear due to the additional heavy-weight device, and (3) large quantities of
marine debris entering into the net block the grid mesh thus lower shrimp catch rate (Shiode
and Tokai 2004). In Indonesia, more than 1000 TEDs were employed in the fishing operations
conducted by joint ventures with Japan in the western area, and the fishing gear specialists
were sent to NMFS for training (Watson et al.1986).
2.2 Indonesian View
2.2.1 Existing by-catch reduction devices (BRDs)
Research on selective devices in industrial
shrimp fishing- BED (by-catch excluder device)
or TED - had been carried out by Research
Institute for Marine Fisheries (RIMF).
Introducing BED or the first type TED to shrimp
fishing companies, was began with a
collaborative scientific trial on BED between
Agency for Assessment and Application of
Technology, Bogor Agricultural University
(IPB), Directorate General of Fisheries, and
RIMF in the Arafura Sea in September-October
1982 (AAAT 1982). Then a scientific trial was
carried out by RIMF in the Cilacap waters,
southern coastal waters of Central Java in October 1982 (Nasution et al. 1983). The trial in
the Arafura sea resulted in a statistically significant reduction of by-catch in the BED-net by
80.11 kg (42.51 %) per towing (one hour) and a statistically insignificant loss of shrimp in the
Research and Engineering Appropriate BRDs
5

Review on By-catch Reduction Devices
BED-net by 4.27 kg (27.48 %) per towing. The trial in the Cilacap waters resulted in a
statistically significant reduction of by-catch in the BED-net by 86.21 kg (63.92 %) per towing
(one hour) and a statistically insignificant, loss of shrimp in the BED-net by 1.80 kg (31.41 %)
per towing. However, statistically insignificant, the loss of shrimp in the BED-net appears to be
rather high (27.48-31.41 %). Considering in the actual fishing if two net towed within two
hours, the shrimp loss will be 17.08 kg/towing in the Arafura sea, and 7.20 kg/towing in the
Cilacap. These results could not prove the potential benefit of BED to be promoted to
industrial shrimp fishing in the Arafura sea. Further scientific trials are needed for improving
design and construction of the BED so as to minimize the shrimp loss. Since then, however,
no more scientific trials are conducted until introducing a new type TED, Super Shooter TED
came introduced 1996. It could be understood if the shrimp fishing companies rejected the
BED, as many of American shrimpers also complained that it was too cumbersome and
dangerous to use, especially in the rough sea and were reluctant to use it (Oravetz and Grant
1986) in addition the BED was heavy, large and difficult to handle (Prado 1993).
In relation to FAO Cooperative
Research Network in Asia and Indian
Region on Selective Tropical Shrimp
Trawling, a preliminary fishing trial on
the use of the Super Shooter TED in
industrial shrimp fishing in the Arafura
sea was carried out by RIMF in
cooperation with a shrimp fishing
company in Ambon on 1-10 April 1997
(Nasution, 1997). Two of four-seam
trawl nets of the same size (one
equipped with and another without TED)
were continuously towed within every two hours in the Aru and Dolak waters of 15-25 m deep
by a double rigger trawler of 180.70 GT and powered 600 HP. The trials in the Aru waters (15
hauls) resulted in a statistically significant loss of tiger shrimp in the TED-net by 3.427 kg
(34.07 %) per towing, a statistically insignificant loss of banana shrimp in the TED-net by
2.591 kg (33.59 %) per towing and a statistically significant reduction of by-catch in the TED-
net by 128.419 kg (41.15 %) per towing. The trial in the Dolak waters (20 hauls) resulted in a
statistically insignificant loss of banana shrimp in the TED-net by 9.226 kg (33.09 %) per
towing (tiger shrimp were not caught in this waters), and a statistically significant reduction of
by-catch in the TED-net by 196.590 kg (45.65 %) per towing. However the TED super shooter
reduce the by-catch, the shrimp loss appeared to be rather high, while significant loss of tiger
Research and Engineering Appropriate BRDs
6

Review on By-catch Reduction Devices
shrimp occurred in the Aru waters. These results still could not prove the potential benefit of
the TED to be promoted into industrial shrimp fishing in the Arafura sea. The reasons of high
loss of shrimp might be due to the position of the exit hole, where the tested TED equipped
with bottom exit hole, while top exit hole appeared to be better than bottom exit hole (Mitchell
et al. 1995), the material and weight of TED and its size in relation to the circumference of
cod-end, as well as the flotation. Unlike the BED, which has been rejected by most American
shrimpers, the super shooter TED should not be complained as it showed a statistically
insignificant loss of shrimp when trawling in USA (Renaud et al. 1992), as well as in Australia
(Robins and Campbell 1997).
Whilst trialling in the Aru waters, the endangered sea turtles were not caught, but in the Dolak
waters two sea turtles were caught in different hauls, one in the TED-net trapped in the TED
then could escape alive by itself and another in the net without TED which released alive into
the water. Furthermore, Mahiswara (2004) found that TED super shooter reduced the by-
catch/towing/hours between 5% (12 cm grid spacing) and 60% (4 cm grid spacing), This
reduction of the by-catch still be followed by the catch of shrimps between 13% (6 cm grid
spacing) and 59% (10 cm grid spacing).
According to Eayrs (2004) there are some points to be considered of the successful
introduction and development of TEDs in prawn-trawl fishery. First, is by extension and
enforcement due to the willingness of fishermen to adopt new technology. The initiatives
used to extend the results of testing programmes on both research and commercials
boats played a major rule in this success. Second, is by selecting the correct TED. The
most important aspect to TED selection is the decision to orientate the grid either upwards
to exclude large animals through the top of the cod-end or downwards to exclude this
animals through the bottom of the cod-end. Third, is the over-turning TEDs. Over-turning
TEDs is a term coined to describe excessive and inappropriate modifications to the TED
to reduce shrimp loss. This loss typically arises from poor design, rigging or maintenance
of a TED, or the poor selection of a TED for particular fishing ground. And the last is by
testing protocol. Testing protocol was required that allowed innovative fishermen the
opportunity to test and develop their own TEDs and BRDs.
Research and Engineering Appropriate BRDs
7

Review on By-catch Reduction Devices
2.2.2 Potency and composition of by-catch in Arafura sea
Potency of by-catch in Arafura sea (the waters of Dolak Island, Aru island and the waters
around Avona) has been reported by Purbayanto et. al. (2004). The potency was 332,186
ton/year based on the observer data from shrimp trawl netters as shown in Table 1.
Table 1Estimation of by-catch potency in Arafura sea
Average of by-catch volume Fishing ground (ton/haul) (ton/day) (ton/trip)
1.03 7.21 216.3 Dolak island 0.93 6.5 195.09 Aru island 0.37 2.57 77.07
0.04 0.31 9.24 Avona 0.23 1.61 48.3 Average 0.52 3.64 109.2 Number of registered (unit) trawlers 336 Potency of by-catch (ton/year) 332.186
Source : Purbayanto et. al. (2004)
There are several reports about the by-catch
from shrimp trawl fisheries in Arafura sea.
Evans and Wahju (1996) reported that 34
species of fin-fish and 5 invertebrate taxa
were identified as the by-catch from non BED
trawl net in Arafura sea during sampling on
February 1992. The dominant by-catch
species by percent weight and number
composed of queen fish (Carangidae), slimy
fish (Leioghnathus insidiator), ornate threadfin
(Nemipterus hexadon), banded grunter
(Therapon theraps), and small head hair
(Trichiurus savala) as shown in Table 2.
Research and Engineering Appropriate BRDs
8

Review on By-catch Reduction Devices
Table 2The by-catch in samples taken from a trawler fishing in Arafura sea
Taxon English name Weight (%) Number (%)
Carangidae Queen fish 9.5 11.9 Formio niger Black pomfret 1.7 2.1 Johnius dussumieri Silver pennah 1.3 2.4 Leioghnathus insidiator Slimy fish 6.9 4.4 Lethrinus lentjan Red-spotted emperor 2.2 1.1 Lutjanus carponatus Gold-stripped snapper 1.3 2.1 Nemipterus hexadon Ornate threadfin 5.2 4.2 Pampus argentus Silver pomfret 4.6 2.5 Sardinella spp. Sardine 1.7 3.3 Stolephorus indicus Anchovy 1.3 3.0 Therapon theraps Banded grunter 8.7 8.9 Trichiurus savala Small head hair 10.8 0.8 Upeneus sulphurous Goatfish 1.3 6.7 Valamugil speigleri Mullet 3.9 2.6 Melo spp. Whelk 2.2 0.1
Source: Evans and Wahju (1996).
Mahiswara and Widodo (2005) reported that the by-catch from 180 GT double-
rigged non TED shrimp trawl operated around Unu island waters in Arafura sea on July
2004 was 38 species of fin-fish, crustacean, snakes, and turtles. The most caught fish
were pony fish (Leiognathidae), anchovies (Engraulidae), grunt (Haemulidae), rays,
sardine (Clupeidae), and croaker (Sciaenidae) as shown in Table 3.
Research and Engineering Appropriate BRDs
9

Review on By-catch Reduction Devices
Table 3 Composition of fish caught by shrimp trawl in Arafura sea
No. Family Local/Indonesia name Percent (%)
1. Leiognathidae Petek 44.39 2. Engraulidae Teri 6.49 3. Haemulidae Gerot-gerot 6.28 4. Rays Pari 5.55 5. Clupeidae Sardin 4.16 6. Sciaenidae Gulamah/tigawaja 4.19 7. Mullidae Biji nangka 2.19 8. Lactaridae Ikan susu 2.05 9. Synodontidae Beloso 2.00 10. Trichiuridae Layur 1.78 11. Drepanidae Ketang-ketang 1.65 12. Shark Hiu-cucut 1.53 13. Ariidae Manyung 1.20 14. Polynemidae Senangin-kuro 1.19 15. Carangidae Bubara/kuwe 1.12 16. Centropomidae Kakap putih 0.78 17. Crabs Kepiting 0.73 18. Lutjanidae Kakap merah 0.60 19. Soleidae 0.51 20. Sphyraenidae Barakuda 0.48 21. Cuttle Sotong 0.48 22. Harpadontidae Nomei 0.42 23. Squids Cumi-cumi 0.29 24. Sillagidae Jerum 0.28 25. Scombridae Tenggiri 0.26 26. Muraesocidae Belut laut 0.22 27. Theraponidae Kerong-kerong 0.10 28. Platycephalidae 0.07 29. Nemipteridae Kurisi 0.07 30. Gerridae Kapas-kapas 0.04 31. Menidae Semar 0.02 32. Chirocentridae Pedang-pedang/Parang-parang 0.01 33. Rachycentridae 0.01 34. Lobster Udang barong 0.07 35. Snake Ular 0.11 36. Invertebrate Moluska 0.05 37. Shrimp Udang 7.27 38. Turtle Penyu 0.60
Source: Mahiswara and Widodo (2005)
From deck observation result on the by-catch species caught by shrimp trawl in Arafura sea showed 44 species, comprised of 24 demersal fish, 12 pelagic fish, 3 molluscs, and 5 crustaceans (Purbayanto et al. 2004). The Indonesian name, English name, and scientific name of the by-catch in detailed is shown in Table 3.
Research and Engineering Appropriate BRDs
10

Review on By-catch Reduction Devices
Table 4Catch species of shrimp trawl (MV. Aru Pearl) during observation in Arafura sea
No. Indonesia name English name Scientific name
Demersal species1. Bambangan Red snapper Lutjanus spp 2. Bawal hitam Black pomfret Formio niger 3. Beloso Lizard fishes Saurida tumbil 4. Biji nangka Goat fishes Upeneus sulphureus 5. Cucut Shark Sphyrhinidae 6. Gulamah Croaker Argyrosomus amoyensis 7. Gerot-gerot Swept lips Johnius sp. 8. Kakap Barramundi Lates calcarifer 9. Kerapu Groupers Ephinephelus spp
10. Kerong-kerong Banded grunter Terapon theraps 11. Kurisi Threadfin breams Nemipterus spp 12. Kuro (Senangin) Giant threadfish Eletheronema tetradactylum 13. Layur Hairtail Trichiurus savala 14. Lidah Long-tongue sole Cynoglossus sp 15. Manyung Marine catfishes Arius thalassinus 16. Pari Rays Trigonidae 17. Peperek Pugnose ponyfishes Secutor ruconis 18. Sembilang Canine catfishes Plotosus canius 19. Swanggi Big eye Priacanthus spp. 20. Tiga waja Bearded-croaker Johnius dussumieri 21. Buntal Smooth golden toadfish Legochepalus inermis 22. Buntal besar Starry pufferfish Arothtron stellatus 23. Nomei Bombay duck, Saury Harpadon micropectoralis 24. Gampret Plataks Platax batavianus
Pelagic species 25. Alu-alu Barracudas Sphyraena spp 26. Daun bambu Queen fishes Chorinemeus tala 27. Kembung Long-jawed mackerel Rastrelliger kanagurta 28. Kuwe Crevallies Caranx sexfasciatus 29. Layang Scads Decapterus russelli 30. Lemuru Indian oil sardinella Sardinella longicep 31. Parang-parang Wolf herrings Chirocentrus spp 32. Selar Blue-spotted trevally Caranx bucculentus 33. Tembang Fringe scale sardinella Sardinella fimbriata
34. Tenggiri Narrow barred spanish mackerel Scomberomorus comersonii
35. Tengiri papan Indi pacific spanish mackerel Scomberomorus guttatus
36. Tetengkek Hardtail Megalapis cordyla Molluscs
37. Cumi-cumi Squid Loligo spp. 38. Sotong Cuttle fish Sepia spp. 39. Gurita Octopus Octopus sp.
Crustacean 40. Kepiting Crabs Scylla sp. 41. Rajungan Swimming crabs Portunus pelagicus 42. Udang Ronggeng Manthis shrimp Squilla sp. 43. Udang Jerbung Banana shrimp Penaeus merguensis 44. Udang Windu Tiger prawn Penaeus monodon
Source: Purbayanto et al. (2004)
Research and Engineering Appropriate BRDs
11

Research and Engineering Appropriate BRDs
33 RREESSEEAARRCCHH MMEETTHHOODDSS
3.1 Time and Location
Fishing trials for comparing effectiveness of three different types of BRDs were conducted
on fishing ground around Dolak island waters in Arafura sea from November 29 to
December 9, 2007. The geographical position of fishing ground was about 7º03’ - 8º43’ S
and 137º20’ - 138º45’ E as shown in Figure 1. The flume tank demonstration was
performed at Fishing Technology Laboratory, Department of Fisheries Resources
Utilization, Faculty of Fisheries and Marine Sciences, Bogor Agricultural University in
January 18-28, 2008.
3.2 Materials and Methods
The fishing trials in Arafura sea were carried out using a commercial double rig shrimp
trawler (MV. Laut Arafura) owned by PT. Sinar Abadi Cemerlang. This trawler has
24,95 m overall length, 166 GT, and an engine power of 402 HP. Three different BRDs
design (US-TED super shooter, square mesh windows, and fish eye) were constructed
and attached on the cod-end of shrimp trawl nets for comparative fishing trials. Data and
information of technical performance of BRDs during operation, catch composition, and
effectiveness of each BRD for reducing by-catch were obtained. These data and
information were further used to consider the development of eco-friendly trawl net in
Indonesia.
The flume tank demonstration was performed to show an underwater technical
performance of the BRDs and fish behaviour inside the codend. The BRDs used were
small-scaled BRDs as to be used in the sea trials. Information obtained during flume tank
demonstration supported the sea trials results especially for public understanding of the
underwater BRDs technical performance. Flow chart diagram of the research in detail is
shown in Figure 2.
Research Methods
Figure 1. Map of fishing ground during sea trials around Dolak island waters in Arafura sea
Research and Engineering Appropriate BRDs
13

Research Methods
Shrimp trawl fishery in Arafura Sea
Desk study: Identify the existing BRD, operation
method, fishing ground, by-catch, etc
Determine design and construction of BRDs, (US-TED super shooter, square
mesh windows, fish eye)
Setting up BRDs on a commercial double rig shrimp trawl net
(MV. Laut Arafura)
Construction of small-scaled BRDs for flume
tank demo
Setting up BRDs on cod-end inside the flume tank
Flume tank demo: • Technical performance • Behavior inside the cod-
end
Fishing trials in Arafura sea: • Technical performance of BRDs • Catch composition of trawl net
without BRDs • Effectiveness of BRDs in reducing
by-catch
Data and information for development of eco-friendly
trawl net in Indonesia
Figure 2. Flow diagram of research and engineering for development of eco-friendly trawl
net in Indonesia
3.2.1 Field experiments
(1) Material and equipment
Materials and equipments used during the fishing trials in Arafura sea as follow : 1) a commercial double-rig shrimp trawler (MV. Laut Arafura) 166 GT (Table 5) 2) a commercial shrimp trawl net installed with BRDs such as TED super shooter,
square mesh windows, and fish eye, (Figure 3 and Figure 4) 3) measuring board 4) container for fish sample 5) fish species identification book 6) balance 7) data sheet for catch composition 8) fishing log book
Research and Engineering Appropriate BRDs
14

Research Methods
9) digital camera 10) handycam, and 11) all equipments available in the vessel (radar, GPS, echo sounder, binocular, radio
communication, etc.).
Table 5
General specification of MV. Laut Arafura
Vessel name MV. Laut Arafura Research/commercial Commercial Length overall (m) 22,56 meters Breadth (m) 7,79 meters Depth (m) 4,26 meters GRT 166 RT Main Engine (HP) 402 HP
The specification of trawl nets used in the experiment is shown in Table 6, while the trawl
net design is attached in the Appendix 1.
Table 6
Specification of trawl net used in the fishing trials
A. Gear data
Code TBS.03.1.5 (ISSCFG – FAO) Type of gear Double rig trawl, 4 seam Number of gears 2 (two) units Net mouth circumference (a) 29 meters Total length (b) 24.9 meters Head rope (l) 18.6 meters Ground rope (m) 22.0 meters Upper wing (c) 6.6 meters, 85 ML, PE 380, 30 Fly Lower wing (d) 8.6 meters, 77 ML, PE 380, 30 Fly Square (d-c) 2.0 meters, 220 ML, PE 380, 30 Fly Body (baiting/belly) (e) 9.1 meters, 220/40 ML (Baiting), PE 380, 30 Fly
200/20 ML (belly), PE 380, 30 Fly Side panel (n) 17.7 meters, 80 ML/20 ML, PE 380, 30 Fly Cod end (f) 7.1 meters, 160 ML, PE 380, 60 Fly Length of ground chain 41.0 meters Otter board type Flat rectangular Otter board size 2.5 m (L) x 1.1 m (B) Weight of otter board 250 kgs
Research and Engineering Appropriate BRDs
13

Research Methods B. Codend data
Mesh size (mm) 44,5 mm (1¾ “) Number of open mesh round 160 ML Cod end length in m 7.1 meters Cod end length in no of meshes 160 MD Mesh type Diamond mesh Cod end material PE 380 d/60 (fly) Knotted/knotless Knotted Twine type Multifilament Twisted/braided twine Twisted Single/double twine Single Twine diameter (mm) 2,30 mm Twine colour Dark green
The specification of three different BRDs i.e., US-TED super shooter, square mesh
windows, and fish eye that used in the experiment is shown in Table 7, while the designs
and constructions are shown in Figure 3, 4, and 5.
Table 7
Specification of BRDs: US-TED super shooter (A), square mesh panel (B), and fish eye (C) used in the experiment
A1. US-TED super shooter Grid length (cm) 120 cm Grid breadth (cm) 90 cm Grid bar shape and size 45 º Grid material Iron Diameters of grid (mm) 16 mm No of element 8 Bar distance (cm) 10 cm Grid setting angle (º) 47,5 º Grid position Front part of cod end
A2. TED super shooter (FAO)
Type Oval Grid length (cm) 120 cm Grid breadth (cm) 90 cm Grid bar shape and size 45º Grid material Aluminium mix steel Diameter of frame 38.1 mm Diameter of grid 25.4 mm Number of element 8 Bar distance 10 mm Grid setting angle (º) 57,1 º Grid position Front of codend
Research and Engineering Appropriate BRDs
16
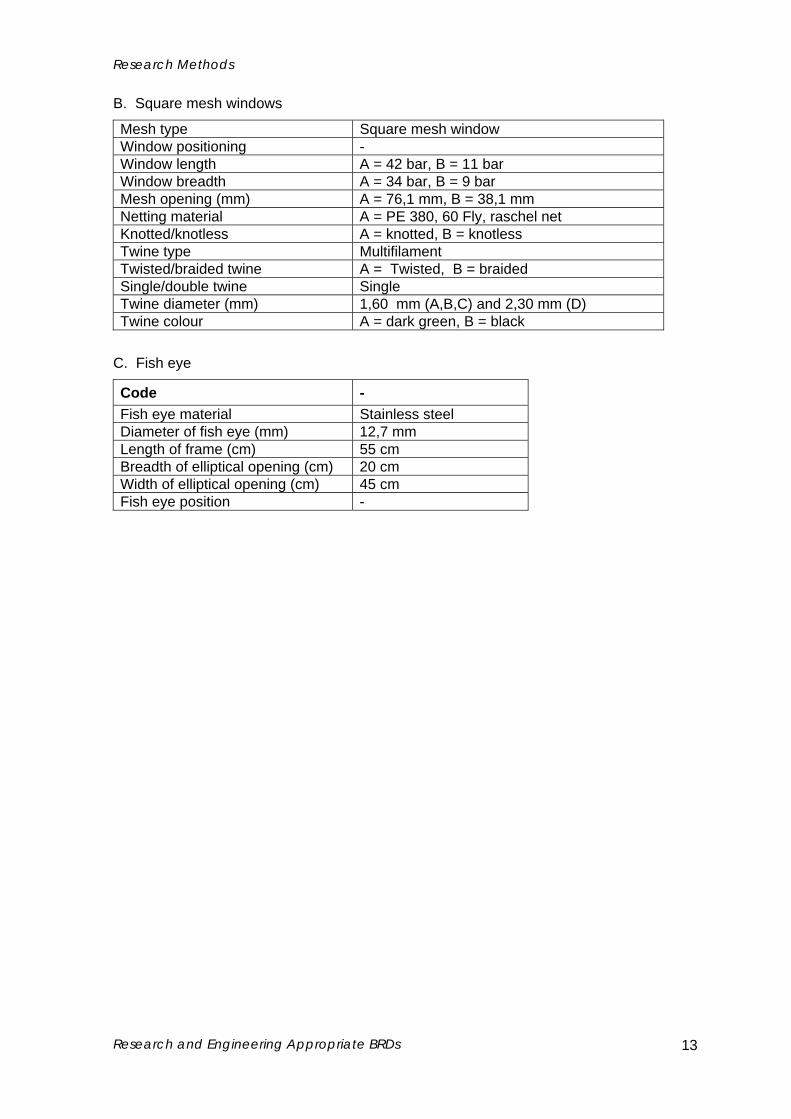
Research Methods B. Square mesh windows
Mesh type Square mesh window Window positioning - Window length A = 42 bar, B = 11 bar Window breadth A = 34 bar, B = 9 bar Mesh opening (mm) A = 76,1 mm, B = 38,1 mm Netting material A = PE 380, 60 Fly, raschel net Knotted/knotless A = knotted, B = knotless Twine type Multifilament Twisted/braided twine A = Twisted, B = braided Single/double twine Single Twine diameter (mm) 1,60 mm (A,B,C) and 2,30 mm (D) Twine colour A = dark green, B = black
C. Fish eye
Code - Fish eye material Stainless steel Diameter of fish eye (mm) 12,7 mm Length of frame (cm) 55 cm Breadth of elliptical opening (cm) 20 cm Width of elliptical opening (cm) 45 cm Fish eye position -
Research and Engineering Appropriate BRDs
13

Research Methods
Figure 3. Design and construction of US-TED super shooter and setting position on the codend
Research and Engineering Appropriate BRDs
18

Research Methods
A
B
A B
Figure 4. Design and construction of square mesh windows and setting position on the codend
Research and Engineering Appropriate BRDs
13

Research Methods
Figure 5. Design and construction of square mesh windows and setting position on the codend
(2) Experimental procedure
The sea trial was started from on boarding the researchers into MV. Laut Arafura in
Merauke fishing base, Papua Province. Fishing operation was carried out in the fishing
ground around Dolak island waters (Figure 1), it tooks about one-day sailing from the
fishing base. The actual fishing operation for the experiment was 6 days, with 6-8 hauls
for sampling purpose per day. The total hauling per day for a common commercial fishing
operation is around 10 hauls.
The BRD effectiveness was determined using the twin trawl net method (Wileman et al.
1996). One trawler tows two similar trawl nets with and without BRD simultaneously side
by side using special rigging. The tested BRD was attached to the other trawl net cod-end
Research and Engineering Appropriate BRDs
20
Research Methods that towed together with trawl net without BRD (control net) to compare the total number
of catch. Thus the reduction of catch by trawl net with BRD could be estimated.
The effects of three different types of BRD (US-TED super shooter, square mesh
windows, and fish eye and) were compared their effectiveness to reduce the by-catch.
Totally, 26 successfully hauls for catch sampling were carried out during day and night
fishing operation with a towing duration of 2 hours as similar to the common commercial
shrimp trawl fishing operation. The number of hauls according to the sea trials for
sampling and date is shown in Table 8.
Table 8
The number of hauls according to the sea trials for sampling and date
Fishing trials for sampling
Date Standard TED vs
US-TED
Control Net vs
US-TED
Control Net vs
Fish Eye
Control Net vs
Square Mesh
2 Dec. 2007 5 hauls
4-5 Dec. 2007 6 hauls
6 Dec. 2007 7 hauls
7 Dec. 2007 8 hauls
The towing speed during trials was between 2.3 and 3.5 knots and the warp length was 5-
12 times the water depth. The trawl net used was the net usually operated by MV. Laut
Arafura with the design as shown in Appendix 2.
(3) Data collection
The catch data from trawl nets equipped with three different BRDs, trawl equipped with
standard TED super shooter used by a commercial fleet in Arafura sea, and trawl net
without BRD (control net) were investigated. The data composes of information regarding
catch weight, number of fish, average catch number per shooting and species
composition, BRD type, and cruise and positional information for each shot. The sub-
sample of each tow was standardized to catch per hour, both in weight and numbers of
individuals. The average catch weight from three different BRDs was sorted into taxonomy
groups for comparison.
Research and Engineering Appropriate BRDs
13

Research Methods After sorting the catch were subdivided into three catch fractions:
1) The large by-catch fraction containing the larger fishes, crabs, starfish, debris etc. 2) The commercial shrimp fraction containing endeavour, tiger, and penaeidae. 3) The non-commercial shrimp. 4) The commercial by-catch containing the larger economic fish.
The body length was measured for all fish to the nearest centimetres. The 10% sub-
sample of the total weight was taken from the tested and the control net.
(4) Data analysis
The technical performance of BRDs during fishing trials was descriptively analyzed based
on information obtained through interviewing fishers and observation data obtained from
direct observation during fishing trials. Four evaluation indicators were used such as (1)
easiness for setting the BRD onto the codend, (2) easiness for hauling the net for each
BRD used, (3) operation successful, and (4) acceptability by fishers. Scoring method was
applied to quantify each technical performance of BRD according to each valuation
indicator. The scores were given based on the scientist justification.
An analysis of non-parametric statistic (Wilcoxon sign test) was performed to test the
significant differences in the average catch from three different BRDs in comparison to the
control net at 95% significant level. From this analysis, the effectiveness of each BRD to
reduce the by-catch was clarified. The analyzed data were presented in tabulation and
graphical format.
3.2.2 Laboratory demonstration
The small scaled codends were installed with three different types of BRDs such as TED
super shooter, square mesh panel, and fish eye (each of 1 set). Three different types of
BRDs was fitted into ¾” mesh codend measuring 80 meshes length and 90 meshes
circumference. Observations of the towing geometry of the three different types of BRDs
and behaviour of fish inside the cod-end were conducted in the flume tank (Figure 7). The
water velocity inside the flume tank was measured by using low atch. An investigation of
the three different types of BRDs was conducted based upon the escapement process of
fish and the performance of the BRDs in the flume tank.
Research and Engineering Appropriate BRDs
22

Research Methods
Figure 6. Laboratory flume tank at Department of Fisheries Resources Utilization, Bogor Agricultural University
Simulation of fish escapement process was conducted by using freshwater fish, i.e. tilapia
(Oreochromis niloticus), catch fish (Pangasius pangasius), and carp (Cyprinus carpio).
The process of fish escapement from TED super shooter, square mesh windows, and fish
eye was observed using handy cam and digital camera.
Table 9.
Laboratory flume tank dimension
Length 10 m Width 4 m Height 1.9 m Channel size 1.2 x 1.2 m Water capacity 48,000 lt Water speed 0.5 – 3 m/s Observation window 3 m x 1m
(1) TED super shooter
The model of TED super shooter was set in the flume tank with the water velocity 0.7 m/s.
The outer frame of the grid constructed from 6 mm steel. The outer height and width of the
grid were measured 26.7 mm and 21.5 mm, respectively. The bars of the grid were
constructed from steel bars of 4 mm diameter. The grid consisted of seven bars, length of
grid 200-270 mm. The TED was an oval shaped grid fitted to the trawl at an angle of about
57o, with bars spacing of 1.9 cm. The two floats Y3H was attached to the top of the grid
frame and measuring buoyancy force 28 grf (to provide slightly positive buoyancy).
Specification of the TED model as shown in Figure 7.
Research and Engineering Appropriate BRDs
13

Research Methods
Figure 7. The small-scaled TED Super Shooter fitted in the codend
(2) Fish eye
The fish eye was constructed from 4 mm steel. The internal opening of the ellipse
measured 215 mm and the circumference measured 285 mm. The length and height of
the fish eye were measured 145 mm and 50 mm, respectively. The one plastic float Y3H
was attached to top of the sides of the ellipse to counter the weight of the steel and hold
the fish eye upright and level. The fish eye was fitted into the codend counted forward 17
½ meshes and 38 meshes backward as shown in Figure 8.
Research and Engineering Appropriate BRDs
24
Research Methods
Figure 8. The small-scaled fish eye fitted in the codend
(3) Square mesh windows
The small-scaled square mesh window was constructed from 2.5” PE 380 d/30 square
mesh measuring 4 x 6 bar length in the middle part. The square mesh 10 b x 15 b from
PE 380 d/30 with the mesh size 1.5 “ was set surrounding the square mesh. Square mesh
was fitted into the codend counted forward 25.5 meshes and 12 meshes backward as
shown in Figure 9.
Research and Engineering Appropriate BRDs
13

Research Methods
Figure 9. The small-scaled square mesh window fitted in the codend
Research and Engineering Appropriate BRDs
26

44 RREESSUULLTTSS
4.1 Technical Performance of BRDs during Fishing Trials
The technical performance of BRDs (US-TED, square mesh window, and fish eye) was
visually observed during sea trials. All fishing operation stages i.e., from setting the BRD
into codend, shooting, towing, hauling, and releasing the catch from codend, were
recorded. We observed that during a successful 26 hauls for sampling the catch,
technically the BRDs showed good performance. The evaluation of technical
performance of BRDs during fishing trials is shown in Table 10.
Table 10
Evaluation of technical performance of BRDs during fishing trials
No. Evaluation indicators US-TEDSquare Mesh
Window Fish Eye
1. Easiness for setting BRD into the codend 4 6 7 2. Easiness for hauling the net for each BRD used 5 7 7 3. Operation successful (no twisted net, no empty
haul, etc.) 7 7 7
4. Acceptability by fishermen 4 7 6 Total Score 20 27 27
Note: Score 1-2 : very low
3-4 : low 5-6 : medium 7-8 : high 9-10 : very high
Considering Table 10, we can explain that for easiness setting and hauling aspects, the
fish eye and square mesh has the highest score, and then followed by US-TED. The
acceptability of BRDs by fishermen showed highest score for square mesh window,
followed by fish eye, and US-TED. Therefore, an overall evaluation result showed that the
best technical performance was fish eye (score 27) and square mesh window (score 27),
and then US-TED (score 20).
Research and Engineering Appropriate BRDs

Results 4.2 Catch Composition of Trawl Net Without and With BRDs
4.2.1 Catch composition of control net and trawl net with US-TED
Catch composition of discarded fish from the control net during fishing trials on 4-5
December 2007, were dominated by Loligo spp 10.85 kg (19%), Terapon theraps 8.95 kg
(15%), Trichiurus lepturus 5.4 kg (9%), Johnius spp 4.90 kg (8%), Pellona ditchela 4 kg
(7%), Polydactillus spp 3.53 kg (6%) and the others species of fish (Figure 10). The total
weight of fish sample was 58.6 kg.
4(7%) 4.9
(8%)
5.4(9%)
3.525(6%)
8.95(15%)3
(5%)
17.975(31%)
10.85(19%)
Loligo spp Terapon theraps Polydactillus sppTrichiurus lepturus Johnius spp Pellona ditchelaArius maculathus Others
Figure 10. Catch composition of discarded fish from control net
The US-TED super shooter influenced on the composition of discarded fish catch. The
catch was dominated by crab 16.10 kg (26%), and followed by Terapon theraps 12 kg
(19%), Trichiurus lepturus 5.45 kg (9%), Johnius spp 4.375 (7%), Pellona ditchela 3.9 kg
(6%) and others species of fishes such as Carangoides spp, Polydactillus spp, etc. with
the total of 28%. The total weight of fish sample was 62.68 kg (Figure 11).
3.2(5%) 3.9
(6%) 4.375(7%)
5.45(9%)
12(19%)
17.65(28%)
16.1(26%)
Crabs Terapon theraps Trichiurus lepturusJohnius spp Pellona ditchela Carangoides sppOthers
Figure 11. Catch composition of discarded fish from trawl net with US-TED
Research and Engineering Appropriate BRDs
28

Results
The total weight and species of fish caught by the US-TED showed increasing weight for
certain species in comparison to the control net. However, some species were decreased
such as Loligo spp from 10.85 kg to 0.25 kg (reduced by 10.6 kg), Dasyatis kuhlli was
reduced by 1.33 kg and Pomadasys maculatus was reduced by 2.1 kg.
The catch composition of economic fish caught by the control net is shown in Figure 12.
The fish comprised of Trichiurus lepturus 133.6 kg (52%), Formio niger 43.95 kg (17%),
and Otolites spp 21.95 kg (8%). The other economic fish caught by the control net were
such as Cynoglossus spp, Caranx iqnobilis, etc. amounted 13.25 kg (approximately 5%
from the number of fish sampled).
13.25(5%) 8.55
(3%)8.25(3%)
19.1(7%)
21.95(8%)
43.95(17%)
7(3%)
6(2%)
133.6(52%)
Trichiurus lepturus Formio nigerOtolites spp Psettodes erumeiCarangoides Caranx iqnobilisCynoglosus spp Priacanthus macracantusOthers
Figure 12. Catch composition of the economic fish from control net
The installment of US-TED influenced on the number and species of economic fish caught.
The fish retained in the codend consisted of Trichiurus lepturus 84.75 kg (41%), Formio
niger 29.6 kg (14%), Otolites spp 19.95 kg (10%), Urapsis urapsis 12.65 kg (6%), and
Psettodes erumei 12.25 kg (6%). Meanwhile, the others fish caught consisted of Alepes
melanoptera, and Scomberomorus commersonii ancounted10% or 19.95 kg (Figure 13).
Research and Engineering Appropriate BRDs
29

Results
19.95(10%)
4.8(2%)
8.5(4%)
29.6(14%)
12.65(6%)
12.25(6%)
19.65(9%)
9.35(4%)8
(4%)
84.75(41%)
Trichiurus lepturus Otolites spp Psettodes erumeiUrapsis urapsis Formio niger Carangoides sppCaranx iqnobilis Decapterus ruselli Cynoglosus sppOthers
Figure 13. Catch composition of economic fish from trawl net with US-TED
4.2.2 Catch composition of control net and trawl net with square mesh window
Catch composition of discarded fish from the control net during fishing trials on 6-7
December 2007 was dominated by crab 25.4 kg (35%), Setipinna spp 9.45 kg (13%),
Pellona ditchella 9 kg (13%), Johnius spp 4.7 kg (7%), Trichiurus lepturus 3.9 kg (5%),
and some other fish species approximately 21% from the total fish sampled (Figure 14).
4.7(7%) 3.9
(5%)
2.2(3%)
2.075(3%)
9.45(13%)
9(13%)
14.92(21%)
25.4(35%)
Crabs Setipinna spp Carangoides sppUrapsis urapsis Trichiurus lepturus Johnius sppPellona ditchela Others
Figure 14. Catch composition of discarded fish from control net
The use of square mesh window influenced on the total weight and number of discarded
fish species. The total catch was dominated by crab 45.5 kg (58%), Setipinna spp 7 kg
(9%), Johnius spp 4.18 kg (5%), Pellona dicthella 3.9 kg (5%), Trichiurus lepturus 3.55 kg
(4%), and others species of fish approximately 16% from the total fish sampled (Figure
15).
Research and Engineering Appropriate BRDs
30

Results
45.5(58%)
12.44(16%)
7(9%)
2.745(3%) 3.55
(4%)4.175(5%)
3.9(5%)
Crabs Setipinna spp Carangoides sppTrichiurus lepturus Johnius spp Pellona ditchelaOthers
Figure 15. Catch composition of discarded fish from trawl net with square mesh window
The catch composition of economic fish from the control net was dominated by Otolites
spp 68.75 kg (35%), Cynoglossus spp 40.9 kg (20%), Trichiurus lepturus 33.6 kg (17%),
Platycephalus spp 10.15 kg (5%), and some other fish such as Megalaspis cordila, and
Urapsis urapsis approximately 6% (200.25 kg) from the total weight (Figure 16).
7.9(4%)
68.75(35%)
22.25(11%)
10.15(5%)
40.9(20%)
4(2%) 12.7
(6%)33.6
(17%)
Trichiurus lepturus Cynoglosus spp Platycepalus sppCarangoides spp Otolites spp M egalaspis cordilaUrapsis urapsis Others
Figure 16. Catch composition of economic fish from control net
The installment of the square mesh window on the trawl net codend has influenced on the
total weight of economic fish. The total catch was dominated by Otolites spp 44.1 kg
(31%), Trichiurus lepturus 27 (19%), Alepes melanoptera 19.4 kg (14%), Cynoglossus spp
17.4 kg (12%), Platycephalus spp 11.7 kg (8%), Megalaspis cordila 10.55 kg (7%), and
other species of fish such as Muraenesox bagio, and Ephinephelus spp approximately
143.6 kg (16%) from the total weight (Figure 17).
Research and Engineering Appropriate BRDs
31

Results
10.55(7%)
44.1(31%)
19.4(14%)
11.7(8%)
17.4(12%)
4.85(3%)
8.6(6%)
27(19%)
Trichiurus lepturus Cynoglosus spp Platycephalus sppAlepes melanoptera Otolites spp Megalaspis cordilaUrapsis urapsis Others
Figure 17. Catch composition of economic fish from trawl net with square mesh window
4.2.3 Catch composition of control net and trawl net with fish eye
The catch composition of the control net during fishing trials were dominated by crab 49
kg (54%), Thryssa setrirostris 8.25 kg (9%), Johnius spp 6.55 kg (7%), Pellona ditchela
4.4 kg (5%), Illisa melastoma 4.03 kg (4%), and others species such as Leiognathus spp,
Harpadon nehereus, Terapon theraps, and Arius maculatus approximately 15% from the
total weight of by-catch (Figure 18).
8.25(9%)
13.26(15%)
2.85(3%)
49.00(54%)
6.55(7%)
4.03(4%)
4.40(5%)
3.05(3%)
Thryssa setrirostris Crabs Johnius sppIllisa melastoma Pellona ditchela Pomadasys maculatusFormio niger Others
Figure 18. Catch composition of discarded fish from control net
The installment of fish eye on the trawl net has influenced on the catch composition of
discarded fish. The catch was dominated by Urapsis urapsis 35.65 kg (51%), Arius
maculatus 8.3 kg (12%), Setipinna spp 5.65 kg (8%), Illisa melastoma 4.63 kg (7%),
Research and Engineering Appropriate BRDs
32

Results Apogon spp 2.5 kg (4%), and other species approximately 15% from the total fish
sampled (Figure 19).
2.15(3%)
2.5(4%)
8.3(12%)4.63
(7%)
35.65(51%)
10.12(15%)
5.65(8%)
Setipinna spp Urapsis urapsis Illisa melastomaArius maculathus Apogon spp Upeneus sulfureusOthers
Figure 19. Catch composition of discarded fish from trawl net with fish eye
The catch composition of economic fish from the control net comprised of Trichiurus
lepturus 26 kg (38%), Polidactylus spp 11.7 kg (17%), Megalaspis cordila 9.85 kg (15%),
Cynoglosus spp 5.9 kg (9%), Carcharinus spp 5.1 kg (8%), and other species such as
Formio niger, Epinephelus spp, Carangoides spp, and some other fish in small quantity
(Figure 20).
2.9(4%)
5.1(8%)
5.9(9%)
9.85(15%)
11.7(17%)
6(9%) 26
(38%)
Trichiurus lepturus Polidactilus spp Megalaspis cordilaCynoglosus spp Carcharinus spp Formio nigerOthers
Figure 20. Catch composition of economic fish from control net
The installment of fish eye on the trawl net has influenced on the catch composition of
economic fish retained. The catch composition was dominated by Trichiurus lepturus
28.40 kg (42.77%), then followed by Otolites spp 22.35 kg (33.66%), Carcharinus spp
5.15 kg (7.76%), Cynoglossus spp 3.40 kg (5.12%), and other species in a small quantity
(Figure 21).
Research and Engineering Appropriate BRDs
33

Results
3.95(6%)
3.15(5%)3.4
(5%)5.15(8%)
22.35(34%)
28.4(42%)
Trichiurus lepturus Otolites spp Carcharinus sppCynoglosus spp Polidactilus spp Others
Figure 21. Catch composition of economic fish from trawl net with fish eye
4.3 Effectiveness of BRDs in Reducing By-catch
4.3.1 Catch composition
On the comparison of catch between trawl net without BRD (control net) and trawl net with
US-TED showed the numbers of species identified from the control net were 24 species.
Whilst, the numbers of species identified from the trawl net with US-TED were 28 species
(Figure 22). There was decreasing in weight of fish from total sampled for three species
i.e., Loligo spp. (99.79%, from 10.86 kg to 0.25 kg), Rastrellliger kanagurta (100%, all
being escaped), and Dasyatis kuhlli (81.29%, from 2.9 kg to 1.6 kg). The decreasing fish
weight number was occurred for 4 species i.e., Formio niger (98.47%, from 43.95 kg to
29.6 kg), Muraenesox bagio (100%), Psettodes erumei (96.64%, from 19.1 kg to 12.25 kg),
and Carangoides (95.59%, from 8.25 kg to 3 kg).
The comparison of total catch between control net and trawl net with fish eye showed the
number of species in a control net were 31 species, while for the trawl net with fish eye
were 26 species (Figure 22). The number of fish catch was decreased for 10 species i.e.,
Formio niger (93.23%, from 2.85 kg to 0.55 kg), crabs (99.88%, from 49 kg to 2.95 kg),
Pomadasys maculatus (99.46%, from 3.05 kg to 0.05 kg), Trichiurus lepturus (88.75%,
from 2.45 kg to 0.67 kg), and Pellona ditchela (99.48%, from 4.4 kg to 4.1 kg). Meanwhile,
Thryssa setrirostris, Cynoglossus spp, Harpadon nehereus, Carangoides spp, Euristhmus
lepturus, and Johnius spp were not found in the codend.
The total weight of fish was decreased for 6 species i.e., Polydactilus spp. (97.70%, from
11.7kg to 3.14 kg), Megalaspis cordila (98.40%, from 9.85 kg to 1.55 kg). While, the
Research and Engineering Appropriate BRDs
34

Results others species such as Formio niger, Priachantus spp, Carangoides spp, and Alepes
melanoptera were not found in the codend.
The comparison between control net and trawl net with square mesh windows showed the
number of species in the control net were 33 species. While, the numbers of species in
the trawl net with square mesh windows were 33 species (Figure 22). The total weight of
fish was decreased for 5 species i.e., Setipinna spp. (92.16%, from 9.45 kg to 7 kg),
Urapsis urapsis (97.93%, from 2.2 kg to 0.1 kg), Megalapsis cordila (65.73%, from 1.57 kg
to 0.85 kg, Pellona ditchela (95.19%, from 9 kg to 3.9 kg, and Leiognathus spp. (23.61%,
from 0.6 kg to 0.27 kg).
The number of fish weight was decreased for 5 species i.e., Carcharinus spp. (95.15%,
from 3.8 kg to 0.7 kg), Trichiurus lepturus (97.61%, from 33.7 kg to 27 kg), Cynoglossus
spp (98.96%, from 40.9 kg to 17.4 kg), Carangoides spp (99.60%, from 22.25 kg to 2 kg),
Otolites spp (99.07%, from 68.75 kg to 44.1 kg), and Rachicentron canadus were not
found in the codend.
The comparison of species number between standard trawl net used by Indonesian
shrimp trawler in Arafura sea and trawl net with US-TED, showed the number of species
for the standard TED was 38 species. Meanwhile, the number of species from the trawl
net with US-TED was 37 species (Figure 22). The number of fish catch was decreased for
4 species i.e., Thryssa mistax (95.79%, from 9.25 kg to 3.6 kg), Arius thallasinus (91.72%,
from 6.95 kg to 4 kg), Dasyatis kuhlli (96.15%, from 8.9 kg to 3.05 kg, and Pellona ditchela
(98.44%, from 16.3 kg to 4.15 kg).
The numbers of fish weight was decreased for 5 species i.e., Formio niger (97.84%, from
13 kg to 3.65 kg), Carcharinus spp (92.23%, from 7.65 kg to 4.55 kg), Lates calcarifer
(98.05%, from 16 kg to 5 kg), Polydactilus spp. (98.63%, from 39.55 kg to 21.4 kg),
Otolites spp. (98.07%, from 26.95 kg to 14 kg). The reduction of species number within
BRDs can be seen in Figure 23.
Research and Engineering Appropriate BRDs
35

Results
05
10152025303540
Contro
l
US-TED
Standard
TED
US-TED
Contro
l
Fish ey
e
Contro
l
Square
mes
h wind
ows
Num
ber (
Spec
ies)
Figure 22. Comparison of species number reduction by BRDs used in trawl net
Figure 23. The reduction of species number within BRDs
4.3.2 Catch Weight
(1) Catch comparison between control net and trawl net with US-TED
From the comparison of average catch obtained during 7 hauls showed that the catch of
trawl net without BRD (control net) was 382.32±27.15 kg, lower than the catch of trawl net
with US-TED (395.05±20.16 kg) as shown in Figure 24. The average catch from every
towing showed that the lowest catch occurred on the towing number 6 (216.75 kg) (Figure
25).
Research and Engineering Appropriate BRDs
36

Results
From the statistical analysis (Wilcoxon sign test) showed that the comparison of catch
between control net and trawl net with US-TED was not significant difference (Asymp. sig.
(2-tailed) 0.753 > α (0.05) ).
050
100150200250300350400450500
Control net Trawl net with TED
Wei
ght (
kg)
Total fish capturedTotal shrimp captured
Figure 24. Average catch of control net and trawl net with US-TED
Fig
0
100
200
300
400
500
600
1 2 3 4 5 6Tow Number
Wei
ght (
kg)
Total fish captured by control net Total shrimp captured by control netTotal fish captured by US-TED Total shrimp captured by US-TED
Figure 25. Catch of control net and trawl net with US-TED according to towing number
Comparison of the average weight of shrimp catch between control net and trawl net with
US-TED showed that the catch from control net (1.5±0.21 kg) was insignificantly different
to the catch from trawl net with US-TED (1.01±0.17 kg) as show in Figure 26.
Research and Engineering Appropriate BRDs
37

Results
0.000.200.400.600.801.001.201.401.601.802.00
Average Shrimp Captured
Wei
ght (
kg)
Control net Trawl net with US-TED
Figure 26. Average catch of shrimp from the control net and trawl net with US-TED
The total weight of shrimp catch for every towing showed a fluctuation with the highest
catch of 3.25 kg for towing number 6 (Figure 27). Conversely, shrimp was not found on
towing number 5.
0.000.501.001.502.002.503.003.50
1 2 3 4 5 6Tow Number
Wei
ght (
kg)
Total shrimp captured by control net Total shrimp captured by trawl net with TED
Figure 27. The catch of shrimp from control net and trawl net with TED per towing
(2) Comparison of catch weight between control net and trawl net with fish eye
The comparison of average catch weight obtained during 7 hauls showed that the catch
from control net was 346.95±8.53 kg, higher than the catch weight from trawl net with fish
eye (299.94±13.33 kg) as shown in Figure 28. The average catch of fish according to
towing number showed the lowest catch was on towing number 7 (230.77 kg) as
presented in Figure 29.
Statistical analysis (Wilcoxon sign test) between control net and trawl net with fish eye
showed a significant difference as indicated by test value of Asymp. sig (2-tailed) 0.237 >
α (0.05).
Research and Engineering Appropriate BRDs
38

Results
0
118
236
354
472
Control net Trawl net with Fish Eye
Wei
ght (
kg)
Total fish captured
Total shrimp captured
Figure 28. The average catch of control net and trawl net with fish eye
0
100
200
300
400
500
600
1 2 3 4 5 6 7Tow Number
Wei
ght (
kg)
Total fish captured by fish eye Total shrimp captured by fish eye
Total fish captured by control net Total shrimp captured by control net
Figure 29. The comparison of catch between control net and trawl net with fish eye according to towing number
The average catch of shrimp for control net was 2.60±0.26 kg, insignificantly different
compared to the average catch of trawl net with fish eye (2.10±0.51 kg) as shown in
Figure 30.
Research and Engineering Appropriate BRDs
39

Results
0.00
0.50
1.00
1.50
2.00
2.50
3.00
3.50
Average Shrimp Captured
Wei
ght (
kg)
Control net
Traw l net w ith f ish eye
Figure 30. The average catch of shrimp from control net and trawl net with fish eye
The total weight of shrimp for every towing showed variation with the highest catch was 5
kg for towing number 7. Conversely, the shrimp caught were not found on towing number
1 (Figure 31).
0.00
1.00
2.00
3.00
4.00
5.00
6.00
7.00
1 2 3 4 5 6 7Tow Number
Wei
ght (
kg)
Total shrimp captured by standard net Total shrimp captured by fish eye
Figure 31. The catch of shrimp from control net and trawl net with fish eye for every towing
(3) Comparison of catch weight between control net and trawl net with square mesh window
The comparison of average catch between control net and trawl net with square mesh
window obtained during 8 hauls showed that the catch of control net was 382.88±13.65 kg,
higher than the catch of trawl net with square mesh windows (369.65±8.44 kg) as shown
in Figure 32. The average fish catch for every towing showed the lowest catch number on
towing number 4 (237.37 kg). The average catch for every towing is presented in Figure
33.
Research and Engineering Appropriate BRDs
40

Results Statistical analysis (Wilcoxon sign test) showed that the comparison of catch from control
net and trawl net with square mesh windows was not significant different as indicated by
Asymp. sig. (2-tailed) 0.484 > α (0.05).
0
50
100
150
200
250
300
350
400
450
Control net Traw l net w ith square meshw indow s
Wei
ght (
kg)
Total f ish capturedTotal shrimp captured
Figure 32. Average catch of control net and trawl net with square mesh windows
0
100
200
300
400
500
600
1 2 3 4 5 6 7 8Tow Number
Wei
ght (
kg)
Total fish captured by square mesh Total shrimp captured by square meshTotal fish captured by control net Total shrimp captured by control net
Figure 33. Catch of control net and trawl net with square mesh window for every towing
The average catch of shrimp from control net (0.80±0.15 kg) was insignificant different in
comparison to the catch of trawl net with square mesh windows (0.62±0.12 kg) as shown
in Figure 34.
Research and Engineering Appropriate BRDs
41

Results
0.000.10
0.200.30
0.40
0.50
0.60
0.700.80
0.901.00
Average Shrimp Captured
Wei
ght (
kg)
Control net (without BRD)
Trawl net with squaremesh windows
Figure 34. The average catch of shrimp from control net and trawl net with square mesh windows
The catch of shrimp for every towing showed a variation with the highest catch was 3.71
kg on towing number 1, while shrimp was not found on towing number 5 and 6 (Figure 35).
0.00
0.50
1.00
1.50
2.00
2.50
3.00
3.50
4.00
1 2 3 4 5 6 7 8Tow Number
Wei
ght (
kg)
Total shrimp captured by control netTotal shrimp captured by square mesh
Figure 35. The catch of shrimp from control net and trawl net with square mesh windows for every towing
(4) Comparison of catch weight between trawl net with standard TED and US-TED
The comparison of average catch weight obtained during 5 hauls showed that the catch
weight of trawl net with standard TED was 183.63±14.53 kg. It was higher than the catch
weight of trawl net with US-TED (154.93±12.18 kg) as shown in Figure 36. The average
catch weight for every towing showed that the lowest average catch was 171.3 kg for
towing no. 3 (Figure 37).
Research and Engineering Appropriate BRDs
42

Results
0
50
100
150
200
250
Standard TED US-TED
Wei
ght (
kg)
Total fish capturedTotal shrimp captured
Figure 36. The average weight of trawl net with standard TED and US-TED
0.00
50.00
100.00
150.00
200.00
250.00
300.00
1 2 3 4 5Tow Number
Wei
ght (
kg)
Total fish captured by standard TED Total shrimp captured by standard TEDTotal fish captured by US-TED Total fish captured by US-TED
Figure 37. The total weight of trawl net with standard TED and US-TED for every towing
The average weight of shrimp from trawl net with standard TED (0.365±0.07 kg) was
insignificantly different compared to the average weight from trawl net with US-TED
(0.355±0.07 kg) as shown in Figure 38.
Research and Engineering Appropriate BRDs
43

Results
00.050.1
0.150.2
0.250.3
0.350.4
0.450.5
Average Shrimp Captured
Wei
ght (
kg)
Standard TEDUS-TED
Figure 38. The average weight of shrimp from trawl net with standard TED and US-TED
The weight of shrimp for every towing showed a variation with the highest shrimp catch
was 0.90 kg on towing no. 1, while shrimp was not found on towing no. 5 (Figure 39).
0.000.100.200.300.400.500.600.700.800.901.00
1 2 3 4 5
Tow Number
Wei
ght (
kg)
Total shrimp captured by standardTEDTotal shrimp captured by US-TED
Figure 39. The weight of shrimp from trawl net with standard TED and US-TED for every towing
4.3.3 Catch Value
(1) Comparison of catch value between control net and trawl net with US-TED
The total weight of catch from trawl net without BRD (control) was 1.468, 68 kg, consisted
of main target catch (shrimp) and by-catch. The by-catch of economic valued fish was
utilized and non economic valued fish was discarded. From the Figure, it can be seen
that proportion of shrimp catch was 0.46% (6.72 kg). The utilized of by-catch was 261.65
Research and Engineering Appropriate BRDs
44

Results kg or 17.82% from the total catch. The number of discarded by-catch was higher than
those shrimp and utilized by-catch mentioned above which reached 81.72% or 1200 kg.
The use of TED on trawl net has influenced on the catch number for both main target
catch and the by-catch. The total catch was 1,534.25 kg, consisted of 0.30% (4.55 kg
shrimp), 13.34% fish that was utilized such as economic value fish (204.70 kg), and
discarded by-catch that was not utilized (86.36% or 1,325.00 kg).
0.46%17.82%
81.72%
Shrimp Retained Fish Catch Retained Fish Discarded
0.30%13.34%
86.36%
Shrimp Retained Fish Catch Retained Fish Discarded
Figure 40. The comparison of catch value between control net and trawl net with US-TED
According to the catch values mentioned above, the catch was not significantly different
between the control net and trawl net with US-TED. However, there was decreasing in
number of economic fish species on trawl net with US-TED by 56.95 kg (21.77%).
(2) Comparison of catch value between control net and trawl net with fish eye
The total catch of control net was 2,642.75 kg, composed of the main catch and the by-
catch species. The main catch of shrimp was 19.95 kg (0.75%) from the total catch.
While, the utilized by-catch was 168.80 kg (6.39%), and the rest of 2.454 kg (92.86%) was
discarded by-catch.
The use of fish eye influenced on the total catch. This fact can be seen from the
decreasing in total catch number that reached 354.54 kg. The total catch from trawl net
with fish eye was 2,288.21 kg, composed of 15.71 (0.69%) kg shrimp, 88.05 kg (3.85%)
utilized by-catch, and 2,181.45 kg (95.47%) discarded by-catch.
Research and Engineering Appropriate BRDs
45

Results
6.39%0.75%
92.86%
Shrimp Retained Fish Catch Retained Fish Discarded
95.47%
3.85%
0.69%
Shrimp Retained Fish Catch Retained Fish Discarded
Figure 41. The comparison of catch value between control net and trawl net with fish eye
Considering the comparison of total catch number, the use of fish eye influenced on the
decreasing in fish catch number by 13.36%. Partially, the use of fish eye decreased the
number of important economic fish with amount of 47.84% and decreased discarded by-
catch species by 10.94%. The use of fish eye also decreased the average catch number
by 13.215 % per towing.
(3) Comparison of catch value between control net and trawl net with square mesh windows
The catch of control net was 3,456.35 kg consisted of shrimp as main catch and fish as
by-catch. The shrimp catch was 6.10 kg (0.18%) from total catch, while number of utilized
fish was 200.25 kg (5.79%) and unutilized by-catch was 3,250 kg (94.03%).
The use of square mesh windows influenced on the number of catch. Total catch weight
was 3,248.35 kg, composed of shrimp 4.75 kg (0.15% from total catch). While, economic
fish that entered into the cod-end was 143.60 kg (4.42%). The total weight of unutilized or
as categorized non economic fish reached 3,100 kg (95.43% from the total catch).
94.03%
0.18%5.79%
Shrimp Retained Fish Catch Retained Fish Discarded
95.43%
0.15%4.42%
Shrimp Retained Fish Catch Retained Fish Discarded
Figure 42. The comparison of catch value between control net and trawl net with square mesh window
Research and Engineering Appropriate BRDs
46

Results According to the data mentioned above, the use of square mesh windows in general could
decrease the number of fish caught until 5.99%. Moreover, the number of economic fish
was decreased by 28.29%, while for non economic fish was only 4.62% decreasing.
(4) Comparison of catch value between trawl net with standard TED and US-TED
The total catch of trawl net with standard TED was 1,014.45 kg, comprising of shrimp as
main catch and fish as the by-catch. The catch of shrimp from the trawl net with standard
TED was 4.2 kg (0.41% from total catch). While, total catch of fish was 1,010.25 kg of
which the utilized fish was 123.35 kg (12.16%), and discarded fish was 886.9 kg (87.43%
from the total catch).
The use of US-TED on trawl net could reduce the total catch. The total catch of trawl net
with US-TED was 817.18 kg, comprising of shrimp 4.93 kg (0.6%), utilized fish 93.65 kg
(11.46%), and unutilized fish 718.6 kg (87.94% from the total catch).
0.60%11.46%
87.94%
Shrimp Retained Fish Catch Retained Fish Discarded
0.41%12.16%
87.43%
Shrimp Retained Fish Catch Retained Fish Discarded
Figure 43. The comparison of catch value between trawl net with standard TED and US-TED
From Figure 43, it can be explained that the use of US-TED could reduce the catch by
198 kg (10.86%) in total, and also the utilized fish decreased by 29.7 kg (13.69%), while
non economic fish decreased by 168.3 kg (10.48%).
Overall evaluation on the effectiveness of BRDs tested (US-TED, Square Mesh Window,
Fish Eye) to reduce the by-catch can be explained by comparing the by-catch reduction
level among the BRDs. The US-TED failed to reduce bycatch, therefore it increased the
bycatch up to 4.66% in comparison to the control net. The square mesh window could
reduce the by-catch up to 5.98%, and the fish eye reduced the bycatch up to 13.36%. All
the BRDs, however, influenced to shrimp lost with the highest percentage occurred on the
US-TED, followed by the square mesh window, and the fish eye as shown in Table 11 and
Appendix-16 to Appendix-19.
Research and Engineering Appropriate BRDs
47

Results Table 11.
The by-catch reduction and shrimp loss of the BRDs tested compared to the control net
Percent reduction by weight US-TED
Square Mesh
Window Fish Eye
By-catch reduction -(4.66)* 5.98 13.36 Shrimp loss 32.29 22.13 21.25
*) The bycatch increase compared to the control net.
4.4 Flume Tank Demonstration
Flume tank demonstration on the performance of three different types of BRDs showed a
significant technical performance and escaping behavior of fish. The function of grid in
TED super shooter directed for large animals and the unwanted animal to be excluded
from the trawl. The grid angle has a strong relationship with grid size and is one of the
most critical factors influencing TED efficiency. Typically grid angle is between 45º and
60º (Eayrs 2005). The small-scaled TED super shooter was 57.1o, suitable for allowing the
unwanted animal to escape. From the observation showed that the grid angle was not
changed by increasing the water velocity. The grid was constructed with an outer frame to
which parallel bars were welded. During the observation some small fish pass through the
grid and enter into the codend. The downward excluding grid seemed to be difficult for fish
to escape. Moreover, the double flapper also obstructing the fish to escape. This may be
caused by the thickness of the double flapper from PE 380 d/6.
4.4.1 Escapement level of fish
Observation on the escapement level of fish for each BRD were carried out by estimating
the numbers of fish for both released and retained fish by each BRD. The observation was
conducted by different size of fish which categorized into (T, K, S and B) with 3 times
replications for each type of BRD. The total of 40 fish was investigated with the same
proportion for each type of BRD.
The result of observation in the flume tank showed that the square mesh could release
more fish than fish eye and TED with the numbers of fish 17, 15, and 12 individuals,
respectively. The escapement level of fish from the square mesh window was 42.5%, fish
eye 37.5% and TED 30% from the total of experimental fish. The escapement level data
on the flume tank can be seen in Table 9.
Research and Engineering Appropriate BRDs
48

Results The square mesh codend has the higher escapement level compared with the fish eye
and TED. This probably due to the different position of the exit hole from each type of
BRDs. The square mesh window consists of 24 exit hole with remain opened during the
observation that made easily for fish to release. Meanwhile, the fish eye construct only
from one ellipse exit hole. This condition make difficult for fish to escape mainly for the fish
which visual axis fore-upper. The escapement mechanism of TED super shooter is totally
different compared with square mesh and fish eye.
Table 12 The average escapement level of experimental fish from three different type of BRDs
TED Square mesh Fish eye Length Released Retained % Released Retained % Released Retained % T 2 8 20 3 7 30 2 8 20 K 4 6 40 5 5 50 3 7 30 S 3 7 30 4 6 40 5 5 50 B 3 7 30 5 5 50 5 5 50
Whereas :
T : the total length of fish 0-30 mm, height 0-10 mm and width 0-5 mm K : the total length of fish 30-50 mm, height 10-15 mm and width 5-7mm S : the total length of fish 50-65 mm, height 15-20 mm and width 7-12 mm B : the total length of fish 65-95 mm, height 20-25 mm and width 12-17 mm.
4.4.2 Behavior of the experiment fish
(1) TED super shooter
Fish behavior of experimental fish during escape from the net equipped by three different
types of BRDs was observed in the flume tank. Response of fish approaching the TED
divided into two categorized involves of response of fish with the width of fish smaller than
grid space and response of fish with the width of fish bigger than grid space.
The escapement mechanisms of fish with body width smaller than the grid space divided
into : (1) fish passing through the grid and retained in the codend, (2) fish passing through
the front part of grid than escape through the exit hole, (3) fish release pass through the
exit hole because of a big size of fish blocking the grid, (4) fish blocking onto the grid
horizontally or caudal ventral of fish, (5) fish blocking onto the grid then release from exit
hole. The escapement process of experimental fish from the TED can be seen in Figure
44.
Research and Engineering Appropriate BRDs
49

Results
Figure 44. The escapement process of experimental fish from the TED
The group of fish with the body width bigger than the grid space can be categorized into:
(1) fish pass through the codend by using the nasal part, (2) fish pass through the codend
by using the ventral part then rotate the body 900 and push forward by the current and
retained in the codend, (3) fish approaching the TED then push forward by the current,
and release through the exit hole. The process of fish with the body width bigger than the
grid space can be seen in Fugure 45.
Figure 45. The process of fish with the body width bigger than the grid space
(2) Square mesh window
Response of fish approaching the square mesh to release could be divided into four
categorized such as (1) fish release through the exit hole mainly by fishes with the small
size (T and K) by swimming vertically without changing position the body against x axis,
(2) fish pass through the exit hole from the codend with the escapement angle between
30-600 against x axis, (3) fish released pass through the square mesh from the front part
with the escapement angle between 30-600 and, (4) fish can not pass through the square
mesh because the body width bigger than the square mesh. The escapement process of
experimental fish during the observation can be seen in Figure 46.
Research and Engineering Appropriate BRDs
50
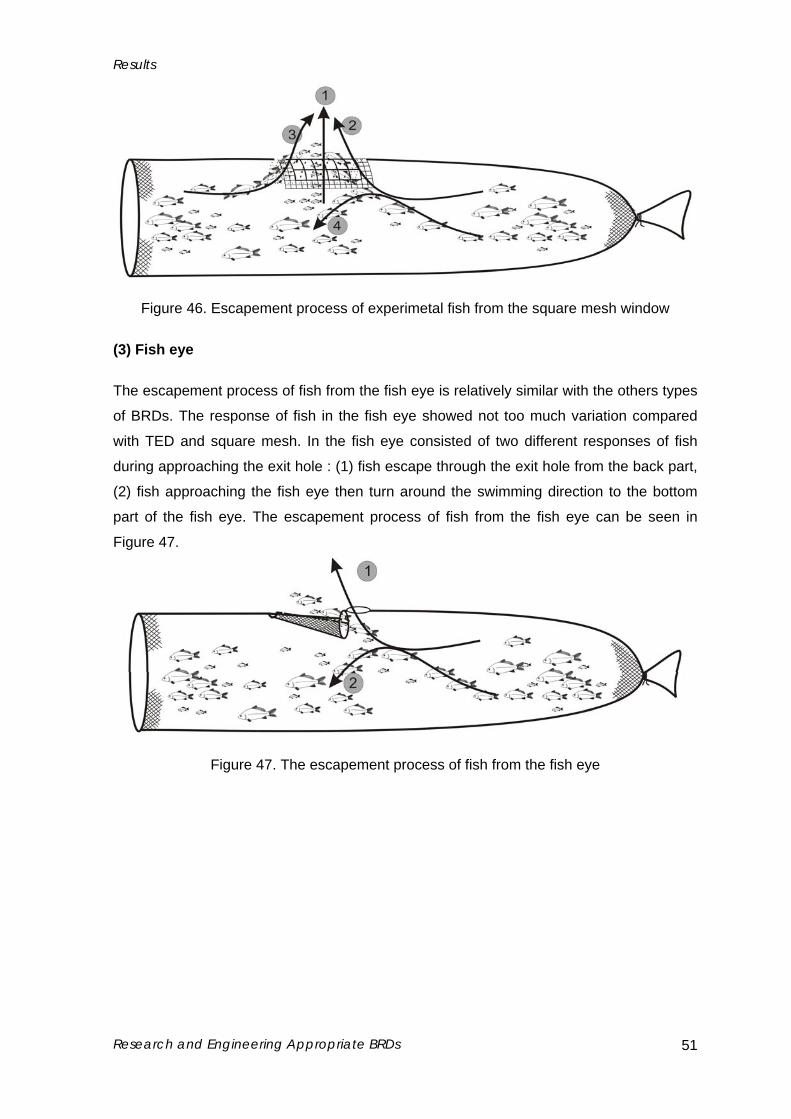
Results
Figure 46. Escapement process of experimetal fish from the square mesh window
(3) Fish eye
The escapement process of fish from the fish eye is relatively similar with the others types
of BRDs. The response of fish in the fish eye showed not too much variation compared
with TED and square mesh. In the fish eye consisted of two different responses of fish
during approaching the exit hole : (1) fish escape through the exit hole from the back part,
(2) fish approaching the fish eye then turn around the swimming direction to the bottom
part of the fish eye. The escapement process of fish from the fish eye can be seen in
Figure 47.
Figure 47. The escapement process of fish from the fish eye
Research and Engineering Appropriate BRDs
51

55 DDIISSCCUUSSSSIIOONNSS
5.1 Technical Performance of BRDs during Fishing Trials
Trawl net equipped with the by-catch reduction device (BRD) here in after referred as
shrimp trawl (“pukat udang” in Indonesia language) has been used legally based on the
Presidential decree No. 85/1982 that took effect from 24 December 1982. This decree
explain that shrimp trawl was permitted to use in the waters of Kei island, Tanimbar, Aru,
Irian Jaya, and Arafura sea with geographical coordinate of 130º E to the eastern, except
for coastal waters of those islands limiting by 10 m isobath. The first introduced BRD in
Indonesia shrimp trawl fishery was by-catch excluder device (BED), a modification of box-
shaped US-TED. In line with development of new BRD design and construction in the
world, recently the used of BED has been changed with a new type of turtle excluder
device (TED) super shooter. Even with the new developed TED super shooter, however,
most of the shrimp trawler abuses this law by taking out the device during fishing
operation, except for inspection needed only by the government fisheries authority.
Concerning this, there are some identified obstacles and problems of TED implementation,
such as technically, the use of TED frequently cause fail of the net operation; weakness of
monitoring, controlling, and surveillance (MCS) as well as law enforcement (Purbayanto et
al. 2004); decrease significantly the catch of shrimp as main target species (Evans and
Wahju 1996; Nasution 1997; DJPT-DKP, 2005).
The explanation mentioned above can be the reason why technical performance of US-
TED during fishing trials was not good compared to square mesh window and fish eye as
shown in Table 10. The low technical performance of the US-TED is due to low scores in
easiness setting and hauling, and acceptability by the fishers. Beside that, US-TED has a
similar design and construction with standard TED recently used by Indonesian shrimp
trawler in Arafura sea. The different was on material used which was aluminum pipe for
US-TED and massive iron for standard TED. The lighter US-TED gave a little bit simple in
handling compared to the standard TED. While, the square mesh window and fish eye
showed similar good technical performance due to their high scores in mostly valuation
criteria.
Research and Engineering Appropriate BRDs
Discussions 5.2 Catch Composition of Trawl Net without and with BRDs
Demersal marine fish resource inhabiting near coastal water have a high diversity
compared to pelagic fish resource (Mahiswara 2004). The biodiversity of marine resource
can be a determinant factor of catch composition of the shrimp trawl. It can be clarified
from the catch composition of the trawl that is not only caught shrimp as a target species
but also fish as by-catch. Instead of the biodiversity of marine resource, the operation
method of trawl which is swept and towed over the sea bottom also supports this condition.
The number of fish and crustacean caught in the codend can be an indication of diversity
of the marine resource in sampling sites. The total number of species identified consisted
of 45 species of fish, 2 species of shrimp and some species of crab. From 45 species of
fish, 21 species included economic species and highly price fish that can be utilized for
income generating to the fishermen instead of the main catch.
5.2.1 Trawl without and with TED
Implementation of BRD namely TED super shooter have no significant effect to the
composition of the total catch. This can be shown from the number of species caught from
the trawl net without BRD (control net) in comparison to the trawl net with TED super
shooter. The objective of installing the TED is to reduce the unwanted catch. However, the
result of this research showed that the total catch of the trawl net with TED was higher
than the total catch of the control net. The 36 species was caught in the trawl net with US-
TED consisted of 23 species of utilized fish and 13 species of fish categorized as
economic fish. Meanwhile, the 41 species fish was caught from the control net comprised
of 25 species of discarded non-economic fish and 16 species of economic retained fish.
This is probably due to the construction of TED super shooter was designed to release
turtle and other large animal. So the TED super shooter was not effective to release the
small fish with body girth smaller than the grid space used. Escaping mechanism of fish
from the TED occurred for fish with high swimming ability and the ability to escape was
from the bottom part of the TED. Moreover, for the fish with the body girth was bigger than
the grid space, they may hit the grid then sustained swim for a while to escape from the
exit hole.
For the small fish with low swimming ability, they will swim passively into the codend.
Even though, installment of the TED on trawl net has an effect in reducing a certain
Research and Engineering Appropriate BRDs
53

Discussions species of fish and the total weight of economic fish caught. The three species were
reduced in term of total weight such as Formio niger, Trichiurus lepturus, and Loligo spp.
5.2.2 Trawl without and with square mesh window
The mechanism of square mesh windows are directed to fish with fore-upper visual
orientation to escape from the square mesh window. The square mesh windows in the
trawl net have no significant effect to the composition of fish caught. The 41 species of
fish were caught from the control net consisted of 25 species of discarded and 16 species
of retained fish. Meanwhile, in the trawl net with square mesh windows the numbers of
species caught were 43 species consisted of 27 species of discarded and 16 species
retained fish.
The square mesh window installed in the upper part of the codend may give possibility for
fish with good swimming and resistant against the current to escape from the codend
during towing. Some species of fish caught involved demersal fish of low swimming ability,
so they could not escape through the square mesh windows on upper part of the codend.
Even though, the square mesh windows showed that some retained fish species were
decreased in term of the total weight such as Cynoglossus spp, Carangoides spp, and
Otolites spp.
5.2.3 Trawl without and with fish eye
The fish eye that installed in trawl net has an affect to the number of species caught. The
numbers of species caught were 38 species which consisted of 25 species of fish
discarded and 13 species of fish retained. Meanwhile, the install of fish eye have an affect
to the numbers of species caught. The 31 of species were caught from the trawl net with
fish eye, which consisted of 20 species of fish discarded and 11 species of fish retained.
The escape mechanisms of fish are relatively similar with the square mesh window. For
both BRD are depended upon the swimming ability of fish to escape from the exit hole.
The fish eye constructs only a single hole. During towing, the water flow will open the
codend and in the same time the fish eye also opened. In that time the fish with high
swimming ability escape through the exit hole. The position of fish eye may influence to
the numbers of fish released.
Referrring to the numbers of species of fish being released was higher than the TED and
the square mesh windows. The fish eye was reduced 7 species of fish such as Thryssa
Research and Engineering Appropriate BRDs
54

Discussions setrirostris, Harpadon nehereus, Johnius spp, Alepes melanoptera, Formio niger,
Euristhmus lepturus and Triachantus spp.
5.3 Effectiveness of BRDs in Reducing By-catch
In general, most of capture fisheries contributes the by-catch, some fisheries especially
shrimp trawl, however contribute a large quantity of the by-catch compare to other
fisheries. This condition is due to that the shrimp trawl categorized as more effective gear
for capturing shrimp as well as demersal fish. From the construction aspect, shrimp trawl
has a codend with relatively small mesh size so that many other marine organism of
various size are caught as the by-catch.
The dominant by-catch of shrimp trawl is mostly demersal fish species of high economic
value. A high by-catch number can be influenced by factor of population number of each
fish species caught. Beside that, the fishing operation is conducted by sweeping and
dragging the net over sea bottom that cause many shrimp and also demersal fish species
are caught. This demersal fish inhabit sea bottom area together with penaeid shrimp in
one ecosystem due to their interaction on food web (Riyanto 2005).
Problems occurred on trawl fisheries are due to many by-catch discarded to the sea. To
reduce these by-catch, the trawl net equipped with By-catch Reduction Device (BRD) so
that to increase it’s selectivity performance. From the research reported by
Chokesanguan et al. (1996) in Thailand and Renaud et al. (1993) in USA showed that the
use of BRD could significantly reduce the by-catch volume. The use of TED super
shooter type could reduce 40% by-catch, but loss of shrimp as main target catch reached
30% (Nasution 1977).
From the fishing trials that have been successfully done in the water around in Dolak
Isaland, Arafura Sea showed that the use of BRD could reduce the catch species
composition especially for pelagic fish species such as Carangoides. This species has a
better swimming ability than demersal fish species of small sized fish. The BRD
construction has been made to give high probability of by-catch for escaping due to the
occurrence of current mechanism or collision to grids (Mahiswara 2004). Moreover, Day
(1996) in his research revealed that during operation there are current turbulence inside
the trawl net, further being directed to grids frame. This condition support large sized fish
and fish with high swimming speed to escape through opening window. While, small fish
with low swimming speed are drifted by current to enter into the codend part.
Research and Engineering Appropriate BRDs
55

Discussions From the observation during research showed that there is some other factors influence
by-catch number that escaped from trawl, namely grids covering (masking effect). The
grids covering are mainly due to sea bottom trash/garbage or big sized fish. This
condition can not be avoided by the trawl because shrimp as target species inhabit in the
sea bottom habitat associated with other demersal fish species.
The catch during fishing trials gave figure on high diversity of fish species caught by the
trawl, which was 45 species could be identified. Factor of position and water depth station
for fishing operation supposed to influence the number, kind, and size of catch. On the
shrimp trawl fishery, some factors such as shape and size of mesh, codend diameter,
hanging ratio, fish availability, water condition, speed and duration of towing can be
influenced to the by-catch number. During fishing operation, the shape and size of mesh
of the trawl net will change, for instant the mesh of net will close when towing process.
The mesh opening as the influence of given hanging ratio value will be changed in shape
due to towing and weighing effect on the codend part. Beside the mesh opening, other
factor that also give influence to the by-catch is a blocking effect on the codend part due
to catch inside the codend part (Ferno and Olsen 1994).
Comparison between shrimp and fish catch is a fishing ratio. This ratio is the comparison
between shrimp caught and by-catch in every hauling. Based on the analysis result from
26 hauls, it can be estimated that the fishing ratio of retained shrimp, retained fish, and
discarded fish between the control net and trawl net with US-TED was 1:13:86, the control
net and trawl net with square mesh window was 1:4:95, and the control net and trawl net
with fish eye was 1:4:95. The high comparison value between shrimp and by-catch can
be due to some following factors (Purbayanto and Riyanto 2005);
(1) Shrimp trawl has an active character, that is to catch fish by towing the net so that
many non target fish also caught,
(2) Fishing operation is conducted in shallow water of 10-35 m depth, it means that
mouth opening of shrimp trawl net is able to sweep most of waters column,
indicated by pelagic fish caught.
(3) Shallow water is a habitat of fish for feeding, spawning, and nursery activities, so
that many young and small fish to be caught.
(4) The bottom of Arafura sea to have a flat surface condition because of continental
shelf and muddy bottom substrate that is a habitat for demersal fish species, and
(5) Fishing operation of shrimp is generally not implemented the use of By-catch
Reduction Device (BRD) especially Turtle Excluder Device as the government
regulation, so that many non target fish become caught.
Research and Engineering Appropriate BRDs
56
Discussions There are no decreasing in total catch number on trawl without BRDs (control net) and
trawl with US-TED. This condition due to the construction of TED with bigger grids will
effective only for turtle and big sized fish for being able to escape from the trawl, while
small fish still enter into the codend.
Decreasing in total catch occurred on the trawl with fish eye against the control net by
350.30 kg (13.36%), the trawl with square mesh window against the control net by 206.65
kg (5.99%). This condition supposed that the construction of fish eye having enough
bigger the escape hole so that giving the possibility for fish with good visual acuity and
swimming ability to escape through the escape hole. While, during towing process, the
mesh of square mesh window still kept opening so that the swimmer fish with size less
than the square mesh opening can escape from the codend side.
Research and Engineering Appropriate BRDs
57
66 CCOONNCCLLUUSSIIOONNSS AANNDD
RREECCOOMMMMEENNDDAATTIIOONNSS
6.1 Conclusion
1. The square mesh window and fish eye showed similar good technical performance
as indicated by high scores of three observation indicators i.e., the easiness
setting of BRD into the codend, easiness hauling the net, and acceptability by the
fishers in comparison with the US-TED. The US-TED has better technical
performance compared to the standard TED, particularly from the view point of
material used that give a little bit simple in handling compared to the standard TED.
2. The total number of species identified during sea trials of 26 successful hauls
consisted of 45 species of fish, 2 species of shrimp, and some species of crabs.
From those species of fish, 21 species categorized as the economic fish that were
utilized by the fishers.
3. The fish eye has high effectiveness in reducing bycatch up to 13.36%, and then
followed by square mesh window (reduced the bycatch up to 5.98%). The US-TED,
however, failed to reduce the bycatch (conversely increased the bycatch by
4.66%). All the BRDs used influenced on the shrimp loss i.e., 21.25% for the fish
eye, 22.13% for the square mesh window, and 32.29% for the US-TED.
4. Flume tank observation from the three different types of BRDs showed a
significant technical performance and escaping behavior of fish. The highest
escapement of fish was from square mesh window. Whilst the TED super shooter
and fish eye have low escapes. The position of fish eye and exit hole of the TED
super shooter has an effect to the escapement process. The TED grid angle of
57.1º was suitable for allowing the unwanted animal to escape.
Research and Engineering Appropriate BRDs

Conclusions and Recommendations
6.2 Recommendation
Based upon the result of the study it can be recommended that three different BRDs can
be implemented. Although we need further study to increase the effectiveness of the
square mesh and fish eye mainly to decide the appropriate position of those BRDs on the
codend for optimum function of the BRDs to reduce the bycatch. Further research need
to be conducted in long duration of fishing trials that representing the fishing season.
Research and Engineering Appropriate BRDs 59

RREEFFEERREENNCCEESS
Agency for Assessment and Application of Technology (AAAT). 1982. Fishing Experiment on Pukat Amerika (BED-e quipped shrimp net) in the Arafura Sea, AAAT, 1982, 7p (in Indonesian).
Alverson DC and Hughes SE. 1996. By-Catch From Emotion 60 Effective Natural Resource Management. Review in Fish Biology and Fisheries. Chapman and Hall. Pp 443-46.
Chokesanguan B, Yuttana T, S Ananpongsuk, Siriraksophon S, Podapol L, Aosomboon P and Ali R. 1997. The Experiments on Turtle Excluder Devices (TEDs) for Shrimp Trawl Nets in Thailand, Regional Workshop on Responsible Fishing, Bangkok, Thailand, 24-27 June 1997, SEAFDEC/RESF/97/WP.6: 43 pp.
Day G. 1996. A Functional Assassment of Nordmore Grid as a By-catch Reduction Device for Australian Prawn Trawl Fisheries. Australian Maritime College. Australia.
Evans SM, Wahju RI. 1996. The Shrimp Fishery of the Arafura sea (eastern Indonesia). Fisheries Research, 26: 365-371.
Eayrs S. 2004. Reducing Turtle Mortality in Shrimp-trawl Fisheries in Australia, Kuwait and Iran. Papers Presented at the Expert Consultation on Interactions Between Sea Turtles and Fisheries Within an Ecosystem Context, Rome, 9-12 March 2004. FAO Fisheries Report No. 738, supplement firm/r738. p 179-194.
Ferno A and Olsen S. 1994. Marine Fish Behaviour in Capture Abudance Estimation. Fishing News Book. London. Pp: 69-81.
Steele P, Bert TM, Johnston KH and Levett S. 2002. Efficiency of By-catch Reduction Devices in Small Otter Trawls Used in the Florida Shrimp Fishery. Fish. Bull. 100: 338-350. p. 338-350.
Mitchell JF, Watson JW, Foster DG and Caylor RE, 1995, The Turtle Excluder Device (TED): A guide to better performance, NOAA Technical Memorandum NMFS-SEFSC-366, April 1995, 35p.
Mahiswara and Widodo AA. 2005. Trawl fisheries in Indonesia (Case study: Malacca strait, South China sea, and Arafura sea) in Symposium proceeding of present status trawl in Indonesia waters “Discover the eco-friendly trawl in Indonesia” (Endroyono ed.). Department of Marine Affairs and Fisheries, Jakarta.
Mahiswara. 2004. By-catch Composition of Shrimp Trawl with TED Super Shooter. Bogor. Graduate School. Bogor Agricultural University.
Nasution C, Nugroho D and Jamal R. 1983. Fishing experiment on BED-trawl in Cilacap waters in October 1982, Mar. Fish. Res. Rep. No. 25 - 1983, RIMF, Jakarta, p. 63-78.
Nasution C. 1995, By-catch in commercial shrimp fishing with gears other than /raw/ in Indonesia, paper presented at the FAO Workshop on Research in Fishing Gear and Methods Selectivity in Southeast Asia, Chendering, Malaysia, 28-30 May 1995, 54p.
Nasution C. 1997a. Highlight of shrimp trawling in the Arafura Sea: fleet, shrimp catch and export in 1995 and 1996, paper presented in the FAO Workshop on selective shrimp trawling with selective device, Darwin, Australia, 24-26 July 1997, 22p.
Research and Engineering Appropriate BRDs

References Nasution C. 1997b. Preliminary fishing experiment on the use of Turtle Excluder Device
(TED) in commercial shrimp trawling in the Arafura Sea, paper presented in the FAO Workshop on selective shrimp trawling with selective device, Darwin, Australia, 24-26 July 1997, 22p.
Nasution C. 1997c. Industrial Shrimp Fishing and Aplication of Selective Shrimp Fishing Gear, in Relation to Code of Conduct for Responsible Fisheries. Research Institute for Marine Fisheries. Jakarta.
Oravetz CA and Grant CJ. 1986. Trawl efficiency device shows promise, Australian Fisheries, Vol.45 No. 2, February 1986, p. 37-40.
Prado J. 1993. Selective shrimp-catching devices: a review, INFOFISH International No. 1/93,January/February 1993, p. 54-60.
Purbayanto A, Wisudo SH, Santoso J, Wahyu RI, Dinarwan, Zulkarnain, Sarmintohadi, Nugraha AD, Soeboer DA, Pramono B, Marpaung A, Riyanto M. 2004. Pedoman Umum Perencanaan dan Pemanfaatan Hasil Tangkap Sampingan Pukat Udang di Laut Arafura Provinsi Papua. Jakarta. Dinas Perikanan dan Kelautan Provinsi Papua dan PT Sucofindo. 68 p
Purbayanto A and Riyanto M. 2005. The Operation of BED Shrimp Trawl at Day and Night Time: Effect to the By-Catch in Arafura Sea Papua. Maritek Volume 5. Bogor. Pp 29-41.
Renaud M, Gitschlag G, Klima E, Shah A, Koi D, and Nance J. 1992. Loss of shrimp by Turtle excluder devices (TEDs) in coastal waters of the United States, North Carolina to Texas: March 1988-August 1990, Fishery Bulletin, US, 91:129-137(1993), p. 129-137.
Robins J and Campbell M. 1997. History of By-catch Reduction Devices (BRDs) Development in Australia, paper presented in FAO Workshop on selective shrimp trawling with selective devices, Darwin, Australia, 24-26 July 1997, 5p.
Robins JB, Campbell MJ and McGilvray JG. 1999. Reducing Prawn-trawl By-catch in Australia: An Overview and an Example from Queensland. Marine Fisheries Review 61(3). p 46-55
Robins-Troeger JB. 1994. Evaluation of The Morrison Soft TED: Prawn and By-catch Variation in Moreton Bay, Queensland. Fish. Res.19:205-217
Sainsbury JC. 1996. Commercial Fishing Methods: an Introduction to Vessels and Gears 3rd edition. Oxford: Fishing News Books, p.238-255
Shiode D and Tokai T. 2004. A Review of Development, Modification and Implementation of TED (Turtle Excluder Device) to Reduce Sea Turtle By-catch in Trawl Fisheries. Papers Presented at the Expert Consultation on Interactions Between Sea Turtles and Fisheries Within an Ecosystem Context, Rome, 9-12 March 2004. FAO Fisheries Report No. 738, supplement firm/r738. p 171-177
Watson JW, Mitchell JF and Shah AK. 1986. Trawling Efficiency Device: A New Concept for Selective Shrimp Trawling Gear. Mar. Fish. Rev., 48.
Wileman DA, Ferro RST, Fonteyne R, and Millar RB. 1996. Manual methods of measuring the Selectivity of Towed Fishing Gears. ICES Cooperative Research report No 215. International Council for the Exploration of the Sea. Denmark.
Research and Engineering Appropriate BRDs
61

AAPPPPEENNDDIICCEESS
Appendix-1. Fishing unit specification used during sea trials Vessel Name:
KM Laut Arafura Date start: 01/12/ 2007 Date end : 08/12/2007
Vessel Identification Number
1990 MMa NO. 303/N Number of tows completed
32 Vessel HP 402 HP
Vessel Length (m)
24.95 x 7.7 x 3.4
Y N Single trawl Commercial fishing vessel
√
Type of trawl arrangement used Double rig
trawl √
Net type Semi ballon Headrope (m)
18 Quad rig trawl
Mesh size in trawl
2 inch Mesh size in codend
1 3/4 inch Ground rope length (m)
21.5
Chafing gear: Length of codend (meshes)
160 Codend material (PE or PA)
PE
Pendant rope length
Upper 7 m Lower 7.30 m
Otter board (LxH) m
250 x 125 Circumference of codend (meshes)
520
Towing Speed (knots)
2.5 – 3.3 Water depth range
8 - 48 Otter board weight (kg) in air
600
Approx. Latitude
S 7o01’ Name of fishing ground
Dolak Island waters, Arafura Sea
Approx. Longitude
E 137o20’
Research and Engineering Appropriate BRDs

Appendices Appendix-2. Design of double rig shrimp trawl net used in fishing trials
Research and Engineering Appropriate BRDs
AP-2
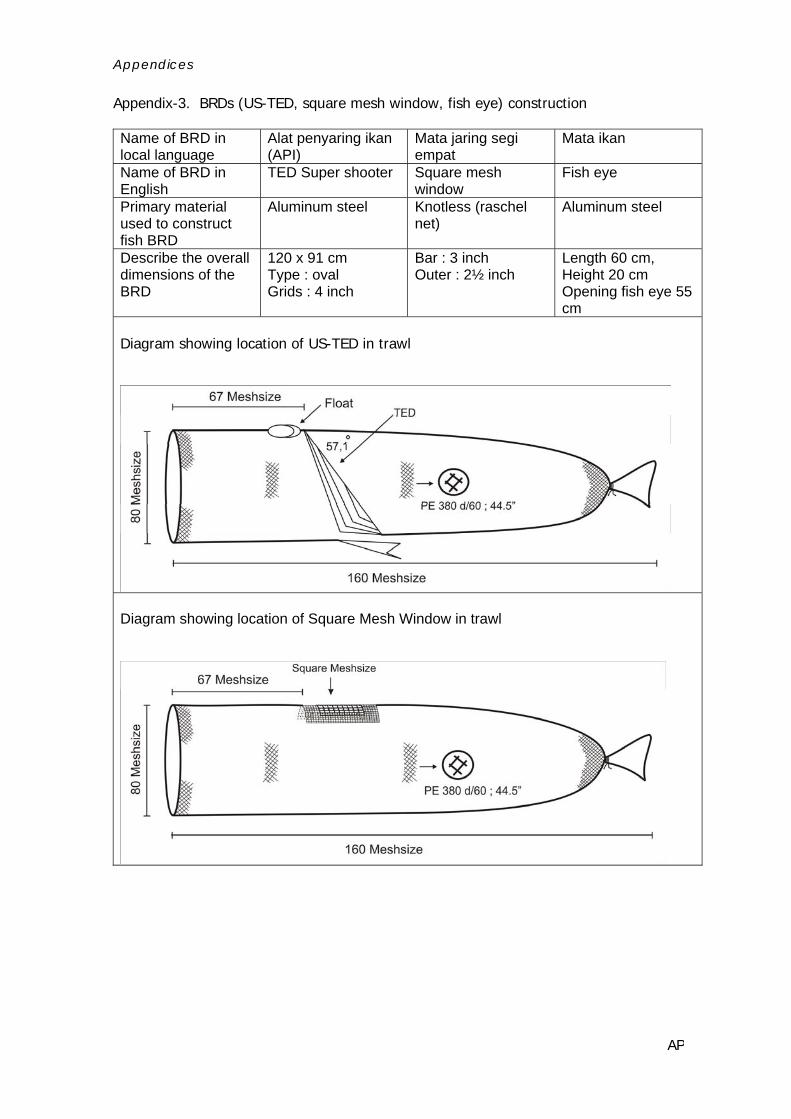
Appendices Appendix-3. BRDs (US-TED, square mesh window, fish eye) construction Name of BRD in local language
Alat penyaring ikan (API)
Mata jaring segi empat
Mata ikan
Name of BRD in English
TED Super shooter Square mesh window
Fish eye
Primary material used to construct fish BRD
Aluminum steel Knotless (raschel net)
Aluminum steel
Describe the overall dimensions of the BRD
120 x 91 cm Type : oval Grids : 4 inch
Bar : 3 inch Outer : 2½ inch
Length 60 cm, Height 20 cm Opening fish eye 55 cm
Diagram showing location of US-TED in trawl
Diagram showing location of Square Mesh Window in trawl
Research and Engineering Appropriate BRDs
AP-3

Appendices Appendix-3. (continued)
Research and Engineering Appropriate BRDs
AP-4

Appendices Appendix-4. Vessel (MV. Laut Arafura) used during sea trials
Appendix-5. The vessel working arrangement for net setting and hauling
Research and Engineering Appropriate BRDs
AP-5

App
Res
endices
earch and Engineering Appropriate BRDs A
Appendix-5. The BRDs (US-TED, square mesh window, and fish eye) set in the codend
US-TED Square Mesh Fish Eye
P-6

Appendices
Appendix-6. Fishing ground in Arafura sea
Research and Engineering Appropriate BRDs
AP-7

Appendices
Appendix-7. Bridge Log Fishing Operation by Trawl in Arafura Sea
Time Setting position Haulling position
Date StationSetting Haulling
Towing Duration
(h) Latitude Longitude Latitude Longitude
Warp Deepth Speed Weather Information
TED Amerika 1 05.15 7.15 2.00 08º38'069" 138º28'244" 08º37'750" 138º26'243" 150 27 2.5 C sampling 2 07.30 9.45 2.15 08º37'353" 138º26'475" 08º35'861" 138º23'505" 110 16 3 C sampling 3 10.00 12.4 2.40 08º35'701" 138º23'443" 08º34'310" 138º30'900" 100 10 3.1 C sampling 4 12.30 14.3 2.00 08º34'302" 138º31'019" 08º32'364" 138º36'832" 80 8.8 3.3 C sampling
12/2/2007
5 15.30 16.45 1.15 08º32'134" 138º40'660" 08º32'483" 138º45'295" 80 9.1 3.5 C sampling TED
1 09.15 10.20 1.05 08º43'104" 138º23'600" 08º43'900" 138º20'360" 195 47.9 3.5 C sampling 12/4/2007 2 21.00 22.10 1.10 08º08'195" 137º25'104" 08º04'902" 137º27'080" 80 8.9 3.2 C sampling 3 23.20 00.30 1.10 07º58'942" 137º28'731" 07º56'237" 137º29'810" 100 11.2 2.6 C sampling 4 02.30 03.40 1.10 07º45'525" 137º29'081" 07º42'691" 137º29'272" 100 13.8 2.6 B Not sampling 5 03.50 05.15 2.05 07º42'263" 137º29'430" 07º40'776" 137º32'724" 110 14.1 2.7 B Not sampling 6 05.25 06.50 1.25 07º40'746" 137º33'746" 07º39'804" 137º36'406" 110 15 2.6 B sampling 7 07.10 08.30 1.20 07º38'907" 137º35'581" 07º37'533" 137º34'019" 110 15 2.8 C sampling
12/5/2007
8 11.40 13.40 2.00 07º29'054" 137º52'310" 07º28'403" 137º57'838" 110 14 2.8 C sampling FISH EYE
1 14.25 16.30 2.05 07º27'613" 137º59'597" 07º25'829" 138º01'063" 110 14 3.1 C sampling 2 16.40 18.30 2.30 07º26'350" 138º00'530" 07º29'610" 137º57'747" 110 15 2.6 C sampling 3 18.45 20.45 2.00 07º29'000" 137º57'110" 07º25'910" 137º59'662" 110 14 2.5 C sampling
12/5/2007
4 21.15 23.15 2.00 07º24'895" 138º02'051" 07º22'148" 138º07'555" 110 15 3 C sampling 5 00.30 02.30 2.00 07º15'273" 138º09'715" 07º09'962" 138º10'028" 125 19.3 2.7 C sampling 6 02.40 04.30 2.30 07º09'211" 138º10'068" 07º04'704" 138º10'427" 125 19.5 2.8 C Not sampling 7 04.45 06.25 2.20 07º04'217" 138º10'933" 07º02'783" 138º11'270" 125 21.7 2.7 C sampling
12/6/2007
8 07.00 08.30 1.30 07º03'359" 138º07'812" 07º06'050" 138º02'802" 130 22 3.1 C sampling
Research and Engineering Appropriate BRDs
AP-8

Appendices
Research and Engineering Appropriate BRDs
AP-9
Appendix-7. (continued)
Time Setting position Haulling position
Date StationSetting Haulling
Towing Duration
(h) Latitude Longitude Latitude Longitude
Warp Deepth Speed Weather Information
SQUARE MESH 1 09.10 10.55 1.45 07º06'569" 138º01'725" 07º10'395" 137º56'905" 130 21 3.2 C sampling 2 11.15 13.00 2.25 07º11'078" 137º56'138" 07º16'080" 137º53'355" 130 20 2.8 C sampling 3 13.10 14.50 1.40 07º16'588" 137º53'043" 07º20'848" 137º50'227" 125 18 3.1 C sampling 4 15.35 17.30 2.35 07º25'269" 137º41'778" 07º29'068" 137º45'639" 110 15.8 2.5 H sampling
12/6/2007
5 18.40 20.35 2.35 07º34'675" 137º42'708" 07º39'048" 137º41'195" 110 16 2.4 C sampling
6 23.45 00.35 0.55 07º52'366" 137º21'972" 07º58'340" 137º26'635" 110 14.5 3.1 C Not
sampling
7 01.50 04.05 2.55 07º59'271" 137º20'421" 07º02'182" 137º22'319" 110 15.4 3.3 C Not
sampling 8 04.15 06.10 2.35 07º01'533" 137º21'430" 07º00'065" 137º20'638" 110 14.9 2.5 C sampling 9 07.30 09.15 2.25 08º07'883" 137º25'188" 08º11'900" 137º26'137" 80 10 3.5 C sampling
10 09.45 11.00 1.55 08º12'175" 137º26'695" 08º14'050" 137º27'080" 75 6 2.3 C sampling
12/7/2007
11 16.15 18.15 2.00 08º40'057" 137º31'980" 08º41'769" 137º36'312" 150 26 2.5 C Not
sampling

Appendices Appendix-8. Catch sampling composition of control net and trawl net with TED on December 4-5, 2007
Control Net Trawl Net with TED No. Indonesian Name Scientific Name Weight
(kg) Percent
(%) Weight
(kg) Percent
(%) 1. Beloso Saurida spp 0.525 0.90 0.95 1.522. Bulu ayam Setipinna spp 0 0.00 0 0.003. Bulu ayam Thryssa setirostis 2.75 4.69 1.9 3.034. Carangid Urapsis urapsis 0 0.00 0.275 0.445. Crab - 0.275 0.47 16.1 25.696. Cumi Loligo spp 10.85 18.52 0.25 0.407. Gerot-gerot Pomadasys maculatus 2.2 3.75 0.1 0.168. Japuh Dussumieria acuta 0 0.00 0.025 0.049. Kembung Rastrelliger kanagurta 0.25 0.43 0 0.00
10. Kerong Terapon theraps 8.95 15.27 12 19.1511. Kuniran Upenus sulphureus 0.65 1.11 0.2 0.3212. Kurisi Nemipterus nematophorus 0.15 0.26 0.25 0.4013. Kuro Polydactillus spp 3.525 6.02 2.425 3.8714. Layur Trichiurus lepturus 5.4 9.22 5.45 8.7015. Lidah Cynoglosus spp 1.7 2.90 1.2 1.9116. Manyung Arius maculathus 3 5.12 2.2 3.5117. Mata Besar Priacanthus maculatus 0.25 0.43 0.625 1.0018. Nomei Harpadon spp 0.85 1.45 0.95 1.5219. Pari Dasyatis kuhlli 2.925 4.99 1.6 2.5520. Petek Leiognathus spp 0.4 0.68 1.075 1.7221. Selar Alepes melanoptera 0.7 1.19 0.7 1.1222. Selar Carangoides spp 1.55 2.65 3.2 5.1123. Sembilang Eurithalmus lepturus 0 0.00 0 0.0024. Slengseng Megalaspis cordila 0 0.00 0 0.0025. Tembang Illisa melastoma 0 0.00 0.025 0.0426. Tiga waja Johnius spp 4.9 8.36 4.375 6.9827. - Herklotsichtis spp 1.8 3.07 1.4 2.2328. - Pellona ditchela 4 6.83 3.9 6.2229. - Platycephalus spp 0 0.00 0 0.0030. - Polynemus spp 1 1.71 1.5 2.39
Total fish sampling 58.6 62.675
Research and Engineering Appropriate BRDs
AP-10

Appendices Appendix-9. Catch sampling composition of economically species from control net and trawl
net with TED on December 4-5, 2007
Control Net Trawl Net with TED No. Indonesian Name Scientific Name Weight
(kg) Percent
(%) Weight
(kg) Percent
(%) 1. Bawal hitam Formio niger 43.95 16.80 29.6 14.462. Carangides Urapsis urapsis 0 0.00 12.65 6.183. Cucut Carcharinus spp 0 0.00 2.7 1.324. Kerapu Ephinephelus spp 0 0.00 0 0.005. Kue Caranx iqnobilis 8.55 3.27 9.35 4.576. Kuro Polidactilus spp 4.35 1.66 3.35 1.647. Layang Decapterus ruselli 2.9 1.11 8 3.918. Layur Trichiurus lepturus 133.6 51.06 84.75 41.409. Lidah Cynoglosus spp 7 2.68 4.8 2.34
10. Mata besar Priacanthus macracantus 6 2.29 4 1.9511. Parang-parang Rachicentron canadus 0 0.00 0 0.0012. Remang Muraenesox bagio 1.5 0.57 0 0.0013. Sebelah Psettodes erumei 19.1 7.30 12.25 5.9814. Selar Alepes melanoptera 0.9 0.34 0.45 0.2215 Selar Carangoides spp 11.85 4.53 11.5 4.1516. Slengseng Megalaspis cordila 0 0.00 0 0.0017. Tenggiri Scomberomorus commersoni 0 0.00 1.25 0.6118. Tiga waja Otolites spp 21.95 8.39 19.65 9.60
Platycepalus 0 0.00 0.4 0.20Total fish catch 261.65 204.7
Research and Engineering Appropriate BRDs
AP-11

Appendices Appendix-10. Catch sampling composition of control net and trawl net with square mesh
windows on December 6-7, 2007
Control Net Trawl Net with Square Mesh
Windows No. Indonesian Name Scientific Name Weight
(kg) Percent
(%) Weight
(kg) Percent
(%) 1. Beloso Saurida spp 0.1 0.14 0.31 0.392. Bulu ayam Setipinna spp 9.45 13.19 7 8.833. Bulu ayam Thryssa setrirostris 0.29 0.40 0.65 0.824. Buntal Diodon spp 0 0.00 1 1.265. Carangid Urapsis urapsis 2.2 3.07 0.1 0.136. Crab 25.4 35.45 45.5 57.377. Gerot-gerot Pomadasys maculatus 1.125 1.57 0.425 0.548. Kembung Rastrelliger kanagurta 0 0.00 0 0.009. Kerong Terapon theraps 0.125 0.17 0.05 0.0610. Kuniran Terapon theraps 0.875 1.22 0.05 0.0611. Kuro Polydactillus spp 0.925 1.29 0.675 0.8512. Layur Trichiurus lepturus 3.9 5.44 3.55 4.4813. Lidah Cynoglosus spp 1.915 2.67 1.26 1.5914. Manyung Arius maculathus 2.65 3.70 2.25 2.8415. Mata Besar Priacanthus maculatus 0.05 0.07 1.025 1.2916. Nomei Harpadon nehereus 0.1 0.14 0.25 0.3217. Pari Dasyatis kuhlli 0.35 0.49 0.86 1.0818. Petek Leiognathus spp 0.6 0.84 0.275 0.3519. Selar Alepes melanoptera 0.4 0.56 0.4 0.5020. Selar Carangoides spp 2.075 2.90 2.745 3.4621. Sembilang Euristhmus lepturus 0 0.00 0.2 0.2522. Slengseng Megalaspis cordila 1.575 2.20 0.85 1.0723. Tembang Illisa melastoma 2.68 3.74 1.225 1.5424. Tiga waja Johnius spp 4.7 6.56 4.175 5.2625. Herklotsichtis spp 0.36 0.50 0.125 0.1626. Pellona ditchela 9 12.56 3.9 4.9227. Platycephalus spp 0.05 0.07 0.06 0.0828. Polinemus spp 0.75 1.05 0.4 0.50
Total Sampling 71.645 79.31
Research and Engineering Appropriate BRDs
AP-12

Appendices Appendix-11. Catch sampling composition of economically species from control net and trawl
net with square mesh windows on December 6-7, 2007
Control Net Trawl Net with Square Mesh
Windows No. Indonesian Name Scientific Name
Weight (kg)
Percent (%)
Weight (kg)
Percent (%)
1. Bawal hitam Formio niger 0.6 0.30 1.35 0.942. Carangid Urapsis urapsis 4 2.00 4.85 3.383. Cucut Carcharinus spp 3.8 1.90 0.7 0.494. Kaakan Pomadasys spp 0 0.00 0.25 0.175. Kerapu Ephinephelus spp 1.25 0.62 1.75 1.226. Kuro Platycepalus spp 10.15 5.07 11.7 8.157. Layur Trichiurus lepturus 33.6 16.78 27 18.808. Lidah Cynoglosus spp 40.9 20.42 17.4 12.129. Mata besar Priacanthus macracantus 0.575 0.29 0.85 0.59
10. Parang-parang Rachicentron canadus 0.35 0.17 0 0.0011. Remang Muraenesox bagio 0.95 0.47 0.2 0.1412. Selar Alepes melanoptera 3.175 1.59 19.4 13.5113. Selar Carangoides spp 22.25 11.11 2 1.3914. Slengseng Megalaspis cordila 7.9 3.95 10.55 7.3515. Tenggiri Scomberomorus commersoni 0.5 0.25 1.25 0.8716. Tiga waja Otolites spp 68.75 34.33 44.1 30.7117. Platycepalus spp 1.5 0.75 0.25 0.17
Total fish catch 200.25 143.6
Research and Engineering Appropriate BRDs
AP-13
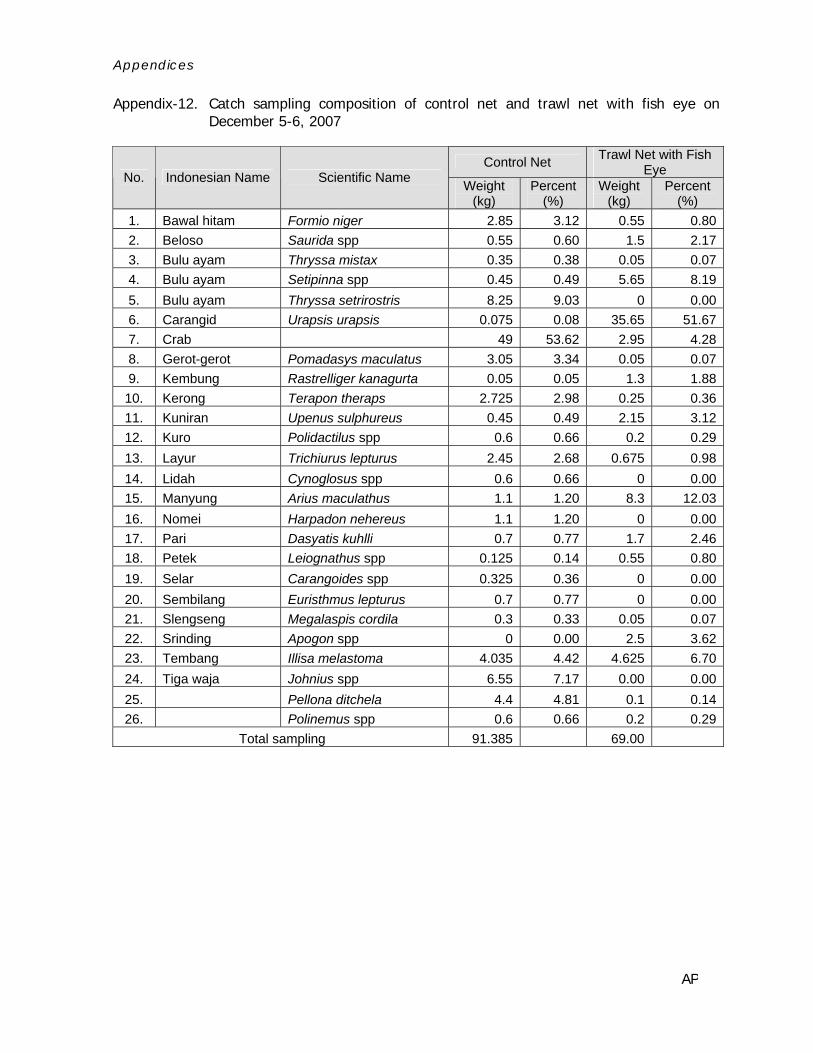
Appendices Appendix-12. Catch sampling composition of control net and trawl net with fish eye on
December 5-6, 2007
Control Net Trawl Net with Fish Eye No. Indonesian Name Scientific Name Weight
(kg) Percent
(%) Weight
(kg) Percent
(%) 1. Bawal hitam Formio niger 2.85 3.12 0.55 0.802. Beloso Saurida spp 0.55 0.60 1.5 2.173. Bulu ayam Thryssa mistax 0.35 0.38 0.05 0.074. Bulu ayam Setipinna spp 0.45 0.49 5.65 8.195. Bulu ayam Thryssa setrirostris 8.25 9.03 0 0.006. Carangid Urapsis urapsis 0.075 0.08 35.65 51.677. Crab 49 53.62 2.95 4.288. Gerot-gerot Pomadasys maculatus 3.05 3.34 0.05 0.079. Kembung Rastrelliger kanagurta 0.05 0.05 1.3 1.88
10. Kerong Terapon theraps 2.725 2.98 0.25 0.3611. Kuniran Upenus sulphureus 0.45 0.49 2.15 3.1212. Kuro Polidactilus spp 0.6 0.66 0.2 0.2913. Layur Trichiurus lepturus 2.45 2.68 0.675 0.9814. Lidah Cynoglosus spp 0.6 0.66 0 0.0015. Manyung Arius maculathus 1.1 1.20 8.3 12.0316. Nomei Harpadon nehereus 1.1 1.20 0 0.0017. Pari Dasyatis kuhlli 0.7 0.77 1.7 2.4618. Petek Leiognathus spp 0.125 0.14 0.55 0.8019. Selar Carangoides spp 0.325 0.36 0 0.0020. Sembilang Euristhmus lepturus 0.7 0.77 0 0.0021. Slengseng Megalaspis cordila 0.3 0.33 0.05 0.0722. Srinding Apogon spp 0 0.00 2.5 3.6223. Tembang Illisa melastoma 4.035 4.42 4.625 6.7024. Tiga waja Johnius spp 6.55 7.17 0.00 0.0025. Pellona ditchela 4.4 4.81 0.1 0.1426. Polinemus spp 0.6 0.66 0.2 0.29
Total sampling 91.385 69.00
Research and Engineering Appropriate BRDs
AP-14

Appendices Appendix-13. Catch sampling composition of economically species from control net and trawl
net with fish eye on December 5-6, 2007
Control Net Trawl Net with Fish Eye No. Indonesian Name Scientific Name Weight
(kg) Percent
(%) Weight
(kg) Percent
(%) 1. Alu alu Spryraena spp 0 0.00 0.35 0.532. Bawal hitam Formio niger 2.9 4.30 0.00 0.003. Carangid Urapsis urapsis 1.05 1.56 1.00 1.514. Cucut Carcharinus spp 5.1 7.56 5.15 7.765. Kerapu Epinephelus spp 0.8 1.19 0.40 0.606. Kuro Polidactilus spp 11.7 17.35 3.15 4.747. Layur Trichiurus lepturus 26 38.55 28.40 42.778. Lidah Cynoglosus spp 5.9 8.75 3.40 5.129. Mata besar Triachantus spp 0.05 0.07 0.00 0.00
10. Remang Muraynesox bagio 1 1.48 0.40 0.6011. Selar Carangoides spp 0.45 0.67 0.00 0.0012. Selar Alepes melanoptera 1.95 2.89 0.00 0.0013. Slengseng Megalaspis cordila 9.85 14.60 1.55 2.3314. Tiga waja Otolites spp 0 0.00 22.35 33.6615. Platicephalus spp 0.7 1.04 0.25 0.38
Total fish catch 67.45 66.4
Research and Engineering Appropriate BRDs
AP-15

Appendices Appendix-14. Catch sampling composition of trawl net with standard TED and USA TED on
December 2-4, 2007
Trawl Net with standard TED
Trawl Net with USA TED No. Indonesian Name Scientific Name
Weight (kg)
Percent (%)
Weight (kg)
Percent (%)
1. Beloso Saurida micopectoalis 2.95 2.89 0.825 1.052. Bulu ayam Thryssa settirostris 2.275 2.23 1.7 2.163. Bulu ayam Setipinna spp 10.8 10.59 12.45 15.844. Bulu ayam Thryssa mistax 9.25 9.07 3.6 4.585. Buntal Lagocephalus spadiceus 0.45 0.44 0.35 0.456. Crab 6.275 6.15 9.8 12.477. Cucut Carcharinus spp 0 0.00 0 0.008. Cumi-cumi Loligo spp 0.6 0.59 0.75 0.959. Gerot-gerot Pomadasys maculatus 6.9 6.77 5.85 7.4510. Ikan Sebelah Psettodes erumei 0 0.00 1 1.2711. Japuh Dussumieria acuta 0.9 0.88 0.3 0.3812. Kembung Rastrelliger kanagurta 0 0.00 0 0.0013. Kerong Terapon theraps 0.15 0.15 0.1 0.1314. Kuniran Upenus sulphureus 0.15 0.15 0.2 0.2515. Kuro Polydactillus spp 9.55 9.37 4.9 6.2416. Layur Trichiurus lepturus 0.7 0.69 2.8 3.5617. Lidah Cynoglosus spp 1.55 1.52 1 1.2718. Manyung Arius thallasinus 6.95 6.82 4 5.0919. Nomei Apogon spp 1.75 1.72 0.75 0.9520. Nomei Harpadon nehereus 0 0.00 0 0.0021. Pari Dasyatis kuhlli 8.9 8.73 3.05 3.8822. Petek Leiognathus spp 1.15 1.13 1.75 2.2323. Selar Alepes melanoptera 0.1 0.10 0 0.0024. Selar Carangoides spp 0.4 0.39 0.8 1.0225. Sembilang Euristhmus lepturus 1.35 1.32 1.35 1.7226. Tembang Illisa melastoma 3.85 3.78 9.65 12.2827. Teri Stolephorus devisi 2.85 2.79 0.15 0.1928. Tiga waja Johnius spp 3.95 3.87 4.3 5.4729. Udang krosok 0.625 0.61 0.6 0.7630. Herklotchsichtis spp 1.05 1.03 2.3 2.9331. Pellona ditchela 16.3 15.98 4.15 5.2832. Platycephalus endrachtensis 0.25 0.25 0.1 0.13
Total Sampling 101.975 78.575
Research and Engineering Appropriate BRDs
AP-16

Appendices
Research and Engineering Appropriate BRDs
AP-17
Appendix-15. Catch sampling composition of economically species from trawl net with standard TED and USA TED December 2-4, 2007
Trawl Net with standard TED
Trawl Net with USA TED No. Indonesian Name Scientific Name
Weight (kg)
Percent (%)
Weight (kg)
Percent (%)
1. Bandeng laki Elops machnata 8.6 6.11 6.85 6.872. Bawal hitam Formio niger 13 9.24 3.65 3.663. Beloso Saurida micopectoalis 0.65 0.46 0 0.004. Cucut Carcharinus spp 7.65 5.44 4.55 4.575. Ephippus orbis 0.3 0.21 0.4 0.406. Ikan Sebelah Psettodes erumei 0.4 0.28 1 1.007. Kakap putih Lates calcariver 16 11.38 5 5.028. Kue Caranx iqnobilis 1.9 1.35 2 2.019. Kuro Polidactilus spp 39.55 28.12 21.4 21.48
10. Layang Decapterus ruselli 0 0.00 0 0.0011. Layur Trichiurus lepturus 2.8 1.99 12 12.0412. Lidah Cynoglosus spp 3.9 2.77 2.95 2.9613. Mata besar Priacanthus macracantus 0 0.00 0 0.0014. Parang-parang Rachicentron canadus 9.5 6.75 13.6 13.6515. Remang Muraenesox bagio 0.95 0.68 0.1 0.1016. Selar Alepes melanoptera 0 0.00 0 0.0017. Selar Carangoides spp 0.5 0.36 0.15 0.1518. Skiper Scatophagus argus 2.65 1.88 2.15 2.1619. Slengseng Megalaspis cordila 0 0.00 0 0.0020. Tenggiri Scomberomorus commersoni 5.1 3.63 9.35 9.3821. Tiga waja Otolites spp 26.95 19.16 14 14.0422. Platycepalus spp 0.25 0.18 0.5 0.50
Total fish catch 140.65 99.65 100

Appendix-16. Catch weight (kg) comparison of trawl net with standard TED and trawl net with US-TED
Trawl Net With Standard TED Trawl Net With US-TED
Tow Number Shrimp
Retained Shrimp Discard
Fish Catch Retained
Fish Discarded
Total Shrimp
Captured
Total Fish Captured
Shrimp Retained
Shrimp discard
Fish Catch Retained
Fish Discarded
Total Shrimp
Captured
Total Fish Captured
Fish Reduction
(%)
Shrimp Lost (%)
1 3.00 - 1.00 36.90 3.00 357.90 4.05 - 11.40 268.60 4.05 280.00 21.77 -35.00 2 0.05 - 1.75 50.00 0.05 171.75 0.20 - 29.55 150.00 0.20 179.55 -4.54 -300.00 3 0.95 - 8.40 00.00 0.95 228.40 0.48 - 20.65 100.00 0.48 120.65 47.18 50.00 4 0.20 - 2.20 00.00 0.20 252.20 0.20 - 32.05 200.00 0.20 232.05 7.99 0.00 5 - - 9.80 50.00 - 169.80 - - 6.00 125.00 - 131.00 22.85 -
Total 4.20 - 43.15 1,036.90 4.20 1,180.05 4.93 - 99.65 843.60 4.93 943.25 20.07* -17.26* Average 0.84 - 8.63 207.38 0.84 236.01 0.99 - 19.93 168.72 0.99 188.65 4.01* 3.45*-
* Total and average were calculated from the total data of fish and shrimp captured
Research and Engineering Appropriate BRDs

Appendices
Appendix-17 Catch weight (kg) comparison of control net and trawl net TED
Trawl Net Without BRD Trawl Net With US-TED
Tow Number Shrimp
Retained Shrimp Discard
Fish Catch Retained
Fish Discarded
Total Shrimp
Captured
Total Fish Captured
Shrimp Retained
Shrimp discard
Fish Catch Retained
Fish Discarded
Total Shrimp
Captured
Total Fish Captured
Fish Reduction
(%)
Shrimp Lost (%)
1 0.80 - 106.20 200.00 0.80 306.20 0.50 - 61.90 200.00 0.50 261.90 14.47 37.50 2 1.50 - 21.55 250.00 1.50 271.55 1.20 - 19.00 275.00 1.20 294.00 -8.27 20.00 3 0.17 - 18.45 300.00 0.17 318.45 0.15 - 19.05 250.00 0.15 269.05 15.51 11.76 4 1.00 - 54.55 150.00 1.00 204.55 0.30 - 58.15 250.00 0.30 308.15 -50.65 70.00 5 - - 35.00 100.00 - 135.00 - - 29.85 150.00 - 179.85 -33.22 - 6 3.25 - 25.90 200.00 3.25 225.90 2.40 - 16.75 200.00 2.40 216.75 4.05 26.15
Total 6.72 - 261.65 1,200.00 6.72 1,461.65 4.55 - 204.70 1,325.00 4.55 1,529.70 -4.66* 32.29* Average 1.12 - 43.61 200.00 1.12 243.61 0.76 - 34.12 220.83 0.76 254.95 -0.78* 5.38*
* Total and average were calculated from the total data of fish and shrimp captured
Research and Engineering Appropriate BRDs
AP-19
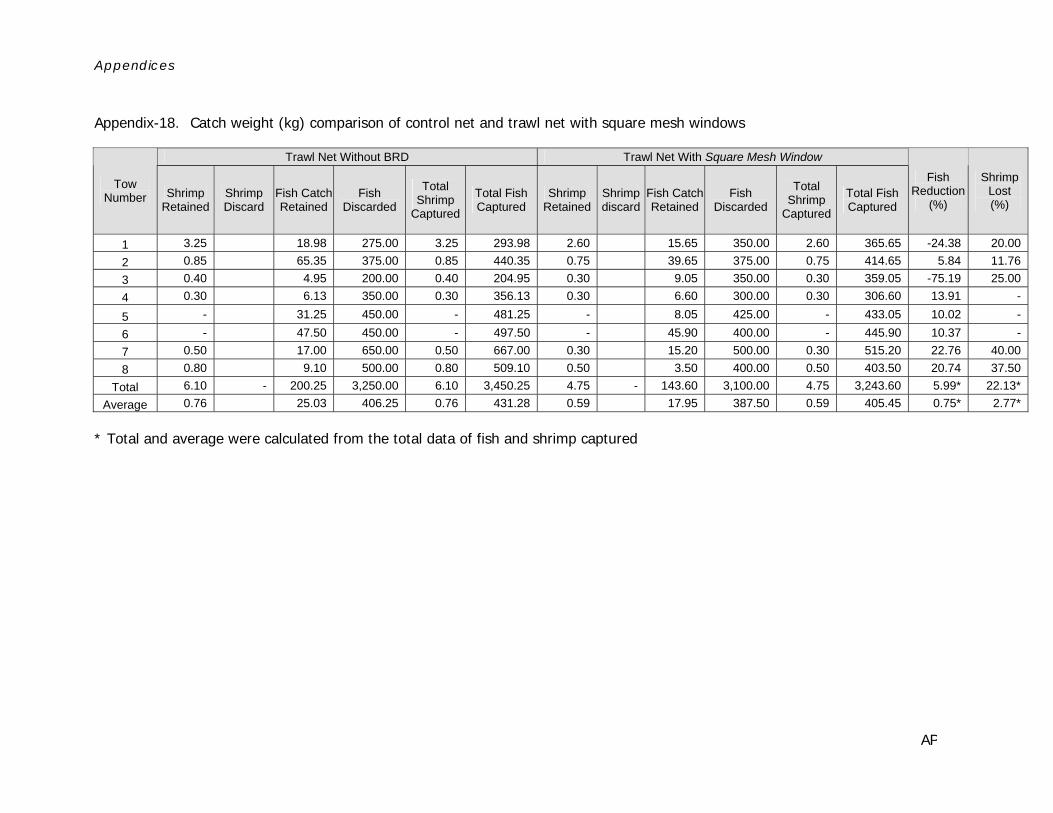
Appendices
Appendix-18. Catch weight (kg) comparison of control net and trawl net with square mesh windows
Trawl Net Without BRD Trawl Net With Square Mesh Window
Tow Number Shrimp
Retained Shrimp Discard
Fish Catch Retained
Fish Discarded
Total Shrimp
Captured
Total Fish Captured
Shrimp Retained
Shrimp discard
Fish Catch Retained
Fish Discarded
Total Shrimp
Captured
Total Fish Captured
Fish Reduction
(%)
Shrimp Lost (%)
1 3.25 18.98 275.00 3.25 293.98 2.60 15.65 350.00 2.60 365.65 -24.38 20.00 2 0.85 65.35 375.00 0.85 440.35 0.75 39.65 375.00 0.75 414.65 5.84 11.76 3 0.40 4.95 200.00 0.40 204.95 0.30 9.05 350.00 0.30 359.05 -75.19 25.00 4 0.30 6.13 350.00 0.30 356.13 0.30 6.60 300.00 0.30 306.60 13.91 -
5 - 31.25 450.00 - 481.25 - 8.05 425.00 - 433.05 10.02 -
6 - 47.50 450.00 - 497.50 - 45.90 400.00 - 445.90 10.37 - 7 0.50 17.00 650.00 0.50 667.00 0.30 15.20 500.00 0.30 515.20 22.76 40.00 8 0.80 9.10 500.00 0.80 509.10 0.50 3.50 400.00 0.50 403.50 20.74 37.50
Total 6.10 - 200.25 3,250.00 6.10 3,450.25 4.75 - 143.60 3,100.00 4.75 3,243.60 5.99* 22.13* Average 0.76 25.03 406.25 0.76 431.28 0.59 17.95 387.50 0.59 405.45 0.75* 2.77*
* Total and average were calculated from the total data of fish and shrimp captured
Research and Engineering Appropriate BRDs
AP-20

Appendices
Research and Engineering Appropriate BRDs
AP-21
Appendix-19. Catch weight (kg) comparison of control net and trawl net with fish eye
Trawl Net Without BRD Trawl Net With Fish Eye
Tow Number Shrimp
Retained Shrimp Discard
Fish Catch Retained
Fish Discarded
Total Shrimp
Captured
Total Fish Captured
Shrimp Retained
Shrimp discard
Fish Catch Retained
Fish Discarded
Total Shrimp
Captured
Total Fish Captured
Fish Reduction
(%)
Shrimp Lost (%)
1 - - 7.70 400.00 - 407.70 - - 1.00 250.00 - 251.00 38.44 - 2 3.95 - 9.20 425.00 3.95 434.20 1.75 - 3.85 300.00 1.75 303.85 30.02 55.70 3 2.50 - 4.60 300.00 2.50 304.60 1.71 - 4.85 324.45 1.71 329.30 -8.11 31.60 4 3.00 - 21.50 336.40 3.00 357.90 4.05 - 9.70 270.30 4.05 280.00 21.77 (35.00) 5 1.00 - 43.00 317.60 1.00 360.60 1.00 - 19.40 258.60 1.00 278.00 22.91 - 6 3.25 - 46.40 450.00 3.25 496.40 2.00 - 30.35 550.00 2.00 580.35 -16.91 38.46 7 6.25 - 36.40 225.00 6.25 261.40 5.20 - 18.90 231.10 5.20 250.00 4.36 16.80
Total 19.95 - 168.80 2,454.00 19.95 2,622.80 15.71 - 88.05 2,184.45 15.71 2,272.50 13.36* 21.25* Average 2.85 - 24.11 350.57 2.85 374.69 2.24 - 12.58 312.06 2.24 324.64 1.91* 3.04*
* Total and average were calculated from the total data of fish and shrimp captured

Appendices Appendix -20. Fitted US-TED, square mesh window and fish eye into the codend
TED Standard
US-TED
Research and Engineering Appropriate BRDs
AP-22

Appendices Appendix-20 (continued)
Fish eye
Square mesh window
Research and Engineering Appropriate BRDs
AP-23

Appendices Appendix -21. Shrimp capture during fishing trials in Arafura sea
Penaeus merguensis Metapenaeus spp
Research and Engineering Appropriate BRDs
AP-24

Appendices Appendix -22. By-catch during fishing trials in Arafura sea
Crabs Formio niger
Elops machnata
Cynoglossus spp
Trichiurus lepturus
Carcharinus spp
Research and Engineering Appropriate BRDs
AP-25

Appendices Appendix -23. Behavior of the experiment fish in flume tank
TED super shooter
Square mesh window
Fish eye
Research and Engineering Appropriate BRDs
AP-26

Appendices
Research and Engineering Appropriate BRDs
AP-27