ABSTRACT Document: CHARACTERIZATON OF HUMAN HOLOCARBOXYLASE
129
ABSTRACT Title of Document: CHARACTERIZATON OF HUMAN HOLOCARBOXYLASE SYNTHETASE ACTIVITY AND SPECIFICITY Maria del Mar Ingaramo, Doctor of Philosophy, 2011 Directed By: Dr. Dorothy Beckett, Department of Chemistry and Biochemistry Human Holocarboxylase Synthetase (HCS) transfers the vitamin biotin to the biotin carboxyl carrier protein (BCCP) domains of five biotin-dependent carboxylases. There are two major forms of HCS present in mammalian cells, which differ by 57 amino acids at their N-terminus. Both variants catalyze biotinylation through a two step reaction in which an activated intermediate, bio-5‟-AMP, is first synthesized from biotin and ATP. In the second step, the biotin moiety is covalently attached to a specific lysine residue on the carboxylase. The mammalian carboxylases comprise the cytosolic acetyl-CoA carboxylase 1 (ACC1), the outer mitochondrial membrane bound acetyl-CoA carboxylase 2 (ACC2), and the three mitochondrial carboxylases pyruvate carboxylase (PC), 3-methylcrotonyl-CoA carboxylase (MCC) and propionyl-CoA carboxylase (PCC).
Transcript of ABSTRACT Document: CHARACTERIZATON OF HUMAN HOLOCARBOXYLASE
ABSTRACT
Title of Document: CHARACTERIZATON OF HUMAN
HOLOCARBOXYLASE SYNTHETASE
ACTIVITY AND SPECIFICITY
Maria del Mar Ingaramo, Doctor of Philosophy,
2011
Directed By: Dr. Dorothy Beckett, Department of Chemistry
and Biochemistry
Human Holocarboxylase Synthetase (HCS) transfers the vitamin biotin to the
biotin carboxyl carrier protein (BCCP) domains of five biotin-dependent
carboxylases. There are two major forms of HCS present in mammalian cells, which
differ by 57 amino acids at their N-terminus. Both variants catalyze biotinylation
through a two step reaction in which an activated intermediate, bio-5‟-AMP, is first
synthesized from biotin and ATP. In the second step, the biotin moiety is covalently
attached to a specific lysine residue on the carboxylase. The mammalian carboxylases
comprise the cytosolic acetyl-CoA carboxylase 1 (ACC1), the outer mitochondrial
membrane bound acetyl-CoA carboxylase 2 (ACC2), and the three mitochondrial
carboxylases pyruvate carboxylase (PC), 3-methylcrotonyl-CoA carboxylase (MCC)
and propionyl-CoA carboxylase (PCC).
In order to investigate the HCS reaction mechanism and specificity, both
isoforms were recombinantly expressed, purified, and biochemically characterized.
The basic mechanistic features of the two HCS variants were investigated using
steady state and pre-steady state kinetic methods. The latter methods allow the
determination of the rates of bio-5‟-AMP synthesis and biotin transfer independent of
each other. Both isoforms catalyze the overall reaction similarly and synthesize bio-
5‟-AMP with a rate of 0.1s-1
. Biotin transfer to the BCCP domain fragments of ACC1
and ACC2 carboxylases, to which HCS has continuous access from the cytosol, is
slow and saturable. In contrast, biotin transfer to the BCCP domain fragments from
the mitochondrial carboxylases PC, PCC and MCC is characterized by rates that are
significantly faster and limited by the collision of enzyme and acceptor substrate. The
same pre-steady state methods were applied to two biotin ligases from archaea and
prokarya, and showed that this collision limited biotin transfer mechanism is
widespread among evolutionary domains.
The observation of a collision limited reaction emphasizes the role of protein
substrate recognition in the biotinylation reaction, and provides a mechanism for
establishing a hierarchy among carboxylases that favors mitochondrial substrates.
This default hierarchy can be overridden according to cellular demands by modifying
the carboxylases‟ expression. The results support the idea that in the cell one of the
mechanisms of biotin-related metabolism regulation relies on HCS specificity to
control biotin distribution among carboxylases.
CHARACTERIZATON OF HUMAN HOLOCARBOXYLASE SYNTHETASE
ACTIVITY AND SPECIFICITY.
By
Maria del Mar Ingaramo
Dissertation submitted to the Faculty of the Graduate School of the
University of Maryland, College Park, in partial fulfillment
of the requirements for the degree of
Doctor of Philosophy
2011
Advisory Committee:
Professor Dorothy Beckett, Chair
Professor Iqbal Hamza
Professor George Lorimer
Associate Professor Richard Stewart
Professor Sergei Sukharev

© Copyright by
Maria del Mar Ingaramo
2011

Acknowledgements
I would like thank my advisor, committee members, professors and co-
workers for their support, guidance and help. I thank Dr. Roy Gravel for providing
the plasmid containing the 58-HCS coding sequence and the overexpression plasmid
for p67, the RIKEN group for supplying the expression plasmids for PhBPL and
PhBCCP, Dr. Chrisopher Lima for the plasmid used for purification of SUMO
protease, Yishan Zhou and Joy Zhao for the purification of PhBCCP, Kyle Daniels
for the purification of PhBPL, and Emily Streaker for the purification of EcBPL.
This work was supported, in whole or in part, by National Institutes of Health
Grants R01-GM46511 and S10-RR15899 to Dr. Beckett. In addition, I am thankful
for support from the University of Maryland summer research fellowships and the
Bailey graduate student fellowship.
ii
Table of Contents
Acknowledgements ....................................................................................................... ii
Table of Contents ......................................................................................................... iii
List of Tables .................................................................................................................v
List of Figures .............................................................................................................. vi
Abbreviations .............................................................................................................. vii
Chapter 1: Background and introduction .......................................................................1
1.1 Introduction ..........................................................................................................1
1.1.1 Biotin.............................................................................................................1
1.1.2 Biotin as a cofactor .......................................................................................3
1.1.3 Biotin dependent carboxylases .....................................................................5
1.1.4 Biotin protein ligases ....................................................................................8
1.1.5 BirA and other ligases ..................................................................................9
1.1.6 The mammalian biotin protein ligase, or human holocarboxylase
synthetase .............................................................................................................12
1.1.7 Biotin protein ligase-BCCP interaction ......................................................15
1.1.8 Multiple carboxylase deficiency .................................................................16
1.2 The experimental problem .................................................................................17
Chapter 2: Biochemical characterization of FL-HCS and 58-HCS .............................20
2.1 Abstract ..............................................................................................................20
2.2 Introduction ........................................................................................................21
2.3 Experimental procedures ...................................................................................25
2.3.1 Chemicals and Biochemicals ......................................................................25
2.3.2 Expression Plasmid Construction ...............................................................25
2.3.3 Purification of 58-HCS and FL-HCS ..........................................................26
2.3.4 Purification of p67 ......................................................................................27
2.3.5 Equilibrium sedimentation measurements ..................................................28
2.3.6 Steady state kinetic measurements..............................................................29
2.3.7 Steady state fluorescence spectra ................................................................30
2.3.8 Initial rate of bio-5′-AMP synthesis ............................................................31
2.3.9 Measurement of the bimolecular association rate constant of HCS with
p67........................................................................................................................31
2.4 Results ................................................................................................................32
2.4.1 Purification of HCS isoforms......................................................................32
2.4.2 Sedimentation equilibrium analysis of FL-HCS and 58-HCS oligomeric
State......................................................................................................................33
2.4.3 Kinetic analysis of the two-step HCS-catalyzed reaction ...........................35
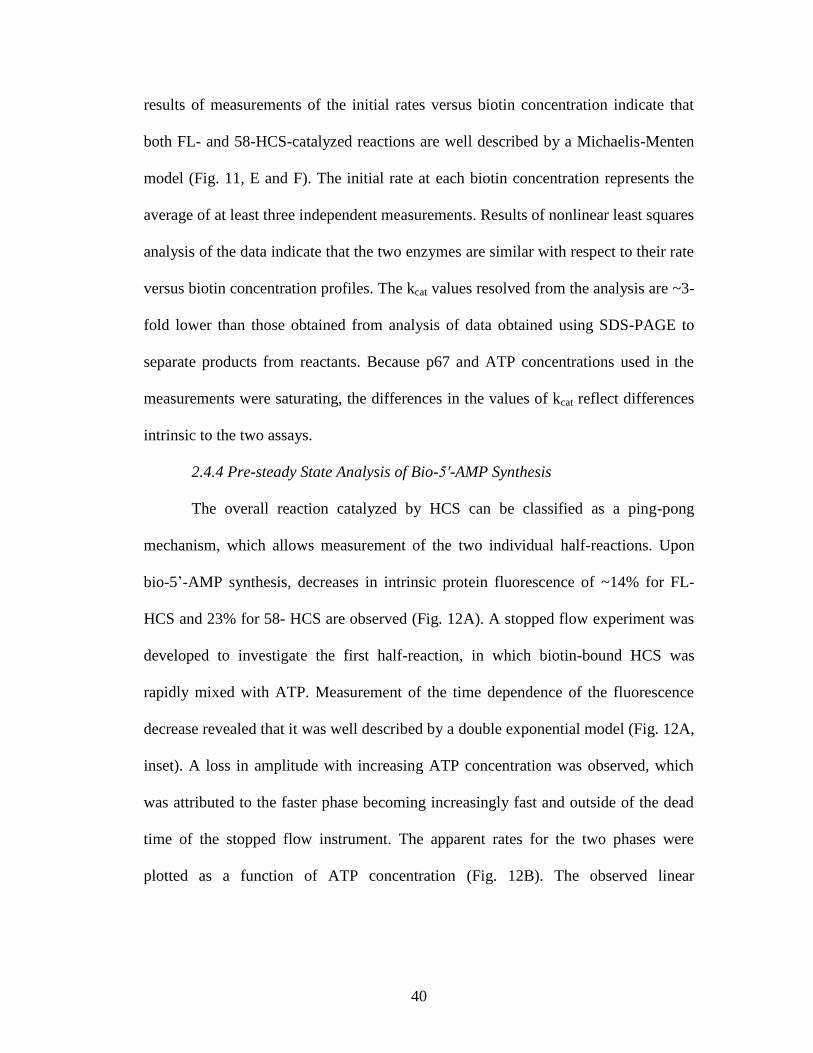
2.4.4 Pre-steady state analysis of Bio-5′-AMP synthesis ....................................40
2.4.5 Single turnover analysis of the biotin transfer reaction ..............................43
2.5 Discussion ..........................................................................................................44
2.5.1 FL-HCS and 58-HCS are monomeric .........................................................46
2.5.2 Steady state analysis of the overall HCS-catalyzed reaction ......................47
2.5.3 Analysis of HCS two half-reactions ...........................................................48
iii
2.5.4 Implications of the distinct rates of association of 58-HCS and FL-HCS
with p6 .................................................................................................................50
Chapter 3: The biotin transfer reaction across different species ..................................52
3.1 Abstract ..............................................................................................................52
3.2 Introduction ........................................................................................................53
3.3 Experimental procedures ...................................................................................58
3.3.1 Chemicals and buffers.................................................................................58
3.3.2 Protein expression and purification ...........................................................59
3.3.3 Stopped flow measurements of biotin transfer ...........................................62
3.3.4 Quench flow measurements of biotin incorporation ..................................63
3.4 Results ................................................................................................................65
3.4.1 Oligomeric states of the reacting species in biotin transfer ........................65
3.4.2 Single turnover assays of the second half reaction in biotin transfer .........66
3.4.3 Biotin transfer rates to cognate substrates are similar for the three Biotin
Protein Ligases .....................................................................................................66
3.4.4 Product formation is limited by bimolecular association of enzyme with
substrate ...............................................................................................................69
3.4.5 Measurements of biotin transfer to noncognate acceptor proteins indicate
substrate specificity ..............................................................................................71
3.5 Discussion ..........................................................................................................74
Chapter 4: Biotin transfer to the five mammalian biotin dependent carboxylases .....78
4.1 Abstract ..............................................................................................................78
4.2 Introduction ........................................................................................................79
4.3 Experimental procedures ...................................................................................82
4.3.1 Chemicals and biochemicals .......................................................................82
4.3.2 Sequence composition and cloning ............................................................83
4.3.3 Protein expression and purification ............................................................85
4.3.4 Sedimentation equilibrium measurements ..................................................87
4.3.5 Stopped flow measurements of biotin transfer ...........................................88
4.3.6 Quenched flow measurements of biotin transfer ........................................89
4.4 Results ................................................................................................................90
4.4.1 Design and preparation of BCCP fragments ...............................................90
4.4.2 Oligomeric states of the BCCP fragments ..................................................91
4.4.3 Biotin transfer assays ..................................................................................92
4.4.4 Biotin transfer to MCC, PC and PCC BCCPs is fast ..................................94
4.4.5 Biotin transfer to ACC1-his6 and ACC2-his6 displays a different kinetic
behavior................................................................................................................97
4.5 Discussion ........................................................................................................101
Chapter 5: Conclusions and future directions ............................................................107
Bibliography ..............................................................................................................112
iv

List of Tables
Table 1. Kinetic parameters for the overall HCS-catalyzed reaction ........................... 39
Table 2. Kinetic parameters for ATP dependence of bio-5‟-AMP synthesis ............... 43
Table 3. Bimolecular association rate constants for HCS·bio-5‟-AMP with p67 ........ 46
Table 4. Biotin transfer rates for cognate ligase-BCCP pairs ....................................... 68
Table 5. Stopped-flow measurements of biotin transfer rates for cognate and non-
cognate ligase-BCCP pairs ........................................................................................... 72
Table 6. Rates of PhBPL-catalyzed biotin transfer ...................................................... 73
Table 7. Assembly state of BCCP fragments................................................................ 92
Table 8. FL- and 58-HCS biotin transfer rates to PCC, MCC and PC BCCP .............. 96
Table 9. FL- and 58-HCS catalyzed biotin transfer to ACC2-his6 BCCP .................. 100
Table 10. FL- and 58-HCS catalyzed biotin transfer to ACC1-his6 BCCP ................ 101
v

List of Figures
Figure 1. Biotin and the egg white injury ......................................................................2
Figure 2. Biotin dependent carboxylases reaction and domain structure ......................4
Figure 3. Mammalian biotin dependent carboxylases associated metabolic pathways
and assembly states ........................................................................................................6
Figure 4. Biotin protein ligase reaction..........................................................................9
Figure 5. The biotin regulatory switch of E. coli .........................................................11
Figure 6. HCS isoforms ...............................................................................................13
Figure 7. HCS function in metabolism and transcription regulation ...........................23
Figure 8. SDS-polyacrylamide gel of 58-HCS purification fractions..........................33
Figure 9. HCS analytical ultracentrifugation ...............................................................34
Figure 10. Kinetic assays used to determine Michaelis-Menten constants for HCS-
catalyzed biotin transfer with respect to p67, biotin, and ATP ....................................35
Figure 11. Steady state kinetic analysis of biotin incorporation into p67 catalyzed by
58-HCS and FL-HCS ...................................................................................................38
Figure 12. Pre-steady state analysis of bio-5‟-AMP synthesis ....................................42
Figure 13. Single turnover measurements of biotin transfer from bio-5‟-AMP to p67
substrate .......................................................................................................................45
Figure 14. Ligases across evolutionary domains .........................................................55
Figure 15. Alignment of structures and sequences of BCCP fragment .......................56
Figure 16. Stopped flow measurements of biotin transfer for cognate ligase-BCCP
pairs ..............................................................................................................................68
Figure 17. Quench flow measurements of biotin transfer for cognate ligase-BCCP
pairs ..............................................................................................................................70
Figure 18. Stopped flow and quench-flow measurements of PhBPL-catalyzed biotin
transfer to cognate and non-cognate substrates ...........................................................73
Figure 19. Mammalian biotin dependent carboxylases ...............................................82
Figure 20. Single turnover assays of biotin transfer ....................................................94
Figure 21. Dependence of the apparent rate of biotin transfer on BCCP concentration
measured by stopped flow and quench flow ................................................................95
Figure 22. Biotin transfer to the BCCP fragments of acetyl-CoA carboxylases .........99
vi
List of Abbreviations
58-HCS protein product of translation initiation at methionine 58 of the
full-length protein
ACC acetyl-CoA carboxylase
BC biotin carboxylase domain
BCCP biotin carboxyl carrier protein
bio-5‟-AMP biotinyl 5‟-adenylate
BPL biotin protein ligase
BSA bovine serum albumin
CT carboxyl transferase domain
Ec Escherichia coli
HCS holocarboxylase synthetase
Hs Homo sapiens
IPTG isopropyl β-D-thiogalactoside
FL-HCS full-length holocarboxylase synthetase
MALDI-TOF matrix-assisted laser desorption ionization time-of-flight
MCC methylcrotonyl-CoA carboxylase
MCD multiple carboxylase deficiency
p67 carboxyl-terminal fragment of the propionyl-CoA-carboxylase
α subunit containing a his6 tag
PC pyruvate carboxylase
PCC propionyl-CoA carboxylase
Ph Pyrococcus horikoshii
PKG protein kinase G
PPi pyrophosphate
SUMO protein small ubiquitin-like modifier protein
TC transcarboxylase domain
TCA tricarboxylic acid cycle
Tricine N-[2-hydroxy-1,1-bis(hydroxymethyl)ethyl]glycine
Tris 2-amino-2-hydroxymethyl-propane-1,3-diol
SUMO protein small ubiquitin-like modifier protein
vii

1
Chapter 1: Background and introduction
1.1 Introduction
Cells adjust the flux of their metabolic processes in a constant effort to
maintain homeostasis. This is a natural response to stress that aids in cell survival and
adaptability. Central to this response is the ability to control and regulate processes
such as enzymatic activity, transcription and translation as a function of nutritional
needs. This work lays the foundation to understand the biochemical basis of those
processes that determine the metabolic fate of the nutrient biotin in mammalian cells.
In particular, it focuses on expanding our understanding of human holocarboxylase
synthetase (HCS), a key enzyme in biotin related metabolism and regulation.
1.1.1 Biotin
Biotin, also known as vitamin B7 or vitamin H, is an essential nutrient
required by most organisms for viability. The only organisms that do not require
biotin are the Lyme disease causing agent Borrelia burgdorferi, the endocellular
symbiont Buchnera sp., mycoplasmas and thermoplasmas (1). Most prokaryotes,
plants and some fungi can synthesize biotin (2). In contrast, most higher eukaryotes,
including all animals, depend on their diet as a source of the vitamin. Alternatively, it
is been suggested that the bacterial community of the intestinal flora may also
function as a biotin source for higher organisms (3).
Biotin was originally discovered by Margaret Boas in 1927 when she
recognized that there was a component in certain foods that protected mice against
„egg white injury‟ (4). She named this component „protective factor X‟. Today, the

2
„egg white injury‟, a condition characterized by severe dermatitis, loss of hair, and
lack of muscular coordination, is known to arise from the presence of the protein
avidin in the egg white (Fig. 1A). Avidin, which binds biotin with one of the tightest
binding affinities known to date, prevents biotin absorption by the mice. In 1940, Paul
Gyorgy realized that the vitamin H that he had extracted from liver in 1931, as well as
the coenzyme R from Rhizobium discovered by Allison in 1933, and the biotin
isolated from egg yolk by Kogl and Tonnis in 1935, were all one and the same (5).
Subsequently, the structure of biotin was solved by DU Vigneaud in 1942 (6), after
recognition that biotin is composed of a ureido ring fused with a tetrahydrothiophene
ring and a carboxyl group on an n-valeric acid side chain (Fig. 1B). Only one of the
eight possible stereoisomers, d-(+)-biotin, is biologically active (7).
Figure 1. Biotin and the egg white injury. A. Picture of a mouse displaying egg white
injury. The symptoms are observed after depriving mice from biotin by feeding them
egg white (reprinted from (4)) B. Structure of biotin.

3
1.1.2 Biotin as a cofactor
The importance of biotin derives from its function as a cofactor for biotin-
dependent carboxylases. In the carboxylation reaction, a carboxyl group is added to
one molecule, for example, acetyl-CoA, to produce another metabolite that has been
extended by one carboxyl group, like malonyl-CoA. Biotin acts as an intermediate
carrier of the carboxyl group, which is originally taken up from a bicarbonate donor
and eventually handed to the metabolic acceptor molecule (Fig. 2A). The reaction is
complex, and is catalyzed in distinct spacio-temporal steps that occur in different
carboxylase domains ((8), Fig. 2B). Biotin performs its carrier function while
covalently attached to a specific lysine of the BCCP (biotin carboxyl carrier protein)
domain. This domain works as a swinging arm, able to reach TC and BC domains
more than 60Å away (9). The BCCP domain interacts first with the BC domain
(biotin carboxylase), where ATP is used to activate bicarbonate by producing a
carboxyphosphate intermediate. This reaction also requires divalent ions. After the N-
1 position of biotin is carboxylated, the BCCP domain brings the biotin to the TC
(transcarboxylase) domain, where the carboxyl group is indirectly transferred to the
acceptor metabolite through intermediate CO2 formation(10).

4
Figure 2. Biotin dependent carboxylases reaction and domain structure. A. The
carboxylase reaction involves taking bicarbonate and ATP to transiently transfer a
carboxyl group to biotin. The carboxyl group is subsequently added to either
pyruvate, acetyl-CoA, propionyl-CoA or methycrotonyl-CoA, depending on the
identity of the carboxylase(8,11). B. Carboxylases are composed of repeating units of
the BC, BCCP and CT domain. The flexible linker (green) of the BCCP domain (red)
moves the biotin moiety between the BC (blue) and TC domain (gold), where the two
parts of the carboxylation reaction occur.

5
1.1.3 Biotin dependent carboxylases
Biotin dependent carboxylases are involved in a variety of metabolic
processes, some of which are essential for cell viability. Most organisms, as is the
case in the widely studied E. coli, possess at least one such carboxylase, namely
acetyl-CoA carboxylase (ACC). This carboxylase catalyzes the conversion of acetyl-
CoA to malonyl-CoA, and as a result, is of fundamental importance for fatty acid
anabolism. Indeed, this chemical step is the first committed step of fatty acid
synthesis. In E. coli, the enzyme consists of four polypeptides, BC, BCCP, TC- and
TC- (12). However, the overall stoichiometry of subunits is still a matter of debate.
Mammalian cells have five biotin dependent carboxylases involved in various
metabolic processes (Fig. 3A,B). Like the bacterial ACC, cytosolic acetyl-CoA
carboxylase 1 (ACC1) is involved in fatty acid synthesis by catalyzing the conversion
of acetyl-CoA to malonyl-CoA. Because this carboxylase has been linked to obesity
and diabetes, it has been the topic of much research. The BC, BCCP and TC domains
of the mammalian enzyme lie on a single polypeptide whose regulation has been
found to be multi-level and complex. The expression pattern varies depending on the
tissue, with the highest levels occurring in adipose tissue (13). In addition, the mRNA
can be alternatively spliced to produce different variants. The expression levels are
responsive to glucose, insulin, thyroid hormone and leptin (14). Citrate and glutamate
are among the currently identified allosteric regulators of ACC1, and citrate is known
to activate ACC1 by inducing homopolymerization of the enzyme (15). ACC1
activity can be inhibited by hormone responsive phosphorylation of several residues.
This extensive regulation at multiple levels and the fact that an ACC1 knock-out

6
mutation in mice is embryonic lethal (16) are in accord with a central role of ACC1 in
metabolism.
Figure 3. Mammalian biotin dependent carboxylases associated metabolic pathways
and assembly states. A. Mammalian cells have five different biotin dependent
carboxylases that are involved in a variety of metabolic pathways. B. Mammalian
biotin dependent carboxylases are large multimeric complexes. The domain
architecture is highlighted by the different colors. The number of times that the
domains are repeated in an active complex is shown on the right. Biotin is attached to
the BCCP subunit (adapted from (11)).

7
Acetyl-CoA carboxylase 2 (ACC2) is the product of a different gene than that
coding for ACC1, although the two enzymes maintain 70% similarity (11). It
catalyzes the same reaction as ACC1, but is involved in regulation of fatty acid
oxidation. Even though the two ACCs catalyze the same reaction the two are not
interchangeable and have different functions. This is evidenced by the very different
results obtained with ACC2 mice knockouts, which aside from a few phenotypic
traits, mature normally (17). A publication by Soo Choi et al. indicating that the
ACC2 knockout mice displayed increased insulin sensitivity and continuous fat
oxidation led to much interest to use this enzyme as a target to treat diabetes and
obesity (18). However, a more recent paper suggests that the phenotypes are not as
pronounced as originally thought (17). An N-terminal leader sequence is responsible
for its localization and anchoring to the cytoplasmic side of the outer mitochondrial
membrane (19). ACC2 displays differential tissue expression, with increased
expression in muscle, and there are also different splice variants (14). It also contains
several phosphorylation sites that may be involved in its regulation (14). Therefore,
ACC2 is also subject to extensive regulation.
Propionyl-CoA carboxylase (PCC) catalyzes the conversion of propionyl-CoA
to S-methylmalonyl-CoA. It is part of the odd-chain fatty acid synthesis pathway and
is also involved in isoleucine, threonine, methionine and valine catabolism. The
enzyme localizes to the mitochondrial matrix. It is a 66 heterododecamer, with the
alpha subunit carrying the biotin moiety (11). PCC has also been established as an
essential gene product, since knock-out mice die hours after birth (20).
8
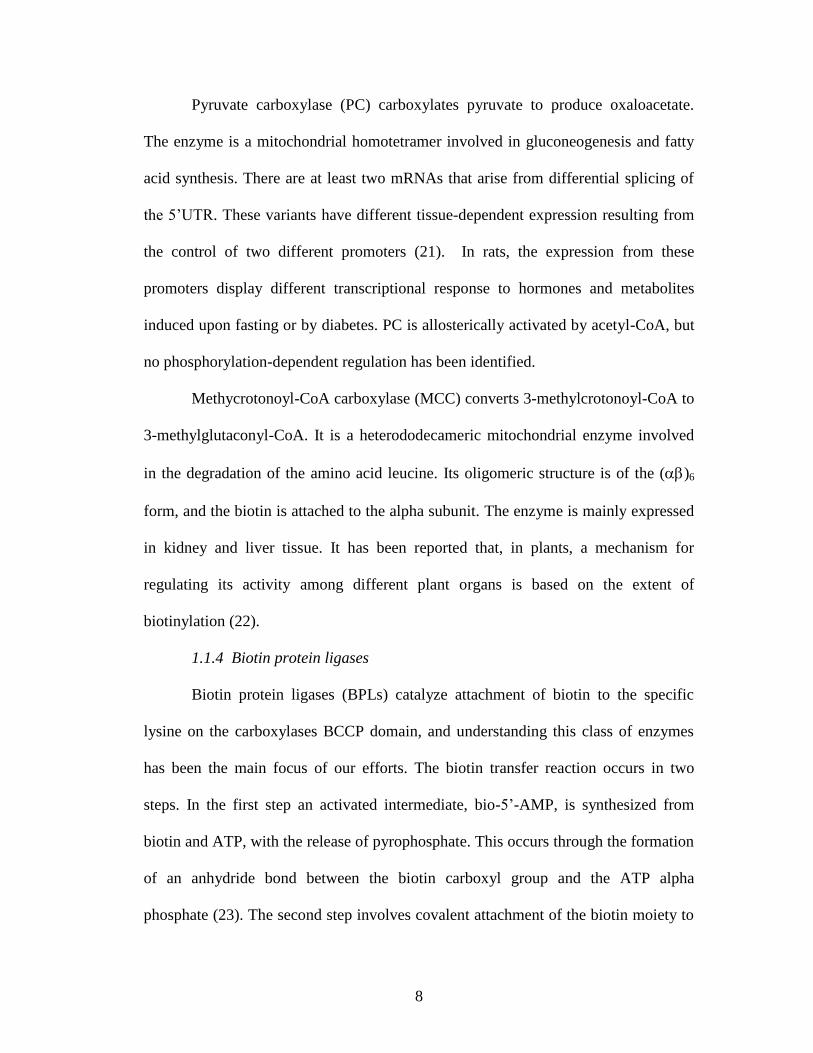
Pyruvate carboxylase (PC) carboxylates pyruvate to produce oxaloacetate.
The enzyme is a mitochondrial homotetramer involved in gluconeogenesis and fatty
acid synthesis. There are at least two mRNAs that arise from differential splicing of
the 5‟UTR. These variants have different tissue-dependent expression resulting from
the control of two different promoters (21). In rats, the expression from these
promoters display different transcriptional response to hormones and metabolites
induced upon fasting or by diabetes. PC is allosterically activated by acetyl-CoA, but
no phosphorylation-dependent regulation has been identified.
Methycrotonoyl-CoA carboxylase (MCC) converts 3-methylcrotonoyl-CoA to
3-methylglutaconyl-CoA. It is a heterododecameric mitochondrial enzyme involved
in the degradation of the amino acid leucine. Its oligomeric structure is of the ()6
form, and the biotin is attached to the alpha subunit. The enzyme is mainly expressed
in kidney and liver tissue. It has been reported that, in plants, a mechanism for
regulating its activity among different plant organs is based on the extent of
biotinylation (22).
1.1.4 Biotin protein ligases
Biotin protein ligases (BPLs) catalyze attachment of biotin to the specific
lysine on the carboxylases BCCP domain, and understanding this class of enzymes
has been the main focus of our efforts. The biotin transfer reaction occurs in two
steps. In the first step an activated intermediate, bio-5‟-AMP, is synthesized from
biotin and ATP, with the release of pyrophosphate. This occurs through the formation
of an anhydride bond between the biotin carboxyl group and the ATP alpha
phosphate (23). The second step involves covalent attachment of the biotin moiety to
9
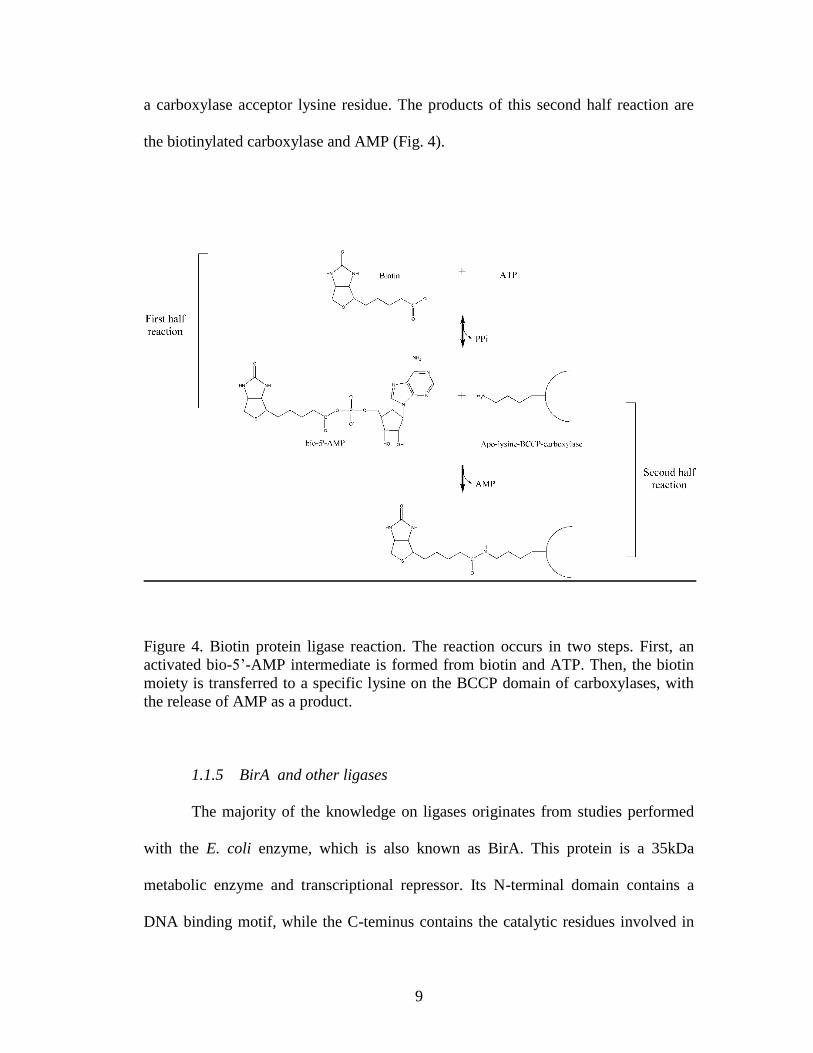
a carboxylase acceptor lysine residue. The products of this second half reaction are
the biotinylated carboxylase and AMP (Fig. 4).
Figure 4. Biotin protein ligase reaction. The reaction occurs in two steps. First, an
activated bio-5‟-AMP intermediate is formed from biotin and ATP. Then, the biotin
moiety is transferred to a specific lysine on the BCCP domain of carboxylases, with
the release of AMP as a product.
1.1.5 BirA and other ligases
The majority of the knowledge on ligases originates from studies performed
with the E. coli enzyme, which is also known as BirA. This protein is a 35kDa
metabolic enzyme and transcriptional repressor. Its N-terminal domain contains a
DNA binding motif, while the C-teminus contains the catalytic residues involved in
10
bio-5‟-AMP synthesis and biotin transfer (24). BirA is central to the sensing and
maintenance of biotin homeostasis in E. coli, by virtue of its ability to function as a
repressor and a biotin ligase (25). After bio-5‟-AMP synthesis, BirA can either
transfer biotin to the BCCP domain of ACC, or it can homodimerize (Fig. 5). BirA
dimers can act as transcriptional repressors by directly binding to a DNA regulatory
sequence and inhibiting the expression of the biotin biosynthetic operon (26). As a
result, BirA function will depend on biotin concentration and levels of unbiotinylated
BCCP (27). When the concentration of biotinylated carboxylase is high, BirA will
homodimerize and bind to the operator. On the other hand, when most of the
carboxylases are unbiotinylated, BirA will heterodimerize with the carboxylase and
biotinylate the BCCP subunits. Because the dimerization reactions utilize the same
surface on BirA, they are mutually exclusive, and their dominance will determine if
biotin is channeled towards metabolism or transcriptional repression. Mechanistically,
hetero- and homo- dimerization events are isoenergetic, and this switch is kinetically
controlled. Since heterodimerization is much faster than homodimerization,
transcriptional repression will occur only after the pool of unbiotinylated BCCPs has
been exhausted (28-29). BirA is, therefore, the key species through which biotin is
partitioned between transcriptional repression and metabolism(30).
11
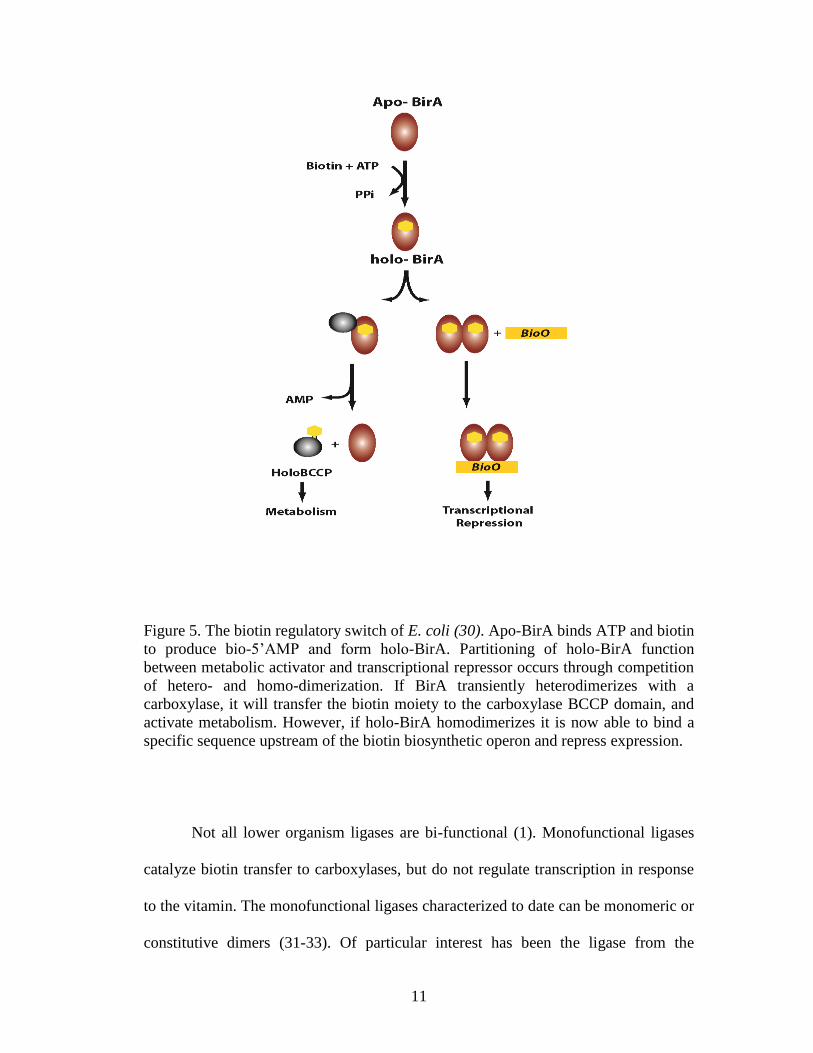
Figure 5. The biotin regulatory switch of E. coli (30). Apo-BirA binds ATP and biotin
to produce bio-5‟AMP and form holo-BirA. Partitioning of holo-BirA function
between metabolic activator and transcriptional repressor occurs through competition
of hetero- and homo-dimerization. If BirA transiently heterodimerizes with a
carboxylase, it will transfer the biotin moiety to the carboxylase BCCP domain, and
activate metabolism. However, if holo-BirA homodimerizes it is now able to bind a
specific sequence upstream of the biotin biosynthetic operon and repress expression.
Not all lower organism ligases are bi-functional (1). Monofunctional ligases
catalyze biotin transfer to carboxylases, but do not regulate transcription in response
to the vitamin. The monofunctional ligases characterized to date can be monomeric or
constitutive dimers (31-33). Of particular interest has been the ligase from the

12
Pyrococcus horikoshii archeon due to the availability of crystal structures of a mutant
enzyme bound to the BCCP fragment (34). It is noteworthy that this ligase does not
homodimerize with the same surface that BirA uses, but both ligases use the same
area to interact with BCCP. Several key residues were identified in the structure,
many of which had been previously probed in BirA by alanine replacement. In
addition, a large number of backbone contacts were identified. These backbone
interactions are thought to be responsible for the ability of ligases to biotinylate
BCCP from other species.
1.1.6 The mammalian biotin protein ligase, or human holocarboxylase
synthetase
In contrast to the E. coli system, the mammalian biotin regulatory network is
not as well understood. A link between biotin and transcriptional status of several
genes has been known since the 1960s. However, the mechanism by which biotin
affects transcription remains elusive. Studies in mammalian fibroblasts with mutant
biotin ligase indicate that these cells are defective in biotin-responsive transcriptional
response and suggest that the human ligase, like its E. coli counterpart, plays a role in
biotin regulation (35). It has been proposed that the mechanism might involve direct
biotinylation of nucleosomes (36), but the inability to detect endogenous biotinylated
histones with methods other than antibodies has raised doubts about this hypothesis
(37). Alternatively, a lack of biotin-transcriptional response in normal HepG2 upon
inhibition of soluble guanylate cyclase suggested that regulation might occur through
a signaling cascade involving the biotin ligase and PKG.

13
The human biotin ligase or human holocarboxylase synthetase (HCS or
HsBPL), is a 726 amino acid protein with a molecular weight of 81 kDa. The C-
terminal domain encompasses the catalytic region and is 36% identical to BirA across
a 126 amino acid region, while its N-terminal sequence bears no homology to any
known protein except to the N-terminus of other higher organism ligases (38).
Characterization of HCS mRNA indicated that of the many different spliced mRNAs,
two code for proteins differing on the N-terminus (39). One variant is the full-length
protein and the other is a 74 kDa form, 58-HCS, which lacks the first 57 amino acids
at the N-terminus. An additional intermediate, 7-HCS, which lacks the first 6 amino
acids, has been proposed to arise from skipping of the first initiation codon in the full
length transcript (39-40).
Figure 6. HCS isoforms. There are two main isoforms of HCS in human cells, FL-
HCS and 58-HCS. The sequence of the additional 57 N-terminal residues that
distinguishes between full length HCS and 58-HCS, the two isoforms found in
mammalian cells is displayed in red. The BirA homologous region is highlighted in
green

14
The HCS N-terminus appears to be involved in biotin acceptor substrate
recognition. Studies that examined biotinylation of a truncated form of the BCCP
domain of the mammalian PCC and of the bacterial BCCP substrate by different
truncations of HCS in E. coli cell extracts determined that enzymes containing
intermediate length N-terminal deletions interfered with biotin acceptor substrate
recognition(41). In NMR studies performed with the BCCP domain of ACC2 and an
N-terminal fragment of HCS consisting of residues 1-160, Lee et al. showed that the
N-terminal domain affects the chemical shift of several residues of ACC2 BCCP (42).
In addition, biotinylating activity was observed when adding the N-terminal HCS
fragment and 160-HCS in trans, but it was compromised when catalyzed by the 160-
HCS fragment alone.
Localization of HCS has been a matter of some debate. HCS displays no
viable mitochondrial or nuclear localization signal (38). Narang et al found that HCS
localized primarily to the nucleus (43). However, subsequent experiments with GFP-
tagged HCS, as well as western blots, determined that FL-HCS localizes primarily to
the cytoplasm (44). The same study determined that the majority of 58-HCS is also
found in the cytoplasm, while a small fraction is present in the nucleus. Western blot
analysis of isolated mitochondria was inconclusive regarding the presence or absence
of HCS in this organelle. A different study of fresh placenta tissue by western blot
showed that HCS was mainly in the cytoplasm. The mitochondrial fraction showed a
band at 62 kDA that was proposed to be an isoform specific to the mitochondria (40).
A few studies have addressed the regulation of HCS. It was proposed that
HCS was transcriptionally regulated as a function of biotin (35,45), but mRNA levels

15
of HCS do not always change with biotin concentration (46). Differential localization
of the various isoforms in response to biotin is a plausible regulatory mechanism of
carboxylase biotinylation. However, studies to determine the identity of the 62 kDa
band observed in the mitochondria, and to assess distribution of HCS as a function of
biotin have not been performed. In addition, a possible mechanism for regulation at
the protein level emerged when a proteomic study identified threonine 146 and serine
147 as two likely phosphorylation sites on HCS (47). This finding, taken together
with the activation of guanylate cyclase by biotin (48), raises the possibility that
protein kinase G (PKG) is activated to phosphorylate transcription factors and,
perhaps, HCS. The relevance of phosphorylation for HCS activity is also unknown, as
are the kinases involved, but they suggest an additional level of regulation of biotin
metabolism.
1.1.7 Biotin protein ligase-BCCP interaction
Although there are studies that provide information on structural and sequence
elements important for BCCP recognition, a thorough understanding is still lacking.
The crystal structure of the thermophillic Pyrococcus horikoshii ligase bound to the
BCCP fragment is available(34). The ligase-BCCP interface is characterized by
hydrogen bonds among backbone residues and extensive van der Waals contacts.
However, not many of the interacting residues appear to be mediating specific
contacts likely to be responsible for the protein-protein recognition specificity. In
addition, screens have yielded peptides with amino acid sequences that do not
resemble BCCP but can be biotinylated as efficiently, further highlighting the

16
challenge in the determination of the sequence/structural elements responsible for
specificity(49).
The importance of several residues for the BCCP-ligase interaction has been
obtained through mutational studies on both proteins. Studies on E. coli BCCP have
identified, in addition to the target lysine, a glutamic acid at position 119 and several
conserved glycine residues that affect biotinylation(50). Unexpectedly, mutation of
the highly conserved methionine residues surrounding the target lysine in the MKM
motif does not significantly affect biotinylation(51). In the E. coli ligase several
surface loops are proposed to function in BCCP recognition and mutational analysis
of these loops has identified R116 and R119 as important for interaction with
BCCP(52). These residues are found in one of the conserved BirA loops, and are
therefore likely to be important for the recognition of BCCP by ligases from all
organisms.
1.1.8 Multiple carboxylase deficiency
Mutations on the HCS gene can lead to Multiple Carboxylase Deficiency
(MCD), a disease characterized by ketoacidosis, organic aciduria and mental
retardation (53-54). MCD presents a combination of the symptoms associated with
deficiency of the individual carboxylases. There are no known naturally occurring
HCS mutants that do not have at least some residual biotinylating activity, and null
mutations are thought to be lethal in accord with HCS importance in biotin
metabolism. MCD makes characterization of HCS and the effect of mutations even
more pressing, although most MCD cases can be managed with pharmacological
doses of biotin.

17
Information regarding the effect of certain amino acid changes on HCS
activity can be obtained from the behavior of MCD associated variants. HCS catalytic
activity in lysates obtained from MCD patients has been measured, usually using the
bacterial carboxylase as a substrate. The variant enzymes display a wide range of
defects that can affect both the catalytic activity and KM for biotin(39,55-58). Some of
the mutations affect positions in the catalytic domain of HCS. Others affect positions
in the N-terminus and stress the importance of this domain to HCS function. Some
broad correlations have been drawn regarding the effects of mutations and clinical
symptoms responsiveness to biotin therapy. Those mutations altering the N-terminus
tend to affect the kcat (59), and to not respond as readily to biotin administration. Yet,
a characterization regarding altered KM for the acceptor substrates is rarely
performed, despite its importance as it provides an explanation for poor biotin
responsiveness.
1.2 The experimental problem
In spite of HCS importance for biotin metabolism, biochemical
characterization of HCS function has been lacking. These studies have been hindered
by the lack of a method to obtain sufficient amounts of pure protein. In chapter 2, we
describe the recombinant expression of FL-HCS and 58-HCS in E. coli and their
subsequent purification. In addition, chapter 2 includes the design of several assays to
perform a steady state kinetic characterization of the effects of p67 or the minimal
carboxylase acceptor substrate, ATP and biotin concentrations. Stopped flow studies
of each of the two half reactions catalyzed by HCS showed that bio-5‟-AMP

18
synthesis is the limiting step in the overall reaction. The two isoforms behaved
similarly in all the assays, except for biotin transfer from the intermediate to the PCC
biotin acceptor protein, where FL-HCS was twofold faster than 58-HCS. This led to
the conclusion that HCS N-terminus is involved in biotin acceptor substrate
recognition and highlighted the importance of protein-protein interaction as a source
of substrate specificity.
Chapter 3 comprises a more detailed investigation of the biotin transfer
reaction. The previous stopped flow experiments monitored the enzyme substrate
disappearance and yielded information on the bimolecular rate of enzyme-substrate
association. The same rates were obtained when monitoring product formation using
tritium labeled biotin in a quench flow assay. This indicated that biotin transfer is
limited by the bimolecular rate of enzyme-substrate association. Comparison to the
results obtained with BirA, the E. coli enzyme, and PhBPL, an archaeal ligase,
showed that this mechanistic aspect is conserved among evolutionary domains. In
addition, the enzymes biotinylated the substrates from the other species with a wide
range of rates, once again highlighting protein-protein interactions as the basis of
selectivity in post-translational biotin addition.
Insight into HCS substrate specificity among the various endogenous human
substrates is presented in Chapter 4. HCS associated with the biotin acceptor
fragment of PC, PCC and MCC carboxylases with rates that range from 10000 to
35000 M-1
s-1
. ACC1 and ACC2 behaved differently, with the chemistry of biotin
transfer becoming the rate limiting step. The different behavior correlated with the
carboxylases localization, since ACC1 and ACC2 are present in the cytoplasm, while

19
the other carboxylases are transported into the mitochondria. A model consistent with
these observations is that HCS biotinylates PC, PCC and MCC enzymes faster
because mitochondrial enzymes are only transiently present in the cytoplasm and
should be post-translationally modified before they reach their final destination.
Conversely, HCS has continuous access to ACC1 and ACC2, so there has not been
any evolutionary pressure to increase the biotinylation reaction speed. In addition, the
data suggest a molecular mechanism for the establishment of a hierarchy that
determines biotin distribution among carboxylases based on the rates of bimolecular
association. Carboxylases will compete for the biotin, and those that have the highest
apparent rate of association, which will depend on substrate concentration and
inherent association rate, will be preferentially modified.

20
Chapter 2: Biochemical characterization of FL-HCS and 58-
HCS
The work presented in this chapter was originally published in the Journal of
Biological Chemistry: Maria Ingaramo and Dorothy Beckett. Distinct Amino Termini
of Two Human HCS Isoforms Influence Biotin Acceptor Substrate Recognition.
Journal of Biological Chemistry. 2009; 284, 30862-30870. the American Society
for Biochemistry and Molecular Biology.
2.1 Abstract
The human holocarboxylase synthetase (HCS) catalyzes transfer of biotin to
biotin-dependent carboxylases, and the enzyme is therefore of fundamental
importance for many physiological processes, including fatty acid synthesis,
gluconeogenesis, and amino acid catabolism. In addition, the enzyme functions in
regulating transcription initiation at several genes that code for proteins involved in
biotin metabolism. Two major forms of HCS exist in humans, which differ at the
amino terminus by 57 amino acids. In this work, the two proteins were expressed in
Escherichia coli, purified, and subjected to biochemical characterization. Equilibrium
sedimentation indicates that the two proteins are monomers both in their apo-forms
and when bound to the enzymatic intermediate biotinyl 5‟-AMP. Steady state kinetic
analyses as a function of biotin, ATP, or a minimal biotin-accepting substrate
concentration indicate similar behaviors for both isoforms. However, pre-steady state
analysis of biotin transfer reveals that the full-length HCS associates with the minimal
21
biotin acceptor substrate with a rate twice as fast as that of the truncated isoform.
These results are consistent with a role for the HCS amino terminus in biotin acceptor
substrate recognition.
2.2 Introduction
Biotin protein ligases are enzymes that are required for viability of all
organisms. In metabolism these enzymes catalyze covalent linkage of biotin to biotin-
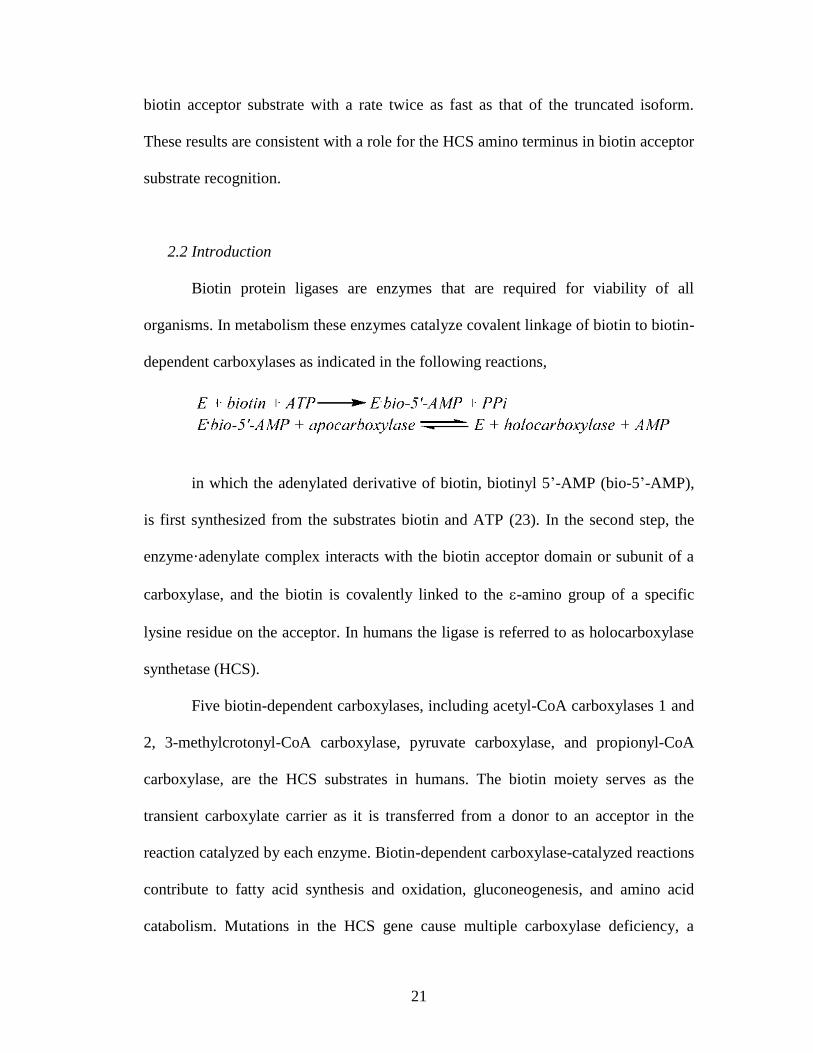
dependent carboxylases as indicated in the following reactions,
in which the adenylated derivative of biotin, biotinyl 5‟-AMP (bio-5‟-AMP),
is first synthesized from the substrates biotin and ATP (23). In the second step, the
enzyme·adenylate complex interacts with the biotin acceptor domain or subunit of a
carboxylase, and the biotin is covalently linked to the -amino group of a specific
lysine residue on the acceptor. In humans the ligase is referred to as holocarboxylase
synthetase (HCS).
Five biotin-dependent carboxylases, including acetyl-CoA carboxylases 1 and
2, 3-methylcrotonyl-CoA carboxylase, pyruvate carboxylase, and propionyl-CoA
carboxylase, are the HCS substrates in humans. The biotin moiety serves as the
transient carboxylate carrier as it is transferred from a donor to an acceptor in the
reaction catalyzed by each enzyme. Biotin-dependent carboxylase-catalyzed reactions
contribute to fatty acid synthesis and oxidation, gluconeogenesis, and amino acid
catabolism. Mutations in the HCS gene cause multiple carboxylase deficiency, a

22
potentially fatal disease characterized by the concurrence of symptoms associated
with each individual carboxylase deficiency (60-61).
In response to changes in biotin availability, HCS has been demonstrated to
function in regulating transcription of the gene that encodes HCS itself as well as
those that code for propionyl-CoA carboxylase, pyruvate carboxylase, acetyl-CoA
carboxylase 1, and the sodium-dependent multivitamin transporter (48,62). This
transcriptional regulatory process is associated with the soluble guanylyl cyclase
signal transduction pathway (35). It has also been suggested that HCS exerts its
transcriptional regulatory role by catalyzing biotin linkage to histones (36) (Fig. 7).

23
Figure 7. HCS function in metabolism and transcription regulation. The
enzyme utilizes substrates biotin and ATP to catalyze synthesis of bio-5‟-AMP. The
HCS·intermediate complex interacts with carboxylases to transfer biotin or functions
in transcription, perhaps through histone biotinylation.

24
Full-length HCS is a 726-amino acid polypeptide, characterized by a
molecular mass of 81 kDa. Although residues 448–701 are homologous to the
catalytic region of the Escherichia coli ligase, BirA (57), the sequence of the amino-
terminal 447 residues of HCS bears homology only to the amino-terminal sequences
of other mammalian holocarboxylase synthetases. Although only one copy of the
HCS gene is present per haploid genome, analysis of the 5‟ termini of cDNAs (38),
elucidation of the structure of the HCS gene (39), and purification of HCS from
human tissue (40) indicate the existence of more than one form of the protein.
Characterization of HCS cDNAs revealed an mRNA in which the initiator codon
corresponds to methionine 58 in the full-length coding sequence(38). In addition,
Western blot analysis of partially purified HCS from human placenta revealed three
species that were assigned to the full-length HCS protein (FL-HCS) and species that
initiated translation at methionine 7 or methionine 58 (58-HCS) (40).
The significance of these distinct HCS forms for functional biology is not
known. It is possible that the two isoforms are characterized by different catalytic
activities. Alternatively, the different forms may play distinct roles in the metabolic
versus transcriptional functions of the enzyme. To investigate the enzymatic
properties of the two isozymes, we have overexpressed and purified FL-HCS and 58-
HCS to homogeneity. Sedimentation equilibrium measurements of the two proteins
indicate that each is monomeric in both the unliganded state and when saturated with
the intermediate in biotin transfer, biotinyl 5‟-AMP. Steady state parameters
governing the overall biotin transfer reaction using the model substrate p67, a
fragment of propionyl-CoA carboxylase, show that they are very similar. However,

25
pre-steady state kinetic analysis of the second half-reaction revealed that FL-HCS
associates with p67 at a faster rate than does 58-HCS. The results indicate that the
two isoforms are functionally distinct and that the amino terminus influences the
kinetics of interaction of the enzyme with the biotin acceptor protein.
2.3 Experimental procedures
2.3.1 Chemicals and Biochemicals
All chemicals used were at least reagent grade. The stock ATP solutions were
prepared by dissolving ATP disodium salt (Sigma) into water and adjusting the pH to
7.5. The nucleotide concentration was determined by UV spectroscopy using an
extinction coefficient at 259 nm of 15,400 M cm−1
. The D-[carbonyl-14
C]biotin (GE
Healthcare) was stored desiccated under nitrogen at −20 °C. Biotin D-2,3,4,6-3H was
purchased from American Radiolabeled Chemicals, Inc., and stored at −20 °C. The
bio-5‟-AMP was synthesized and purified as described previously (23,63). Protein
extinction coefficients were calculated according to Gill and von Hippel (64).
2.3.2 Expression Plasmid Construction
The strategy developed to overexpress FL-HCS and 58-HCS involved
constructing plasmids that encode amino-terminal his6-SUMO fusions of each protein
using the linearized pSUMOpro (LifeSensors Inc.) expression vector (65). Primers
containing an Esp3I restriction site were used to amplify the HCS coding sequences
by PCR. The coding sequence for 58-HCS was amplified from a pGEX construct
provided by Dr. Roy Gravel. The FL-HCS cDNA sequence (GenBankTM accession
number NM_000411.4) was purchased from OriGene Technologies, Inc. After

26
digestion of the PCR product with Esp3I (Fermentas), the resulting two coding
sequence fragments were ligated into the linearized pSUMO vector using T4 ligase
(Roche Applied Science), and the ligation mixtures were transformed into the E. coli
top10 strain. Plasmids were verified by sequencing the entire insert.
2.3.3 Purification of 58-HCS and FL-HCS
The plasmids encoding his6-SUMO-FL-HCS and his6-SUMO-58-HCS were
transformed into E. coli RosettaTM(DE3). Once the culture had reached an A600 of
0.6, induction was achieved by the addition of lactose (Difco) to a final concentration
of 0.5% (w/v) and allowed to proceed for 18–20 h at 25 °C. Cells were harvested,
resuspended in 30 ml of lysis buffer/liter of culture (50 mM sodium phosphate buffer,
pH 8, 500 mM sodium chloride, 1 mM 2-mercaptoethanol, 1 mM
phenylmethylsulfonyl fluoride, and 5% (v/v) glycerol containing 10 mM imidazole),
and lysed with three French press passes at 800–1000 p.s.i. The cellular debris was
pelleted by centrifugation, and the supernatant was loaded onto a Ni2+
-Sepharose
column (GE Healthcare). After washing extensively, 20 ml of lysis buffer containing
1 mM ATP, 0.5 mM magnesium chloride, and 1 μM of the biotin acceptor protein
p67 was loaded on the column to remove residual biotin and bio-5‟-AMP that was
associated with the enzyme. After a wash step, the HCS protein was eluted with lysis
buffer containing 400 mM imidazole. Sumo protease-1 (66) that was purified in this
laboratory using an overexpression plasmid provided by Dr. C. Lima was added at a
1:100 (w/w) ratio to the HCS, and the mixture was dialyzed into buffer containing 10
mM sodium phosphate, pH 8.0, 60 mM NaCl, 5% (v/v) glycerol, 5 mM 2-
mercaptoethanol. Following overnight incubation, the imidazole concentration was
27
adjusted to 40 mM, and the sample was loaded again onto Ni2+
-Sepharose resin to
remove the his6-SUMO tag and the his6-tagged protease. The flow-through was
collected and dialyzed against buffer containing 10 mM sodium phosphate, pH 8.0,
30 mM NaCl, 1 mM 2-mercaptoethanol, 5% glycerol. The resulting sample was
loaded onto a Toyopearl anion exchange column (Tosoh Bioscience) and eluted with
a linear gradient to 0.3 M NaCl. HCS was concentrated and stored in 10 mM Tris-
HCl, pH 8, 200 mM sodium chloride, 10% glycerol at −80 °C. The yield was 2 mg of
protein/liter of bacterial culture and the concentration of each protein was determined
spectrophotometrically using an extinction coefficient at 280 nm of 56,610 M cm−1
(64). The proteins were at least 97% pure as judged by Coomassie Brilliant Blue
staining of samples subjected to SDS-PAGE.
2.3.4 Purification of p67
The pDest17 plasmid coding for his6-p67 was a generous gift from Dr. Roy
Gravel. Purification of his6-p67 was carried out as described previously (67), except
for the use of an additional SP-Sepharose Fast Flow column (GE Healthcare). This
column was run with a linear KCl gradient in 50 mM Tris-HCl, pH 7.5, at 4 °C, 5%
glycerol, 1 mM 2-mercaptoethanol. The concentration was determined
spectrophotometrically using an extinction coefficient at 276 nm of 4350 M cm−1
.
The presence of biotinylated p67 in the preparations was undetectable, as determined
by MALDI-TOF mass spectrometry using the α-cyano-4-hydroxycinnamic acid
matrix (28). The same method was used to determine that all of the p67 preparation is
active in accepting biotin.
28
2.3.5 Equilibrium Sedimentation Measurements
Equilibrium sedimentation measurements were carried out in a Beckman
Optima XL-I analytical centrifuge equipped with a 4-hole An60-Ti rotor (Beckman
Coulter). Double sector 12-mm path length cells with charcoal-filled Epon
centerpieces and sapphire windows were used. Samples (VTOT = 140 μl) were
prepared at final concentrations ranging from 2 to 20 μM from protein that had been
extensively dialyzed against reaction buffer (10 mM Tris-HCl, pH 7.50 ± 0.02 at 20.0
± 0.1 °C, 200 mM KCl, 2.5 mM MgCl2). Samples that contained HCS, FL- or 58-,
and bio-5‟-AMP were prepared with 1.5-fold molar excess of the ligand over the
protein. Centrifugation was carried out at speeds ranging from 14,000 to 22,000 rpm
for 12 h at each speed (68), and absorbance scans were acquired at 280 or 295 nm, if
the bio-5‟-AMP contribution needed to be avoided, with a step size of 0.001 cm and
five averages per step. The data obtained for the samples run at the multiple speeds
were subjected to a global single species analysis using the program WinNonLin (69),
and the best fit value of σ obtained from the analysis was converted to molecular
mass using the following equation,
M(1)2
RT
in which M is the molecular mass v is the partial specific volume of the
protein, ρ is the buffer density; ω is the angular velocity; R is the gas constant; and T
is the temperature. The value of ρ (1.007 g/ml) was determined pycnometrically (70),
and v was calculated, based on the protein sequences, to be 0.7389 ml/g for 58-HCS
or 0.7392 ml/g for FL-HCS using the program SedenTerp.

29
2.3.6 Steady State Kinetic Measurements
Kinetic measurements of the overall HCS-catalyzed reaction as a function of
ATP or p67 concentration were performed by monitoring the incorporation of
[14
C]biotin into p67. The reactions were carried out in reaction buffer at 37.0 ± 0.1 °C
and initiated by the addition of enzyme to a final concentration between 50 and 150
nM. At designated time points, a 17-μl aliquot was quenched into a solution
containing 5.1 μl of loading dye and 3.4 μl of 1% trifluoroacetic acid (in H2O). The
loading dye was composed of 50 mM Tris-HCl, pH 6.8, 4% SDS, 30% glycerol, 0.67
mg/ml Coomassie Brilliant Blue G-250, 735 mM 2-mercaptoethanol. Unincorporated
[14
C]biotin was separated from the 14
C-biotinylated p67 by electrophoresis on a 16%
acrylamide-SDS-Tricine gel (71). The gels were dried on Whatman 3MM paper and
exposed to a phosphor screen (GE Healthcare) for 3 days. The phosphor screen image
was scanned using a Storm PhosphorImager, and the volumes of the bands
corresponding to [14
C]biotin-labeled p67 were quantified using the ImageQuant
software (GE Healthcare). Initial velocities were obtained from the slope of counts
versus time plot. The initial velocity versus substrate concentration data were
subjected to nonlinear least squares analysis using the Michaelis-Menten equation
with GraphPad Prism to obtain Vmax and Km. The Vmax and kcat values were converted
from counts/min to micromolars of biotin using the relation between counts/min and
micromolars obtained from a reaction containing 50 μM p67, 150 nM HCS, 10 μM
biotin, and 1 mM ATP in standard reaction buffer incubated for 1 h to allow complete
incorporation of the biotin into the acceptor protein. In experiments in which the
Michaelis-Menten constants for p67 were determined, the [14
C]biotin and ATP

30
concentrations were set at saturating values of 10 μM and 1 mM, respectively. The
Km and kcat values for ATP were determined in a similar fashion, with the exception
that the reactions contained 50 μM p67, 10 μM [14
C]biotin, and variable ATP
concentrations.
The biotin concentration dependences of the reactions catalyzed by FL- and
58-HCS were determined by quantitating the incorporation of [3H]biotin into p67.
Each reaction contained 16.67 nM [3H]biotin and a supplement of unlabeled biotin to
obtain the desired final total biotin concentration. The p67 and ATP concentrations
were 150 μM and 1 mM, respectively. Reactions were initiated by addition of enzyme
to 5 nM final concentration, and aliquots were quenched with trifluoroacetic acid
added to a final concentration of 0.3% (v/v). Quenched reactions were filtered though
BA 85 Protran nitrocellulose membranes (Whatman), and the retained radioactivity
was quantified in ProteinReady+ scintillation fluid (Beckman) using a LS6500
Beckman counter. The measured disintegrations/min were converted to molar
quantities of biotin incorporated by multiplying by total biotin concentration/dpm of
unfiltered sample. The correction for filter retention was achieved by using the
disintegrations/min associated with a filtered and unfiltered reaction in which 10 μM
cold biotin and 16.67 nM [3H]biotin were fully incorporated into p67.
2.3.7 Steady State Fluorescence Spectra
Steady state fluorescence spectra were acquired at 20 °C in reaction buffer
using an ISS PC1 instrument. The excitation wavelength was 295 or 300 nm, and
emission was monitored from 310 to 450 nm. The excitation slit width was set to 4 or

31
8 nm, and the emission slit width was 8 nm. Spectra were corrected for contributions
from buffer and ligand and for dilution.
2.3.8 Initial Rate of Bio-5′-AMP Synthesis
The rate of bio-5‟-AMP synthesis was measured at 20 °C by monitoring the
intrinsic protein fluorescence decrease that accompanies synthesis of the intermediate.
The experiments were performed in a Kintek 2001 stopped flow instrument using an
excitation wavelength of 295 or 300 nm and monitoring the emission through a 340-
nm cutoff filter (Corion Corp.). Several ATP solutions prepared at concentrations
ranging from 25 to 800 μM were rapidly mixed in a 1:1 ratio with a solution of a
fixed concentration of HCS containing 30 μM biotin. Initial HCS concentrations
varied from 2 to 6 μM, and all solutions were prepared in degassed reaction buffer. A
minimum of five traces that spanned at least eight half-lives of the process was
collected at each ATP concentration. Transients were analyzed using a double
exponential function with the Kintek software. The dependences of the apparent rates
of the two phases on ATP concentration are discussed under “Results.”
2.3.9 Measurement of the Bimolecular Association Rate Constant of HCS with
p67
The bimolecular rate of association of HCS with p67 was obtained by
monitoring the intrinsic fluorescence increase of HCS upon depletion of the bio-5‟-
AMP·HCS complex. The instrument and experimental setup were as described above,
with the exception that one syringe contained varying concentrations of p67, and the
second syringe contained a fixed concentration of the HCS·bio-5‟-AMP complex.
The HCS·bio-5‟-AMP complex concentration before mixing ranged from 1 to 3 μM

32
in different experiments. This solution was prepared by combining HCS with biotin at
half of the enzyme concentration and 100 μM ATP and incubating for 10 min to
allow completion of bio-5‟-AMP synthesis. This solution was rapidly mixed with
p67, and the resulting time-dependent increase in intrinsic HCS fluorescence was
monitored. At least five traces acquired at each [p67] were fit to single exponential to
obtain apparent rates. The observed rates as a function of p67 concentration were
subjected to further analysis as described under “Results.”
2.4 Results
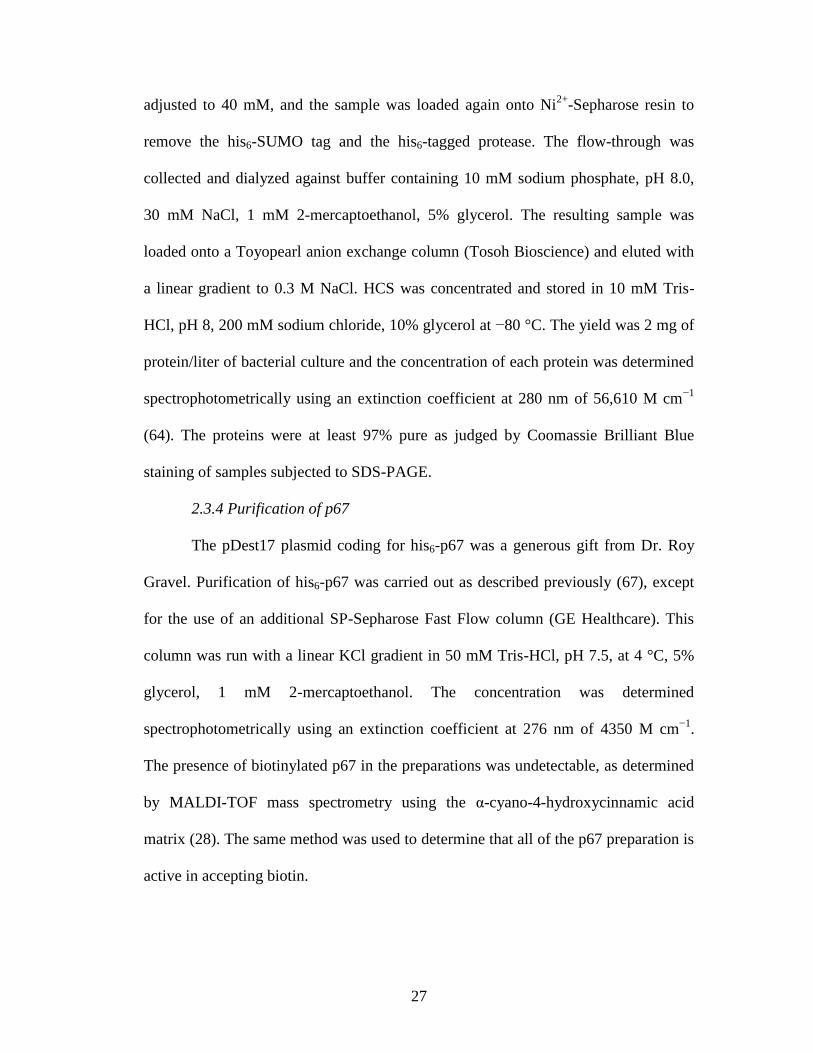
2.4.1 Purification of HCS Isoforms
The two HCS isoforms were expressed in E. coli as his6-SUMO fusion
proteins, and the purification protocol, which included three chromatography steps,
yielded preparations that were >97% pure (Fig. 8). Because SUMO-protease-1 leaves
no exogenous amino acids after cleavage, the final proteins correspond to native 58-
HCS and FL-HCS. In the purification, it was necessary to incorporate steps to remove
bio-5‟-AMP from the preparations. This contamination was revealed by the ability to
detect biotinylation of p67 in the absence of added biotin. Biotinylation was assayed
as a shift in the mass of a fraction of the p67 using MALDI-TOF mass spectrometry.
Both the E. coli and Pyroccocus horikoshii enzymes have been purified in this
laboratory, and in contrast to the Homo sapiens enzyme, no contaminating substrate
or intermediate has ever been detected in those preparations.
33
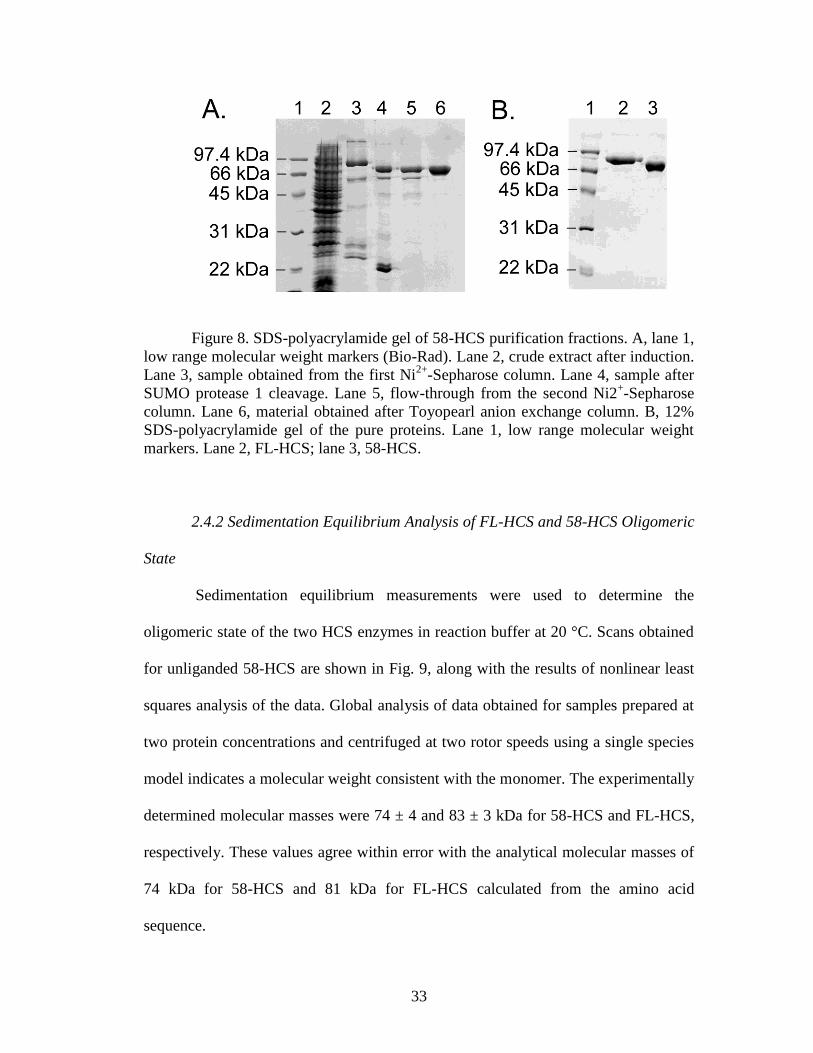
Figure 8. SDS-polyacrylamide gel of 58-HCS purification fractions. A, lane 1,
low range molecular weight markers (Bio-Rad). Lane 2, crude extract after induction.
Lane 3, sample obtained from the first Ni2+
-Sepharose column. Lane 4, sample after
SUMO protease 1 cleavage. Lane 5, flow-through from the second Ni2+-Sepharose
column. Lane 6, material obtained after Toyopearl anion exchange column. B, 12%
SDS-polyacrylamide gel of the pure proteins. Lane 1, low range molecular weight
markers. Lane 2, FL-HCS; lane 3, 58-HCS.
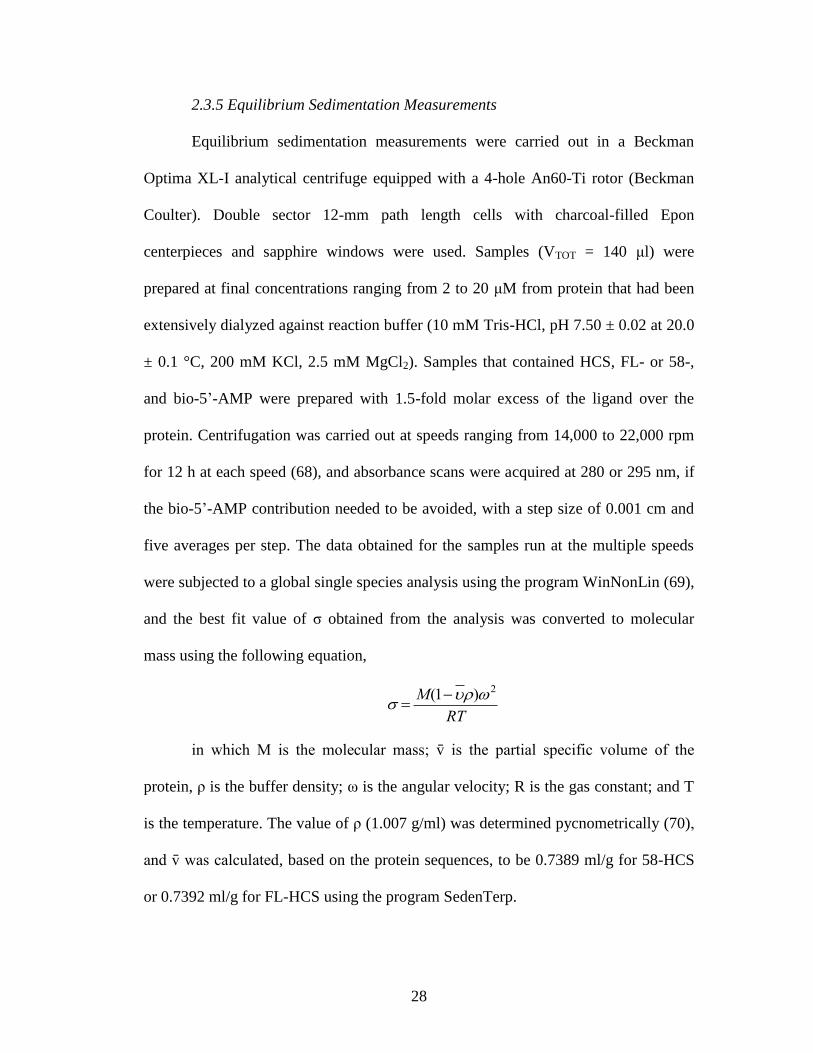
2.4.2 Sedimentation Equilibrium Analysis of FL-HCS and 58-HCS Oligomeric
State
Sedimentation equilibrium measurements were used to determine the
oligomeric state of the two HCS enzymes in reaction buffer at 20 °C. Scans obtained
for unliganded 58-HCS are shown in Fig. 9, along with the results of nonlinear least
squares analysis of the data. Global analysis of data obtained for samples prepared at
two protein concentrations and centrifuged at two rotor speeds using a single species
model indicates a molecular weight consistent with the monomer. The experimentally
determined molecular masses were 74 ± 4 and 83 ± 3 kDa for 58-HCS and FL-HCS,
respectively. These values agree within error with the analytical molecular masses of
74 kDa for 58-HCS and 81 kDa for FL-HCS calculated from the amino acid
sequence.
34
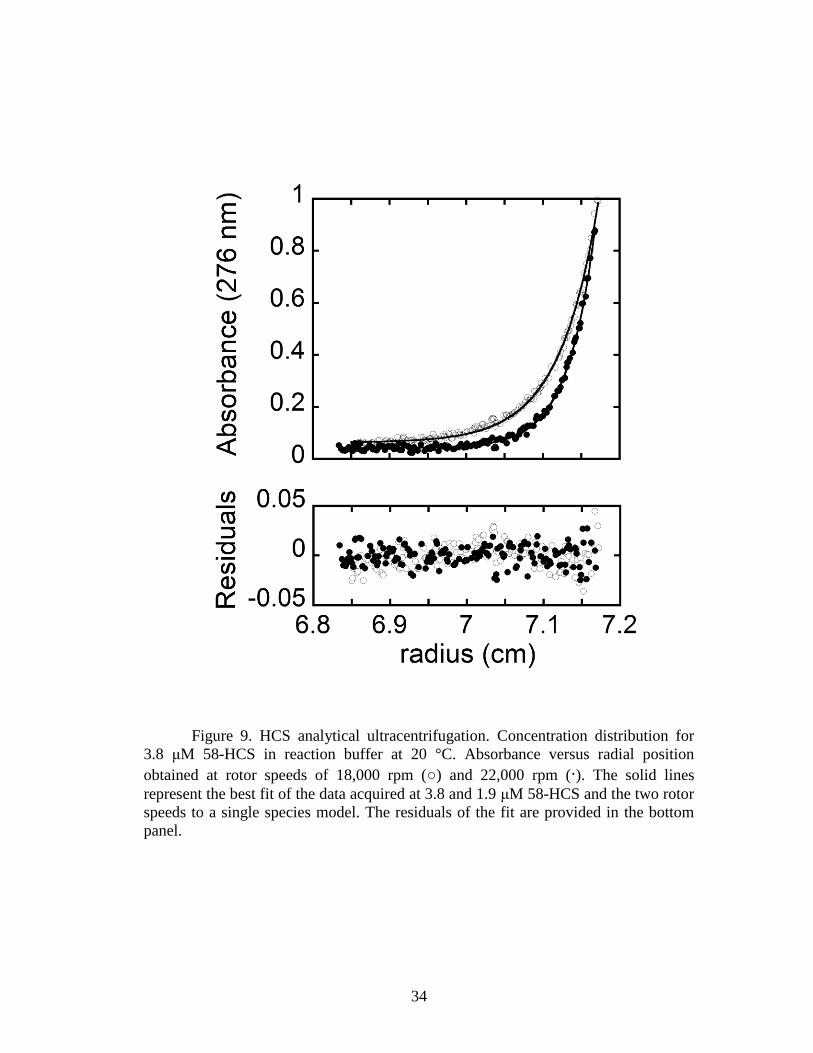
Figure 9. HCS analytical ultracentrifugation. Concentration distribution for
3.8 μM 58-HCS in reaction buffer at 20 °C. Absorbance versus radial position
obtained at rotor speeds of 18,000 rpm (○) and 22,000 rpm (∙). The solid lines
represent the best fit of the data acquired at 3.8 and 1.9 μM 58-HCS and the two rotor
speeds to a single species model. The residuals of the fit are provided in the bottom
panel.

35
The E. coli biotin protein ligase undergoes a monomer-dimer transition that is
dependent on bio-5‟-AMP binding (70). To investigate the effect of the intermediate
on the self-association of the two HCS enzymes, sedimentation equilibrium
measurements were performed in the presence of excess bio-5‟-AMP. The
experimentally obtained molecular masses for the intermediate bound species were 79
± 8 kDa for 58-HCS and 83 ± 7 kDa for FL-HCS, consistent with a monomeric
species. Thus, both the unliganded and intermediate-bound forms of FL and 58-HCS
are monomeric.
2.4.3 Kinetic Analysis of the Two-step HCS-catalyzed Reaction
In the HCS-catalyzed reaction, biotin is covalently linked to a specific lysine
residue on the biotin carboxyl carrier protein domain of five distinct carboxylases.
The physiologically relevant substrates contain multiple copies of this domain. To
develop a simple assay for measuring the catalytic activity of the purified HCS
enzymes, the p67 domain of propionyl-CoA carboxylase was employed as the model
acceptor substrate. This protein corresponds to the carboxyl-terminal 67 residues of
the α subunit of human propionyl-CoA carboxylase, which contains sufficient
information for recognition by the human biotin protein ligase (72).
The two kinetic assays used in this work rely on measurements of
incorporation of radiolabeled biotin into p67. In the first assay, [14
C]biotin
incorporation into p67 was monitored. The [14
C]biotin-labeled p67 was separated
from the unincorporated biotin by electrophoresis, and radioactivity in the bands
corresponding to p67 was quantitated by phosphorimaging (Fig. 10A). The initial rate
at several ATP concentrations and constant biotin and p67 concentrations exhibit the

36
expected increase in the rate of [14
C]biotin incorporation with increasing ATP
concentration (Fig. 10B).
Figure 10. Kinetic assays used to determine Michaelis-Menten constants for
HCS-catalyzed biotin transfer with respect to p67, biotin, and ATP. A, incorporation
of [14
C]biotin into p67 was used to determine the kinetic constants with respect to p67
and ATP. The biotinylated p67 and free biotin are separated on a 16% acrylamide gel.
B, biotin incorporation versus time at 150 nM 58-HCS, 50 μM p67, 10 μM
[14
C]biotin, and a range of ATP concentrations as follows: (■, 5 μM; ▴, 30 μM; ▾, 90
μM; ♦, 250 μM; ∙, 500 μM; □, 750 μM; and ▵, 1000 μM ATP. C, incorporation of
[3H]biotin into p67 used to determine the kinetic constants with respect to biotin.
Biotinylated p67 is separated from unincorporated biotin by filtration through a
nitrocellulose membrane. D, initial rates of biotin incorporated measured at 5 nM FL-
HCS, 150 μM p67, 16.67 nM [3H]biotin and variable unlabeled biotin concentrations
as follows: ▾, 20 μM; ■, 10 μM; ♦, 7 μM; ∙, 3 μM; and ▴, 1 μM biotin. The inset
depicts the traces obtained for the following: ▿, 400 nM; Δ, 150 nM; and ◊, 50 nM
total biotin. B and D, the lines were obtained from linear regression of the measured
biotin incorporation versus time.

37
The second assay for HCS catalytic activity monitors [3H]biotin incorporation
into p67. The [3H]biotin-labeled p67 was separated from the unincorporated biotin by
filtration through nitrocellulose and quantitated by liquid scintillation counting (Fig.
10C). The relatively low Km value for biotin, the detection limit of the 14
C radiation
using phosphorimaging, and a new lack of commercial availability of the [14
C]biotin
motivated development of this second assay. Results of measurements of the initial
rates of HCS-catalyzed [3H]biotin incorporation at constant ATP and p67
concentrations and varying total biotin concentrations are shown in Fig. 10D. The
time courses used for initial rate measurements at low biotin concentrations were
carried out for a shorter time than those acquired at the higher biotin concentration.
This is due to the higher specific activity of the substrate at the low cold biotin
concentration, which allowed acquisition of data over shorter time periods.
To investigate if the amino-terminal 57-amino acid residues impact the basic
catalytic properties of the human biotin protein ligase, the kinetic parameters
associated with the process were measured for both FL-HCS and 58-HCS.
Measurements of the initial rates of biotin transfer as a function of p67 concentration
are shown in Fig. 11, A and B. The results indicate Km values of 19 and 21 μM,
respectively, for FL-HCS and 58-HCS (Table 1) and values of kcat that are similar at
0.47 and 0.35 s−1
, respectively. The magnitudes of kcat/Km are, within error, identical.

38
Figure 11. Steady state kinetic analysis of biotin incorporation into p67
catalyzed by 58-HCS and FL-HCS. Samples of steady state analysis of the reaction
catalyzed by 58-HCS (A) and FL-HCS (B) as a function of p67 concentration are
shown. Data were obtained as a function of ATP concentration for 58-HCS (C) and
FL-HCS (D). E and F display results of steady state measurements for 58-HCS and
FL-HCS as a function of biotin concentration. In these two panels each data point
represents the average of the initial rate measured at each biotin concentration in three
independent experiments. In E and F, the error bars represent the standard deviation
of each three points. In each panel the solid line represents the best fit of the data to
the Michaelis-Menten equation.

39
Table 1. Kinetic parameters for the overall HCS-catalyzed reaction.
HCS form Substrate KM kcat kcat/ KM
M
s-1
x104 M
-1 s
-1
58 p67 19 ± 4a 0.35 ± 0.02
a 1.8 ± 0.4
ATP 41 ± 10a 0.33 ± 0.02
a,b 0.8 ± 0.2
(0.24 ± 0.01)a,c
0.6 ± 0.1
biotin 0.7 ± 0.3d 0.11 ± 0.01
d 16 ± 7
FL p67 21 ± 2 a 0.47 ± 0.01
a 2.2 ± 0.2
ATP 47 ± 8 a 0.45 ± 0.02
a,b
(0.32 ± 0.01)a,c
1.0 ± 0.2
0.7 ± 0.1
biotin 0.8 ± 0.2d 0.17 ± 0.01
d 21 ± 5
a The errors correspond to the standard deviation of two independent experiments.
b
The calculated value is based on the experimentally obtained kcat at 50 μM p67.c
Experimentally obtained kcat was at 50 μM p67.d The error represents the standard
error obtained from globally fitting data from three independent experiments.
A similar analysis as a function of ATP concentration (Fig. 11, B and D)
provides Km values for ATP of 41 and 47 μM for 58-HCS and FL-HCS, respectively.
The magnitude of kcat associated with ATP obtained from direct fitting of the data is
lower than that obtained from measurements of the p67 concentration dependence of
the reaction. This is attributable to the necessity, due to the appearance of a doublet
for the labeled p67 at high concentrations, of using an acceptor protein concentration
of 50 μM in the ATP concentration dependence measurements. Normalization of the
resolved kcat values obtained from analysis of the ATP concentration dependence of
the reactions to those obtained from the measurements of the p67 concentration
dependence reveals that they are identical (Table 1).
The FL-HCS and 58-HCS enzymes were subjected to Michaelis-Menten
analysis of the biotin concentration dependence of the reaction using [3H]biotin. The
40
results of measurements of the initial rates versus biotin concentration indicate that
both FL- and 58-HCS-catalyzed reactions are well described by a Michaelis-Menten
model (Fig. 11, E and F). The initial rate at each biotin concentration represents the
average of at least three independent measurements. Results of nonlinear least squares
analysis of the data indicate that the two enzymes are similar with respect to their rate
versus biotin concentration profiles. The kcat values resolved from the analysis are ~3-
fold lower than those obtained from analysis of data obtained using SDS-PAGE to
separate products from reactants. Because p67 and ATP concentrations used in the
measurements were saturating, the differences in the values of kcat reflect differences
intrinsic to the two assays.
2.4.4 Pre-steady State Analysis of Bio-5′-AMP Synthesis
The overall reaction catalyzed by HCS can be classified as a ping-pong
mechanism, which allows measurement of the two individual half-reactions. Upon
bio-5‟-AMP synthesis, decreases in intrinsic protein fluorescence of ~14% for FL-
HCS and 23% for 58- HCS are observed (Fig. 12A). A stopped flow experiment was
developed to investigate the first half-reaction, in which biotin-bound HCS was
rapidly mixed with ATP. Measurement of the time dependence of the fluorescence
decrease revealed that it was well described by a double exponential model (Fig. 12A,
inset). A loss in amplitude with increasing ATP concentration was observed, which
was attributed to the faster phase becoming increasingly fast and outside of the dead
time of the stopped flow instrument. The apparent rates for the two phases were
plotted as a function of ATP concentration (Fig. 12B). The observed linear

41
dependence of the faster phase on ATP concentration and the saturable slower phase
are consistent with the following reaction,
in which the slope of the linear dependence of the apparent rate of the fast
phase on nucleotide concentration provides an estimate of the rate of association of
ATP with the HCS·biotin complex, k1 (Table 2). Nonlinear least squares analysis of
the concentration dependence of the second phase using the Michaelis-Menten model
yielded kcat and Km values for the reaction. The parameters obtained for 58-HCS and
FL-HCS from these two analyses are similar in magnitude (Table 2).
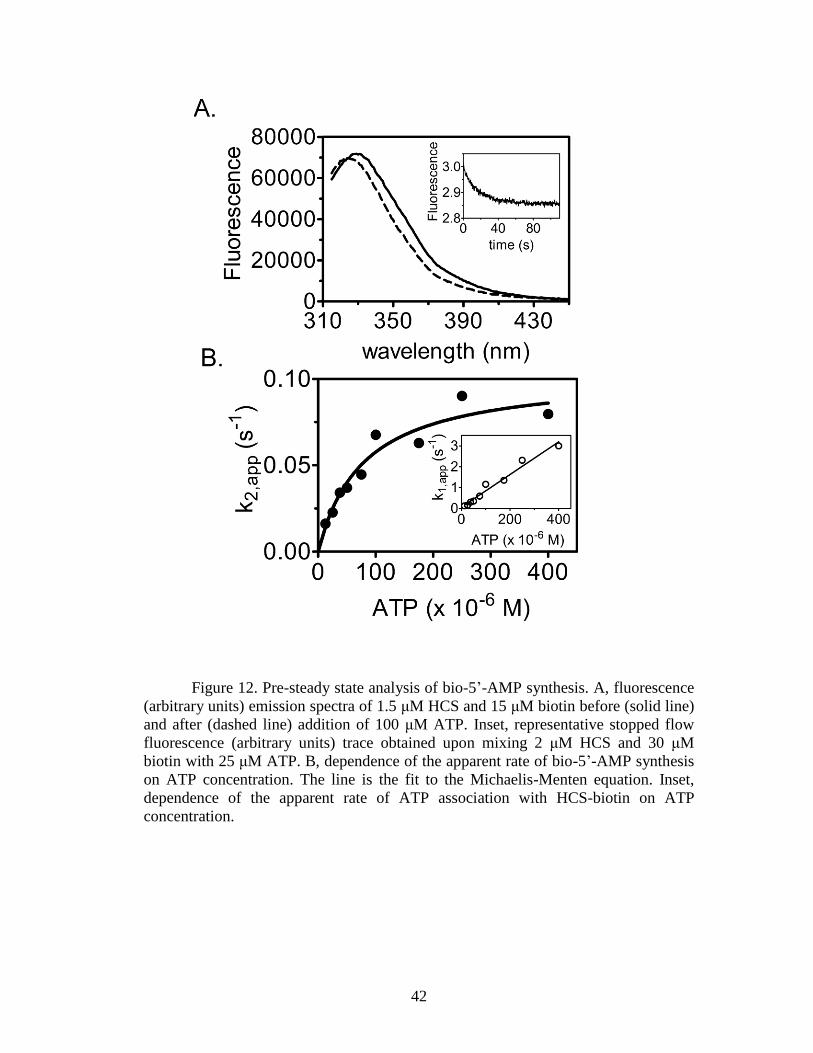
42
Figure 12. Pre-steady state analysis of bio-5‟-AMP synthesis. A, fluorescence
(arbitrary units) emission spectra of 1.5 μM HCS and 15 μM biotin before (solid line)
and after (dashed line) addition of 100 μM ATP. Inset, representative stopped flow
fluorescence (arbitrary units) trace obtained upon mixing 2 μM HCS and 30 μM
biotin with 25 μM ATP. B, dependence of the apparent rate of bio-5‟-AMP synthesis
on ATP concentration. The line is the fit to the Michaelis-Menten equation. Inset,
dependence of the apparent rate of ATP association with HCS-biotin on ATP
concentration.
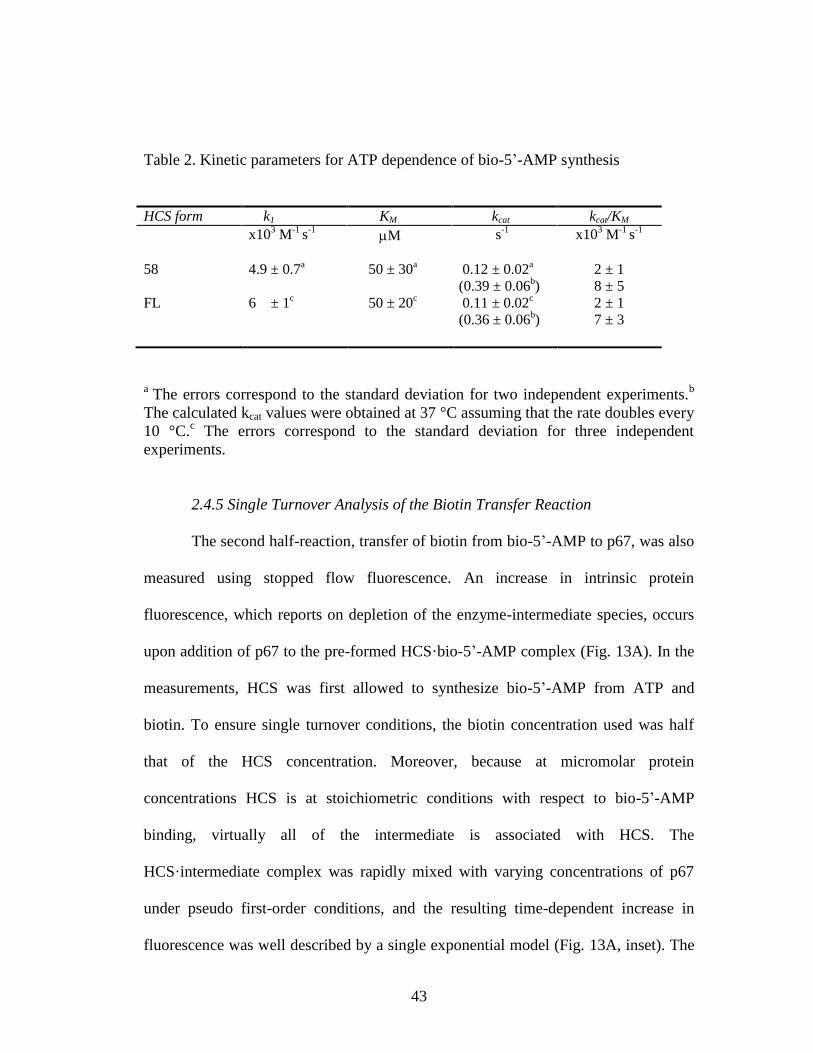
43
Table 2. Kinetic parameters for ATP dependence of bio-5‟-AMP synthesis
HCS form k1 KM kcat kcat/KM
x103 M
-1 s
-1 M
s-1
x103 M
-1 s
-1
58 4.9 ± 0.7a 50 ± 30
a 0.12 ± 0.02
a
(0.39 ± 0.06b)
2 ± 1
8 ± 5
FL 6 ± 1c 50 ± 20
c 0.11 ± 0.02
c
(0.36 ± 0.06b)
2 ± 1
7 ± 3
a
The errors correspond to the standard deviation for two independent experiments.b
The calculated kcat values were obtained at 37 °C assuming that the rate doubles every
10 °C.c The errors correspond to the standard deviation for three independent
experiments.
2.4.5 Single Turnover Analysis of the Biotin Transfer Reaction
The second half-reaction, transfer of biotin from bio-5‟-AMP to p67, was also
measured using stopped flow fluorescence. An increase in intrinsic protein
fluorescence, which reports on depletion of the enzyme-intermediate species, occurs
upon addition of p67 to the pre-formed HCS·bio-5‟-AMP complex (Fig. 13A). In the
measurements, HCS was first allowed to synthesize bio-5‟-AMP from ATP and
biotin. To ensure single turnover conditions, the biotin concentration used was half
that of the HCS concentration. Moreover, because at micromolar protein
concentrations HCS is at stoichiometric conditions with respect to bio-5‟-AMP
binding, virtually all of the intermediate is associated with HCS. The
HCS·intermediate complex was rapidly mixed with varying concentrations of p67
under pseudo first-order conditions, and the resulting time-dependent increase in
fluorescence was well described by a single exponential model (Fig. 13A, inset). The
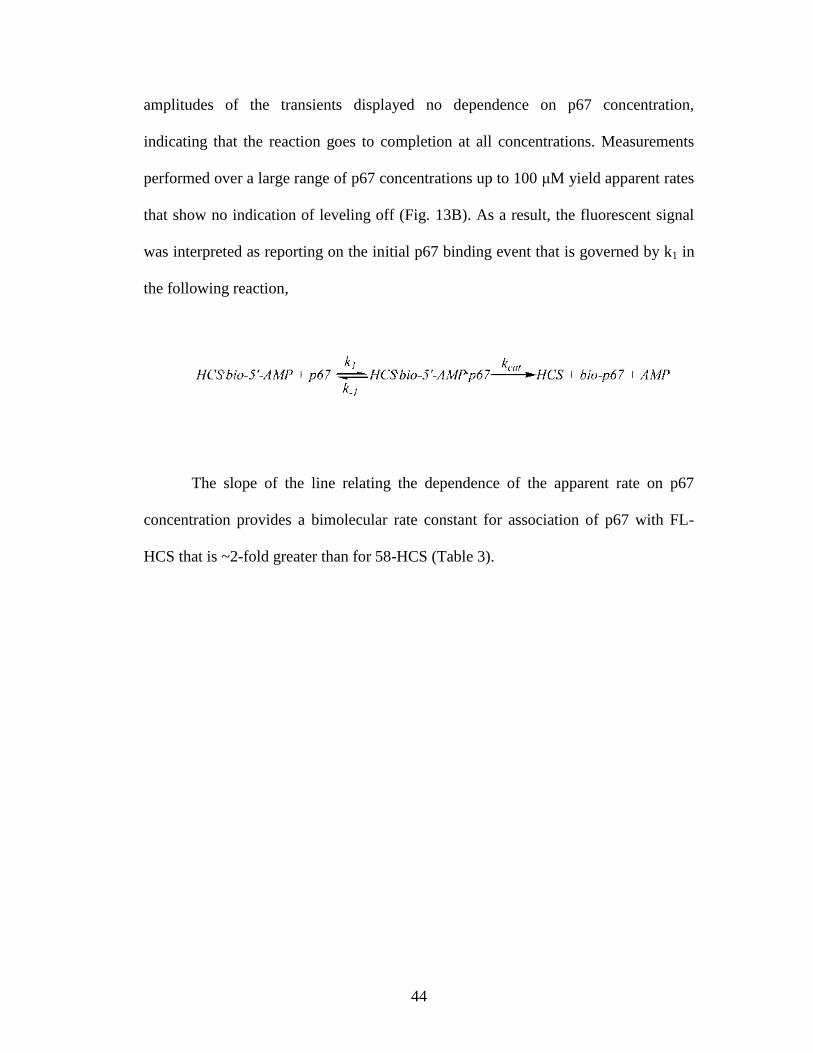
44
amplitudes of the transients displayed no dependence on p67 concentration,
indicating that the reaction goes to completion at all concentrations. Measurements
performed over a large range of p67 concentrations up to 100 μM yield apparent rates
that show no indication of leveling off (Fig. 13B). As a result, the fluorescent signal
was interpreted as reporting on the initial p67 binding event that is governed by k1 in
the following reaction,
The slope of the line relating the dependence of the apparent rate on p67
concentration provides a bimolecular rate constant for association of p67 with FL-
HCS that is ~2-fold greater than for 58-HCS (Table 3).

45
Figure 13. Single turnover measurements of biotin transfer from bio-5‟-AMP
to p67. A, fluorescence emission spectra (arbitrary units) of 1 μM 58-HCS, 0.5 μM
biotin, and 100 μM ATP before (solid line) and after (dashed line) addition of 10 μM
p67. Inset, representative stopped flow fluorescence trace (arbitrary units) obtained
upon mixing 1 μM 58-HCS, 0.5 μM biotin, and 100 μM ATP with 20 μM p67. B,
dependence of the apparent association rate of FL-HCS-bio-5-AMP (∙) or 58-HCS-
bio-5‟-AMP (■) with p67 on acceptor protein concentration. Error bars represent the
mean ± S.E. of at least five measurements performed at each [p67].
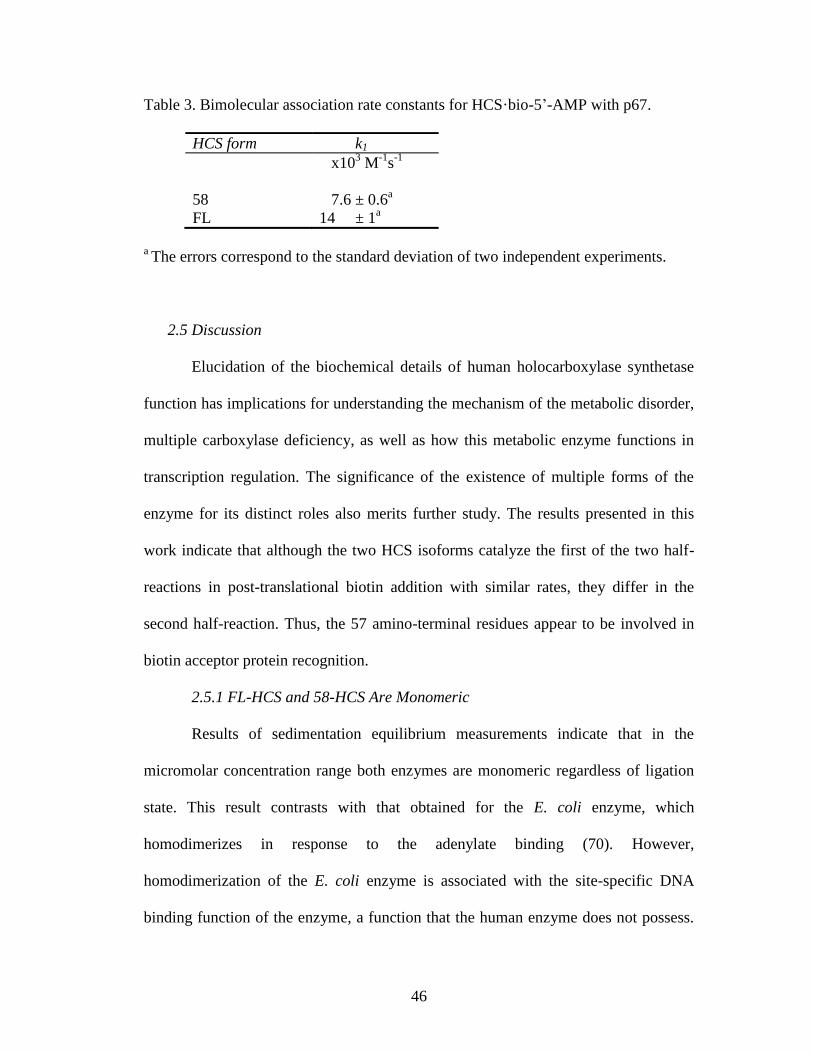
46
Table 3. Bimolecular association rate constants for HCS·bio-5‟-AMP with p67.
HCS form k1
x103 M
-1s
-1
58 7.6 ± 0.6a
FL 14 ± 1a
a The errors correspond to the standard deviation of two independent experiments.
2.5 Discussion
Elucidation of the biochemical details of human holocarboxylase synthetase
function has implications for understanding the mechanism of the metabolic disorder,
multiple carboxylase deficiency, as well as how this metabolic enzyme functions in
transcription regulation. The significance of the existence of multiple forms of the
enzyme for its distinct roles also merits further study. The results presented in this
work indicate that although the two HCS isoforms catalyze the first of the two half-
reactions in post-translational biotin addition with similar rates, they differ in the
second half-reaction. Thus, the 57 amino-terminal residues appear to be involved in
biotin acceptor protein recognition.
2.5.1 FL-HCS and 58-HCS Are Monomeric
Results of sedimentation equilibrium measurements indicate that in the
micromolar concentration range both enzymes are monomeric regardless of ligation
state. This result contrasts with that obtained for the E. coli enzyme, which
homodimerizes in response to the adenylate binding (70). However,
homodimerization of the E. coli enzyme is associated with the site-specific DNA
binding function of the enzyme, a function that the human enzyme does not possess.

47
Studies of a number of simple monofunctional bacterial biotin protein ligases that do
not possess a DNA binding domain indicate that they can exist as monomers or
constitutive dimers. The structures of the dimeric enzymes, which utilize a surface
distinct from that used by the E. coli enzyme to homodimerize, reinforce the idea that
linkage of dimerization of the E. coli enzyme to bio-5‟-AMP binding is idiosyncratic
to its additional role in site-specific DNA binding.
Sedimentation analysis of the two HCS isoforms indicates that the HCS amino
terminus plays no role in mediating homo-oligomerization of the protein. Several
eukaryotic biotin protein ligases have been characterized at the sequence level.
However, very few have been purified. Among these are the Saccharomyces
cerevisiae and one of the two Arabidopsis thaliana enzymes. The chloroplastic A.
thaliana enzyme has been overexpressed in and purified from E. coli and found to be
monomeric in its native form (73). No characterization of the oligomeric state of the
yeast enzyme was reported. Like the human enzyme, these eukaryotic enzymes are
characterized at the primary structure level by a carboxyl terminus that is homologous
to the monofunctional bacterial enzymes and the central and carboxyl-terminal
domains of the bifunctional bacterial enzymes. Furthermore, they all possess amino-
terminal segments of varying lengths. One potential role for these amino-terminal
segments is in self-association of the protein. However, the characterization of the
purified human and plant enzymes indicates that this is not the case.
2.5.2 Steady State Analysis of the Overall HCS-catalyzed Reaction
The FL- and 58-HCS isoforms exhibit similar kinetic properties in the overall
biotin transfer reaction. However, the kcat values for FL-HCS are consistently larger

48
than those measured for the truncated protein. For example, the kcat values of 0.35 ±
0.02 and 0.47 ± 0.01 s−1
for 58-HCS versus FL-HCS, respectively, were resolved
from measurements of the p67 concentration dependence of the reaction. Similarly
modest differences in kcat are observed in measurements of the dependence of the rate
on ATP and biotin concentrations.
The values of the kinetic constants for two of the three substrates compare
reasonably well with those reported previously for the human enzyme. However, the
caveat to any comparison is that previous measurements were performed in
fractionated cellular extracts. Previously reported values of the Km for biotin range
from 15 nM to 1 μM and thus are in the same range as the values of 700–800 nM
reported in this work (74-77). The Km values for ATP measured for FL-HCS and 58-
HCS are ~40–50 μM, although previously reported values range from 190 to 250 μM
(74-75). Finally, the Michaelis constants for p67 reported in this work cannot be
compared with any other values because none exist in the literature.
2.5.3 Analysis of HCS Two Half-reactions
Transient state kinetic analysis can yield valuable insight into a reaction
mechanism. This method relies on the use of high enzyme concentrations that allow
the direct detection of intermediates. As a result, the analysis makes possible the
determination of elementary rate constants(78). In this work, two transient state
assays were used to obtain information on the two half reactions. The assay for bio-
5‟-AMP synthesis is based on rapidly mixing a large concentration of enzyme
saturated with excess biotin with several ATP concentrations. Although the set up
resembles an „approach to steady state‟ experiment, the observed fluorescence change
49
indicates that on the examined timescale, a single turnover of bio-5‟-AMP synthesis
is observed. In the biotin transfer assay, a constant concentration of biotin is pre-
incubated with twice as much enzyme and ATP to allow synthesis of bio-5‟-AMP.
This complex is rapidly mixed with p67 prepared at several concentrations. The
excess enzyme allows for monitoring of only one reaction turnover.
Results of the pre-steady state measurements of the first half-reaction indicate
that the two forms synthesize bio-5‟-AMP with similar rates and Km for ATP.
Furthermore, the Michaelis constants for ATP for the half-reaction are the same as the
values obtained for the overall reaction. Because the fluorescence signal at this
temperature was more reliable, measurements of the half-reactions were performed at
20 °C. Assuming that the rate doubles every 10 °C, the values of kcat for the first half-
reaction at 37 °C are predicted to be 0.39 ± 0.06 s−1
for 58-HCS and 0.36 ± 0.06 s−1
for FL-HCS. These values agree with those obtained from measurements of the
overall reaction and therefore indicate that bio-5‟-AMP synthesis is the rate-limiting
step in the two-step reaction.
Stopped-flow fluorescence measurements of second half-reaction, which
report only on association of p67 with the enzyme·intermediate complex, indicate that
FL-HCS associates with the acceptor protein at a rate twice that measured for 58-
HCS. Furthermore, the absence of a leveling off of the rate as p67 concentration is
increased is consistent with the conclusion that bio-5‟-AMP synthesis is the rate-
limiting step in the two-step reaction. Simulations of the kinetic time courses in the
context of the model used for the analysis indicate a lower limit for the rate of biotin

50
transfer and product release of 1 s−1
, a value significantly greater than the kcat value of
0.1 s−1
determined for the first half-reaction.
The distinct rates of association of FL- and 58-HCS with p67 are qualitatively
consistent with the results of previous studies in which a series of truncation proteins
of 58-HCS were characterized with respect to their abilities to catalyze biotin linkage
to the biotin acceptor domain of the human propionyl-CoA carboxylase, p67, and the
E. coli biotin carboxylase carrier protein fragment, BCCP87, of acetyl-CoA
carboxylase (41). Those studies indicate that the amino-terminal region of the enzyme
functions in dictating the relative specificity of the enzyme for the alternative
acceptor protein substrates. However, in those studies, the physiologically relevant
HCS forms, FL and 58, were not compared, and no time dependence was
investigated.
2.5.4 Implications of the Distinct Rates of Association of 58-HCS and FL-HCS
with p67
The most significant difference observed between FL-HCS and 58-HCS lies
in the parameters describing their association with p67, with FL-HCS associating
with the biotin acceptor substrate at a rate ~2-fold faster than 58-HCS. Although this
difference is small, it may have consequences for the metabolic activities of
carboxylases. The low biotin concentration in human tissue (nanomolar range) limits
the supply of the HCS·bio-5‟-AMP complex (79-80). Once the complex is formed,
biotin utilization by the carboxylases depends, in part, on the efficiency with which it
is transferred from the intermediate to the acceptor protein substrates. There are five
biotin-dependent carboxylases present in mammalian cells that are involved in a

51
variety of distinct metabolic processes. A hierarchy of recognition of these
carboxylases by HCS may exist, depending on how vital the reaction is to the survival
of the cell. In addition, there is currently no information about the relative abundance
of FL- and 58-HCS, each with its distinct rate of association with acceptor protein
targets. Tissue-specific variation in the availability of the two isoforms could
potentially provide a means of regulating activities of biotin-dependent carboxylases.
Other possible roles exist for distinct forms of the HCS. The function of HCS
in transcription regulation is consistent with a nuclear role for the enzyme. Indeed,
immunofluorescence studies indicate that the enzyme is localized to both the cytosol
and the nucleus (43). The alternative HCS forms could be functionally distinct with
regard to nuclear localization and, consequently, their relative significance for
metabolism and transcription regulation.
In conclusion, the work presented here has established that two naturally
occurring isoforms of HCS behave similarly in most respects, but they have distinct
activities in biotin acceptor substrate binding, thus indicating a role for the amino-
terminal amino acids in carboxylase recognition.

52
Chapter 3: The biotin transfer reaction across different species
The work presented in this chapter was originally published in the Journal of
Biological Chemistry: Maria Ingaramo and Dorothy Beckett. Biotinylation: a post-
translational modification controlled by the rate of protein:protein association.
Journal of Biological Chemistry. 2011; 286, 13071-13078. the American Society
for Biochemistry and Molecular Biology.
3.1 Abstract
Biotin protein ligases catalyze specific covalent linkage of the coenzyme
biotin to biotin-dependent carboxylases. The reaction proceeds in two steps including
synthesis of an adenylated intermediate followed by biotin transfer to the carboxylase
substrate. In this work specificity in the transfer reaction was investigated using
single turnover stopped-flow and quench-flow assays. Cognate and non-cognate
reactions were measured using the enzymes and minimal biotin acceptor substrates
from E. coli, P. horikoshii and H. sapiens. The kinetic analysis demonstrates that for
all enzyme-substrate pairs the bimolecular rate of association of enzyme with
substrate limits post-translational biotinylation. In addition, in noncognate reactions
the three enzymes displayed a range of selectivities. These results highlight the
importance of protein-protein binding kinetics for specific biotin addition to
carboxylases and provide one mechanism for determining biotin distribution in
metabolism.
53
3.2 Introduction
Post-translational protein modification is ubiquitous in biology and influences
critical processes including metabolism, protein degradation and gene expression.
The water soluble vitamin biotin, a required cofactor for biotin dependent
carboxylases, functions as a transient carrier of carboxyl groups in their transfer from
bicarbonate to small molecule metabolites, such as acetyl-CoA. The five mammalian
biotin-dependent carboxylases function in gluconeogenesis, amino acid catabolism,
and fatty acid synthesis and degradation (11). In its coenzyme function biotin must be
covalently linked to a carboxylase in a highly specific post-translational modification
reaction catalyzed by Biotin Protein Ligases (BPL). In this two-step reaction (figure
14A) an intermediate, bio-5‟-AMP, is first formed from biotin and ATP substrates
and the biotin is then linked via its carboxyl group to the ε amine of a specific lysine
residue on the carboxylase (23). The target lysine residue is on the biotin carboxylase
carrier protein (BCCP) domain of the carboxylase, an enzyme complex composed of
multiple copies of BCCP, biotin carboxylase (BC), and carboxyl transferase (CT)
moieties (11).
Previous studies of specificity in post-translational biotin addition are
inconclusive. In any single organism, with few exceptions, only the specific target
lysine on carboxylase substrates is biotinylated. Consistent with this specificity, the
Pyrococcus horikoshii ligase:BCCP structure, in which BCCP refers to a minimal
biotin accepting domain, is characterized by an extensive protein:protein interface
(34). However, a lack of specificity is evident from numerous examples of
interspecies biotinylation. For example, in vivo the Escherichia coli ligase
54
biotinylates BCCP domains from yeast (81), human (72), plant (82) and other
bacteria (83), and the human p67, a commonly used substrate that includes
propionyl-CoA carboxylase BCCP, can be biotinylated by partially purified BPLs
from at least nine other organisms (38,84). This inter-species biotinylation may be
attributable to the high degree of sequence conservation among ligases and BCCP
domains. Alternatively, the qualitative nature of the methods used to measure inter-
species reactivity may have precluded detection of selectivity in the reaction.
Comparison of BPL-BCCP pairs from E.coli (Ec), Pyrococcus horikoshii
(Ph) and Homo sapiens, which represent three phylogenetic domains, illustrates the
sequence and structural conservation among the enzymes and substrates. For
example, the most disparate ligase catalytic domain sequences of E. coli and human
(figure 14B) maintain 26 % sequence identity and 43 % similarity (85). Moreover,
the structures of the catalytic domains of the Ec and Ph enzymes are nearly
superimposable (24,86). Overlay of BCCP structures from the three organisms
reveals that, with the exception of the “thumb” on the E. coli domain, they are
identical (figure 15A). At the primary sequence level (figure 15B), the most disparate
BCCP sequences from human and E. coli display 35 % identity and 54 % similarity
(85).

55
Figure 14. Ligases across evolutionary domains. A. Ligase catalyzed biotin transfer
occurs in two steps in which an activated biotin intermediate is first synthesized from
ATP and biotin with the release of pyrophosphate. In the second step, the biotin
moiety of bio-5‟-AMP is covalently attached to a specific lysine residue on BCCP. B.
Alignment (87) of the E. coli, H. sapiens and P. horikoshii Biotin Protein Ligase
catalytic domain sequences. The identities (black) and similarities (grey) are
highlighted. The N-terminal domains of the E. coli and H. sapiens sequences are not
shown.

56
Figure 15. Alignment of structures and sequences of BCCP fragments. A.
Superimposition of PhBCCP (grey, 2EJG), HsBCCP (dark grey, 2JKU) and EcBCCP
(light grey, 1A6X) structures generated with Pymol software (http://www.pymol.org).
B. Sequence alignment of the three BCCPs, generated using Jalview(87-88). The
working HsBCCP sequence has an exogenous tyrosine residue at the N terminus,
which was added in subcloning to allow for spectrophotometric protein concentration
determination.

57
As indicated above, ligase-catalyzed biotinylation occurs in two steps and
steady-state measurements with the human ligase revealed that bio-5‟-AMP synthesis
is the rate limiting step in the overall reaction. However, a single-turnover stopped-
flow fluorescence assay in which the preformed enzyme intermediate complex is
mixed with the BCCP substrate provides specific information about the ligase-
acceptor protein interaction independent of the bio-5‟-AMP synthesis step. Stopped-
flow measurements of the HsBPL catalyzed biotin transfer from the intermediate to a
human BCCP substrate revealed a linear dependence of the apparent rate on substrate
protein concentration with no evidence of saturation (28,32). The simplest
interpretation of this kinetic behavior is that the assay reports on the bimolecular
collision of the enzyme with substrate protein. However, it is not known if this is a
general feature of the BPL-catalyzed reaction. Additionally, the stopped-flow
measurements, which monitor the disappearance of the enzyme:intermediate
complex, provide no information about product accumulation in the reaction, and,
consequently, about which step limits turnover in the second half reaction.
In this work, the single turnover stopped flow and a quench flow assay that
allows monitoring of product formation are applied to studies of the second step in
BPL-catalyzed biotinylation. Measurements performed on three cognate enzyme-
substrate pairs from E. coli, P. horikoshii and H. sapiens yield linear rate versus
substrate concentration profiles in both assays. Furthermore, for each cognate
enzyme.acceptor protein pair the bimolecular rates obtained using the stopped-flow
and quench-flow assays are identical. Thus, bimolecular association of the enzyme-
intermediate complex with BCCP substrate limits post-translational biotin transfer
58
from bio-5‟-AMP to the acceptor protein. In addition, measurements performed on
noncognate enzyme-substrate pairs reveal distinct levels of substrate selectivity by the
three enzymes. The control of the biotin transfer rate by enzyme-substrate collision
coupled with the discrimination in noncognate reactions stresses the importance of
protein:protein recognition in post-translational biotin addition and has implications
for control of biotin distribution in metabolism.
3.3 Experimental Procedures
3.3.1 Chemicals and Buffers
All chemicals used in buffer preparation were at least reagent grade. Bio-5‟-
AMP was synthesized and purified as previously described (23,63). Biotin d-[2,3,4,6-
3H] was purchased from American Radiolabeled Chemicals, Inc and stored under
argon at -70oC. Unlabeled d-biotin and ATP were obtained from Sigma-Aldrich. The
ATP concentration in stock solutions, which were prepared by dissolving adenosine
5‟-triphosphate disodium salt into water and adjusting the pH to 7.5, were determined
by UV absorbance using an extinction coefficient at 259 nm of 15400 M cm-1
. Biotin
solutions were prepared by dissolving the desired amount of powder in reaction
buffer that had not been pH adjusted, adjusting the pH to 7.5, and bringing the
solution to its final volume in a volumetric flask. The biotin stock was filtered,
divided into 1 mL aliquots, and stored at -70 °C. The reaction buffer is composed of
10 mM Tris-HCl pH 7.50±0.02 at either 20 oC (Ec, Hs) or 40
oC (Ph), 2.5 mM
MgCl2, and 500 mM KCl (Ph) or 200 mM KCl (Ec, Hs).

59
3.3.2 Protein expression and purification
PhBPL, EcBPL and HsBPL were recombinantly expressed and purified from
Escherichia coli as previously described (31-32,89). The E. coli biotin acceptor
substrate fragment EcBCCP, which comprises the C-terminal 87 amino acids of the
acetyl-CoA carboxylase BCCP subunit, was purified as in Nenortas et al. (28). All
chromatographic steps were carried out on an AKTA prime FPLC platform at 4 °C
(GE healthcare).
PhBCCP corresponds to the 73 C-terminal amino acids of P. horikoshii
BCCP domain of acetyl-CoA carboxylase and was expressed from a pet11-a plasmid
derivative that was a generous gift from Riken (90). The plasmid was transformed
into E. coli BL21(λDE3)-RIL strain by electroporation and selection was carried out
on Luria-Bertani (LB) agar plates containing 50 µg/ml kanamycin. A 1 mL volume
from a 5 mL overnight culture was diluted into 50 mL of LB media containing
antibiotic and grown for 8 hours at 37°C with shaking at 250 rpm. A second 500 mL
culture was started by addition of 10 mL of the previous growth and grown overnight.
The final four 1 L cultures were inoculated with the previous culture at a dilution of
1:20. Protein expression was induced at an OD600 of 0.7 by addition of IPTG to 350
µM, and allowed to proceed for 2.5 hrs. Cells were harvested by centrifugation at
7000 rpm at 4 °C for 40 minutes, the pellet washed with 40 mL of lysis buffer per
liter of culture, and the sample was centrifuged again for 20 minutes at 9000 rpm. The
cell paste was re-suspended in twice its weight of lysis buffer (50 mM Tris, pH 7.5 at
4 °C, 500 mM NaCl, 5 % (v/v) glycerol, 0.1 mM DTT and 0.1 mM PMSF), and cells
were disrupted by sonication using one minute bursts until the OD600 decreased to

60
less than 10 % of the original value. The lysate was diluted to 200 mL with lysis
buffer and cleared of cell debris by centrifugation at 9000 rpm for 40 minutes. After
adding CaCl2, MgCl2, DNase I and RNase, to 1mM, 2.5 mM and 0.03 mg/mL (both
enzymes) final concentrations, respectively, the sample was stirred at room
temperature for two hours. The solution was then heated to 90 °C for 15 minutes
with stirring, cooled to room temperature, and the precipitated contaminating
proteins were cleared by centrifuging at 9000 rpm for 30 minutes at 4 °C. In order to
eliminate residual nucleic acid contamination PEI was added to the supernatant at a
final concentration of 0.2 % (w/v), the sample was stirred at 4 °C for 15 minutes,
and the precipitate was removed by centrifugation at 12000 rpm for 20 minutes.
Solid ammonium sulfate was slowly stirred into the supernatant to 90 % (w/v)
saturation, and precipitation was allowed to proceed overnight. The precipitate was
collected by centrifugation at 12000 rpm for 1.5 hrs, and re-suspended in 30 mL of 50
mM Tris, pH 7.5 at 4 °C, 5 % (v/v) glycerol. This sample was dialyzed against 2 mM
potassium phosphate buffer, pH 7.0, 5 % (v/v) glycerol and loaded on a
hydroxyapatite column (Pall Lifesciences). The flow-through was collected, dialyzed
against storage buffer (10 mM Tris, pH 7.5 at 4 °C, 200 mM KCl, 5 % (v/v)
glycerol), and stored in aliquots at -70 °C. Since the PhBCCP does not possess
tryptophan or tyrosine residues, the stock concentration was determined by
comparing the density of the bands from dilutions electrophoresed on a 20 %
acrylamide-SDS-tricine gel against bands with known amounts of PhBCCP (71).
Lanes with known amounts of PhBCCP were obtained by loading dilutions of a
PhBCCP desalted „standard‟ solution, the concentration of which had been

61
determined in triplicate by quantitative amino acid analysis at the protein facility of
the Iowa State University. Band density quantitation was performed using a
Molecular Dynamics Laser Scanning Personal Densitometer (GE Healthcare) and
ImageQuant software.
The HsBCCP fragment corresponds to C-terminal 67 amino acids of the
BCCP domain of propionyl-CoA carboxylase. In order to facilitate removal of the
histidine tag and eliminate any exogenous residues originating from the vector, the
p67 sequence from a pDEST17 derivative (a generous gift from Dr. Roy Gravel) was
subcloned into pSUMO-pro (LifeSensors) (67). A tyrosine residue was added at the
N-terminus to allow for concentration determination using uv absorption
spectroscopy. The plasmid encoding the SUMO-HsBCCP fusion was introduced into
E. coli strain Rosetta (DE3) by electroporation, and transformants were selected by
growth on LB agar containing 34 µg/ml chloramphenicol and 100 µg/ml ampicillin.
A single colony was transferred to 5 mL of LB media supplemented with antibiotics
and grown for 8 hrs with shaking at 37 °C. A 1:100 dilution was performed to initiate
a 50 mL overnight culture and one liter cultures were inoculated with 20 mL of the
overnight culture, grown at 37 °C, and protein expression was induced at an OD600
of 0.8 by addition of lactose to 0.5 % (w/v). Following overnight growth at 30 °C,
cells were harvested by centrifugation at 4500 rpm at 4 °C, re-suspended in a volume
of lysis buffer corresponding to five times the cell pellet weight, and lysed by
sonication in HsBCCP lysis buffer (50 mM sodium phosphate buffer, pH 8, 300 mM
sodium chloride, 10 mM imidazole, 5 % (v/v) glycerol, 3 mM 2-mercaptoethanol, 1
mM PMSF). The crude lysate was cleared by centrifugation at 9000 rpm for 30
62
minutes at 4 °C, and the supernatant was subjected to chromatography on 8 mL Ni-
NTA resin (Qiagen) packed in a 1.5 x 10 cm econo-column (BioRad) according to the
manufacturer‟s instructions. The eluted protein was dialyzed against 10 mM sodium
phosphate, pH 8.0, 60 mM NaCl, 5 % (v/v) glycerol, 5 mM 2-mercaptoethanol, and
digested overnight at room temperature with SUMO-protease-1. In order to remove
the protease, the his6-SUMO tag and undigested protein, the sample was passed
through Ni-NTA resin. The flow through was collected and dialyzed against 50 mM
Tris pH 7.5 at 4 °C, 20 mM KCl, 1 mM 2-mercaptoethanol, 5 % (v/v) glycerol. The
resulting sample was loaded onto a 8 ml DEAE anion exchange (GE Healthcare)
column and eluted with a linear gradient of 20-400 mM KCl (VT=200 mL) at a flow
rate of 2 ml/min. The pooled fractions (2 ml each) containing HsBCCP were
concentrated and loaded at 0.1 ml/min onto a 150 ml S-100 Sephacryl resin (GE
Healthcare) packed in a 1.5 x 100 cm econo-column (BioRad) and equilibrated with
10 mM Tris, pH 7.5 at 4 °C, 0.8 M KCl, 5 mM 2-mercaptoethanol, 5 % (v/v)
glycerol. The eluted sample was exchanged into 10 mM Tris-HCl, pH 8 at 4 °C, 200
mM KCl and 5 % (v/v) glycerol by dialysis and stored at –70 oC. The yield was 10
mg of protein per liter of bacterial culture and the concentration was determined
spectrophotometrically using an extinction coefficient of 1450 M cm-1
at 276 nm
(64).
3.3.3 Stopped flow measurements of biotin transfer
Biotin transfer was measured by monitoring the intrinsic fluorescence increase
that occurs upon rapid mixing the enzyme.intermediate complex with the substrate
biotin acceptor protein (28,32). A solution of 1-2 µM ligase was incubated with half

63
its concentration of biotin and 500 µM ATP for 20 minutes to allow for bio-5‟-AMP
synthesis. In order to avoid the complication from the large fluorescence change that
accompanies ATP binding to the enzyme, PhBPL catalyzed reactions were carried
out using chemically synthesized bio-5‟-AMP (31). Reactions catalyzed by the
human and E. coli enzyme were carried out in standard reaction buffer, which
contains 10 mM Tris, pH 7.5 at 20 °C, 200 mM KCl, 2.5 mM MgCl2. In contrast,
those reactions catalyzed by PhBPL were performed at pH 7.5, 40 °C and a KCl
concentration of 500 mM. The higher salt concentration and temperature are
necessary to obtain complete activity of the thermophilic enzyme (31), a reflection of
the fact that P. horikoshii intracellular salt concentration is about 500 mM, and the
organism grows optimally at 98 °C (91). Each ligase-intermediate complex solution
was rapidly mixed with varying concentrations of BCCP using a Kintek SF-2001
stopped flow instrument equipped with fluorescence detection. The excitation
wavelength was 295 nm and fluorescence emission was monitored above 340 nm
using a cutoff filter (Corion Corp.). At least six traces spanning 10 half-lives were
collected at each BCCP concentration. The resulting transients were fit to an
appropriate model (single or double exponential), and the apparent rates were plotted
as a function of BCCP concentration. Further analysis and interpretation were
performed as described in the Results section.
3.3.4 Quench flow measurements of biotin incorporation
Single turnover measurements of enzyme-catalyzed biotin transfer to the
BCCP fragments was monitored as a function of time using a Kintek QF-3 quench
flow apparatus. One syringe contained a solution of 1 µM ligase, 0.463 µM biotin, 37
64
nM 3H-biotin, and 500 µM ATP that had been incubated for 30 minutes at the
working temperature to allow for bio-5‟-AMP synthesis. The second syringe
contained variable concentrations of each BCCP fragment, ranging from 10 to 200
µM. All samples were prepared in the appropriate working buffer. Equal volumes of
the two syringe solutions were mixed and the resulting reactions were allowed to age
for a specific amount of time, after which they were quenched with a 2 M HCl
solution. Free and BCCP incorporated biotin were separated using TCA precipitation
(50). In reactions containing PhBCCP, 0.02% (w/v) deoxycholate was included, in
addition to BSA (0.1 mg/mL), to aid in precipitation. The samples were spotted on
dried Whatman 3MM squares to which 200 µl of 800 µM unlabeled biotin had been
added after soaking in 10 % TCA. After drying, the papers were washed twice in
batch mode in 250 ml of ice cold 10 % TCA and once in 100 ml of cold ethanol. The
radioactivity retained on the filters was quantified in a LS6500 Beckman counter
using ReadyProtein+ (Beckman) scintillation fluid. Background corrections were
performed with values obtained from control reactions that contained no BCCP.
Correction for precipitation efficiency (typically above 80 %) and conversion from
dpm to “µM biotin” were carried out using the relation between dpm and µM
obtained from the precipitation of a reaction incubated for 30 minutes in order to
allow for quantitative 3H incorporation. Each discontinuous transient was fit to a
single exponential equation and the resulting apparent rates as a function of BCCP
concentration were subjected to linear least squares analysis. The slope of the line
yielded the rate of biotin incorporation.

65
3.4 Results
3.4.1 Oligomeric states of the reacting species in biotin transfer
Interpretation of kinetic and binding data requires knowledge of the assembly
states of all species participating in a reaction. The oligomerization properties of the
three biotin protein ligases have previously been characterized using sedimentation
equilibrium. The human ligase is monomeric in both its unliganded and liganded
forms (32). By contrast, the Pyrococcus horikoshii ligase is a constitutive dimer (31).
However, in the dimer the active sites for biotin transfer are available for interaction
with the acceptor substrate (34). The E. coli enzyme can also form a homo-dimer,
albeit in a reaction that depends on the intermediate in biotin transfer, bio-5‟-AMP
(70). Furthermore, the surface utilized for the homo-dimerization is identical to that
used for hetero-dimerization with the biotin acceptor protein (92). The equilibrium
dissociation constant governing homo-dimerization reaction in buffer conditions
identical to those used in the present studies is approximately 10 µM (70).
Consequently, in order to avoid any complication from this competing homo-
dimerization reaction, all kinetic measurements in these studies were performed at a
total enzyme concentration of 0.5 µM.
The assembly states of the three acceptor protein substrates employed in these
studies were also characterized by sedimentation equilibrium. The EcBCCP has
previously been shown to be monomeric over a broad concentration range (28). For
this work, sedimentation equilibrium measurements were performed on HsBCCP and
PhBCCP (data not shown). Global analysis of the data obtained at three loading

66
concentrations and two speeds using a single species model yielded molecular
weights for the proteins consistent with monomers
3.4.2 Single turnover assays of the second half reaction in biotin transfer
This work is focused on the interaction of the ligase with the biotin acceptor
protein in post-translational biotinylation. Since the rate-determining step in the
overall reaction is intermediate synthesis, steady state measurements provide limited
information about this protein:protein interaction. However, the reaction proceeds
through a double displacement mechanism that can be halted after formation of the
kinetically stable ligase.bio-5‟-AMP complex (Figure 14). Mixing of the preformed
complex with BCCP allows monitoring of the second half reaction independent of the
first.
3.4.3. Biotin transfer rates to cognate substrates are similar for the three
Biotin Protein Ligases
In these experiments, BPL is pre-incubated with biotin at half of the enzyme
concentration and excess ATP to allow for bio-5‟-AMP synthesis. The BPL excess
over biotin ensures that only one turnover of biotin transfer occurs in the stopped-
flow measurement. Mixing of the pre-formed complex with BCCP yields a time-
dependent increase in the intrinsic fluorescence (Figure 16A), that has been shown
through measurements of the spectra of the two species to be consistent with
conversion of the bio-5‟-AMP-bound enzyme to the free enzyme (28,32).Transients
acquired upon mixing the ligase-bio-5‟-AMP complex at each BCCP concentration
were fit to either a single or double exponential model to obtain apparent rates. For

67
example, the transient shown in Figure 16A, which was obtained by mixing
HsBCCP-bio-5‟-AMP with 200 µM HsBCCP, contains two well-separated
exponential phases. While both the human and E. coli-catalyzed reactions displayed
this biphasic behavior at higher BCCP concentrations, all PhBCCP traces were
monophasic.
Plots of the faster apparent rate versus biotin accepting substrate concentration
for all three cognate ligase.substrate pairs were linear and showed no evidence of
saturation (Figure 16B). Consequently, the slope of each line is interpreted as
reporting on k1, or BCCP association with the ligase-bio-5‟-AMP complex, in the
following mechanism:
BPL·bio-5'-AMP + BCCP BPL·bio-5'-AMP·BCCP BPL + bio-BCCP + AMP
k1
k-1
k2
The bimolecular association rates for the three BPLs with their cognate
substrates (Table 4), obtained from linear regression of the apparent rate versus
BCCP concentration profiles (Figure 16B), reveal that all three reactions are
characterized by bimolecular association rates on the order of 104 M
-1s
-1. However,
the human system displays the fastest rate.
For reactions that exhibited two exponentials, the rate of the slower phase
exhibited no dependence on BCCP concentration, which supports its assignment to
holo-BCCP dissociation from the ligase (28). The rates of HsBPL and EcBPL
dissociation from their cognate holoBCCPs are both approximately 0.2 s-1
(Table 4).

68
Table 4: Biotin transfer rates for cognate ligase-BCCP pairs.
Stopped-flow
a Quench-flow
b
( x104 M
-1s
-1) ( x10
4 M
-1s
-1)
HsBPL 3.5 ± 0.3 3.1 ± 0.3
EcBPL 1.15 ± 0.07 1.05 ± 0.08
PhBPL 1.50 ± 0.06 c 1.5 ± 0.1
c
a. The errors represent the standard deviation of three independent stopped-flow
experiments. b.
The errors correspond to the standard deviation of results obtained in
two independent quench flow experiments. c. Measurements with PhBPL were carried
out at 40 C, in 10 mM Tris, pH 7.5, 500 mM KCL, 2.5 mM MgCl2. All other
experiments were performed at 20 C, in 10 mM Tris, pH 7.5, 200 mM KCL, 2.5 mM
MgCl2
Figure 16. Stopped flow measurements of biotin transfer for cognate ligase-BCCP
pairs. A. Stopped flow fluorescence trace obtained upon 1:1 (vol/vol) mixing 1 µM
HsBPL, 0.5 µM biotin, 0.5 µM ATP with 200 µM HsBCCP. Data was collected with
an equal number of points in two time windows in order to better capture the two
exponential behavior. The solid line represents the best-fit of the data to a double
exponential model. B. Plots of the dependence of the apparent rate of biotin transfer
on BCCP concentration: (■) HsBPL-HsBCCP, (♦) PhBPL-PhBCCP, (∙) EcBPL-
EcBCCP. The data points represent the average of the apparent rate measured at each
BCCP concentration in three independent experiments with standard deviations
shown as error bars. The solid lines represent the best-fits of the rate versus
concentration profiles to a linear equation.

69
3.4.4. Product formation is limited by bimolecular association of enzyme with
substrate
The stopped flow assay reports on the disappearance of the ligase.bio-5‟-AMP
complex but provides no information on product accumulation in the second half
reaction. Consequently, a quench flow assay was developed to quantify the
production of biotinylated BCCP.
In the assay the reactants are prepared similarly to those used in the stopped
flow experiments, with the exception that the cold biotin is spiked with tritium-
labeled biotin. Once sufficient time has elapsed for bio-5‟-AMP synthesis, an aliquot
of the ligase-intermediate complex solution is rapidly mixed with BCCP. After aging
for the appropriate time interval, the reaction is quenched by decreasing the pH. This
low pH also destroys the non-covalent ligase-bio-5‟-AMP complex while leaving the
covalent amide linkage between biotin and BCCP intact. In contrast to the stopped-
flow assay, the quench-flow assay of biotin transfer is discontinuous. Therefore, the
transient acquired at each BCCP concentration (Figure 17A) results from multiple
measurements in which reactions prepared at a given acceptor protein concentration
are aged for variable amounts of time prior to quenching. Separation of free biotin
from biotinylated BCCP is achieved using a modification of the TCA precipitation
method previously used in steady state kinetic measurements performed on EcBPL
(50). The TCA precipitates BCCP and holo-BCCP, but not free biotin or bio-5‟-AMP.
Quantitation of the radioactivity in the acid insoluble material by scintillation
counting yields information on the amount of biotin incorporated at a specific time,
and ultimately a transient (Figure 17A). Transients for all cognate enzyme-substrate

70
pairs are well-described by a single exponential model, further supporting the
assignment of the slow rate observed in the stopped flow traces with HsBPL and
EcBPL to the enzyme-product dissociation rate. Plots of the apparent rates obtained
from the transients versus BCCP concentration are linear and reveal no evidence of
saturation (Figure 17B). Furthermore, for all three enzymes the rates obtained from
the slopes of the lines are identical to the bimolecular association rates obtained from
the stopped flow measurements (Table 4). Thus, for all cognate pairs, the rate of
bimolecular association of enzyme with substrate limits accumulation of the
biotinylated acceptor protein.
Figure 17. Quench flow measurements of biotin transfer for cognate ligase-BCCP
pairs. A. Transient obtained upon mixing in equal parts 1 µM HsBPL, 0.5 µM biotin,
0.5 µM ATP against 200 µM HsBCCP. The solid line represents the best-fit of the
data to a single exponential model. B. Plots of apparent rate versus substrate
concentration for: (□) HsBPL-HsBCCP, (◊) PhBPL-PhBCCP, (○) EcBPL-EcBCCP.
The data points represent the average of the apparent rate measured at each BCCP
concentration in two independent experiments with standard deviations shown as
error bars. The solid lines represent the best-fits of the rate versus concentration
profiles to a linear equation.

71
3.4.5 Measurements of biotin transfer to noncognate acceptor proteins
indicate substrate specificity
The specificity of biotin transfer was investigated by performing stopped-flow
experiments with each BPL and non-cognate substrates (Table 5). Like the cognate
reactions, noncognate biotin transfer yielded linear apparent rate versus substrate
concentration profiles. The bimolecular association rates obtained from linear
regression of the data span a large range, from undetectable to 43000 M-1
s-1
with the
fastest rate observed for PhBPL-catalyzed biotin transfer to HsBCCP, a non-cognate
substrate. The only enzyme capable of biotinylating all three BCCP substrates is
PhBPL. No time-dependent change in the fluorescence signal is observed upon
mixing either HsBPL or EcBPL with PhBCCP, consistent with the absence of biotin
transfer. This result was confirmed by MALDI-ToF MS analysis of reactions
containing either the human or E. coli ligase and PhBCCP (data not shown).
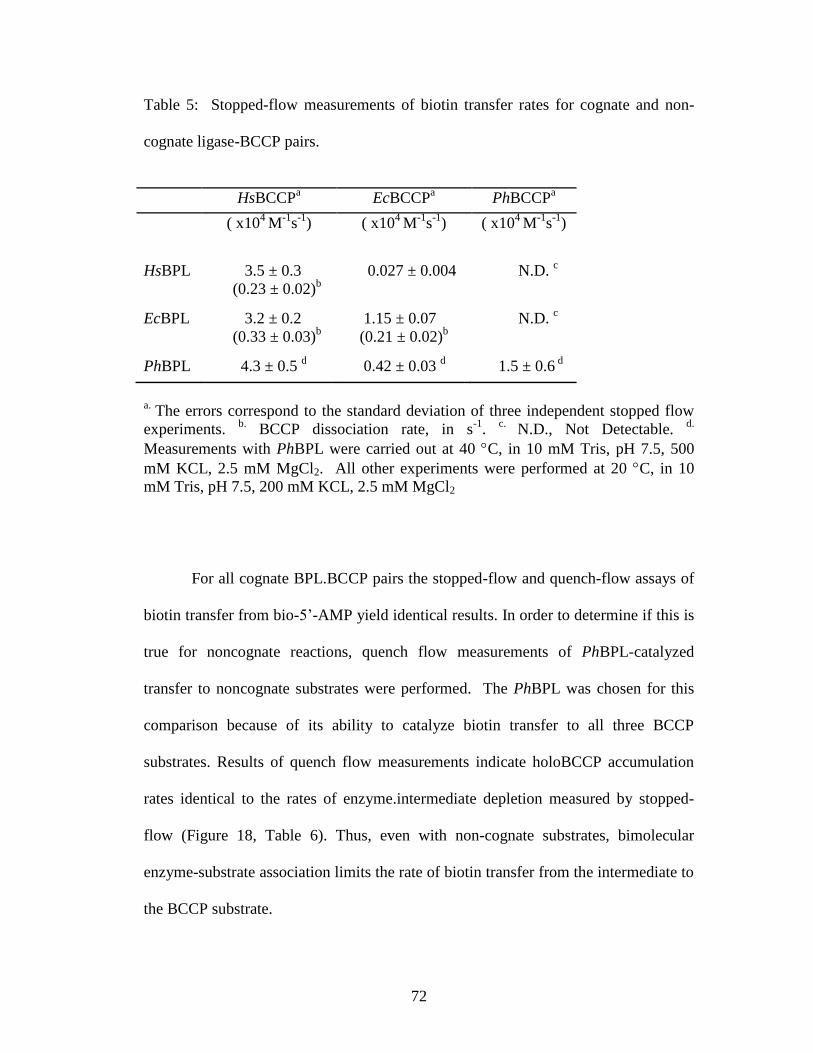
72
Table 5: Stopped-flow measurements of biotin transfer rates for cognate and non-
cognate ligase-BCCP pairs.
HsBCCPa EcBCCP
a PhBCCP
a
( x104
M-1
s-1
) ( x104 M
-1s
-1) ( x10
4 M
-1s
-1)
HsBPL 3.5 ± 0.3
(0.23 ± 0.02)b
0.027 ± 0.004
N.D. c
EcBPL 3.2 ± 0.2
(0.33 ± 0.03)b
1.15 ± 0.07
(0.21 ± 0.02)b
N.D. c
PhBPL 4.3 ± 0.5 d 0.42 ± 0.03
d 1.5 ± 0.6
d
a.
The errors correspond to the standard deviation of three independent stopped flow
experiments. b.
BCCP dissociation rate, in s-1
. c.
N.D., Not Detectable. d.
Measurements with PhBPL were carried out at 40 C, in 10 mM Tris, pH 7.5, 500
mM KCL, 2.5 mM MgCl2. All other experiments were performed at 20 C, in 10
mM Tris, pH 7.5, 200 mM KCL, 2.5 mM MgCl2
For all cognate BPL.BCCP pairs the stopped-flow and quench-flow assays of
biotin transfer from bio-5‟-AMP yield identical results. In order to determine if this is
true for noncognate reactions, quench flow measurements of PhBPL-catalyzed
transfer to noncognate substrates were performed. The PhBPL was chosen for this
comparison because of its ability to catalyze biotin transfer to all three BCCP
substrates. Results of quench flow measurements indicate holoBCCP accumulation
rates identical to the rates of enzyme.intermediate depletion measured by stopped-
flow (Figure 18, Table 6). Thus, even with non-cognate substrates, bimolecular
enzyme-substrate association limits the rate of biotin transfer from the intermediate to
the BCCP substrate.

73
Figure 18. Stopped flow and quench-flow measurements of PhBPL-catalyzed biotin
transfer to cognate and non-cognate substrates. Rate versus concentration profiles
obtained by stopped-flow for (■) HsBCCP, (♦) PhBCCP, and (∙) EcBCCP and
quench-flow flow for (□) HsBCCP, (◊) PhBCCP and (○) EcBCCP. The solid lines
were obtained from linear regression of the data.
Table 6: Rates of PhBPL-catalyzed biotin transfer
Stopped-flow a Quench-flow
b
(M-1
s-1
) (M-1
s-1
)
HsBCCP 4.3 ± 0.5 4.2 ± 0.7
EcBCCP 0.420 ± 0.03 0.4 ± 0.1
PhBCCP 1.50 ± 0.06c 1.5 ± 0.1
c
a. The errors represent the standard deviation of three independent stopped-flow
experiments. b.
The errors correspond to the standard deviation of results obtained in
two independent quench flow experiments. c. Measurements with PhBPL were carried
out at 40 C, in 10 mM Tris, pH 7.5, 500 mM KCL, 2.5 mM MgCl2. All other
experiments were performed at 20 C, in 10 mM Tris, pH 7.5, 200 mM KCL, 2.5 mM
MgCl2

74
3.5 Discussion
The structural and energetic basis of the specific enzyme-catalyzed post-
translational biotin addition is not known. Previous steady-state measurements with
HsBPL indicated that the first step, bio-5‟-AMP synthesis, is the rate limiting step in
the two-step reaction (32). In this work the second half reaction in biotin transfer was
measured independent of the first using single turnover stopped-flow and quench-
flow assays. The measurements performed on ligases and substrates from three
different organisms demonstrate that rate of bimolecular association of enzyme with
substrate limits post-translational biotin addition. Furthermore, measurements on
noncognate enzyme substrate pairs reveal specificity in post-translational biotin
addition.
The stopped-flow measurements of biotin transfer from the bio-5‟-AMP to
BCCP, which monitors disappearance of the enzyme.intermediate complex, provides
information about bimolecular association of enzyme with substrate for all
ligase/BCCP pairs. This conclusion is based on the observed linear dependencies of
the apparent rates on BCCP concentration. In order to obtain values for the rate of the
chemistry of biotin transfer, a quench flow assay for the second half reaction, in
which product holoBCCP formation is monitored, was applied to the three ligase-
BCCP systems. The linear dependencies and resulting bimolecular rate constants
obtained with this assay are identical those obtained using the stopped-flow assay.
Therefore, for all three cognate BPL-BCCP pairs the chemistry of biotin transfer from
the intermediate to acceptor protein is limited by the enzyme-substrate association

75
rate. As indicated by measurements performed using PhBPL and the non-cognate
BCCP substrates, this is also true for reactions involving non-cognate pairs.
The three enzymes display association rates with their cognate substrates of
1-5x10⁴ M-1
s-1
, values that are well within range of the commonly observed
association rates for protein-protein interactions (93). The rates also agree with
previous measurements of the EcBPL-EcBCCP interaction performed in the same
substrate concentration range (28). In addition, the results obtained with the human
system are comparable to those previously obtained with p67, a biotin acceptor
substrate that contains in addition to the HsBCCP sequence some “extra” residues
originating from the vector sequence (32). However, the measured association rate
with p67 was only twofold slower than that measured for HsBCCP.
Measurements performed with non-cognate substrates indicate that PhBPL,
which biotinylates the two non-cognate substrates at rates comparable to the cognate
reaction, is the least discriminating of the three enzymes. By contrast, neither the
HsBPL nor EcBPL can transfer biotin to PhBCCP. The human enzyme, which fails to
biotinylate PhBCCP and reacts with the E. coli substrate with a slow rate of 3x10² M
-
1s
-1, is the most discriminating of the three ligases. Precedent for such slow
bimolecular protein:protein association rates exist including a value of approximately
2 M-1
s-1
measured for the binding of the p66 and p51 subunits of HIV reverse
transcriptase (94).
Previous studies provide limited information on the structural features that
are important for substrate recognition by biotin protein ligases. In the
76
PhBPL.PhBCCP complex structure the interface is characterized by multiple
hydrogen bonds mediated by backbone residues as well as numerous van der Waals
contacts. Functional studies of both E. coli BCCP and ligase variants have also been
performed. Mutational studies on E. coli BCCP revealed that, in addition to the target
lysine, a glutamic acid at position 119 is important for recognition (50). In the E. coli
ligase several surface loops are proposed to function in BCCP recognition. Functional
studies of EcBPL variants at amino acids R116, R119, and A147 confirm the
importance of three of these loop residues for the process (52). In addition to the
catalytic domain, the human ligase is characterized by a ~450 amino acid N-terminal
extension, which has been shown to both influence the association rate with p67 (32)
and to directly interact the BCCP domain of Acetyl CoA carboxylase II (42).
Additional studies to elucidate the structural origins of the range of bimolecular
association rates exhibited by the BPL.BCCP pairs are in progress.
The control of biotin transfer by enzyme-BCCP association has potential
biological consequences. First, consider any single organisms such as H. sapiens in
which there are multiple biotin-dependent carboxylases. In vivo biotin concentrations
are in the low nanomolar range (80) and, therefore, there is a limited amount of
BPL.bio-5‟-AMP. Therefore, the carboxylase that associates most rapidly with the
enzyme-intermediate complex should acquire the greatest portion of the available
biotin. The association rate should depend on both the intrinsic bimolecular rate
constant for a ligase-carboxylase pair and on the carboxylase substrate concentration.
Thus, the relative intracellular apo-carboxylase concentrations should be an
important factor in determining biotin distribution in metabolism. The observed

77
collision-controlled reaction is also important for bifunctional ligases such as EcBPL,
which, in addition to forming the hetero-dimer with BCCP, homo-dimerizes to
regulate transcription. Since a single surface on the ligase-intermediate complex is
utilized for the both dimerization reactions (92), the two are mutually exclusive.
However, homo-dimerization is governed by an association rate that is much slower
than hetero-dimerization (27,29). This gives rise to a competition between hetero-
and homo- dimerization in which kinetic preference is given to biotin transfer to
BCCP. Only after the unbiotinylated BCCP pool has been depleted and metabolic
demand for biotin is satisfied does the enzyme-intermediate complex linger
sufficiently long to allow homo-dimerization and transcription repression.
This work quantitatively demonstrates specificity of post-translational biotin
addition to BCCP substrates. This specificity exists in spite of the high degree of
evolutionary conservation of sequence and structures in both ligases and BCCP
substrates. In addition, the measurements indicate that the association of ligases with
biotin acceptor substrate limits the biotinylation reaction rate. Together, the results
highlight the importance of protein-protein interactions in post-translational
biotinylation, and provide a mechanism for determining the distribution of biotin in
carboxylases and, therefore, in metabolism.
78
Chapter 4: Biotin transfer to the five mammalian biotin
dependent carboxylases
4.1 Abstract
Human Holocarboxylase Synthetase (HCS) catalyzes transfer of the vitamin
biotin to the biotin carboxyl carrier protein (BCCP) domain of five biotin dependent
carboxylases. The carboxylases comprise acetyl-CoA carboxylases 1 and 2 (ACC1
and ACC2), pyruvate carboxylase (PC), 3-methylcrotonyl-CoA carboxylase (MCC)
and propionyl-CoA carboxylase (PCC). The reaction is catalyzed in two steps. First,
an activated intermediate, bio-5‟-AMP, is synthesized from biotin and ATP. The
second step involves covalent linkage between the biotin moiety and a specific lysine
residue on the carboxylase.
To address whether HCS displays selectivity among the BCCP domains of the
five carboxylases, the biotin transfer reaction was investigated using single turnover
stopped-flow and quench-flow assays. HCS catalyzed biotin transfer to minimal
biotin acceptor BCCP fragments corresponding to the five carboxylases was
measured. The results demonstrated that biotinylation of the BCCP fragments of the
mitochondrial carboxylases PCC, PC, and MCC was fast and limited by the
bimolecular association rate of the enzyme with the BCCP substrates. In contrast,
biotinylation of the BCCP fragments of ACC1 and ACC2, to which HCS has
continuous access from the cytoplasm, was slow and displayed a hyperbolic
dependence on BCCP concentration. The correlation between HCS accessibility to
79
the biotin acceptor substrate and the rates of biotinylation suggests that mitochondrial
carboxylase sequences have evolved to produce fast association rates with HCS in
order to ensure biotinylation of the carboxylases before mitochondrial import. In
addition, the results suggest an important role for the ligase specificity in dictating
biotin distribution among carboxylases.
4.2 Introduction
Post-translational modifying enzymes must have specificity towards their
intended targets, but at the same time be promiscuous enough to allow interaction
with several partners. Biotin attachment is a post-translational modification essential
for biotin-dependent carboxylase function. In mammalian cells, biotin linkage is
catalyzed in a stepwise fashion by Human Holocarboxylase Synthetase (HCS):
HCS + biotin + ATP HCS · bio-5'-AMP + PPi
HCS · bio-5'-AMP + apo-carboxylase HCS + holo-carboxylase + AMP
In the first step an activated intermediate, bio-5‟-AMP, is synthesized from
biotin and ATP, with the release of pyrophosphate. The second step involves covalent
attachment of the biotin moiety to a specific lysine residue on the biotin carboxyl
carrier protein (BCCP) domain of a carboxylase(23). There are at least three HCS
variants present in mammalian cells, but only two arise from differential splicing of
the mRNA(38,40,57). The full length variant (FL-HCS) is comprised of 726 amino

80
acids and a shorter isoform corresponds to a protein that is lacking the first 57 amino
acids (58-HCS).
In mammalian cells, there are five carboxylases that require post-translational
biotin addition by HCS(11). Acetyl-CoA carboxylase 1 (ACC1) is a cytosolic enzyme
that is involved in fatty acid synthesis by catalyzing the conversion of acetyl-CoA to
malonyl-CoA. Acetyl-CoA carboxylase 2 (ACC2) catalyzes the same reaction as
ACC1, but is the product of a different gene. It is involved in fatty acid oxidation, and
localizes to the cytosolic side of the mitochondrial membrane. Propionyl-CoA
carboxylase (PCC) synthesizes S-methylmalonyl CoA from propionyl-CoA. This
mitochondrial enzyme is part of the odd fatty acid synthesis pathway, and is also
involved in isoleucine, threonine, methionine and valine catabolism. Pyruvate
carboxylase (PC) also localizes to the mitochondrial matrix and carboxylates pyruvate
to produce oxaloacetate, a reaction necessary for gluconeogenesis. Finally,
mitochondrial methylcrotonoyl-CoA carboxylase (MCC) converts 3-
methylcrotonoyl-CoA to 3-methylglutaconyl-CoA, a reaction that is part of the
leucine degradation pathway.
It has been demonstrated previously that FL-HCS discriminates among BCCP
substrates from different species(95). In previous experiments, single turnover assays
that monitored biotin transfer independently of bio-5‟-AMP synthesis were used. This
was necessary because comparison of steady state parameters for the overall reaction
with the rate of bio-5‟-AMP synthesis indicated the rate limiting step in the overall
reaction was synthesis of the intermediate(28,32). HCS biotinylated the BCCP
domain of PCC, did not biotinylate the BCCP domain from an archeal organism, and

81
it slowly biotinylated that from E. coli(95). However, HCS selectivity of biotin
transfer to the endogenous, biologically relevant substrates is unknown.
In order to investigate HCS substrate specificity among mammalian
carboxylases, a single turnover assays were used to determine the rates of biotin
transfer by FL- and 58-HCS to the BCCP domains of ACC1, ACC2, PC, PCC and
MCC (Figure 19A). Biotin transfer rates to the BCCP domains of the mitochondrial
carboxylases PC, PCC and MCC were faster than transfer to ACC1 and ACC2. In
addition, the apparent rate vs concentration profiles were strikingly different. While
the BCCP fragments of MCC, PC and PCC displayed a linear dependence of the
apparent rate on substrate concentration, the BCCP fragments of ACC1 and ACC2
yielded a hyperbolic dependence, suggesting a difference in the identity of the rate
limiting step for these two substrates. The different behavior correlated with the
carboxylase localization, since ACC1 and ACC2 are continuously accessible to HCS
in the cytoplasm, while the remaining carboxylases are transported into the
mitochondria. A model consistent with these observations is proposed, whereby HCS
biotinylates PC, PCC and MCC at a faster rate because these enzymes are only
transiently present in the cytoplasm and they must be post-translationally modified
before they reach their final destination. In addition, the data suggest a molecular
mechanism for the establishment of a hierarchy that determines biotin distribution
among carboxylases based on the rates of bimolecular association and carboxylase
abundance.
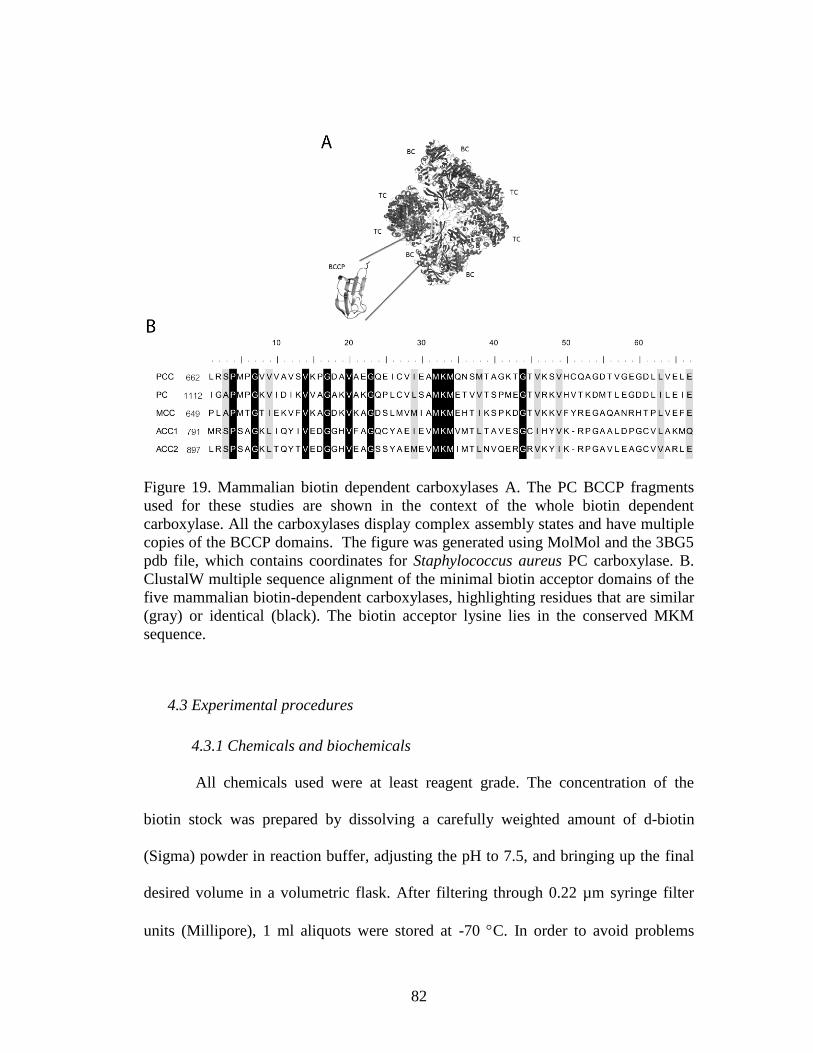
82
Figure 19. Mammalian biotin dependent carboxylases A. The PC BCCP fragments
used for these studies are shown in the context of the whole biotin dependent
carboxylase. All the carboxylases display complex assembly states and have multiple
copies of the BCCP domains. The figure was generated using MolMol and the 3BG5
pdb file, which contains coordinates for Staphylococcus aureus PC carboxylase. B.
ClustalW multiple sequence alignment of the minimal biotin acceptor domains of the
five mammalian biotin-dependent carboxylases, highlighting residues that are similar
(gray) or identical (black). The biotin acceptor lysine lies in the conserved MKM
sequence.
4.3 Experimental procedures
4.3.1 Chemicals and biochemicals
All chemicals used were at least reagent grade. The concentration of the
biotin stock was prepared by dissolving a carefully weighted amount of d-biotin
(Sigma) powder in reaction buffer, adjusting the pH to 7.5, and bringing up the final
desired volume in a volumetric flask. After filtering through 0.22 µm syringe filter
units (Millipore), 1 ml aliquots were stored at -70 C. In order to avoid problems

83
related to biotin solubility the concentrations of the prepared stocks were always
lower than 850 µM. The d-Biotin (8,9-3H(N)) (PerkinElmer) was aliquoted and stored
under argon gas in sealed containers at -70 C. The ATP stock was prepared by
dissolving the ATP powder (sigma) in water and adjusting the pH to 7.5 with sodium
hydroxide. The stock concentration was determined by UV absorbance using an
extinction coefficient of 15400 M-1
cm-1
at 259 nm, and stored in 0.5 ml aliquots at -
70 °C. The concentrations of the enzymes and the biotin acceptor substrates were
determined from their UV absorption spectra using extinction coefficients calculated
according to the method of Gill and Von Hippel(64).
4.3.2 Sequence composition and cloning
The SUMO fusion plasmid used to purify the 67 amino-acid long C-terminal
region of PCC carboxylase was described previously. This minimal biotin acceptor
fragment corresponds to the 67 amino acids of the BCCP domain described by Leon
del Rio (residues 662-728), preceded by an additional exogenous N-terminal tyrosine
introduced to aid in protein concentration determination by UV
spectroscopy(67,72,96). ClustalW multiple sequence alignment of the PCC BCCP
minimal acceptor sequence with those of the remaining carboxylases aided in the
selection of the corresponding regions of MCC, PC, and the ACC2 (Figure 19B). The
coding regions for PC (residues 1112-1178), MCC (residues 649-715) and ACC2
(residues 897-962) BCCP fragments were cloned into the SUMOpro vector
(LifeSensors) to yield constructs with a cleavable N-terminal 6his-SUMO tag. The
fragment sequences were amplified using taq polymerase (Invitrogen) with PCR
primers that introduced Eco31I (Fermentas) sites. In addition, in order to facilitate

84
concentration determination the amplification primers for PC BCCP were designed to
introduce an exogenous tyrosine residue after the SUMO cleavage site. Because the
SUMO protease does not cleave before a proline residue, an N-terminal glycine was
introduced at the N-terminus of the MCC BCCP sequence. A pet28 plasmid coding
for the full length PC carboxylase (Gift from Dr. Lain Tong) was used as the template
to amplify PC BCCP. The cDNA sequence of the MCCA gene (Origene, Inc.) was
used to amplify the MCC BCCP fragment. ACC2 BCCP was amplified from a pBSK
plasmid containing the ACC2 BCCP coding sequence purchased from Epoch Biolabs
Inc. After restriction enzyme digestion and agarose gel purification of the PCR
products and the SUMO-pro vector, the fragments were ligated using T4 DNA ligase
(Roche). The resulting ligation reactions were transformed by electroporation into E.
coli Top10 cells and successful clones were selected for on LB-ampicillin media.
Plasmid DNA from an antibiotic resistant clone was isolated and the correct sequence
was verified by sequencing at the UMBI DNA sequencing facility.
The coding sequences for ACC2 (residues 891-965) and ACC1 (residues 785-
859) BCCP fragments were cloned into a pet28 vector, introducing an uncleavable C-
terminal hexahistidine tag. The primers used for PCR amplification contained NcoI
and XhoI sites (NEB, Inc.). Template DNA plasmids containing the coding
sequences for the two ACC BCCP domains were purchased from Epoch Biolabs Inc.
After digestion, purification and ligation of the PCR products and the vector, the
ligation mixtures were transformed into E. coli Top10 cells and clones were selected
for on LB-kanamycin plates. Plasmids were extracted using a mini-prep plasmid
extraction kit (Zymo Research). For ACC1 this plasmid DNA served as the template

85
for replacement of the three cysteine codons with serine codons using the
QuikChange Multi Site Directed Mutagenesis Kit from Stratagene. In all cases DNA
sequencing of the complete insert was used to verify the accuracy of each construct.
4.3.3 Protein expression and purification
FL-HCS, 58-HCS and the PCC BCCP domain were purified as previously
described(32,95). ACC2, MCC and PC BCCP domains were also purified by affinity
chromatography as his6-SUMO fusions. Plasmids were transformed by elecroporation
into Rosetta BL21DE3, and clones were selected for with 100 ug/ml ampicillin and
34 ug/ml chlorampenicol. A single colony was used to inoculate 5 ml of LB media
supplemented with antibiotics, and the culture was grown overnight at 37 C with
shaking at 250 rpm. After dilution into 50 mls of media and 8 hrs of growth, the
culture was used to inoculate 1 L of media with antibiotics. When the OD600 reached
0.6, the temperature was lowered to 20 C and expression was induced for 18-20 hrs
by addition of 0.1 % (w/v) lactose. All subsequent steps were carried out at 4 C.
Cells were harvested by centrifugation at 4500 rpm. The resulting pellet was
resuspended in 200 ml of lysis buffer (50 mM sodium phosphate, pH 8, 300 mM KCl,
10 mM imidazole, 5 % (vol/vol) glycerol, 1 mM PMSF, 3 mM 2-mercaptoethanol)
and cells were pelleted by centrifugation at 6000 rpms. The pellet was resuspended in
a volume corresponding to five times its weight of lysis buffer and cells were lysed
by sonication until the OD600 was reduced to 10 % of its original value. The lysate
was spun at 8000 rpm and the supernatant loaded on 10 ml of Ni-NTA resin (Qiagen)
equilibrated with lysis buffer. After the column was washed with lysis buffer with 20
and then 50 mM imidazole until the absorbance returned to baseline after which the

86
protein was eluted with Ni-NTA elution buffer (50 mM sodium phosphate, pH 8, 300
mM KCl, 250 mM imidazole, 5 % (vol/vol) glycerol). Sumo protease-1, which was
purified from a plasmid that was a generous gift from Dr. Christopher Lima(66), was
added at a 1:100 (weight/weight) ratio, and the resulting sample dialyzed overnight
into SUMO protease digestion buffer (10 mM sodium phosphate, pH 8.0, 60 mM
NaCl, 5% vol/vol glycerol, 5 mM 2-mercaptoethanol). The SUMO tag and SUMO
protease were removed by passing the sample through the Ni-NTA column
equilibrated with lysis buffer. The MCC sample was concentrated down to 5 mls by
dialysis against a viscous solution of PEG20000 in storage buffer (10 mM Tris, pH
8.0, 200 mM KCl, 5 % glycerol), and it was loaded at flow-rate of 0.1 mL/min on a
1.5 x 75 cm column containing 140 mls of Sephacryl S-100 resin equilibrated in
storage buffer with 1 mM 2-mercaptoethanol for PC and MCC, or 1 mM DTT for
ACC2. Before loading the PC BCCP sample onto the size exclusion column as
described for MCC and ACC2, the sample was dialyzed against Q-sepharose starting
buffer (10 mM Tris, pH 7.5 at 4 C, 30 mM NaCl, 5 % (vol/vol) glycerol, 1 mM 2-
mercaptoethanol) and loaded on a 10 ml of Q-sepharose resin (GE healthcare) in a 1.5
x 10 ml econo column (BioRad) at 0.5 ml/min. After washing until the absorbance
returned to baseline, the protein was eluted at a flow rate of 0.5 ml/min with Q-
sepharose elution buffer (10 mM Tris, pH 7.5 at 4 C, 1 M NaCl, 5 % (vol/vol)
glycerol, 1 mM 2-mercaptoethanol) using a linear NaCl gradient (30 mM to 1.0 M) of
a total volume of 300 mL.
The longer ACC1 and ACC2 BCCP fragments were expressed as non-
cleavable C- terminal his6 tag. These fragments are referred to as ACC1-his6 and

87
ACC2-his6, and correspond to the ACC2 BCCP described by Lee et al(42). Their
expression was carried out in Rosetta E. coli cells using a similar protocol as the one
described for PC and MCC, with the exception that expression was induced with 1.5
% (w/vol) lactose and selection was provided by 50 µg/ml kanamycin and 34 µg/ml
chloramphenicol. After harvesting, washing and resuspending the cells in lysis buffer,
the samples were loaded on Ni-NTA. The columns were washed with 20 and 50 mM
imidazole in lysis buffer, and eluted with Ni-NTA elution buffer. The ACC1-his6
sample was then dialyzed into Q-sepharose staring buffer, loaded on 10 ml of Q resin,
and eluted with a gradient of Q-sepharose elution buffer as described for PC BCCP.
The ACC2-his6 sample did not require an ion exchange column. Both samples were
concentrated down to 5 ml and chromatographed on Sephacryl S-100 columns as
described above. The BCCP fragment preparations were determined to be more than
99 % pure, as judged by electrophoresis on 16.5 % polyacrylamide-SDS-tricine gels.
In addition, all the BCCP preparations were tested using MALDI for lack of
contamination with biotinylated BCCP, as well as for their ability to be quantitatively
biotinylated by HCS. Samples were dialyzed into storage buffer and passed through
0.22 µm syringe filter units (Millipore). After UV spectrophotometric determination
of their concentrations, the samples were aliquoted in 500 µL and stored at -70 C.
4.3.4 Sedimentation equilibrium measurements
The molecular weights of PC, MCC, ACC1-his6 and ACC2-his6 were
determined by equilibrium analytical ultracentrifugation. Measurements were
performed in a Optima XL-I analytical ultracentrifuge (Beckman-Coulter) equipped
with a four hole AnTi-60 rotor. Centrifugation was performed at 20 C with samples

88
that had been extensively dialyzed against reaction buffer (10 mM Tris, pH 7.5 at 20
C, 200 mM KCl, 2.5 mM MgCl2). The BCCPs that contained cysteine residues were
dialized against reaction buffer with 0.5 µM TCEP. Approximately 110 µL of sample
at three different concentrations ranging from 40 to 400 µM were loaded into a cell
assembled with a 12 mm six channel charcoal filled epon centerpiece. Samples were
scanned at 276 nm through sapphire windows. Data were collected after a delay
period of 8 hours at two different speeds (28000 and 32000 rpm) as an average of 5
scans with a 0.001 cm radial step. In each case a value for the reduced molecular
weight, , was obtained by subjecting the data to global analysis using single species
model in WinNonLin, which was converted to molecular weight using the following
equation:
in which M is the molecular mass, is the partial specific volume of the
protein, is the buffer density, is the angular velocity, R is the gas constant and T
is the temperature. The reaction buffer density was 1.017 g/ml. Partial specific
volumes were calculated based on the protein sequences using the program SednTerp
(http://www.rasmb.bbri.org), and had values of 0.7375 ml/g for PCC BCCP, 0.7593
ml/g for PC BCCP, 0.7485 ml/g for MCC BCCP, 0.7274 ml/g for ACC2-his6 and
0.7311 ml/g for ACC1-his6.
4.3.5 Stopped flow measurements of biotin transfer
Biotin transfer was measured using a Kintek SF-2001 instrument as described
previously(28,32,95). The stopped flow instrument allows monitoring of the time
dependent increase in intrinsic tryptophan florescence that accompanies the
M (1 ) 2
R T

89
disappearance of the enzyme-intermediate upon biotin transfer. In these experiments,
one syringe contained a fixed concentration of enzyme-intermediate complex, while
the second syringe contained varying concentrations of the BCCP substrates. The
reactions were initiated by rapidly mixing equal volumes of the two solutions. The
enzyme intermediate complex was pre-formed by incubating 1 µM HCS with 0.5 µM
biotin and 500 µM ATP in reaction buffer at 20 for 20 minutes, thus allowing bio-
5‟-AMP synthesis to occur. The emitted fluorescence as a function of time was
monitored using a 340 nm cutoff filter (Corion Corp.) and an excitation wavelength
of 295 nm. At least 5 transients were collected at each BCCP concentration, and the
apparent rates were obtained by individually fitting to an appropriate exponential
model using the software provided with the Kintek instrument. Subsequent linear
regression or non-linear least squares fitting to the Michaelis-menten equation were
performed using PRISM 5 (GraphPad, Inc).
4.3.6 Quenched flow measurements of biotin transfer
The rate of HCS-catalyzed biotin incorporation into the BCCP fragments was
monitored using a QF-3 quenched flow instrument as described previously. A single
turnover of biotin transfer from HCS to BCCP was monitored by quantitating the
amount of tritium labeled biotin incorporated into the BCCP fragments. Briefly, a
solution of enzyme-intermediate, HCS.bio-5‟-AMP was rapidly mixed with an equal
volume of a BCCP solution. The enzyme-intermediate complex was pre-formed by
incubating 1 µM ligase, 0.463 µM biotin, 37 nM 3H-biotin, and 500 µM ATP in
reaction buffer at 20 C for 20 minutes. At each BCCP concentration, the biotin
transfer reaction was repeatedly initiated and quenched with 2 M HCl, after aging for
90
an increasing amount of time. The reactions involving ACC1-his6, ACC2-his6 and
ACC2 BCCP fragments were sufficiently slow to allow hand mixing of the enzyme
and reactants in 280 µL total volume followed by quenching of 24 µL in 180 µL of 2
M HCL at different times. BSA was added to a final concentration of 0.1 mg/ml, and
the sample was transferred to dried 3MM Whatman paper squares pre-spotted with
200 l of 800 M biotin in 10 % TCA. The papers were washed twice in 250 ml of
cold 10 % TCA and rinsed once with ethanol. After drying, the radioactivity on the
papers was counted on a LS6500 Beckman counter using 5 ml of ReadyProtein+
(Beckman) scintillation fluid. After background correction, conversion from dpm to
“µM biotin” was carried out using the relation between dpm and µM obtained from
the precipitation of a reaction with quantitative 3H incorporation. Apparent rates were
obtained by fitting the transients to a single exponential model. The apparent rates vs
concentration profiles were fit to either linear regression in the case of PCC, PC and
MCC, or to non-linear least square regression to the Michaelis-Menten equation in
the case of ACC1-his6 and ACC2-his6.
4.4 Results
4.4.1 Design and preparation of BCCP fragments
In order to investigate selectivity in HCS-catalyzed post-translational biotin
addition to the five natural carboxylase targets appropriate substrates were first
obtained in sufficient quantities for detailed kinetic measurements. Human
carboxylases are large proteins with complex oligomeric structures (Figure 19A).
Fortunately, it has previously been shown that a 67 amino acid fragment of the BCCP

91
domain of the human propionyl CoA carboxylase contains all the information
necessary for HCS-catalyzed biotinylation (72) (Figure 19B). Moreover, this
fragment can be readily overexpressed and purified in large quantity using the SUMO
fusion protein strategy(95). A similar strategy was used to obtain BCCP fragments of
the remaining carboxylases. Multiple sequence alignment of the PCC fragment with
the sequences of the remaining carboxylases was used to identify the corresponding
biotin acceptor regions of MCC, PC, ACC1 and ACC2. The BCCP domains of PC
and MCC were successfully purified in quantities larger than 10 mg/L of bacterial
culture using the strategy employed previously for the PCC fragment. By contrast, the
ACC2 and ACC1 fragments presented a variety of problems. Yields of the ACC1
fragment were low (1 mg/L), and the SUMO-ACC1 fragment could not be cleaved,
even when extended to include 7 additional endogenous residues before the tag.
Consequently, following the ACC2 BCCP fragment design of Lee et al. (42) , the two
acceptor domains were produced a his6 fusion proteins. Relative to the MCC, PC and
PCC acceptor domains, both ACC1 and ACC2 fragments contained 3 additional
endogenous residues and the non cleavable -LEHHHHHH tag at the C-terminus, and
6 additional endogenous residues at the N-terminus. In addition, in order to prevent
aggregation due to nonspecific disulfide bond formation the three cysteine residues of
ACC1-his6 were replaced by serine.
4.4.2 Oligomeric states of the BCCP fragments
Interpretation of the kinetic data was facilitated by determining the oligomeric
states of all BCCP fragments using equilibrium analytical ultracentrifugation. Three
different concentrations of each protein were allowed to reach equilibrium at two

92
different speeds. The resulting six scans were globally fit to a single species model to
obtain values for sigma. The sigma values corresponded to molecular weights that
were consistent with the monomeric BCCP species at the concentrations relevant to
our studies (Table 7). The FL-HCS and 58-HCS have previously been determined to
be monomers in both the unliganded form and when bound to bio-5‟-AMP(32).
Table7. Assembly state of BCCP fragments
BCCP Analytical M.W. Experimental M.W.
PCC 7033 7200 ± 500 a, b
MCC 7462 7600 ± 700 b
PC 7254 8000 ± 1000 b
ACC1-his6 9234 9400 ± 900 b
ACC2-his6 9408 9700 ± 600 b
a. value obtained from Ingaramo and Beckett (95).
b. molecular weights with 67%
confidence limits obtained from global nonlinear least-squares analysis of equilibrium
sedimentation data using WinNonLin.
4.4.3 Biotin transfer assays
HCS specificity in post-translational biotin addition was measured using
stopped-flow and quench-flow kinetic assays. The rate-determining step in the
overall two-step biotinylation reaction catalyzed by HCS is bio-5‟-AMP synthesis.
Therefore, information about the selectivity in the second step in which biotin is
transferred from the adenylate to the acceptor protein is lacking in steady state
measurements. Two single turnover assays were used to monitor the biotin transfer
reaction independent of bio-5‟-AMP synthesis(28,32,95). In both assays the enzyme,
biotin and ATP are pre-incubated to allow for complete bio-5‟-AMP synthesis. Only

93
then is the enzyme-intermediate complex rapidly mixed with BCCP, and the biotin
transfer reaction progress monitored. Thus, the reaction monitored in these assays is:
HCS·bio-5'-AMP + BCCP HCS·bio-5'-AMP·BCCP HCS + bio-BCCP + AMP
k1
k-1
k2
The stopped flow assay allows observation of the time dependent increase in
HCS intrinsic fluorescence that accompanies biotinylation (Figure 20A). Transients
obtained upon mixing equal volumes of a constant concentration of enzyme-bio-5‟-
AMP with different concentrations of BCCP fit to a single exponential model, except
in the case of the PCC fragment. For this substrate the stopped flow traces display a
second slow phase, the rate of which is independent of BCCP concentration and is,
therefore, interpreted as reporting on product dissociation (k2) . The second assay,
which employs a quench-flow system, follows the product, bio-BCCP, accumulation
and is based on the quantitation of the amount of radioactive biotin incorporated into
BCCP. Each transient is obtained after repeatedly initiating the biotinylation reaction
by mixing pre-formed enzyme intermediate complex with BCCP, and quenching it at
different times (Figure 20B). Quenching of the reaction is accomplished by adding
2M HCl, which both abolishes enzymatic activity and destroys the enzyme-
intermediate complex. After protein precipitation with TCA, the acid insoluble
radioactivity is quantified to measure biotin incorporation. All transients obtained
from this analysis are well-described by a single exponential model.
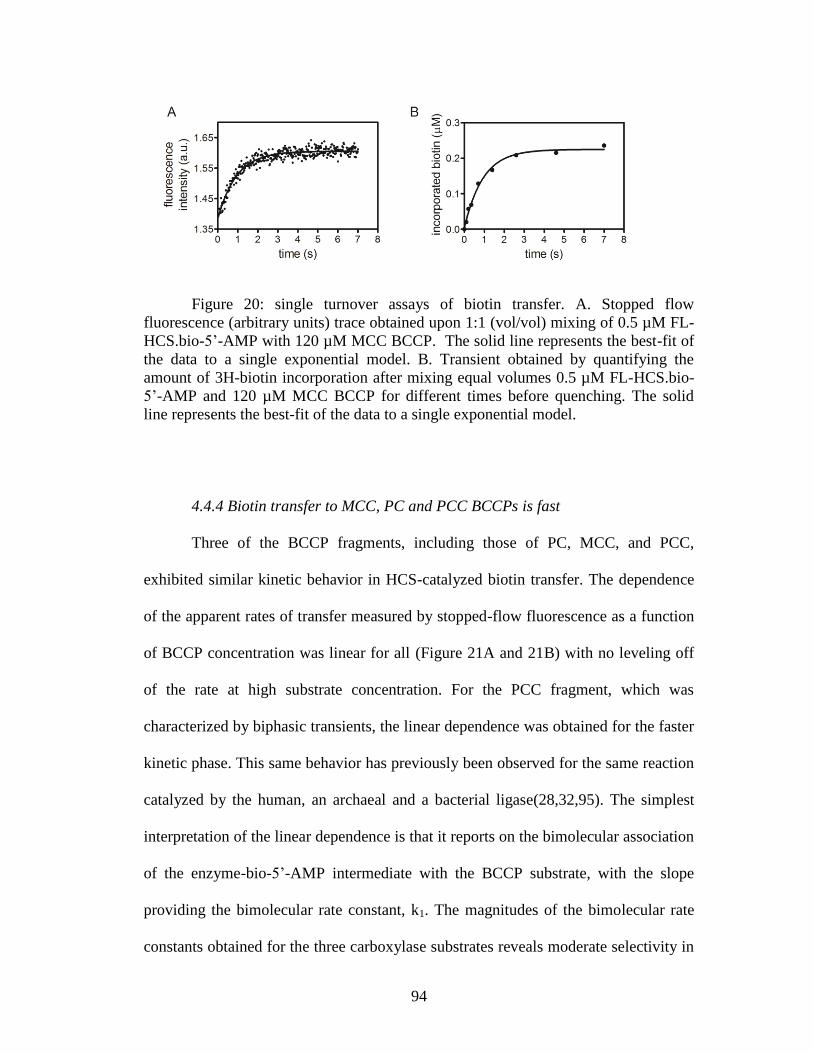
94
Figure 20: single turnover assays of biotin transfer. A. Stopped flow
fluorescence (arbitrary units) trace obtained upon 1:1 (vol/vol) mixing of 0.5 µM FL-
HCS.bio-5‟-AMP with 120 µM MCC BCCP. The solid line represents the best-fit of
the data to a single exponential model. B. Transient obtained by quantifying the
amount of 3H-biotin incorporation after mixing equal volumes 0.5 µM FL-HCS.bio-
5‟-AMP and 120 µM MCC BCCP for different times before quenching. The solid
line represents the best-fit of the data to a single exponential model.
4.4.4 Biotin transfer to MCC, PC and PCC BCCPs is fast
Three of the BCCP fragments, including those of PC, MCC, and PCC,
exhibited similar kinetic behavior in HCS-catalyzed biotin transfer. The dependence
of the apparent rates of transfer measured by stopped-flow fluorescence as a function
of BCCP concentration was linear for all (Figure 21A and 21B) with no leveling off
of the rate at high substrate concentration. For the PCC fragment, which was
characterized by biphasic transients, the linear dependence was obtained for the faster
kinetic phase. This same behavior has previously been observed for the same reaction
catalyzed by the human, an archaeal and a bacterial ligase(28,32,95). The simplest
interpretation of the linear dependence is that it reports on the bimolecular association
of the enzyme-bio-5‟-AMP intermediate with the BCCP substrate, with the slope
providing the bimolecular rate constant, k1. The magnitudes of the bimolecular rate
constants obtained for the three carboxylase substrates reveals moderate selectivity in
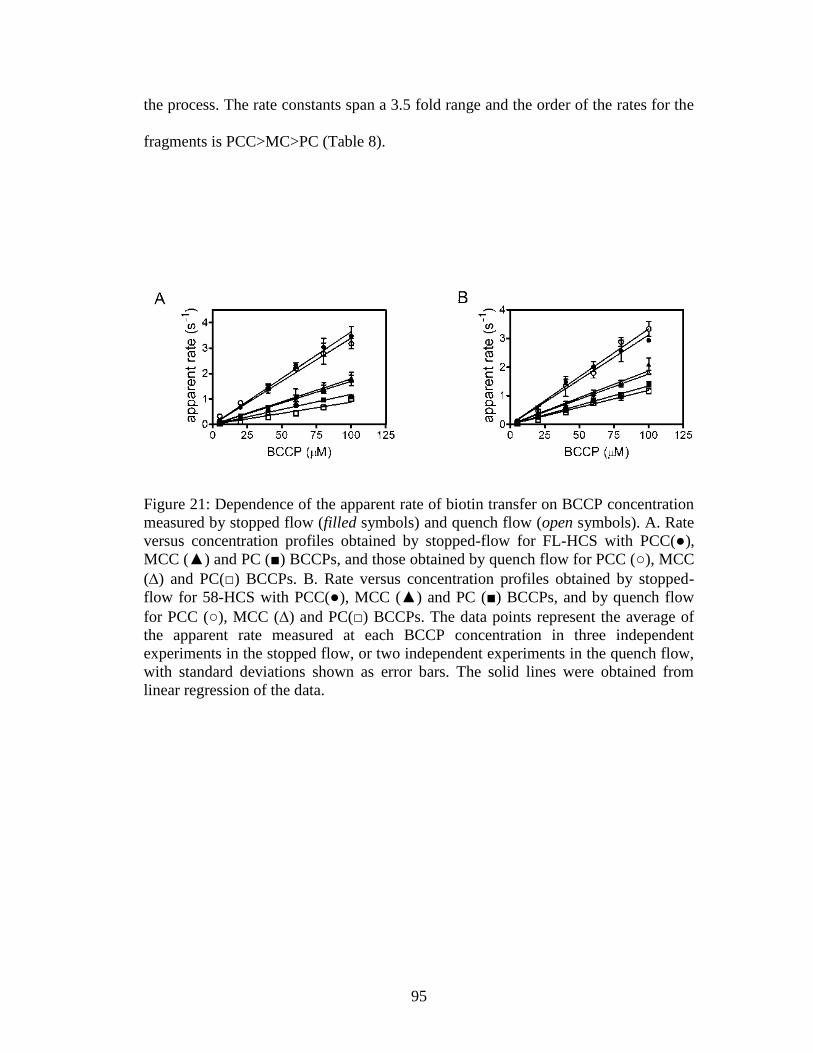
95
the process. The rate constants span a 3.5 fold range and the order of the rates for the
fragments is PCC>MC>PC (Table 8).
Figure 21: Dependence of the apparent rate of biotin transfer on BCCP concentration
measured by stopped flow (filled symbols) and quench flow (open symbols). A. Rate
versus concentration profiles obtained by stopped-flow for FL-HCS with PCC(●),
MCC (▲) and PC (■) BCCPs, and those obtained by quench flow for PCC (○), MCC
() and PC(□) BCCPs. B. Rate versus concentration profiles obtained by stopped-
flow for 58-HCS with PCC(●), MCC (▲) and PC (■) BCCPs, and by quench flow
for PCC (○), MCC () and PC(□) BCCPs. The data points represent the average of
the apparent rate measured at each BCCP concentration in three independent
experiments in the stopped flow, or two independent experiments in the quench flow,
with standard deviations shown as error bars. The solid lines were obtained from
linear regression of the data.
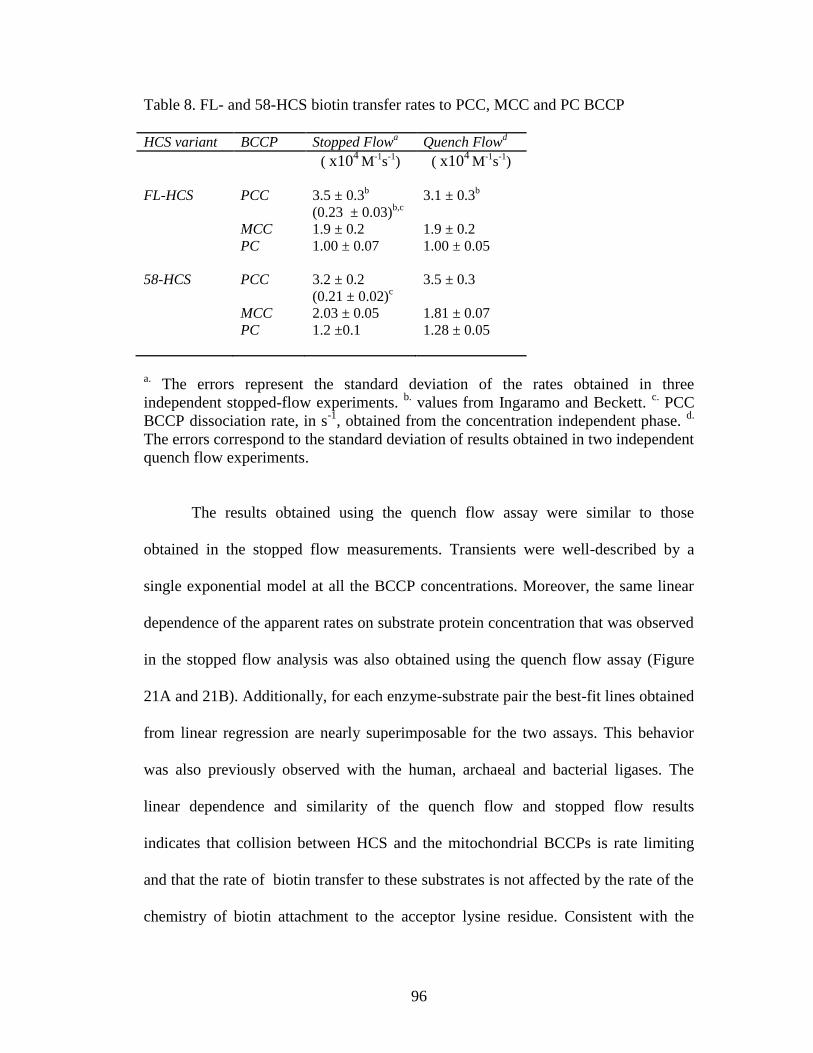
96
Table 8. FL- and 58-HCS biotin transfer rates to PCC, MCC and PC BCCP
HCS variant BCCP Stopped Flowa Quench Flow
d
( x104
M-1
s-1
)
( x104
M-1
s-1
)
FL-HCS PCC 3.5 ± 0.3b
(0.23 ± 0.03)b,c
3.1 ± 0.3b
MCC 1.9 ± 0.2 1.9 ± 0.2
PC 1.00 ± 0.07 1.00 ± 0.05
58-HCS PCC 3.2 ± 0.2
(0.21 ± 0.02)c
3.5 ± 0.3
MCC 2.03 ± 0.05 1.81 ± 0.07
PC 1.2 ±0.1 1.28 ± 0.05
a. The errors represent the standard deviation of the rates obtained in three
independent stopped-flow experiments. b. values from Ingaramo and Beckett.
c. PCC
BCCP dissociation rate, in s-1
, obtained from the concentration independent phase. d.
The errors correspond to the standard deviation of results obtained in two independent
quench flow experiments.
The results obtained using the quench flow assay were similar to those
obtained in the stopped flow measurements. Transients were well-described by a
single exponential model at all the BCCP concentrations. Moreover, the same linear
dependence of the apparent rates on substrate protein concentration that was observed
in the stopped flow analysis was also obtained using the quench flow assay (Figure
21A and 21B). Additionally, for each enzyme-substrate pair the best-fit lines obtained
from linear regression are nearly superimposable for the two assays. This behavior
was also previously observed with the human, archaeal and bacterial ligases. The
linear dependence and similarity of the quench flow and stopped flow results
indicates that collision between HCS and the mitochondrial BCCPs is rate limiting
and that the rate of biotin transfer to these substrates is not affected by the rate of the
chemistry of biotin attachment to the acceptor lysine residue. Consistent with the

97
stopped flow results, HCS displays selectivity among the three BCCP domains by
displaying biotin transfer rates that are 3.5 fold different. In addition, the linear
dependencies of the rates of FL and 58-HCS-catalyzed reactions for any single BCCP
substrate were similar.
4.4.5 Biotin transfer to ACC1-his6 and ACC2-his6 displays a different kinetic
behavior
The kinetic behavior of the two ACC BCCP fragments in HCS-catalyzed
biotin transfer is distinct from that observed for the mitochondrial substrates. For
simplicity the results obtained with the ACC2 fragment are first presented followed
by those obtained for the ACC1 fragment. Like the PC and MCC fragments,
transients obtained upon mixing of the enzyme.intermediate complex with ACC2-
his6 BCCPs were well described by a single exponential model. However, at any
single substrate concentration the measured rate was significantly slower than the
rates obtained for the mitochondrial BCCP fragments. For example, the apparent rate
obtained at a final concentration of 80 µM ACC2-his6 is approximately 40 fold slower
than the apparent rate at the same concentration of PC BCCP, the slowest of the
mitochondrial substrates. In contrast to the linear behavior exhibited by the
mitochondrial BCCPs, ACC2-his6 displayed a hyperbolic dependence of the apparent
biotinylation rate on BCCP concentration (Figure 22A and 22B). Nonlinear least
squares analysis of the data using the Michaelis-Menten formalism yielded a KM of
approximately 65 µM and a kcat of 0.04 s-1
(Table 9). The saturable behavior indicates
that, in contrast to the three BCCP fragment discussed above, the rate-limiting step in
the second half reaction for the ACC2 substrate is limited by the chemistry of biotin

98
attachment. In turn, bio-5‟-AMP synthesis, which is associated with a rate of 0.1 s-1
,
is not the rate limiting step in the overall two-step biotinylation reaction for this
substrate.
Measurements of product incorporation into ACC2-his6 BCCP yielded results
similar to those obtained in the stopped-flow measurements (Figure 22A and 22B,
table 9). The slow reaction rates observed for this substrate obviated use of the
quench-flow, and manual mixing and quenching of 3H-biotin spiked reactions was
used to construct the transients, which were all well-described by a single-exponential
model. The rates obtained from the analysis are, like those obtained using the
stopped-flow assay, slow. One source of concern associated with the slow measured
rates of biotin transfer to the ACC2-his6 is the potential influence of the tag on the
reaction rate. Although the untagged version of the fragment could not be obtained in
sufficient quantity to determine full rate versus concentration profiles, sufficient
material was available to compare its kinetic behavior to that of the tagged protein.
Comparison of the transients obtained at a final concentration of 20 µM ACC2 BCCP
with the corresponding transients for 20 µM ACC2-his6 showed that FL and 58-HCS
catalyze the biotin transfer reaction to both BCCP constructs with similarly slow rates
that are within error identical (data not shown). Furthermore, the results show that
both tagged and untagged ACC2 BCCPs are similarly slow. Plots of the measured
rates versus substrate concentration displayed a hyperbolic dependence on ACC2-his6
concentration and non-linear least squares of the data to the Michaelis-Menten model
yielded parameters values that agree with those obtained in the stopped flow
measurements (Table 9).

99
Figure 22: biotin transfer to the BCCP fragments of acetyl-CoA carboxylases. Panels
A and B: rate vs concentration profiles for FL-HCS (A) or 58-HCS (B) biotin transfer
to his6-ACC2 obtained by stopped flow (●) and quench flow (○).The data points
represent the average of the apparent rate measured at each BCCP concentration in
three independent experiments in the stopped flow, or two independent experiments
in the quench flow, with standard deviations shown as error bars. The solid lines
represent the best-fits of the rate versus concentration profiles to the Michaelis-
Menten equation. Panels C and D: Apparent rates for biotin transfer to ACC1-his6
obtained by stopped flow (♦) or quench flow (◊) with FL-HCS (C) and 58-HCS (D).
The quench flow data points represent the average of the apparent rate measured at
each BCCP concentration in two independent experiments, with standard deviations
shown as error bars. The stopped flow data points for the three higher ACC1-his6
concentrations are the average of at least 10 traces each, while the data points at the
lower concentrations represent the average of three independent experiments, with
error bars indicating their standard deviation.

100
Table 9: FL- and 58-HCS catalyzed biotin transfer to ACC2-his6 BCCP
Stopped Flowa
3H-biotin incorporation assay
b
KM kcat KM kcat
FL-HCS
(µM)
80 ± 20
(s-1
)
0.032 ± 0.005
(µM)
60 ± 20
(s-1
)
0.037 ± 0.004
58-HCS 70 ± 30 0.038 ± 0.007
90 ± 20 0.058 ± 0.006
a. The errors represent the standard deviation of the rates obtained in three
independent stopped-flow experiments, or the propagated 68% confidence interval
obtained from the individual fits, whichever was larger. b.
The errors correspond to the
standard deviation of results obtained in two independent experiments, or the
propagated 68% confidence interval obtained from the individual fits, whichever was
larger.
HCS-catalyzed biotin transfer to ACC1-his6 was similar to transfer to ACC2-
his6. Stopped flow traces displayed apparent rates that were very slow compared to
those measured for the mitochondrial carboxylases (Figure 22C and 22D). In
addition, as observed for ACC2-his6, the apparent rates displayed a hyperbolic
dependence on ACC1-his6 concentration. Non-linear least square regression of the
apparent rate dependence on BCCP fragment concentration to the Michaelis-Menten
provided kcat and KM values of (Table 10). The large errors associated with the
stopped flow derived KM values for ACC1-his6 are likely due the limited
concentration range over which the measurements could be performed because of the
fragment‟s low solubility. The 3H-incorporation experiments provided KM values
comparable to those obtained for ACC2-his6 (Table 10), and kcat values that were
approximately 2-fold larger than those for ACC2-his6. Moreover, this kcat value is
similar in magnitude to that obtained for bio-5‟-AMP synthesis.

101
Table 10. FL- and 58-HCS catalyzed biotin transfer to ACC1-his6 BCCP
Stopped Flowa
3H-biotin incorporation assay
b
KM kcat KM kcat
FL-HCS
(µM)
190 ± 90
(s-1
)
0.12 ± 0.04
(µM)
70 ± 30
(s-1
)
0.06 ± 0.02
58-HCS 200 ± 90 0.15 ± 0.05 80 ± 30 0.12 ± 0.03
a. The errors represent the propagated 68% confidence limits obtained from globally
fitting the data, which comprised three independent datasets for the three lower
concentrations, and at least 10 traces for the three largest concentrations. b.
The errors
correspond to the standard deviation of results obtained in two independent
experiments, or the propagated 68% confidence interval obtained from the individual
fits, whichever was larger.
4.5 Discussion
Holocarboxylase synthetase is known to display preference for its cognate
human biotin acceptor (BCCP) domain over those of other species (95). However,
prior to these studies it was not known if the enzyme shows any specificity in biotin
addition to the five endogenous human BCCPs. It was also not known if the HCS N-
terminus affects the interaction with these BCCP fragments. In this work the
application of two single turnover assays allowed measurements of specificity in
HCS-catalyzed biotin transfer to the five endogenous human acceptor substrates
(28,32,95) that revealed a kinetic preference for mitochondrial over cytosolic
substrates.
The BCCP fragments of the mitochondrial carboxylases, PC, PCC and MCC,
displayed similar kinetic properties in biotin transfer. All exhibited a linear
dependence of the apparent transfer rate on BCCP concentration when monitored by
either stopped flow or quench flow. This behavior indicates that transfer to these

102
substrates is limited by the rate of collision of the enzyme-intermediate with BCCP,
and provides a measure of the bi-molecular association rate constant formation of the
ternary complex. The slowest rate constant, 10,000 M-1
s-1
, was measured for the PC
substrate and the fastest, 33,000 M-1
s-1
, for the PCC fragment. This 3-fold difference
in transfer supports the notion that HCS shows modest discrimination in biotin
transfer to the three mitochondrial carboxylases. However, for all substrates the full
length and the N-terminal truncated enzymes showed identical rates of biotin transfer.
The properties of ACC1 and ACC2 BCCP fragments in HCS-catalyzed biotin
transfer are both qualitatively and quantitatively distinct from those of the three
mitochondrial substrates. Although, like the mitochondrial substrates, transients for
the cytosolic substrates were well-described by a single exponential model, the
apparent rates at comparable acceptor protein concentrations were significantly
slower (approximately 100-fold). The identical rates measured for the untagged and
tagged versions of the ACC2 substrate indicate that the slow rates cannot be
attributed to the presence of the his6 tag. Furthermore, in contrast to the linear
dependence observed for the mitochondrial substrates, the apparent rates of biotin
transfer to the ACC substrates displayed a hyperbolic dependence on BCCP
concentration. This saturable behavior and slow biotin transfer rates indicate that the
rate-limiting step in the second step of biotin transfer to the ACC substrates differs
from that for the PCC, PC and MCC substrates and corresponds to either the
chemistry of biotin attachment or the dissociation rate. Additionally, the slow rates
measured for HCS-catalyzed biotin addition to the ACC substrates indicates that, in
contrast to the mitochondrial substrates for which bio-5‟-AMP synthesis is rate-

103
limiting, it is the second step of biotin transfer from the adenylate to the acceptor
protein that is rate-limiting in the overall two step biotinylation reaction. The kcat in
the second step of the transfer reaction for the ACC2 BCCP fragment is
approximately 0.04 s-1
, and that of ACC1 is twice as large. Comparison of these rates
to the bio-5‟-AMP synthesis rate of 0.1 s-1
indicates that for the ACC substrates the
overall reaction rate for the two-step biotin transfer reaction is influenced by the
second step of biotin transfer from the adenylate to the lysine residue on BCCP(32).
The two-fold larger kcat observed for 58- vs FL-HCS biotinylation of the
BCCP fragment of ACC2 was the largest difference observed for the two enzyme
isoforms. This suggests that the N-terminus of HCS affects biotin acceptor substrate
recognition mainly for ACC2 and perhaps for ACC1 and are consistent with results of
NMR measurements performed on the ACC2-his6 construct. Lee et al. monitored the
chemical shift perturbations that occur in ACC2-his6 spectra upon addition of FL-
HCS and the initial 160 amino-acids of HCS (160-HCS)(42). Signals for several
ACC2-his6 side chains were shown to undergo chemical shift perturbations upon
addition of either HCS partner, which led to the proposal that the N-terminus might
be involved in recruitment of the BCCP substrate. In addition, chemical shift
perturbations on the N-terminal HCS fragment indicated that this domain undergoes
conformational rearrangements upon binding ACC2-his6. While these NMR studies
provided valuable structural information, only the ACC2-his6 BCCP has been
subjected to them.
The magnitudes of the rates of BCCP biotinylation correlate with the cellular
localization of the corresponding carboxylases. Biotinylation of the BCCP fragments

104
of PC, PCC and MCC displayed faster apparent rates than those of ACC1 and ACC2.
While the latter two are present in the cytoplasm, the other carboxylases are
transported into the mitochondria matrix. It is tempting to speculate that HCS
biotinylates PC, PCC and MCC enzymes faster because mitochondrial enzymes are
only transiently present in the cytoplasm and must be biotinylated prior to
mitochondrial import. Conversely, HCS has continuous access to ACC1 and ACC2,
so there is no biological pressure to increase the biotinylation reaction speed.
Previous studies provide some support for a model that rationalizes faster
biotinylation rates of substrates destined for the mitochondria based on lack of access
once transported. First, even though ACC2 is associated with the mitochondria, it
localizes to the cytosolic side of the mitochondrial membrane (19). Thus, HCS has
continuous access to ACC2 as well as ACC1 and a fast biotinylation rate would not
need to evolve. Second, carboxylases are imported into mitochondria whether
biotinylated or not (97). If indeed there is no mechanism to prevent unbiotinylated
carboxylase transport into the mitochondria, then it is even more pressing that
biotinylation of mitochondrial carboxylases display a fast rate.
The above model assumes that HCS localizes to the cytoplasm, with no HCS
found in the mitochondria. Subcellular localization of HCS has been a matter of
debate. Its presence in the cytoplasm is well established through fluorescence
microscopy localization studies and western blots of fractionated cells (44). While no
mitochondrial localization of HCS was evidenced in microscopy studies of intact
cells in which the N- and C- terminally GFP tagged enzyme was expressed, western
blots of mitochondrial fractions were inconclusive and showed a 60 kDa band that is

105
not consistent with the sizes expected for HCS splice variants (40). The identity of
this band remains to be confirmed, but suggests the presence of a processed form of
HCS in the mitochondria. In addition, an independent study involving pulse-chase 35
S
labeling of PC provided evidence supporting the presence of biotinylating activity in
the mitochondria(97). The possibility of HCS mitochondrial localization poses a
problem for our explanation for HCS faster biotin transfer rates to mitochondrial
carboxylases. However, confirming the presence of biotinylating activity in the
mitochondria and the identity of the 60 kDa species would reveal new mechanistic
possibilities, and does not negate the fact that HCS displays specificity among its
natural biotinylation targets.
The observed HCS selectivity suggest a mechanism for biotin distribution
among carboxylases that is controlled kinetically at two levels. First, HCS displays a
marked distinction between cytosolic and mitochondrial substrates, favoring biotin
transfer to those carboxylases to which it has only transient access. Second, HCS will
display selectivity among the mitochondrial carboxylases. The intracellular biotin
supply is low and, accordingly, the HCS.adenylate complex is limiting. Kinetically,
the carboxylase that associates most rapidly with this complex will be favored in
biotinylation. However, the significance of the relative intrinsic rates of biotinylation
can be overridden by altering relative carboxylase concentrations. Carboxylases will
compete for the biotin, and those that have the fastest kinetics of association, which is
dependent on substrate concentration and inherent association rate, will be
preferentially modified. As a result of these preferences, the cell can establish a

106
hierarchy among the carboxylases that determines metabolic use of biotin based on
the rates of bimolecular association and carboxylase abundance.
107
Chapter 5: Conclusions and future directions
The initial biochemical studies presented yielded valuable insight into the
mechanism of the biotinylation reaction, allowed for the investigation of HCS
specificity, and suggested a model for the control of biotin distribution among
carboxylases. Biochemical characterization of the two HCS isoforms demonstrated
that both variants are monomers in the unliganded form and when bound to bio-5‟-
AMP. Steady state analysis of the overall reaction, as well as pre-steady state kinetic
measurements of bio-5‟-AMP synthesis indicated that FL- and 58-HCS synthesize
bio-5‟-AMP at a rate of 0.1 s-1
. Single turnover measurements of the biotin transfer
reaction alone indicated that BCCPs from mitochondrial carboxylases were
biotinylated much faster than the BCCP fragments of cytosolic carboxylases. In the
case of the two cytosolic carboxylases the second step, biotin transfer, is the slowest
step observed, likely becoming the rate limiting step. However, in the biotinylation of
the three mitochondrial BCCP fragments, the HCS catalyzed reaction is limited by
the rate of bio-5‟-AMP synthesis.
Comparison of the results obtained from the single turnover stopped flow with
those of quench flow measurements of the biotin transfer reaction to the
mitochondrial minimal biotin acceptor substrates revealed that the rate of biotin
transfer to mitochondrial carboxylases is limited by the rate of enzyme-BCCP
association. These results were used to propose a model to explain biotin distribution
among carboxylase substrates based on HCS specificity and the concentration of
substrate protein. Inside the cell, HCS binds biotin and converts it to bio-5‟-AMP.
Since this is the rate limiting step in most cases, an accumulation of enzyme-

108
intermediate complex occurs. This holo-enzyme then transfers the biotin moiety to
the carboxylase with the largest apparent association rate, leading to an effective
competition among the mitochondrial carboxylases. The apparent association rate
depends on carboxylase concentration and on the intrinsic association rate, which
gives the cell a chance to override biotin distribution by controlling carboxylase
expression.
The E. coli and an archaeal ligase catalyzed biotin transfer reactions were also
found to be limited by the rate of enzyme-intermediate complex collision with the
biotin acceptor substrate, indicating that this mechanistic aspect of the reaction is
ubiquitous. In the mammalian system, this behavior highlights the importance of
protein:protein recognition in determining the fate of biotin among the various
substrates, and mitochondrial ligases likely have evolved sequences that provide
faster association rates. In the E.coli system, association rates have an equally central
role. The bacterial ligase acts like a switch in which the ligase can transfer biotin to
the carboxylase substrate, or homodimerize to repress transcription of biotin
biosynthetic genes. Since the two interactions are isoenergetic, it is the competition of
the association rates that controls the switch.
This work has laid the foundation for several future studies. The structural
basis of HCS specificity is still vague, and it remains to be determined which residues
play critical roles in modulating the recognition both on HCS and on the biotin
acceptor substrate. This is due, in part, to the lack of an X-ray crystallography model
of HCS. Identifying which residues cause the dramatic difference between the BCCP
domains of ACC1 and 2 vs those of PC, PCC, and MCC, can potentially provide

109
insight on the involvement of those residues in catalysis vs binding. The effect of
mutating residues that affect binding will have larger effects on the apparent rate vs
BCCP concentration profiles for the mitochondrial carboxylases, while those residues
that affect catalysis might have larger effects on the cytosolic carboxylases. This
work would require a combination of mutational and crystallographic studies of
enzyme substrate complex. The PhBPL/PhBCCP crystallographic structure stands as
precedent for this type of work, although the human complex might prove more
difficult to crystallize.
The previous mutational studies can then be expanded to include those
naturally occurring variants of HCS and BCCP that are linked to MCD. Most of the
defects are expected to relate to compromised catalytic activity or biotin affinity.
However, it would be of interest to characterize those mutations that cause low biotin
responsiveness, since this phenotype may be caused by an increased KM for biotin
acceptor substrate. This is important because it would yield information on interacting
residues, and moreover, it would allow prediction of biotin responsiveness. The
assays that we developed allow us to assign the defective reaction as either bio-5‟-
AMP synthesis or biotin transfer, and to evaluate HCS response to pharmacological
doses of biotin.
Studies with the whole carboxylases would be very relevant to the
understanding of HCS specificity. Human PC (98) and PCC (99) carboxylases have
been recombinantly expressed and purified in E. coli , and MCC (100) and ACC1 in
baculovirus systems. ACC2(101) has also been purified from a baculovirus system,
but is missing 146 amino-acids (102). The single turnover quenched flow experiment

110
could be easily applied to investigate the effect of the complete carboxylase structure
on biotin transfer. After this characterization is complete, the model that we proposed
regarding distribution of biotin based on HCS association rate and the concentration
of carboxylase could be tested in human cells by careful measurement of the
carboxylases amounts and their relative biotinylation state as a function of biotin
concentration.
The key role that phosphorylation plays in regulation of cellular processes
renders HCS phosphorylation an issue that should not be overlooked. HCS activity
could be regulated by this phosphorylation. However, cell biology studies to validate
the relevance of phosphorylation to HCS regulation are lacking. It is possible that
HCS phosphorylation is unrelated to its regulation in, for example, a cell cycle
dependant manner. It is necessary to determine HCS phosphorylation status as a
function of biotin concentration before any conclusions can be drawn regarding its
biological significance. The observation that biotin activates guanylate cyclase
suggests a mechanism by which a cGMP dependent kinase would phosphorylate
transcription factors to upregulate gene expression, or maybe, phosphorylate and
regulate HCS. Identifying HCS possible interaction partners and the players of the
signaling cascade that leads to biotin regulation of gene expression in mammalian
cells is a field advancement to look forward to.
HCS biochemical characterization is not complete. Thermodynamic
characterization of small molecule binding is important because it provides assays
that aid in the design of inhibitors to either target or avoid the human ligase. Rational
drug design has traditionally used thermodynamics as a guide in binding affinity
111
optimization. Bacterial ligases have been proposed as targets for antibiotics (59), and
for this purpose, avoiding binding to the human ligase would be desirable. In
addition, it has been demonstrated that a variety of cancer cells display upregulation
of ACC, in line with their high growth rate and higher need for lipogenesis, and that
ACC is a potential anti-cancer target. Moreover, inhibition of ACC1 has shown, in
some cases, to be selective for cancer cells (103). Given this information, and the
importance of ACC for metabolism, the idea of ACC as a plausible anti-cancer drug
is not so farfetched.
In conclusion, the biochemical studies presented here provided insight into
HCS mechanism and specificity. Furthermore, the results led to the development of
models for HCS function that relate to cellular regulation and are of direct biological
relevance. We hope to have provided the framework for future HCS studies and
elucidation of the role of HCS in biotin sensing.

112
Bibliography
1. Rodionov, D. A., Mironov, A. A., and Gelfand, M. S. (2002) Genome Res 12,
1507-1516
2. Hall, C., and Dietrich, F. S. (2007) Genetics 177, 2293-2307
3. Said, H. M., Ortiz, A., McCloud, E., Dyer, D., Moyer, M. P., and Rubin, S. (1998)
Am J Physiol 275, 1365-1371
4. Boas, M. A. (1927) Biochem J 21, 712-724
5. Gyorgy, P., Melville, D. B., Burk, D., and Du Vigneaud, V. (1940) Science 91,
243-245
6. du Vigneaud, V. (1942) Science 96, 455-461
7. Bentley, R. (1985) Trends in Biochemical Sciences 10, 51-56
8. Knowles, J. R. (1989) Annu Rev Biochem 58, 195-221
9. St. Maurice, M., Reinhardt, L., Surinya, K. H., Attwood, P. V., Wallace, J. C.,
Cleland, W. W., and Rayment, I. (2007) Science 317, 1076-1079
10. Attwood, P. V., and Wallace, J. C. (202) Acc Chem Res 35, 113-120
11. Jitrapakdee, S., and Wallace, J. C. (2003) Curr Protein Pept Sci 4, 217-229
12. Cronan, J. E., and Waldrop, G. L. (2002) Prog Lipid Res 41, 407
13. Castle, J. C., Hara, Y., Raymond, C. K., Garret-Engele, P., Ohwaki, K., Kan, Z.,
Kusunoki, J., and Johnson, J. M. (2009) PLoS ONE 4
14. Brownsey, R. W., Boone, A. N., Elliot, J. E., Kulpa, J. E., and Lee, W. M. (2006)
Biochem Soc Trans 34, 223-227
15. Kim, C. W., Moon, Y. A., Park, S. W., Cheng, D., Kwon, H. J., and Horton, J. D.
(2010) Proc Natl Acad Sci 107, 9626-9631
113
16. Abu-Elheiga, L., Matzuk, M. M., Kodari, P., Oh, W., Shaikenov, T., Gu, Z., and
Wakil, S. J. (2005) Proc Natl Acad Sci 102, 12011-12016
17. Olson, D. P., Pulinilkunnil, T., Cline, G. W., Shulman, G. I., and Lowell, B. B.
(2010) Proc Natl Acad Sci 107, 7598-7603
18. Choi, C. S., Savage, D. B., Abu-Elheiga, L., Liu, Z. X., Kim, S., Kulkarni, A.,
Distefano, A., Hwang, Y. J., Reznick, R. M., Codella, R., Zhang, D., Cline, G.
W., Wakil, S. J., and Shulman, G. I. (2007) Proc Natl Acad Sci 104, 16480-16485
19. Abu-Elheiga, L., Brinkley, W. R., Zhong, L., Chirala, S. S., Woldegiorgis, G., and
Wakil, S. J. (2000) Proc Natl Acad Sci 97, 1444-1449
20. Miyazaki, T., Ohura, T., Kobayashi, M., Shigematsu, Y., Yamaguchi, S., Suzuki,
Y., Hata, I., Aoki, Y., Yang, X., Minjares, C., Harauta, I., Uoto, H., Ito, Y., and
Muller, U. (2001) J Biol Chem 276, 35995-35999
21. Jitrapakdee, S., Walker, M. E., and Wallace, I. C. (1996) Biochem Biophys Res
Comm 223
22. Wang, X., Wurtele, E. S., and Nicolau, B. J. (1995) Plant Physiol 108, 1133-1139
23. Lane, M. D., Rominger, K. L., Young, D. L., and Lynen, F. (1964) J Biol Chem
239, 2865-2871
24. Wilson, K. P., Shewchuk, L. M., Brennan, R. G., Otsuka, A. J., and Matthews, B.
W. (1992) Proc Natl Acad Sci U S A 89, 9257-9261
25. Barker, D. F., and Campbell, A. M. (1981) J Mol Biol 146, 451-467
26. Lin, K. C., Cambell, A., and Shiuan, D. (1991) Biochim Biophys Acta 1090, 317-
325
27. Streaker, E. D., and Beckett, D. (2006) Biochemistry 45, 6417-6425

114
28. Nenortas, E., and Beckett, D. (1996) J Biol Chem 271, 7559-7567
29. Zhao, H., and Beckett, D. (2008) J. Mol. Biol 380, 223-236
30. Beckett, D. (2007) Annu Rev Genet 41, 443-464
31. Daniels, K. G., and Beckett, D. (2010) Biochemistry 49, 5358-5365
32. Ingaramo, M., and Beckett, D. (2009) J Biol Chem 284, 30862-30870
33. Purushothaman, S., Gupta, G., Srivastava, R., Ramu, V. G., and Surolia. (2008)
PloS One 3, 2320
34. Bagautdinov, B., Matsuura, Y., Bagautdinova, S., and Kunishima, N. (2008) J
Biol Chem 283, 14739-14750
35. Solorzano-Vargas, R. S., Pacheco-Alvarez, D., and Leon-Del-Rio, A. (2002) Proc
Natl Acad Sci U S A 99, 5325-5330
36. Zempleni, J. (2005) Annu Rev Nutr 25, 175-196
37. Bailey, L. M., Ivanov, R. A., Wallace, J. C., and Polyak, S. W. (2008) Anal
Biochem 373, 71-77
38. Leon del Rio, A., Leclerc, D., Akerman, B., Wakamatsu, N., and Gravel, R. A.
(1995) Proc Natl Acad Sci U S A 92, 4626-4630
39. Yang, X., Aoki, Y., Li, X., Sakamoto, O., Hiratsuka, M., Kure, S., Taheri, S.,
Christensen, E., Inui, K., Kubota, M., Ohira, M., Ohki, M., Kudoh, J., Kawasaki,
K., Shibuya, K., Shintani, A., Asakawa, S., Minoshima, S., Shimizu, N.,
Narisawa, K., Matsubara, Y., and Suzuki, Y. (2001) Hum Genet 109, 526-534
40. Hiratsuka, M., Sakamoto, O., Li, X., Suzuki, Y., Aoki, Y., and Narisawa, K.
(1998) Biochim Biophys Acta 1385, 165-171
41. Campeau, E., and Gravel, R. A. (2001) J Biol Chem 276, 12310-12316
115
42. Lee, C. K., Cheong, C., and Y.H., J. (2010) FEBS lett 584, 675-680
43. Narang, M. A., Dumas, R., Ayer, L. M., and Gravel, R. A. (2004) Hum Mol Genet
13, 15-23
44. Bailey, L. M., Wallace, J. C., and Polyak, S. W. (2010) Arch Biochem Biophys
496, 45-52
45. Rodriguez-Melendez, R., Cano, S., Mendez, S. T., and Velazquez, A. (2001) J
Nutr 131, 1909-1913
46. Pacheco-Alvarez, D., Solorzano-Vargas, R. S., Gonzalez-Noriega, A., Michalak,
C., Zempleni, J., and Leon-Del-Rio, A. (2005) Mol Genet Metab 85, 301-307
47. Villen, J., Beausoleil, S. A., Gerber, S. A., and Gygi, S. P. (2007) Proc Natl Acad
Sci 104, 1488-1493
48. Dakashinamurti, K., and Cheah-Tan, C. (1968) Arch Biochem Biophys 127, 17-21
49. Beckett, D., Kovaleva, E., and Schatz, P. J. (1999) Protein Sci 8, 921-929
50. Chapman-Smith, A., Morris, T. W., Wallace, J. C., and Cronan, J. E. (1999) J
Biol Chem 247, 1449-1457
51. Reche, P., Fuller, C., Eichhorn, K., and Perham, N. (1998) Biochem J 329, 589-
596
52. Zhao, H., Naganathan, S., and Beckett, D. (2009) J Mol Biol 389, 336-348
53. Leon del Rio, A. (2005) J Nutr Biochem 16, 432-434
54. Pacheco-Alvarez, D., Solorzano-Vargas, R. S., and Leon del Rio, A. (2002) Arch
Med Res 33, 439-427
55. Dupuis, L., Campeau, E., Leclerc, D., and Gravel, R. A. (1999) Mol Genet Metab
66, 80-90
116
56. Dupuis, L., Leon-Del-Rio, A., Leclerc, D., Campeau, E., Sweetman, L.,
Saudubray, J. M., Herman, G., Gibson, K. M., and Gravel, R. A. (1996) Hum Mol
Genet 5, 1011-1016
57. Suzuki, Y., Aoki, Y., Ishida, Y., Chiba, Y., Iwamatsu, A., Kishino, T., Niikawa,
N., Matsubara, Y., and Narisawa, K. (1994) Nat Genet 8, 122-128
58. Suzuki, Y., Yang, X., Aoki, Y., Kure, S., and Matsubara, Y. (2005) Hum Mutat
26, 285-290
59. Pendini, N. R., Bailey, L. M., Booker, G. W., Wilce, M. C., Wallace, J. C., and
Polyak, S. W. (2008) Biochim Biophys Acta 1784, 973-982
60. Sherwood, W. G., Saunders, M., Robinson, B. H., Brewster, T., and Gravel, R. A.
(1982) J Pediatr 101, 546-550
61. Sweetman, L., Burri, B. J., and Nyhan, W. L. (1985) Ann N Y Acad Sci 447, 288-
296
62. Chauhan, J., and Dakshinamurti, K. (1991) J Biol Chem 266, 10035-10038
63. Abbott, J., and Beckett, D. (1993) Biochemistry 32, 9649-9656
64. Gill, S. C., and von Hippel, P. H. (1989) Anal Biochem 182, 319-326
65. Marblestone, J. G., Edavettal, S. C., Lim, Y., Lim, P., Zuo, X., and Butt, T. R.
(2006) Protein Sci 15, 182-189
66. Mossessova, E., and Lima, C. D. (2000) Mol Cell 5, 865-876
67. Healy, S., Heightman T. D., Hohmann, L., Schriemer, D., and Gravel, R. A.
(2009) Protein Sci 18, 314-328
68. Roark, D. E. (1976) Biophys Chem 5, 185-196
117
69. Johnson, M. L., Correia, J. J., Yphantis, D. A., and Halvorson, H. R. (1981)
Biophys J 36, 575-588
70. Eisenstein, E., and Beckett, D. (1999) Biochemistry 38, 13077-13084
71. Schagger, H., and von Jagow, G. (1987) Anal Biochem 166, 368-379
72. Leon del Rio, A., and Gravel, R. A. (1994) J Biol Chem 269, 22964-22968
73. Tissot, G., Pepin, R., Job, D., Douce, R., and Alban, C. (1998) Eur J Biochem
258, 586-596
74. Burri, B. J., Sweetman, L., and Nyhan, W. L. (1985) Am J Hum Genet 37, 326-
337
75. Burri, B. J., Sweetman, L., and Nyhan, W. L. (1981) J Clin Invest 68, 1491-1495
76. Sakamoto, O., Suzuki, Y., Li, X., Aoki, Y., Hiratsuka, M., Suormala, T.,
Baumgartner, E. R., Gibson, K. M., and Narisawa, K. (1999) Pediatr Res 46, 671-
676
77. Aoki, Y., Suzuki, Y., Li, X., Sakamoto, O., Chikaoka, H., Takita, S., and
Narisawa, K. (1997) Pediatr Res 42, 849-854
78. Johnson, K. A. (1998) Curr Opin Biotechnol 9, 87-89
79. Mock, D. M., deLorimer, A. A., Liebman, W. M., Sweetman, L., and Baker, H.
(1981) N Engl J Med 304, 820-823
80. Baker, H., Frank, O., Matovitch, V. B., Pasher, I., Aaronson, S., Hunter, S. H.,
and Sobotka, H. (1962) Anal Biochem 3, 31-39
81. Polyak, S. W., Chapman-Smith, A., Brautigan, P. J., and Wallace, J. C. (1999) J
Biol Chem 274, 32847-32854
82. Cronan, J. E. (1990) J Biol Chem 265, 10327-10323
118
83. Marini, P., Li, S. J., Gardiol, D., Cronan, J. E., and de Mendoza, D. (1995) J
Bacteriol 188, 7003-7006
84. Slavoff, S. A., Chen, I., Choi, Y., and Ting, A. Y. (2008) J Am Chem Soc 130,
1160-1162
85. Rice, P., Longden, I., and Bleasby, A. (2000) Trends Genet 16, 276-277
86. Bagautdinov, B., Kuroisgi, C., Sugahara, M., and Kunishima, N. (2005) J Mol
Biol 353, 322-333
87. Larkin, M. A., Blackshields, G., Brown, N. P., Chenna, R., McGettigan, P. A.,
McWilliam, H., Valentin, F., Wallace, I. M., Wilm, A., Lopez, R., Thompson, J.
D., Gibson, T. J., and Higgins, D. G. (2007) Bioinformatics 23, 2947-2948
88. Waterhouse, A. M., Procter, J. B., Martin, D. M. A., Clamp, M., and Barton, G. J.
(2009) Bioinformatics 25, 1189-1191
89. Brown, P. H., Cronan, J. E., Grotli, M., and Beckett, D. (2004) J Mol Biol 337,
857-869
90. Bagautdinov, B., Matsuura, Y., Bagautdinova, S., and Kunishima, N. (2007) Acta
Crystallogr Sect F Struct Biol Cryst Commun 63, 334-337
91. Gonzalez, J. M., Masuchi, Y., J.W., A., Maeder, D. L., Yanagibayashi, M.,
Tamaoka, J., and Kato, C. (1988) Extremophiles 2, 123-130
92. Weaver, L. H., Kwon, K., Beckett, D., and Matthews, B. W. (2001) Protein Sci
10, 2618-2622
93. Koren, R., and Hammes, G. G. (1976) Biochemistry 15, 1165-1171
94. Venezia, C. F., Meany, B. J., Braz, V. A., and Barkley, M. D. (2009)
Biochemistry 48, 9084-9093

119
95. Ingaramo, M., and Beckett, D. (2011) J Biol Chem 286, 13071-13078
96. Healy, S., Heightman T. D., Hohmann, L., Schriemer, D., and Gravel, R. A.,
McDonald, M. K., Wu, X., Yue, W. W., Kochan, G., Oppermann, U., and Gravel,
R. A. (2010) Biochemistry 49, 4687-4694
97. Taroni, F., and Rosenberg, L. E. (1991) J Biol Chem 266, 13267-13271
98. Xiang, S., and Tong, L. (2008) Nature Struct Mol Biol 15, 259-302
99. Chloupkova, M., Maclean, K. N., Alkhateeb, A., and Kraus, J. P. (2002) Hum
Mutat 19, 629-640
100. Chu, C. H., and Cheng, D. (2007) Protein Expr Purif 53, 421-427
101. Locke, G. A., Cheng, D., Witmer, M. R., Tamura, J. K., Haque, T., Carney, R. F.,
Rendina, A. R., and Marconkeviciene, J. (2008) Arch Biochem Biophys 475, 72-
79
102. Kim, K. W., Yamane, H., Zondlo, J., Busby, J., and Wang, M. (2007) Protein
Expr Purif 53, 16-23
103. Beckers, A., Organe, S., Timmermans, L., Scheys, K., Peeters, A., Brusselmans,
K., Verhoeven, G., and Swinnen, J. V. (2007) Cancer Res 67, 8180-8187