ABSTRACT DE OLIVEIRA, JEAN EDUARDO. Effects of In ovo
316
ABSTRACT DE OLIVEIRA, JEAN EDUARDO. Effects of In ovo Feeding on Turkey Embryos Development, Energy Status, Intestinal Maturation, Gene Expression and Post-hatch Development. (Under the direction of Peter R. Ferket.) Glycogen stored in liver and muscles are the main energy source during hatching of poultry. Turkey embryos are very sensitive to perturbations in energy metabolism because they have a wider hatching window than chicken embryos. Mortality of turkey embryos during late-term incubation is high relative to chickens, and many surviving hatchlings have compromised vitality. In ovo feeding (IOF) improves the energy status and gut development of perinatal poultry by supplementing the amnion with nutrients, which is then orally consumed by the embryo prior to hatch. A survey of amnion and embryonic development was done to determine the best time, maximum volume and solution characteristics for IOF. Several IOF formulations containing combinations of carbohydrates, proteins and enteric modulators were tested in turkey eggs, with emphasis on comparing hydrolyzed soy protein to egg white. IOF was found to improve energy status at hatch, but subsequent growth performance results were inconsistent. Therefore, further studies were designed to better understand late-term turkey embryo metabolism, using a customized focused oligonucleotide microarray. A gene expression survey using this array was performed on liver, pectoral muscle, hatching muscle, duodenum, and ileum of turkey embryos from 20 days of incubation until hatch. The embryos were found to switch from yolk fat to carbohydrate-based metabolism around 22 days of incubation, and potential substrates were identified to be tested in ovo. A nutritive solution containing metabolic co-factors was then formulated and tested in a subsequent IOF experiment. At hatch, poults treated with this latest IOF formulation exhibited better quality scores and
Transcript of ABSTRACT DE OLIVEIRA, JEAN EDUARDO. Effects of In ovo

ABSTRACT
DE OLIVEIRA, JEAN EDUARDO. Effects of In ovo Feeding on Turkey Embryos Development, Energy Status, Intestinal Maturation, Gene Expression and Post-hatch Development. (Under the direction of Peter R. Ferket.) Glycogen stored in liver and muscles are the main energy source during hatching of
poultry. Turkey embryos are very sensitive to perturbations in energy metabolism
because they have a wider hatching window than chicken embryos. Mortality of turkey
embryos during late-term incubation is high relative to chickens, and many surviving
hatchlings have compromised vitality. In ovo feeding (IOF) improves the energy status
and gut development of perinatal poultry by supplementing the amnion with nutrients,
which is then orally consumed by the embryo prior to hatch. A survey of amnion and
embryonic development was done to determine the best time, maximum volume and
solution characteristics for IOF. Several IOF formulations containing combinations of
carbohydrates, proteins and enteric modulators were tested in turkey eggs, with emphasis
on comparing hydrolyzed soy protein to egg white. IOF was found to improve energy
status at hatch, but subsequent growth performance results were inconsistent. Therefore,
further studies were designed to better understand late-term turkey embryo metabolism,
using a customized focused oligonucleotide microarray. A gene expression survey using
this array was performed on liver, pectoral muscle, hatching muscle, duodenum, and
ileum of turkey embryos from 20 days of incubation until hatch. The embryos were found
to switch from yolk fat to carbohydrate-based metabolism around 22 days of incubation,
and potential substrates were identified to be tested in ovo. A nutritive solution containing
metabolic co-factors was then formulated and tested in a subsequent IOF experiment. At
hatch, poults treated with this latest IOF formulation exhibited better quality scores and

more symmetric legs than controls. Gene expression patterns of liver, pectoral muscle,
hatching muscle, duodenum and ileum confirmed IOF favored skeletal development of
poults. This dissertation research clearly demonstrated that in ovo feeding technology can
enhance energy status and advance the development of hatchlings, resulting in superior
poult quality.
Effects of In ovo Feeding on Turkey Embryos Development, Energy Status, Intestinal Maturation, Gene Expression and Post-hatch Development
by JEAN EDUARDO DE OLIVEIRA
A dissertation submitted to the Graduate Faculty of North Carolina State University
in partial fulfillment of the requirements for the Degree
of Doctor of Philosophy
Nutrition
Raleigh, North Carolina
2007
APPROVED BY:
_________________________________ Dr. Christopher Matthew Ashwell
(Biotechnology Minor Representative)
_________________________________ Dr. Zehava Uni
_________________________________ Dr. Michael Wineland
________________________________ Dr. Peter R. Ferket
(Chair of Advisory Committee)

ii
Biography
Native of Sao Paulo, Brazil, I graduated in Animal Science from Universidade
Estadual Paulista (UNESP)-Jaboticabal, Brazil in December 1998. While in college I
always had an interest in poultry and research, keeping an internship at the poultry
nutrition lab from sophomore year until graduation. I was also selected in my sophomore
year to participate in a government sponsored program called Special Training Program
(PET) for students showing higher academic potential, where I was stimulated to develop
academic, leadership, and community skills. In 2002, I completed my Master of Science
Degree in Animal Science with emphasis in poultry nutrition at Universidade Federal de
Vicosa, Brazil. In the fall of 2003, I came to United States to start my doctoral studies in
Nutrition under the direction of Dr. Peter Ferket. I was stimulated to get a minor in
biotechnology to work towards integrating molecular biology to nutrition. During my
time as a student at NC State I served as Poultry Science Graduate Student
Representative at the University Graduate Students Association, Poultry Science
Graduate Student Association President, and Poultry Science Departmental Ambassador
for International Students, and president of the NC State Brazilian Students Association.

iii
Acknowledgements
I would like to express my gratitude to Dr. Peter Ferket, the Chairperson of my
Advisory Committee, for his guidance, attention, assistance and friendship during the
journey that resulted in this dissertation. I would like to thank the other members of my
committee, Dr. Chris Ashwell, Dr. Zehava Uni and Dr. Mike Wineland for their review,
and critical input of my dissertation.
I also would like to give a very special thanks to our Nutrition Laboratory
Manager Annette Israel for assisting me in carrying out the animal experiments, and also
to Shelly Nolin and Audrey O’nan, the Animal Genomic Laboratory assistants for their
patience during my molecular biology work. Very special thanks to Dr. Shelly Druyan
for her friendship, and for sharing with me the pains and glory of working with
microarrays. Thanks to Drs Anael and Fernanda Santos for being such great friends and
fellow students throughout these years. I must also thank my fellow graduate students and
post-docs for sharing this experience with me.
My deepest gratitude to my family for their support, encouragement and love, and
to my church family at Raleigh SDA Church, who helped me endure being so far from
home.
iv
Table of Contents
Page List of Tables……………………………………………………………………………. ix List of Figures…………………………………………………………………………… xii Chapter 1
Introduction and Literature Review…………………………………………………… 1 Poultry Production Overview……………………………………………. 1
Historic advances in poultry industry……………………………. 1 Poultry industry challenges……………………………………… 4
Starting turkey poults……………………………………. 5 Hatchery Holding Period………………………………………… 7
Egg storage time…………………………………………. 9 Egg size/breeder age……………………………………... 10 Hatch window…………………………………………… 11
Consequences of selection………………………………………………. 13 Poultry Embryo Development…………………………………………… 15
Embryonic use of egg nutrients………………………………….. 15 Egg composition…………………………………………. 15 Egg structure…………………………………………….. 16 Embryo development during incubation……………….... 17 Turkey poult peculiarities………………………………... 22
Late-term embryo tissue specificities……………………………. 23 Ways to improve Early Development…………………………………… 28 Assessing Poult Quality…………………………………………………. 30 Aiding Embryo Nutrition in Ovo………………………………………... 33
In ovo feeding concept…………………………………………... 33 In ovo feeding constraints……………………………………….. 38 Effects of in ovo feeding………………………………………… 39
Preliminary in ovo feeding research……………………... 39 Chicken in ovo feeding research………………………… 42 Turkey in ovo feeding research………………………….. 44
Important Metabolic Pathways Associated with Perinatal Nutrition……. 46 Glycolysis and gluconeogenesis…………………………………. 47 TCA Cycle……………………………………………………….. 49 Glycogenesis and glycogenolysis……………………………… 51 Pentose phosphate pathway……………………………………… 54 Fatty Acid synthesis and beta oxidation…………………………. 56 Metabolic pathways interaction…………………………………. 58 Hormonal control of poultry embryo metabolism……………….. 60
Studying Nutrition Through Gene Expression…………………………... 63 Era post chicken genome………………………………………… 63 Methods of measuring gene expression…………………………. 64 Microarray technology and its application in nutritional studies... 68
RNA extraction and quality control……………………... 69 Labeling…………………………………………………. 69
v
Array construction……………………………………….. 70 Hybridization…………………………………………….. 72 Scanning…………………………………………………. 72 Data procession and statistical analysis…………………. 73 Application in nutritional studies………………………... 78 Chicken arrays…………………………………………… 80
Dissertation Research Outline…………………………………………………………. 83 Preliminary research……………………………………………... 83 Phase 1: Evaluation of hydrolyzed soy as an IOF solution ingredient…………………………………………………………
85
Phase 2: Determining IOF volume and osmolality constraints….. 87 Phase 3: Late-term turkey embryo gene expression survey……... 87 Phase 4: Effect of in ovo feeding on turkey embryo gene expression – energy metabolism and intestinal development……
89
Conclusions……………………………………………………… 90 List of References…..…………………………………………………………………… 91 Chapter 2
Effect of carbohydrates, hydrolyzed soybean protein and methionine fed in ovo on turkey poult hatchability and energy status at hatch………………………….
105
Abstract…………………………………………………………………………………… 105 Introduction………………………………………………………………………………. 106 Material and Methods…………………………………………………………………… 107
Experiment 1…………………………………………………………….. 107 Experiment 2…………………………………………………………….. 108 Tissue Sampling and Glycogen Determination………………………….. 110 Feeding Behavior Test…………………………………………………... 110 Statistical Analysis………………………………………………………. 110
Results and Discussion………………………………………………………………….. 111 Experiment 1…………………………………………………………….. 111 Experiment 2…………………………………………………………….. 113
Conclusions………………………………………………………………………………. 115 References………………………………………………………………………………… 116
Chapter 3 Effect of in ovo feeding saline solutions with or without carbohydrate and protein on turkey poult hatchability, energy status and growth up to 14 days of age………………………………………………………………………………..
118
Abstract…………………………………………………………………………………… 118 Introduction………………………………………………………………………………. 119 Materials and Methods………………………………………………………………….. 120
Tissue Sampling and Glycogen Analysis………………………………... 121 Housing and Animal Care……………………………………………….. 121 Statistical Analysis………………………………………………………. 122
Results…………………………………………………………………………………….. 122 Discussion………………………………………………………………………………… 127 Conclusions……………………………………………………………………… 130 References……………………………………………………………………….. 131
vi
Chapter 4 Effect of in ovo feeding and incubation conditions on energy status and performance of turkey poults from 25 days of incubation to 14 days of age…….
133
Abstract……………………………………………………………………………………. 133 Introduction………………………………………………………………………………. 134 Material and Methods…………………………………………………………………… 136
Incubation and IOF………………………………………………………. 136 Animal Husbandry………………………………………………………. 137 Tissue Sampling and Glycogen Analysis………………………………... 138 Feeding Behavior Test…………………………………………………... 138 Statistical Analysis………………………………………………………. 139
Results…………………………………………………………………………………….. 140 Discussion………………………………………………………………………………… 146 Conclusion………………………………………………………………………………... 148 References………………………………………………………………………………… 149
Chapter 5 Effect of in ovo feeding on glycogen status of perinatal turkeys………………... 151 Abstract……………………………………………………………………………………. 151 Introduction………………………………………………………………………………. 152 Material and Methods…………………………………………………………………… 153
Tissue Sampling and Glycogen Analysis………………………………... 154 Housing and Animal Care……………………………………………….. 155 Statistics Analysis……………………………………………………….. 156
Results……………………………………………………………………………………… 156 Discussion…………………………………………………………………………………. 165 References…………………………………………………………………………………. 171
Chapter 6 Late-term turkey embryo survey of amnion fluid proprieties and its implication to in ovo feeding studies………………………………………………………….
173
Abstract……………………………………………………………………………………. 173 Introduction……………………………………………………………………………….. 174
The role of water during incubation of avian eggs………………………. 175 Amniotic fluid influence on hatch……………………………………….. 179
Turkey embryo and amnion survey…………………………………………………….. 182 Material and Methods……………………………………………………. 182
Statistical Analysis………………………….................................. 184 Results……………………………………………………………………. 184 Discussion………………………………………………………………... 189 Conclusion……………………………………………………………….. 195
References…………………………………………………………………………………. 196 Chapter 7
Survey of energy metabolism and intestinal development gene expression in late-term turkey embryos using microarrays……………………………………..
199
Abstract……………………………………………………………………………………. 199 Introduction……………………………………………………………………………….. 200 Materials and Methods………………………………………………………………….. 202
vii
Incubation and sampling…………………………………………………. 202 RNA extraction and quality control……………………………………… 203 Microarray manufacturing……………………………………………….. 204 Sample labeling…………………………………………………………... 206 Hybridizing and image scanning……………………………………….... 206 Array data procession and statistical analysis……………………………. 207
Embryonic growth and glycogen concentration statistical analysis……………………………………………………………
207
Results and Discussion…………………………………………………... 208 Embryonic development and energy status……………………… 208 Microarrays………………………………………………………. 217
Cluster analysis…………………………………………... 218 Liver……………………………………………… 228 Pectoral muscle…………………………………... 232 Hatching muscle…………………………………. 234 Duodenum………………………………………... 236
Conclusion………………………………………………………………………………… 238 References………………………………………………………………………………… 239
Chapter 8 Effects of in ovo feeding on late-term turkey embryo growth, intestinal morphology, poult quality, energy status, and their association to differences in gene expression observed by microarrays………………………………………..
242
Abstract……………………………………………………………………………………. 242 Introduction……………………………………………………………………………….. 243 Materials and Methods………………………………………………………………….. 246
Incubation and sampling…………………………………………………. 246 RNA extraction and quality control……………………………………… 247 Microarray manufacturing……………………………………………….. 248 Sample labeling…………………………………………………………... 251 Hybridization and image scanning………………………………………. 251 Data processing, normalization and statistical analysis………………….. 252
Differences in gene expression between IOF and control poults... 252 Embryonic growth, glycogen concentration and poults quality statistical analysis………………………………………………...
252
Results and Discussion………………………………………………………………….. 253 Glycogen Concentration…………………………………………………. 254 Poult quality…………………………………………………………….... 257 Array results……………………………………………………………… 259
Liver…………………………………………………………….... 259 Pectoral muscle…………………………………………………... 261 Hatching muscle…………………………………………………. 261 Duodenum……………………………………………………….. 262 Ileum……………………………………………………………... 263
Conclusion………………………………………………………………………………… 267 References…………………………………………………………………………………. 268
viii
Chapter 9 Conclusions…………………................................................................................ 272
Appendices….…………………………………………………………………………… 277 Appendix 1
The effect of various forms of administration of nutritive solutions on turkey performance……………………………………………………….
278
Appendix 2 The effect of osmolality and protein sources of nutrition solutions injected in ovo……………………………………………………………………
282
Appendix 3 Genes printed on NCSU_JArray_1………………………………………. 290
Appendix 4 Genes printed on NCSU_JSArray_2………………………...…………... 293 Chapter VIII in ovo feeding formula…………………………………….. 300
ix
List of Tables Page Table 1.1. Approximate composition of a 60g chicken egg…………………… 16 Table 1.2. Approximate composition of a 90g turkey egg…………………….. 16 Table 1.3. Summary of research papers mentioning in ovo administration of substances………………………………………………………………………..
34
Table 2.1. Effect of IOF treatment on hatchability and mortality rates of turkey embryos (Experiment 1)…………………………………………………………
112
Table 2.2. Effect of IOF treatment on body weights poults after hatch (Experiment 1)…………………………………………………………………..
112
Table 2.3. Effect of IOF treatment on yolk-free body mass and yolk sac size relative to total body weight of poults at hatch (Experiment 1)…………………
113
Table 2.4. Effect of IOF treatment on liver weights and liver glycogen concentration of poults at hatch (Experiment 1)………………………………...
113
Table 2.5. Effect of IOF treatment on hatchability and mortality rates of turkey embryos (Experiment 2)…………………………………………………………
114
Table 2.6. Effect of IOF treatment on body weights poults after hatch (Experiment 1)…………………………………………………………………..
115
Table 2.7. Effect of IOF treatment on yolk-free body mass and yolk sac size relative to total body weight of poults at hatch (Experiment 1)…………………
115
Table 2.8 – Behavioral activity expressed as time spent to consume pre-starter feed by day old turkey poults in-ovo fed with different nutritive solutions……..
115
Table 3.1 – Effects of in ovo feeding (IOF) and gender on body weight of turkey poults at hatch (experiments 1 and 2)……………………………………
124
Table 3.2 – Effect of in ovo feeding (IOF) treatment on weights and glycogen concentration of hatching muscle, breast muscle, and liver in poults at hatch (Experiments 1 and 2)…………………………………………………………...
125
Table 3.3 – In ovo feeding treatment and gender main effects on body weight of turkey poults at 7d of age (Experiment 1 and 2)……………………………...
125
Table 3.4 – In ovo feeding treatment and gender main effects on body weight of turkey poults at 14d of age (Experiment 1 and 2)…………………………….
126
Table 3.5 – Main effects of in ovo feeding treatment and gender on weight gain of turkey poults during1-7d, 7-14d and 1-14d of age (Experiments 1 and 2)………………………………………………………………………………...
126
Table 3.6 – Breast muscle weight at 7 days of age of male and female in ovo fed (IOF) turkeys of treatment 1………………………………………………...
127
Table 3.7 – Effects of in ovo feeding and sex on breast muscle weight of turkey poults at 14d of age on experiment 11, and at 7d and 14d of age in experiment 2……………………………………………………………………..
127
Table 4.1. Incubator temperature profiles in hatcheries 1 and 2……………….. 142 Table 4.2. Number of eggs external pipped, hatched poults, and dead embryos at hatch from turkey poults in ovo fed (IOF) saline or a carbohydrate-protein solution (CHP) and non-injected poults incubated in hatchery 1……………….
142
x
Table 4.3. Number of eggs external pipped, hatched poults, and dead embryos from day 25 of incubation (E) to day of hatch, from turkey poults in ovo fed (IOF) saline or a carbohydrate-protein solution (CHP) and non-injected poults incubated (hatchery 2)…………………………………………………………..
143
Table 4.4. Main effects of IOF treatment and hatchery on hatching muscle size and liver glycogen concentration at 25E………………………………………...
144
Table 4.5. Effect of in ovo feeding (IOF) treatment on liver weights of 25E embryos incubated in two different hatcheries………………………………….
145
Table 4.6. Main effects of IOF treatment and hatchery on hatching muscle weight and glycogen concentration, and yolk as percent of body weight at hatch……………………………………………………………………………..
145
Table 4.7. Effect of IOF treatment on pectoral muscle weight and glycogen concentration of poults incubated in hatcheries 1 and 2 at day of hatch………...
145
Table 4.8. Main effects of IOF treatment, hatchery, and gender on body weight (BW) and weight gain (WG) from hatch (0d) to 14 days of age (14d)…………
146
Table 4.9. Effect of IOF treatment on the growth performance of male and female turkey poults from hatch to 14 days of age……………………………...
146
Table 5.1. Effect of in ovo feeding (IOF) treatment on percentage of internal pipping of eggs sampled at 25 days of incubation………………………………
158
Table 5.2. Effect of in ovo feeding (IOF) treatment on hatchability of fertile eggs……………………………………………………………………………...
158
Table 5.3. Effect of in ovo feeding (IOF) treatment on body weight and weight gain of poults at 7 and 14 days post-hatch………………………………………
158
Table 5.4. Effect of gender on body weight and weight gain of turkey poults at 7 and 14 dayspost-hatch…………………………………………………………
159
Table 6.1. Average volume, pH and osmolality of the amniotic fluid from Hybryd turkey egg from 21 to 24 days of incubation (Uni and Ferket, 2003)….
181
Table 6.2. Effect of embryonic stage of development of BUT turkeys on embryo weight, amnion flid volume, and amnion fluid osmolality……………..
186
Table 6.3. Effect of embryonic stage of development of NIC turkeys on embryo weight, yolk sac weight, and allantoic fluid volume…………………...
187
Table 6.4. Effect of embryonic stage of development of NIC turkeys on amniotic fluid volume, amniotic fluid osmolality and embryonic osmolality…..
187
Table 6.5. Effect of embryonic stage of development of HYB turkeys on embryo weight and amnion fluid volume……………………………………….
188
Table 8.1. Genes that were significantly affected1 by in ovo feeding (IOF) in different turkey embryo tissues analyzed by microarray………………………..
266
Table 9.1. Summary of research trials reported in chapters 2, 3, 4 and 5……… 275 Table A1.1. Hatchability, piped eggs and dead eggs…………………………... 279 Table A1.2. Body weight of turkey pouts at day of hatch……………………… 279 Table A1.3. Body weight of turkey pouts at day of hatch, by gender………….. 279 Table A1.4 – Pectoral muscle, liver and yolk of turkeys at day of hatch………. 279 Table A1.5. Body weight of turkey poults from 3 to 42 days of age…………... 280 Table A1.6. Body weight of turkeys placed at day of hatch and 24 hours later... 280 Table A2.1. Osmolality of Injected Solutions………………………………….. 283
xi
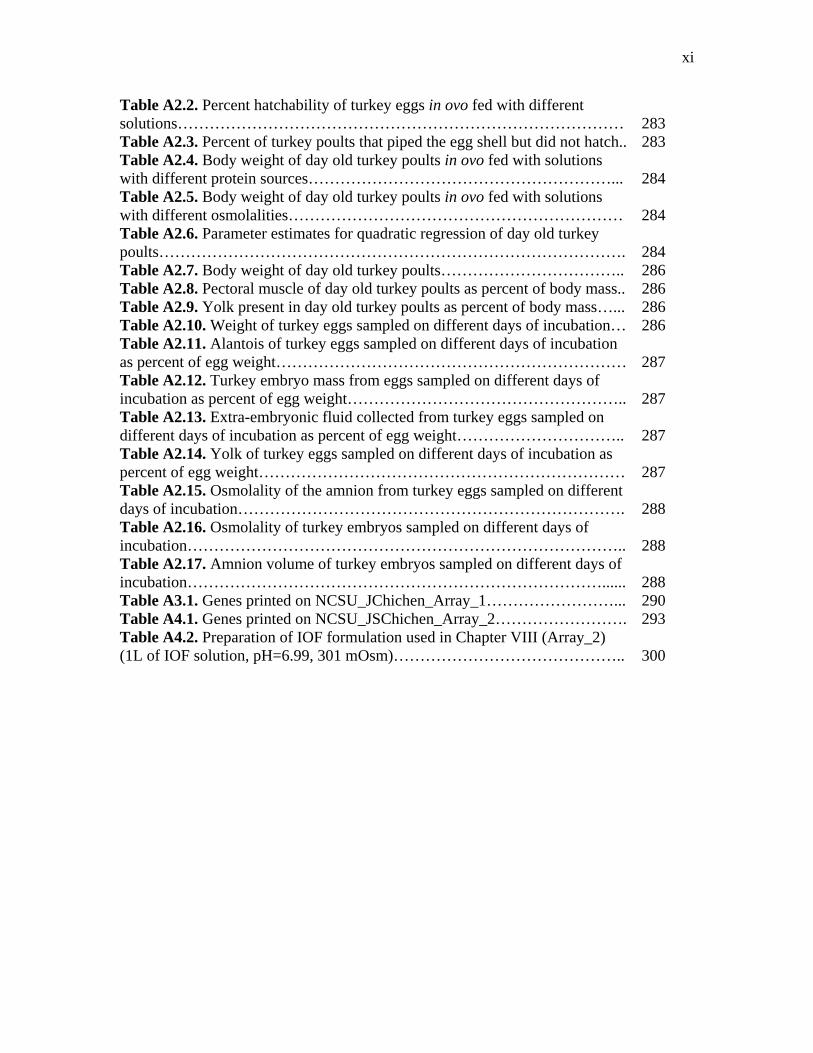
Table A2.2. Percent hatchability of turkey eggs in ovo fed with different solutions…………………………………………………………………………
283
Table A2.3. Percent of turkey poults that piped the egg shell but did not hatch.. 283 Table A2.4. Body weight of day old turkey poults in ovo fed with solutions with different protein sources…………………………………………………...
284
Table A2.5. Body weight of day old turkey poults in ovo fed with solutions with different osmolalities………………………………………………………
284
Table A2.6. Parameter estimates for quadratic regression of day old turkey poults…………………………………………………………………………….
284
Table A2.7. Body weight of day old turkey poults…………………………….. 286 Table A2.8. Pectoral muscle of day old turkey poults as percent of body mass.. 286 Table A2.9. Yolk present in day old turkey poults as percent of body mass…... 286 Table A2.10. Weight of turkey eggs sampled on different days of incubation… 286 Table A2.11. Alantois of turkey eggs sampled on different days of incubation as percent of egg weight…………………………………………………………
287
Table A2.12. Turkey embryo mass from eggs sampled on different days of incubation as percent of egg weight……………………………………………..
287
Table A2.13. Extra-embryonic fluid collected from turkey eggs sampled on different days of incubation as percent of egg weight…………………………..
287
Table A2.14. Yolk of turkey eggs sampled on different days of incubation as percent of egg weight……………………………………………………………
287
Table A2.15. Osmolality of the amnion from turkey eggs sampled on different days of incubation……………………………………………………………….
288
Table A2.16. Osmolality of turkey embryos sampled on different days of incubation………………………………………………………………………..
288
Table A2.17. Amnion volume of turkey embryos sampled on different days of incubation……………………………………………………………………......
288
Table A3.1. Genes printed on NCSU_JChichen_Array_1……………………... 290 Table A4.1. Genes printed on NCSU_JSChichen_Array_2……………………. 293 Table A4.2. Preparation of IOF formulation used in Chapter VIII (Array_2) (1L of IOF solution, pH=6.99, 301 mOsm)……………………………………..
300

xii
List of Figures
Page Figure 1.1. Structure of the hen’s egg shown by a section through the long axis 17 Figure 1.2. Schematic representation egg compartmentalization during incubation………………………………………………………………………..
19
Figure 1.3. Schematic representation on in ovo injection…… ………………... 37 Figure 1.4. Glycolysis (red) and gluconeogenesis (blue) pathways and enzymes………………………………………………………………………….
48
Figure 1.5. The Cori cycle……………………………………………………... 49 Figure 1.6. The TCA cycle showing enzymes, substrates and products………. 51 Figure 1.7. Pathway of glycogen synthesis (glycogenesis)……………………. 53 Figure 1.8. Glycogenolysis and the fate of glycogen in the liver……………… 53 Figure 1.9. Glycogenolysis and the fate of glycogen in muscle………………. 54 Figure 1.10. Pentose phosphate pathway intermediaries and enzymes………... 55 Figure 1.11. Malonyl-CoA synthesis from acetyl-CoA and bicarbonate……… 56 Figure 1.12. Formation of the first bond on fatty acid synthesis……………… 57 Figure 1.13. Fatty acid elongation pathway…………………………………… 57 Figure 1.14. Fatty acid beta oxidation…………………………………………. 58 Figure 1.15. Graphic representation of metabolic major pathways and how they relate to each other…………………………………………………………
59
Figure 1.16. Common array experimental designs……………………………. 78 Figure 2.1. Influence of % hydrolyzed soy protein dissolved in 0.4% saline solution on osmolality (mOsm)………………………………………………….
109
Figure 4.1. Feed intake of control and in ovo fed (IOF) turkey poults [saline or carbohydrate-protein solution (CHP)] during the first four hours after placement………………………………………………………………………..
144
Figure 5.1. Effect of in ovo feeding treatment at 23 days of incubation on hatching muscle weight of turkey embryos at 25 days of incubation…………...
159
Figure 5.2. Effect of in ovo feeding treatment at 23 days of incubation on hatching muscle glycogen concentration of turkey embryos at 25 days of incubation………………………………………………………………………..
160
Figure 5.3. Effect of in ovo feeding treatment at 23 days of incubation on liver glycogen concentration of turkey embryos at 25 days of incubation……………
161
Figure 5.4. Effect o in ovo feeding treatment at 23 days of incubation on body weight turkey poults at hatch……………………………………………………
162
Figure 5.5. Effect of in ovo feeding treatment at 23 days of incubation on hatching muscle glycogen concentration of -fed turkey poults at hatch………...
163
Figure 5.6. Effect of in ovo feeding treatment at 23 days of incubation on liver glycogen concentration of turkey poults at hatch……………………………….
164
Figure 5.7. Effect of in ovo feeding treatment at 23 days of incubation on pectoral muscle glycogen concentration of turkey poults at hatch……………...
165
Figure 6.1. Changes in volume of amniotic fluid of avian species…………….. 177 Figure 6.2. Effect of embryonic stage (age) of development of turkeys from different strains on amnion fluid volume relative to total egg mass (mL amniotic fluid/g egg mass)………………………………………………………
195
xiii
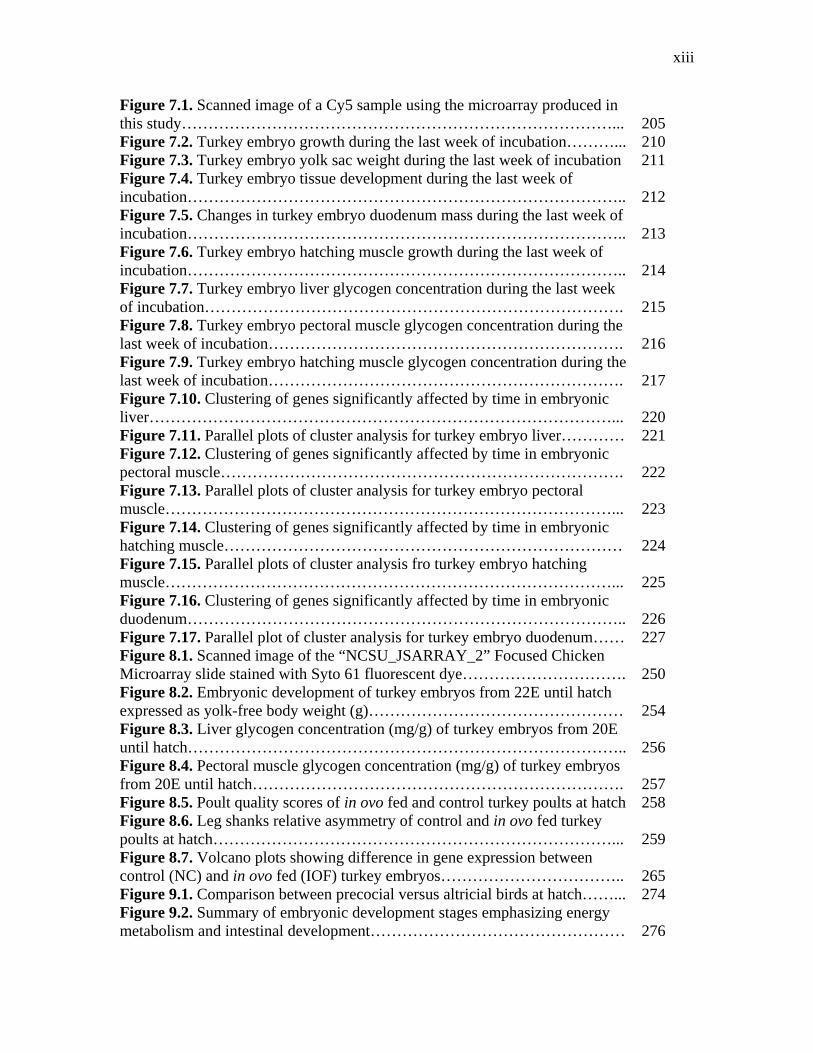
Figure 7.1. Scanned image of a Cy5 sample using the microarray produced in this study………………………………………………………………………...
205
Figure 7.2. Turkey embryo growth during the last week of incubation………... 210 Figure 7.3. Turkey embryo yolk sac weight during the last week of incubation 211 Figure 7.4. Turkey embryo tissue development during the last week of incubation………………………………………………………………………..
212
Figure 7.5. Changes in turkey embryo duodenum mass during the last week of incubation………………………………………………………………………..
213
Figure 7.6. Turkey embryo hatching muscle growth during the last week of incubation………………………………………………………………………..
214
Figure 7.7. Turkey embryo liver glycogen concentration during the last week of incubation…………………………………………………………………….
215
Figure 7.8. Turkey embryo pectoral muscle glycogen concentration during the last week of incubation………………………………………………………….
216
Figure 7.9. Turkey embryo hatching muscle glycogen concentration during the last week of incubation………………………………………………………….
217
Figure 7.10. Clustering of genes significantly affected by time in embryonic liver……………………………………………………………………………...
220
Figure 7.11. Parallel plots of cluster analysis for turkey embryo liver………… 221 Figure 7.12. Clustering of genes significantly affected by time in embryonic pectoral muscle………………………………………………………………….
222
Figure 7.13. Parallel plots of cluster analysis for turkey embryo pectoral muscle…………………………………………………………………………...
223
Figure 7.14. Clustering of genes significantly affected by time in embryonic hatching muscle…………………………………………………………………
224
Figure 7.15. Parallel plots of cluster analysis fro turkey embryo hatching muscle…………………………………………………………………………...
225
Figure 7.16. Clustering of genes significantly affected by time in embryonic duodenum………………………………………………………………………..
226
Figure 7.17. Parallel plot of cluster analysis for turkey embryo duodenum…… 227 Figure 8.1. Scanned image of the “NCSU_JSARRAY_2” Focused Chicken Microarray slide stained with Syto 61 fluorescent dye………………………….
250
Figure 8.2. Embryonic development of turkey embryos from 22E until hatch expressed as yolk-free body weight (g)…………………………………………
254
Figure 8.3. Liver glycogen concentration (mg/g) of turkey embryos from 20E until hatch………………………………………………………………………..
256
Figure 8.4. Pectoral muscle glycogen concentration (mg/g) of turkey embryos from 20E until hatch…………………………………………………………….
257
Figure 8.5. Poult quality scores of in ovo fed and control turkey poults at hatch 258 Figure 8.6. Leg shanks relative asymmetry of control and in ovo fed turkey poults at hatch…………………………………………………………………...
259
Figure 8.7. Volcano plots showing difference in gene expression between control (NC) and in ovo fed (IOF) turkey embryos……………………………..
265
Figure 9.1. Comparison between precocial versus altricial birds at hatch……... 274 Figure 9.2. Summary of embryonic development stages emphasizing energy metabolism and intestinal development…………………………………………
276

xiv
Figure A2.1. Regression analysis of body weight by osmolality of in ovo feeding solution………………………………………………………………….
285
1
Chapter 1
Introduction and Literature Review
Poultry Production Overview
Historic advances in poultry industry
Poultry meat and eggs are high-quality protein, and during the last 50 years they
have become among the most affordable food staple for people throughout the world. As
technological development advanced during the twentieth century, the world’s population
became more urbanized (Lobo, 2006) and dependent upon concentrated large-scale food
production that can be easily and efficiently transported to metropolitan areas. The
poultry industry led this transformation from subsistence agriculture to integrated
production to feed this growing urbanized society, elevating the consumption of poultry
products ahead of other animal products as the least expensive and most popular animal
protein source (Hammerstedt, 1999).
Modern chickens were domesticated from the Red Jungle Fowl (Gallus gallus)
over the last four or five thousand years for eggs and meat, for game and for exhibition
(Winter and Funk, 1960; Roberts, 1998; Klasing, 2005). Chickens were imported to the
new world from Europe and Asia during the 1800’s, where they were raised for eggs and
meat in the backyards of most homes. Indeed, the most profitable part of the poultry
business until the early 1920’s was for competitive exhibitions rather than for food
(Winter and Funk, 1960; Hanke et al., 1972). But then the profit on poultry production
shifted from the exhibitions fancy feather breeds to the egg and meat production poultry

2
(Winter and Funk, 1960; Hanke et al., 1972). Emphasis on poultry meat and egg
production accelerated after Herbert Hoover’s 1928 presidential campaign promise of “A
chicken in every pot…and a car in every garage.” The outcome was so successful that
since 1992 poultry meat has been the most-consumed meat in the US, surpassing beef
and pork, based in the retail weight series (Smith, 2006b).
Modern turkeys are native to North America and were domesticated from
Meleagris gallopavo by the Aztec Indians in what is now Mexico as far back as AD1000
(Roberts, 2002, Klasing, 2005). Early European explorers brought turkeys back to their
noble underwriters who further selected them for show and feasts. Commercial rearing
became important in early 19th century, after domesticated turkeys were brought back
from Europe and backcrossed with wild turkeys (Hanke et al., 1972; Roberts, 2002;
Klasing, 2005).
The growth of the poultry industry during the last 7 decades has been
phenomenal. In 1939, 660.5 million chickens and 27.9 million turkeys were raised in the
United States (Winter and Funk, 1960). In 2006, 10.9 billion broiler chickens (20 billion
kg) and 261.9 million turkeys (3.3 billion kg) were produced (USDA National
Agriculture Statistics Service, 2007). The average consumption of chicken in the US
today is 36.3 kg per capita (Lefens, 2007), and per capita consumption of turkey is
growing faster then chicken during the last five years (Smith, 2007a). Worldwide 67.6
billion kg of chicken meat is produced every year (van der Sluis, 2005), and the biggest
poultry meat exporter is Brazil with 2.85 million metric tons in 2006, followed by the US
with 2.34 million metric tons (Shane, 2007). Considering such high poultry production in
3
the USA and throughout the world, any small percentage change in poultry production
has an economic impact worth millions of dollars to the poultry and associated industries.
There are several reasons for the success of the poultry industry and the
phenomenal growth in consumer demand for its products, including rapid application of
scientific discoveries, specialization into integrated production systems, and free
acceptance in world market.
Since its’ beginning, the poultry industry has being strongly dependent on
research (Smith, 2006b). Large scale production was only possible after the discovery of
vitamins, improvement of artificial incubation, introduction of disease test kits,
vaccination, and breeder genetic selection application (Winter and Funk, 1960; Hanke et
al., 1972; Morris, 1980). This continuous industry progress is based on the application of
scientifically-proven technologies that help poultry growers improve production yield,
bird health and nutrition, housing, genetics and reproduction, food quality, safety, and
efficiency (Smith, 2006b). The best example of dramatic advances can be seen in animal
performance, especially improvements in body weights at market. A typical 1957 chicken
strain reached 539 g of body weight at 42 days of age, while a 2001 commercial broiler
chicken strain reached 2,672 g at the same 42 days of age, which constitutes remarkable
progress (Havenstein et al., 2003). The production characteristics of turkeys have also
improved significantly during the last 4 decades. Modern 2003 strains were observed to
weigh approximately twice the weight of the 1966 turkey strain from 112 to 196 days of
age (Havenstein et al., 2007). This improvement in growth performance and meat yield
was driven by costumer preference for white breast meat products, and the industry’s
focus on greater meat yields per unit of input costs. The average market weight of
4
broilers slaughtered in the US reached a record high of 2.54 kg in 2006 (Smith, 2006a).
Today, most of the broiler and turkey carcasses are deboned and further processed and
the amount of poultry meat produced are sustained by heavier birds, even when the
number of birds decreases (Smith, 2006a). Such accomplishment could only be reached
by constant research and innovation to overcome challenges, and there is still more room
for improvement.
Another reason why the poultry industry has grown so much is attributed to
having a refined and specialized segmentation. A few breeding companies provide elite
genetic stock, while production companies grow out hybrid crosses to produce the final
product (Hammerstedt, 1999). The grower receives a technology package and mainly
concentrates on managing the birds, while genetic companies concentrate in producing a
more efficient bird every generation.
Finally, the phenomenal growth of the poultry industry would not have occurred
if not for few social and trade barriers. There are no barriers against poultry meat, like
religious or cultural impediments that exist to other meats. This allied to attractive prices,
led exports to boom world wide, providing to the industry an even greater incentive for
growth. In conclusion, poultry is the perfect animal product to feed a globalized world.
Poultry Industry challenges
The challenges that the poultry industry faces are the opportunities for research
and development. According to Smith, (2006b), the poultry industry must commit and
coordinate with research to remain as the leading food animal sector. A global
commitment to solving the poultry industry challenges is necessary because multinational
poultry production companies now produce a significant share of the worldwide trade
5
poultry products. The main issues forecasted by specialists are disease pandemic, feed
stuff contamination, environmental impact, shortage of carbohydrate sources, metabolic
diseases, and increasing production costs (Shelton, 2006; Smith, 2006b).
To reduce production costs, it is important to improve early growth performance
characteristics in poultry. As demands for decreasing market weight for age continue, it
will become more important to improve growth and development during the brooding
phase (Hulet, 2007). This is especially important to the turkey industry, where fertile eggs
and day old poults cost more than they do in the chicken industry (Schaal and Cherian,
2007). Genetic selection has created a more efficient bird, driving costs down
(Hammerstedt, 1999), but that would negated if poults do not survive the first week of
life. Therefore, early survival of is a major concern for high-yield poultry strains,
particularly to the turkey industry.
Starting turkey poults
Turkey industry’s main challenges are to improve poult yield and quality from
hatcheries, reduce mortality and stunted growth during brooding, and have a more
uniform bird at market age independent of the season. Management-related problems
during brooding and growing account for over 6% of flock mortality, and for 10 to 30%
depression in growth relative to the genetic potential. Weak poults suffer from metabolic
disorders related to the transition from egg to the precocial poult (Noble et al., 1999;
Christensen et al., 2003c; Christensen et al., 2007).
Hammerstedt, (1999) pointed out that production effectiveness starts with
reproduction, including hatchability and post hatch survival. Because market weight for
age has decreased during the last 4 decades without change in the duration of incubation,

6
the incubation period has increased to represent 30 to 40% of the productive life of meat
poultry (Hulet, 2007). Therefore, the incubation and brooding periods has gained more
relative importance to a successful rearing of meat poultry than ever before, and this
trend is expected to continue as increases in post-hatch growth rate are achieved.
Early mortality and stunted growth is not only costly to the turkey industry, but it
negatively impacts animal welfare concerns. Two common conditions have been reported
as responsible for these losses, starve-outs and flip-over poults. Poults that do not develop
and eventually die during the first 5 days post-hatch are commonly called “starve-outs”
(Christensen et al., 2003c). ”Starve-out” poults typically have exhausted their
carbohydrate reserves, which adversely affects their ability to thermoregulate and use
their yolk reserves (Donaldson, 1995). This inability to utilize yolk reserves to support
tissue growth and development consequently increases the incidence of unabsorbed yolk
sacs observed at carcass processing of surviving birds (Buhr et al., 2006). Thus, high
mortality is usually seen 5-7 days post hatch, and the ones that survive never recover
(Horrox, 2003), causing increased size variation at slaughter that adversely affects the
uniformity of meat cuts (Horrox, 2006b).
Poor poult quality at hatch can also be exhibited by an increased incidence of
poults that flip on their back, paddle their feet, and cannot get back on their feet without
assistance. If these “flip-over” poults are put back on their feet, they cannot regain
balance, they are weak, and they vocalize loudly, indicating loss of neurological control,
distress, and lethargy (Noble et al., 1999). The same authors reported high mortality rates
among flip-overs (37.8% of the flock) during the 2 days post-hatch. Christensen et al.,
(2003c) observed that these flip-over poults have smaller hearts and lower plasma
7
concentration of thyroid hormones than normal poults. Moreover, the incidence of flip-
overs poults is higher among poults that have delayed hatch from small eggs (Noble et
al., 1999).
Christensen et al., (2007) proposed a solution to avoid starve-outs, flip-overs and
improve early development and uniformity in turkey poults by feeding them readily
available carbohydrates as soon as possible after hatching. Early access to feed, as it will
be discussed later, improves post-hatch survival and growth (Uni and Ferket, 2004) by
improving gut development, digestion and absorption capacity, thereby overcoming some
of the challenges faced by the neonatal poult during the first week post hatch. For the
neonatal poult to initiate feeding and early growth, an appetite and a functional digestive
system is necessary (Christensen et al., 2007).
Hatchery Holding Period
It is common practice in the poultry industry to hold poults without feed and
water for many hours after hatch. Poults may remain for up to 36 hours after hatching
before they are pulled from the hatching cabinet, and then it may take an additional 72
hours before they are be serviced and transported to brooder farms where they finally
have access to feed and water. Poult servicing includes sexing, toe trimming, snood
removal, beak trimming, and injection of antibiotics (Donaldson and Christensen, 1991,
Donaldson et al., 1991). After enduring this stress of servicing poults are often held in
transportation boxes stacked in a dim room for up to 24 hours so they can recover and
endure the stress of transport and placement. Donaldson et al., (1991) confirmed that
poults recuperate liver glycogen concentration to levels prior to servicing when held for
24 hours, however this glycogen status recover occurs at the expense of catabolizing their
8
own protein reserves (Donaldson, 1995; Keirs et al., 2002) since they have no access to
feed or water during this time.
Several studies were performed to evaluate the impact of this early fasting period
on poult development, comparing hatchlings that were held for 24 hours with those given
ad libitum access to feed and water immediately after they were removed from the
hatcher. Careghi et al., (2005) observed that broiler chicks fed immediately after hatch
showed higher weight gain later in life as compared to the held chicks, and that late
hatchers benefit more from early access to feed. Uni et al., (1998) demonstrated that early
fasting clearly delays gut maturation, affecting the development of mucosal morphology
and intestinal enzyme activity. Fed poults and chicks also have more goblet cells per
villus, and more proliferating enterocytes, in contrast to more apoptotic cells in fasted
birds (Uni et al., 1998; Potturi et al., 2005; Smirnov et al., 2006). According to (Potturi et
al., 2005), poults fed immediately after hatch had 5.0µm longer and 6.8µm wider
intestinal villi, and 5.6µm deeper villi crypts than fasted-held poults. These fasted poults
also had more aerobic bacteria in their small intestine (Potturi et al., 2005). Feed
restriction early in life also programmed birds for obesity later in life (Zhan et al., 2007)
by permanently altering energy related enzyme production and function. Velleman and
Mozdziak, (2005) found reduced muscle growth among chicks that experienced a 72 hour
of fasting after hatch. Because of the literature sited above, there is great interest in ways
to aid poult nutrition before placement, as Careghi et al., (2005) suggested to provide an
energy source in the hatch basked and during transport.

9
There are several other management practices and conditions that can accentuate
the adverse effects of a long post-hatch holding period, including egg storage period, egg
size, and hatch window.
Egg storage time
The adverse effects of post-hatch holding time on poult vigor can be accentuated
by long pre-incubation egg storing time. Careghi et al., (2005) reported that extended egg
storage time (over 7 days) and hatchery holding time negatively affect poult early growth.
Eggs stored for over a week causes increased number of embryonic abnormalities,
mortality, slower embryonic metabolism, and delays or prolongs the internal pipping
stage (Decuypere and Bruggeman, 2007).
By the time of oviposition, the chicken embryo has already developed inside the
hen for 18 to 21 hours, having about 40,000 to 60,000 cells (Fasenko, 2007). Turkey
embryos are at less mature stages of development than chickens at time of lay (Gupta and
Bakst, 1993, Fasenko, 2007). Fertile eggs will continue development if adequate
incubation conditions are provided. Edwards determined that chicken embryos do not
develop but still survive if stored at 21oC (Edwards, 1902). The temperature below which
embryonic development does not occur is termed physiological zero, but the preferred
term is embryonic diapause (Fasenko, 2007). Bakst and Gupta, (1997) found that the
turkey embryo physiological zero is lower than chickens, at 15oC. Even though the
embryo is not growing during storage, the young embryo, who depends on glucose to
survive, is still consuming the limited amount of available glucose. Embryos from eggs
stored for 14 days are not behind in development, but their metabolism is slower
throughout incubation (Fasenko, 2007). This includes lower concentration of plasma
10
hormones, and reduced efficiency in maintaining glycogen reserves in muscle and heart
(Christensen et al., 2001b; Fasenko, 2007). As a consequence, the energy stores of such
embryos are smaller, contributing to even lower energy status at hatch. Mather and
Laughlin, (1977) observed that embryos from eggs stored for more than seven days may
take up to 12 hours to resume development when set at the incubator. This observation
was later confirmed with turkeys by Fasenko, (2007).
Egg size/breeder age
Breeder hen age and egg size are two other factors that can aggravate holding
time. These two factors are often associated since older hens lay bigger eggs (Decuypere
and Bruggeman, 2007). The first egg laid of each clutch is also bigger than subsequent
eggs (Zakaria et al., 2005). Embryos from hens at the end of the lay cycle hatch earlier,
and thus, these hatchlings stay longer in the incubator, depleting their energy stores
(Joseph and Moran, 2005b). Eggs from older hens also have higher egg conductance due
to larger eggshell pores, losing more weight during incubation, and stimulating embryos
to hatch earlier (Christensen et al., 1996; Funderbunk et al., 2005). Eggs that loose weight
at an accelerated rate during incubation yield embryos and hatchlings that are more
dependent on gluconeogenesis and are more adversely affected by nutrient deprivation
and poor brooding conditions (Peebles et al., 2005).
As the embryo growths tissues demanding oxygen are formed, but oxygen supply
is fixed. At a certain point a plateau in oxygen consumption is reached. This plateau stage
is essential for maturation of several processes in embryo development. Christensen et
al., (1996) showed that because eggs from older hens have higher shell conductance their
embryos reach the plateau stage later. Whether cause or consequence, these embryos
11
grow muscle more efficiently. Because muscle requires more oxygen, embryos from
older hens have less liver glycogen available for hatching and post-hatch survival.
Breeder hen age also affect circulating thyroid hormone levels of embryos, T4, which
stimulates growth, was higher in embryos from older hen, whereas T3, which promotes
glycogen metabolism, was higher in embryos from younger hens. This hen age effect on
thyroid function in embryos may be a direct consequence of the nutrients available in the
egg. The hen deposits more yolk at expense of egg white as she ages. Because yolk lipids
supply energy for growth and carbohydrate plays a major role at hatching, a hatching egg
with more yolk and less albumen yields heavier poults that do not always survive the
rigors of hatching until feed intake initiates (Christensen et al., 1996). Consequently,
hatchability declines as hens get older (Nestor et al., 1972). Research is needed to
alleviate the adverse effect of age and egg size by helping these troubled embryos to
accumulate and utilize glycogen to fuel hatch.
Hatch window
Hatch window is defined as the time it takes from the first embryo hatched to the
time the hatch is pulled. A broad hatch window may exceed a duration of 36 to 48 hours,
which further delays the access to feed in addition to the 24 hours or more required for
poult servicing, holding, and transport to the brooder farm (Careghi et al., 2005). The
optimum time to pull the poults from the hatcher is often difficult to determine among
hatches with a wide hatch window because embryos do not hatch all at the same time. If
the poults are pulled from the hatcher too soon, many late-hatched poults are
unnecessarily disposed; but if the poults are pulled too late, many early-hatched poults
will be dehydrated and depleted of their energy reserves, thus compromising performance
12
and final weight (Bamelis et al., 2005; Careghi et al., 2005). In contrast, determining the
optimum hatch pull time is much easier for hatching with a narrow hatch window, and
there are fewer poult quality problems (Careghi et al., 2005; Joseph and Moran, 2005b).
Depending on incubation conditions the hatch window of time can be 24 to 36 hours, or
more.
Hatch window duration may be affected by several factors, including breeder age,
incubation temperature, egg storage time, and location in the incubator Wyatt, et al.,
(1985) reported that broiler chicks from older hens began hatching 6 hours sooner than
chicks from younger flocks. In a similar experiment, Joseph and Moran, (2005b) reported
that early hatches stayed in the hatcher up to 32 hours post-emergence, while late hatches
were held up to 6 hours. Eggs incubated in higher temperatures hatch earlier (Christensen
et al., 2001a; Christensen et al., 2003a; Christensen et al., 2003b; Hulet et al., 2007).
Position in the incubator affects egg temperature because of differences in air flow. Egg
shell temperature may be higher than incubator temperature, especially after mid
incubation when the embryo is producing heat, thus subjecting the embryos to heat stress
(Hulet et al., 2007). We have already discussed the effects of egg storage time on length
of incubation, an extended hatch window is expected if eggs are stored for different
amounts of time and then are set together.
In summary, there are many factors that may delay the initiation of feeding, and it
is a challenge to manage all these factors to reduce their impact on hatchability, viability
and performance. New technologies are welcome and necessary to address these
problems, but their implementation will not be easy. Some hatchery management experts
are suggesting a revolutionary way to hatch and handle chicks and poults to minimize the
13
delay to feed intake initiation. The eggs are transferred to special units were they hatch
with feed and water available, and where they stay for a couple of days before being
shipped out. This results in chicks and poults equivalently one day ahead in development
compared to standard industry practice (Horrox, 2006a), but this new hatchery
technology would require heavy investments in new equipment by hatcheries.
Consequences of Selection
Great advances in poultry breeding and genetic selection for valuable production
traits have been achieved during the last 50 years. Many have predicted that the genetic
limit for growth was reached and slower progress will be seen from then on (Shelton,
2006), but we still see advances every year. The formula for success depends on two
main branches of research, genetics and nutrition. The first creates a bird with higher
potential, and the second has to find a way to help that bird to achieve as much of that
potential as possible.
Constant selection for performance, especially heavier weights, has its
consequences. One big setback is that selection for higher post-hatch growth is negatively
correlated with embryo survival (Nestor and Noble, 1995; Christensen et al., 2000).
Collin et al., (2007) pointed out that selection for breast meat yield leads to poor visceral
system. This phenomenon was explained by Foye (2005), who said that selection for
growth is pushing precocial poultry to become more altricial by directing resources to
growth stead of viscera maturation.
One of the consequences of the reduction of visceral capacity relative to body size
among modern broilers selected for rapid growth is exemplified by the increasing
incidence of ascites. Ascites have been liked to limited cardiopulmonary capacity of the
14
animal to attend body demands. One of the strategies to reduce the incidence of ascites is
to slow down early growth by feed restriction; but if it is too severe, the restriction may
not be compensated later in life, resulting in lower weights and yields at processing
(Ozkan et al., 2006). Selection for weight gain also increases risk of obesity, lower
fertility, and lower hatchability (Joseph and Moran, 2005a).
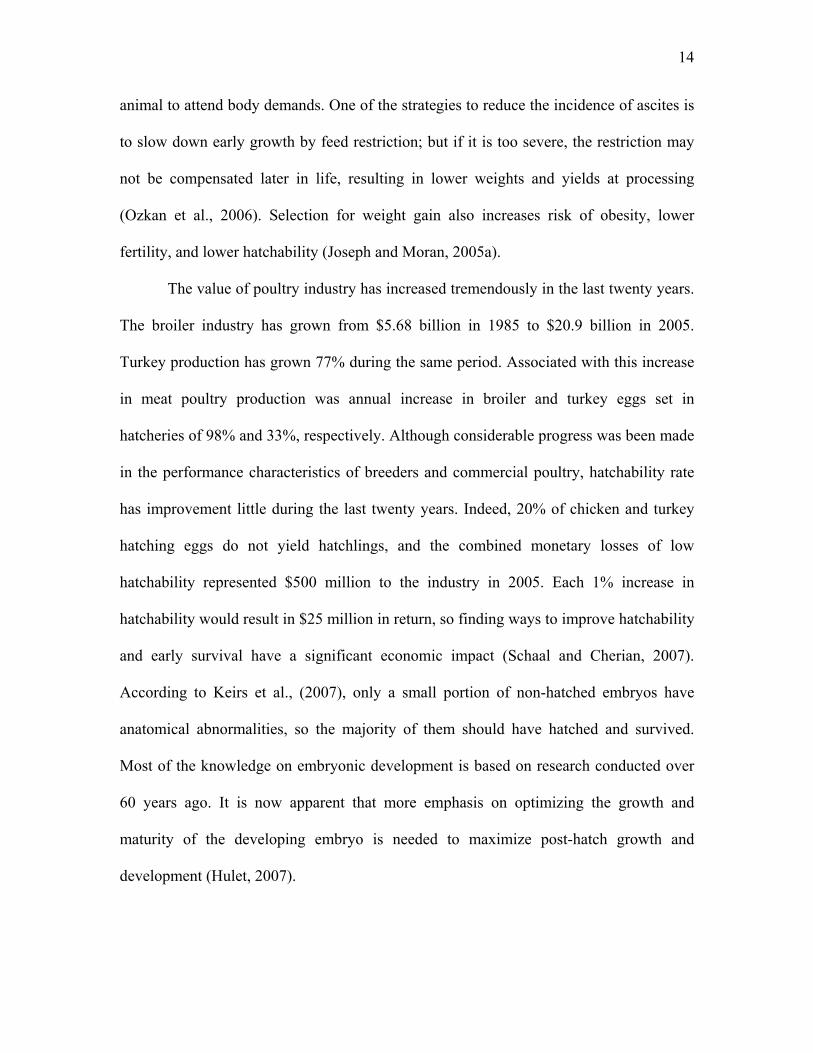
The value of poultry industry has increased tremendously in the last twenty years.
The broiler industry has grown from $5.68 billion in 1985 to $20.9 billion in 2005.
Turkey production has grown 77% during the same period. Associated with this increase
in meat poultry production was annual increase in broiler and turkey eggs set in
hatcheries of 98% and 33%, respectively. Although considerable progress was been made
in the performance characteristics of breeders and commercial poultry, hatchability rate
has improvement little during the last twenty years. Indeed, 20% of chicken and turkey
hatching eggs do not yield hatchlings, and the combined monetary losses of low
hatchability represented $500 million to the industry in 2005. Each 1% increase in
hatchability would result in $25 million in return, so finding ways to improve hatchability
and early survival have a significant economic impact (Schaal and Cherian, 2007).
According to Keirs et al., (2007), only a small portion of non-hatched embryos have
anatomical abnormalities, so the majority of them should have hatched and survived.
Most of the knowledge on embryonic development is based on research conducted over
60 years ago. It is now apparent that more emphasis on optimizing the growth and
maturity of the developing embryo is needed to maximize post-hatch growth and
development (Hulet, 2007).
15
Poultry Embryo Development
Embryonic use of egg nutrients
Egg composition
Embryo development apart from the hen allows poultry producers to handle large
number of animals, but on the down side all nutrients must be present in the egg to
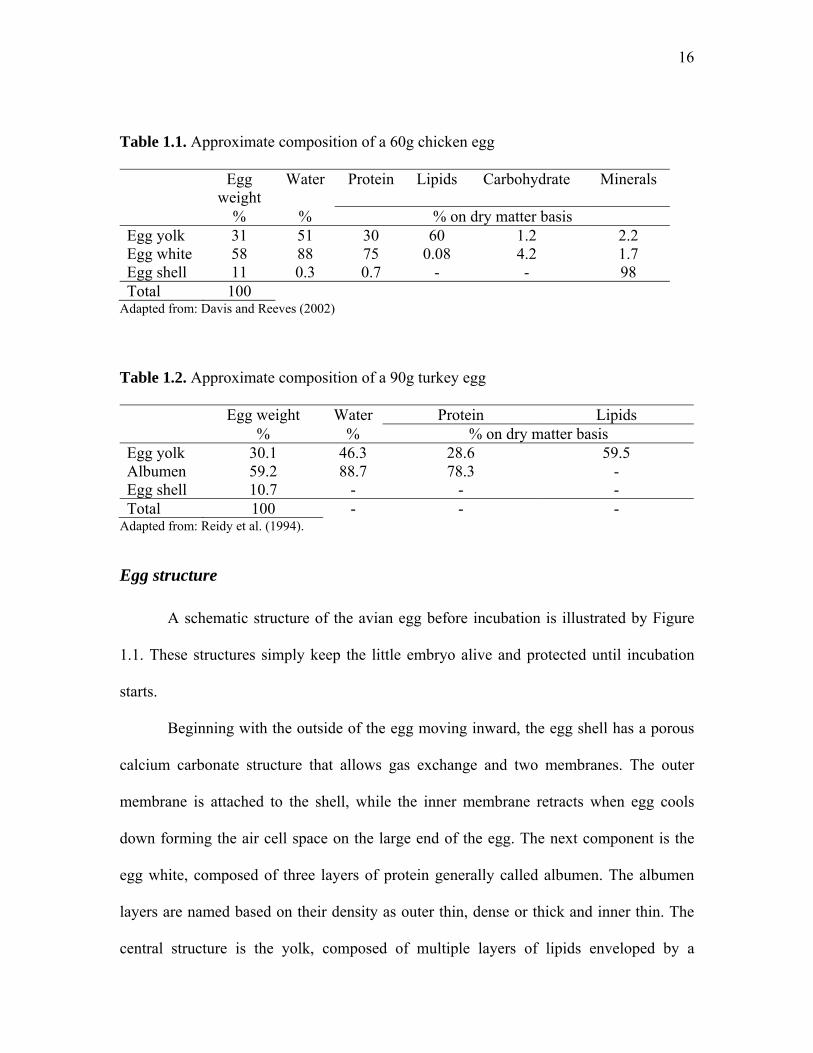
sustain embryonic development by the time the egg is laid (Fasenko, 2007). Composition
of a typical chicken egg is presented on Table 1.1. There is much less information
available on the composition of turkey egg, mostly because they are only produced for
the purpose of turkey reproduction rather than as a human food source. An 80g turkey
egg comprises of about 30% yolk and 55-60% albumen (Applegate and Lilburn, 1998).
Reidy et al., (1994) determined egg composition from two of the three major turkey
breeds, and the average composition values among breeds over different hen ages are
presented in Table 1.2. Although the relative composition of eggs from chickens and
turkeys are similar, turkey eggs have higher total nutrients because of their larger size.
These egg nutrients will be all that is available to nurture the developing embryo.
However, it is noteworthy that there is very little energy reserves as carbohydrates in the
egg (Romanoff, 1967), being most of lipids in the yolk fraction. Ninety eight percent of
the free carbohydrates are present as 0.5% glucose in the albumen (Davis and Reeves,
2002).
16
Table 1.1. Approximate composition of a 60g chicken egg
Egg weight
Water Protein Lipids Carbohydrate Minerals
% % % on dry matter basis Egg yolk 31 51 30 60 1.2 2.2 Egg white 58 88 75 0.08 4.2 1.7 Egg shell 11 0.3 0.7 - - 98 Total 100
Adapted from: Davis and Reeves (2002)
Table 1.2. Approximate composition of a 90g turkey egg
Egg weight Water Protein Lipids % % % on dry matter basis Egg yolk 30.1 46.3 28.6 59.5 Albumen 59.2 88.7 78.3 - Egg shell 10.7 - - - Total 100 - - -
Adapted from: Reidy et al. (1994).
Egg structure
A schematic structure of the avian egg before incubation is illustrated by Figure
1.1. These structures simply keep the little embryo alive and protected until incubation
starts.
Beginning with the outside of the egg moving inward, the egg shell has a porous
calcium carbonate structure that allows gas exchange and two membranes. The outer
membrane is attached to the shell, while the inner membrane retracts when egg cools
down forming the air cell space on the large end of the egg. The next component is the
egg white, composed of three layers of protein generally called albumen. The albumen
layers are named based on their density as outer thin, dense or thick and inner thin. The
central structure is the yolk, composed of multiple layers of lipids enveloped by a

17
membrane. Resting on top of the yolk is the blastodisc where the embryo resides after the
egg is fertilized. Concentric yolk layers can be differentiated by the amount of pigment
deposited depending whether they were formed during daylight or night darkness.
Linking the yolk to each end of the egg are the chalazas that act like bungee cords to keep
the yolk horizontally centered in the egg. These rudimentary structures are present at the
time of lay but they rapidly change once incubation proceeds.
From http://www.msstate.edu/dept/poultry/avianemb.htm#stages (Smith, 2007b)
Embryo development during Incubation
Moran, (2007) presented a comprehensive review on the development of the avian
embryo. Moran divided embryonic development in three distinct periods: 1) the
Figure 1.1.
18
establishment of the germ; 2) completion of embryonic formation; and 3) preparation for
emergence.
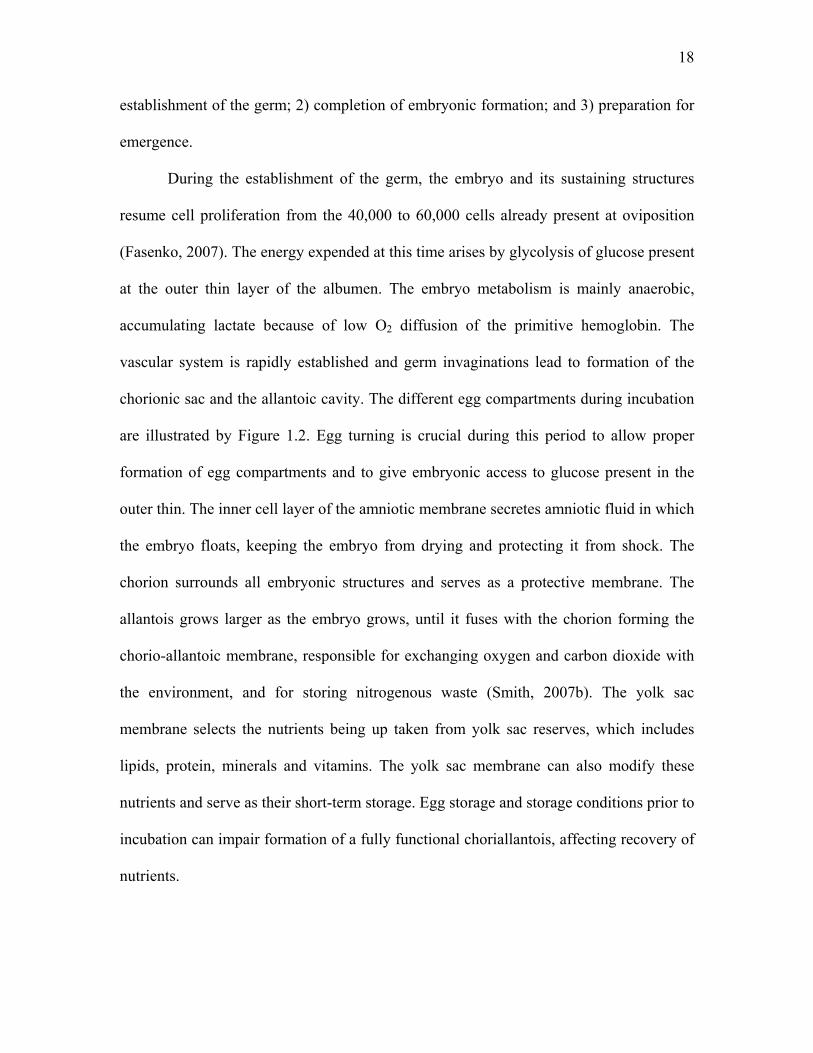
During the establishment of the germ, the embryo and its sustaining structures
resume cell proliferation from the 40,000 to 60,000 cells already present at oviposition
(Fasenko, 2007). The energy expended at this time arises by glycolysis of glucose present
at the outer thin layer of the albumen. The embryo metabolism is mainly anaerobic,
accumulating lactate because of low O2 diffusion of the primitive hemoglobin. The
vascular system is rapidly established and germ invaginations lead to formation of the
chorionic sac and the allantoic cavity. The different egg compartments during incubation
are illustrated by Figure 1.2. Egg turning is crucial during this period to allow proper
formation of egg compartments and to give embryonic access to glucose present in the
outer thin. The inner cell layer of the amniotic membrane secretes amniotic fluid in which
the embryo floats, keeping the embryo from drying and protecting it from shock. The
chorion surrounds all embryonic structures and serves as a protective membrane. The
allantois grows larger as the embryo grows, until it fuses with the chorion forming the
chorio-allantoic membrane, responsible for exchanging oxygen and carbon dioxide with
the environment, and for storing nitrogenous waste (Smith, 2007b). The yolk sac
membrane selects the nutrients being up taken from yolk sac reserves, which includes
lipids, protein, minerals and vitamins. The yolk sac membrane can also modify these
nutrients and serve as their short-term storage. Egg storage and storage conditions prior to
incubation can impair formation of a fully functional choriallantois, affecting recovery of
nutrients.
19
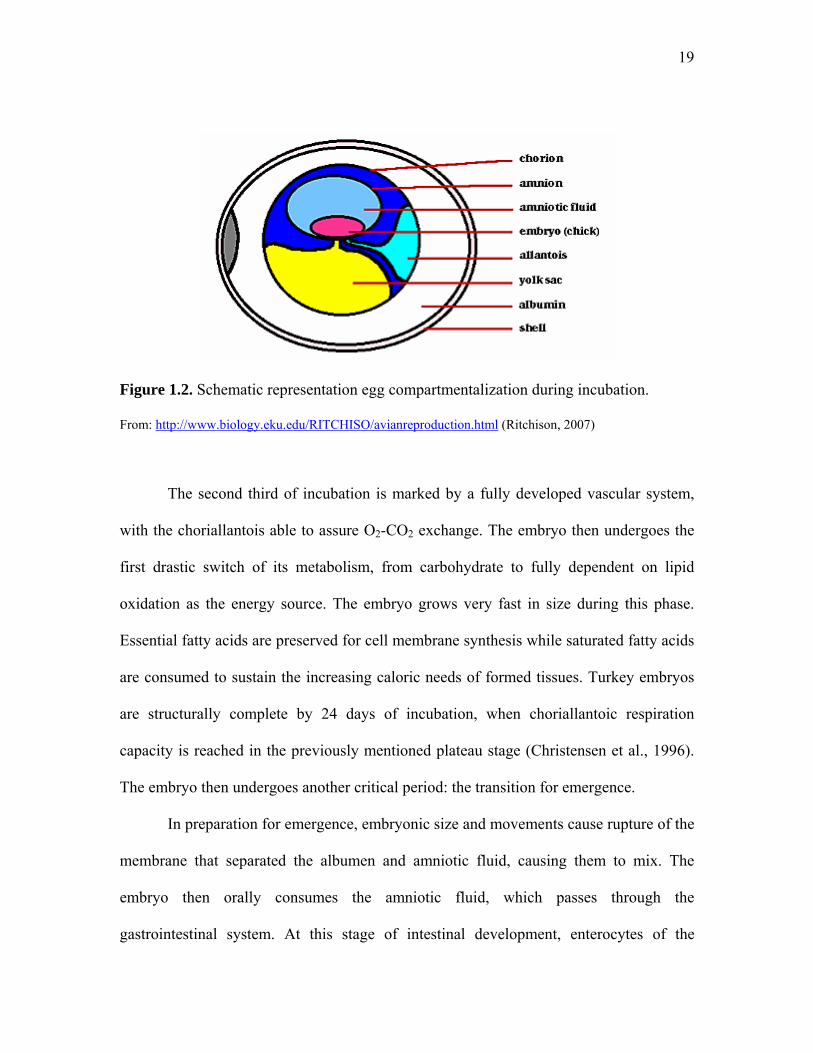
Figure 1.2. Schematic representation egg compartmentalization during incubation.
From: http://www.biology.eku.edu/RITCHISO/avianreproduction.html (Ritchison, 2007)
The second third of incubation is marked by a fully developed vascular system,
with the choriallantois able to assure O2-CO2 exchange. The embryo then undergoes the
first drastic switch of its metabolism, from carbohydrate to fully dependent on lipid
oxidation as the energy source. The embryo grows very fast in size during this phase.
Essential fatty acids are preserved for cell membrane synthesis while saturated fatty acids
are consumed to sustain the increasing caloric needs of formed tissues. Turkey embryos
are structurally complete by 24 days of incubation, when choriallantoic respiration
capacity is reached in the previously mentioned plateau stage (Christensen et al., 1996).
The embryo then undergoes another critical period: the transition for emergence.
In preparation for emergence, embryonic size and movements cause rupture of the
membrane that separated the albumen and amniotic fluid, causing them to mix. The
embryo then orally consumes the amniotic fluid, which passes through the
gastrointestinal system. At this stage of intestinal development, enterocytes of the
20
duodenum and jejunum are able to absorb macromolecules of protein, in a process similar
to mammalian absorption of colostrums. Such consumption continues until the albumen-
amniotic fluid disappears and internal pipping begins. Since embryonic skeletal tissue
development is complete at this point, the nutrients absorbed are used for visceral organs
maturation and most of it is stored as glycogen. The main protein present in the fluid is
called ovomucoid, which has extensive amounts of carbohydrate. Gluconeogenesis from
albumen proteins is channeled to form glycogen, while the amino acids are spared for
protein synthesis. Glycogen is deposited in liver and muscle. Some residual albumen-
allantoic fluid ingested enters the yolk and continues to express digestive enzymes
obtained while passing through gastrointestinal systems. Digestion of nutrients then can
occur in the yolk and be absorbed by yolk sac cell villi, especially VLDL, which
accumulates triglycerides in sub-dermal locations of the embryo. Cholesterol accumulates
in the liver, causing it to grow in size and become yellow in appearance. At the same time
HDL aggregates in granules and are covered with calcium from circulation. These
granules remain in the yolk sac until pipping. Dissolution of mammary knobs adjacent to
the choriallantois-shell membrane interface mobilizes great amounts of calcium, which
rises in the circulation favoring calcification of the skeleton, which was mainly cartilage
until then. Now the embryo is ready to start pipping the weakened shell and membranes
(Moran, 2007).
Emergence starts when the embryo breaks the choriallantois and the inner shell
membrane near the air cell, in what is called internal pipping. At this point the embryo
must initiate pulmonary respiration, since the outer shell membrane is loosing contact
with the shell. This is a critical period because limited supply of oxygen suppresses
21
continuing use of lipids as energy, so metabolism switches again to the anaerobic
catabolism of glucose from glycogen reserves producing lactate. The remaining yolk sac
is retracted into the abdominal cavity, and peripheral blood is recovered into the embryo.
A relatively great amount of energy is used to sustain embryonic pipping movements to
break the shell, and body rotation. Shell piercing is achieved by the coordination of
pipping muscle movements and the egg tooth of the beak. The pipping or hatching
muscle is a specialized muscle located in the back of the head. Hatching muscle fibers
are exclusively anaerobic and relay on glycogen stored there previously. It also has a
special nervous system to coordinate its movements. External air access now provides
enough oxygen for oxidation of fatty acids and lactate recovery in the liver. At this point
the choriallantois can not longer extract calcium from the shell, so calcium mobilization
begins from HDL granules. The embryo continues breaking the shell, rotating and using
the feet to push until it is free from the shell (Moran, 2007). The blood vessels linking the
navel to the shell membrane are detached, and the hatching process is over.
Although yolk sac lipoproteins continue to be an important nutrient source at this
time, fatty acid recovery from preformed body depots appears to dominate. Extensive
hepatic cholesterol in place at hatch rapidly dissipates along with the depots. Cholesterol,
together with depot essential fatty acids, enables continued membrane formation and
growth. A high concurrent demand for glucose appears to reside with its need to support
growth of glycolytic muscle. In the intestine, cell proliferation is stimulated by feed
intake to replace embryonic enterocytes, able to absorb macromolecules, by mature ones,
able to produce digestive enzymes and to absorb external feed nutrients. The complete
22
transition may take up to two weeks post-hatch, and is delayed if feeding is delayed
(Moran, 2007).
Turkey poult peculiarities
Genetic advances are forcing commercial poultry towards altricial development,
as was pointed out by Foye, (2005). Early nutrition and incubation have become key
factors for successful poultry production and it offers the greatest opportunity for
improvement (Hulet, 2007). The development of body functions starts early during the
embryonic phase in precocial birds, especially poultry. This early and very sensitive
developmental phase is of high significance for the adaptability of the organism later in
life (Tzschentke, 2007).
The turkey is more prone to perinatal problems than chickens because of it has a
thicker egg shell (lower conductance), longer incubation period (28 versus 21 days), and
longer hatching window (exacerbated by longer storage since less eggs are available).
These disadvantages often increases the incidence of weak poults by the time of
placement, resulting in 2-5% mortality during brooding phase (Carver et al., 2000;
Christensen et al., 2003c; Uni and Ferket, 2004). Bakst et al., (1997) described that we
can not use the same staging procedure for chickens and turkeys because there are several
differences between their developments. Chicken morphogenetic development is more
advanced by the time of oviposition (Gupta and Bakst, 1993; Bakst et al., 1997), but
more research is necessary to confirm if this is related to higher hatchery losses among
turkeys compared to chickens.
It has been well documented that weaker poults are associated with depleted
glycogen energy reserves by the time of hatching (Donaldson and Christensen, 1991,
23
Donaldson et al., 1991; Donaldson, 1995; Christensen et al.; 2001b, Christensen et al.,
2003c), and recovering glycogen reserves is done at the expense of muscle degradation
by gluconeogenesis (Keirs et al., 2002). These poults may be too weak to eat and drink
thus initial losses may never be compensated.
Late-term embryo tissue specificities
To study turkey embryo and poult nutrition and metabolism, it is important to
identify which are the most metabolic active tissues: liver, pectoral muscle, hatching
muscle, and intestines. The following is a brief explanation why these tissues are
metabolically important for the perinatal turkey.
As in all animals, the liver is the most metabolically active tissue in the body of
turkey embryos. It is the only organ in which all metabolic pathways and metabolic
enzymes are active; some of them are present exclusively in the liver. Blood coming from
vitelline circulation, digestive tract or peripheral tissues pass though the liver. In the liver
nutrients absorbed can be stored, modified or exported to other parts of the body, while
waste components from other tissues can be metabolized for excretion, or recycled back
into useful metabolites. Major energy metabolic pathways like glycolysis,
gluconeogenesis, tricarboxylic acid cycle (TCA), pentose phosphate, glycogenesis and
glycogenolysis are most active in the liver, due to its role in controlling energy
homeostasis. Extensive lipid metabolism also occurs in the liver, like exporting stored
and de novo synthesized cholesterol, triacylglycerol and phospholipids packaged or
repackaged as low-density lipoproteins (LDL), very low density lipoproteins (VLDL) and
high-density lipoproteins (HDL). To keep energy homeostasis, hepatic cells are under
fine control of circulating hormones, including insulin, glucagon, corticosteroids and
24
thyroid hormones. In poultry embryos, the liver is especially important to produce
glucose through gluconeogenesis. The major gluconeogenic organ in animals is the liver,
with small contributions from the kidney cortex (Matthews and Holde, 1990a). This is
crucial because from when internal pipping begins until the poult is fed, gluconeogenesis
is the only source of glucose production for the embryo and poult (Donaldson, 1995), and
only the liver has glucose-6-phosphatase, the enzyme needed to export glucose
(Matthews and Holde, 1990a). This is in contrast to what happens in mammals, which
have a constant supply of maternal glucose (Pearce and Brown, 1971). For example,
gluconeogenesis and glycogenesis rapidly develop in rats only after birth (Pearce and
Brown, 1971). Some cells of the brain, blood, heart, and muscle depend exclusively on
glucose as their energy substrate under anaerobic conditions (like hatching) (Krebs,
1972). Gluconeogenesis from amino acids also require deamination and the liver plays a
key role in metabolizing nitrogen to be transported in a less toxic form to the kidney
where it can be excreted (Matthews and Holde, 1990b), or to the allantois in the case of
the embryo. Because of its increased role in late-term embryo metabolism, the liver
shows extensive growth during the last phase of incubation, growing proportionally faster
than the rest of the embryo (Romanoff, 1967). The avian’s liver has an even greater
importance in carbohydrate metabolism because their hearts lack the enzymes of the Cori
cycle, so lactate produced during increased glycolysis can only be recycled by hepatic
tissue (Pearce and Brown, 1971; Christensen et al., 2003c).
The breast muscle (Pectoralis major) of the avian embryo is metabolically
important mainly because of its relatively large size. Even though the pectoral muscle
contains less glycogen per unit mass, it accounts for the greatest quantity of total
25
glycogen stored in the body (Foye et al., 2006). Therefore, it is important to study the
pectoral muscle when tracking the destiny of circulating glucose during late incubation.
The pectoral muscle is also the tissue of highest economic value (Smith, 2006a). Genetic
selection of turkeys for increased breast meat yields may have contributed to some of the
metabolic challenges the poults are experiencing nowadays. Larger breasts retaining
constant concentration of glycogen may reduce glucose available for liver storage. Since
genetic selection keeps increasing pectoral muscle size, this trend is not going to stop.
New technologies opened the door to even greater emphasis in breast meat. Geneticists
may include some selected key genes into selection strategy to improve pectoral muscle
(Velleman, 2007). The pectoral muscle is also the possible source of protein mobilized to
supply amino acids for gluconeogenesis if energy reserves are depleted after hatch
(Donaldson, 1995; Keirs et al., 2002; Warner et al., 2006). This could mean less pectoral
muscle at market age, and consequently economic losses. Thus, there is a need to study
the role the pectoral muscle plays in embryonic metabolism during embryo development,
hatching and brooding.
The importance of the hatching muscle to the developing embryo was already
discussed above, but it is worth emphasizing some more key points. The Complexus
muscle or hatching muscle is a large paired neck muscle that overlies the spinalis and
biventer cervicus muscles (Gross, 1985), extending from the dorsal surface of the
transverse process of some of the anterior cervical vertebrae to the occipital crest of the
skull (George and Berger, 1966). Each half is divided into three segments with
neuromuscular junctions in between them. It acts by extending the head dorsally and
laterally. Another characteristic of this muscle is its increase in size towards the time of
26
pipping, and then shrinking during 3 to 8 days post-hatch (John et al., 1987). The
function of this muscle is to help the embryo pierce the membranes and the shell (Moran,
2007). Enlargement of the hatching muscle forces the egg-tooth to push against the shell,
thereby causing the shell to crack (Smail, 1964). There are not many studies on structural
and metabolic aspects of this muscle in relation to its function, but what is known is that
it has two types of muscle fibers. The majority of the fibers are glycolytic only (able to
use glucose exclusively), and a few are oxidative-glycolytic (able to use glucose and fatty
acids). The muscle swelling happens with accumulation of high amounts of water and
glycogen granules, which is reduced by half after hatch (John, et al., 1987). Glycolytic
fibers produce lactate and are more active during pipping and hatching, while oxidative-
glycolytic fibers are active after hatch, coinciding with rising amounts of free fatty acids
in this tissue (John et al., 1987). The complexus muscle has its independent nerve control
(Gross, 1985; Moran, 2007) to coordinate its movements. Because it is one of the most
active muscles during emergence, it has higher energy demands than any other tissue of
the body. So the hatching muscle is an important tissue to consider when studying late-
term embryo energy metabolism and hatchability.
During egg incubation bird embryos do not invest much into gut development, but
at the end of the incubation period rapid visceral growth and maturation occurs. The
hatched poult must have a functional digestive system, because their nutrient reserves are
limited (Christensen et al., 2007), and it must start eating. The sooner the gastrointestinal
tract achieves its functional capacity, the sooner the young bird can utilize dietary
nutrients and efficiently grows to its genetic potential (Uni et al., 2006). It is
understandable that the embryo would not spend a lot of resources growing intestinal
27
tissue during embryonic development since their nutrients are being absorbed by the yolk
sac membrane directly into the vitelline circulation (Richards, 1997). Also intestinal cells
require high energy for maintenance and have very high turnover. The major event to
trigger change in this system is amnion consumption, which constitutes the first substrate
to pass through intestinal tract for absorption (Uni et al., 2006). At this time there is an
abrupt change in nutrient source from yolk lipids to protein and some carbohydrates
arriving in the gut (Uni et al., 1998). Intestinal mucosa cells called enterocytes are
produced in the crypt and migrate to the tip of the villus to replace embryonic mucosa. At
the same time they mature from secretory to digestive/absorbing cells. This pattern of
maturation is programmed to staring a couple days before hatch, and will persist
throughout the bird’s life. Even though maturation is programmed to happen, substrate
presence seems to accelerate development. During migration, enterocytes acquire
differential functions for digestion, including expression of enzymes such as
disaccharidase, peptidase, and alkaline phosphatase (Uni et al., 1998). Uni et al., (1998)
showed that villus volume increased rapidly in all segments of the intestine starting at 2
days post-hatch. Duodenum completed development by 7 days post-hatch, whereas
jejunum and ileum continued until day 14. Crypt depth increases two to three fold as age
advances, being greatest in the duodenum and least in the ileum. Production of major
enzymes, like sucrase, maltase and alkaline phosphatase, also increases with age.
Birds have a greater capacity to digest disaccharides than mammals immediately
post-hatch. Even before hatch there are reports of pancreatic and brush-border enzymatic
activity in the chicken embryo intestine (Uni and Ferket, 2004), but not much is known
about other enzymes and transporters. It was also previously discussed that not having
28
immediate access to feed causes loss of intestinal structure and delays maturation (Uni et
al., 1998; Uni and Ferket, 2004; Christensen et al., 2007). To emphasize the importance
of a mature gut, it is worth mentioning the study done by Applegate et al., (2005) who
compared turkey poults and pekin ducklings. Both species have the same egg size and
incubation length, but ducklings grow faster with the difference being their higher
intestinal growth and maturation compared to poults of the same age. Hypothetically,
any improvement in early gut maturation and digestive capacity would be valuable to
help give poults a good start post-hatch.
Ways to Improve Early Development
Because turkey poults are more difficult to hatch and brood than chickens, early
development has been a focused area of research. (Uni and Ferket, 2004) described it as
the “hatchling quality” phenomena, where hatchlings do not survive the critical post-
hatch adjustment period and many survivors exhibit stunted growth, inefficient feed
utilization, reduced disease resistance, or poor meat yield; this all costs the poultry
industry over $200 million a year. As discussed below, many options to alleviate these
losses have being suggested, and many have been tested.
While changes in the way hatcheries handle poults have not been implemented
during the last 3 decades, a lot of studies have been focusing on early feeding. One
hypothesis is that having the first feed formulated to improve gut development could
compensate for the previous long period of fasting. For example, feeding yeast extract to
turkey poults has been shown to accelerate gut maturation in comparison to poults fed
regular diets (Solis de los Santos et al., 2007). Even just the physical presence of solids
with no nutritive value in the intestine is enough to stimulate maturation and growth, but
29
with no lasting effects (Noy and Sklan, 1998b). Early feeding stimulates gastrointestinal
motility and use of yolk sac nutrients necessary for growth (Noy and Sklan, 1998b; Noy
and Sklan, 1998a; Noy and Sklan, 1999b; Noy and Sklan, 2001).
Offering glucose in drinking water was the earliest initiative to improve chick
energy status, but the practice was later found to be detrimental because glucose
suppresses gluconeogenesis, which is the main source of energy to the early hatchling
(Donaldson, 1995). One other option is to offer feed in the transport boxes, which led to
the design of products like Oasis1, which is made of protein, carbohydrate, fat and fiber in
a green granular form. The product attracts chicks and poults to eat during transport or
when dressed on top of feed trays in the brooder house. Although gavage of nutrients is
not practical under commercial conditions, it was found to be effective as Oasis in
increasing body weight and breast meat yield (Noy and Sklan, 1999a). Even at market
age early fed birds were 8-10% heavier and had 7-9% bigger breasts than birds held
without feed (Noy and Sklan, 1998b; Noy and Sklan, 1999a).
Another option tested was subcutaneous injection of nutrients at servicing.
Gluconeogenic substrates like amino acids and vitamins were injected subcutaneously in
just hatched broiler chicks and resulted in 10% gain in body weight in 24 hours and
nearly double their weights in 96 hours due to reduced tissue catabolism (Keirs et al.,
2002; Peebles et al., 2006). Another study testing the injection of glucose and alanine
concluded that under proper brooding conditions and timely feed provision, growth was
not improved (Donaldson, 1995; Keirs et al., 2002; Peebles et al., 2006). John, et al.,
(1987) tested the effect of immerging eggs in a glucose-antibiotic solution, and saw no
1 Novus International, Inc., MO
30
differences in glycogen reserves, but an increase on lactate, indicating increased
glycolysis.
From all options tested, early feeding seems to be the most advantageous, while
gavage, injections and egg dipping showed to be unpractical or have inconsistent results.
These inconsistent results emphasize that there is not enough information about avian
embryo physiology and nutrition to predict responses. Although early feeding enhances
development of hatched birds, it is too late for embryos to overcome struggles during
pipping and hatching. It is also difficult to measure improvements on poult quality other
than body weight and growth.
Assessing Poult Quality
A good-quality 1-day-old chick is a crucial link between the hatchery and the
broiler farmer. The usual criterion to assess chick quality is personal observation and
judgment of personnel, with no clear standards. The relationship of body weight at hatch
with slaughter weight is unclear, disqualifying chick weight as a good indicator of chick
quality must be considered.
Two scoring systems have been proposed to provide a better assessment of poult
quality (Decuypere and Bruggeman, 2007). The first one is called the Pasgar Score, in
which the chick starts with a score of 10 and looses points when abnormalities are
observed (Boerjan, 2006; Decuypere and Bruggeman, 2007). The other scoring system
was proposed by Tona et al., (2003), where parameters receive points depending on their
importance, with totals ranging from 0 to 100 (100 being the best chick). These scoring
systems have shown good correlation with body weight at 6 weeks of age, where birds
showing high scores at hatch were the heaviest birds at slaughter. The most important
31
chick quality traits of the two evaluation systems is associated with retracted yolk and
naval (Decuypere and Bruggeman, 2007).
An increasing number of turkeys develop some sort of leg problem. The most
common skeleton problems are dyschondroplasia, twisted leg, rickets, kinky back, brittle
bone disease, and general lameness (Zhou et al., 2007a). Birds with leg problems have
trouble moving and thus do not eat and drink normally, ending as small birds at
processing and more condemnations when associated with infection. Zhou et al.
emphasized that skeleton integrity is important for meat processing and cause significant
economic losses (Zhou et al., 2007a). The source of the problem seems to trace back to
initial bone formation when calcium is mobilized from eggshell for skeleton calcification.
Incubation conditions or limited egg nutrients can prevent normal bone development,
which can be seen in long bones like leg shanks of the hatched poult or chick. At 18 days
of incubation, the turkey embryo skeleton is still all cartilage, with solid bone mass
appearing between E18 and 3 days post hatch. Ossification is mainly completed by 7
days pf age (Simsa and Ornan, 2007). Shank length can be used as an indicator of poult
quality. Leg relative asymmetry was a parameter created to determine hatchling quality;
it uses the ratio between right and left shank length to assess proper use of nutrients for
bone development (Moller et al., 1995; Moller and Cuervo, 2002; Moller and Manning,
2003; Yalcin et al., 2003; Yalcin et al., 2004; Yalcin et al., 2005).
Among the factors that affect quality, Decuypere and Bruggeman, (2007)
highlighted the following: egg storage time (the longer, the worse), age of breeder (eggs
from older hens result in poor quality chicks), incubation conditions (humidity,
temperature, turning and gaseous environment), and embryo physiology (heat production,
32
hormones, gas exchange, energy stores). Studying egg size and heat production, Lourens
et al., (2006) concluded that temperature has a big influence on poult quality, and large
eggs had more remaining yolk energy. Egg turning regulates accumulation of protein in
amniotic fluid, affecting embryo growth, hatchability and consequently poult quality.
Turning also influences thyroid hormone levels and corticosteroid production, affecting
embryonic response to stress (Tona et al., 2005). The same authors even suggested that
ceasing to turn eggs negatively affects poult quality through genome imprinting.
Decuypere and Bruggeman, (2007) hypothesized that conditions prior to hatch can
modify embryo physiology in ways that can not be evaluated, such as changes in the
expression of genes involved in growth.
In summary, there is a problem in turkey production with poor hatchability, poult
quality, early survival, and stunted growth. A combination of factors contribute to the
picture, including breeder hen age, egg size, egg conductance, egg storage, incubation
conditions, hatch window, poult servicing, holding time at the hatchery, transport to
brooder farm, and brooding conditions. The worse case scenario seems to be with large
eggs, from older hens, stored for over a week, incubated in less than ideal conditions,
submitted to long holding and transportation periods, finally placed in lower brooding
temperatures. Unfortunately some sort of combination of these factors can not always be
avoided in practical conditions, and that is why we need to consider new ways to help
these poults must be considered.

33
Aiding Embryo Nutrition in Ovo
In ovo feeding concept
The greatest opportunity to facilitate improvements in hatchability and hatchling
viability was, for a long time, to change incubation conditions. In the early days of
poultry industry, Smith (1937) advised farmers to invest in turkey hen nutrition because
after the egg was laid, it was impossible to increase any of the food essentials for
development and growth of the embryo until it hatches. In the beginning of the 80’s, in
ovo vaccination against Marek’s disease was proven to be effective against early
exposure to the virus (Sharma and Burmester, 1982). These same authors developed a
successful method of in ovo injection. Experimental injection of small amounts of drugs,
vaccines and nutrients in the egg during incubation was tested along the years. A
summary of research papers mentioning in ovo administration is presented on Table 1.3.
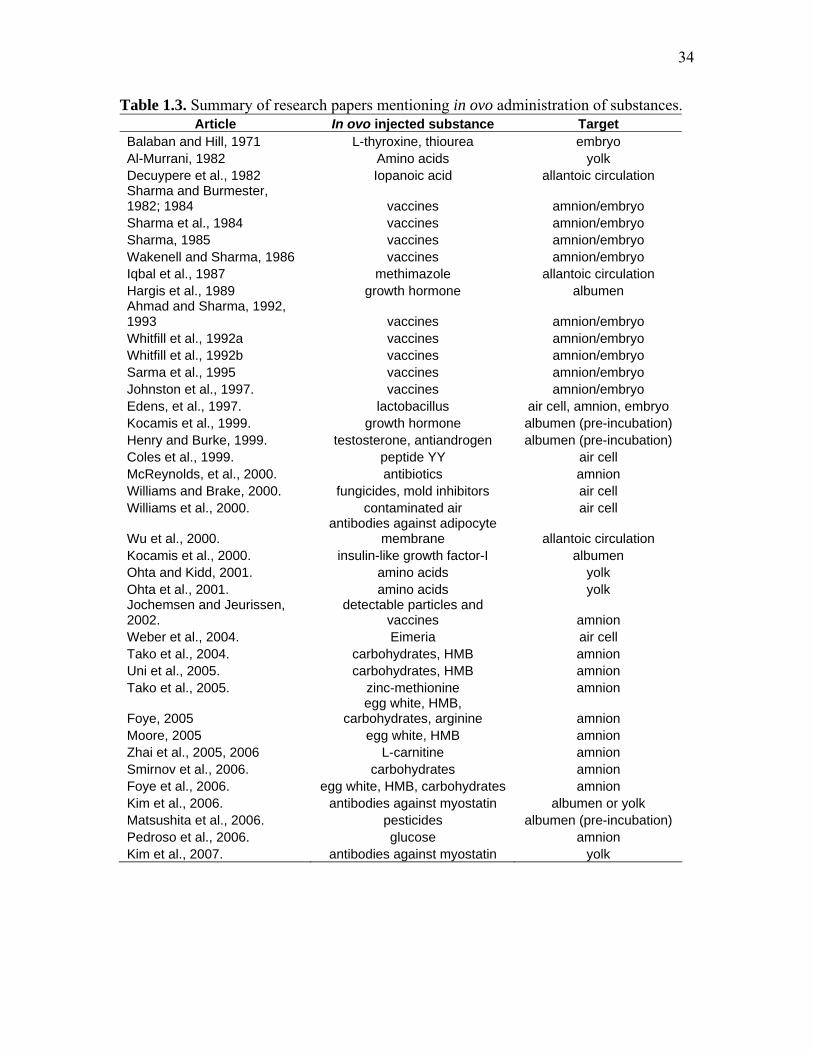
34
Table 1.3. Summary of research papers mentioning in ovo administration of substances. Article In ovo injected substance Target
Balaban and Hill, 1971 L-thyroxine, thiourea embryo Al-Murrani, 1982 Amino acids yolk Decuypere et al., 1982 Iopanoic acid allantoic circulation Sharma and Burmester, 1982; 1984 vaccines amnion/embryo Sharma et al., 1984 vaccines amnion/embryo Sharma, 1985 vaccines amnion/embryo Wakenell and Sharma, 1986 vaccines amnion/embryo Iqbal et al., 1987 methimazole allantoic circulation Hargis et al., 1989 growth hormone albumen Ahmad and Sharma, 1992, 1993 vaccines amnion/embryo Whitfill et al., 1992a vaccines amnion/embryo Whitfill et al., 1992b vaccines amnion/embryo Sarma et al., 1995 vaccines amnion/embryo Johnston et al., 1997. vaccines amnion/embryo Edens, et al., 1997. lactobacillus air cell, amnion, embryo Kocamis et al., 1999. growth hormone albumen (pre-incubation) Henry and Burke, 1999. testosterone, antiandrogen albumen (pre-incubation) Coles et al., 1999. peptide YY air cell McReynolds, et al., 2000. antibiotics amnion Williams and Brake, 2000. fungicides, mold inhibitors air cell Williams et al., 2000. contaminated air air cell
Wu et al., 2000. antibodies against adipocyte
membrane allantoic circulation Kocamis et al., 2000. insulin-like growth factor-I albumen Ohta and Kidd, 2001. amino acids yolk Ohta et al., 2001. amino acids yolk Jochemsen and Jeurissen, 2002.
detectable particles and vaccines amnion
Weber et al., 2004. Eimeria air cell Tako et al., 2004. carbohydrates, HMB amnion Uni et al., 2005. carbohydrates, HMB amnion Tako et al., 2005. zinc-methionine amnion
Foye, 2005 egg white, HMB,
carbohydrates, arginine amnion Moore, 2005 egg white, HMB amnion Zhai et al., 2005, 2006 L-carnitine amnion Smirnov et al., 2006. carbohydrates amnion Foye et al., 2006. egg white, HMB, carbohydrates amnion Kim et al., 2006. antibodies against myostatin albumen or yolk Matsushita et al., 2006. pesticides albumen (pre-incubation) Pedroso et al., 2006. glucose amnion Kim et al., 2007. antibodies against myostatin yolk
35
The in ovo studies presented on Table 1.3 show a variety of substances being
injected in different compartments of the egg. The first studies of Balaban and Hill
(1971), Al-Murrani (1982) and Sharma and Burmester (1982), Sharma and Burmester
(1984) determined that injecting solutions in the air cell or on the chorioallantoic
membrane depressed hatchability. Balaban and Hill (1971) proved that hatchability is
dependent on thyroid hormones, which was later confirmed by Decuypere et al. (1982).
Al-Murrani (1982) was the first to attempt improving embryo body weight by adding
amino acids to the yolk sac of chicken embryos at 7 days of incubation. He concluded
that embryos used the extra protein to grow heavier only when they reached late
embryonic growth, and that supplemented chicks were heavier all the way to market age.
His idea was not to make in ovo supplementation commercially viable, but to prove that
laying hens needed additional protein in their diets. Most of the studies done during the
following two decades were focused on in ovo vaccination (Johnston et al., 1997).
Research was done to test the effect of growth hormone (Hargis et al., 1989; Kocamis et
al., 1999), testosterone (Henry and Burke, 1999), peptide YY (Coles et al., 1999),
antibiotics (McReynolds et al., 2000), insulin-like growth factor-I (Kocamis, et al., 2000),
pathogens (Williams et al., 2000; Weber, et al., 2004), and fungicides and toxic
compounds (Williams et al., 2000; Matsushita et al., 2006). The objective of this research
was not to improve poultry production, but to demonstrate embryo response within the
egg’s closed environment. Ohta resumed Al-Murrani’s work, now with the goal to
improve hatchability and chick weight (Ohta and Kidd, 2001; Ohta et al., 2001). As Al-
Murrani, (1982), they injected a mixed amino acid solution similar to the amino acid
profile of egg white into different embryonic compartments on day 7 of incubation. They
36
concluded that the yolk sac or the extra-embryonic cavity was the best target for amino
acid injection at 7 days of incubation to positively affect hatchability. However, injecting
this amino acid solution into the amnion at 7 days of incubation resulted in embryonic
death within 24 hours. Yolk and extra-embryonic coelom supplemented chicks hatched
heavier than the controls (Ohta and Kidd, 2001), and had higher amino acids
concentration in their tissues (Ohta et al., 2001).
In ovo vaccination has became a widely adopted practice by the poultry industry
(Johnston et al., 1997), and after the technology was patented (Sharma and Burmester,
1984). In fact, in ovo techniques are mentioned by Smith (2006b) as one of the biggest
contributions of poultry research, along with feather sexing, nutritional strategies to avoid
leg problems, blood screening to eliminate pathogen carriers, and genome sequencing.
Uni and Ferket, (2003) invented and patented the concept of administrating a
nutritive solution into the amniotic fluid so as to “feed” supplemental nutrients to the
embryo which consumes the amniotic fluid prior to hatch. According to Uni and Ferket,
(2004), if early access to feed is critical for early development post-hatch, then feeding
the embryo before hatch by in ovo administration would be expected to enhance
hatchability, and development of the digestive tract, and increase body weight and
nutritional status of the hatchling. The advantage of in ovo feeding over early feeding is
the possibility of helping the struggling embryos to hatch. In ovo feeding may not replace
the benefits of early feeding, but it should potentialize its effects if both practices were
combined, and at least minimize the adverse effects of post-hatch holding if the poults do
not have access to early feeding.
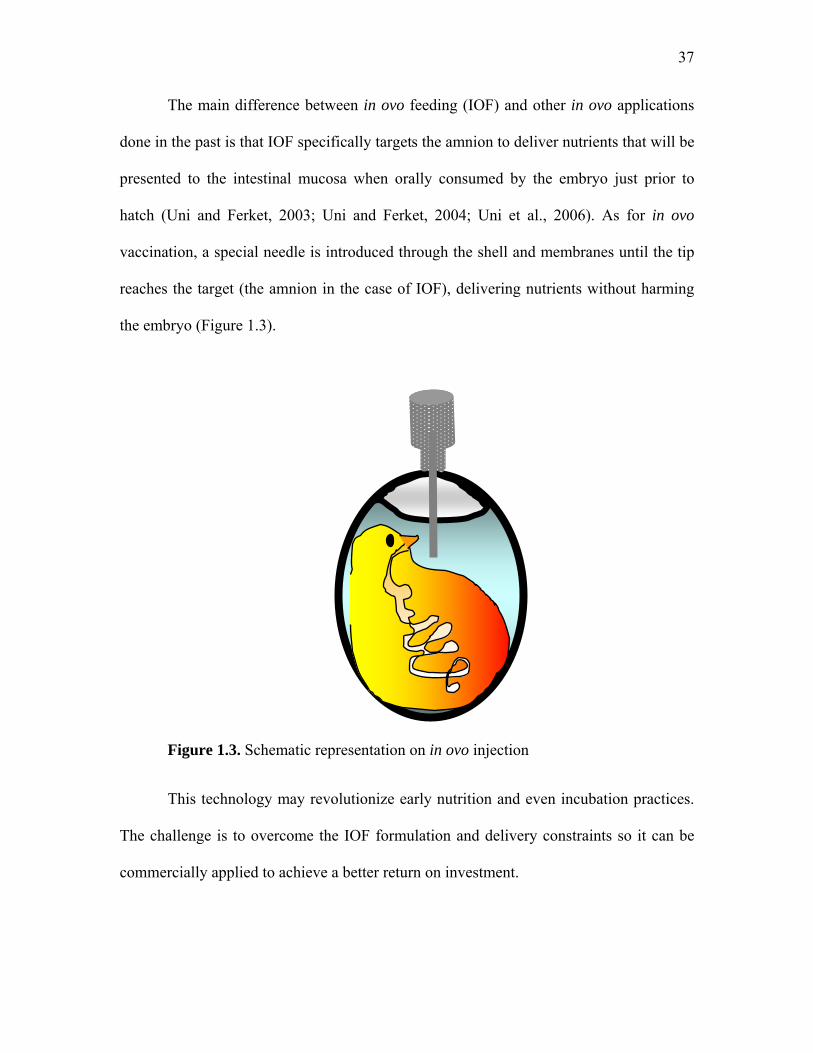
37
The main difference between in ovo feeding (IOF) and other in ovo applications
done in the past is that IOF specifically targets the amnion to deliver nutrients that will be
presented to the intestinal mucosa when orally consumed by the embryo just prior to
hatch (Uni and Ferket, 2003; Uni and Ferket, 2004; Uni et al., 2006). As for in ovo
vaccination, a special needle is introduced through the shell and membranes until the tip
reaches the target (the amnion in the case of IOF), delivering nutrients without harming
the embryo (Figure 1.3).
Figure 1.3. Schematic representation on in ovo injection
This technology may revolutionize early nutrition and even incubation practices.
The challenge is to overcome the IOF formulation and delivery constraints so it can be
commercially applied to achieve a better return on investment.
38
In ovo constraints
Enting et al., (2007) tested breeder diets with different nutrient densities and
concluded that available practical diets produced eggs with reduced egg white compared
to a control diet. The authors concluded that the amount of egg white in these eggs at the
time of lay was insufficient to sustain proper embryonic development. This is one
situation where IOF can be beneficial to the embryos. However, several technical
questions need to be addressed for IOF to succeed under commercial conditions: 1) what
is the best time to inject (embryo age or stage of development)? 2) how much volume can
or need to be injected? 3) what is the best osmolality of the solution so it will not harm
amnion/embryo osmotic balance? 4) what nutrients and how much can be in ovo fed
without increasing metabolic load or causing toxicity to the embryo? Therefore, questions
related to the physical constraints of the egg and metabolic constraints of the embryo
must be answered.
The idea of supplementing carbohydrates to chicks and poults into the amnion
before hatch may seem simple, but it is technologically difficult. As already mentioned,
just giving glucose in the drinking water to chicks at placement ended up being
detrimental because it suppressed gluconeogenic enzymatic activity (Donaldson, 1995).
So the kind of nutrient that can be in ovo fed and how it will affect embryonic
metabolism must be carefully studied.
A popular trade magazine asked the questions: “Can nutritionists find ways to put
more vitality into day-olds?”, and “Will it be via breeder feed or by direct application into
the egg?” (Horrox, 2006b). These seem to be fair questions to ask as we attempt to solve
39
the problems of low chick quality. But since it is difficult to influence egg composition
via hen nutrition, in ovo feeding offers an intriguing solution.
Effects of in ovo feeding
Preliminary in ovo feeding research
As disclosed in the patent by Uni and Ferket, (2003) in ovo feeding may include
the amnion supplementation of nutrients like protein, amino acids, carbohydrates,
vitamins, and enteric modulators (like beta-hydroxy-beta-methylbutyrate (HMB), organic
minerals, lectins, fatty acids and antioxidants in IOF formulations. HMB was chosen to
be the first enteric modulator to be tested. HMB is a metabolite of the essential amino
acid leucine that occurs naturally at about 5% of leucine metabolism through a minor
pathway (Foye, 2005).
Ferket et al. (2005) furthered knowledge on IOF constraints in a study of amnion
volume and pH of turkey eggs, and the effects of solution osmolality on hatchability. The
osmolality study tested saline solutions ranging from 150 to 1500 mOsm (milliosmoles),
and concluded that chick hatchability was optimum when solution osmolality was
between 400 to 600 mOsm, with unacceptable rates with solutions exceeding 800 mOsm.
Amnion volume of turkey eggs were on average 3.5 mL, pH=6.5 and osmolality 322
mOsm at 21 days of incubation, 2.0 mL, pH=6.5 and 322 mOsm on 22 days of
incubation, 1.0 mL, pH=7.3 and 318 mOsm at 23 days of incubation. Negligible amounts
of amnion were found from 24 days of incubation onto hatch. Based on these findings the
IOF solution volume limits for turkeys was determined to be between 1.0 and 2.0 mL,
injected at 23 days of incubation.
40
The original research disclosed in the patent (Uni and Ferket, 2003) included 8
trials using either chicken eggs, turkey eggs or both. The first trial tested the effect of
injecting increasing amounts of HMB (0 to 100 mcg) at 24 days of incubation on turkey
embryo hatchability, liver glycogen concentration, and plasma glucose concentration.
Supplementation of HMB has being shown to increase carcass quality of steers, reduce
early broiler mortality, and increase broiler chicken bodyweight, breast yield, and carcass
yield (Fuller and Nissen, 1994; Nissen et al., 1994; Van Koevering et al., 1994). The
conclusion of this research was that HMB concentrations between 0.1 and 1.0 mcg
increased hatchability, all doses increased liver glycogen, and 0.1 mcg resulted in highest
plasma glucose concentration. The second trial tested a more complex carbohydrate
solution composed of 10% sucrose, 10% maltose, 5% dextrin dissolved in 0.9% NaCl
solution. One milliliter of this formula was injected into the amnion of chicken embryos
on day 18 of incubation. Compared to the non-injected control eggs, IOF eggs showed no
effect on hatchability, but IOF yielded heavier chicks, with bigger and more mature
intestines. IOF birds maintained heavier weights until the end of the trial at 35 days of
age. The third trial used a formula containing 5% sucrose, 5% maltose and 15% dextrin
dissolved in 0.9% NaCl, also using same volume and embryonic age. This IOF treatment
resulted in chicks 3 to 5% heavier than the controls through 25 days of age. The forth trial
used the following formulation: 2.5% sucrose, 2.5% maltose, 12% dextrin, 8.25% egg
white protein, in 0.9% saline (NaCl), injected 1 mL in broiler chicken eggs on day 18 of
incubation. This formulation, simulating the nutrient composition of a typical chick diet,
resulted in 3 to 5% increase in body weight up to 14 days of age, as compared to control
chicks.

41
Turkey formulas were tested in the fifth trial with 24% egg white protein in 9%
saline, primarily because poults have a higher protein requirement than chicks. Two
milliliters of this formula were injected at 23 days of incubation. This IOF formula
increased body weights by 4 to 8% from 1 to 12 days post-hatch in comparison to control
poults. The next turkey formula (sixth trial) added some carbohydrates and HMB, with
composition including 5% maltose, 12% dextrin, 8.5% egg white protein and 0.1% HMB,
all dissolved in 0.9% saline solution. The volume injected was between 1 to 3 mL per
egg. Here the body weights IOF poults were 3 to 8% greater than controls. A simpler
formula containing 24% egg white protein and 0.1% HMB in 0.9% saline solution was
used in the seventh trial, and it resulted in poults 4 to 6% heavier then the controls up
until 24 days post-hatch. Finally, the last IOF formula tested had 5% maltose, 12%
dextrin, 8.5% egg white protein and 0.1% HMB in 0.9% saline injected in chicken eggs,
and 6% dextrin, 15% egg white protein, 0.1% HMB in 0.9% saline injected in turkey
eggs (1 and 2 mL/egg, respectively). These formulas increased chick hatchability by
15.6% and turkey hatchability by 17.5%, proving that IOF effectively helps hatchlings in
their struggle to emerge from the shell.
Based on these promising results, the patent was approved, and a Binational
Agriculture Research and Development Fund (http://www.bard-isus.com) grant was
shared between Dr. Uni2 and Dr. Ferket3 to further develop the technology. Uni’s
research concentrated on IOF of chickens, while Ferket’s group concentrated on IOF of
2 Hebrew University of Jerusalem, Rehovot 3 North Caroline State University, Raleigh, NC

42
turkeys. Subsequently, Pfizer-Embrex, Inc.4 joined the project to develop an automated
system capable to commercialize the IOF technology for the poultry industry.
Chicken in ovo feeding research
Since the early work by Uni and Ferket, (2003), considerable progress has been
made in identifying why or how IOF increases hatchability rate and body weights, as
described by a series of research publications. The first IOF paper was published by Tako
et al., (2004). In this study three IOF formulations were tested in chicken eggs: 1) CHO
solution (25 g of maltose/L, 25 g of sucrose/L, 200 g of dextrin/L, and 5 g of NaCl/L); 2)
HMB solution (1 g of HMB/L in 5 g of NaCl/L); and 3) CHO+HMB solution (25 g of
maltose/L, 25 g of sucrose/L, 200 g of dextrin/L, 1 g of HMB/L in 5 g of NaCl/L). The
control was a non-injected egg group. Each egg was injected with 1 mL of the respective
IOF solution at 17.5 days of incubation. The intestinal morphology results showed that
IOF birds had enhanced intestinal development by increasing villi size and
disaccharidases enzyme capacity. In comparison to controls, body weight of IOF chicks
increased 3.2% at hatch and 5.3% at 3 days post-hatch. The best results were found when
birds received HMB alone or with carbohydrates.
Uni et al. (2005) injected 1 mL of a solution containing 25g/L maltose, 25g/L
sucrose, 200g/L dextrin, 1g/L HMB and 5g/L NaCl, in 17.5 days of incubation chicken
eggs, in two separated trials. In comparison to the control, this IOF treatment increased
hatchability 5 to 6%, increased liver glycogen 2 to 5 fold, and increased pectoral muscle
size 6 to 8% among birds up to 25 days post-hatch. These authors concluded that IOF
4 Triangle Research Park, Durham, NC
43
HMB and carbohydrates at 17.5 days of incubation improved late-term embryo energy
status and post-hatch growth.
Tako et al. (2005) tested IOF zinc-methionine (ZnMet) as a metabolic effector for
chicken embryos. At 17 days of incubation, they injected 1 mL IOF solution containing
0.5g/L ZnMet and 5g/L NaCl, and compared it to a 5g/L NaCl saline control solution.
The ZnMet solution increased mRNA expression of the intestinal zinc transporter
(ZnT1), brush border enzymes activity, and increase in intestinal villus surface area 15 to
47%. The authors concluded that IOF ZnMet triggered the expression of genes involved
in digestion and absorption of amino acids and glucose, indicating greater intestinal
maturity.
In ovo feeding also affected chicken intestinal surface mucus production (Smirnov
et al., 2006). The mucus layer over the gastrointestinal tract mucosa serves as a diffusive
barrier, which protects the absorptive cells from pathogens, provides an adequate
environment for brush border enzymes to function, and facilitates nutrient absorption.
Mucus is made of mucin protein secreted by specialized cells called goblet cells. Smirnov
et al., (2006) in ovo fed chicken embryos 1mL/egg a test solution containing either
carbohydrates (15 g of maltose/L, 15 g of sucrose/L, 150 g of dextrin/L, and 5 g NaCl/L)
or a saline control solution (75 g of NaCl/L) at 17.5 days of incubation. These researchers
observed the carbohydrate-treated group had greater villus surface area from 19 days of
incubation until 3 days post-hatch, higher goblet cell density of jejunum villi, and higher
mucin gene expression than the saline-control birds. They concluded that the presence of
carbohydrate in the intestinal lumen of the chick embryo might be a trigger for the
number of goblet cells and their production of acidic mucin.
44
The later research confirm the earlier patent claims by Uni and Ferket, (2003) that
IOF enhances chick energy status and gut maturation, but the search for a commercially
feasible formulation with consistent results is yet to be done. Evidently, IOF formulations
containing carbohydrates and HMB do affect embryonic metabolism, which may not
always result in better hatchability or heavier body weights.
Turkey in ovo feeding research
The effects of HMB, egg white protein (EWP) and carbohydrates IOF to turkey
embryos were addressed by Foye et al., (2006). They injected eggs with 1.5 mL of the
respective IOF solutions on day 23 of incubation. The treatments were: 1) 18% EWP,
2)18% EWP + 0.1%HMB, 3) 0.1% HMB and 4) 20% dextrin + 0.3% maltose, all
dissolved in 0.9% NaCl solution. The control group was made of non-injected eggs. At
hatch, the IOF treatment groups were 6.0, 3.2 and 3.3% heavier than the controls for
treatments EWP, EWP+HMB, and HMB, respectively. This difference was not sustained
by 3 and 7 days post-hatch, with the exception of birds IOF HMB alone. The pectoral
muscle was larger for EWP and HMB treatments than controls only at day of hatch.
Feeding embryos protein increased liver glycogen reserves, while HMB and
carbohydrates increased muscle glycogen. The authors concluded that EWP stimulated
gluconeogenesis and glycogen storage in the liver, while HMB and carbohydrates caused
insulin release, shutting down gluconeogenesis yet stimulating muscle glucose uptake
and local glycogen storage. The effects on body weight were variable between the
treatments at different ages, with EWP giving the best weights at hatch, but lowest
weights at 7 days. Foye et al., (2006) concluded that future studies must be conducted to
determine the effects of IOF amino acids and their metabolites on carbohydrate

45
metabolism during avian development. Based on these findings, it is hard to predict
whether protein or carbohydrates would benefit turkey embryos the most. The effects of a
combination of protein and carbohydrates fed in ovo have also not yet been addressed.
In her dissertation Foye (2005) also tested the IOF effects of the amino acid
arginine in turkeys. Arginine was investigated as an IOF solution ingredient because
previous studies indicated that it can stimulate insulin secretion and thus could add value
to HMB and carbohydrates effects on insulin. Turkey eggs received 1.5 mL of IOF
solutions on day 23 of incubation. The treatments tested in a series of experiments
included saline solutions containing 0.7% arginine, 18% EWP with or without 0.1%
HMB, and 20% dextrin and 3% maltose. Contrary to the authors expectations, HMB did
not enhanced pectoral muscle glycogen or size as compared to the controls; arginine and
EWP with or without HMB increased liver glycogen at hatch, but not thereafter, and
body weight was increased during the first two weeks post-hatch. HMB, arginine and
EWP confirmed their role as gluconeogenic substrates by increasing glucose-6-
phosphatase activity. IOF carbohydrates enhanced activity of the brush border enzymes
sucrase-isomaltase (IS) and leucine aminopeptidase (LAP) at 7 days of age. HMB,
arginine, and EWP enhanced activity of the same brush border enzymes at hatch, in
addition to glucose transporter SGLT-1, peptide transporter Pept-1 and intestinal
enzymes maltase and aminopeptidase (AP). This response likely occurred because
arginine and HMB increased insulin-like growth factors (IGF-I and II) in plasma,
stimulating gut cells proliferation and maturation (Foye, 2005).
Moore (2005) tested the effect of IOF turkey embryos on pectoral muscle satellite
cell mitotic activity. IOF solutions injected contained just 0.4% NaCl (control) or 18%
46
EWP + 0.1% HMB in 0.4% NaCl solution. Each egg received 1.5 mL of the respective
IOF solution at 22 days of incubation. In ovo feeding HMB and EWP was expected to
increase satellite cell proliferation, but this effect was not among poults observed until 7
days post-hatch, nor was body weight, pectoral muscle size, or weight gain. The author’s
discussion emphasized that he may not have observed treatment differences because
these experimental poults had immediate access to feed and water after hatch, as opposed
to commercial industry poults are typically held for 24 to 48 hours without food or water.
Moore (2005) also stressed that he may have missed the chance to observe an IOF
treatment effect because the most important period of muscle cell proliferation occurs
between 25 days of incubation and 1 day post-hatch.
As observed among the in chicken IOF research, the effects of different IOF
solution ingredients do not always include increased body weights or better growth
performance.
Important Metabolic Pathways associated with Perinatal Nutrition
The effects of different IOF solution ingredients on chicks and turkey embryos are
not always predictable and simple to understand. The choice of IOF ingredients used was
based on the assumption that the nutrients should be similar to what the hatchling will be
fed after hatch in order to promote intestinal development and metabolic adaptation. The
embryo relies on gluconeogenesis as its energetic supply from hatch until feed intake
initiation (Donaldson, 1995). Foye (2005) demonstrated that IOF components
(carbohydrates and HMB) that induce insulin release impaired gluconeogenesis, while
protein and amino acids stimulated gluconeogenic enzymes. The embryo undergoes
radical changes as the end of the incubation approaches (Uni and Ferket, 2004). Just
47
before hatch, the hatchling’s full body size is reached, and it’s vital organ systems (e.g.
respiratory and digestive systems) must become functional (Moran, 2007). At that same
time, the embryo is engaging in the process of hatching. Because nutrients available to
the embryo are very limited just before hatch, an amazingly orchestrated sequence of
metabolic changes within a very short time. These metabolic changes determine which
pathway will be active, depending on substrate and oxygen availability. Little is known
about how these metabolic events occur and how they can be modified by management
and nutritional interventions. Thus, it is necessary to understand intermediary metabolism
of the late-term embryo before one can understand the impact in ovo feeding certain
nutrients or compounds.
The following section will introduce the major metabolic pathways related to
energy metabolism and briefly comment on the possible flux energetic substrates can
follow. The metabolic pathways of interest include glycolysis, gluconeogenesis, TCA
cycle, pentose phosphate pathway, glycogenesis, glycogenolysis, fatty acid synthesis and
fatty acid oxidation.
Glycolysis and gluconeogenesis
Glucose present in eukaryotic circulation is rapidly taken up by cells. Once inside
the cell, glucose can be used to generate energy or be stored as glycogen or fat.
Glycolysis and gluconeogenesis pathways with their respective enzymes are illustrated by
Figure 1.4. Glycolysis is the main pathway where glucose can be phosphorylated, so its’
destiny can be decided. The flux through a pathway is determined by the amount of
enzymes and its affinity for the substrate. Through glycolysis, glucose can be reduced to
2 pyruvate units plus 6 moles of ATP. Pyruvate can enter the TCA cycle for further
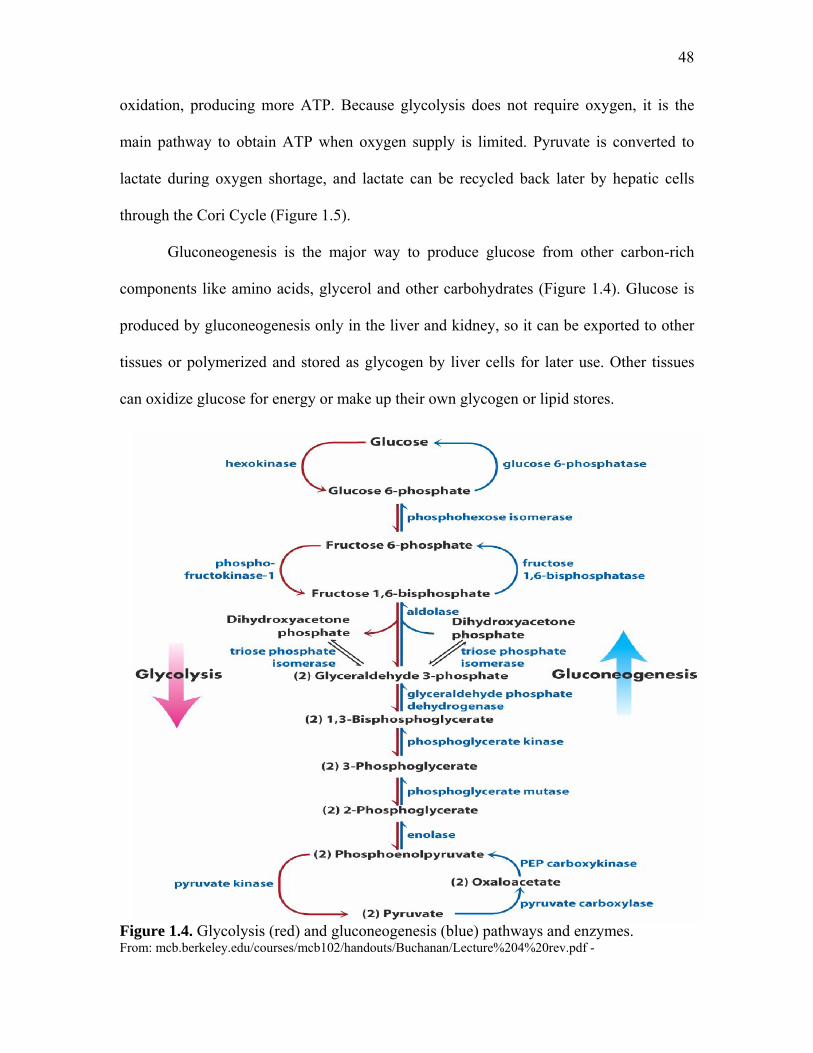
48
oxidation, producing more ATP. Because glycolysis does not require oxygen, it is the
main pathway to obtain ATP when oxygen supply is limited. Pyruvate is converted to
lactate during oxygen shortage, and lactate can be recycled back later by hepatic cells
through the Cori Cycle (Figure 1.5).
Gluconeogenesis is the major way to produce glucose from other carbon-rich
components like amino acids, glycerol and other carbohydrates (Figure 1.4). Glucose is
produced by gluconeogenesis only in the liver and kidney, so it can be exported to other
tissues or polymerized and stored as glycogen by liver cells for later use. Other tissues
can oxidize glucose for energy or make up their own glycogen or lipid stores.
Figure 1.4. Glycolysis (red) and gluconeogenesis (blue) pathways and enzymes. From: mcb.berkeley.edu/courses/mcb102/handouts/Buchanan/Lecture%204%20rev.pdf -
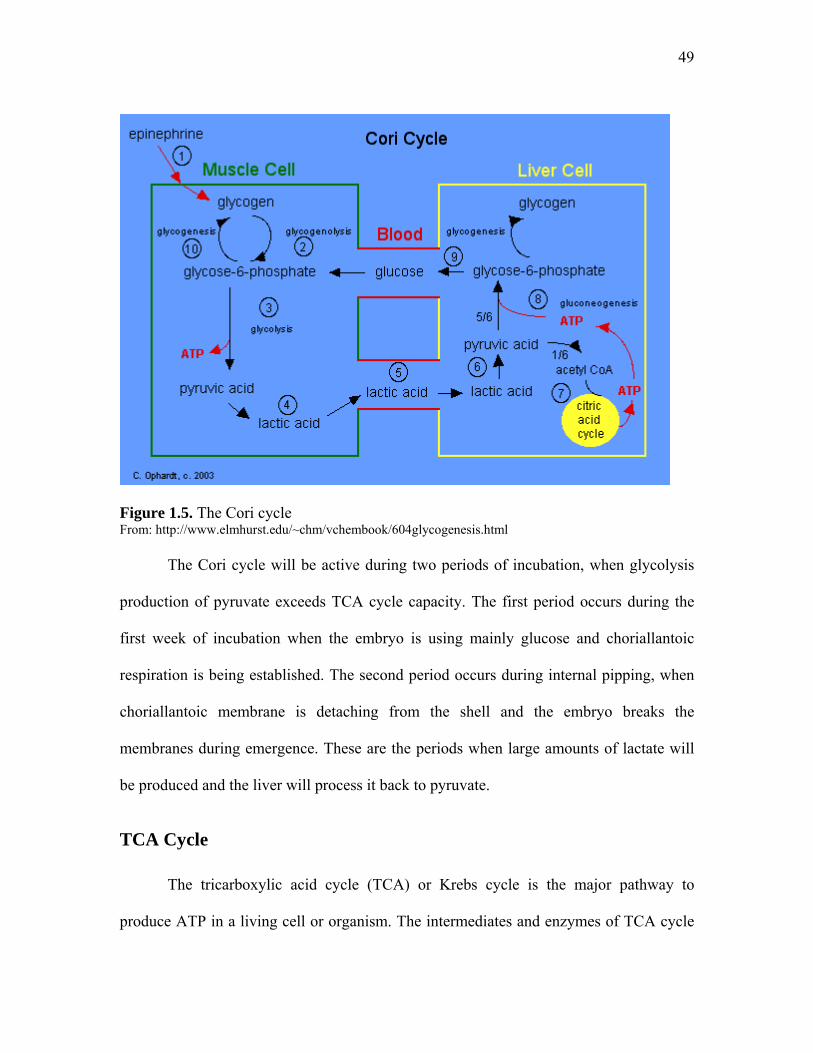
49
Figure 1.5. The Cori cycle From: http://www.elmhurst.edu/~chm/vchembook/604glycogenesis.html
The Cori cycle will be active during two periods of incubation, when glycolysis
production of pyruvate exceeds TCA cycle capacity. The first period occurs during the
first week of incubation when the embryo is using mainly glucose and choriallantoic
respiration is being established. The second period occurs during internal pipping, when
choriallantoic membrane is detaching from the shell and the embryo breaks the
membranes during emergence. These are the periods when large amounts of lactate will
be produced and the liver will process it back to pyruvate.
TCA Cycle
The tricarboxylic acid cycle (TCA) or Krebs cycle is the major pathway to
produce ATP in a living cell or organism. The intermediates and enzymes of TCA cycle
50
are illustrated by Figure 1.6. Pyruvate is converted to acetyl-CoA which enters the cycle
forming citrate. As citrate is converted to several intermediates, energy-rich molecules of
NADH, GTP and FADH2 are produced. NADH and FADH2 are reducing equivalents that
will later result in 24 ATP produced for each glucose unit through the electron transport
chain. Other than producing energy, the TCA cycle may receive or donate intermediaries
to other pathways. Carbon backbones from many origins enter the TCA cycle in different
points as one of the intermediates. Because oxidative production of ATP requires oxygen,
the TCA cycle flux is limited by oxygen availability. When lipids are mobilized from
fats, fatty acids produce acetyl-CoA which enters the TCA to produce energy. Because
two carbon units are lost as CO2 through TCA cycle, and acetyl-CoA has 2 carbons, fatty
acids can not be converted back to glucose through gluconeogenesis.
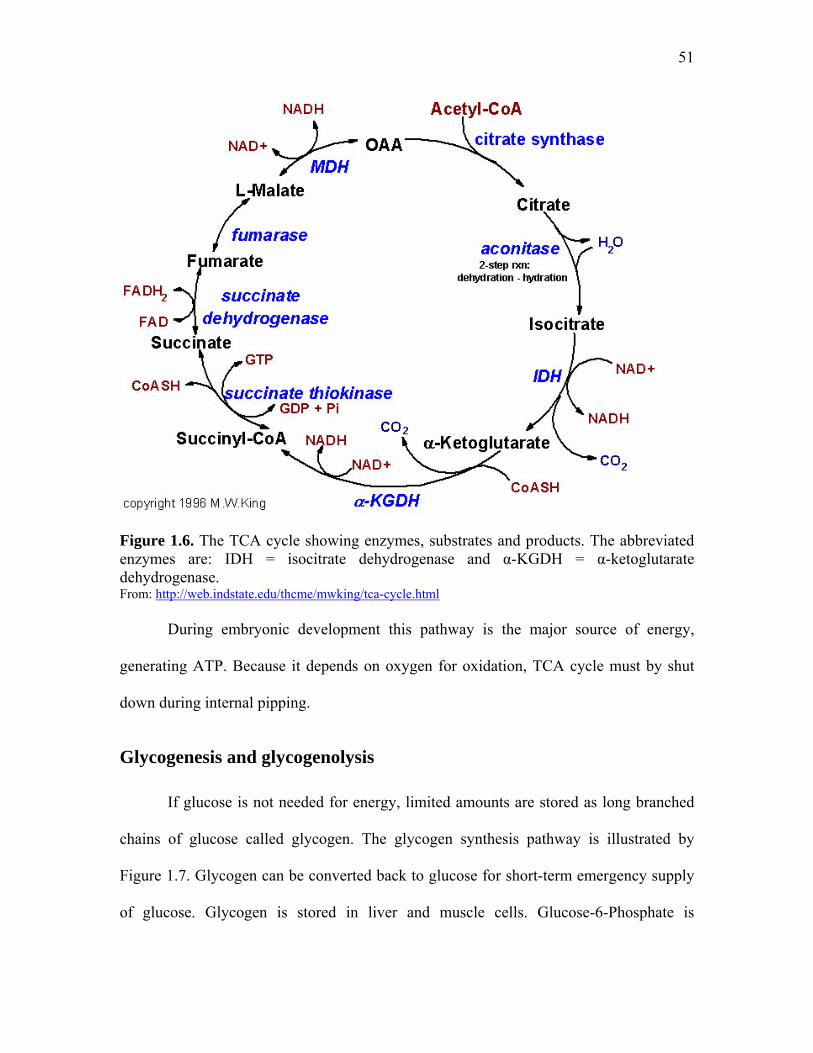
51
Figure 1.6. The TCA cycle showing enzymes, substrates and products. The abbreviated enzymes are: IDH = isocitrate dehydrogenase and α-KGDH = α-ketoglutarate dehydrogenase. From: http://web.indstate.edu/thcme/mwking/tca-cycle.html
During embryonic development this pathway is the major source of energy,
generating ATP. Because it depends on oxygen for oxidation, TCA cycle must by shut
down during internal pipping.
Glycogenesis and glycogenolysis
If glucose is not needed for energy, limited amounts are stored as long branched
chains of glucose called glycogen. The glycogen synthesis pathway is illustrated by
Figure 1.7. Glycogen can be converted back to glucose for short-term emergency supply
of glucose. Glycogen is stored in liver and muscle cells. Glucose-6-Phosphate is
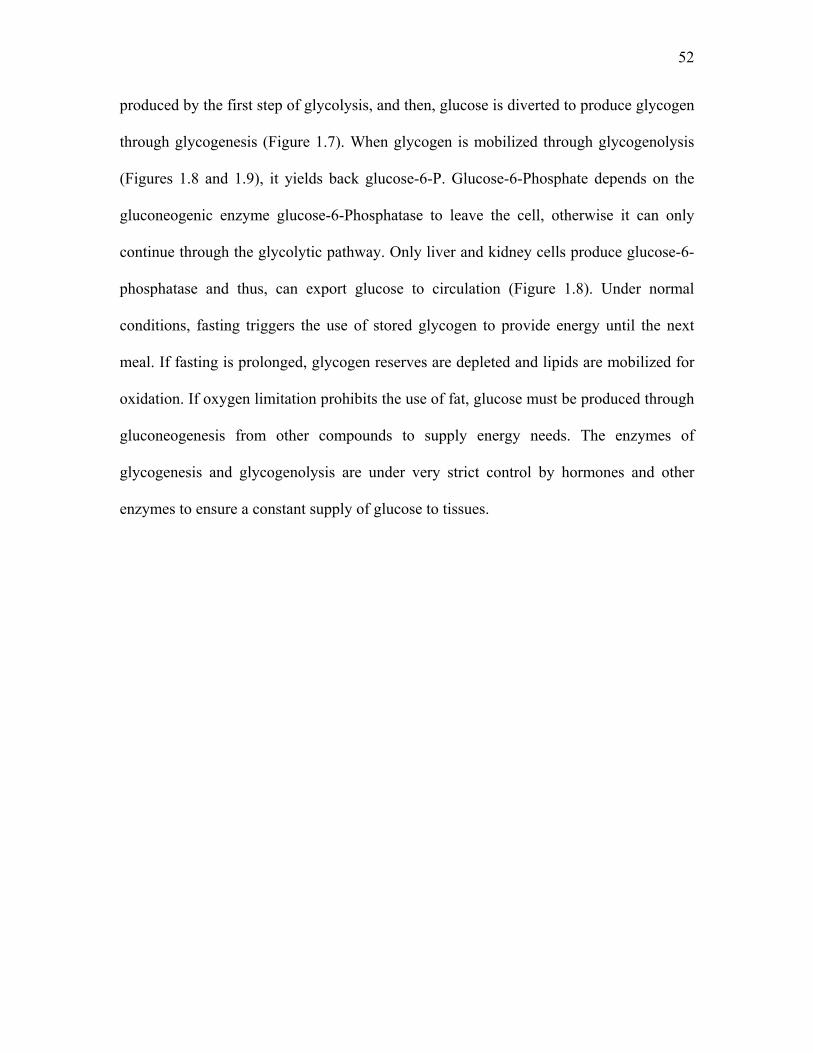
52
produced by the first step of glycolysis, and then, glucose is diverted to produce glycogen
through glycogenesis (Figure 1.7). When glycogen is mobilized through glycogenolysis
(Figures 1.8 and 1.9), it yields back glucose-6-P. Glucose-6-Phosphate depends on the
gluconeogenic enzyme glucose-6-Phosphatase to leave the cell, otherwise it can only
continue through the glycolytic pathway. Only liver and kidney cells produce glucose-6-
phosphatase and thus, can export glucose to circulation (Figure 1.8). Under normal
conditions, fasting triggers the use of stored glycogen to provide energy until the next
meal. If fasting is prolonged, glycogen reserves are depleted and lipids are mobilized for
oxidation. If oxygen limitation prohibits the use of fat, glucose must be produced through
gluconeogenesis from other compounds to supply energy needs. The enzymes of
glycogenesis and glycogenolysis are under very strict control by hormones and other
enzymes to ensure a constant supply of glucose to tissues.
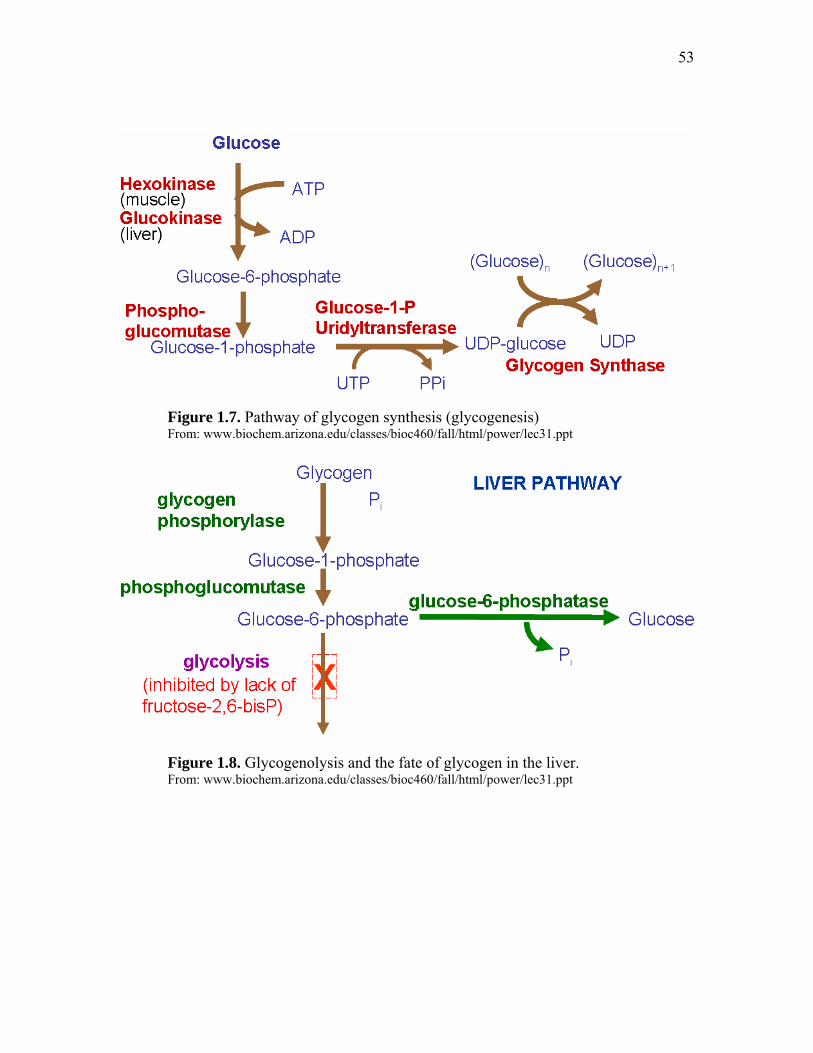
53
Figure 1.7. Pathway of glycogen synthesis (glycogenesis) From: www.biochem.arizona.edu/classes/bioc460/fall/html/power/lec31.ppt
Figure 1.8. Glycogenolysis and the fate of glycogen in the liver. From: www.biochem.arizona.edu/classes/bioc460/fall/html/power/lec31.ppt
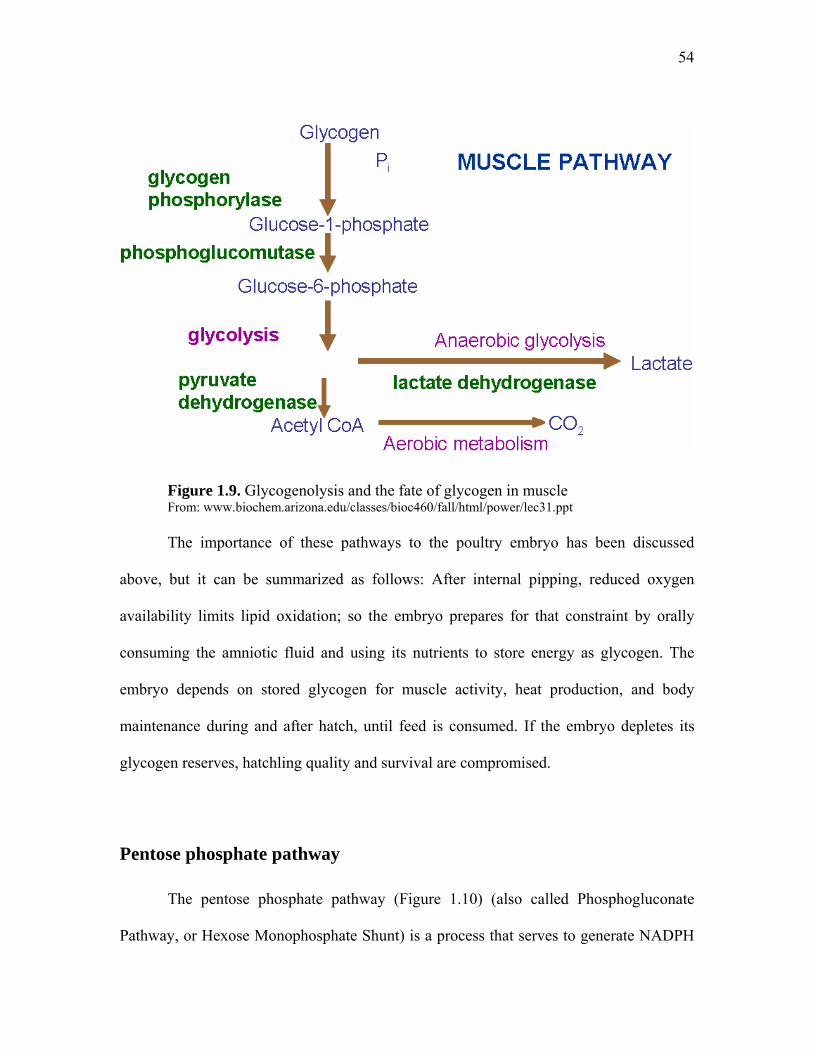
54
Figure 1.9. Glycogenolysis and the fate of glycogen in muscle From: www.biochem.arizona.edu/classes/bioc460/fall/html/power/lec31.ppt The importance of these pathways to the poultry embryo has been discussed
above, but it can be summarized as follows: After internal pipping, reduced oxygen
availability limits lipid oxidation; so the embryo prepares for that constraint by orally
consuming the amniotic fluid and using its nutrients to store energy as glycogen. The
embryo depends on stored glycogen for muscle activity, heat production, and body
maintenance during and after hatch, until feed is consumed. If the embryo depletes its
glycogen reserves, hatchling quality and survival are compromised.
Pentose phosphate pathway
The pentose phosphate pathway (Figure 1.10) (also called Phosphogluconate
Pathway, or Hexose Monophosphate Shunt) is a process that serves to generate NADPH
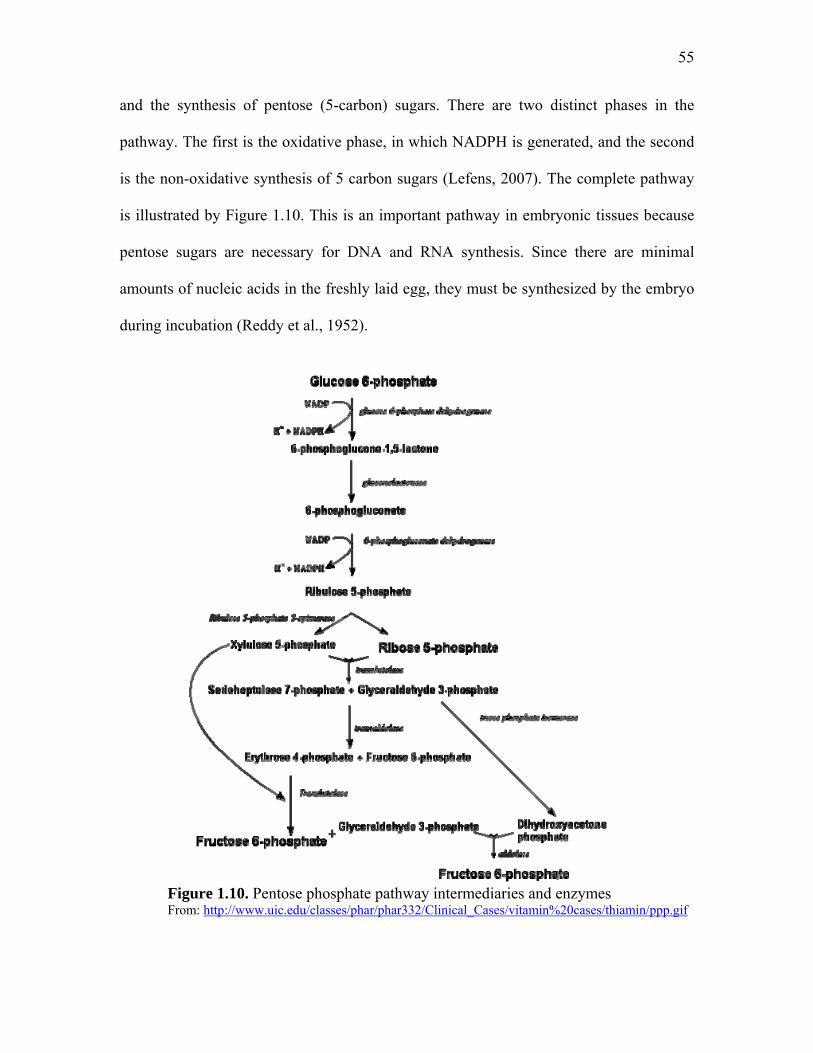
55
and the synthesis of pentose (5-carbon) sugars. There are two distinct phases in the
pathway. The first is the oxidative phase, in which NADPH is generated, and the second
is the non-oxidative synthesis of 5 carbon sugars (Lefens, 2007). The complete pathway
is illustrated by Figure 1.10. This is an important pathway in embryonic tissues because
pentose sugars are necessary for DNA and RNA synthesis. Since there are minimal
amounts of nucleic acids in the freshly laid egg, they must be synthesized by the embryo
during incubation (Reddy et al., 1952).
Figure 1.10. Pentose phosphate pathway intermediaries and enzymes From: http://www.uic.edu/classes/phar/phar332/Clinical_Cases/vitamin%20cases/thiamin/ppp.gif
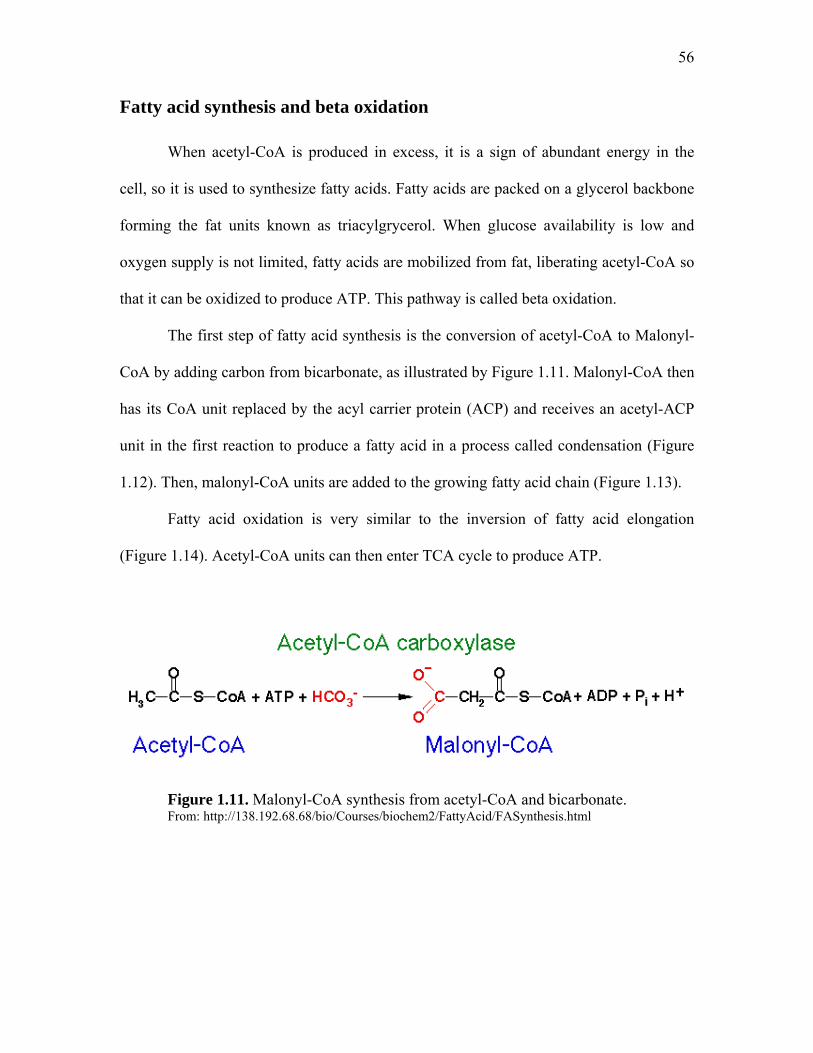
56
Fatty acid synthesis and beta oxidation
When acetyl-CoA is produced in excess, it is a sign of abundant energy in the
cell, so it is used to synthesize fatty acids. Fatty acids are packed on a glycerol backbone
forming the fat units known as triacylgrycerol. When glucose availability is low and
oxygen supply is not limited, fatty acids are mobilized from fat, liberating acetyl-CoA so
that it can be oxidized to produce ATP. This pathway is called beta oxidation.
The first step of fatty acid synthesis is the conversion of acetyl-CoA to Malonyl-
CoA by adding carbon from bicarbonate, as illustrated by Figure 1.11. Malonyl-CoA then
has its CoA unit replaced by the acyl carrier protein (ACP) and receives an acetyl-ACP
unit in the first reaction to produce a fatty acid in a process called condensation (Figure
1.12). Then, malonyl-CoA units are added to the growing fatty acid chain (Figure 1.13).
Fatty acid oxidation is very similar to the inversion of fatty acid elongation
(Figure 1.14). Acetyl-CoA units can then enter TCA cycle to produce ATP.
Figure 1.11. Malonyl-CoA synthesis from acetyl-CoA and bicarbonate. From: http://138.192.68.68/bio/Courses/biochem2/FattyAcid/FASynthesis.html
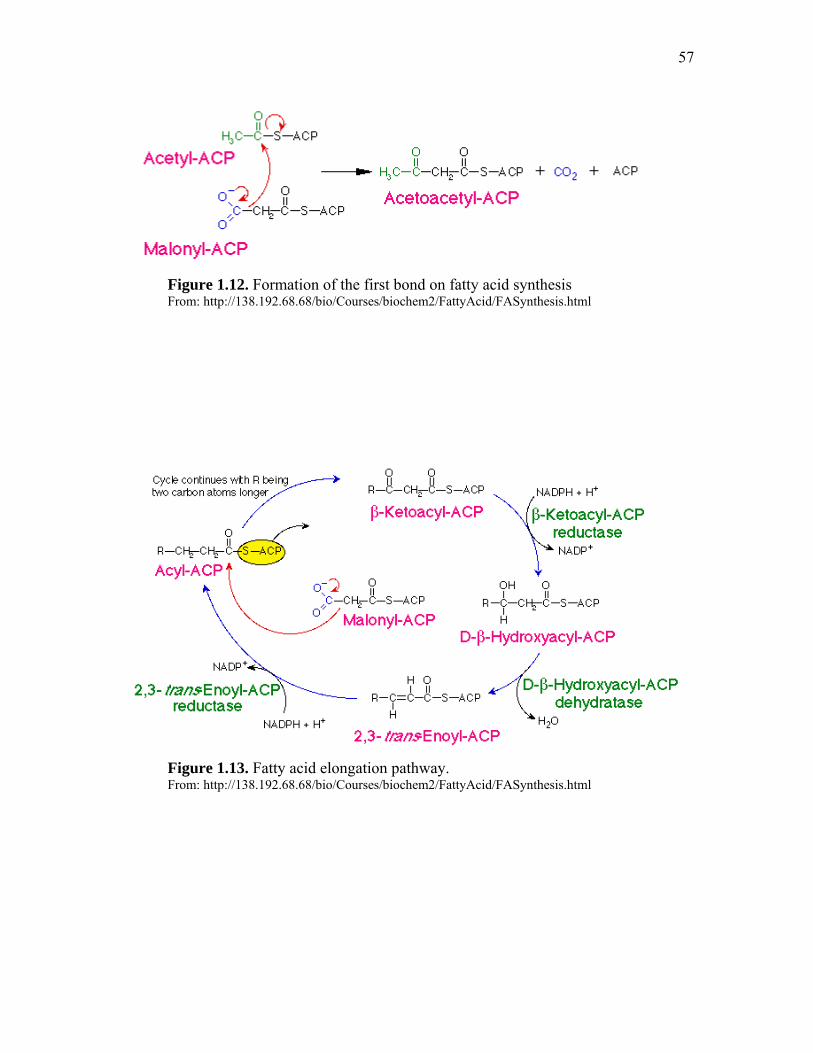
57
Figure 1.12. Formation of the first bond on fatty acid synthesis From: http://138.192.68.68/bio/Courses/biochem2/FattyAcid/FASynthesis.html
Figure 1.13. Fatty acid elongation pathway. From: http://138.192.68.68/bio/Courses/biochem2/FattyAcid/FASynthesis.html
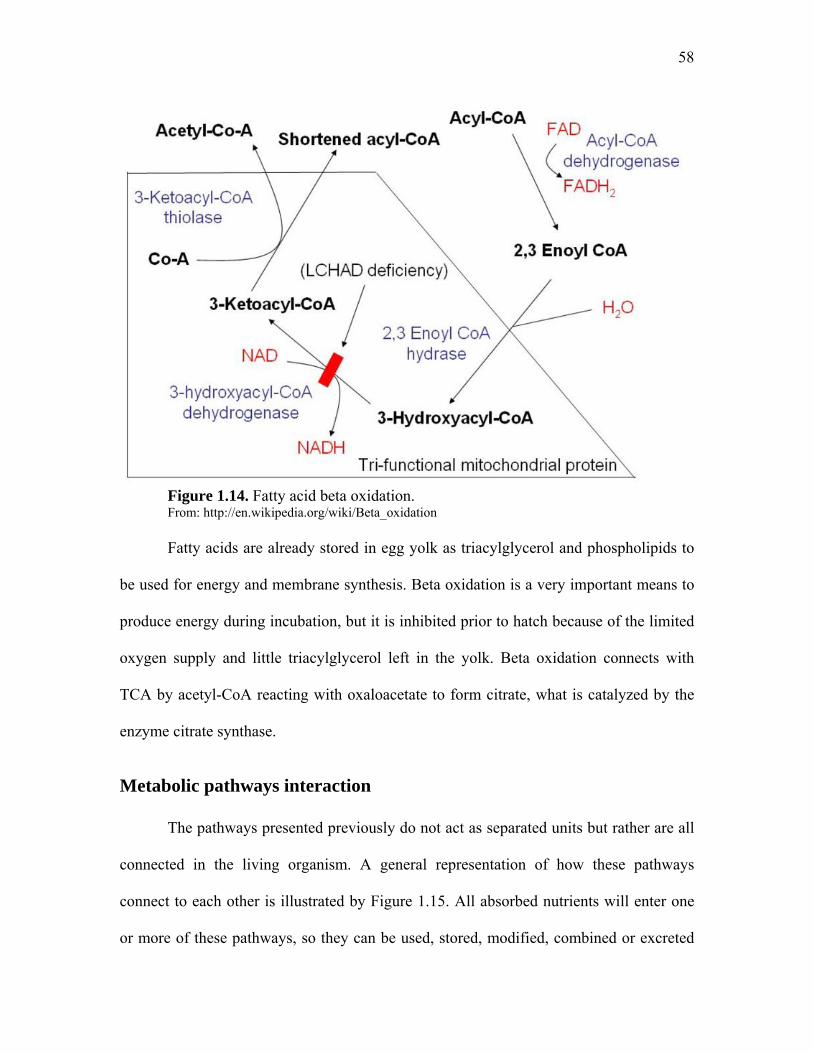
58
Figure 1.14. Fatty acid beta oxidation. From: http://en.wikipedia.org/wiki/Beta_oxidation Fatty acids are already stored in egg yolk as triacylglycerol and phospholipids to
be used for energy and membrane synthesis. Beta oxidation is a very important means to
produce energy during incubation, but it is inhibited prior to hatch because of the limited
oxygen supply and little triacylglycerol left in the yolk. Beta oxidation connects with
TCA by acetyl-CoA reacting with oxaloacetate to form citrate, what is catalyzed by the
enzyme citrate synthase.
Metabolic pathways interaction
The pathways presented previously do not act as separated units but rather are all
connected in the living organism. A general representation of how these pathways
connect to each other is illustrated by Figure 1.15. All absorbed nutrients will enter one
or more of these pathways, so they can be used, stored, modified, combined or excreted
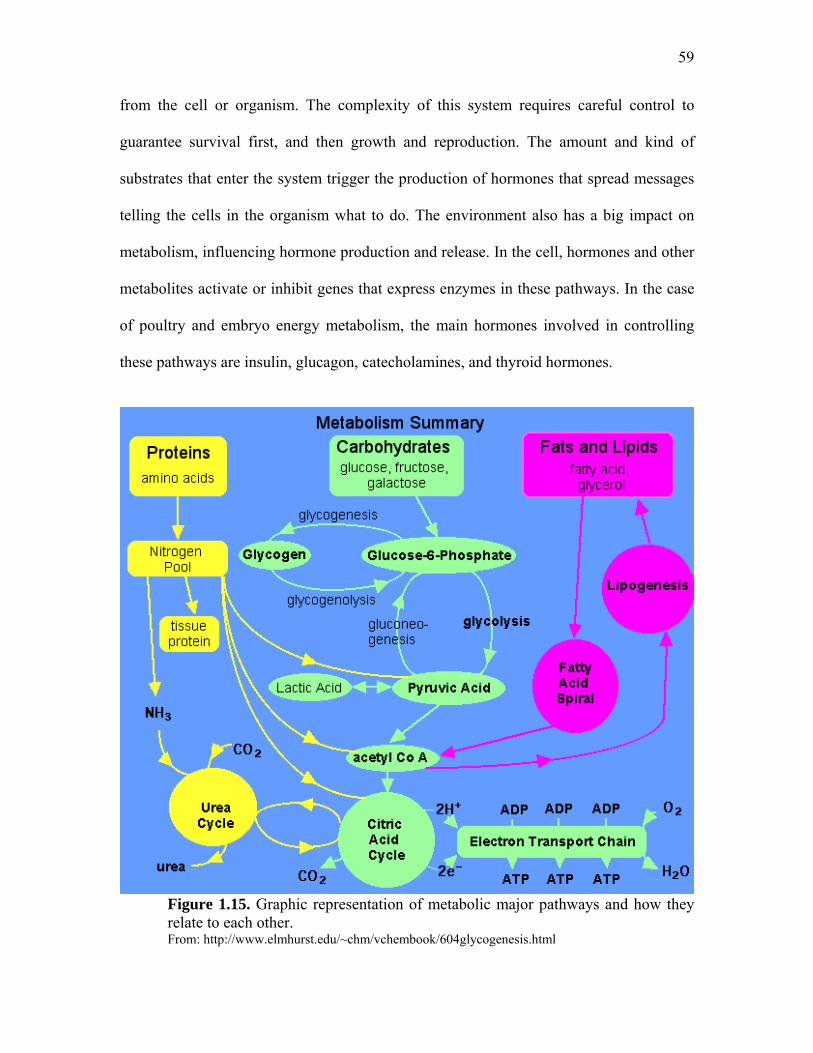
59
from the cell or organism. The complexity of this system requires careful control to
guarantee survival first, and then growth and reproduction. The amount and kind of
substrates that enter the system trigger the production of hormones that spread messages
telling the cells in the organism what to do. The environment also has a big impact on
metabolism, influencing hormone production and release. In the cell, hormones and other
metabolites activate or inhibit genes that express enzymes in these pathways. In the case
of poultry and embryo energy metabolism, the main hormones involved in controlling
these pathways are insulin, glucagon, catecholamines, and thyroid hormones.
Figure 1.15. Graphic representation of metabolic major pathways and how they relate to each other. From: http://www.elmhurst.edu/~chm/vchembook/604glycogenesis.html
60
Hormonal control of poultry embryo metabolism
Genome wide analysis identified insulin, glucagon, T3, T4, IGF-I, IGFII genes as
being most involved in metabolism, affecting phenotypic traits in chickens (Zhou et al.,
2007b).
Insulin and glucagon are closely related to energy in all tissues of the bird (Lu et
al., 2007). These hormones are produced by the pancreas and their release into blood
circulation depends on the animal’s energy status. Insulin is the hormone released after a
meal, signaling abundance of circulating glucose. It permits cells throughout the body to
uptake glucose and cause the synthetic processes to occur. Insulin stimulates glycolysis,
TCA cycle, glycogenesis and fatty acid synthesis. Glucagon is the hormone of fasting,
indicating low glucose availability, so only cells that rely of glucose as their only
energetic substrate will take it. Glucagon also triggers glycogen and fat mobilization
throughout the body. In the liver, gluconeogenesis is stimulated by glucagon to produce
glucose from other substrates so it can be made available to other tissues through
circulation.
Lu et al. (2007) summarized what is known about these hormones in poultry
embryos. In chicken embryos, insulin regulates the concentration of amino acids and
related compounds in plasma, amniotic fluid, and allantoic fluid. It also accelerates
embryonic morphological development. Other then insulin, the same gene also expresses
insulin like growth factors I and II (IGF-I and IGF-II). In poultry as in mammal species,
these IGFs stimulate growth, development and intermediary metabolism. Specifically
important, IGF-I and II stimulate hepatic glycogen, RNA and protein synthesis. IGFs
were also found in amniotic fluid, where they may play a role in regulating amino acid
61
compounds. Their research found that insulin levels increased significantly as the embryo
ages, reaching a plateau during pipping and hatching, and rising again 24 hours after the
chick starts feeding. Parallel to that pattern, glucagon levels are low throughout
incubation, and then start rising three days before hatch, peaking during pipping and
hatching. Glucagon levels drop by 40% 24 hours after the chick starts feeding. Plasma
glucose levels follow the insulin pattern, increasing throughout incubation, and plateau
during pipping and at hatching. A significantly reduction in plasma glucose levels
happens 4 days prior to hatch. Concurrently, there is a peak on insulin levels along with
amnion consumption by the embryo and glycogen accumulation in liver and muscle
tissues. IGF-I levels increase during incubation, but are reduced during hatch. After
hatch, IGF-I levels rapidly increase and keep increasing all the way until 21 days post-
hatch. IGF-I levels have been identified as important factors in stimulating intestinal
mucosa growth and cell maturation (Foye, 2005). IGF-II levels also increases during
incubation and remain much higher than IGF-I all the way until hatch, when it quickly
drops to very low levels. This indicates that IGF-II may play a bigger role in growth and
development during incubation, while IGF-I becomes the major player after hatch.
Because embryo growth hormone levels are low during incubation, Lu et al.
(2007) hypothesized insulin’s role as a possible growth factor for the embryo. They found
indications of insulin acting as an important promoter of protein deposition during the
period of rapid embryonic growth. Moreover, insulin levels are much more sensitive to
amino acids than to carbohydrate levels in chick embryos. This makes sense since there is
very little glucose in the egg as compared to high levels of amino acids in the amnion and
albumen.
62
Glucagon appears to be the dominant pancreatic hormone in birds, maintaining
them in constant hyperglycemia. Glucagon levels in avian plasma are 2 to 3 times greater
than in mammals. Glucagon rises when the embryo need of glucose is increased,
precisely during the first 10 days of incubation and during the last week before hatch (Lu
et al., 2007). Lu et al. (2007) confirmed previous research by Picardo and Dickson (1982)
claiming that hepatocytes’ mobilization of glycogen is not affected by insulin levels 3
days before hatch, which could grant liver cells capacity to synthesize and utilize
glycogen simultaneously. Glucagon also plays a role during the embryonic transition
from lipid to carbohydrate metabolism, as Langslow et al. (1979) proposed adipocytes
became sensitive to glucagon levels only after hatch. This is important so that
subcutaneous adipose stores are not used until the first day post-hatch. In contrast to other
species or among chickens post-hatch, glucagon levels may be low or high during rapid
growth stages of incubation, so it seems to function as an embryonic growth-stimulating
factor in a complex way or by interacting with other hormones (Lu et al., 2007). In
simple terms, Langslow et al. (1979) concluded that chick embryos could be in a fasting
status, while hatched chicks may be in a feasting status hormone wise.
Last, but not least in importance, are the thyroid hormones thiiodothyronine (T3)
and thyroxine (T4), which are involved in numerous physiological processes, including
regulation of heat production, mobilization of glycogen reserves, embryo muscle growth
(Christensen et al., 1996), and stimulus for hatching (Christensen and Biellier, 1982;
Christensen et al., 1982; Christensen et al., 2003b; Christensen et al., 2003c). Lu et al.
(2007) observed constant levels of T3 during mid incubation, but it peaked the day before
hatch. T4 levels reached high levels and stayed high during amnion consumption

63
(between days 17 and 20 of incubation), decreasing after hatch. Elevated thyroxine
levels are considered important for stimulating a variety of developmental and metabolic
processes necessary for hatching. The sharp rise in T3 was associated to embryonic
switching to lung respiration. Both T3 and T4 are positively correlated with embryonic
body weight during late incubation (Lu, et al., 2007).
Lu et al. (2007) concluded that the most important hormones contributing to
growth are insulin and IGF-II during embryogenesis, and IGF-I and T4 from hatch to 3
weeks post-hatch. Glucagon modifies growth and function, while thyroid hormones are
critical for hatching. The relationship between energy status and the endocrine system
during early development is not completely understood, and it requires further study (Lu
et al., 2007).
Studying Nutrition Through Gene Expression
Era post chicken genome
The chicken genome was completed and published in 2004, granting the chicken
with the title of first farm animal to have its genome sequenced (Lamont, 2006; Siegel et
al., 2006). A new era in poultry research started with the completion of the chicken
genome, opening the door to innumerable applications (Lamont, 2006).
Even before Mendelian theory of genetic selection was suggested, chickens
already had a proud history in practical genetics, qualifying them to be the first to be
sequenced. The available genome sequence place the chicken as member of the “elite
club” of species that can use full power modern genomic technology. Now it is possible
64
to map and assay the genotype with great precision, and we are just starting to
accumulate data on expression patterns of all genes (Siegel et al., 2006).
Methods of measuring gene expression
The best way to study intermediary metabolism would be by measuring the
present amount of proteins in a cell or organism (Spielbauer and Stahl, 2005), including
enzymes, hormones and structural components. Proteins are produced by gene
expression. The science of producing a quantitative representation of the complete
protein expression pattern of a cell, a tissue, an organ or an organism under exactly
defined conditions is called proteomics (Spielbauer and Stahl, 2005). Genes in the DNA
sequence are transcribed into messenger RNA (mRNA), and then mRNA is translated
into proteins. Parameters like mRNA stability, protein degradation, post-translational
modifications and others prevent making a statement over the current amount of
measured protein, because the classical molecular biology still can not make a strict
connection between the amount of mRNA and protein (Spielbauer and Stahl, 2005). The
discovery of a method to reverse transcribe RNA into stable DNA opened the door to the
new world of the science called transcriptomics. Now RNA expression patterns can be
produced, and functional genomics is trying to correlate transcriptomics to protein
amounts and function (Spielbauer and Stahl, 2005).
During the early 1990s, a protocol was perfected to synthesize small segments of
DNA in laboratory in what was called polymerase chain reaction (PCR). In time, PCR
was expanded to include amplifying RNA molecules as their complementary DNA
(cDNA), in a procedure termed “reverse transcriptase” or RT-PCR. This reaction mimics
65
the process used by viruses to synthesize DNA from an RNA template. The enzyme able
to perform this task is reverse transcriptase. Through reverse transcription unstable
mRNA turns into more stable cDNA, creating a powerful tool for examining the entire
population of mRNAs expressed in a cell at a particular time (Harris, 2000).
The first step to study mRNA populations is to isolate the RNA from all other cell
components. RNAs are very sensitive to enzymatic degradation. To protect RNA from
degradation, tissues can be treated in two ways: snap-freezing in liquid nitrogen, or
immersion in a powerful RNAse inhibitor, such as TRIzol or RNA-Later buffers (Garosi
et al., 2005). The purified RNA extract can be studied in many ways, like RT-PCR, real
time PCR, Northern Blot and microarrays (Harris, 2000; Yadetie et al., 2004; Spielbauer
and Stahl, 2005).
One of the most powerful tools in molecular biology is the polymerase chain
reaction (PCR). With time, several adaptations of the original protocol that used DNA as
a template appeared in the literature, including the possibility to use mRNA as template
(RT-PCR), rapid amplification of cDNA ends (RACE), competitive PCR, real-time PCR,
Taqman5, SYBR green and hybridization probes (Ruiz and Bok, 1993; Wiseman, 2002).
All of those are variations of the same principle can be used to make many copies of
DNA or RNA using unspecific (random) primers, or copies of one specific gene using
specific primers. With every cycle, the PCR products exponentially increase in number
(Wiseman, 2002) until they can be detected. Real time PCR is one way to quantify the
amount of specific genes by comparing the increasing number of copies of a desired
sequence versus the ones of a constantly expressed house-keeping gene (Wiseman,
2002). It can also be used to compare expression of total RNAs from different origins to 5 Applied Biosystems, Foster City, CA
66
identify which genes are differently expressed (Harris, 2000). This technique is still one
of the most used ways to study gene expression, but it has some limitations. One of the
biggest concerns when doing PCRs is contamination. Because it works by making many
copies of small amounts of RNA or DNA, even the smallest contamination with foreign
sequences can completely compromise the results, giving false positives or negatives
results. It can also amplify RNAs that were not meant to be translated, like products of
degradation (Harris, 2000). Another problem with PCR is that if the ideal conditions for
that specific reaction are not matched, like number of cycles, correct dye, amount of
sample, amount of primers and amount of reagents, no product is obtained. For this
reason, RT-PCR requires extensive optimization and validation before it can be
successfully used (Yadetie et al., 2004). Test sensitivity is another issue, with big
variation when results form different laboratories are compared (Wiseman, 2002). Others
reported PCR-related problems include staining, densitometry, imaging, heteroduplex
formation between target and standard, and the use of complicated nonsymmetrical
detection algorithms (Wiseman, 2002). For all these reasons, plus cost and time,
researchers must limit the number of samples and genes that can be studied by PCR
(Wiseman, 2002).
Northern Blot was another method created to identify and quantify RNAs (Zhan
et al., 1997). In Northern blotting, agarose gel electrophoresis of RNA is followed by
transfer of the RNA onto porous solid supports, typically nylon or nitrocellulose
membranes, so they can be scanned for identification. Quantification can also be done by
dot/slot blot hybridization with probes performed after transfer to membrane without size
separation (Yadetie et al., 2004). It works by blotting the gel onto a filter and hybridized
67
with a target to detect a particular species of mRNA as a distinct band or spot (van Zyl,
2005). The advantage of this technique over PCR is that it does not require much
optimization and validation (Yadetie et al., 2004). The limitations of this technique are
that it is very laborious and time consuming (Sato et al., 1993; Yadetie et al., 2004), and
sensitive non-radioactive assays are still being perfected (Sato et al., 1993; Zhan et al.,
1997; Yadetie et al., 2004), so only a small number of genes can be studied at a time
(Yadetie et al., 2004).
After the year 2000, a new technology became available, called microarrays (Page
et al., 2003). Microarray experiments rely on the same principle of hybridization (base
paring) used in Northern blotting, so it is sometimes referred to as “reverse Northerns”
(van Zyl, 2005). Oligonucleotides or cDNAs are spotted (probes) onto nylon filters or
glass slides and hybridized with a target made from an mRNA population of interest.
Usually, targets are made by reverse-transcribing mRNA into single-stranded cDNA in
the presence of labeled nucleotides (van Zyl, 2005). The biggest advantage of
microarrays over traditional methods for gene expression analysis, such as RT-PCR,
Northern blotting or real time PCR, is that a large number of genes can be measured in a
single assay (Spielbauer and Stahl, 2005). Printing a large number sequence spots in a
very small area in a specific pattern required automation and precision that could only be
achieved by robotics, so the principles of microarray technology are miniaturization,
parallelization and automation (Spielbauer and Stahl, 2005). Thanks to that, researchers
are now able to study thousands of genes in one experiment, creating a “still picture” of
the mRNAs present in a cell culture, plan or animal tissue, or even a whole organism at a
determined time point (Harris, 2000).
68
The ability to access information about a great number of genes is especially
advantageous to study complex metabolic patterns. Entire pathways can have their
enzymes mapped to determine the possible flux of metabolites. The possible applications
of microarray technology in nutritional studies will be discussed next.
Microarray technology and its application in nutritional studies
Microarrays are used to survey thousand of genes in single experiment. The
output of a microarray experiment is called a “gene expression profile” (Gibson, 2003).
The core principle relies on the fact that the amount of transcript can be estimated by the
amount hybridized to a complementary probe. Each probe represents the complement of
at least a part of a transcript that might be expressed in a tissue (Gibson, 2003).
Dr. Harris explained the microarray technique as fixing cDNAs or oligos
containing a particular sequence referred as “expressed sequence tag” (EST) to a glass
slide, while mRNA samples from a tissue is converted to corresponding cDNA and
labeled with either Cy3 or Cy5 fluorescent dye. When fluorescent cDNAs from 2 samples
labeled with different dyes are hybridized together on the slide, the specific product that
corresponds to the ESTs in the DNA array pairs with it and can be measured by scanning
the slide. The slide is scanned with 2 different wave lengths, so Cy3 fluoresces green and
Cy5 fluoresces red. Various degrees of red and green can be measured by the scanner, so
a probe favoring either color is a sign of differential expression of that population of
mRNAs (Harris, 2000). In hybridization arrays, the DNA with a defined identity tethered
to a solid medium is referred to as ‘probe’ and the labeled DNA as ‘target’ (Spielbauer
and Stahl, 2005).
69
The steps involved in a microarray experiment include RNA extraction, labeling,
microarray construction, hybridization, scanning and statistical analysis (Harris, 2000,
Gibson, 2003; Bauer et al., 2004; Garosi et al., 2005; Spielbauer and Stahl, 2005).
RNA extraction and quality control
RNA quantity and quality are vitally important to assure reliability and
reproducibility of the results (Harris, 2000). Already discussed was how careful RNA
must be manipulated to avoid RNAse degradation. Even with all care, different tissues
yield different quantities of RNA. The final extract must be free of RNAses, proteins and
genomic DNA. The quality control may include spectrophotometry and gel
electrophoresis, to assess RNA concentration and integrity. If the recovered RNA amount
is too small, a PCR amplification step of the RNA may be included, but it is
recommended to be kept to a minimum (Harris, 2000). Another option is to pool RNA
samples from different sources within the same treatment group (Garosi et al., 2005).
Degradation is the greatest risk, so all instruments, tubes and reagents must be RNAse-
free and the samples must be refrigerated while in use, or frozen at minus eighty degrees
Celsius when stored.
Labeling
there are three common methods of labeling adopted by most scientists: direct
labeling, indirect labeling, and dendrimer labeling (Harris, 2000). Direct labeling
incorporates deoxyribonuclotide triphosphate fluorescently labeled during reverse
transcription. Indirect labeling incorporates nucleotides containing a reactive aminoallyl
70
residue during transcription and then on a subsequent reaction succinyl esters of Cy3 or
Cy5 are covalently coupled to the amino-allyl-labeled cDNAs (Harris, 2000; Spielbauer
and Stahl, 2005). Both methods depend on the frequency of incorporation of the modified
nucleotides, but indirect labeling is preferred because the fluorescent nucleotides are
bulkier, which decreases incorporation. The dendrimer labeling method uses a reverse
transcription reaction primed with an oligonucleotide containing a specific capture
sequence. The cDNAs with the capture sequence is hybridized to fluorescently labeled
dendrimers and then to the array. This method requires less starting material, but it costs
more. Even though indirect labeling is laborious and time-consuming, it is still the most
popular because it results in higher yields, with better dye incorporation, and longer
cDNAs, which increases specific hybridization (Harris, 2000).
Array construction
The most popular methods of microarray construction include the use of
platforms, custom cDNA arrays, and custom oligo arrays (Harris, 2000). Platforms like
Affymetrix GeneChip relies on in situ synthesis of 25-mer oligonucleotides using
photomasks, which means that each probe is individually synthesized on the chip surface
(Spielbauer and Stahl, 2005). Customizable pre-synthesized cDNA or commercialized
oligos 50 to 70 base pairs long can be printed on the slide surface. Even though in situ
probe synthesis is considered to be more reliable and reproducible (Garosi et al., 2005),
they require sophisticated and expensive equipment, while DNA printed arrays are
affordable for academic research laboratories (Spielbauer and Stahl, 2005). Pre-made
oligos also give the advantage of fabricating them in high quality and defined quantities
(Spielbauer and Stahl, 2005). Automated spotting and rigorous quality control can
71
minimize a great part of variation introduced in customized arrays (Garosi et al., 2005).
In these arrays, the oligonucleotides are covalently attached to the slide surface, which is
coated with functional groups (Harris, 2000; Spielbauer and Stahl, 2005), each spot
corresponding to one gene (Harris, 2000). After DNA fixation, the slides are chemically
reduced, and salt and impurities are removed, so they can be stored for several months
(Spielbauer and Stahl, 2005). For these reasons oligonucleotide arrays have become
increasingly popular (Garosi et al., 2005; Spielbauer and Stahl, 2005).
All available technologies used in automated microarray fabrication,
photolithography, inkjet printing and contact printing (Spielbauer and Stahl, 2005), were
usually made of full genome chips, but printed oligo spots (contact printing) can create
gene focused arrays. Scientists are moving away from full or nearly full genome coverage
to focused arrays. The main advantage of this approach is the ability to retain the power
of microarray technology for monitoring a set of selected genes involved in a pathway of
interest, with more flexibility but with only a fraction of the cost of the regular arrays.
They are even sensitive enough to detect single copy number changes (Carvalho et al.,
2004). The disadvantages are that these arrays are printed with sequences from gene
oligos available from deduced genome assemblies, and the identity of the genes can
change as more accurate sequences are reported. They also need the inclusion of a
reliable baseline signal, which can be achieved by increasing the number of technical
replications of the genes of interest on the array, and addition of internal and external
control genes (Garosi et al., 2005).
72
Hybridization
The microarrays are hybridized and washed according to the slide manufacturer’s
recommendations (Spielbauer and Stahl, 2005). In this step equal amounts of labeled
cDNAs are hybridized on the microarray slide under specific temperature and time,
protected from light. It usually includes a pre-hybridization, the hybridization itself and a
post-hybridization wash with different buffer solutions and nuclease-free water6. After
they are dried, the slides are ready for laser scanning.
Scanning
Scanning is an important step of a microarray experiment because once scanned,
all data, whether high or poor quality, can not be changed. The major scanner settings are
laser power and voltage. Lower laser power minimizes photo-bleaching or saturation, but
lower signals can be missed. High power results in the inverse situation, catching lower
signals, but causing bleaching if high intensity signals. Between the two, there is more
concern about avoiding signal saturation (Spielbauer and Stahl, 2005). (Lyng et al., 2004)
determined that for most available scanners, the best relationship between intensity and
tube voltage is within the intensity range 200-50,000 (mean spot intensity). The same
slide can be scanned more than once in different laser powers so signals on the extreme
range can be correctly measured (Garosi et al., 2005).
6 Corning Inc. Pronto! Universal Microarray System Protocol
73
Data processing and statistical analysis
Image processing
The first step in data analysis is the quantification of signal and background
intensities. The raw scanner generated data is processed using a software package. This
step is called image analysis and consists of isolating the region of the image
corresponding to each individual spot from the background around it, so it can be
converted into an intensity value. Often it is necessary to perform visual inspections, and
if necessary, manual correction of grid placement on each microarray image (Garosi et
al., 2005). Subtracting the background from foreground intensity in each channel gives
spot intensity for calculating the expression ratio between the two channels.
There are four methods to deal with background: local background subtraction,
morphological opening, constant background subtraction, and not correcting for
background at all. (Yang et al., 2001) suggested that when the software package does not
have a morphological opening option, it is preferred to calculate the log-ratios without
background subtraction. The product is a data intensity file that will be used for statistical
analysis.
Data normalization
Dye effects (Cy3 signal is usually higher than Cy5) and array-to-array variations
can be corrected by normalization procedures. Especially in high density arrays, the use
of multiple testing procedures in the statistical analysis is essential to avoid producing
just a list of arbitrary genes, rather than meaningful true results (Spielbauer and Stahl,
74
2005). When using whole-genome arrays, there is a risk of having solutions with no
problems (Harris, 2000), and getting more data than one can digest (Page et al., 2003).
Because microarrays follow many and long protocols with multiple steps, there
are many possible sources of variation, so precautions must be taken to reduce variability
(Garosi et al., 2005). For example, printer head, chip lot, reagent lot, day of extraction,
scanners, and technicians can introduce variation (Page et al., 2003). To help isolate and
account for variation, microarray experimental designs include both technical and
biological replicates. Biological replicates are independent biological samples (e.g. same
tissue from different individuals of the same treatment group) and they take care of target
population variability. Technical replicates are repetition of a microarray experiment
using the same RNA samples, and they account for variability between and within slides
(Garosi et al., 2005). To reduce technical variability, samples that are from the same
group or those that will be hybridized together should be extracted and labeled at the
same time (Page et al., 2003). Although best practices are followed, there is still need to
perform data normalization. The normalization process aims to balance many of the
systematic variations present in an array experiment (Garosi et al., 2005). There are
several normalization techniques available, but they all follow the principle of identifying
genes that are not affected by experimental conditions and show a ratio with the reference
sample equal to one. Another method called global normalization uses the mean or
median values instead of a reference. Alternative methods include linear regression
analysis, log centering, rank invariant, and Chen’s ratio statistics. Lowess normalization
uses locally weighted linear regression to smooth data by comparing one spot with its
neighboring spots. During the process, housekeeping genes that are constantly expressed,

75
genomic DNA which is double strained, and external control genes that should not
hybridize, and negative controls can be used as internal controls, helping to identify the
‘noise’ of a microarray experiment (Garosi et al., 2005).
Testing approaches
The statistical approaches used to analyze microarray data can vary depending on
the situation. When comparing just two conditions, Student’s t test can be used to find
genes differently expressed, but when performing thousands of t tests a large number of
false negatives can be expected. This problem can be solved by calculating the false
discovery rate, which is the proportion of false positive genes in the total set of
differentially expressed genes by methods like Benlamini, Bonferroni, and Bonferroni
step-down. These methods estimate false discovery rate and attempt to correct it. When
performing a test, one must choose a test and set a p-value cutoff (e.g. a 0.05 false
positive rate) (Wolfinger et al., 2001). The rigor of the test will depend on how it
calculates the false discovery rate; some like Bonferroni are very rigorous, while others
not so much like FDR. Another method is the Bayesian approach, which improves the
confidence in array data with low number of replicates by assuming that genes with
similar expression have similar measurement errors. The ANOVA approach is a
generalization of the t test when comparing more than two conditions. In ANOVA, a
model is built to estimate and account for known sources of variation so the treatment
effect can be isolated. It has the advantage of possible inclusion of interesting variations
like gene regulation, day of labeling and different dyes (Garosi et al., 2005). Mixed
ANOVA models are preferred with experiments including biological replicates
76
(Spielbauer and Stahl, 2005). Some platform arrays have their own software, and now
there are many being created to analyze all sort of arrays (Garosi et al., 2005).
Generally, a two-fold or greater difference in expression over normalization is
considered distinct expression (Harris, 2000). Even though fold difference is the most
common way to quantify differences, it is not the only method. There are even better
quantitative ways, such as standardized mean difference (Page et al., 2003). Because
microarrays statistical analysis is not simple, collaboration with a biostatistician is
strongly recommended (Page et al., 2003). Validation of the results can be done by
repeating the experiment by a different technique, like PCR or Northern blot, for the
genes that were differently expressed by microarrays. In one report, microarray results
gave fold change gene expression values closely correlated with the ones calculated by
Northern blots (Casey et al., 2005).
Page et al. (2003) encouraged nutritionists to forge ahead into microarray
research, considering clear definition of objectives, appropriately designing of
experiments, choosing adequate sample size, applying statistical rigor to data analysis,
and paying attention to data handling and management issues. For example, hybridization
schemes depend on experimental design, which will also define number of samples, array
printing and statistical analysis. Even though arrays can be used to generate hypothesis,
better results can be obtained when a clear goal is defined from the beginning to meet
those objectives. These will help define important starting points, like the number of
biological and technical replicates. Page et al. (2003) suggested that it is more appropriate
to choose sample size based on control of false discovery rate (FDR) and the expected
discovery rate (EDR), which are mathematical estimations. In any case they advise not to
77
use fewer than five observations per treatment or it would limit the statistical methods
that could be used, with 40 observations or more being ideal.
Finding one gene or a group of genes that are differently expressed must be
followed by successful interpretation on the data in a biological context (Garosi et al.,
2005). It is necessary to regularly update information on the genes present on the arrays,
like gene names and annotations. This information is available through online databases.
Tools like principal component analysis can help assess similarity or dissimilarity of
expression profiles, and it facilitates selection of relevant genes from the data.
Visualization of gene expression changes in pathways can also help (Garosi et al., 2005).
Experimental design
There are two basic types of array experimental designs: the reference design and
the loop design (Garosi et al., 2005). In the loop design, each sample is compared directly
with other samples in a circular or multiple-pairwise fashion (interwoven loop). This
approach has greater statistical power than the reference design, so the ability to detect
differences is maximized. The reference design compares each sample with a common
RNA reference sample, serving as a common denominator between different array
hybridizations (Garosi et al., 2005). This method is preferred when a large number of
samples are analyzed. Graphical examples of both designs are illustrated by Figure 1.16.
It is necessary to be sure that each sample is labeled at least once with each dye, and that
the comparisons we want to make are possible with the design chosen.
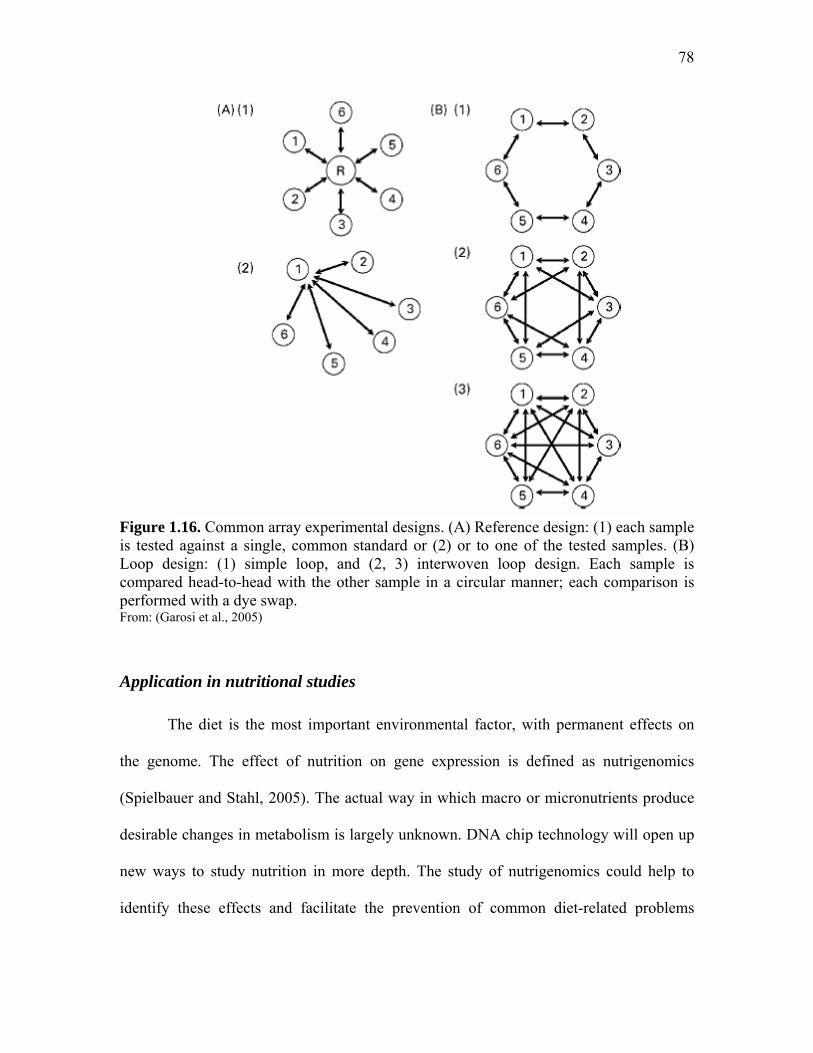
78
Figure 1.16. Common array experimental designs. (A) Reference design: (1) each sample is tested against a single, common standard or (2) or to one of the tested samples. (B) Loop design: (1) simple loop, and (2, 3) interwoven loop design. Each sample is compared head-to-head with the other sample in a circular manner; each comparison is performed with a dye swap. From: (Garosi et al., 2005)
Application in nutritional studies
The diet is the most important environmental factor, with permanent effects on
the genome. The effect of nutrition on gene expression is defined as nutrigenomics
(Spielbauer and Stahl, 2005). The actual way in which macro or micronutrients produce
desirable changes in metabolism is largely unknown. DNA chip technology will open up
new ways to study nutrition in more depth. The study of nutrigenomics could help to
identify these effects and facilitate the prevention of common diet-related problems
79
(Spielbauer and Stahl, 2005). In fact DNA microarrays will make major contributions to
nutritional research (Page et al., 2003).
Identification of cellular response to a specific nutritional signal may provide
ways to decipher the mechanism by which a nutritional signal is transduced into a given
response. Today, little is known about the molecular mechanisms by which the genome
perceives nutritional signals and mobilizes the organism to respond (Spielbauer and
Stahl, 2005). As we learn about the essentiality of nutrients, it is clear that they interact
with genetic material in the cell nuclei, either directly or indirectly, causing changes in
gene expression, so the population of mRNAs is affected, and not necessarily on that
specific nutrient’s metabolism (Harris, 2000). Because DNA chip technology allows
simultaneous screening of a large number of genes, it can give a comprehensive, detailed
picture of changes in gene expression, shedding light on complex regulatory interactions
(Spielbauer and Stahl, 2005). In nutritional sciences, whole-genome gene expression
profiles could provide new insights into nutrient-gene interactions and diet-related
mechanisms underlining alterations in gene expression (Spielbauer and Stahl, 2005),
giving a qualitative and quantitative diagnostic (Harris, 2000). Currently DNA
microarrays are applied to analyze RNA expression levels, but they can be used for gene
discovery, sequence identification, mapping, polymorphism detection, and hypothesis
generation (Gibson, 2003; Spielbauer and Stahl, 2005). Also, RNA and protein arrays are
being created using the same technology (Yadetie et al., 2004; Spielbauer and Stahl,
2005). The interaction of all these technologies to give them meaning must be a
combined effort of scientists from many disciplines.

80
Other nutritional applications could be in the detection of genetically modified
organisms, presence of animal products in the feed, and bioequivalence of food and drugs
(Page et al., 2003).
Chicken arrays Since the chicken genome became available, microarray techniques have also
improved and they are being used more often. Several microarray experiments using
chickens can be found in the literature. They cover a variety of applications. Here is a
brief summary of the more relevant ones.
Min et al. (2003) used microarrays to create a profile of changes in gene
expression of chickens infected with two species of Eimeria. They sampled the
duodenum and jejunum regions of the intestine. The glass array was spotted with 400
cDNA clones selected from the chicken EST database, including 12 chicken cytokines.
After primary infection 99 genes were affected by E. acervulina and 51 by E. maxima.
The secondary infection cause changes in 46 and 25 transcripts, respectively for E.
acervulina and E. maxima. The authors concluded that the genes and their pattern
affected by both Eimeria species were similar, but more research is needed to understand
host protective responses.
Also in 2003, an international research consortium project launched a system-
wide chicken DNA array based on cDNA libraries from chicken liver, fat, breast, leg
muscle, pineal gland and reproductive tract. They printed 2 arrays, the first being chicken
metabolic/somatic systems array with 11,000 gene sequences and the second a
neuroendocrine/reproductive system array with 8,000 sequences. In a test done to
compare liver samples of hypothyroid versus hyperthyroid chickens, they found 14
81
differently expressed genes that were verified by PCR. They also compared liver gene
expression of 16 days of incubation embryos with those of hatchlings and found 8 genes
that are up regulated in embryos compared to chicks and 9 genes that were higher
expressed in chicks when compared with embryos. The authors concluded that they
successfully developed and tested these system-wide arrays and that they are now
available to be used by several research groups (Cogburn et al., 2003). Since then, the
consortium have being working in profiling several tissues in different situations like
before and after hatch, fast and re-fed chickens, fast versus slow growing chickens and so
on (Cogburn et al., 2004). Chicken arrays used for cancer research were developed by
The Fred Hutchinson Cancer Research Center in Seattle and tested by Black et al. (2004),
who identified 27 genes whose expression is increased 3 fold or more in v-Jun-
transformed cells. In a different study, Afrakhte and Schultheiss (2004) created an array
with 11,000 clones identified from the chick precardiac mesoendoderm and were able to
select multiple cardiac-specific genes, including several that have not been characterized
before. In 2005, the same cancer research group published their chicken array, now
known as the 13k chicken array, with sequences isolated from 24 different tissues, and
with 11,447 non-redundant ETSs and 160 control spots. They now advertise this chicken
array for research groups interested in genome wide screening (Burnside et al., 2005).
In China, a group is using the chicken as a model to study excessive lipid
accumulation. The Beijing Genomics Institute created a 9,024 chicken cDNA array that
was used in that study. They compared a commercial line of broilers with a local chicken
breed, and found 42 genes differently expressed, when blasted with the chicken genome
available at the GeneBank database. These genes were mainly related to lipid and energy
82
metabolism, some were transcription and splicing factors, and some related to protein
synthesis and degradation. Four genes were verified by Northern blot and PCR with
similar results across the different techniques (Wang et al., 2006).
As needed, researchers are creating their own focused arrays to target some
specific tissue or research interest. Smith et al. (2006) developed a 5K microarray
focused on immune function. This array is now another one available for purchase to
scientists interested in studying chicken immunology. Another 5k chicken microarray
was created to study the neuroendocrine system. It was tested by Ellestad et al. (2006)
with chicken embryo’s pituitary glands, and they found 352 cDNAs that were differently
expressed as the embryos aged from 10 to 17 days of incubation. From this group of
genes they could identify 141 genes related to thyrotrophic differentiation, 69 indicating
growth hormone mRNA production and 61 related to prolactin mRNA synthesis. They
concluded that the array was useful not only to identify when these genes start being
expressed, but also other numerous transcription factors and signaling molecules not
previously associated in pituitary development. Affymetrix developed and commercialize
a GeneChip Chicken Genome Array, designed with 28,000 chicken transcripts plus 17
avian virus transcripts for disease detection (Affymetrix, 2007).
From these reports we can conclude that several groups are producing their own
chicken arrays and making them available to others, mostly using cDNA libraries and
looking at large number of genes not all of them yet identified with annotation. There are
still no reports of chicken arrays used specifically for practical nutrition studies. There are
also no reports of arrays being tested with turkey RNA samples, what was expected since
the turkey genome is still being sequenced.
83
Dissertation Research Outline
Based on results from previous in ovo feeding (IOF) research, which were already
discussed, this dissertation is a continuation of the in ovo feeding project at North
Carolina State University. The main objectives of these studies were to move from the
proved concept to a more practical focus, going toward future industry application. To
make IOF feasible, there was a need to study the physiological effects of changing
injection site from the side to the top of the egg, since the injecting machine prototype
was going to target the amnion from that position. The next couple trials focused on
finding a protein source with characteristics that were compatible with sound industry
manufacturing practices and animal response. Results from these trials reveled our lack
of information about embryo physiology during the perinatal period, so the last half of
this research introduced the use molecular biology tools to better understand the
physiology of development of late-term turkey embryos.
Preliminary research
Site of Injection
Since the IOF concept was created, the way of injecting the solutions was to
locate the amnion by candling the egg, marking an area on the shell where the risk of
hitting the embryo or blood vessels was minimal, punching a hole in the shell, and then
manually injecting the nutritive solution. The selected area was usually somewhere on the
side of the egg. The industry partner on this project7 developed a means to automate in
ovo feeding. In ovo vaccination machines that are commercially available already hit the
amnion 89% of the time (Sharma and Burmester, 1982), injecting from the top of the 7 Pfizer-Embrex Inc., Research Triangle Park, Durham, NC
84
large end of the egg. Thus, Pfizer-Embrex Inc., purposed to improve the accuracy of
amnion targeting via injection through the air cell end of the egg without the need of
candling. To confirm the benefits of IOF versus other possible ways to supplement poults
at hatch, we also tested gavaging the birds with the same nutritive solution at hatch or
injecting the solution subcutaneously. A research trial was carried out to compare IOF
from the side, IOF from the top, gavage and subcutaneous injection to non-supplemented
embryos or poults.
Hypotheses: 1) IOF can be successfully be done by injecting from the top of the egg. 2)
Feeding a nutritive solution in ovo promotes greater benefits to poults than gavage or
neck injection.
Conclusions: Injection from the top hit the amnion in 90% of the time, which was
considered acceptable, thus the first hypothesis was accepted. The IOF-treated poults had
equal or superior performance for the parameters tested, thus we accepted the hypothesis
that IOF-treated poults benefit more from nutrients fed in ovo then by other methods.
Results of this trial are presented on Appendix 1 of this dissertation.
IOF Solution Osmotic limits
Another issue addressed was to define the osmotic limits for IOF solutions
turkeys. The original experiment that defined these limits was performed by Uni and
Ferket (2003), who tested IOF saline (NaCl) solutions ranging from 400 to 1200 mOsm
using, in chicken eggs. A similar osmotic constraint study in turkey embryos using
carbohydrates was necessary because it had never been determined before and a different
osmotic response to energetic substrates was expected to be different than for a mineral
salt.
85
Hypotheses: Osmotic limits for turkey embryos are the same as those for chicken
embryos.
Conclusion: Based on poult hatchability and body weight, IOF solution osmolalities
between 550 and 850 mOsm were considered safe, with estimated best value at 708
mOsm. The range determined for chickens were between 400 and 600 mOsm. Since
turkey osmotic limits seems to be higher the limit for chickens, we reject our hypothesis.
Results of this trial are presented at Appendix 2 of this dissertation.
Phase 1: Evaluation of hydrolyzed soy as an IOF Solution Ingredient
As reviewed in the chicken and turkey IOF research sections, several formulas
with different ingredients and concentrations were tested. The first phase of this research
was to identify and test ingredients used in IOF formulas with a focus on the protein
source. Previous IOF research used egg white protein (albumen) as the only protein
source because it most closely matched the amino acid balance requirements of the
embryo, but there are some technical drawbacks with its use in a commercial IOF
solution. Commercially available as a chemical-grade in powder, egg albumin is difficult
to dissolve in saline solution and it will coagulate into an insoluble mass after heat
sterilization necessary to minimize microbial contamination after IOF solution injection
into the egg. In order to use EWP in IOF solutions, the saline solution had to be prepared
by dissolving NaCl at the concentration of 0.4% in distilled water, and then autoclaved to
secure sterility. The 0.4% concentration was preferred over the 0.9% used in the
beginning of the IOF research to reduce the osmotic load but still get the benefits the
sodium offering enhanced enterocyte nutrient absorption. The powder substrates, sugars
or albumen were then dissolved in that saline solution. EWP and dextrin required at least
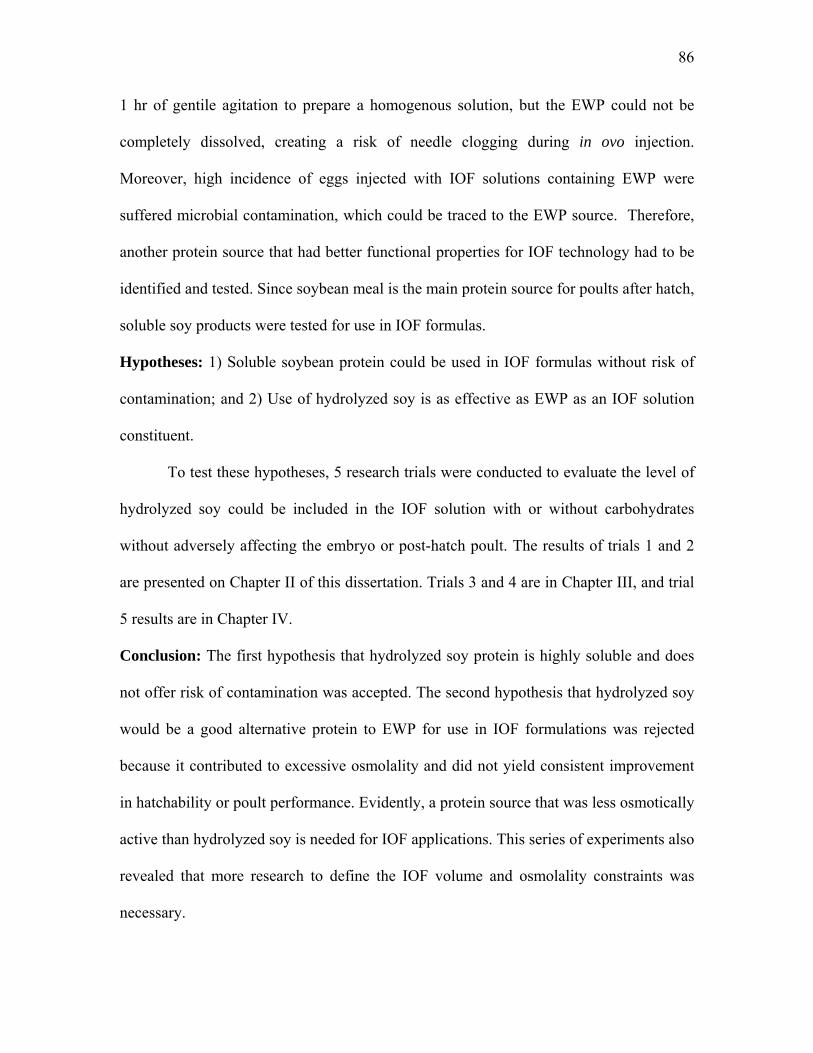
86
1 hr of gentile agitation to prepare a homogenous solution, but the EWP could not be
completely dissolved, creating a risk of needle clogging during in ovo injection.
Moreover, high incidence of eggs injected with IOF solutions containing EWP were
suffered microbial contamination, which could be traced to the EWP source. Therefore,
another protein source that had better functional properties for IOF technology had to be
identified and tested. Since soybean meal is the main protein source for poults after hatch,
soluble soy products were tested for use in IOF formulas.
Hypotheses: 1) Soluble soybean protein could be used in IOF formulas without risk of
contamination; and 2) Use of hydrolyzed soy is as effective as EWP as an IOF solution
constituent.
To test these hypotheses, 5 research trials were conducted to evaluate the level of
hydrolyzed soy could be included in the IOF solution with or without carbohydrates
without adversely affecting the embryo or post-hatch poult. The results of trials 1 and 2
are presented on Chapter II of this dissertation. Trials 3 and 4 are in Chapter III, and trial
5 results are in Chapter IV.
Conclusion: The first hypothesis that hydrolyzed soy protein is highly soluble and does
not offer risk of contamination was accepted. The second hypothesis that hydrolyzed soy
would be a good alternative protein to EWP for use in IOF formulations was rejected
because it contributed to excessive osmolality and did not yield consistent improvement
in hatchability or poult performance. Evidently, a protein source that was less osmotically
active than hydrolyzed soy is needed for IOF applications. This series of experiments also
revealed that more research to define the IOF volume and osmolality constraints was
necessary.
87
Phase 2: determining IOF volume and osmolality constraints
As concluded in phase 1, the IOF volume and osmolality constraints had to be
determined before proceeding with IOF solution ingredient evaluation. In order to
complete these objectives, several questions had to be answered: How much amnion is
present in turkey eggs throughout late development? What is the fluid osmolality and
viscosity of the amnion and embryo that constrain IOF osmolality limits? What is the
pattern of amniotic fluid consumption by turkey embryos of different breeds?
Hypothesis: Characterization of amnion and the turkey embryo can help determine IOF
constraints.
A series of experiments were conducted to measure embryo growth, amniotic
fluid volume, osmolality and viscosity from 20 to 28 days of incubation, using eggs from
3 different breeds.
Conclusions: Information on amnion volume, osmolality and viscosity of different
turkey breeds, along with embryonic growth and IOF solution osmolality is useful to
determine the optimum volume that can be injected into the amnion, the best time of
injection, and the osmotic limits of the amnion-embryo system.
Phase 3: late-term turkey embryo gene expression survey
After determining the constraints associated with IOF, more information about the
changes in metabolism of the late-term embryo was needed to identify appropriate
nutritional substrates that could serve as IOF ingredients. Comprehensive literature
search yielded insufficient information about late-term turkey embryo metabolism to help
identify potential nutritional substrates as IOF ingredients. Therefore, microarray
88
technology was used to profile metabolism of the late-term embryo, particularly those
pathways associated with energy metabolism.
Hypotheses: 1) A focused oligo microarray based on the chicken genome sequences can
be used to screen turkey embryo tissues and map changes in energy metabolism during
the last week of incubation. 2) Evidence of gene expression of key metabolic enzymes
will identify potential IOF substrates that could enhance energy flux to benefit embryo
vitality and physic-morphological development.
A microarray was constructed using all known unique oligonucleotide sequences
corresponding to enzymes of metabolic pathways, hormones, intestinal digestive
enzymes and transporters. Two experiments were carried out, the first using a prototype
96 genes array and the second using an updated 300 gene array. In both experiments,
turkey embryos were sampled from around 20 days of incubation until hatch. The RNA
samples used in the microarrays experiments were extracted from liver, pectoral muscle,
hatching muscle and intestine tissues.
Conclusion: The hypothesis that a microarray based on chicken sequences can be used to
evaluate turkey RNA samples was accepted, implying that the sequences in both species
are similar enough for successful target and probe hybridization. Also accept was the
hypothesis that the array information can be used to map embryo development of all
metabolic pathways represented in the array. Evidently, the embryo has the enzymatic
capacity to metabolize identified substrates at the IOF target stage of development, but
this must be confirmed by a subsequent IOF treatment study investigation.
89
Phase 4: Effect of in ovo feeding on turkey embryo gene expression –
energy metabolism and intestinal development
This last phase of research in this dissertation was done to confirm that gene
microarray technology is useful to map the changes in metabolism after in ovo feeding of
nutrients identified as candidate substrates in phase 3 in comparison to non-injected
control turkey embryos.
Hypotheses: 1) Differences in metabolism between IOF and control embryos can be
measured by microarray technology. 2) These differences can be correlated with other
parameters like poult quality and tissue glycogen concentration. 3) Consequences of
feeding substrates identified by previous array experiment could be predicted and proven.
To test these hypotheses an experiment was design to compare regular non-
injected turkey embryos with embryos IOF 0.4 mL of a solution containing metabolic co-
factors. In contrast to previous IOF studies with turkeys, proteins and sugars were
excluded from the IOF formulation because of two major technical constraints. First, IOF
target studies using a modified Inovoject® machine (Pfizer-Embrex Inc., Durham, NC)
identified the highest IOF delivery accuracy into the amnion at 24 days of incubation. At
this stage of embryonic development, an injection volume of .4 ml saline was found to
have negligible effect on hatchability. Second, the microarray survey of late-term
embryos done in phase 3 identified that metabolic enzymes associated with glycogen
accumulation from caloric substrates (proteins and carbohydrates) is down regulated at
24 days of incubation, whereas glycogenolysis and lactate utilization is up-regulated as
the hatching process begins. Therefore, only substrates and co-factors that complement
the unique metabolic state of the E24 turkey embryo was included in the IOF solution.
90
Embryonic tissues sampled on days 22, 24, 25, 26 of incubation and at hatch included the
liver, pectoral muscle, hatching muscle, duodenum and jejunum. The extracted RNA was
used in microarrays experiments using the 300 genes array created to screen energy
related pathways and intestinal development.
Conclusions: The first hypothesis that differences in metabolism between IOF and non-
fed can be detected by microarray was accepted, since a total of 21 genes were differently
expressed. The expression profiled could be correlated to poult quality scores and a tissue
glycogen concentration, thus the second hypothesis was accepted. However, the third
hypothesis could not be adequately confirmed because the changes in gene expression
caused by IOF were not as straight forward as predicted. More research is needed to
improve the ability to predict responses to a certain nutrient IOF to turkey embryos.
Conclusions
In ovo feeding of Carbohydrates and protein can enhance poult quality, livability
and performance as demonstrated by previous research. Nonetheless, there still not one
formula composition able to satisfy all the constraints associated with the commercial
application of IOF technology to yield consistent improvement in bird performance.
Investigating constraints in volume and osmolality of amniotic fluid helped define IOF
formulation specifications to be delivered at different stages of late-term incubation (22
to 23 days of incubation). New technologies like microarrays can greatly add to our
current knowledge in understanding turkey embryo metabolism and development, which
could result in improvement in turkey poult hatchability, quality, survival and early
performance.

91
List of References Affymetrix. 2007. GeneChip Chicken Genome Array.
http://www.affymetrix.com/products/arrays/specific/chicken.affx Accessed May 2007.
Afrakhte, M., and T. M. Schultheiss. 2004. Construction and analysis of a subtracted
library and microarray of cDNAs expressed specifically in chicken heart progenitor cells. Dev Dyn 230:290-298.
Al-Murrani, W. K. 1982. Effect of injecting amino acids into the egg on embryonic and
subsequent growth in the domestic fowl. Br Poult Sci 23:171-174. Applegate, T. J., and M. S. Lilburn. 1998. Effect of hen age, body weight, and age at
photostimulation. 1. Egg, incubation, and poult characteristics of commercial turkeys. Poult Sci 77:433-438.
Applegate, T. J., D. M. Karcher, and M. S. Lilburn. 2005. Comparative development of
the small intestine in the turkey poult and Pekin duckling. Poult Sci 84:426-431. Bakst, M. R., and S. K. Gupta. 1997. Preincubation storage of turkey eggs: impact on rate
of early embryonic development. Br Poult Sci 38:374-377. Bakst, M. R., S. K. Gupta, and V. Akuffo. 1997. Comparative development of the turkey
and chicken embryo from cleavage through hypoblast formation. Poult Sci 76:83-90. Balaban, M., and J. Hill. 1971. Effects of thyroxine and temperature manipulations upon
the hatching of chick embryos (Gallus domesticus). Dev Psychobiol 4:17-35. Bamelis, F., B. Kemps, K. Mertens, B. De Ketelaere, E. Decuypere, and J.
DeBaerdemaeker. 2005. An automatic monitoring of the hatching process based on the noise of the hatching chicks. Poult Sci 84:1101-1107.
Bauer, M., A. Hamm, and M. J. Pankratz. 2004. Linking nutrition to genomics. Biol
Chem 385:593-596. Black, E. J., T. Clair, J. Delrow, P. Neiman, and D. A. Gillespie. 2004. Microarray
analysis identifies Autotaxin, a tumor cell motility and angiogenic factor with lysophospholipase D activity, as a specific target of cell transformation by v-Jun. Oncogene 23:2357-2366.
Boerjan, M. 2006. Chick vitality and uniformity. in International Hatchery Practice
20(8):7-9.
92
Buhr, R. J., J. K. Northcutt, L. J. Richardson, N. A. Cox, and B. D. Fairchild. 2006. Incidence of unabsorbed yolk sacs in broilers, broiler breeder roosters, white Leghorn hens, and Athens-Canadian randombred control broilers. Poult Sci 85:1294-1297.
Burnside, J., P. Neiman, J. Tang, R. Basom, R. Talbot, M. Aronszajn, D. Burt, and J.
Delrow. 2005. Development of a cDNA array for chicken gene expression analysis. BMC Genomics 6:13.
Careghi, C., K. Tona, O. Onagbesan, J. Buyse, E. Decuypere, and V. Bruggeman. 2005.
The effects of the spread of hatch and interaction with delayed feed access after hatch on broiler performance until seven days of age. Poult Sci 84:1314-1320.
Carvalho, B., E. Ouwerkerk, G. A. Meijer, and B. Ylstra. 2004. High resolution
microarray comparative genomic hybridization analysis using spotted oligonucleotides. J Clin Pathol 57:644-646.
Carver, D. K., J. Fetrow, T. Gering, M. T. Correa, K. K. Krueger, and H. J. Barnes. 2000.
Use of statistical modeling to assess risk for early poult mortality in commercial turkey flocks. J Appl Poult Res 10:397-420.
Casey, O. M., D. G. Morris, R. Powell, J. M. Sreenan, and R. Fitzpatrick. 2005. Analysis
of gene expression in non-regressed and regressed bovine corpus luteum tissue using a customized ovarian cDNA array. Theriogenology 64:1963-1976.
Christensen, V. L., and H. V. Biellier. 1982. Physiology of turkey embryos during
pipping and hatching. IV. Thyroid function in embryos from selected hens. Poult Sci 61:2482-2488.
Christensen, V. L., H. V. Biellier, and J. F. Forward. 1982. Physiology of turkey embryos
during pipping and hatching III. Thyroid function. Poult Sci 61:367-374. Christensen, V. L., W. E. Donaldson, and J. P. McMurtry. 1996. Physiological
differences in late embryos from turkey breeders at different ages. Poult Sci 75:172-178.
Christensen, V. L., J. L. Grimes, W. E. Donaldson, and S. Lerner. 2000. Paternal
influences on turkey embryonic growth in the absence of changes in egg weight and eggshell conductance. Poult Sci 79:1810-1816.
Christensen, V. L., J. L. Grimes, M. J. Wineland, and L. G. Bagley. 2001a. Effects of
turkey breeder hen age, strain, and length of the incubation period on survival of embryos and hatchlings. J Appl Poult Res 10:5-15.
Christensen, V. L., M. J. Wineland, G. M. Fasenko, and W. E. Donaldson. 2001b. Egg
storage effects on plasma glucose and supply and demand tissue glycogen concentrations of broiler embryos. Poult Sci 80:1729-1735.
93
Christensen, V. L., J. L. Grimes, M. J. Wineland, and G. S. Davis. 2003a. Accelerating embryonic growth during incubation following prolonged egg storage. 1. Embryonic livability. Poult Sci 82:1863-1868.
Christensen, V. L., J. L. Grimes, M. J. Wineland, and G. S. Davis. 2003b. Accelerating
embryonic growth during incubation following prolonged egg storage. 2. Embryonic growth and metabolism. Poult Sci 82:1869-1878.
Christensen, V. L., D. T. Ort, and J. L. Grimes. 2003c. Physiological factors associated
with weak neonatal poults (Meleagris gallopavo). Int J Poult Sci 2:7-14. Christensen, V. L., D. T. Ort, K. E. Nestor, S. G. Velleman, and G. B. Havenstein. 2007.
Genetic control of neonatal growth and intestinal maturation in turkeys. Poult Sci 86:476-487.
Cogburn, L. A., X. Wang, W. Carre, L. Rejto, T. E. Porter, S. E. Aggrey, and J. Simon.
2003. Systems-wide chicken DNA microarrays, gene expression profiling, and discovery of functional genes. Poult Sci 82:939-951.
Cogburn, L. A., X. Wang, W. Carre, L. Rejto, E. Aggrey, M. J. Duclos, J. Simon, and T.
E. Porter. 2004. Functional genomics in chickens: development of integrated-systems microarrays for transcriptional profiling and discovery of regulatory pathways. Comp Funct Genom 5:253-261.
Coles, B. A., W. J. Croom, J. Brake, L. R. Daniel, V. L. Christensen, C. P. Phelps, A.
Gore, and I. L. Taylor. 1999. In ovo peptide YY administration improves growth and feed conversion ratios in week-old broiler chicks. Poult Sci 78:1320-1322.
Collin, A., C. Berri, S. Tesseraud, F. E. Rodon, S. Skiba-Cassy, S. Crochet, M. J. Duclos,
N. Rideau, K. Tona, J. Buyse, V. Bruggeman, E. Decuypere, M. Picard, and S. Yahav. 2007. Effects of thermal manipulation during early and late embryogenesis on thermotolerance and breast muscle characteristics in broiler chickens. Poult Sci 86:795-800.
Davis, C., and C. R. Reeves 2002. High value opportunities from the chicken egg. Pages
69 in Book High value opportunities from the chicken egg. Editor ed. Rural Industries Research and Development Corporation, City.
Decuypere, E., E. R. Kuhn, B. Clijmans, E. J. Nouwen, and H. Michels. 1982. Effect of
blocking T4-monodeiodination on hatching in chickens. Poult Sci 61:1194-1201. Decuypere, E., and V. Bruggeman. 2007. The endocrine interface of environmental and
egg factors affecting chick quality. Poult Sci 86:1037-1042. Donaldson, W. E., and V. L. Christensen. 1991. Dietary carbohydrate level and glucose
metabolism in turkey poults. Comp Biochem Physiol A 98:347-350.
94
Donaldson, W. E., V. L. Christensen, and K. K. Krueger. 1991. Effects of stressors on blood glucose and hepatic glycogen concentrations in turkey poults. Comp Biochem Physiol A 100:945-947.
Donaldson, W. E. 1995. Carbohydrate, hatchery stressors affect poult survival. in
Feedstaffs 67(14):16-17. Edwards, C. L. 1902. The physiological zero and the index of development from the egg
of the domestic fowl. Am J Physiol 6:351-397. Ellestad, L. E., W. Carre, M. Muchow, S. A. Jenkins, X. Wang, L. A. Cogburn, and T. E.
Porter. 2006. Gene expression profiling during cellular differentiation in the embryonic pituitary gland using cDNA microarrays. Physiol Genomics 25:414-425.
Enting, H., T. A. Kruip, M. W. Verstegen, and P. J. van der Aar. 2007. The effect of low-
density diets on broiler breeder performance during the laying period and on embryonic development of their offspring. Poult Sci 86:850-856.
Fasenko, G. M. 2007. Egg storage and the embryo. Poult Sci 86:1020-1024. Foye, O. T. 2005. The biochemical and molecular effects of amnionic nutrient
administration, “in ovo feeding” on intestinal development and function and carbohydrate metabolism in turkey embryos and poults. Ph.D. Dissertation. North Carolina State University. Raleigh, NC.
Foye, O. T., Z. Uni, and P. R. Ferket. 2006. Effect of in ovo feeding egg white protein,
beta-hydroxy-beta-methylbutyrate, and carbohydrates on glycogen status and neonatal growth of turkeys. Poult Sci 85:1185-1192.
Fuller, J. C., Jr., and S. Nissen. 1994. Decreasing male broiler mortality by feeding the
leucine catabolite beta-methyl-hydroxybutyrate. Poult Sci 73(Suppl. 1):93 (Abstr.). Funderbunk, S., V. L. Christensen, J. L. Grimes, M. J. Wineland, and L. G. Bagley. 2005.
Effects of egg size and eggshell conductance on poult livability and body weight gain. Poult Sci 84(Suppl. 1):33. (Abstr.).
Garosi, P., C. De Filippo, M. van Erk, P. Rocca-Serra, S. A. Sansone, and R. Elliott.
2005. Defining best practice for microarray analyses in nutrigenomic studies. Br J Nutr 93:425-432.
George, J. C., and A. J. Berger. 1966. Avian myology Academic Press, New York. Gibson, G. 2003. Microarray analysis: genome-scale hypothesis scanning. PLoS Biol
1:E15.
95
Gross, G. H. 1985. Innervation of the complexus ("hatching") muscle of the chick. J Comp Neurol 232:180-189.
Gupta, S. K., and M. R. Bakst. 1993. Turkey embryo staging from cleavage through
hypoblast formation. J Morphol 217:313-325. Hammerstedt, R. H. 1999. Symposium summary and challenges for the future. Poult Sci
78:459-466. Hanke, O. A., J. Skinner, and J. H. Florea. 1972. American poultry history 1823-1973
American Poultry Historical Society, Mount Morris, IL. Hargis, P. S., S. L. Pardue, A. M. Lee, and G. W. Sandel. 1989. In ovo growth hormone
alters growth and adipose tissue development of chickens. Growth Dev Aging 53:93-99.
Harris, E. D. 2000. Differential PCR and DNA microarrays: the modern era of nutritional
investigations. Nutrition 16:714-715. Havenstein, G. B., P. R. Ferket, and M. A. Qureshi. 2003. Growth, livability, and feed
conversion of 1957 versus 2001 broilers when fed representative 1957 and 2001 broiler diets. Poult Sci 82:1500-1508.
Havenstein, G. B., P. R. Ferket, J. L. Grimes, M. A. Qureshi, and K. E. Nestor. 2007.
Comparison of the performance of 1966- versus 2003-type turkeys when fed representative 1966 and 2003 turkey diets: growth rate, livability, and feed conversion. Poult Sci 86:232-240.
Henry, M. H., and W. H. Burke. 1999. The effects of in ovo administration of
testosterone or an antiandrogen on growth of chick embryos and embryonic muscle characteristics. Poult Sci 78:1006-1013.
Horrox, N. 2003. Chick problems and their new satisfactory investigation. in
International Poultry Practice 17(6):11-13. Horrox, N. 2006a. World focus: a good start, time for a rethink? in International Poultry
Production 14(5):5. Horrox, N. 2006b. Incubation and chick handling-where next? in International Hatchery
Practice 20(8):13-15. Hulet, R., G. Gladys, D. Hill, R. Meijerhof, and T. El-Shiekh. 2007. Influence of egg
shell embryonic incubation temperature and broiler breeder flock age on posthatch growth performance and carcass characteristics. Poult Sci 86:408-412.
96
Hulet, R. M. 2007. Managing incubation: where are we and why? Poult Sci 86:1017-1019.
John, T. M., J. C. George, and E. T. Moran, Jr. 1987. Pre- and post-hatch ultrastructural
and metabolic changes in the hatching muscle of turkey embryos from antibiotic and glucose treated eggs. Cytobios 49:197-210.
Johnston, P. A., H. Liu, T. O'Connell, P. Phelps, M. Bland, J. Tyczkowski, A. Kemper, T.
Harding, A. Avakian, E. Haddad, C. Whitfill, R. Gildersleeve, and C. A. Ricks. 1997. Applications in ovo technology. Poult Sci 76:165-178.
Joseph, N. S., and E. T. Moran, Jr. 2005a. Characteristics of eggs, embryos, and chicks
form broiler breeder hens selected for growth or meat yield. J Appl Poult Res 14:275-280.
Joseph, N. S., and E. T. Moran, Jr. 2005b. Effect of flock age and postemergent holding
in the hatcher on broiler live performance and further-processing yield. J Appl Poult Res 14:512-520.
Keirs, R. W., E. D. Peebles, S. A. Hubbard, and S. K. Whitmarsh. 2002. Effects of
supportative gluconeogenic substrates on early performance of broilers under adequate brooding conditions. J Appl Poult Res 11:367-372.
Keirs, R. W., E. D. Peebles, and P. D. Gerard. 2007. Relationship of late embryo loss and
anomalies in broiler offspring. J Appl Poult Res 16:62-69. Klasing, K. C. 2005. Poultry nutrition: a comparative approach. J Appl Poult Res 14:426-
436. Kocamis, H., Y. N. Yeni, D. C. Kirkpatrick-Keller, and J. Killefer. 1999. Postnatal
growth of broilers in response to in ovo administration of chicken growth hormone. Poult Sci 78:1219-1226.
Kocamis, H., Y. N. Yeni, C. U. Brown, P. B. Kenney, D. C. Kirkpatrick-Keller, and J.
Killefer. 2000. Effect of in ovo administration of insulin-like growth factor-I on composition and mechanical properties of chicken bone. Poult Sci 79:1345-1350.
Krebs, H. A. 1972. Some aspects of the regulation of fuel supply in omnivorous animals.
Adv Enzyme Regul 10:397-420. Lamont, S. J. 2006. Perspectives in chicken genetics and genomics. Poult Sci 85:2048-
2049. Langslow, D. R., G. Cramb, and K. Siddle. 1979. Possible mechanisms for the increased
sensitivity to glucagon and catecholamines of chicken adipose tissue during hatching. Gen Comp Endocrinol 39:527-533.
97
Lefens, M. 2007. In conclusion: by the numbers. in Poultry Magazine February-March. p.60.
Lobo, P. 2006. Mind the gap. in Poultry Magazine. October-November, p.56. Lourens, A., R. Molenaar, H. van den Brand, M. J. Heetkamp, R. Meijerhof, and B.
Kemp. 2006. Effect of egg size on heat production and the transition of energy from egg to hatchling. Poult Sci 85:770-776.
Lu, J. W., J. P. McMurtry, and C. N. Coon. 2007. Developmental changes of plasma
insulin, glucagon, insulin-like growth factors, thyroid hormones, and glucose concentrations in chick embryos and hatched chicks. Poult Sci 86:673-683.
Lyng, H., A. Badiee, D. H. Svendsrud, E. Hovig, O. Myklebost, and T. Stokke. 2004.
Profound influence of microarray scanner characteristics on gene expression ratios: analysis and procedure for correction. BMC Genomics 5:10.
Mather, C. M., and K. F. Laughlin. 1977. Storage of hatching eggs: the effect on early
embryonic development. Br Poult Sci 18:597-603. Matsushita, S., J. Yamashita, T. Iwasawa, T. Tomita, and M. Ikeda. 2006. Effects of in
ovo exposure to imazalil and atrazine on sexual differentiation in chick gonads. Poult Sci 85:1641-1647.
Matthews, C. K., and K. E. Holde 1990a. Carbohydrate metabolism: biosynthesis. Pages
670-703 in Biochemistry. The Benjamin/Cummnings Plublishing Company, Inc., Redwood City, CA.
Matthews, C. K., and K. E. Holde 1990b. Metabolism of nitrogenous compounds:
principles of biosynthesis, utilization, turnover, and excretion. Pages 670-703 in BiochemistryThe Benjamin/Cummings Publishing Company, Inc., Redwood City, CA.
McReynolds, J. L., D. Y. Caldwell, E. T. Barnhart, J. R. Deloach, A. P. McElroy, R. W.
Moore, B. M. Hargis, and D. J. Caldwell. 2000. The effect of in ovo or day-of-hatch subcutaneous antibiotic administration on competitive exclusion culture (PREEMPT) establishment in neonatal chickens. Poult Sci 79:1524-1530.
Min, W., H. S. Lillehoj, S. Kim, J. J. Zhu, H. Beard, N. Alkharouf, and B. F. Matthews.
2003. Profiling local gene expression changes associated with Eimeria maxima and Eimeria acervulina using cDNA microarray. Appl Microbiol Biotechnol 62:392-399.
Moller, A. P., G. S. Sanotra, and K. S. Vestergaard. 1995. Developmental stability in
relation to population density and breed of chickens Gallus gallus. Poult Sci 74:1761-1771.

98
Moller, A. P., and J. J. Cuervo 2002. Asymmetry, size and sexual selection: meta-analysis, publication bias and factors affecting variation in relationships. in Polak, M. (Ed.), Developmental Instability, Oxford University Press, New York.
Moller, A. P., and J. Manning. 2003. Growth and developmental instability. Vet J
166:19-27. Moore, D. T. 2005. The influence of early nutrition on muscle development in the poult.
Ph.D. Dissertation. North Carolina State University. Raleigh, NC. Moran, E. T., Jr. 2007. Nutrition of the developing embryo and hatchling. Poult Sci
86:1043-1049. Morris, T. 1980. Poultry can crow at NCSU: a history of poultry at North Carolina State
University, 1881-1976. NCSU, Raleigh, NC. Nestor, K. E., K. I. Brown, and S. P. Touchburn. 1972. Egg quality and poult production
in turkeys. 1. Variation during a seven month period. Poult Sci 51:104-110. Nestor, K. E., and D. O. Noble. 1995. Influence of selection for increased egg production,
body weight, and shank width of turkeys on egg composition and the relationship of the egg traits to hatchability. Poult Sci 74:427-433.
Nissen, S., J. C. Fuller, Jr., J. Sell, P. R. Ferket, and D. V. Rives. 1994. The effect of beta-
hydroxy-beta-methylbutyrate on growth, mortality, and carcass qualities of broiler chickens. Poult Sci 73:137-155.
Noble, D. O., K. E. Nestor, and C. R. Polley. 1999. Factors influencing early poult flip-
overs in experimental populations of turkeys. Poult Sci 78:178-181. Noy, Y., and D. Sklan. 1998a. Yolk utilisation in the newly hatched poult. Br Poult Sci
39:446-451. Noy, Y., and D. Sklan. 1998b. Metabolism responses to early nutrition. J Appl Poult Res
7:437-451. Noy, Y., and D. Sklan. 1999a. Different Types of Early Feeding and Performance In
Chicks and Poults. J Appl Poult Res 8:16-24. Noy, Y., and D. Sklan. 1999b. Energy utilization in newly hatched chicks. Poult Sci
78:1750-1756. Noy, Y., and D. Sklan. 2001. Yolk and exogenous feed utilization in the posthatch chick.
Poult Sci 80:1490-1495.
99
Ohta, Y., and M. T. Kidd. 2001. Optimum site for in ovo amino acid injection in broiler breeder eggs. Poult Sci 80:1425-1429.
Ohta, Y., M. T. Kidd, and T. Ishibashi. 2001. Embryo growth and amino acid
concentration profiles of broiler breeder eggs, embryos, and chicks after in ovo administration of amino acids. Poult Sci 80:1430-1436.
Ozkan, S., I. Plavnik, and S. Yahav. 2006. Effects of early feed restriction on
performance and ascites development in broiler chickens subsequently raised at low ambient temperature. J Appl Poult Res 15:9-19.
Page, G. P., J. W. Edwards, S. Barnes, R. Weindruch, and D. B. Allison. 2003. A design
and statistical perspective on microarray gene expression studies in nutrition: the need for playful creativity and scientific hard-mindedness. Nutrition 19:997-1000.
Pearce, J., and W. O. Brown. 1971. Carbohydrate metabolism Academic Press, London. Peebles, E. D., R. W. Keirs, L. W. Bennett, T. S. Cummings, S. K. Whitmarsh, and P. D.
Gerard. 2005. Relationships among prehatch and posthatch physiological parameters in early nutrient restricted broilers hatched from eggs laid by young breeder hens. Poult Sci 84:454-461.
Peebles, E. D., W. D. Berry, R. W. Keirs, L. W. Bennett, and P. D. Gerard. 2006. Effects
of injected gluconeogenic supplementation on the performance of broilers from young breeders. Poult Sci 85:371-376.
Picardo, M., and A. J. Dickson. 1982. Hormonal regulation of glycogen metabolism in
hepatocyte suspensions isolated from chicken embryos. Comp Biochem Physiol B 71:689-693.
Potturi, P. V., J. A. Patterson, and T. J. Applegate. 2005. Effects of delayed placement on
intestinal characteristics in turkey poults. Poult Sci 84:816-824. Reddy, D. V., M. E. Lombardo, and L. R. Cerecedo. 1952. Nucleic acid changes during
the development of the chick embryo. J Biol Chem 198:267-270. Reidy, T. R., J. L. Atkinson, and S. Leeson. 1994. Strain comparison of turkey egg
components. Poult Sci 73:388-395. Richards, M. P. 1997. Trace mineral metabolism in the avian embryo. Poult Sci 76:152-
164. Ritchison, G. 2007. Avian reproduction: anatomy & the bird egg. BIO 554/754. website:
http://people.eku.edu/ritchisong/RITCHISO//avianreproduction.html Accessed May 2007.
100
Roberts, V. 1998. Poultry for anyone. Whittet Books, Suffolk, IP. Roberts, V. 2002. Ducks, geese and turkeys for anyone. Whittet Books, Sulffok, IP. Romanoff, A. L. 1967. Biochemistry of the avian embryo; a quantitative analysis of
prenatal development. Interscience Publishers, New York. Ruiz, A., and D. Bok. 1993. Direct RT-PCR amplification of mRNA supported on
membranes. Biotechniques 15:882-887. Sato, M., K. Murao, M. Mizobuchi, and J. Takahara. 1993. Quantitative and sensitive
northern blot hybridization using PCR-generated DNA probes labeled with digoxigenin by nick translation. Biotechniques 15:880-882.
Schaal, T., and G. Cherian. 2007. A survey of the hatchability of broiler and Turkey eggs
in the United States from 1985 through 2005. Poult Sci 86:598-600. Sharma, J. M., and B. R. Burmester. 1982. Resistance to Marek's disease at hatching in
chickens vaccinated as embryos with the turkey herpesvirus. Avian Dis 26:134-149. Sharma, J. M., and B. R. Burmester 1984. Disease Control in Avian Species by
Embryonal Vaccination. U.S. Patent no. 4,458,630. Shelton, T. 2006. Back to the future: a CEO's perspective of the broiler business. in
Poultry USA 7(5):28-31. Siegel, P. B., J. B. Dodgson, and L. Andersson. 2006. Progress from chicken genetics to
the chicken genome. Poult Sci 85:2050-2060. Simsa, S., and E. M. Ornan. 2007. Endochondral ossification process of the turkey
(Meleagris gallopavo) during embryonic and juvenile development. Poult Sci 86:565-571.
Smail, J. R. 1964. A possible role of the Musculus complexus in pipping the chicken egg.
Am Midl Nat 72:499-506. Smirnov, A., E. Tako, P. R. Ferket, and Z. Uni. 2006. Mucin gene expression and mucin
content in the chicken intestinal goblet cells are affected by in ovo feeding of carbohydrates. Poult Sci 85:669-673.
Smith, E. Y. 1937. Producing better poults at low costs: good breeds, good feed, proper
care of eggs and modern incubators are important factors. in Turkey World 12(2):16-18.

101
Smith, J., D. Speed, P. M. Hocking, R. T. Talbot, W. G. Degen, V. E. Schijns, E. J. Glass, and D. W. Burt. 2006. Development of a chicken 5 K microarray targeted towards immune function. BMC Genomics 7:49.
Smith, R. 2006a. Chicken needs 'more modest' expansion. in Feedstuffs 78(46):20. Smith, R. 2006b. Poultry industry must partner with researchers. in Feedstuffs 78(32):8. Smith, R. 2007a. Turkey consumption increases in response to consumer demand. in
Feedstuffs 79(8):6. Smith, T. W. 2007b. Avian embryo: stages of embryonic development in Book Avian
embryo: stages of embryonic development. Editor ed. Mississippi State University, City.
Solis de los Santos, F., A. M. Donoghue, M. B. Farnell, G. R. Huff, W. E. Huff, and D. J.
Donoghue. 2007. Gastrointestinal maturation is accelerated in turkey poults supplemented with a mannan-oligosaccharide yeast extract (Alphamune). Poult Sci 86:921-930.
Spielbauer, B., and F. Stahl. 2005. Impact of microarray technology in nutrition and food
research. Mol Nutr Food Res 49:908-917. Tako, E., P. R. Ferket, and Z. Uni. 2004. Effects of in ovo feeding of carbohydrates and
beta-hydroxy-beta-methylbutyrate on the development of chicken intestine. Poult Sci 83:2023-2028.
Tako, E., P. R. Ferket, and Z. Uni. 2005. Changes in chicken intestinal zinc exporter
mRNA expression and small intestinal functionality following intra-amniotic zinc-methionine administration. J Nutr Biochem 16:339-346.
Tona, K., F. Bamelis, B. De Ketelaere, V. Bruggeman, V. M. Moraes, J. Buyse, O.
Onagbesan, and E. Decuypere. 2003. Effects of egg storage time on spread of hatch, chick quality, and chick juvenile growth. Poult Sci 82:736-741.
Tona, K., O. Onagbesan, V. Bruggeman, K. Mertens, and E. Decuypere. 2005. Effects of
turning duration during incubation on embryo growth, utilization of albumen, and stress regulation. Poult Sci 84:315-320.
Tzschentke, B. 2007. Attainment of thermoregulation as affected by environmental
factors. Poult Sci 86:1025-1036. Uni, Z., S. Ganot, and D. Sklan. 1998. Posthatch development of mucosal function in the
broiler small intestine. Poult Sci 77:75-82.
102
Uni, Z., and P. R. Ferket 2003. Enhancement of development of oviparous species by in ovo feeding. U.S. Patent no. 6,592,878 B2.
Uni, Z., and P. R. Ferket. 2004. Methods for early nutrition and their potential. Worlds
Poult Sci J 60:101-111. Uni, Z., P. R. Ferket, E. Tako, and O. Kedar. 2005. In ovo feeding improves energy status
of late-term chicken embryos. Poult Sci 84:764-770. Uni, Z., P. R. Ferket, and E. Tako. 2006. In ovo feeding: impact on gut development,
energetic status, gene expression and growth performance. Pages 47-48 in The 29th Technical Turkey Conference. Turkey.
Van Koevering, M. T., H. G. Dolezal, D. R. Gill, F. N. Owens, C. A. Strasia, D. S.
Buchanan, R. Lake, and S. Nissen. 1994. Effects of beta-hydroxy-beta-methyl butyrate on performance and carcass quality of feedlot steers. J Anim Sci 72:1927-1935.
van Zyl, L. 2005. Introduction to microarrays. BIT 815J Manual. North Carolina State
University and SAS Institute Inc., Raleigh, NC. Velleman, S. G., and P. E. Mozdziak. 2005. Effects of posthatch feed deprivation on
heparan sulfate proteoglycan, syndecan-1, and glypican expression: implications for muscle growth potential in chickens. Poult Sci 84:601-606.
Velleman, S. G. 2007. Muscle development in the embryo and hatchling. Poult Sci
86:1050-1054. Wang, H., H. Li, Q. Wang, Y. Wang, H. Han, and H. Shi. 2006. Microarray analysis of
adipose tissue gene expression profiles between two chicken breeds. J Biosci 31:565-573.
Warner, J. D., P. R. Ferket, V. L. Christensen, and J. V. Felts. 2006. Effect of season,
hatch time, and post-hatch holding on glycogen status of turkey poults. Poult Sci 85(Suppl. 1):117 (Abstr.).
Weber, F. H., K. C. Genteman, M. A. LeMay, D. O. Lewis, Sr., and N. A. Evans. 2004.
Immunization of broiler chicks by in ovo injection of infective stages of Eimeria. Poult Sci 83:392-399.
Williams, C. J., D. L. Murray, and J. Brake. 2000. Development of a model to study
Aspergillus fumigatus proliferation on the air cell membrane of in ovo injected broiler eggs. Poult Sci 79:1536-1542.
Wikipedia. 2007. Pentose phosphate pathway.
http://en.wikipedia.org/wiki/Pentose_phosphate_pathway Accessed May 2007.
103
Winter, A. R., and E. M. Funk. 1960. Poultry, science and practice. 5th ed. Lippincott Company, Chicago.
Wiseman, G. 2002. State of the art and limitations of quantitative polymerase chain
reaction. J AOAC Int 85:792-796. Wolfinger, R. D., G. Gibson, E. D. Wolfinger, L. Bennett, H. Hamadeh, P. Bushel, C.
Afshari, and R. S. Paules. 2001. Assessing gene significance from cDNA microarray expression data via mixed models. J Comput Biol 8:625-637.
Wyatt, C. L., W. D. Weaver, Jr., and W. L. Beane. 1985. Influence egg size, eggshell
quality, and posthatch holding time on broiler performance. Poult Sci 64:2049-2055. Yadetie, F., A. K. Sandvik, H. Bergum, K. Norsett, and A. Laegreid. 2004. Miniaturized
fluorescent RNA dot blot method for rapid quantitation of gene expression. BMC Biotechnol 4:12.
Yalcin, S., S. Ozkan, M. Cabuk, and P. B. Siegel. 2003. Criteria for evaluating husbandry
practices to alleviate heat stress in broilers. J Appl Poult Res 12:382-388. Yalcin, S., S. Ozkan, M. Cabuk, and P. B. Siegel. 2004. Duration of tonic immobility,
leukocyte cell numbers and relative asymmetry in broilers under heat stress. Pages 290 in XXII World's Poultry Science Congress. Istanbul, Turkey (Abstr).
Yalcm, S., S. Ozkan, M. Cabuk, J. Buyse, E. Decuypere, and P. B. Siegel. 2005. Pre- and
postnatal conditioning induced thermotolerance on body weight, physiological responses and relative asymmetry of broilers originating from young and old breeder flocks. Poult Sci 84:967-976.
Yang, Y. H., M. J. Buckley, and T. P. Speed. 2001. Analysis of cDNA microarray
images. Brief Bioinform 2:341-349. Zakaria, A. H., P. W. Plumstead, H. Romero-Sanchez, N. Leksrisompong, J. Osborne,
and J. Brake. 2005. Oviposition pattern, egg weight, fertility, and hatchability of young and old broiler breeders. Poult Sci 84:1505-1509.
Zhan, J., H. D. Fahimi, and A. Voelkl. 1997. Sensitive nonradioactive dot
blot/ribonuclease protection assay for quantitative determination of mRNA. Biotechniques 22:500-505.
Zhan, X. A., M. Wang, H. Ren, R. Q. Zhao, J. X. Li, and Z. L. Tan. 2007. Effect of early
feed restriction on metabolic programming and compensatory growth in broiler chickens. Poult Sci 86:654-660.

104
Zhou, H., N. Deeb, C. M. Evock-Clover, A. D. Mitchell, C. M. Ashwell, and S. J. Lamont. 2007a. Genome-wide linkage analysis to identify chromosomal regions affecting phenotypic traits in the chicken. III. Skeletal integrity. Poult Sci 86:255-266.
Zhou, H., C. M. Evock-Clover, J. P. McMurtry, C. M. Ashwell, and S. J. Lamont. 2007b.
Genome-wide linkage analysis to identify chromosomal regions affecting phenotypic traits in the chicken. IV. Metabolic traits. Poult Sci 86:267-276.
105
Chapter 2
“Effect of carbohydrates, hydrolyzed soybean protein and methionine fed in ovo on turkey poult hatchability
and energy status at hatch”
Abstract
About twenty percent of turkey eggs set do not hatch, and as many as thirty percent suffer
from growth depression during brooding. Many of these weak poults do not survive the
first week post-hatch. In ovo feeding (IOF) has been demonstrated to be a method to
enhance turkey embryo energy status and gut maturation, with the goal of increasing
hatchability and post-hatch development. Previous studies included egg white protein
(EWP) in IOF solutions to supply turkey embryos more protein, found to be more
effective than in chickens. However, EWP does not dissolve easily in a saline IOF
solution, and it cannot be heat-sterilized. A more soluble and heat-stable alternative to
EWP, hydrolyzed soy protein (HSP), was evaluated for IOF application. Two
experiments tested IOF solutions containing different levels of HSP combined with
carbohydrate (CHO) and β-hydroxyl-β-methylbutyrate (HMB), with and without
methionine, and compared it to non-injected controls (NC) and embryos in ovo-fed CHO
alone. IOF solutions containing CHO or 4% HSP increased hatchability in the first trial.
In contrast, 8% HSP with or without methionine reduced hatchability in both trials,
although hatched poults of these treatments were heavier at hatch as compared to NC
(P<0.06). IOF of protein increased liver glycogen concentration measured in the first
trial. All IOF-treated poults consumed more feed than NC poults during the first 6 hours
106
post-hatch in the second trial. IOF of HSP may improve poult viability and vigor at hatch,
but more research is needed to learn how to avoid its adverse effect on hatchability.
Introduction
Turkey poults face many challenges during late-term incubation, including limited
oxygen supply, amnion consumption, switching from lipid to carbohydrate metabolism,
glycogen accumulation, internal and external pipping, until they finally hatch (Donaldson
and Christensen, 1991; Christensen et al., 2003; Uni and Ferket, 2004; Moran, 2007).
Many embryos struggle during these events and may enter one or more phases of the
General Adaptation Syndrome (GAS) (Donaldson et al., 1991). Many problems identified
with these embryos are associated to a low energy status (Christensen et al., 1996; Uni et
al., 2005; Uni et al., 2006). Depleted energy reserves can result in poor quality poults,
stunted growth, or death during hatch or the first days post-hatch (Uni and Ferket, 2004).
Feeding embryos in ovo was suggested as a way to help embryos overcome these
challenges by adding nutrients to the amniotic fluid that will be orally consumed prior to
internal pipping (Uni and Ferket, 2003). Previous studies tested solutions containing
carbohydrates (Tako et al., 2004), egg white protein (Foye, 2005; Foye et al., 2006), and
intestinal modulators like zinc methionine and β-hydroxyl-β-methylbutyrate (HMB)
(Tako et al., 2004; Tako et al., 2005; Foye et al., 2006). Turkey poults are believed to
have higher protein requirements than chicks early in life, most of which is supplied by
dietary inclusion of soybean meal (Donaldson and Christensen, 1991; Donaldson, 1995).
The amino acid methionine is supplemented in poultry diets because it is the first limiting
amino acid in corn-soy based diets (National Research Council, 1994). Egg white was the
logical protein source to be fed in ovo because it is the predominant protein source
107
available to the embryos (Foye, 2005), but its use in commercial IOF applications is not
feasible because of functional and microbial quality constraints. Egg white protein (EWP)
does not completely dissolve in the saline IOF solutions, and it foams upon agitation.
Moreover, EWP is susceptible to microbial contamination and it cannot be heat-sterilized
without coagulation. In contrast, hydrolyzed soy protein (HSP), used predominantly in
microbial fermentation applications, is soluble in saline solutions and it can be heat-
sterilized with minimal change to its physical properties (Kerry Bio-Sciences, 2007). The
objective of this study was to evaluate the efficacy of HSP as a protein ingredient of IOF
solutions for turkey embryos. This objective was addressed by two experiments that
evaluated the effects of levels of HSP in saline IOF solutions containing carbohydrates or
HMB on hatchability and indicators of energy status, and compared this treatment to
negative and positive controls. Because HSP has lower methionine content in comparison
to EWP, the efficacy of methionine supplementation to IOF solutions containing HSP
was also evaluated.
Material and Methods
Experiment 1
Four-hundred Nicholas turkey eggs from 12 weeks of lay hens were obtained
from a commercial source1 and incubated2 at the North Carolina State University Turkey
Unit3. At 20 days of incubation, eggs were candled and divided into 4 groups with similar
weight distribution, averaging 90g (±15). Eggs were injected with IOF solution according
to assigned treatments at 24 days of incubation (E). The treatments tested were: 1) non- 1 Prestage Farms, Clinton, NC 2 Jamesway incubator setter and hatcher model 252 3 Lake Wheeler Field Laboratory, Raleigh, NC

108
injected controls (NC); 2) IOF carbohydrates (13% dextrin + 5% glucose + 0.1% HMB)
(CHO); 3) IOF carbohydrates plus 8% HSP4 (6% dextrin + 8% HSP + 0.1% HMB)
(CP1); and 4) IOF carbohydrates plus 4% HSP (10% dextrin + 6% maltose + 4% HSP +
0.1% HMB) (CP2). All IOF solutions were prepared in a 0.4% NaCl sterile solution, and
formulated to an osmolality of 650 mOsm, which was determined by Ferket et al. (2005)
to be the upper limit to prevent hatchability problems. A standard curve of solution
osmolality X HSP concentration in 0.4% saline was determined in order to identify the
maximum inclusion level of HSP within a 650 mOsm IOF solution (Figure 1).
Osmolality was measured using a Micro Osmometer5.
At the day of injection eggs were removed from the incubator, candled and
marked on the side of the egg to locate the amnion. After the eggs were sprayed with a
chlorine-based disinfecting solution using hand plant mister, a hole was punched at the
marked spot on the shell over the amnion using a 22 gauge needle secured on a rubber
stopper, and 1.5 ml of the respective IOF solution was injected into the amniotic cavity.
All eggs remained outside the incubator for the same amount of time to complete the IOF
treatment, including the NC treatment group. After injection, the injection hole was
sealed with cellophane tape and the eggs were placed back in the hatching incubator.
Experiment 2
Four-hundred Hybrid turkey eggs from 12 weeks of lay hens were obtained from
the same source1 and incubated2 as in experiment 1. At 20 days of incubation the eggs
were removed from the incubator, candled to remove infertile eggs, and divided into 4
groups with similar weight distribution, averaging 80g (±15). Eggs were injected on 24E 4 HY SOY, Kerry Bio-Science, Chicago, IL 5 Model 3300, Advanced Instruments, Inc., Norwood, MA
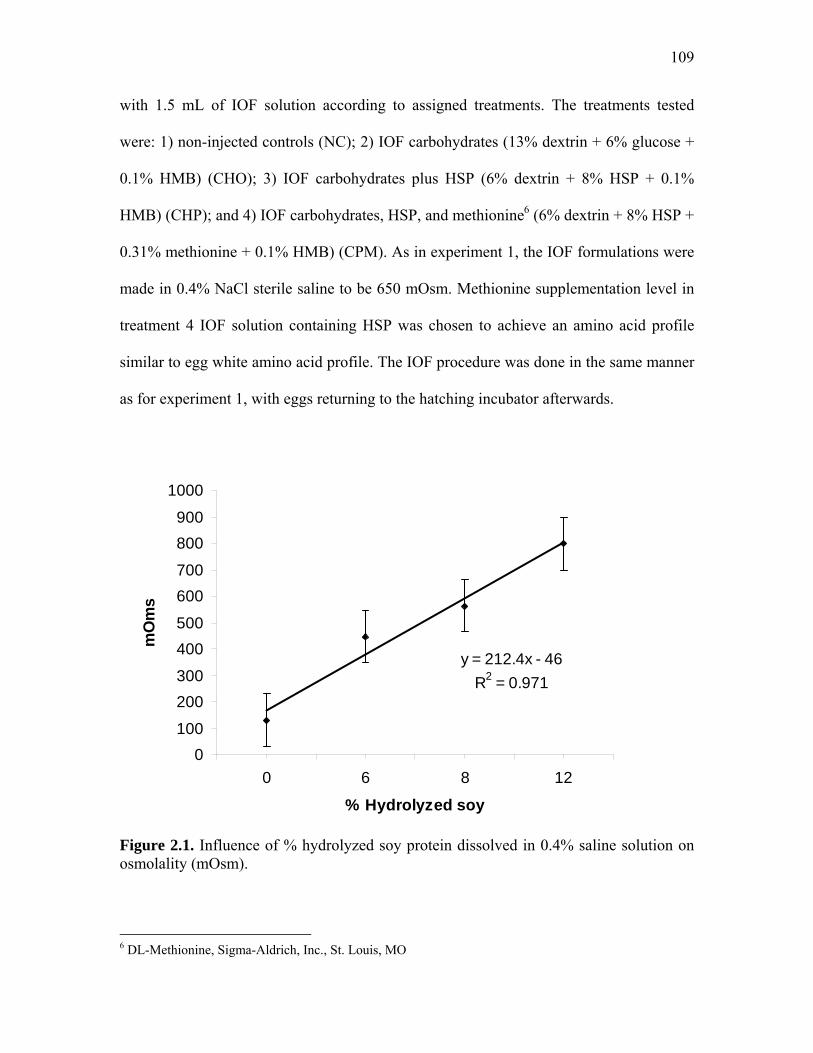
109
with 1.5 mL of IOF solution according to assigned treatments. The treatments tested
were: 1) non-injected controls (NC); 2) IOF carbohydrates (13% dextrin + 6% glucose +
0.1% HMB) (CHO); 3) IOF carbohydrates plus HSP (6% dextrin + 8% HSP + 0.1%
HMB) (CHP); and 4) IOF carbohydrates, HSP, and methionine6 (6% dextrin + 8% HSP +
0.31% methionine + 0.1% HMB) (CPM). As in experiment 1, the IOF formulations were
made in 0.4% NaCl sterile saline to be 650 mOsm. Methionine supplementation level in
treatment 4 IOF solution containing HSP was chosen to achieve an amino acid profile
similar to egg white amino acid profile. The IOF procedure was done in the same manner
as for experiment 1, with eggs returning to the hatching incubator afterwards.
y = 212.4x - 46R2 = 0.971
0100
200300
400500
600700
800900
1000
0 6 8 12
% Hydrolyzed soy
mO
ms
Figure 2.1. Influence of % hydrolyzed soy protein dissolved in 0.4% saline solution on osmolality (mOsm).
6 DL-Methionine, Sigma-Aldrich, Inc., St. Louis, MO
110
Tissue Sampling and Glycogen Determination
In both experiments, the hatch was pulled at 672 hours of incubation (28E) and
counted by treatment to determine percent hatchability. The poults were then individually
weighted and 15 from each treatment group were randomly selected for sampling. In the
first experiment, sampled poults were euthanized by cervical dislocation and livers were
removed, and placed immediately on ice for future glycogen analysis. In both
experiments, remaining yolk sac was removed from 15 poults and weighted to calculate
yolk-free body weight (YFBW). Liver samples were frozen at -20C until they were
processed for glycogen analysis. Glycogen concentration was determined by colorimetric
method of iodine binding (Dreiling et al., 1987). Remaining poults were euthanized using
CO2. The experimental protocols were approved by the North Carolina State University
Institutional Animal Care and Use Committee.
Feeding Behavior Test
Poults hatched in the second experiment were submitted to a feeding behavior test
to observe eagerness to feed intake initiation by determining the amount of feed
consumed over a 6 hr period. Four hr post-hatch, 60 poults of the same IOF treatment
were placed in transport boxes and allotted 30g of turkey starter feed each in 100 cm2
trays. The boxes were open and placed under brooding heat lamps. The amount of feed
remaining on each tray was recorded after one, three and six hours after placement.
Statistical Analysis
Both experimental designs were completely randomized, with four treatments and
100 replicates (poults) per treatment, with exception of % yolk, YFBW and glycogen
111
analysis which had 15 replicates per treatment. The data was analyzed using general
linear models procedure of SAS (SAS Institute. 2004) for analysis of variance.
Comparisons between treatments were made using least-square-means test (lsmeans), and
differences were considered significant at P<0.05, when not otherwise indicated.
Results and Discussion
Experiment 1
Hatchability results are shown on Table 2.1. CHO and CP2 treated poults had
hatchability 6-7% higher than NC (Table 2.1), evidently a consequence of fewer live
pipped embryos at hatch (Table 2.1). A decreased rate of live pipped embryos among the
NC embryos demonstrated their struggle to hatch, which was minimized by IOF.
Struggling embryos can eventually deplete their energy sources and die. Embryo
mortality and those pipping reduced hatchability of the CP1 group by 6% below NC,
indicating distress embryos. About 3% of embryos were unintentionally injected into the
right pectoral muscle with the CHO and CP2 IOF solutions (Table 2.1), which is typical
of in ovo injection applications (Sharma and Burmester, 1982).
Body weights at hatch are presented in Table 2.2, and YFBW and percent
remaining yolk are presented in Table 2.3. Poults in ovo-fed 8% HSP (CP1) were heavier
than poults of all other treatments (Table 2.2). This difference in BW was likely
attributed to increased residual yolk reserves, since there was no difference in YFBW
among treatments (Table 2.3). Apparently, IOF solutions containing HSP delayed yolk
utilization, which can also be influenced by accelerated hatching time. Metabolic stress,
caused by embryo’s need to metabolize amino acids could have accelerated hatching and
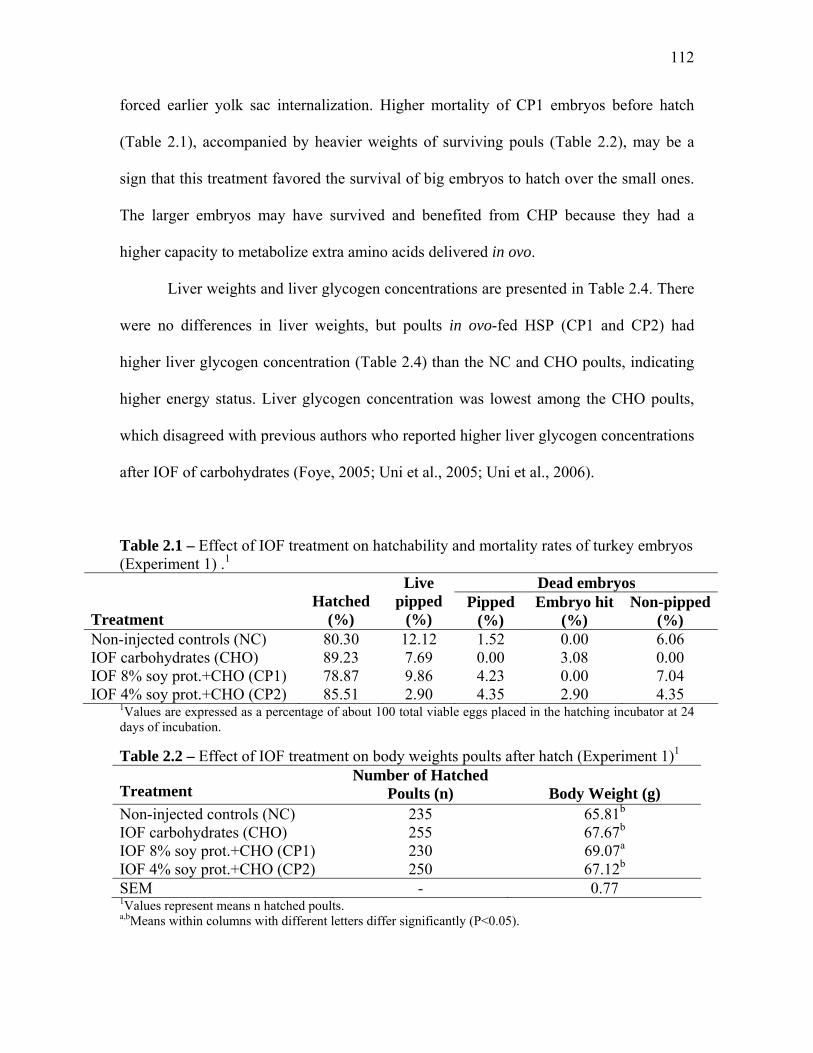
112
forced earlier yolk sac internalization. Higher mortality of CP1 embryos before hatch
(Table 2.1), accompanied by heavier weights of surviving pouls (Table 2.2), may be a
sign that this treatment favored the survival of big embryos to hatch over the small ones.
The larger embryos may have survived and benefited from CHP because they had a
higher capacity to metabolize extra amino acids delivered in ovo.
Liver weights and liver glycogen concentrations are presented in Table 2.4. There
were no differences in liver weights, but poults in ovo-fed HSP (CP1 and CP2) had
higher liver glycogen concentration (Table 2.4) than the NC and CHO poults, indicating
higher energy status. Liver glycogen concentration was lowest among the CHO poults,
which disagreed with previous authors who reported higher liver glycogen concentrations
after IOF of carbohydrates (Foye, 2005; Uni et al., 2005; Uni et al., 2006).
Table 2.1 – Effect of IOF treatment on hatchability and mortality rates of turkey embryos (Experiment 1) .1
Dead embryos Treatment
Hatched
(%)
Live pipped
(%) Pipped
(%) Embryo hit
(%) Non-pipped
(%) Non-injected controls (NC) 80.30 12.12 1.52 0.00 6.06 IOF carbohydrates (CHO) 89.23 7.69 0.00 3.08 0.00 IOF 8% soy prot.+CHO (CP1) 78.87 9.86 4.23 0.00 7.04 IOF 4% soy prot.+CHO (CP2) 85.51 2.90 4.35 2.90 4.35
1Values are expressed as a percentage of about 100 total viable eggs placed in the hatching incubator at 24 days of incubation. Table 2.2 – Effect of IOF treatment on body weights poults after hatch (Experiment 1)1
Treatment Number of Hatched
Poults (n)
Body Weight (g) Non-injected controls (NC) 235 65.81b IOF carbohydrates (CHO) 255 67.67b IOF 8% soy prot.+CHO (CP1) 230 69.07a IOF 4% soy prot.+CHO (CP2) 250 67.12b SEM - 0.77 1Values represent means n hatched poults. a,bMeans within columns with different letters differ significantly (P<0.05).
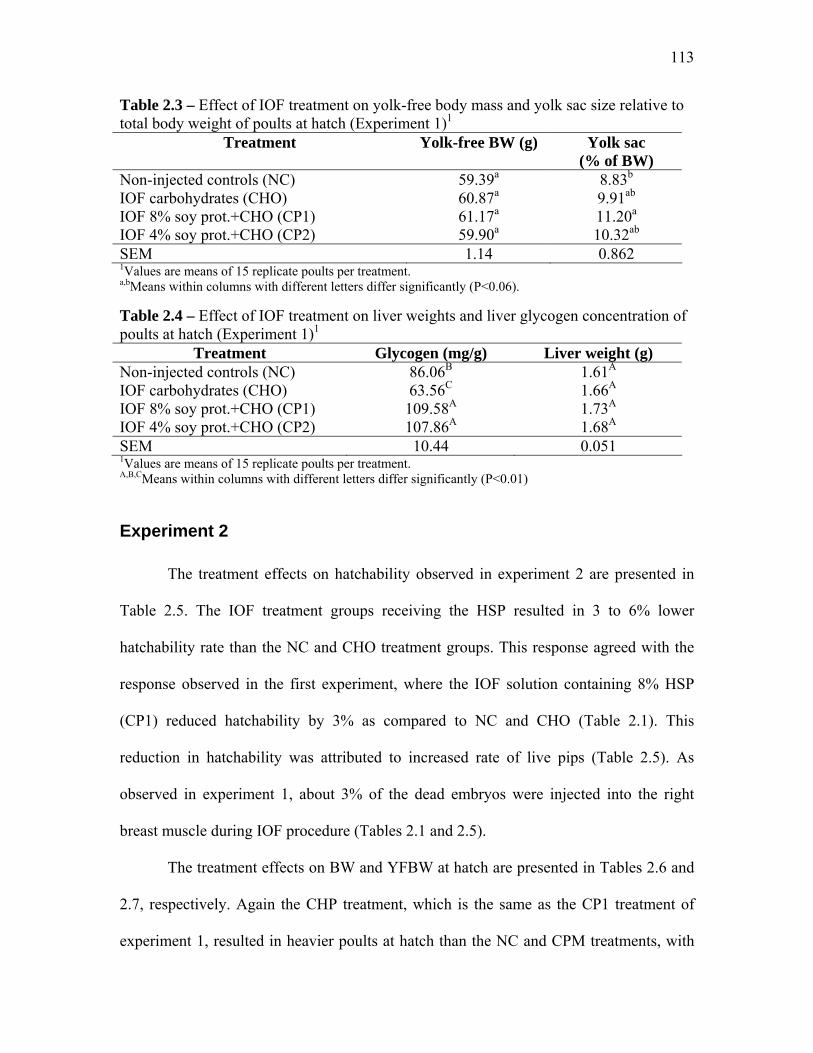
113
Table 2.3 – Effect of IOF treatment on yolk-free body mass and yolk sac size relative to total body weight of poults at hatch (Experiment 1)1
Treatment Yolk-free BW (g) Yolk sac (% of BW)
Non-injected controls (NC) 59.39a 8.83b IOF carbohydrates (CHO) 60.87a 9.91ab IOF 8% soy prot.+CHO (CP1) 61.17a 11.20a IOF 4% soy prot.+CHO (CP2) 59.90a 10.32ab SEM 1.14 0.862 1Values are means of 15 replicate poults per treatment. a,bMeans within columns with different letters differ significantly (P<0.06). Table 2.4 – Effect of IOF treatment on liver weights and liver glycogen concentration of poults at hatch (Experiment 1)1
Treatment Glycogen (mg/g) Liver weight (g) Non-injected controls (NC) 86.06B 1.61A IOF carbohydrates (CHO) 63.56C 1.66A IOF 8% soy prot.+CHO (CP1) 109.58A 1.73A IOF 4% soy prot.+CHO (CP2) 107.86A 1.68A SEM 10.44 0.051 1Values are means of 15 replicate poults per treatment. A,B,CMeans within columns with different letters differ significantly (P<0.01)
Experiment 2
The treatment effects on hatchability observed in experiment 2 are presented in
Table 2.5. The IOF treatment groups receiving the HSP resulted in 3 to 6% lower
hatchability rate than the NC and CHO treatment groups. This response agreed with the
response observed in the first experiment, where the IOF solution containing 8% HSP
(CP1) reduced hatchability by 3% as compared to NC and CHO (Table 2.1). This
reduction in hatchability was attributed to increased rate of live pips (Table 2.5). As
observed in experiment 1, about 3% of the dead embryos were injected into the right
breast muscle during IOF procedure (Tables 2.1 and 2.5).
The treatment effects on BW and YFBW at hatch are presented in Tables 2.6 and
2.7, respectively. Again the CHP treatment, which is the same as the CP1 treatment of
experiment 1, resulted in heavier poults at hatch than the NC and CPM treatments, with
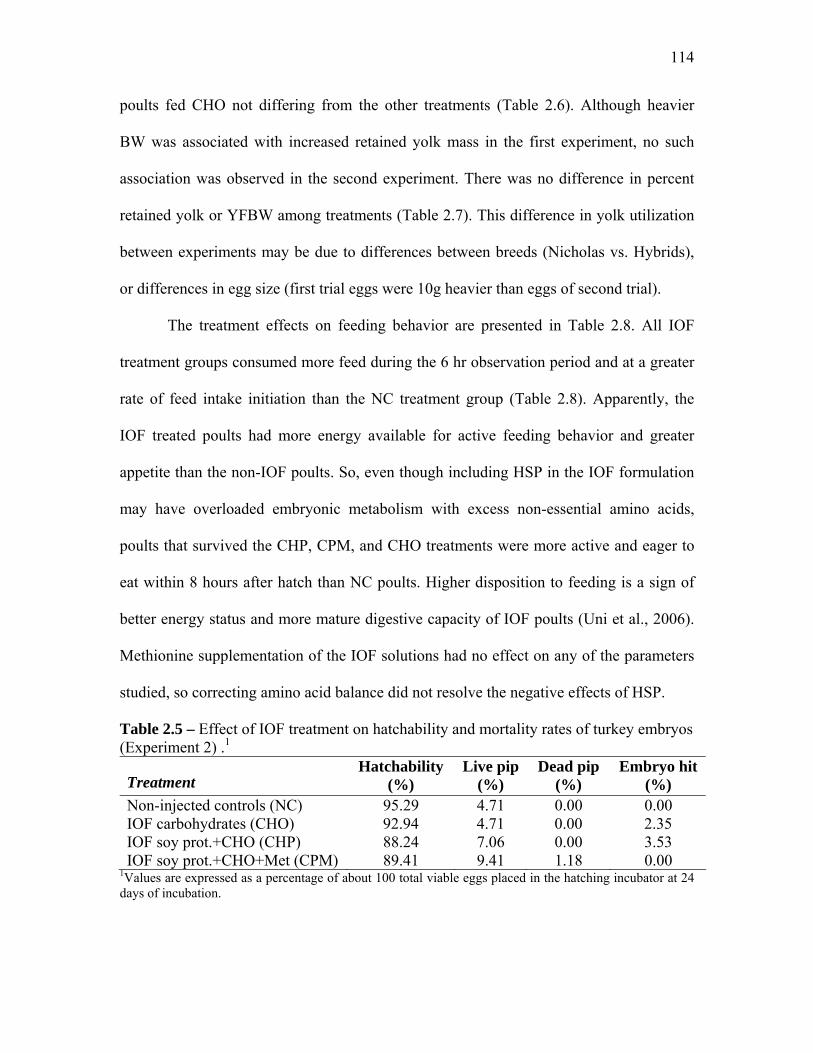
114
poults fed CHO not differing from the other treatments (Table 2.6). Although heavier
BW was associated with increased retained yolk mass in the first experiment, no such
association was observed in the second experiment. There was no difference in percent
retained yolk or YFBW among treatments (Table 2.7). This difference in yolk utilization
between experiments may be due to differences between breeds (Nicholas vs. Hybrids),
or differences in egg size (first trial eggs were 10g heavier than eggs of second trial).
The treatment effects on feeding behavior are presented in Table 2.8. All IOF
treatment groups consumed more feed during the 6 hr observation period and at a greater
rate of feed intake initiation than the NC treatment group (Table 2.8). Apparently, the
IOF treated poults had more energy available for active feeding behavior and greater
appetite than the non-IOF poults. So, even though including HSP in the IOF formulation
may have overloaded embryonic metabolism with excess non-essential amino acids,
poults that survived the CHP, CPM, and CHO treatments were more active and eager to
eat within 8 hours after hatch than NC poults. Higher disposition to feeding is a sign of
better energy status and more mature digestive capacity of IOF poults (Uni et al., 2006).
Methionine supplementation of the IOF solutions had no effect on any of the parameters
studied, so correcting amino acid balance did not resolve the negative effects of HSP.
Table 2.5 – Effect of IOF treatment on hatchability and mortality rates of turkey embryos (Experiment 2) .1
Treatment Hatchability
(%) Live pip
(%) Dead pip
(%) Embryo hit
(%) Non-injected controls (NC) 95.29 4.71 0.00 0.00 IOF carbohydrates (CHO) 92.94 4.71 0.00 2.35 IOF soy prot.+CHO (CHP) 88.24 7.06 0.00 3.53 IOF soy prot.+CHO+Met (CPM) 89.41 9.41 1.18 0.00
1Values are expressed as a percentage of about 100 total viable eggs placed in the hatching incubator at 24 days of incubation.
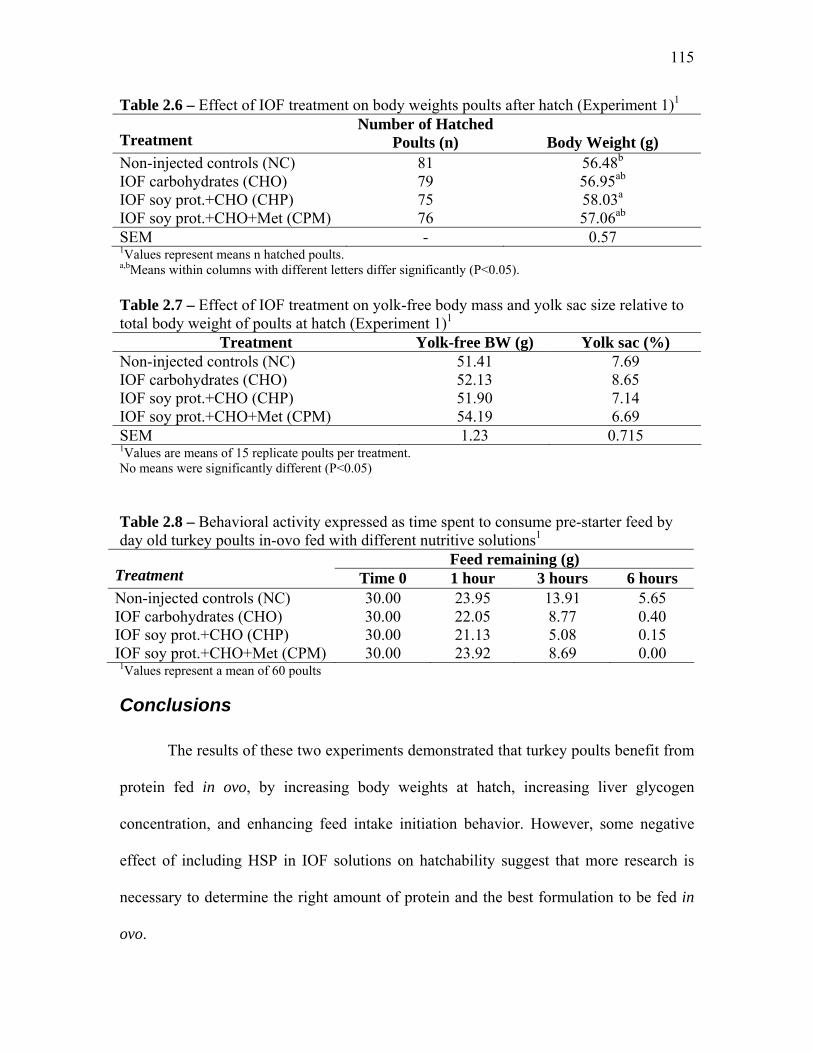
115
Table 2.6 – Effect of IOF treatment on body weights poults after hatch (Experiment 1)1
Treatment Number of Hatched
Poults (n)
Body Weight (g) Non-injected controls (NC) 81 56.48b IOF carbohydrates (CHO) 79 56.95ab IOF soy prot.+CHO (CHP) 75 58.03a IOF soy prot.+CHO+Met (CPM) 76 57.06ab SEM - 0.57 1Values represent means n hatched poults. a,bMeans within columns with different letters differ significantly (P<0.05). Table 2.7 – Effect of IOF treatment on yolk-free body mass and yolk sac size relative to total body weight of poults at hatch (Experiment 1)1
Treatment Yolk-free BW (g) Yolk sac (%) Non-injected controls (NC) 51.41 7.69 IOF carbohydrates (CHO) 52.13 8.65 IOF soy prot.+CHO (CHP) 51.90 7.14 IOF soy prot.+CHO+Met (CPM) 54.19 6.69 SEM 1.23 0.715 1Values are means of 15 replicate poults per treatment. No means were significantly different (P<0.05) Table 2.8 – Behavioral activity expressed as time spent to consume pre-starter feed by day old turkey poults in-ovo fed with different nutritive solutions1
Feed remaining (g) Treatment Time 0 1 hour 3 hours 6 hours Non-injected controls (NC) 30.00 23.95 13.91 5.65 IOF carbohydrates (CHO) 30.00 22.05 8.77 0.40 IOF soy prot.+CHO (CHP) 30.00 21.13 5.08 0.15 IOF soy prot.+CHO+Met (CPM) 30.00 23.92 8.69 0.00
1Values represent a mean of 60 poults
Conclusions
The results of these two experiments demonstrated that turkey poults benefit from
protein fed in ovo, by increasing body weights at hatch, increasing liver glycogen
concentration, and enhancing feed intake initiation behavior. However, some negative
effect of including HSP in IOF solutions on hatchability suggest that more research is
necessary to determine the right amount of protein and the best formulation to be fed in
ovo.
116
References Christensen, V. L., W. E. Donaldson, and J. P. McMurtry. 1996. Physiological
differences in late embryos from turkey breeders at different ages. Poult Sci 75:172-178.
Christensen, V. L., D. T. Ort, and J. L. Grimes. 2003. Physiological factors associated
with weak neonatal poults (Meleagris gallopavo). Int J Poult Sci 2:7-14. Donaldson, W. E., and V. L. Christensen. 1991. Dietary carbohydrate level and glucose
metabolism in turkey poults. Comp Biochem Physiol A 98:347-350. Donaldson, W. E., V. L. Christensen, and K. K. Krueger. 1991. Effects of stressors on
blood glucose and hepatic glycogen concentrations in turkey poults. Comp Biochem Physiol A 100:945-947.
Donaldson, W. E. 1995. Carbohydrate, hatchery stressors affect poult survival. in
Feedstauffs 67(14):16-17. Dreiling, C. E., D. E. Brown, L. Casale, and L. Kelly. 1987. Muscle glycogen:
comparison of iodine binding and enzyme digestion assays and application to meat samples. Meat Science 20:167-177.
Ferket, P., J. de Oliveira, A. Ghane, and Z. Uni, 2005. Effect of in ovo feeding solution
osmolality on hatching turkeys. Poultry Science 84 (Supplement 1):118. Foye, O. T. 2005. The biochemical and molecular effects of amnionic nutrient
administration, “in ovo feeding” on intestinal development and function and carbohydrate metabolism in turkey embryos and poults. Ph.D. Dissertation. North Carolina State University. Raleigh, NC.
Foye, O. T., Z. Uni, and P. R. Ferket. 2006. Effect of in ovo feeding egg white protein,
beta-hydroxy-beta-methylbutyrate, and carbohydrates on glycogen status and neonatal growth of turkeys. Poult Sci 85:1185-1192.
Kerry Bio-Science. 2007. Enzymatic digestion of soy meal. in Product Information Sheet
Hy-Soy (5X59022). Kerry Bio-Science. Norwich, NY Moran, E. T., Jr. 2007. Nutrition of the developing embryo and hatchling. Poult Sci
86:1043-1049. National Research Council, 1994. Nutrient requirements for poultry. 9th rev. ed. National
Academy Press, Washington, DC. SAS Institute. 2004. SAS/STAT User's guide: statistics. SAS Institute, Cary. NC.

117
Sharma, J. M., and B. R. Burmester. 1982. Resistance to Marek's disease at hatching in chickens vaccinated as embryos with the turkey herpesvirus. Avian Dis 26:134-149.
Tako, E., P. R. Ferket, and Z. Uni. 2004. Effects of in ovo feeding of carbohydrates and
beta-hydroxy-beta-methylbutyrate on the development of chicken intestine. Poult Sci 83:2023-2028.
Tako, E., P. R. Ferket, and Z. Uni. 2005. Changes in chicken intestinal zinc exporter
mRNA expression and small intestinal functionality following intra-amniotic zinc-methionine administration. J Nutr Biochem 16:339-346.
Uni, Z., and P. R. Ferket 2003. Enhancement of development of oviparous species by in
ovo feeding. U.S. Patent no. 6,592,878 B2. Uni, Z., and P. R. Ferket. 2004. Methods for early nutrition and their potential. Worlds
Poult Sci J 60:101-111. Uni, Z., P. R. Ferket, E. Tako, and O. Kedar. 2005. In ovo feeding improves energy status
of late-term chicken embryos. Poult Sci 84:764-770. Uni, Z., P. R. Ferket, and E. Tako. 2006. In ovo feeding: impact on gut development,
energetic status, gene expression and growth performance. Pages 47-48 in The 29th Technical Turkey Conference. Turkey.
118
Chapter 3
“Effect of in ovo feeding saline solutions with or without carbohydrate and protein on turkey poult hatchability,
energy status and growth up to 14 days of age”
Abstract
Many physical or chemical characteristics of the egg or conditions during incubation can
cause metabolic distress of turkey embryos and thus adversely affect the hatchability of
poults. Low energy status often results in poor vitality or even death from the time of
internal pipping until the first couple days post-hatch. Two experiments were conducted
to investigate the effects of in ovo feeding (IOF) a saline solution or saline containing
other nutrients (beta-hydroxy-beta-methylbutyrate, hydrolyzed soy protein and dextrin)
on energy status and growth performance of turkey poults from 1 to 14 d post-hatch. In
comparison to non-injected controls, IOF of saline or other nutrients did not affect
hatchability, body weight, or organ size at hatch, but it increased glycogen concentration
in the liver and in the hatching muscle. Toms gained more weights than hens throughout
the studies. Pectoral muscle size was the same for all treatments at 14 days of age.
Although higher energy status did not affect body weight or pectoral muscle at 14d, some
differences were observed during development, so other quality or immune parameters
not included in this study may have also been affect. Future research will address this
possibility and improvements to in ovo feeding formulation.
119
Introduction
Turkey poults are considered difficult to start because of high incidence of weak
poults (Christensen et al., 2003), “flip-overs” (Noble et al., 1999), and “starve-outs”
(Christensen, et al., 2003). Mortality rate during the first week after hatch may be as high
as 6% of the flock placement, and 10 to 30% of the surviving poults may exhibit
depressed growth (Christensen et al., 2003). These viability problems among so many
poults are predominately a consequence of their low energy status, which were depleted
during hatching, servicing, holding, and transport (Wyatt et al., 1985; Donaldson and
Christensen, 1991; Donaldson et al., 1991; Uni and Ferket, 2004; Careghi et al., 2005).
Compounding this effect is the poor ability to replenish their energy reserves once they
gain access to feed because of enteric immaturity and low digestive capacity (Uni et al.,
1998; Uni et al., 1999). In ovo feeding (IOF) embryos nutrients to the amnion prior to
hatch was proposed by Uni and Ferket (2003) to help increase poult quality and survival.
Previous studies demonstrated that IOF can enhance energy status (Foye et al., 2006) and
gut maturation of developing embryos (Tako et al., 2004; Smirnov et al., 2006). Turkey
poults are believed to require more protein in their diets than broiler chicks, so Foye
(2005) investigated the addition of a protein source in IOF solutions. Egg white was the
logical protein source to be fed in ovo because it is the predominant protein source
available to the embryos (Foye, 2005), but its use in commercial IOF applications is not
feasible because of functional and microbial quality constraints. Egg white protein (EWP)
does not completely dissolve in the saline IOF solutions, and it foams upon agitation.
Moreover, EWP is susceptible to microbial contamination and it cannot be heat-sterilized
120
without coagulation. In contrast, hydrolyzed soy protein (HSP), used predominantly in
microbial fermentation applications, is soluble in saline solutions and it can be heat-
sterilized with minimal change to its physical properties (Kerry Bio-Science, 2007). The
objective of this study was to evaluate the effects of IOF turkey embryos with HSP
combined with carbohydrates on hatchability, poult energy status and post-hatch
development.
Material and Methods
Two experiments were carried out each utilizing 840 Nicholas turkey eggs from
12 week of lay hens obtained from a commercial hatchery1. These eggs were incubated
using standard industry procedure at Pfizer-Embrex2. At 20 days of incubation (E), the
eggs were candled to remove infertile eggs, and then they were sorted into 3 groups with
a similar distribution of weights. In ovo injection was performed manually on 24E,
injecting from the blunt side of the egg, and caring that all eggs stayed outside the
incubator for the same amount of time. The treatments tested were: 1) non-injected
control (NC), 2) IOF 0.4% NaCl solution (SC), and 3) IOF carbohydrate-protein solution
(6% dextrin + 8% HSP3 + 0.1% HMB4 + 0.4% NaCl) (CHP). All procedures were
performed the same in both experiments, with the only difference being the volume of the
IOF solution administered into the amnion, which were 1.5 mL and 1.0 mL for
experiments 1 and 2, respectively. At about 672 hrs of incubation (28E), all hatching
trays were pulled out, and the number of hatched and unhatched eggs was counted.
Fifteen poults per treatment were randomly selected for sampling, while the remaining
1 Prestage Farms, Clinton, NC 2 Research Triangle Park, Durham, NC 3 Kerry Bio-Science, Chicago, IL
121
poults were transported to NCSU Turkey Research Unit4, where they were sexed, neck
tagged, weighed, and divided by sex and treatment among 12 floor pens containing about
55 poults per pen. At 7 and 14 days post-hatch, the poults in each pen were individually
weighed, and the feed consumption per pen was measured to determine feed conversion
for each age period.
Tissue Sampling and Glycogen Analysis
At day of hatch, sample birds (15 replicates per treatment) were euthanized by
cervical dislocation and liver, pectoral muscle and hatching muscle were harvested and
immediately placed on ice for about 2 hours, and then stored at -20C until processing for
glycogen content analysis. Glycogen concentration [GLY] was measured by the iodine
binding method (Dreiling et al., 1987). The remaining yolk sac was removed and
weighed to calculate yolk-free body weight (YFBW). Fifteen birds per treatment were
also sampled at 7 and 14 days post-hatch to determine pectoral muscle weight.
Housing and Animal care
Each of the 12, 10 m2 floor pens was furnished with 4 cm of soft pine shavings as
litter, and equipped with a 125 watt bulb heat lamp, an automatic water drinker5 and a
tube feeder6. Each pen was populated with 55 male or female poults and assigned to one
of the three IOF treatments. These poults were housed in a curtained-sided, temperature-
controlled building equipped with ceiling-mounted mixing fans to prevent air
stratification and incandescent lights scattered throughout the house for uniform
4 Lake Wheeler Field Laboratory, Raleigh, NC 5 Plasson® 6 Shenandoah®

122
illumination. Temperature inside the house was kept between 29 and 31C during the first
week, and then it was gradually reduced by 3C every week. The birds received 23 hr
light: 1 hr dark each day, and water and feed was offered at libitum. The same feed
formulated to meet or exceed NRC requirements (National Research Council, 1994) was
offered to all treatment pens.
All experimental protocols were approved by the Institutional Animal Care and
Use Committee at North Carolina State University.
Statistical Analysis
The experiment was designed as a 3 X 2 completely randomized factorial,
consisting of 3 IOF treatments and 2 genders. Each gender X IOF treatment combination
was replicated in two pens, each containing 55 poults. Samples collected at day of hatch
were analyzed with 15 replicates per treatment. The data was analyzed using the general
linear models GLM procedure of SAS (SAS Institute. 2004) and differences between
means were tested by least-square-means (lsmeans) with significance at P<0.05.
Results
The IOF solution osmolality used in both experiments was determined7 to be 120
mOsm for the SC solution and 620 mOsm for CHP. Accuracy of manual IOF injection
technique was validated to exceed 90% amnion target by opening 40 eggs injected with
0.3% coumasie blue dye in ethanol.
In the first experiment, hatchability was 87.96% for NC, 88.51% for SC and
83.02% for CHP. Hatchability of the second experiment was 86.50% for NC, 89.4% for
7 Micro Osmometer Model 3300, Advanced Instruments, Inc., Norwood, MA
123
SC and 90.47% for CHP. Apparently, the hatchability rate of the CHP treatment group
was 5% lower than the other 2 treatments in the first experiment, but this disadvantage
was eliminated by reducing the volume of IOF solution injected in the second trial.
There were no interaction effects between IOF treatment and gender for any of
the studied parameters, except for pectoral muscle weight at 7d of age in the first
experiment. BW of poults according to treatment and gender in both experiments are
presented on Table 3.1. There was no IOF treatment or gender effects on BW at hatch in
either experiment (Table 3.1). Yolk weight averaged 6.07g (±0.57) and 3.35g (±0.27) in
experiments 1 and 2, respectively. YFBW averaged 55.14g (±1.12) and 49.07g (±0.94) in
experiments 1 and 2. However, there were no significant treatment effects on yolk weight
or YFBW. The treatment effects on weight and [GLY] of the tissues sampled at hatch are
presented in Table 3.2. Although IOF treatment did not affect tissue size at hatch, [GLY]
was significantly affected in all tissues with exception of pectoral muscle in experiment 1
(Table 3.2). IOF of saline or CHP increased [GLY] in the hatching muscle and liver, as
compared to NC in experiment 1 (Table 3.2). In experiment 2, [GLY] in hatching muscle
was highest in the CHP treatment group, followed by SC and least for NC. The SC
treatment group had higher [GLY] in pectoral muscle than the other two treatment
groups. In contrast, liver [GLY] was higher in the CHP treatment group than in the SC
group, with the NC group intermediately (Table 3.2).
No significant interaction effects between IOF treatments and gender were found
on BW at 7 and 14d. BW of poults from both experiments on day 7 and 14 is presented
on Tables 3.3 and 3.4, respectively. The WG data during all age phases in both
experiments is presented in Table 3.5. There was no difference between IOF treatments

124
for BW on day 7 in experiment 1, but 7 d BW of the CHP-treated poults was greater than
the SC poult, with NC not differing from either group (Table 3.3). As expected, males
were heavier than females at 7 d in both experiments. There were no differences between
IOF treatments for BW at 14 d in either experiment, but males were consistently heavier
than females (Table 3.4). The only significant IOF treatment effect on WG was observed
during the 1-7 d period of experiment 2, where SC poults had lower WG than NC poults,
but not significantly different from CHP poults (Table 3.5). Males gained more weight
than females in all periods and in both trials (Table 3.5).
The IOF and gender effects on pectoral muscle weight in experiments 1 and 2 are
presented in Table 3.6. With the exception of the NC treatment group, pectoral muscle
weights were heavier for males than females at 7d of age in experiment 1.
Table 3.1 – Effects of in ovo feeding (IOF) and gender on body weight of turkey poults at hatch (experiments 1 and 2)1 Experiment 1 Experiment 2 Treatment Body Weight (g) N Body Weight (g) N
In ovo feeding Non-injected control (NC) 60.47 212 52.61 223 IOF2 Saline (SC) 61.12 212 52.46 229 IOF carbohydrate-protein (CHP) 60.70 209 52.88 226 SEM3 0.36 - 0.41 -
Gender Males 61.24 315 52.77 330 Females 60.28 318 52.53 348 SEM 0.29 - 0.33 -
None of the means on the same column were statistically different at P=0.05 1Values are main effect means for IOF treatments and gender. There were no significant (P>0.05) IOF treatment X gender effects observed. 2IOF = in ovo feeding 3SEM = standard error of the mean
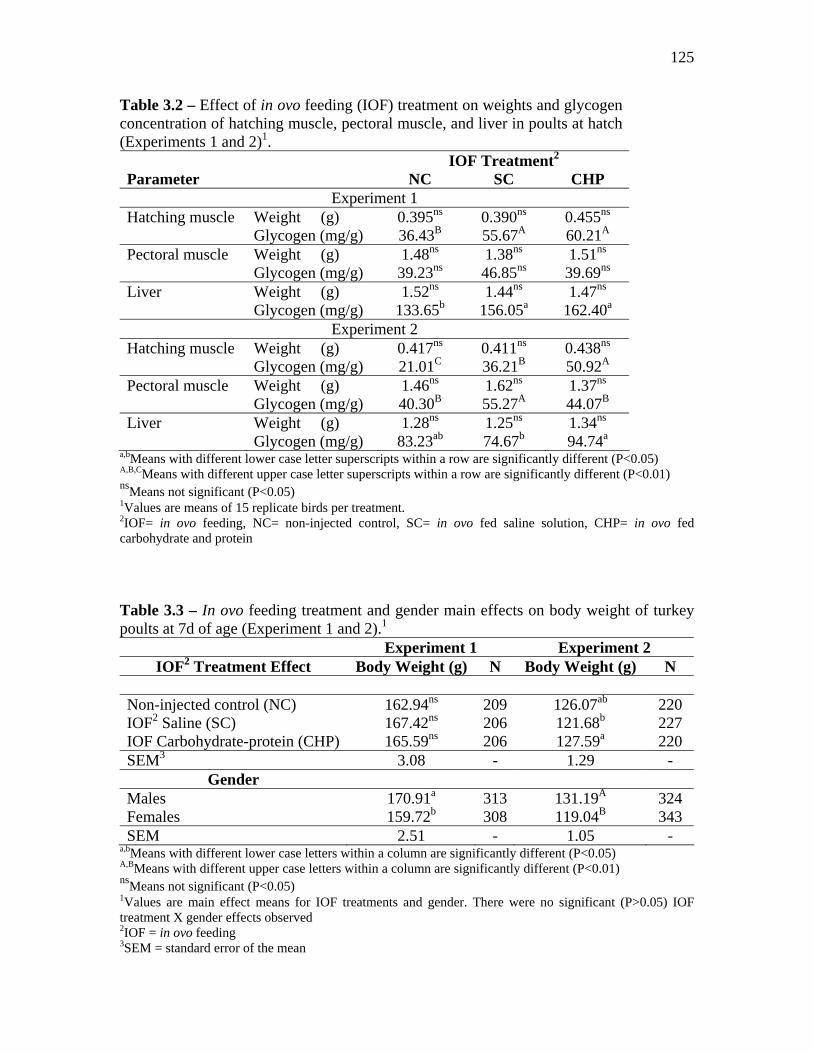
125
Table 3.2 – Effect of in ovo feeding (IOF) treatment on weights and glycogen concentration of hatching muscle, pectoral muscle, and liver in poults at hatch (Experiments 1 and 2)1.
IOF Treatment2 Parameter NC SC CHP
Experiment 1 Hatching muscle Weight (g) 0.395ns 0.390ns 0.455ns Glycogen (mg/g) 36.43B 55.67A 60.21A Pectoral muscle Weight (g) 1.48ns 1.38ns 1.51ns Glycogen (mg/g) 39.23ns 46.85ns 39.69ns Liver Weight (g) 1.52ns 1.44ns 1.47ns Glycogen (mg/g) 133.65b 156.05a 162.40a
Experiment 2 Hatching muscle Weight (g) 0.417ns 0.411ns 0.438ns Glycogen (mg/g) 21.01C 36.21B 50.92A Pectoral muscle Weight (g) 1.46ns 1.62ns 1.37ns Glycogen (mg/g) 40.30B 55.27A 44.07B Liver Weight (g) 1.28ns 1.25ns 1.34ns Glycogen (mg/g) 83.23ab 74.67b 94.74a
a,bMeans with different lower case letter superscripts within a row are significantly different (P<0.05) A,B,CMeans with different upper case letter superscripts within a row are significantly different (P<0.01) nsMeans not significant (P<0.05) 1Values are means of 15 replicate birds per treatment. 2IOF= in ovo feeding, NC= non-injected control, SC= in ovo fed saline solution, CHP= in ovo fed carbohydrate and protein Table 3.3 – In ovo feeding treatment and gender main effects on body weight of turkey poults at 7d of age (Experiment 1 and 2).1
Experiment 1 Experiment 2 IOF2 Treatment Effect Body Weight (g) N Body Weight (g) N
Non-injected control (NC) 162.94ns 209 126.07ab 220 IOF2 Saline (SC) 167.42ns 206 121.68b 227 IOF Carbohydrate-protein (CHP) 165.59ns 206 127.59a 220 SEM3 3.08 - 1.29 -
Gender Males 170.91a 313 131.19A 324 Females 159.72b 308 119.04B 343 SEM 2.51 - 1.05 -
a,bMeans with different lower case letters within a column are significantly different (P<0.05) A,BMeans with different upper case letters within a column are significantly different (P<0.01) nsMeans not significant (P<0.05) 1Values are main effect means for IOF treatments and gender. There were no significant (P>0.05) IOF treatment X gender effects observed 2IOF = in ovo feeding 3SEM = standard error of the mean
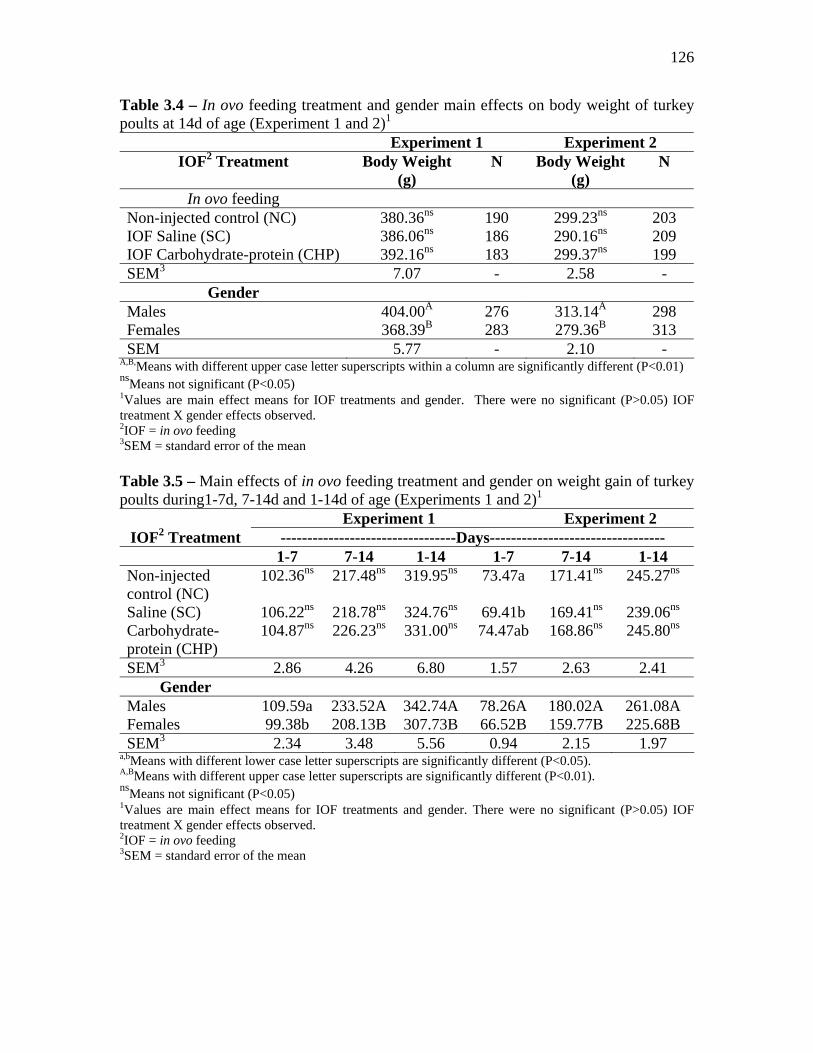
126
Table 3.4 – In ovo feeding treatment and gender main effects on body weight of turkey poults at 14d of age (Experiment 1 and 2)1 Experiment 1 Experiment 2
IOF2 Treatment Body Weight (g)
N Body Weight (g)
N
In ovo feeding Non-injected control (NC) 380.36ns 190 299.23ns 203 IOF Saline (SC) 386.06ns 186 290.16ns 209 IOF Carbohydrate-protein (CHP) 392.16ns 183 299.37ns 199 SEM3 7.07 - 2.58 -
Gender Males 404.00A 276 313.14A 298 Females 368.39B 283 279.36B 313 SEM 5.77 - 2.10 -
A,B,Means with different upper case letter superscripts within a column are significantly different (P<0.01) nsMeans not significant (P<0.05) 1Values are main effect means for IOF treatments and gender. There were no significant (P>0.05) IOF treatment X gender effects observed. 2IOF = in ovo feeding 3SEM = standard error of the mean Table 3.5 – Main effects of in ovo feeding treatment and gender on weight gain of turkey poults during1-7d, 7-14d and 1-14d of age (Experiments 1 and 2)1
Experiment 1 Experiment 2 IOF2 Treatment ---------------------------------Days--------------------------------- 1-7 7-14 1-14 1-7 7-14 1-14 Non-injected control (NC)
102.36ns 217.48ns 319.95ns 73.47a 171.41ns 245.27ns
Saline (SC) 106.22ns 218.78ns 324.76ns 69.41b 169.41ns 239.06ns Carbohydrate-protein (CHP)
104.87ns 226.23ns 331.00ns 74.47ab 168.86ns 245.80ns
SEM3 2.86 4.26 6.80 1.57 2.63 2.41 Gender
Males 109.59a 233.52A 342.74A 78.26A 180.02A 261.08A Females 99.38b 208.13B 307.73B 66.52B 159.77B 225.68B SEM3 2.34 3.48 5.56 0.94 2.15 1.97
a,bMeans with different lower case letter superscripts are significantly different (P<0.05). A,BMeans with different upper case letter superscripts are significantly different (P<0.01). nsMeans not significant (P<0.05) 1Values are main effect means for IOF treatments and gender. There were no significant (P>0.05) IOF treatment X gender effects observed. 2IOF = in ovo feeding 3SEM = standard error of the mean

127
Table 3.6 – Pectoral muscle weight at 7 days of age of male and female in ovo fed (IOF) turkeys of treatment 11
IOF Treatment Gender Pectoral muscle weight (g)
Male 13.334 B Non-injected control (NC) Female 13.623 AB Male 12.343 B IOF2 Saline (SC)
Female 15.224 A Male 15.069 A IOF carbohydrate-protein (CHP)
Female 13.037 B A,BMeans with different upper case letter superscripts are significantly different (P<0.01) 1Values are mean of 15 poults. Standard error of the mean = 0.80 2IOF = in ovo feeding Table 3.7 – Effects of in ovo feeding and sex on pectoral muscle weight of turkey poults at 14d of age on experiment 11, and at 7d and 14d of age in experiment 21. Experiment 1 Experiment 2
Treatment Pectoral muscle 14d 7d 14d ------------------------------(g)------------------------------
In ovo feeding Non-injected control (NC) 50.39ns 9.83ns 37.59ns IOF2 Saline (SC) 50.90ns 9.94ns 35.50ns IOF carbohydrate-protein (CHP) 50.80ns 9.61ns 36.22ns SEM3 1.37 0.58 1.15
Sex Males 52.80A 10.05ns 38.42A Females 48.59B 9.54ns 34.45B SEM 1.12 0.47 0.94
A,BMeans with different upper case letter superscripts are significantly different (P<0.01) nsMeans not significant (P<0.05) 1Values are main effect means for IOF treatments (20 replicates) and gender (60 replicates). There were no significant (P>0.05) IOF treatment X gender effects observed 2IOF = in ovo feeding 2SEM = standard error of the mean
Discussion
Poults, that use most of their energy reserves to hatch and sustain themselves until
feed intake initiation, are at risk energy starvation, resulting in impaired growth or death
(Christensen et al., 2003). Flip-overs and starve-outs poults are the consequences of these
conditions as commonly observed in the field (Noble et al., 1999; Christensen et al.,
2003). Liver glycogen is the most important energy reserve to sustain poults during the
128
perinatal period, and it has been used to indicate poult energy status (Donaldson et al.,
1991; Donaldson, 1995; Christensen et al., 1996; Christensen et al., 2003). Poults are able
to restore their liver and muscle glycogen reserves after hatch by pectoral muscle
catabolism and gluconeogenesis, especially if they do not have immediate access to feed
and water (Donaldson et al., 1991; Keirs et al., 2002). In ovo feeding has been shown to
improve energy status of perinatal chicks and poults by increasing glycogen reserves, and
stimulating gut maturation that help poults utilize feed nutrients (Uni and Ferket, 2003;
Uni and Ferket, 2004; Ferket et al., 2005). In this study, a slight reduction in hatchability
was observed when embryos were in ovo-fed the 1.5 ml solution containing CHP in
experiment 1, but not when the IOF volume was reduced to 1.0 mL in experiment 2. In
contrast, in ovo feed either 1.5 ml or 1.0 ml saline had no adverse effect on hatchability.
Considering the difference in osmolality between the CHP and SC IOF solutions (620
mOsm versus 120 mOsm), some of the CHP treated embryos may have suffered greater
osmotic stress or metabolic overload than the SC treated embryos, resulting in reduced
hatchability.
Even though all poults started with similar BW, residual yolk and YFBW at hatch
(Table 3.1), differences in other parameters demonstrated that the IOF poults were
metabolically different than the NC poults. For example, poults IOF CHP had more
remaining glycogen reserves in the livers and hatching muscles at hatch than NC poults
and, to a lesser degree, the SC poults (Table 3.2). Similar improvements in glycogen
reserves were observed by Uni et al. (2005) who in ovo fed chickens saline solutions
containing carbohydrates, and by Foye et al. (2006) who in ovo fed turkeys saline
solutions containing egg white protein. These differences in energy status at hatch were
129
not enough to result in higher weight gain later in life, so IOF poults weighed the same at
the end of both studies (Tables 3.4 and 3.5). The fact that there were no BW differences
between SC and CHP solutions fed in ovo demonstrates the value of NaCl as an energy
modulator in poultry embryos. Although sodium chloride has no energetic value, it
changed the use of innate energy available in the egg and embryo, resulting in more
glycogen accumulated in pectoral muscle (Table 3.2) at expense of liver, which may have
been the reason why SC poults gained less weight during the first week post-hatch than
NC poults (Table 3.5, experiment 2).
As expected, male poults had greater post-hatch weight gain than females, with
both genders being equally affected by the IOF treatments, as there was generally no IOF
treatment X gender interaction effects observed. The only exception was pectoral muscle
mass at 7d (Table 3.6), where NC females did not differ from NC males, while SC
benefited females and CHP benefited males. This effect was probably a consequence of
differences in pectoral muscle deposition between sexes, where female precocity leads to
slightly higher muscle than males (Table 3.6, Experiment 1, NC). The difference in
muscle mass between genders was accentuated by IOF saline. We hypothesize that IOF
saline increased muscle breakdown for gluconeogenesis as this treatment had numerically
smaller pectoral muscle at hatch (Table 3.2), and males were still recovering from it at
7d. Interestingly, IOF CHP did not affected females, which had pectoral muscle mass
similar to controls, but it could be used by males to produce more pectoral muscle.
Compensatory gain after 7d of age dissipated the treatment effects, so only differences
between genders persisted at 14d (Table 3.7).
130
Liver weights of poults at hatch were similar to values reported by Donaldson et
al. (1991) and Christensen et al. (1996), but hepatic [GLY] concentrations were in
general about 4-fold higher than those reported by these authors or by Foye et al. (2006).
Breast [GLY] reported here were very similar to concentrations measured by Foye et al.
(2006). The higher hepatic glycogen reserves among the CHP treated poults in this study
may indicate that these poults may have an advantage immediately after hatch, but this
benefit may not last beyond 14 days.
Although preliminary research estimated highest poult body weight with IOF
solution osmolatily of 708 mOsm (Appendix 2, page 268), this osmolality value as well
as the one used herein (620 mOsm) may have been too high, leading the embryos to
osmotic stress and hindering them from full benefits of IOF.
Conclusions
High osmolality of in ovo feeding solution associated to hydrolyzed soy protein
anti-nutritional factors reduced benefits of in ovo feeding turkey embryos, but it still
resulted on increased poult energy status and eagerness to feed.
131
References Careghi, C., K. Tona, O. Onagbesan, J. Buyse, E. Decuypere, and V. Bruggeman. 2005.
The effects of the spread of hatch and interaction with delayed feed access after hatch on broiler performance until seven days of age. Poult Sci 84:1314-1320.
Christensen, V. L., W. E. Donaldson, and J. P. McMurtry. 1996. Physiological
differences in late embryos from turkey breeders at different ages. Poult Sci 75:172-178.
Christensen, V. L., D. T. Ort, and J. L. Grimes. 2003. Physiological factors associated
with weak neonatal poults (Meleagris gallopavo). Int J Poult Sci 2:7-14. Donaldson, W. E., and V. L. Christensen. 1991. Dietary carbohydrate level and glucose
metabolism in turkey poults. Comp Biochem Physiol A 98:347-350. Donaldson, W. E., V. L. Christensen, and K. K. Krueger. 1991. Effects of stressors on
blood glucose and hepatic glycogen concentrations in turkey poults. Comp Biochem Physiol A 100:945-947.
Donaldson, W. E. 1995. Carbohydrate, hatchery stressors affect poult survival. in
Feedstuffs 67(14):16-17. Dreiling, C. E., D. E. Brown, L. Casale, and L. Kelly. 1987. Muscle glycogen:
comparison of iodine binding and enzyme digestion assays and application to meat samples. Meat Science 20:167-177.
Ferket, P. R., Z. Uni, E. Tako, O. T. Foye, and J. E. Oliveira. 2005. In ovo feeding
nutrition: impact on gene expression, gut development, and growth performance. Pages 160-172 in The Annual Nutrition Conference. September 13-15. University of Arkansas. Rogers, AR.
Foye, O. T. 2005. The biochemical and molecular effects of amnionic nutrient
administration, “in ovo feeding” on intestinal development and function and carbohydrate metabolism in turkey embryos and poults. Ph.D. Dissertation. North Carolina State University. Raleigh, NC.
Foye, O. T., Z. Uni, and P. R. Ferket. 2006. Effect of in ovo feeding egg white protein,
beta-hydroxy-beta-methylbutyrate, and carbohydrates on glycogen status and neonatal growth of turkeys. Poult Sci 85:1185-1192.
Keirs, R. W., E. D. Peebles, S. A. Hubbard, and S. K. Whitmarsh. 2002. Effects of
supportative gluconeogenic substrates on early performance of broilers under adequate brooding conditions. J Appl Poult Res 11:367-372.

132
Kerry Bio-Science. 2007. Enzymatic digestion of soy meal. in Product Information Sheet Hy-Soy (5X59022). Kerry Bio-Science. Norwich, NY
National Research Council, 1994. Nutrient requirements for poultry. 9th rev. ed. National
Academy Press, Washington, DC. Noble, D. O., K. E. Nestor, and C. R. Polley. 1999. Factors influencing early poult flip-
overs in experimental populations of turkeys. Poult Sci 78:178-181. SAS Institute. 2004. SAS/STAT User's guide: statistics. SAS Institute, Cary. NC. Smirnov, A., E. Tako, P. R. Ferket, and Z. Uni. 2006. Mucin gene expression and mucin
content in the chicken intestinal goblet cells are affected by in ovo feeding of carbohydrates. Poult Sci 85:669-673.
Tako, E., P. R. Ferket, and Z. Uni. 2004. Effects of in ovo feeding of carbohydrates and
beta-hydroxy-beta-methylbutyrate on the development of chicken intestine. Poult Sci 83:2023-2028.
Uni, Z., S. Ganot, and D. Sklan. 1998. Posthatch development of mucosal function in the
broiler small intestine. Poult Sci 77:75-82. Uni, Z., Y. Noy, and D. Sklan. 1999. Posthatch development of small intestinal function
in the poult. Poult Sci 78:215-222. Uni, Z., and P. R. Ferket 2003. Enhancement of development of oviparous species by in
ovo feeding. U.S. Patent no. 6,592,878 B2. Uni, Z., and P. R. Ferket. 2004. Methods for early nutrition and their potential. Worlds
Poult Sci J 60:101-111. Uni, Z., P. R. Ferket, E. Tako, and O. Kedar. 2005. In ovo feeding improves energy status
of late-term chicken embryos. Poult Sci 84:764-770. Wyatt, C. L., W. D. Weaver, Jr., and W. L. Beane. 1985. Influence egg size, eggshell
quality, and posthatch holding time on broiler performance. Poult Sci 64:2049-2055.
133
Chapter 4
“Effect of incubation conditions on energy status and performance of in ovo fed turkey poults from 25 days of
incubation to 14 days of age”
Abstract
Turkey poults are very sensitive to poor incubation conditions, causing them to struggle
during hatch until feed intake initiation because of low energy status. Nutrient
supplementation of the amnion by in ovo feeding (IOF) has been demonstrated to
improve embryonic energy status and to promote gut maturation. This study was
designed to investigate the effects of two different incubation profiles (P1 and P2),
similar to single stage or multistage temperature profiles, respectively, on IOF turkey
poults. Six hundred turkey eggs were divided between the two hatcheries that followed
distinct incubation profiles. Each hatchery was assigned an equal number of eggs divided
among three treatments: 1) non-IOF controls (NC), 2) IOF saline (SC), and 3) IOF
carbohydrates, egg white protein, sodium chloride and beta-hydroxy-beta-methylbutyrate
(CHP). IOF eggs were injected with 1.5 ml of the respective solution into the amnion at
23E. Eggs from each treatment were sampled at 25E to collect liver, pectoral muscle and
hatching muscle for glycogen analysis. At hatch, the number of hatched poults and
unhatched eggs was counted and the same tissues were sampled for glycogen analysis.
Poults incubated with both profiles and IOF treatments were raised until 14d to compare
growth performance between profiles, IOF treatments, and gender. Although incubator
temperatures in P2 registered higher than in P1 during hatching (37.9 vs. 37.0C,
respectively), hatchability or poult weight at hatch were not adversely affected. However,
134
the P1 poults accumulated more liver glycogen and performed better during rearing than
poults from P2. In comparison to the NC group, hatchability was reduced by about 15%
in the CHP IOF group due to a microbial contaminated ingredient source, but their post-
hatch performance was better. The best growth performance was observed among males
in the CHP treatment group. These results demonstrate that heat distressed conditions
during the last stages of incubation can adversely affect post-hatch performance and
appetite of poults, but this could be ameliorated by IOF.
Introduction
The eggs of oviparous species must be laid containing all necessary nutrients for
embryonic development. The hen specifically synthesizes and deposits the egg nutrients,
so egg composition is relatively constant (Whitehead, 1991). According to Boerjan
(2006) poultry embryos will develop if given adequate incubation conditions, like
temperature, humidity and turning. When these conditions are not ideal, embryonic
development may be compromised. Studies showed that if poultry eggs are not turned or
they are turned incorrectly, embryonic compartments are not properly formed, and the
incidence of embryonic malformations, mal positioning and albumen misuse are
increased (Tona et al., 2005). Temperature and egg storage can affect incubation period.
For example, high temperatures shorten the incubation period (Hulet et al., 2007), and
long egg storage prolongs time to hatch (Tona et al., 2003). Even though egg composition
is kept relatively constant, breeder nutrition and age can cause changes depending on
body pool of nutrients and synthetic capacity (Whitehead, 1991). For example, the
amount of yolk increases at expense of albumen as the hen ages, altering the amount of
substrate available to the embryo (Joseph and Moran, 2005). A combination of these
135
conditions, plus changes in genetics due to selection for higher yields, cause turkey poults
to struggle to hatch and have low energy status by the time they hatch. If energy stores
are depleted, survival and performance can be compromised (Donaldson et al., 1991).
One possible way to aid embryo energy needs is to provide extra nutrients in ovo.
In ovo feeding (IOF) consists in injecting a nutritive solution into the amnion prior to
embryo amniotic fluid consumption (Uni and Ferket, 2003). IOF nutrients will supply the
embryo with extra substrate for glycogen storage and tissue growth, improving poult
quality, performance and survivability (Uni and Ferket, 2004). Foye et al. (2006) tested
feeding turkey embryos in ovo with nutritive solutions containing different amounts of
egg white protein, sodium chloride, carbohydrates (dextrin and maltose) and β-hydroxyl-
β-methylbutyrate (HMB), and compared their response to non-injected control poults.
They concluded that IOF enhanced body weight (BW) and glycogen status of poults
during the neonatal period.
According to French (1997), at the beginning of incubation embryo temperature is
usually slightly lower than incubator temperature, but from mid-incubation onwards
metabolic heat production from the embryo may cause embryo temperature to rise above
incubator temperature. Single-stage incubator settings can be adjusted to match
embryonic temperature needs, but multi-stage incubators have constant cycles of similar
temperatures throughout incubation. High embryonic temperatures occur more frequently
in multi-stage systems, especially if air flow is not uniform. Heat-stressed embryos may
respond differently to hatching challenges and to IOF. Practical application of IOF
implies that embryos incubated in a variety of conditions must show positive responses.
136
Therefore, the objective of this study was to evaluate the same IOF formulation on eggs
from the same flock, but incubated under different conditions.
Material and Methods
Incubation and IOF
Turkey eggs were obtained from first-cycle Hybrid breeder hens in the 6th week of
lay and divided into two groups of 600 eggs each assigned to different hatcheries. One
group of eggs was incubated at Pfizer-Embrex Research Laboratory1, and the other group
was incubated at the North Carolina State University Turkey Research Unit2. Both
hatcheries were equipped with Jamesway 252 incubator setters and hatchers, but different
incubation profiles were followed (Table 4.1). The first hatchery used an incubation
profile (P1) with decreasing set points to help with removal of metabolic heat as the
embryos growth, similar to what happens in single stage incubation. The second hatchery
profile kept incubator set temperature constant, letting the temperature increase due to
less removal of metabolic heat from the eggs in later stages of incubation (P2), as usually
happens in multistage incubation. All other procedures were performed in the same
manner in both hatcheries. At 20 days of incubation (E), all eggs were candled to remove
infertile eggs and then divided into 3 groups with similar average egg weights (73.3±10g)
and weight distribution. Each group of eggs were randomly assigned to one of 3 IOF
treatments: 1) non-injected control (NC), 2) IOF saline (0.4% NaCl) (SC) or 3) IOF
nutritive solution (20% egg white+5% dextrin+0.1% HMB+0.4% NaCl) (CHP). At 23E
eggs from each treatment were removed from the incubator, one treatment at the time, to
perform IOF. First, the eggs were disinfected and then manually injected from the top of 1 Research Triangle Park, Durham, NC 2 Lake Wheeler Field Laboratory, Raleigh, NC
137
the blunt end of the egg with a specially designed needle3. Then 1.5 mL of pre-warmed
(ca. 37C) IOF solution was injected into the amnion according to the assigned treatments.
The injection needles were dipped in a chlorinated disinfectant between egg injections to
minimize microbial cross-contamination by the injection procedure. Eggs of NC groups
were removed from incubator for the same duration of time as IOF-treatment group eggs
(ca. 20 minutes). Once the IOF procedure was completed, the eggs were transferred to
hatching baskets and placed in the hatchers. The number of external pipped eggs and
hatched poults was counted each day at P2, starting on 25E until day of hatch. On the
morning of 28E, the hatches were pulled and the number of hatched poults, pipped eggs
and dead embryos was recorded to evaluate hatchability.
Animal Husbandry
At day of hatch, poults from both hatcheries were sexed, tagged and individually
weighed. The poults were then transported to a temperature controlled curtained-sided
facility containing 12 10m2 pens. Floor pens were topped with 4 cm of soft pine shavings,
and equipped with one heating lamp4, one drinker5 and one feeder6. Twenty five poults
from each hatchery were placed in the same pen, being of the same sex and IOF
treatment. Each of the 6 treatment combinations were replicated twice inside the house.
Feed and water were provided ad libitum throughout the study and all pens received the
same diet formulated to match or exceed NRC requirements (National Research Council,
1994). Feed remaining in the feeders was weighed at 7 and 14 days to calculate feed
intake (FI) and feed conversion (FC) for each pen. All experimental protocols were 3 Proprietary of Pfizer-Embrex, Research Triangle Park, Durham, NC 4 Model 54411 Heave Gauge Aluminum Base, Hog Slats, Inc., Newton Gove, NC 5 Plasson® automatic drinker 6 Shenandoah® tube feeder
138
approved by the Institutional Animal Care and Use Committee at North Carolina State
University.
Tissue Sampling and Glycogen Analysis
At 25E 5 eggs from each treatment combination were sampled to collect the
hatching muscle (HM) and liver for glycogen analysis. The eggs were opened and the
embryos euthanized by cervical dislocation, followed by tissue harvesting. The same
tissues, along with the pectoralis muscle (breast), were collected from 8 poults per
treatment at day of hatch for the same purpose. All tissues were immediately place on ice
and then frozen at -20C until processing. Glycogen concentration was determined using
the iodine binding assay as described by Foye et al. (2006). At 7 and 14 days of age, 8
birds per treatment were sampled to determine relative pectoral muscle weight.
Feeding Behavior Test
Previous studies revealed that IOF chicks and poults had more mature digestive
and absorptive systems than their non-IOF counterparts (Foye 2005; Foye et al., 2006;
Uni et al., 2006). More mature guts associated with better energy status could result in
poults that are more active and eager to feed. A simple feeding test was conducted to look
for indications of such behavior. As soon as birds were place in their respective pens
(Time 0), each pen received a 10 cm2 feeding tray containing 5g/poult of feed (Oasis7).
Two hours later (0-2 hours) the trays were carefully removed and replaced by a new tray
containing the same amount of feed (5g/poult). At the end of another two hour period (2-
4 hours) all trays were removed. The feed remaining in both trays were weighted to
7 Novus International Inc., St. Louis, MO
139
determine average FI per bird during the first 2 hours (0-2 hours) after placement, during
the 2 to 4 hour period (2-4 hours), and during the total 4 hours (2-4 hours) after
placement.
Statistical Analysis
Glycogen data from 25E and day of hatch was analyzed by mixed ANOVA
according to the model,
Y = μ + HAT + IOF + HAT*IOF + e,
with hatchery (HAT), in ovo feeding (IOF) and their interaction (HAT*IOF) as fixed
effects. Day of hatch BW was analyzed by mixed ANOVA according to the model,
Y = μ + HAT + IOF + GDR+ HAT*IOF +HAT*GDR +IOF*GDR +HAT*IOF*GDR + e,
with hatchery (HAT), in ovo feeding (IOF), gender (GDR), and their interactions
(HAT*IOF, HAT*GDR, IOF*GDR, HAT*IOF*GD) as main effects. The 7d and 14d
performance data was also analyzed by mixed ANOVA according to the model,
Y = μ + HAT + IOF + GDR+ HAT*IOF +HAT*GDR +IOF*GDR +HAT*IOF*GDR +PEN+ e,
with hatchery (HAT), in ovo feeding (IOF), gender (GDR) and their interactions
(HAT*IOF, HAT*GDR, IOF*GDR, HAT*IOF*GD) as main effects, and pen as a
random effect. These statistical analysis were conducted by the Fit Model procedure in
JMP (SAS Institute. 2005). Means were separated by t-student or Tukey test and
considered significant when P<0.05.
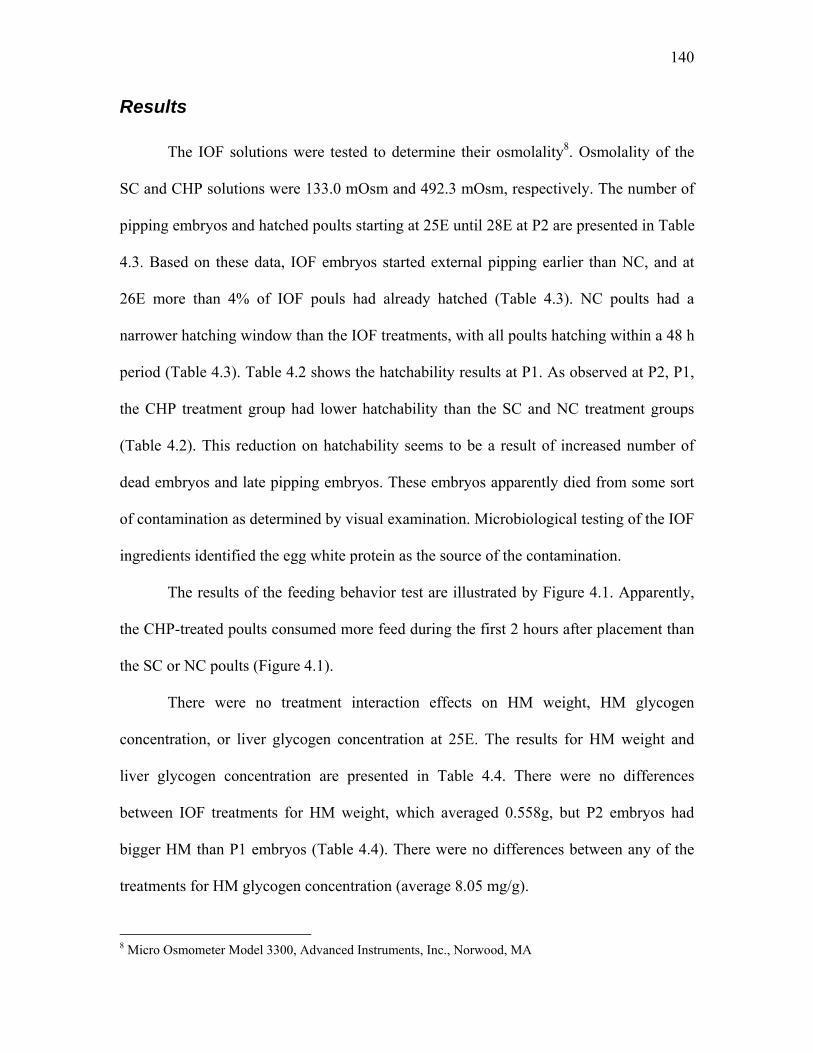
140
Results
The IOF solutions were tested to determine their osmolality8. Osmolality of the
SC and CHP solutions were 133.0 mOsm and 492.3 mOsm, respectively. The number of
pipping embryos and hatched poults starting at 25E until 28E at P2 are presented in Table
4.3. Based on these data, IOF embryos started external pipping earlier than NC, and at
26E more than 4% of IOF pouls had already hatched (Table 4.3). NC poults had a
narrower hatching window than the IOF treatments, with all poults hatching within a 48 h
period (Table 4.3). Table 4.2 shows the hatchability results at P1. As observed at P2, P1,
the CHP treatment group had lower hatchability than the SC and NC treatment groups
(Table 4.2). This reduction on hatchability seems to be a result of increased number of
dead embryos and late pipping embryos. These embryos apparently died from some sort
of contamination as determined by visual examination. Microbiological testing of the IOF
ingredients identified the egg white protein as the source of the contamination.
The results of the feeding behavior test are illustrated by Figure 4.1. Apparently,
the CHP-treated poults consumed more feed during the first 2 hours after placement than
the SC or NC poults (Figure 4.1).
There were no treatment interaction effects on HM weight, HM glycogen
concentration, or liver glycogen concentration at 25E. The results for HM weight and
liver glycogen concentration are presented in Table 4.4. There were no differences
between IOF treatments for HM weight, which averaged 0.558g, but P2 embryos had
bigger HM than P1 embryos (Table 4.4). There were no differences between any of the
treatments for HM glycogen concentration (average 8.05 mg/g).
8 Micro Osmometer Model 3300, Advanced Instruments, Inc., Norwood, MA
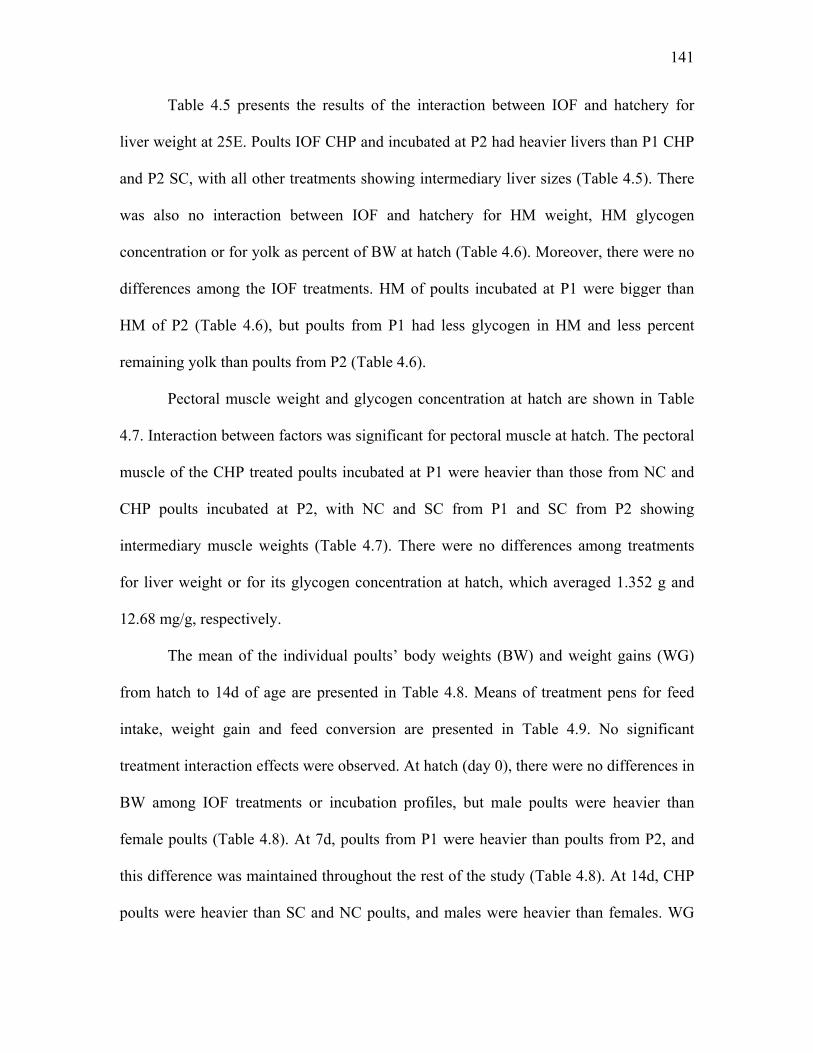
141
Table 4.5 presents the results of the interaction between IOF and hatchery for
liver weight at 25E. Poults IOF CHP and incubated at P2 had heavier livers than P1 CHP
and P2 SC, with all other treatments showing intermediary liver sizes (Table 4.5). There
was also no interaction between IOF and hatchery for HM weight, HM glycogen
concentration or for yolk as percent of BW at hatch (Table 4.6). Moreover, there were no
differences among the IOF treatments. HM of poults incubated at P1 were bigger than
HM of P2 (Table 4.6), but poults from P1 had less glycogen in HM and less percent
remaining yolk than poults from P2 (Table 4.6).
Pectoral muscle weight and glycogen concentration at hatch are shown in Table
4.7. Interaction between factors was significant for pectoral muscle at hatch. The pectoral
muscle of the CHP treated poults incubated at P1 were heavier than those from NC and
CHP poults incubated at P2, with NC and SC from P1 and SC from P2 showing
intermediary muscle weights (Table 4.7). There were no differences among treatments
for liver weight or for its glycogen concentration at hatch, which averaged 1.352 g and
12.68 mg/g, respectively.
The mean of the individual poults’ body weights (BW) and weight gains (WG)
from hatch to 14d of age are presented in Table 4.8. Means of treatment pens for feed
intake, weight gain and feed conversion are presented in Table 4.9. No significant
treatment interaction effects were observed. At hatch (day 0), there were no differences in
BW among IOF treatments or incubation profiles, but male poults were heavier than
female poults (Table 4.8). At 7d, poults from P1 were heavier than poults from P2, and
this difference was maintained throughout the rest of the study (Table 4.8). At 14d, CHP
poults were heavier than SC and NC poults, and males were heavier than females. WG
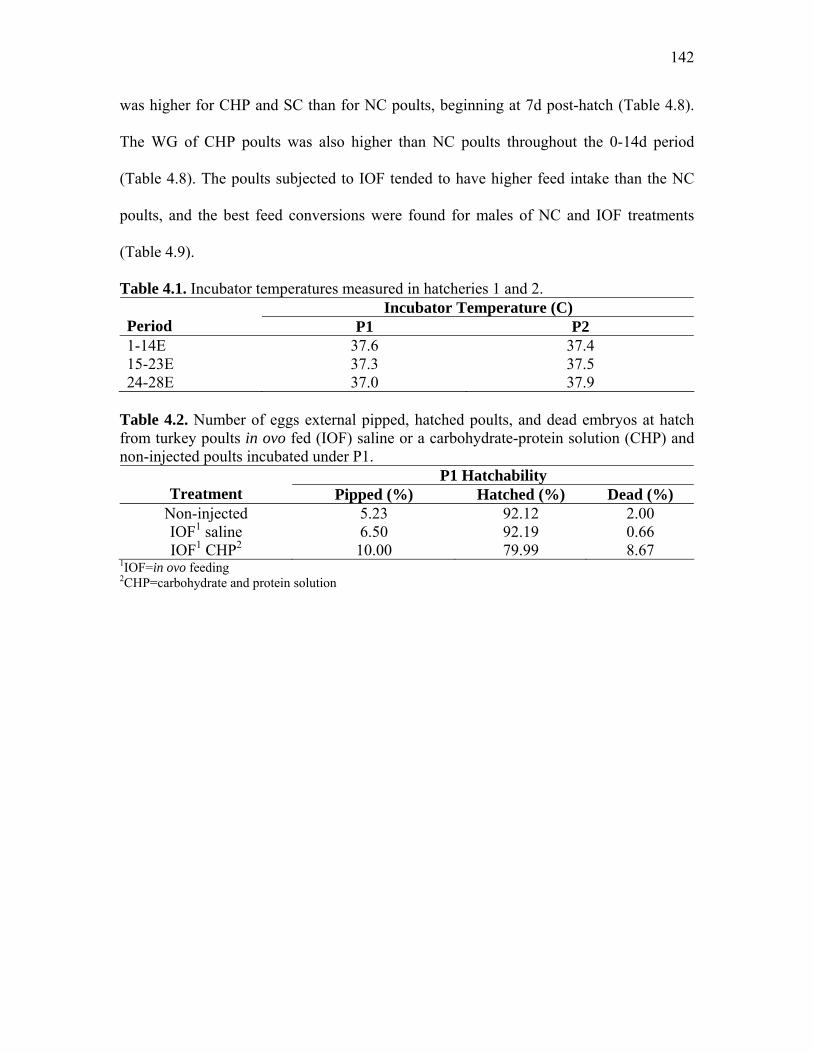
142
was higher for CHP and SC than for NC poults, beginning at 7d post-hatch (Table 4.8).
The WG of CHP poults was also higher than NC poults throughout the 0-14d period
(Table 4.8). The poults subjected to IOF tended to have higher feed intake than the NC
poults, and the best feed conversions were found for males of NC and IOF treatments
(Table 4.9).
Table 4.1. Incubator temperatures measured in hatcheries 1 and 2. Incubator Temperature (C)
Period P1 P2 1-14E 37.6 37.4 15-23E 37.3 37.5 24-28E 37.0 37.9
Table 4.2. Number of eggs external pipped, hatched poults, and dead embryos at hatch from turkey poults in ovo fed (IOF) saline or a carbohydrate-protein solution (CHP) and non-injected poults incubated under P1.
P1 Hatchability Treatment Pipped (%) Hatched (%) Dead (%)
Non-injected 5.23 92.12 2.00 IOF1 saline 6.50 92.19 0.66 IOF1 CHP2 10.00 79.99 8.67
1IOF=in ovo feeding 2CHP=carbohydrate and protein solution
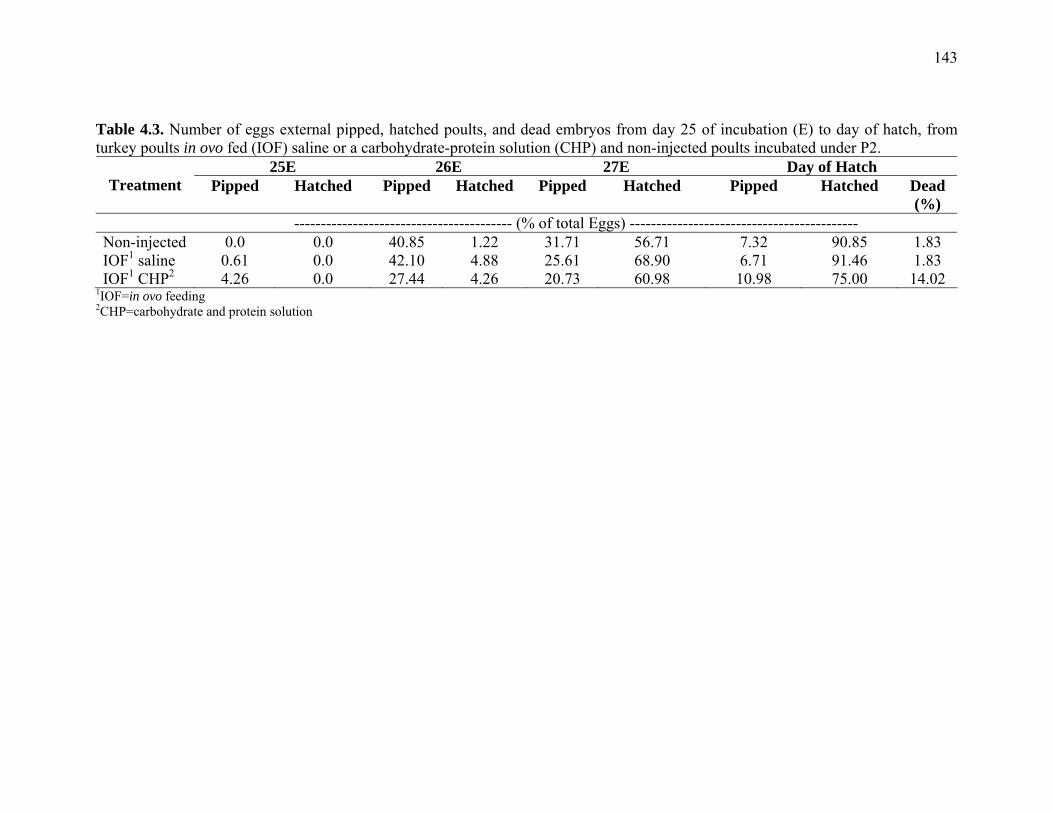
143
Table 4.3. Number of eggs external pipped, hatched poults, and dead embryos from day 25 of incubation (E) to day of hatch, from turkey poults in ovo fed (IOF) saline or a carbohydrate-protein solution (CHP) and non-injected poults incubated under P2.
25E 26E 27E Day of Hatch Treatment Pipped Hatched Pipped Hatched Pipped Hatched Pipped
Hatched
Dead (%)
----------------------------------------- (% of total Eggs) ------------------------------------------- Non-injected 0.0 0.0 40.85 1.22 31.71 56.71 7.32 90.85 1.83 IOF1 saline 0.61 0.0 42.10 4.88 25.61 68.90 6.71 91.46 1.83 IOF1 CHP2 4.26 0.0 27.44 4.26 20.73 60.98 10.98 75.00 14.02
1IOF=in ovo feeding 2CHP=carbohydrate and protein solution
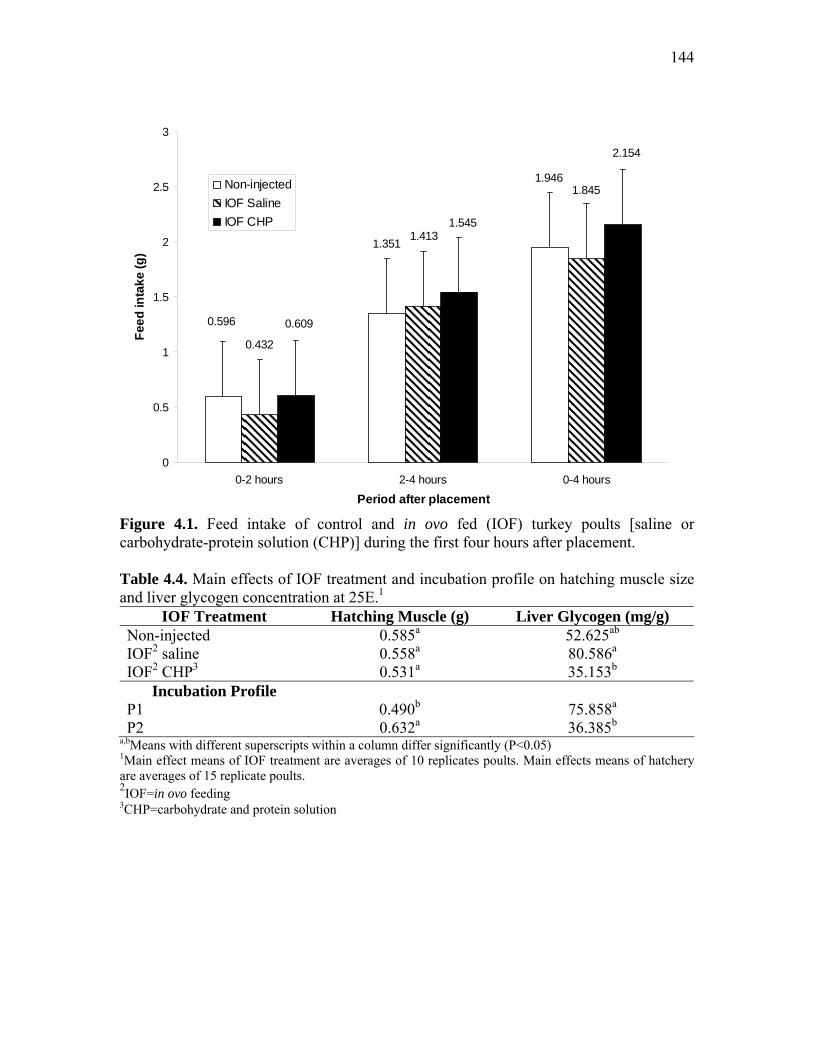
144
0.596
1.351
1.946
0.432
1.413
1.845
0.609
1.545
2.154
0
0.5
1
1.5
2
2.5
3
0-2 hours 2-4 hours 0-4 hours
Period after placement
Feed
inta
ke (g
)
Non-injectedIOF SalineIOF CHP
Figure 4.1. Feed intake of control and in ovo fed (IOF) turkey poults [saline or carbohydrate-protein solution (CHP)] during the first four hours after placement. Table 4.4. Main effects of IOF treatment and incubation profile on hatching muscle size and liver glycogen concentration at 25E.1
IOF Treatment Hatching Muscle (g) Liver Glycogen (mg/g) Non-injected 0.585a 52.625ab IOF2 saline 0.558a 80.586a IOF2 CHP3 0.531a 35.153b
Incubation Profile P1 0.490b 75.858a P2 0.632a 36.385b
a,bMeans with different superscripts within a column differ significantly (P<0.05) 1Main effect means of IOF treatment are averages of 10 replicates poults. Main effects means of hatchery are averages of 15 replicate poults. 2IOF=in ovo feeding 3CHP=carbohydrate and protein solution

145
Table 4.5. Effect of in ovo feeding (IOF) treatment on liver weights of 25E embryos incubated in two different temperatures profiles.1
Treatment Incubation Profile IOF Liver (g)
Non-injected 0.711ab IOF2 saline 0.779ab
P1
IOF2 CHP3 0.702b Non-injected 0.789ab IOF2 saline 0.686b
P2
IOF2 CHP3 0.906a a,bMeans with different superscripts within a column differ significantly (P<0.05) 1Mean values are averages of 5 replicate poults per treatment. 2IOF=in ovo feeding 3CHP=carbohydrate and protein solution Table 4.6. Main effects of IOF treatment and hatchery on hatching muscle weight and glycogen concentration, and yolk as percent of body weight at hatch.1
IOF Treatment Hatching Muscle (g)
Hatching muscle glycogen (mg/g)
Yolk (%)
Non-injected 0.341a 1.404a 5.282a IOF2 saline 0.336a 2.489a 6.434a IOF2 CHP3 0.298a 3.015a 5.913a
Incubation Profile P1 0.403a 1.173b 4.972b P2 0.247b 3.432a 6.844a
a,bMeans with different superscripts within a column differ significantly (P<0.05) 1 Main effect means of IOF treatment are averages of 16 replicates poults. Main effect means of hatchery are averages of 24 replicate poults. 2IOF=in ovo feeding 3CHP=carbohydrate and protein solution Table 4.7. Effect of IOF treatment on pectoral muscle weight and glycogen concentration of poults incubated different temperature profiles at day of hatch.1
Treatment Incubation
Profile IOF Pectoral muscle
(g) Pectoral muscle glycogen
(mg/g) Non-injected 1.289ab 1.996c IOF2 saline 1.258ab 0.013d
P1
IOF2 CHP1 1.532a 5.687a Non-injected 1.157b 4.846a IOF2 saline 1.445ab 2.968b
P2
IOF2 CHP3 1.181b 2.581bc Means with different superscripts within a column differ significantly (P<0.05) 1Mean values are averages of 8 replicate poults per treatment. 2IOF=in ovo feeding 3CHP=carbohydrate and protein solution
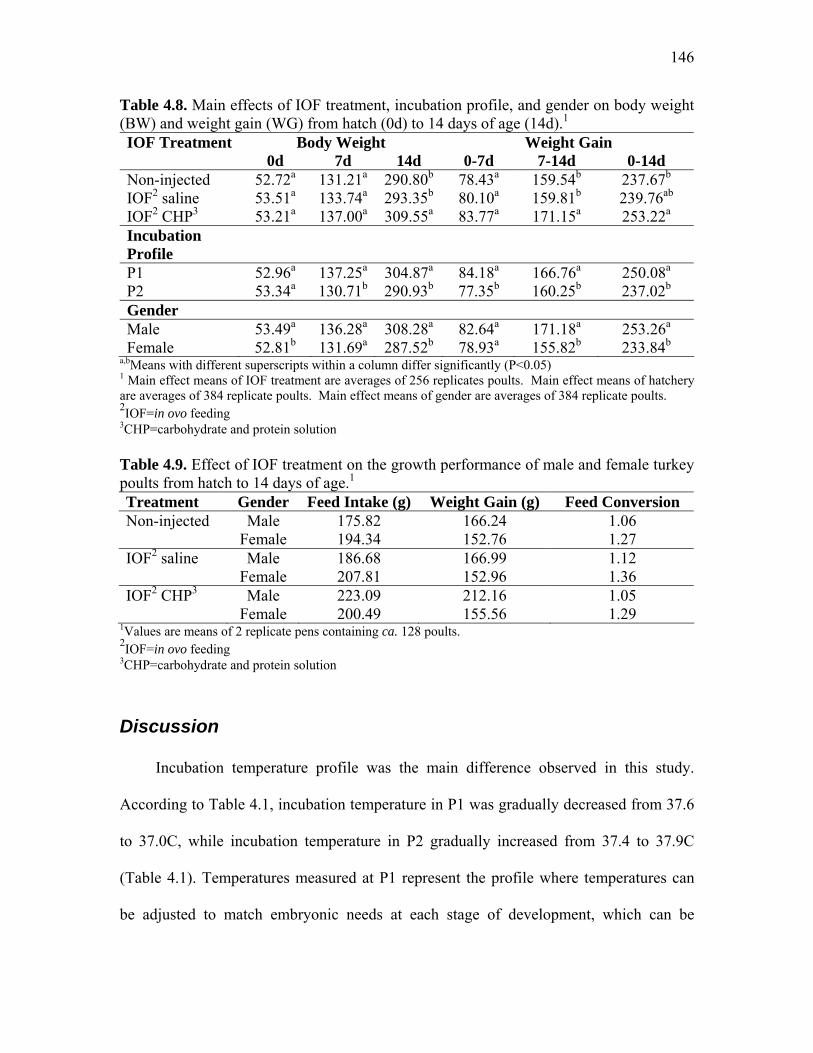
146
Table 4.8. Main effects of IOF treatment, incubation profile, and gender on body weight (BW) and weight gain (WG) from hatch (0d) to 14 days of age (14d).1
IOF Treatment Body Weight Weight Gain 0d 7d 14d 0-7d 7-14d 0-14d Non-injected 52.72a 131.21a 290.80b 78.43a 159.54b 237.67b IOF2 saline 53.51a 133.74a 293.35b 80.10a 159.81b 239.76ab IOF2 CHP3 53.21a 137.00a 309.55a 83.77a 171.15a 253.22a Incubation Profile
P1 52.96a 137.25a 304.87a 84.18a 166.76a 250.08a P2 53.34a 130.71b 290.93b 77.35b 160.25b 237.02b Gender Male 53.49a 136.28a 308.28a 82.64a 171.18a 253.26a Female 52.81b 131.69a 287.52b 78.93a 155.82b 233.84b
a,bMeans with different superscripts within a column differ significantly (P<0.05) 1 Main effect means of IOF treatment are averages of 256 replicates poults. Main effect means of hatchery are averages of 384 replicate poults. Main effect means of gender are averages of 384 replicate poults. 2IOF=in ovo feeding 3CHP=carbohydrate and protein solution Table 4.9. Effect of IOF treatment on the growth performance of male and female turkey poults from hatch to 14 days of age.1
Treatment Gender Feed Intake (g) Weight Gain (g) Feed Conversion Non-injected Male 175.82 166.24 1.06 Female 194.34 152.76 1.27 IOF2 saline Male 186.68 166.99 1.12 Female 207.81 152.96 1.36 IOF2 CHP3 Male 223.09 212.16 1.05 Female 200.49 155.56 1.29
1Values are means of 2 replicate pens containing ca. 128 poults. 2IOF=in ovo feeding 3CHP=carbohydrate and protein solution
Discussion
Incubation temperature profile was the main difference observed in this study.
According to Table 4.1, incubation temperature in P1 was gradually decreased from 37.6
to 37.0C, while incubation temperature in P2 gradually increased from 37.4 to 37.9C
(Table 4.1). Temperatures measured at P1 represent the profile where temperatures can
be adjusted to match embryonic needs at each stage of development, which can be

147
obtained in single stage incubators. Temperatures observed in P2 are similar to what is
usually seen in multistage incubators, where temperatures can not be adjusted to match
needs of both early and late term embryos, so temperatures are higher than late-term
embryo needs. Even though this difference in incubation profile did not affect
hatchability or poult BW at hatch, it clearly affected the performance of these poults post-
hatch, with P1 poults showing superior performance (Table 4.8). Moreover, the P1 poults
had the bigger pectoral muscles with higher glycogen concentration at hatch than those
hatched in P2 (Table 4.7). In contrast, P2 poults amassed bigger HM at the expense of
liver [GLY] than P1 poults at 25E (Table 4.4), regressing by hatch (Table 4.6) probably
due to protein catabolism. Similar differences between poults from hatcheries using
single stage or multistage incubators were fond by Warner et al. (2006).
We believe that lower temperatures early in incubation at P2 may have played a
role in the poults inferior performance, what agrees with the findings of Funderburk et
al., (2006), where poults from eggs incubated in lower temperatures showed lower body
weights at the end of 7d.
IOF treatment effects were independent of gender or hatchery. The reason IOF
embryos started hatching earlier (Table 4.3) is not clear, but it could be because of
accelerated development or because of incubation distress. The higher incubation
temperatures in P2 may have caused heat distress, resulting in inferior performance as
compared to the poults of P1. Despite the negative effects of microbial contamination on
the hatchability of the CHP-treated poults (Tables 4.2 and 4.3), these poults exhibited
superior WG and BW starting at 7d of age through until the end of this study (14d). The
enhanced growth performance among the CHP-treated poults may be a consequence of
148
greater digestive capacity as observed by Foye et al. (2006) who used a similar IOF
formulation. Evidently, the CHP-treated poults had greater appetite at placement than
poults of the other treatment groups (Figure 4.1). Although the male poults of both NC
and CHP treatment groups had the same feed conversion, only the CHP poults were
heavier because of higher feed intake (Table 4.9). Some studies demonstrated a positive
correlation between BW at 7 d of age and age of slaughter as influenced by early feeding
(Noy and Sklan, 1998, Noy and Sklan, 1999), but a similar relationship is yet to be
demonstrated in turkeys after in ovo feeding. Poults subjected to the SC IOF treatment
responded intermediately between those subjected to the NC and CHP treatments,
indicating that they received only partial benefit of in ovo feeding.
Conclusion
In ovo feeding, gender and incubation profile affected embryo development,
energy use and post-hatch performance. The best performance was found among male
poults that were in ovo fed a saline solution containing protein and carbohydrate and
incubated using single stage temperature profile.
149
References Boerjan, M. 2006. Chick vitality and uniformity. in International Hatchery
Practice 20(8):7-9. Donaldson, W. E., V. L. Christensen, and K. K. Krueger. 1991. Effects of
stressors on blood glucose and hepatic glycogen concentrations in turkey poults. Comp Biochem Physiol A 100:945-947.
Foye, O. T. 2005. The biochemical and molecular effects of amnionic nutrient
administration, “in ovo feeding” on intestinal development and function and carbohydrate metabolism in turkey embryos and poults. Ph.D. Dissertation. North Carolina State University. Raleigh, NC.
Foye, O. T., Z. Uni, and P. R. Ferket. 2006. Effect of in ovo feeding egg white protein,
beta-hydroxy-beta-methylbutyrate, and carbohydrates on glycogen status and neonatal growth of turkeys. Poult Sci 85:1185-1192.
French, N. A. 1997. Modeling incubation temperature: the effects of incubator design,
embryonic development, and egg size. Poult Sci 76:124-133. Funderburk, S. L., V. L. Christensen, G. C. Campbell, M. J. Wineland, J. L. Grimes, K.
M. Mann, E. R. Neely, D. T. Ort, D. V. Rives, J. P. McMurry. 2006. Incubation temperature and eggshell conductance effects on intestinal maturation and thyroid function in commercial turkey poults hatching from an induced molted flock. Poult. Sci 85(Suppl 1):57. (Abstr)
Hulet, R., G. Gladys, D. Hill, R. Meijerhof, and T. El-Shiekh. 2007. Influence of egg
shell embryonic incubation temperature and broiler breeder flock age on posthatch growth performance and carcass characteristics. Poult Sci 86:408-412.
Joseph, N. S., and E. T. Moran, Jr. 2005. Effect of flock age and postemergent holding in
the hatcher on broiler live performance and further-processing yield. J Appl Poult Res 14:512-520.
National Research Council, 1994. Nutrient requirements for poultry. 9th rev. ed.
National Academy Press, Washington, DC. Noy, Y., and D. Sklan. 1998. Metabolism responses to early nutrition. J Appl Poult Res
7:437-451. Noy, Y., and D. Sklan. 1999. Different Types of Early Feeding and Performance In
Chicks and Poults. J Appl Poult Res 8:16-24.
SAS Institute. 2005. JMP Version 6 User's Guide. SAS Inst., Cary, NC.
150
Tona, K., F. Bamelis, B. De Ketelaere, V. Bruggeman, V. M. Moraes, J. Buyse, O. Onagbesan, and E. Decuypere. 2003. Effects of egg storage time on spread of hatch, chick quality, and chick juvenile growth. Poult Sci 82:736-741.
Tona, K., O. Onagbesan, V. Bruggeman, K. Mertens, and E. Decuypere. 2005. Effects of
turning duration during incubation on embryo growth, utilization of albumen, and stress regulation. Poult Sci 84:315-320.
Uni, Z., and P. R. Ferket 2003. Enhancement of development of oviparous species by in
ovo feeding. U.S. Patent no. 6,592,878 B2. Uni, Z., and P. R. Ferket. 2004. Methods for early nutrition and their potential. Worlds
Poult Sci J 60:101-111. Uni, Z., P. R. Ferket, and E. Tako. 2006. In ovo feeding: impact on gut development,
energetic status, gene expression and growth performance. Pages 47-48 in The 29th Technical Turkey Conference. Turkey.
Warner, J. D., P. R. Ferket, V. L. Christensen, J. V. Felts. 2006. Effects of season, hatch
time, and post-hatch holding on glycogen status of turkey poults. Poult Sci 85(Suppl 1):56-57. (Abstr)
Whitehead, C. C. 1991. Nutrition of the breeding bird and developing embryo. Pages
227-237 in Avian Incubation, Poultry Science Symposium 22. S. G. Toullet ed. Butterworth-Heineman, Boston, MA.
151
Chapter 5
“Effect of in ovo feeding on glycogen status of perinatal turkeys”
Abstract
In ovo feeding (IOF) improves turkey poult quality and viability, but the formulation
must be optimized relative to appropriate control treatments. The objective of this study
was to compare different controls and IOF formulations. At 23 days of incubation (E),
840 Hybrid turkey eggs were sorted into 5 groups of similar weight distribution and
assigned to the following treatments: 1) non-injected control (NC); 2) shell-hole punch
control (HC); 3) 1.5 ml IOF saline control solution (SC); 4) 1.5 ml carbohydrate IOF
solution (CHO); and 5) 1.5 ml carbohydrate-protein solution (CHP). Hatchability rate
(HR) and body weights (BW) were recorded at hatch, and then the poults were randomly
distributed by treatment and sex among 12 replicate pens. Glycogen concentration [GLY]
of liver (L), pectoral muscle (BM), and pipping muscle (PM) were determined at 25E (8
eggs/treatment) and hatch (10 poults/treatment). BW and weight gain (WG) were
determined at 7 and 14 d. IOF treatments increased HR in comparison to controls (93%
and 93% for CHO and CHP versus 90%, 91%, and 91% for NC, HC, and SC, p<.05).
CHO and CHP had 2% higher BW over controls (NC, HC, and SC) at hatch (p<.05). BW
of toms was greater than hens, but there was no difference among treatments after 7d. HC
had higher WG at 7d when compared with CHO (p<.05). There were no treatment effects
on [GLY] in PM or L at 25E. At hatch, PM [GLY] was greatest for CHO, intermediate
for CHP, and lowest for NC and SC (16.8, vs. 8.6, vs. 2.8 and 4.1 mg/g, respectively,
p<.05). BM [GLY] was greatest for NC, followed by CHP than CHO and SC (2.2, 1.3, .7,
152
and .4 mg/g, respectively). L [GLY] was higher for CHO than CHP, NC, and SC (11.9
vs. 4.8, 6.6, and 5.7 mg/g, respectively, p<.05). IOF solutions containing CHO or CHP
increased HR and BW at hatch, probably due improved energy status. Since HC and SC
affected [GLY] in tissues and WG when compared with NC, they can not be considered
controls for IOF studies
Introduction
Genetic selection of commercial meat poultry has succeeded to yield great growth
potential (Hammerstedt, 1999). As the number of days for modern broilers and turkeys to
achieve market weight decreases with each generation of selection, the neonatal growth
period becomes of greater relative importance to their total productive life (Uni and
Ferket, 2004; Ferket et al., 2005). Turkey poults are particularly at risk because they must
endure the stress of hatching, some waiting in the hatching cabinet for over 24 hours after
hatch, then they are subjected to the stress of handling and transport for another 24 hours
before given access to feed and water (Donaldson and Christensen, 1991; Donaldson et
al., 1991). Consequently, many poults succumb to impaired growth and as many as 4-6%
do not survive the first week of life (Carver et al., 2000; Christensen et al., 2003; Uni and
Ferket, 2004).
The major energy source available for poults to hatch and sustain them until feed
intake begins comes from glycogen reserves stored in the liver prior to hatch (Donaldson
1995; Christensen et al., 1999). In order to improve the glycogen status of neonatal
poultry, Uni and Ferket (2003) proposed in ovo feeding (IOF): injecting a nutrient
solution into the amnion of the embryo prior to internal pipping. Several studies have
demonstrated that IOF accelerates enteric development and maturation before and after
153
hatch (Uni and Ferket, 2004; Tako et al., 2005; Smirnov et al., 2006; Uni et al., 2006),
improves hatchability (Ferket et al., 2005), increases body weight and relative pectoral
muscle size at hatch (Ferket et al., 2005; Uni et al., 2005), and improves energy status
(Uni et al., 2005). Previous research in our laboratory have demonstrated that IOF of
several nutrients have beneficial effects, including carbohydrates (Tako et al., 2004),
sodium chloride (Tako et al., 2005; Smirnov et al., 2006), arginine (Foye, 2005), egg
white protein (Foye, 2005; Foye et al., 2006), zinc-methionine (Tako et al., 2005) and β-
hydroxy-β-methylbutyrate (HMB) (Tako et al., 2004; Foye et al., 2006).
Since soybean meal is the primary dietary protein source for turkey poults
(Donaldson, 1995), it was hypothesized that hydrolyzed soy protein (HSP) would be a
good candidate ingredient for IOF solution formulation. Previous studies showed that
poults IOF HSP had enhanced energy status (Chapters 2 and 3), superior feed intake
(Chapter 2), and suffered less negative effects of heat stress during incubation (Chapter
4). The objective of the study reported herein was to evaluate the efficacy of an IOF
solution containing hydrolyzed soy in comparison to control treatments, including IOF
solutions containing carbohydrates, saline, and sham injections. IOF Treatment efficacy
was evaluated by hatching performance indicators, hatchling body weight, and glycogen
reserves in liver, hatching muscle, and pectoral muscle.
Material and Methods Eight-hundred-forty fertile Hybrid turkey eggs were obtained from a commercial
hatchery1, sorted by weight, and divided into 5 treatment groups (175 eggs per treatment)
with similar weight distribution (87.5 g, ±12.5), and incubated at Pfizer-Embrex Inc.2
1 Prestage Farms, Clinton, NC 2 Research Triangle Park, Durham, NC
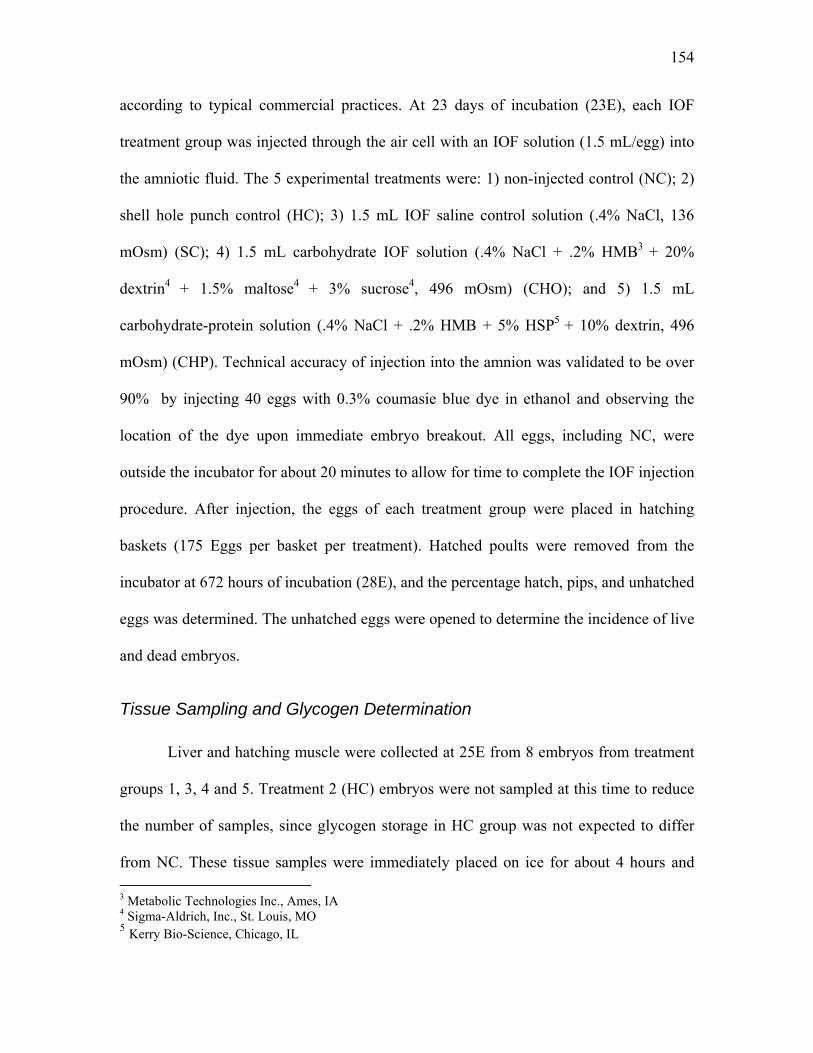
154
according to typical commercial practices. At 23 days of incubation (23E), each IOF
treatment group was injected through the air cell with an IOF solution (1.5 mL/egg) into
the amniotic fluid. The 5 experimental treatments were: 1) non-injected control (NC); 2)
shell hole punch control (HC); 3) 1.5 mL IOF saline control solution (.4% NaCl, 136
mOsm) (SC); 4) 1.5 mL carbohydrate IOF solution (.4% NaCl + .2% HMB3 + 20%
dextrin4 + 1.5% maltose4 + 3% sucrose4, 496 mOsm) (CHO); and 5) 1.5 mL
carbohydrate-protein solution (.4% NaCl + .2% HMB + 5% HSP5 + 10% dextrin, 496
mOsm) (CHP). Technical accuracy of injection into the amnion was validated to be over
90% by injecting 40 eggs with 0.3% coumasie blue dye in ethanol and observing the
location of the dye upon immediate embryo breakout. All eggs, including NC, were
outside the incubator for about 20 minutes to allow for time to complete the IOF injection
procedure. After injection, the eggs of each treatment group were placed in hatching
baskets (175 Eggs per basket per treatment). Hatched poults were removed from the
incubator at 672 hours of incubation (28E), and the percentage hatch, pips, and unhatched
eggs was determined. The unhatched eggs were opened to determine the incidence of live
and dead embryos.
Tissue Sampling and Glycogen Determination
Liver and hatching muscle were collected at 25E from 8 embryos from treatment
groups 1, 3, 4 and 5. Treatment 2 (HC) embryos were not sampled at this time to reduce
the number of samples, since glycogen storage in HC group was not expected to differ
from NC. These tissue samples were immediately placed on ice for about 4 hours and 3 Metabolic Technologies Inc., Ames, IA 4 Sigma-Aldrich, Inc., St. Louis, MO 5 Kerry Bio-Science, Chicago, IL
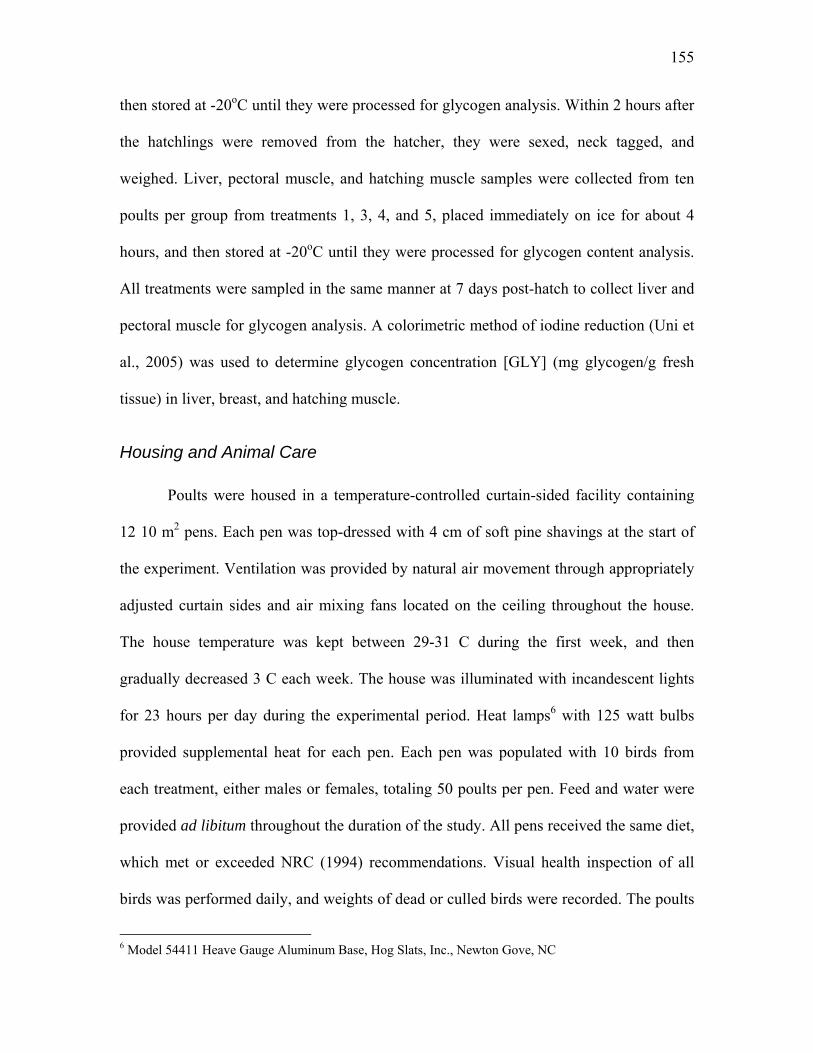
155
then stored at -20oC until they were processed for glycogen analysis. Within 2 hours after
the hatchlings were removed from the hatcher, they were sexed, neck tagged, and
weighed. Liver, pectoral muscle, and hatching muscle samples were collected from ten
poults per group from treatments 1, 3, 4, and 5, placed immediately on ice for about 4
hours, and then stored at -20oC until they were processed for glycogen content analysis.
All treatments were sampled in the same manner at 7 days post-hatch to collect liver and
pectoral muscle for glycogen analysis. A colorimetric method of iodine reduction (Uni et
al., 2005) was used to determine glycogen concentration [GLY] (mg glycogen/g fresh
tissue) in liver, breast, and hatching muscle.
Housing and Animal Care
Poults were housed in a temperature-controlled curtain-sided facility containing
12 10 m2 pens. Each pen was top-dressed with 4 cm of soft pine shavings at the start of
the experiment. Ventilation was provided by natural air movement through appropriately
adjusted curtain sides and air mixing fans located on the ceiling throughout the house.
The house temperature was kept between 29-31 C during the first week, and then
gradually decreased 3 C each week. The house was illuminated with incandescent lights
for 23 hours per day during the experimental period. Heat lamps6 with 125 watt bulbs
provided supplemental heat for each pen. Each pen was populated with 10 birds from
each treatment, either males or females, totaling 50 poults per pen. Feed and water were
provided ad libitum throughout the duration of the study. All pens received the same diet,
which met or exceeded NRC (1994) recommendations. Visual health inspection of all
birds was performed daily, and weights of dead or culled birds were recorded. The poults
6 Model 54411 Heave Gauge Aluminum Base, Hog Slats, Inc., Newton Gove, NC
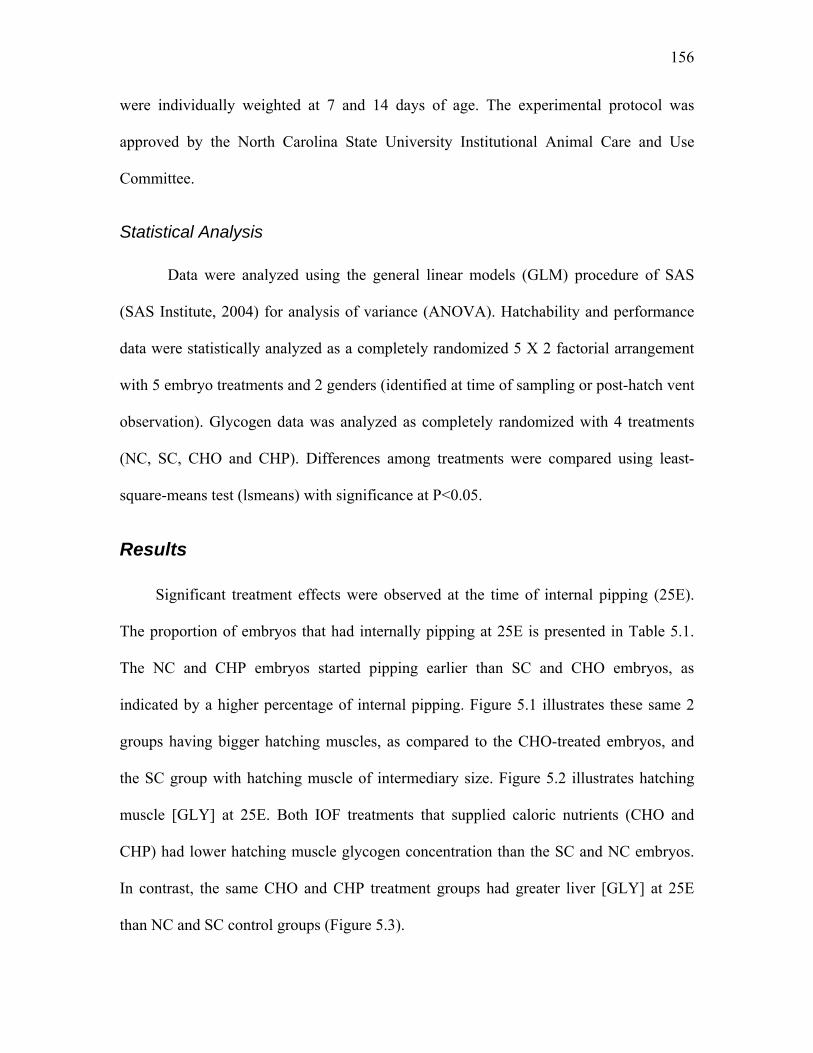
156
were individually weighted at 7 and 14 days of age. The experimental protocol was
approved by the North Carolina State University Institutional Animal Care and Use
Committee.
Statistical Analysis
Data were analyzed using the general linear models (GLM) procedure of SAS
(SAS Institute, 2004) for analysis of variance (ANOVA). Hatchability and performance
data were statistically analyzed as a completely randomized 5 X 2 factorial arrangement
with 5 embryo treatments and 2 genders (identified at time of sampling or post-hatch vent
observation). Glycogen data was analyzed as completely randomized with 4 treatments
(NC, SC, CHO and CHP). Differences among treatments were compared using least-
square-means test (lsmeans) with significance at P<0.05.
Results
Significant treatment effects were observed at the time of internal pipping (25E).
The proportion of embryos that had internally pipping at 25E is presented in Table 5.1.
The NC and CHP embryos started pipping earlier than SC and CHO embryos, as
indicated by a higher percentage of internal pipping. Figure 5.1 illustrates these same 2
groups having bigger hatching muscles, as compared to the CHO-treated embryos, and
the SC group with hatching muscle of intermediary size. Figure 5.2 illustrates hatching
muscle [GLY] at 25E. Both IOF treatments that supplied caloric nutrients (CHO and
CHP) had lower hatching muscle glycogen concentration than the SC and NC embryos.
In contrast, the same CHO and CHP treatment groups had greater liver [GLY] at 25E
than NC and SC control groups (Figure 5.3).

157
There were significant treatment effects observed on hatchability and body weights
on the day of hatch. All the IOF treatment groups (SC, CHO, and CHP) had 2% higher
hatchability rates because of fewer dead embryos than the NC and HC treatment groups
(Table 5.2). Poults fed CHO or CHP were significantly heavier at hatch than NC and HC
control poults, with SC poults not differing from either group (Figure 5.4). However,
these differences in hatchling BW were no longer observed at 7 or 14 days post-hatch
(Table 5.3). As expected, the male poults gained more weight and were heavier
throughout the whole study than the females.
The IOF treatments had different effects on body glycogen reserves at hatch,
depending on the tissue of origin. The CHO treated poults had highest [GLY] in hatching
muscle, significantly higher than the CHP as well as the SC and NC poults. Although the
combination of carbohydrates and protein in the IOF solution resulted in lower hatching
muscle [GLY] than carbohydrates alone (CHO), the CHP treatment still resulted in
higher [GLY] than the SC and NC treatments (Figure 5.5). In contrast to hatching
muscle, liver [GLY] at hatch was significantly increased only among the CHO treated
poults (Figure 5.6). In contrast to what was observed for hatching muscle and liver,
pectoral muscle [GLY] was highest among the NC treatment group (Figure 5.7). Pectoral
muscle [GLY] was lowest among the SC treatment group, but it was incrementally
increased as the caloric content of IOF treatment increased as in CHO and CHP,
respectively.
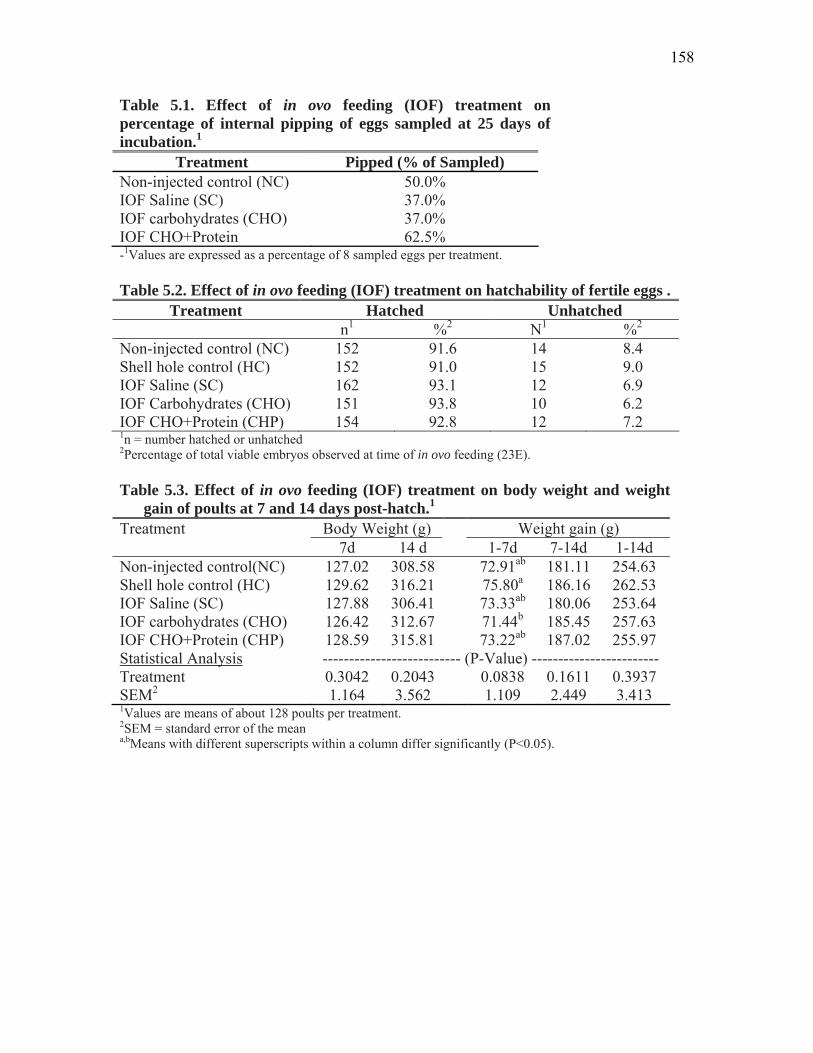
158
Table 5.1. Effect of in ovo feeding (IOF) treatment on percentage of internal pipping of eggs sampled at 25 days of incubation.1
Treatment Pipped (% of Sampled) Non-injected control (NC) 50.0% IOF Saline (SC) 37.0% IOF carbohydrates (CHO) 37.0% IOF CHO+Protein 62.5% -1Values are expressed as a percentage of 8 sampled eggs per treatment. Table 5.2. Effect of in ovo feeding (IOF) treatment on hatchability of fertile eggs .
Treatment Hatched Unhatched n1 %2 N1 %2
Non-injected control (NC) 152 91.6 14 8.4 Shell hole control (HC) 152 91.0 15 9.0 IOF Saline (SC) 162 93.1 12 6.9 IOF Carbohydrates (CHO) 151 93.8 10 6.2 IOF CHO+Protein (CHP) 154 92.8 12 7.2 1n = number hatched or unhatched 2Percentage of total viable embryos observed at time of in ovo feeding (23E). Table 5.3. Effect of in ovo feeding (IOF) treatment on body weight and weight
gain of poults at 7 and 14 days post-hatch.1 Treatment Body Weight (g) Weight gain (g) 7d 14 d 1-7d 7-14d 1-14d Non-injected control(NC) 127.02 308.58 72.91ab 181.11 254.63 Shell hole control (HC) 129.62 316.21 75.80a 186.16 262.53 IOF Saline (SC) 127.88 306.41 73.33ab 180.06 253.64 IOF carbohydrates (CHO) 126.42 312.67 71.44b 185.45 257.63 IOF CHO+Protein (CHP) 128.59 315.81 73.22ab 187.02 255.97 Statistical Analysis -------------------------- (P-Value) ------------------------ Treatment 0.3042 0.2043 0.0838 0.1611 0.3937 SEM2 1.164 3.562 1.109 2.449 3.413 1Values are means of about 128 poults per treatment. 2SEM = standard error of the mean a,bMeans with different superscripts within a column differ significantly (P<0.05).
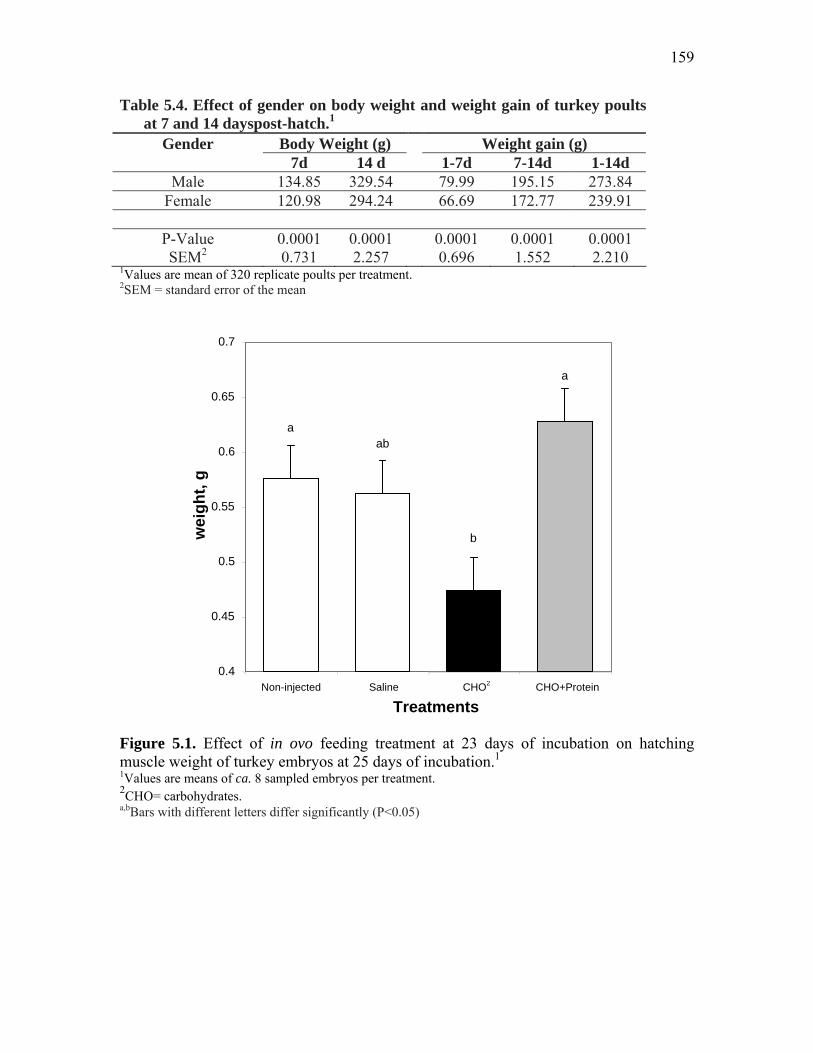
159
Table 5.4. Effect of gender on body weight and weight gain of turkey poults at 7 and 14 dayspost-hatch.1
Gender Body Weight (g) Weight gain (g) 7d 14 d 1-7d 7-14d 1-14d
Male 134.85 329.54 79.99 195.15 273.84 Female 120.98 294.24 66.69 172.77 239.91
P-Value 0.0001 0.0001 0.0001 0.0001 0.0001 SEM2 0.731 2.257 0.696 1.552 2.210
1Values are mean of 320 replicate poults per treatment. 2SEM = standard error of the mean
Figure 5.1. Effect of in ovo feeding treatment at 23 days of incubation on hatching muscle weight of turkey embryos at 25 days of incubation.1 1Values are means of ca. 8 sampled embryos per treatment. 2CHO= carbohydrates. a,bBars with different letters differ significantly (P<0.05)
a
b
aba
0.4
0.45
0.5
0.55
0.6
0.65
0.7
Non-injected Saline CHO2 CHO+Protein Treatments
wei
ght,
g
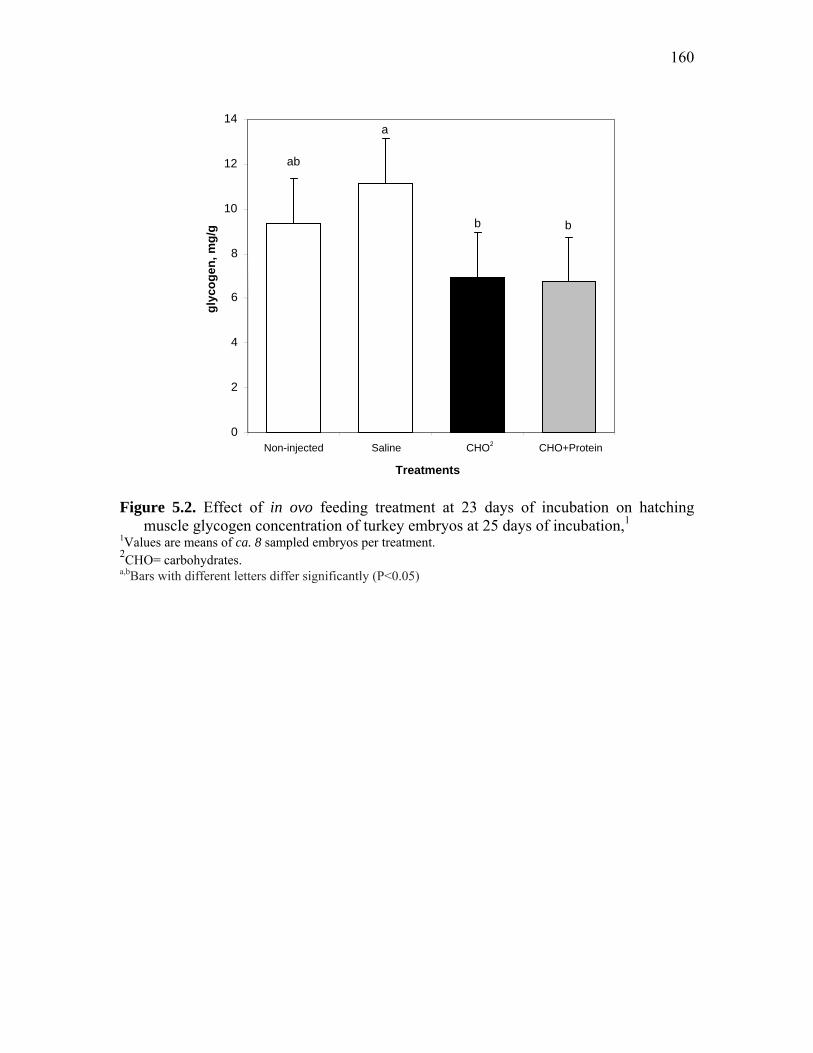
160
Figure 5.2. Effect of in ovo feeding treatment at 23 days of incubation on hatching
muscle glycogen concentration of turkey embryos at 25 days of incubation,1 1Values are means of ca. 8 sampled embryos per treatment. 2CHO= carbohydrates. a,bBars with different letters differ significantly (P<0.05)
b b
a
ab
0
2
4
6
8
10
12
14
Non-injected Saline CHO2 CHO+Protein Treatments
glyc
ogen
, mg/
g

161
Figure 5.3. Effect of in ovo feeding treatment at 23 days of incubation on liver glycogen concentration of turkey embryos at 25 days of incubation.1 1Values are means of ca. 8 sampled embryos per treatment. 2CHO= carbohydrates. a,bBars with different letters differ significantly (P<0.05)
b b
aa
40
60
80
100
120
140
160
Non-injected Saline CHO2 CHO+Protein
Treatments
Con
cent
ratio
n, m
g/g
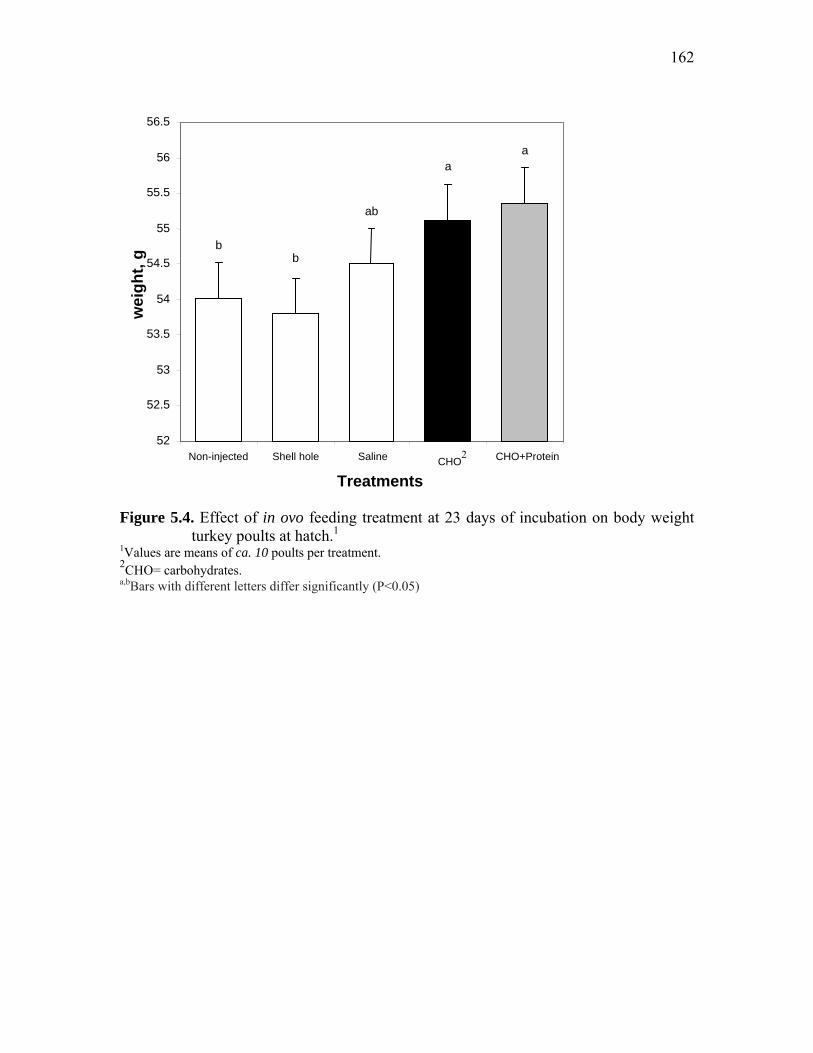
162
Figure 5.4. Effect of in ovo feeding treatment at 23 days of incubation on body weight
turkey poults at hatch.1 1Values are means of ca. 10 poults per treatment. 2CHO= carbohydrates. a,bBars with different letters differ significantly (P<0.05)
aa
ab
b b
52
52.5
53
53.5
54
54.5
55
55.5
56
56.5
Non-injected Shell hole Saline CHO2 CHO+Protein
Treatments
wei
ght,
g
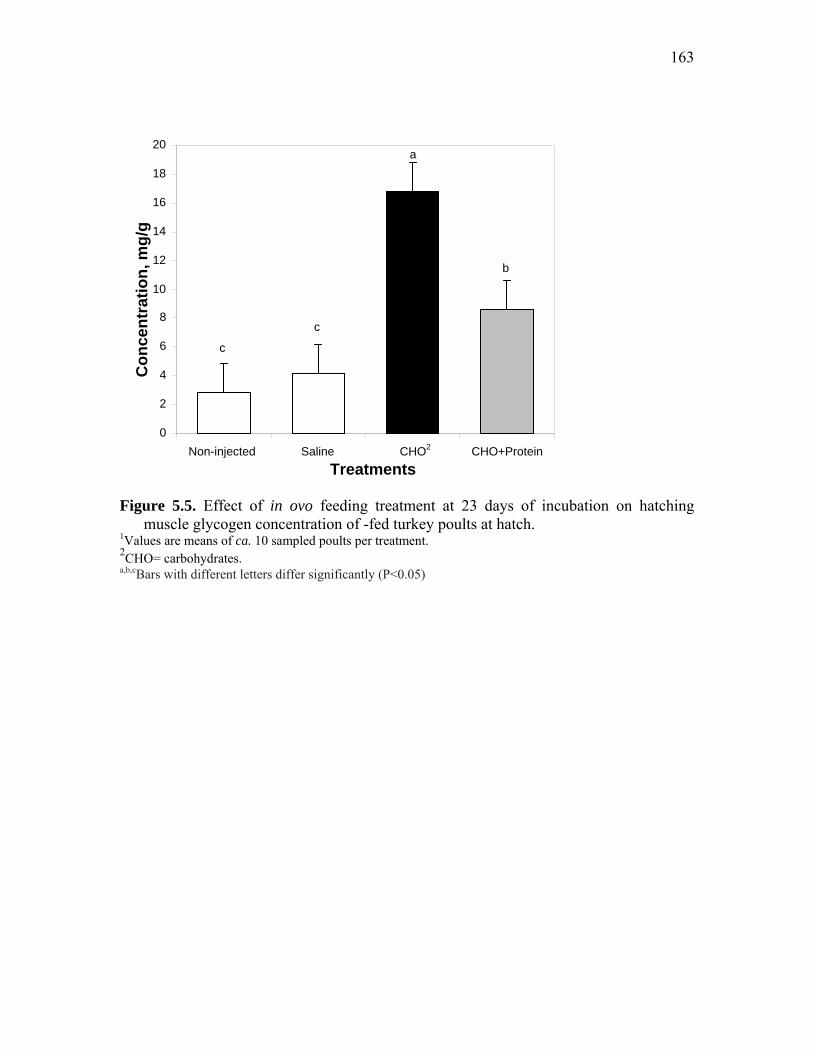
163
Figure 5.5. Effect of in ovo feeding treatment at 23 days of incubation on hatching
muscle glycogen concentration of -fed turkey poults at hatch. 1Values are means of ca. 10 sampled poults per treatment. 2CHO= carbohydrates. a,b,cBars with different letters differ significantly (P<0.05)
c c
a
b
0
2
4
6
8
10
12
14
16
18
20
Non-injected Saline CHO2 CHO+ProteinTreatments
Con
cent
ratio
n, m
g/g

164
Figure 5.6. Effect of in ovo feeding treatment at 23 days of incubation on liver glycogen concentration of turkey poults at hatch.1 1Values are means of ca. 10 sampled poults per treatment. 2CHO= carbohydrates. a,bBars with different letters differ significantly (P<0.05)
b
a
bb
0
2
4
6
8
10
12
14
16
Non-injected Saline CHO2 CHO+Protein Treatments
Con
cent
ratio
n, m
g/g
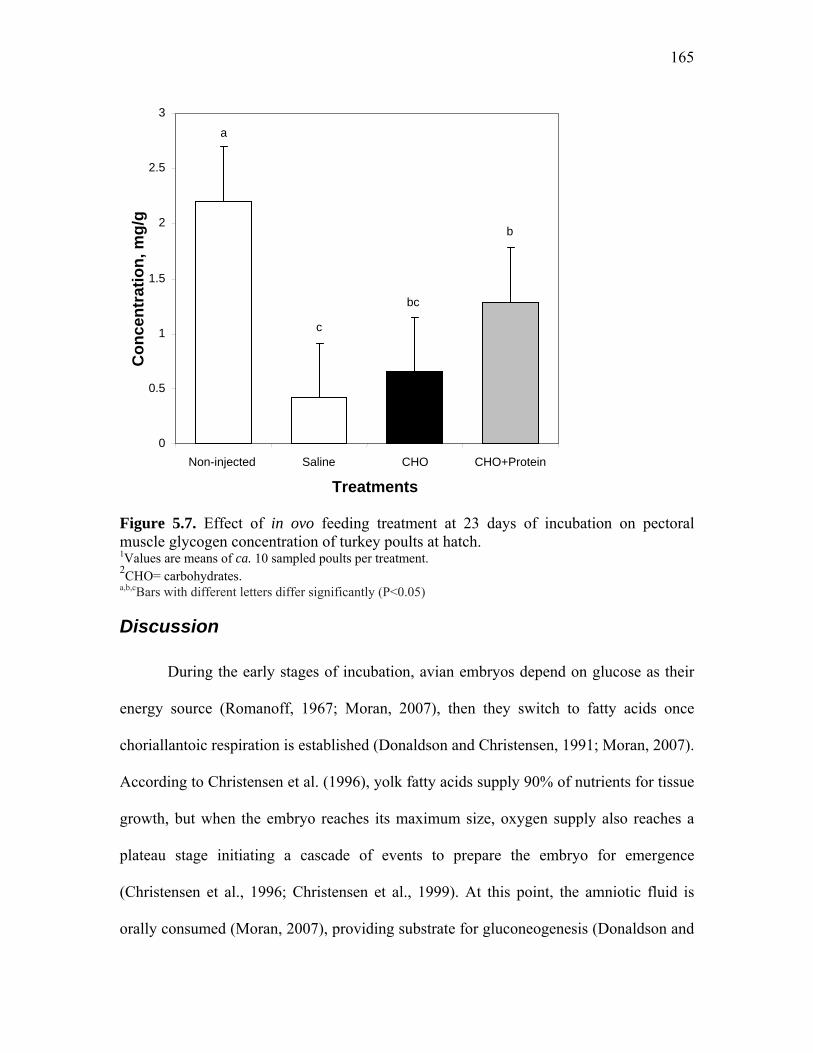
165
Figure 5.7. Effect of in ovo feeding treatment at 23 days of incubation on pectoral muscle glycogen concentration of turkey poults at hatch. 1Values are means of ca. 10 sampled poults per treatment. 2CHO= carbohydrates. a,b,cBars with different letters differ significantly (P<0.05)
Discussion
During the early stages of incubation, avian embryos depend on glucose as their
energy source (Romanoff, 1967; Moran, 2007), then they switch to fatty acids once
choriallantoic respiration is established (Donaldson and Christensen, 1991; Moran, 2007).
According to Christensen et al. (1996), yolk fatty acids supply 90% of nutrients for tissue
growth, but when the embryo reaches its maximum size, oxygen supply also reaches a
plateau stage initiating a cascade of events to prepare the embryo for emergence
(Christensen et al., 1996; Christensen et al., 1999). At this point, the amniotic fluid is
orally consumed (Moran, 2007), providing substrate for gluconeogenesis (Donaldson and
a
c bc
b
0
0.5
1
1.5
2
2.5
3
Non-injected Saline CHO CHO+Protein
Treatments
Con
cent
ratio
n, m
g/g
166
Christensen, 1991; Donaldson, 1995), so glycogen can be stored in liver and muscle
tissues (Christensen et al., 1996; Christensen et al., 1999; Christensen et al., 2003; Uni et
al., 2005). These glycogen reserves will be the embryo’s sole energy supply during
hatching (Romanoff, 1967; Donaldson, 1995; Moran, 2007), since the choriallantois is
detached from the shell during pipping, limiting oxygen supply and lipid catabolism
(Moran, 2007). Even after hatch, gluconeogenesis and glycogenolysis will continue to be
the poult’s glucose source until feed is consumed (Donaldson and Christensen, 1991;
Keirs et al., 2002; Peebles et al., 2006; Moran, 2007). The liver is especially important
because it is the embryo’s largest glycogen reserve (Romanoff, 1967), and in contrast to
muscle, the liver has all the dephosphorylation enzymes necessary to mobilize glucose to
other tissues (Matthews and Holde, 1990). This means that glucose derived from muscle
glycogen can only be used locally, while liver glucose can be mobilized for use in other
body tissues.
In the process of glycogen accumulation, glucose is taken in greater amounts by
tissues that are active during hatching, like the hatching muscle, pectoral muscle and the
heart. The complexus muscle (hatching muscle), located in the back of the neck right
below the skull, is responsible for pulling the head back so the beak can break the
membranes and the shell (John et al., 1987; Moran, 2007). This muscle grows larger in
size right before internal pipping, and shrinks after a couple days post-hatch (John et al.,
1987). It swells due to water and glycogen granules accumulation, and most of its muscle
fibers are exclusively glycolytic (John et al., 1987; Moran, 2007).
Stress conditions, such as low oxygen levels and high temperatures, during late
incubation can cause embryos to hatch earlier. Embryonic distress may have occurred
167
among the NC and CHP embryos in this study, these treatment groups had a higher
number of internal pipped embryos at 25E than the other treatments. The NC treated
group may be distressed because of limited glycogen reserves to sustain anaerobic
metabolism, whereas the CHP embryos may have been distressed by increased nitrogen
metabolism or by soy anti-nutritional factors. Even though HSP product composition
does not show specific composition of carbohydrates, it states that the level is high
(Kerry Bio-Science, 2007), so common soy anti-nutritional factors, such as
oligosaccharides and lignin, may be present. Adding nutrients to the amnion by IOF
influenced the size and [GLY] of the hatching muscle at 25E (Figures 5.1 and 5.2). NC
and SC control groups had [GLY] similar to levels reported by John et al. (1987), while
CHP and CHO increased [GLY] 1 and 2 fold, respectively. The same treatments that
were pipping earlier at 25E (NC and CHP, Table 5.1) also had bigger hatching muscles
(Figure 5.1), confirming the key role of this tissue on pipping. Incubation distress has
been observed to speed hatching muscle development and accelerate hatching in turkeys.
The IOF formulation apparently influenced energy partitioning in the late-term
embryo. Feeding CHO alone reduced hatching muscle size (Figure 5.1) and [GLY] as
compared to NC (Figure 5.2), probably because these embryos directed more resources to
liver glycogen stores (Figure 5.3). Combining protein with carbohydrates in the IOF
solution (CHP) did not change hatching muscle size (Figure 5.1), perhaps because more
amino acids were available for protein synthesis. Evidently, IOF solutions containing
caloric substrates affect energy partitioning prior to pipping and hatching because
embryos fed CHO or CHP had less hatching muscle [GLY] (Figure 5.2) and more liver
[GLY] at 25E and NC and SC (Figure 5.3). Hepatic [GLY] of poults at hatch is 12-15
168
mg/g (Donaldson and Christensen, 1991; Donaldson, 1995; Christensen et al., 1996),
which was similar to the 12 mg/g found in this study for the CHO fed group, while the
other treatment groups had only half of that amount. Apparently, the embryos in this
study had lower energy reserves than poults studied by Donaldson and Christensen.
The SC treatment was intended to serve as a positive control treatment to test the
effect of the IOF base solution, .4% saline. The SC treatment was not significantly
different from the NC treatment for all measured parameters except for pectoral muscle
[GLY]. Because the Pectoral muscle [GLY] was significantly lower among the SC
treatment group than the NC treatment, in ovo feeding a saline solution evidently affected
breast tissue metabolism and thus cannot be considered as sham-injection control relative
to the CHO and CHP treatments.
Liver glycogen levels were clearly enhanced before pipping by feeding CHO and
CHP (Figure 5.3), confirming our hypothesis that embryos can use IOF nutrients to
complement innate energy sources. This advantage in energy status was why IOF poults
were heavier than NC and HC at hatch (Figure 5.4). Remaining [GLY] in hatching
muscle and liver were higher for CHO fed poults than for other treatments (Figures 5.5
and 5.6), indicating a surplus of glycogen. Combining protein and carbohydrates in the
IOF solution (CHP) reduced the remaining [GLY] in the hatching muscle and liver after
hatch in comparison with the IOF solution containing CHO alone (Figures 5.5 and 5.6),
which may be again due to higher energy cost of protein metabolism. Hatching muscle
and liver [GLY] of the SC treatment group did not differ the NC treatment group at hatch
(Figures 5.5 and 5.6), but [GLY] remaining in pectoral muscle was reduced to a quarter
of NC, and half of CHP levels (Figure 5.7). Lower levels of remaining [GLY] in pectoral
169
muscle were also observed in all other IOF treatments at hatch as compared to NC
(Figure 5.7), which indicates that they used whatever glycogen stores they had in this
tissue. In contrast to the IOF treatments, the NC treatment group had higher amounts of
energy trapped as glycogen in pectoral muscle, which was unavailable to other tissues.
Based in these results it seems that IOF triggered better energy partition, favoring
liver over muscle. Pectoral muscle [GLY] of IOF poults varied between 0.4-1.2 mg/g,
which agreed with the 0.7 mg glycogen/g pectoral muscle observed by Christensen et al.,
(1999). In contrast, the pectoral muscle [GLY] of the NC treatment group at hatch was
over 2 mg/g, higher that observed by Christensen et al., (1999). This difference in
pectoral muscle [GLY] between studies may be associated with the differences in genetic
strain of poults used. Christensen et al. (1999) observed embryos from unique genetic
lines selected either for egg production or body weight, whereas a commercial genetic
line7 was used in the present study. Therefore, genetic differences may be responsible for
increased glycogen deposition in pectoral muscle found in this study, exacerbating the
effects of limited energy reserves by trapping glycogen in the muscle.
The HC group was not different from NC group for any of the parameters studied
until hatch; thus any benefit of IOF on poults at hatch was due to the addition of in ovo
nutrients, and not due to extra air exchange through the injection site. However, weight
gain during the first week post-hatch was enhanced by the HC treatment (Table 5.3),
disqualifying this treatment as a control for IOF studies.
Treatment differences in BW at hatch disappeared after 7 days post-hatch (Table
5.3). There may be two possible reasons why weight differences at hatch were not carried
on later in life: 1) The caloric content of the IOF solutions was enough to help embryos 7 Hybrid turkeys, Inc., Kitchener, Ontario, Canada

170
hatch, but it inhibited post-hatch gluconeogenesis, affecting glucose supply; and 2) Poults
subjected to IOF may require different nutrition, management, and brooding conditions to
retain advantages found at hatch. This is indicated by lower weight gain of CHO fed
poults during the first week post-hatch, as compared to controls (Table 5.3). Based on the
results of this study, IOF carbohydrates and protein altered energy partitioning during the
perinatal period, favoring glycogen stores in liver over muscle. Just punching a hole in
the shell or IOF saline should not be considered as positive or sham control groups of
IOF study because the former change weight gain and the later changed pectoral muscle
glycogen stores as compared to the non-injected controls. More studies are necessary to
detail the impact of in ovo feeding carbohydrate and protein on metabolism, and to
determine why differences at hatch dissipate within a few days after hatch.

171
References Carver, D. K., J. Fetrow, T. Gering, M. T. Correa, K. K. Krueger, and H. J. Barnes. 2000.
Use of statistical modeling to assess risk for early poult mortality in commercial turkey flocks. J Appl Poult Res 10:397-420.
Christensen, V. L., W. E. Donaldson, and J. P. McMurtry. 1996. Physiological
differences in late embryos from turkey breeders at different ages. Poult Sci 75:172-178.
Christensen, V. L., W. E. Donaldson, and K. E. Nestor. 1999. Length of the plateau and
pipping stages of incubation affects the physiology and survival of turkeys. Br Poult Sci 40:297-303.
Christensen, V. L., D. T. Ort, and J. L. Grimes. 2003. Physiological factors associated
with weak neonatal poults (Meleagris gallopavo). Int J Poult Sci 2:7-14. Donaldson, W. E., and V. L. Christensen. 1991. Dietary carbohydrate level and glucose
metabolism in turkey poults. Comp Biochem Physiol A 98:347-350. Donaldson, W. E., V. L. Christensen, and K. K. Krueger. 1991. Effects of stressors on
blood glucose and hepatic glycogen concentrations in turkey poults. Comp Biochem Physiol A 100:945-947.
Donaldson, W. E. 1995. Carbohydrate, hatchery stressors affect poult survival. in
Feedstuffs 67(14):16-17. Ferket, P. R., Z. Uni, E. Tako, O. T. Foye, and J. E. Oliveira. 2005. In ovo feeding
nutrition: impact on gene expression, gut development, and growth performance. Pages 160-172 in The Annual Nutrition Conference. September 13-15. University of Arkansas. Rogers, AR.
Foye, O. T. 2005. The biochemical and molecular effects of amnionic nutrient
administration, “in ovo feeding” on intestinal development and function and carbohydrate metabolism in turkey embryos and poults. Ph.D. Dissertation. North Carolina State University. Raleigh, NC.
Foye, O. T., Z. Uni, and P. R. Ferket. 2006. Effect of in ovo feeding egg white protein,
beta-hydroxy-beta-methylbutyrate, and carbohydrates on glycogen status and neonatal growth of turkeys. Poult Sci 85:1185-1192.
Hammerstedt, R. H. 1999. Symposium summary and challenges for the future. Poult Sci
78:459-466. John, T. M., J. C. George, and E. T. Moran, Jr. 1987. Pre- and post-hatch ultrastructural
and metabolic changes in the hatching muscle of turkey embryos from antibiotic and glucose treated eggs. Cytobios 49:197-210.
172
Keirs, R. W., E. D. Peebles, S. A. Hubbard, and S. K. Whitmarsh. 2002. Effects of supportative gluconeogenic substrates on early performance of broilers under adequate brooding conditions. J Appl Poult Res 11:367-372.
Kerry Bio-Science. 2007. Enzymatic digestion of soy meal. in Product Information Sheet
Hy-Soy (5X59022). Kerry Bio-Science. Norwich, NY Matthews, C. K., and K. E. Holde 1990. Carbohydrate metabolism: biosynthesis. Pages
670-703 in BiochemistryThe Benjamin/Cummings Publishing Company, Inc., Redwood City, CA.
Moran, E. T., Jr. 2007. Nutrition of the developing embryo and hatchling. Poult Sci
86:1043-1049. Peebles, E. D., W. D. Berry, R. W. Keirs, L. W. Bennett, and P. D. Gerard. 2006. Effects
of injected gluconeogenic supplementation on the performance of broilers from young breeders. Poult Sci 85:371-376.
Romanoff, A. L. 1967. Biochemistry of the avian embryo; a quantitative analysis of
prenatal development. Interscience Publishers, New York. Smirnov, A., E. Tako, P. R. Ferket, and Z. Uni. 2006. Mucin gene expression and mucin
content in the chicken intestinal goblet cells are affected by in ovo feeding of carbohydrates. Poult Sci 85:669-673.
Tako, E., P. R. Ferket, and Z. Uni. 2004. Effects of in ovo feeding of carbohydrates and
beta-hydroxy-beta-methylbutyrate on the development of chicken intestine. Poult Sci 83:2023-2028.
Tako, E., P. R. Ferket, and Z. Uni. 2005. Changes in chicken intestinal zinc exporter
mRNA expression and small intestinal functionality following intra-amniotic zinc-methionine administration. J Nutr Biochem 16:339-346.
Uni, Z., and P. R. Ferket 2003. Enhancement of development of oviparous species by in
ovo feeding. U.S. Patent no. 6,592,878 B2. Uni, Z., and P. R. Ferket. 2004. Methods for early nutrition and their potential. Worlds
Poult Sci J 60:101-111. Uni, Z., P. R. Ferket, E. Tako, and O. Kedar. 2005. In ovo feeding improves energy status
of late-term chicken embryos. Poult Sci 84:764-770. Uni, Z., P. R. Ferket, and E. Tako. 2006. In ovo feeding: impact on gut development,
energetic status, gene expression and growth performance. Pages 47-48 in The 29th Technical Turkey Conference. Turkey.
173
Chapter 6
“Late-term turkey embryo survey of amnion fluid proprieties and its implication to in ovo feeding studies”
Abstract
Three observational studies of similar design were conducted during the later stages of
embryonic development on each of the three major commercial turkey strains used by the
industry (BUT, NIC and HYB). The eggs used on each of these experiments were from
first-cycle turkey breeder flocks in their 12-13th week of lay. The objective was to
document the changes that occur in the amnion fluid volume and osmolality from 20 to
24 days of incubation (E). This data was then used to determine the proportion of amnion
relative to egg mass, and the rate of amnion consumption by viable embryos. Amnion
fluid volume relative to egg mass decreased with day of incubation in all three strains.
Although NIC and HYB embryos had similar amounts of amnion fluid (11 mL/egg) at
20E, HYB turkeys had the greatest amniotic fluid volume relative to egg mass.
Consumption rate of amniotic fluid was not consistent among turkey strains until after
21E. Considering all three strains, amnion consumption followed a linear trend with
consumption rate of about 0.0012 mL/hr/g egg, or 0.10 mL/hr for a typical 85g turkey
egg. This information was useful to determine amnion volume capacity, maximum safe
injection volume for in ovo studies (1.5 mL), best injection time (22-23E), and osmolality
constraints of solutions that can be administered in ovo (570 mOsm maximum, 450
mOsm ideal).
174
Introduction
Successful avian embryonic development is essential to poultry industry
profitability. Although artificial incubation has been a standard practice for over 50 years,
few improvements in hatchability has occurred during last 20 years (Schaal and Cherian,
2007). Despite incredible advances in genetic potential for growth (Hammerstedt, 1999),
no changes were observed in incubation time, thus incubation now accounts for an
increasing percent (30-40 %) of the total development time of the bird (Hulet, 2007).
Many physiological processes that take place inside the egg during incubation remain
unknown (Romanoff, 1960; Vleck, 1991). Research work on new technologies like in
ovo vaccination (Johnston et al., 1997) and in ovo feeding (Uni and Ferket, 2003; Ferket
et al., 2005) have revealed that more information on late-term embryo development is
needed. Particularly more information is needed related to amnion fluid volume and its
consumption by the embryo and the osmotic limits of amnion and embryo during late-
term development. Such information is especially needed for turkeys, since this has
become a more important poultry production sector (Schaal and Cherian, 2007) and
hatchability and poult quality problems are so prevalent (Christensen et al., 2001;
Christensen et al., 2003). This paper reviews the literature on water compartments of the
egg, and amnion formation and function during the last third of the incubation period.
This paper will also report on a study of amnion proprieties and its consumption by the
developing turkey embryo, which can help determine practical in ovo feeding constraints.

175
The role of water during incubation of avian eggs In contrast to many reptilian eggs that can exchange mass with the environment
through a liquid phase, avian eggs depend upon gas phase mass exchange. Since
inorganic solutes can not leave the egg, the embryo must compensate for variability in
water content by distribution of solute pools (Vleck, 1991). The avian egg shell structure
allows for water loss to the environment but not to gain water from its surroundings
during incubation. The amount of water lost during incubation will depend on incubation
temperature, humidity and ventilation associated to egg shell conductance characteristics,
all of which are not controlled by the developing embryo (Amos, 1991). Metabolic water
is the only way to add water to the system. Organic molecules can be oxidized to CO2
and water, with CO2 diffusing through the shell while water is added to the pool of water
within the egg (Vleck, 1991). Water loss plays a necessary part on incubation. Since egg
internal space is fixed by shell rigidness, water space is replaced by air in the air cell at
the blunt end of the egg. The air in the air cell is important feature by the time of internal
pipping when pulmonary respiration starts. Unlike mammals, where the lungs fill up
immediately at birth, the bird’ lungs and air sacs become gas-filled gradually during the
perinatal period (Amos, 1991). To be able to shut down choriallantoic circulation before
hatch, the respiratory system must be inflated beforehand with air available inside the egg
(air cell). According to Amos (1991), too little water loss may prevent full inflation of the
respiratory system due to insufficient air in the air cell. Excessive water loss on the other
hand must be compensated by embryonic adaptive physiology, or the embryo may die.
About 75% of the water in the egg is initially in the albumen (Amos, 1991),
which is 85% to 90% water (Vleck, 1991). The water content of yolk is much lower than
albumen due to its lipid richness, varying between 43% and 66% water, and it is kept
176
constant throughout development (Vleck, 1991). As the germinal disc expands, the
embryo starts changing water distribution by translocating water from the albumen to
form a layer of sub-embryonic fluid between itself and the yolk. The volume of sub-
embryonic fluid decreases until the embryo is enclosed by the expanding amniotic
membrane, which is filled with fluid (Vleck, 1991). At first, the amniotic sac is in contact
to the embryo, but it is carried away from the body as the clear amniotic fluid
accumulates. The origin of the amniotic fluid seems to be transudation from blood vessels
of the area pellucida (Romanoff, 1960).
The volume of amniotic fluid in several species of birds was studied by Romanoff
and Hayward, (1943). Changes in volume by percent of incubation period are illustrated
in Figure 6.1. From all species studied, turkey eggs showed the highest peak of amnion
volume (8 mL) for an average 85g egg. The turkey embryo exhibits two distinct peaks in
amnion volume during incubation: one at 50% and another at 80% of incubation.
Maximum volume is reached at the second peak, which corresponds to 22.5E, then
rapidly decreases toward hatch (28E). The lowering in volume observed between peaks
(57% of incubation) coincides with the highest peak of allantoic fluid accumulation
(Romanoff and Hayward, 1943). The great rise in volume that creates the second peak
happens as a consequence of albumen invading the amniotic cavity when both egg
compartments are joined during the last third of the incubation period (Romanoff, 1960),
and by movement of water from the allantois into the amnion (Vleck, 1991).
Disappearance of amniotic fluid is due to its oral consumption by the embryo in
preparation for hatching (Romanoff, 1960; Moran, 2007), and it finally decreases to near
zero by the time the embryo starts internal pipping (Romanoff, 1960).
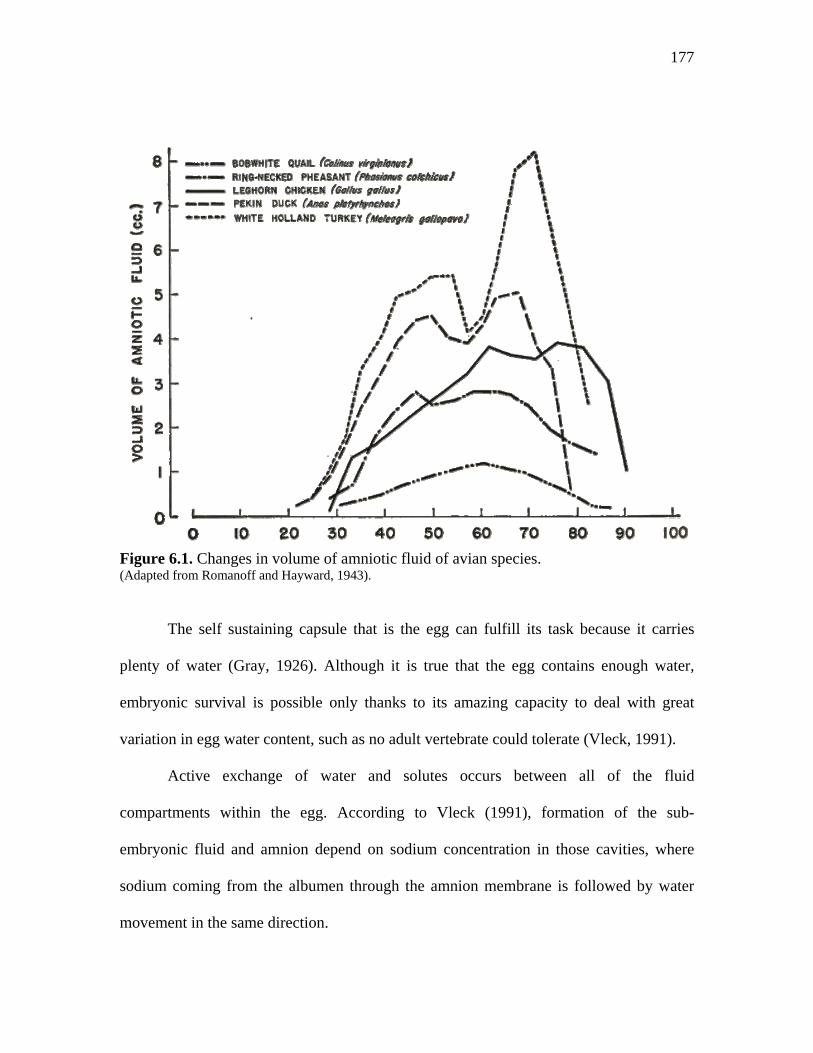
177
Figure 6.1. Changes in volume of amniotic fluid of avian species. (Adapted from Romanoff and Hayward, 1943).
The self sustaining capsule that is the egg can fulfill its task because it carries
plenty of water (Gray, 1926). Although it is true that the egg contains enough water,
embryonic survival is possible only thanks to its amazing capacity to deal with great
variation in egg water content, such as no adult vertebrate could tolerate (Vleck, 1991).
Active exchange of water and solutes occurs between all of the fluid
compartments within the egg. According to Vleck (1991), formation of the sub-
embryonic fluid and amnion depend on sodium concentration in those cavities, where
sodium coming from the albumen through the amnion membrane is followed by water
movement in the same direction.
178
The allantois, which is a membrane-defined cavity linked to the hind gut,
performs two important roles: 1) it is the embryonic respiratory system; and 2) it serves
as a repository of waste from the kidneys (Romanoff, 1960). As the embryo develops, the
amount of nitrogenous waste accumulated in the allantois also increases, reaching its
peak volume shortly after the middle of the incubation period. At that point, it reaches a
volume corresponding to 8-10% of the original egg weight (Romanoff and Hayward,
1943).
The allantoic membrane can actively transport sodium against both electrical and
concentration gradients. According to Hoyt (1979), this is an important feature because
the allantois, containing large amounts of fluid and being normally hyposmotic as
compared to the embryo, is the perfect osmoregulatory organ. Water resorption from the
allantois naturally occurs late in incubation, but as investigated by Hoyt (1979), the
embryo osmoregulates by adjusting water and solute exchange with the allantois. If
osmolality of the embryo or amnion increases due to excessive water losses, sodium is
pumped in that direction so water from the allantois will follow it. In the event of little
water loss during incubation, the allantoic fluid will be reabsorbed only before internal
pipping; so the allantoic fluid will be part of the amnion consumed by the embryo.
Hoyt (1979) conducted a study varying incubation humidity. He was able to
create egg water losses varying from 4 to 16% of initial egg mass, but water content and
dry matter of the yolk and amnion remained unchanged (Hoyt, 1979). Thus if egg weight
was reduced but yolk and amnion remained unchanged, embryonic water content must
have changed. According to Vleck (1991) avian embryos can change tissue hydration
(less than 5%) without compromising tissue dry matter. In contrast, reptile embryos
179
change tissue synthesis without altering tissue water content (Vleck, 1991). Thus, avian
hatchling weight can vary because of the amount of water in their tissues, whereas
reptilian hatchlings reduce size by utilizing less yolk, which can be left with the shell at
hatch.
Amniotic fluid influence on hatch Correct formation and utilization of the amnion can be affected by several
conditions. Other than incubation humidity, other factors like incubation temperature and
egg turning can alter amnion characteristics.
Temperature affects the speed of embryonic development (Lourens, 2005). It is
possible that because eggs incubated in higher temperatures mature faster, they will reach
maximum amnion volume earlier, losing less water and leaving more water to be drained
from other egg compartments into the amnion. In contrast, low incubation temperatures
increases incubation time (Mortela, 2006), so it is possible that these eggs would have
lost more water by the time amnion reaches its maximum volume. Research is necessary
to confirm these hypotheses.
Improper egg turning or no turning will prevent the embryo from regulating water
movement between egg compartments. It also reduces protein accumulation in the
amniotic fluid, and decreases thyroid hormone levels (Tona et al., 2003; Tona et al.,
2005). Non-turned eggs will have reduced amnion fluid volume (Romanoff, 1960), and
they will have leftover albumen by hatch, while the embryo hatches in a dehydrated state
and they are smaller due to unused albumen nutrients and water (Tona et al., 2005).
Proper accumulation of amniotic fluid is not only important for embryonic
hydration but also because albumen proteins will be the substrate used for
180
gluconeogenesis so glycogen can be stored prior to hatch (Donaldson, 1995). Stored
glycogen is the main energy source to fuel the hatching process and sustain the poults
until feed intake initiation (Donaldson and Christensen, 1991; Foye et al., 2006).
Anything that results in amnion reduction will also result in smaller glycogen reserves,
causing embryos to struggle to hatch due to lack of energy. If embryos deplete their
energy stores they may die during internal or external pipping stages. Extensive
embryonic mortality is usually observed in turkeys between pipping and emergence
(Christensen et al., 1993; Foye et al., 2006). Although some embryos may hatch, they
have very low energy status and they are weak and dehydrated. This condition can be
aggravated in poultry commercial operations by long holding periods and servicing stress
(Donaldson et al., 1991). Weak and dehydrated poults are very common in turkey
operations, resulting in higher mortality during brooding (Christensen et al., 2003). In the
field these poults are known as “starve-outs” and “flip-overs”, which are characterized by
poults that are too weak to eat and to turn back on their feet (Noble et al., 1999;
Christensen et al., 2003).
The study of amniotic volume done by Romanoff and Hayward (1943) (Figure
6.1) was done with White Holland turkeys, which is no longer an economically important
breed. Today the main turkey breeds utilized by the industry are Nicholas, Hybrid and
British United Turkeys (BUT). Because the growth performance conformation of
commercial turkeys of today is very different from the commercial turkeys 60 years ago
(Havenstein et al., 2007), amnion volume and utilization are most likely different also.
As part of their preliminary IOF studies, Uni and Ferket (2003) determined
amniotic fluid volume, pH and osmolality of Hibryd turkey eggs from 21E to 27E (Table
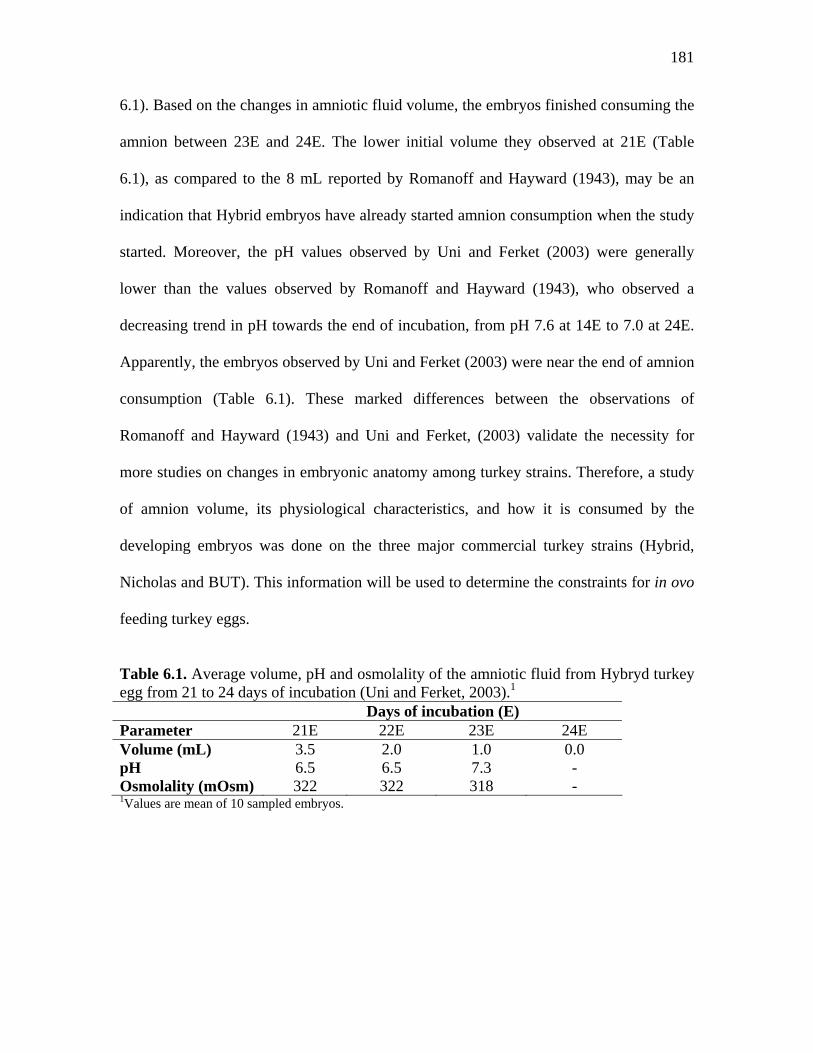
181
6.1). Based on the changes in amniotic fluid volume, the embryos finished consuming the
amnion between 23E and 24E. The lower initial volume they observed at 21E (Table
6.1), as compared to the 8 mL reported by Romanoff and Hayward (1943), may be an
indication that Hybrid embryos have already started amnion consumption when the study
started. Moreover, the pH values observed by Uni and Ferket (2003) were generally
lower than the values observed by Romanoff and Hayward (1943), who observed a
decreasing trend in pH towards the end of incubation, from pH 7.6 at 14E to 7.0 at 24E.
Apparently, the embryos observed by Uni and Ferket (2003) were near the end of amnion
consumption (Table 6.1). These marked differences between the observations of
Romanoff and Hayward (1943) and Uni and Ferket, (2003) validate the necessity for
more studies on changes in embryonic anatomy among turkey strains. Therefore, a study
of amnion volume, its physiological characteristics, and how it is consumed by the
developing embryos was done on the three major commercial turkey strains (Hybrid,
Nicholas and BUT). This information will be used to determine the constraints for in ovo
feeding turkey eggs.
Table 6.1. Average volume, pH and osmolality of the amniotic fluid from Hybryd turkey egg from 21 to 24 days of incubation (Uni and Ferket, 2003).1
Days of incubation (E) Parameter 21E 22E 23E 24E Volume (mL) 3.5 2.0 1.0 0.0 pH 6.5 6.5 7.3 - Osmolality (mOsm) 322 322 318 - 1Values are mean of 10 sampled embryos.
182
Turkey embryo and amnion survey
Materials and Methods Separate experiments were conducted for each strain of turkeys, BUT, Nicholas
and Hybrid, represented subsequently as BUT, NIC and HYB, respectively.
In experiment 1, 250 turkey eggs were obtained at 20E from a commercial
hatchery1, and incubated at the North Carolina State University Turkey Research Unit2 in
a Jamesway 252 incubator, set to 37.5C and 60% humidity. The eggs came from first-
cycle BUT breeder hens in the 13th week of lay. Upon arrival, the eggs were candled to
remove infertile eggs and dead embryos, and then they were divided into 5 groups of 25
eggs with similar weight distribution, ranging from 70 to 95g. Starting at 20E, 25 eggs
were sampled every day at the same time until amniotic fluid could not be found. The
eggs were carefully opened at the blunt end using surgical scissors, going through the air
cell, piercing the allantoic membranes so the embryo could be removed from the shell,
and placed with its attachments on a Petri dish, making sure that yolk sac and amnion
membranes remained intact. The embryos were euthanized by cervical dislocation, and
the amniotic fluid was aspirated using a graduated syringe and 23 gauge needles through
the amniotic membrane. The embryo along with all other egg contents was weighed after
removal from the shell. The amnion fluid was dispensed into a 10 mL graduated test tube
from where volume was recorded, and its osmolality was determined using a Micro
Osmometer3, and reported in milliosmoles (mOsm).
1 Prestage Farms, Clinton, NC 2 Lake Wheeler Rd, Raleigh, NC 3 Model 3300, Advanced Instruments, Inc., Norwood, MA

183
In experiment 2, 250 eggs from NIC were transported from the same hatchery1 at
18E, weighed and divided into groups in the same manner as in experiment 1. Eggs from
first-cycle hens in 12th week of lay ranged in weights from 70 to 95g. The eggs were
incubated and sampled daily as in experiment 1, except each egg compartment was
measured separately. Amnion and allantoic fluids volume were measured, as well as yolk
sac weight detached from the embryo. Embryo free body weight (YFBW) was
determined without any other attachments.
Amnion fluid and embryo serum osmolality was determined. To obtain embryo
serum, the euthanized embryos without any attachments were individually ground to a
homogenous mixture using commercial blender4. A 10g representative aliquot of this
embryo homogenate was centrifuged at 1000 rpm for 5 minutes and the supernatant
serum transferred to a new tube for osmolality determination. All osmotic measurements
were performed using the same osmometer used in experiment 1.
Experiment 3 was conducted at the hatchery at Cold Springs Farm, Ltd.5 using eggs
from a first-cycle flock of HYB turkey breeder hens in their 13th week of lay. At 18E, 200
viable eggs were weighted and distributed into 5 groups with similar weight distribution,
ranging in weights from 60 to 95g. A group of 25 eggs was sampled every day starting on
20E as in experiment 1. Amnion fluid was aspirated, and to measure its volume and the
embryo with all egg contents (except the shell) was weighted. Osmolality was not
measured in this trial since an osmometer was not available on site, and also because
osmolality of HYB strain have already been reported by Uni and Ferket (2003) (Table
4 Waring Commercial, Model 51BL31, Torrington, CT 5 Thamesford, Ontario, Canada
184
6.1). Amnion fluid as a percent of egg weight was calculated to give an idea of proportion
of egg corresponding to amnion in each day of incubation.
Statistical Analysis The experimental design in all three experiments was completely randomized.
The data was analyzed by ANOVA using the general linear models procedure (proc
GLM) of SAS (SAS Institute. 2004). Means were separated by least-square means test (ls
means). Regression analysis was performed on data when considered appropriate.
Results The effect of embryonic development on embryo weight, amnion fluid volume,
and amnion fluid osmolality for BUT, NIC and HYB is presented on Tables 6.2, 6.3, 6.4
and 6.5, respectively. Egg weight was not significantly affected by day of incubation
(Tables 6.2, 6.3 and 6.5) in all 3 strains. Even though a slight decrease in egg weight is
expected due to moisture loss, the differences and sample sizes were not big enough to
detect statistical significance. BUT and HYB embryos finished consuming amniotic fluid
at 24E (Tables 6.2 and 6.5), while NIC amnion fluid could not be measured passed 23E
(Table 6.3). Embryos from BUT did not show significant increase in weight during the
period studied (Table 6.2), which may indicate that BUT embryos approached their full
size by the time the experimental observations started. Amnion volume of BUT eggs
significantly decreased from about 7.8 mL at 20E to near zero at 24E (Table 6.2), while
osmolality of amnion fluid decreased about 10 mOsm in the same period (Table 6.2).
In experiment 2, NIC embryo size increased towards hatch, indicating that
embryos of this strain only reach their full size at 23E (Table 6.3). All other egg fluids
(yolk, allantois and amnion) decreased in volume during the period studied for NIC eggs

185
(Tables 6.3 and 6.4). Amnion fluid and embryo serum osmolality decreased at 21E, as
compared to all other time points (Table 6.4). Embryos from HYB also increase in size
during the studied period (Table 6.5). Amnion fluid volume and its proportion of egg
weight decreased from 21E until it was almost totally consumed by 24E (Table 6.5).
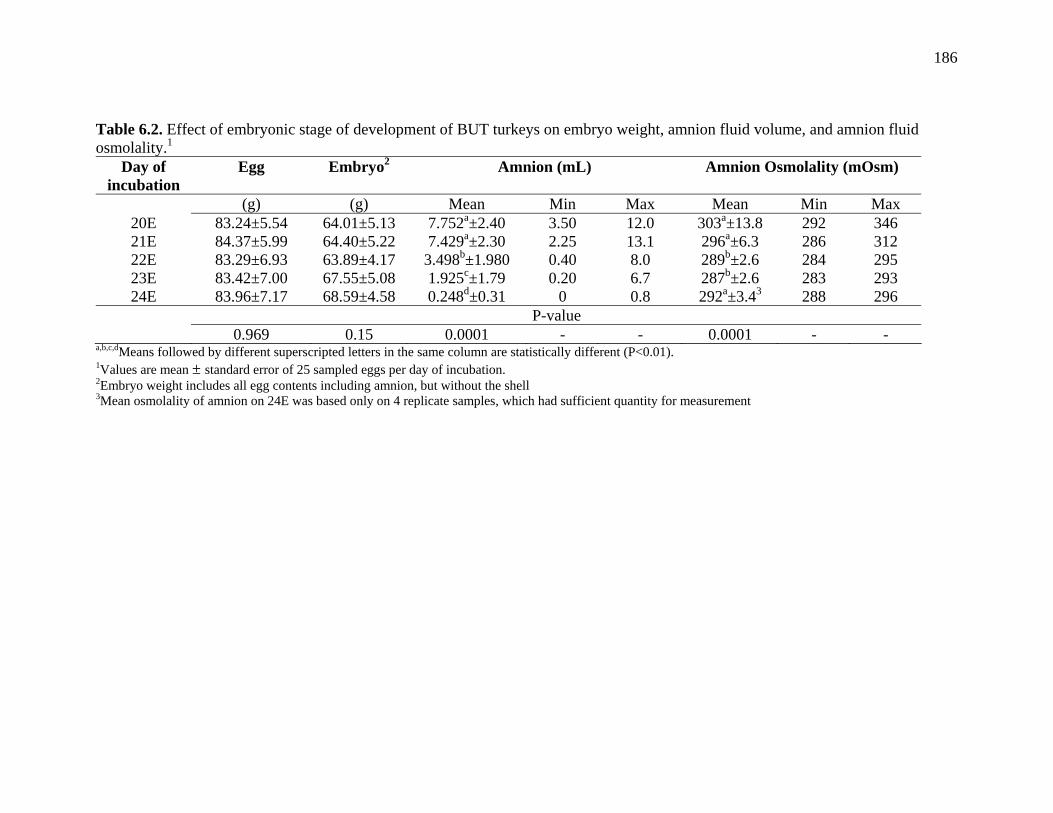
186
Table 6.2. Effect of embryonic stage of development of BUT turkeys on embryo weight, amnion fluid volume, and amnion fluid osmolality.1
Day of incubation
Egg Embryo2 Amnion (mL) Amnion Osmolality (mOsm)
(g) (g) Mean Min Max Mean Min Max 20E 83.24±5.54 64.01±5.13 7.752a±2.40 3.50 12.0 303a±13.8 292 346 21E 84.37±5.99 64.40±5.22 7.429a±2.30 2.25 13.1 296a±6.3 286 312 22E 83.29±6.93 63.89±4.17 3.498b±1.980 0.40 8.0 289b±2.6 284 295 23E 83.42±7.00 67.55±5.08 1.925c±1.79 0.20 6.7 287b±2.6 283 293 24E 83.96±7.17 68.59±4.58 0.248d±0.31 0 0.8 292a±3.43 288 296
P-value 0.969 0.15 0.0001 - - 0.0001 - -
a,b,c,dMeans followed by different superscripted letters in the same column are statistically different (P<0.01). 1Values are mean ± standard error of 25 sampled eggs per day of incubation. 2Embryo weight includes all egg contents including amnion, but without the shell 3Mean osmolality of amnion on 24E was based only on 4 replicate samples, which had sufficient quantity for measurement
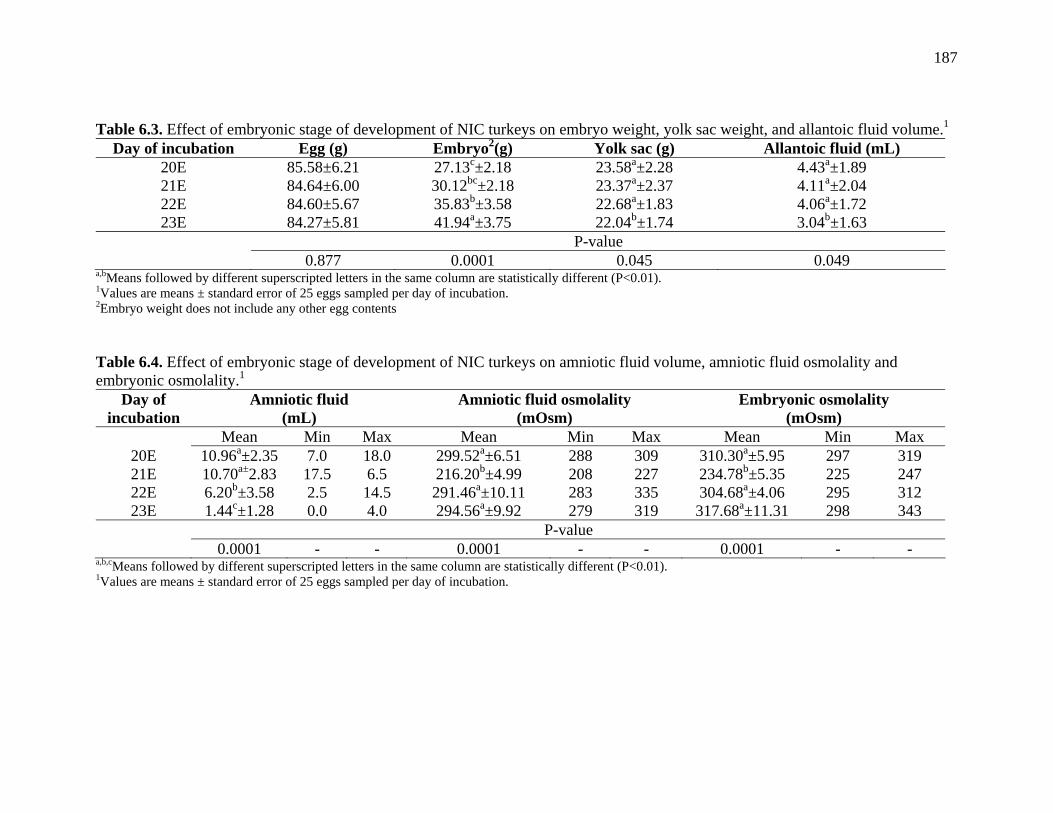
187
Table 6.3. Effect of embryonic stage of development of NIC turkeys on embryo weight, yolk sac weight, and allantoic fluid volume.1
Day of incubation Egg (g) Embryo2(g) Yolk sac (g) Allantoic fluid (mL) 20E 85.58±6.21 27.13c±2.18 23.58a±2.28 4.43a±1.89 21E 84.64±6.00 30.12bc±2.18 23.37a±2.37 4.11a±2.04 22E 84.60±5.67 35.83b±3.58 22.68a±1.83 4.06a±1.72 23E 84.27±5.81 41.94a±3.75 22.04b±1.74 3.04b±1.63
P-value 0.877 0.0001 0.045 0.049
a,bMeans followed by different superscripted letters in the same column are statistically different (P<0.01). 1Values are means ± standard error of 25 eggs sampled per day of incubation. 2Embryo weight does not include any other egg contents Table 6.4. Effect of embryonic stage of development of NIC turkeys on amniotic fluid volume, amniotic fluid osmolality and embryonic osmolality.1
Day of incubation
Amniotic fluid (mL)
Amniotic fluid osmolality (mOsm)
Embryonic osmolality (mOsm)
Mean Min Max Mean Min Max Mean Min Max 20E 10.96a±2.35 7.0 18.0 299.52a±6.51 288 309 310.30a±5.95 297 319 21E 10.70a±2.83 17.5 6.5 216.20b±4.99 208 227 234.78b±5.35 225 247 22E 6.20b±3.58 2.5 14.5 291.46a±10.11 283 335 304.68a±4.06 295 312 23E 1.44c±1.28 0.0 4.0 294.56a±9.92 279 319 317.68a±11.31 298 343
P-value 0.0001 - - 0.0001 - - 0.0001 - -
a,b,cMeans followed by different superscripted letters in the same column are statistically different (P<0.01). 1Values are means ± standard error of 25 eggs sampled per day of incubation.
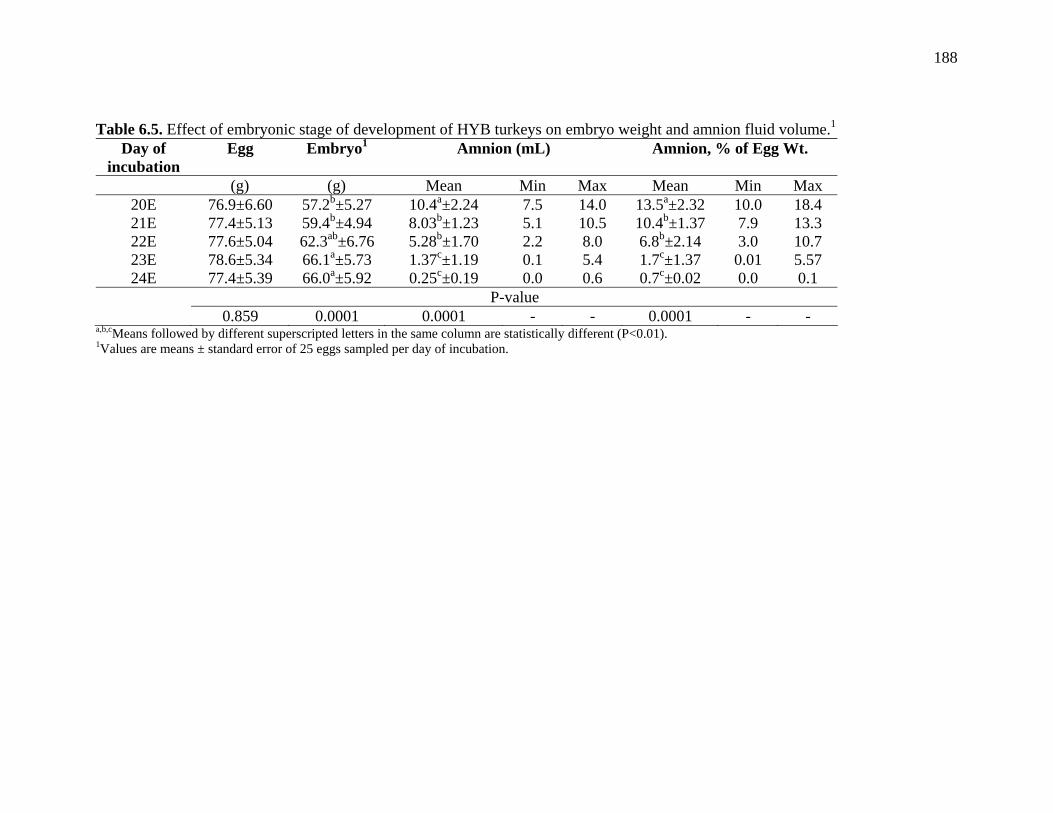
188
Table 6.5. Effect of embryonic stage of development of HYB turkeys on embryo weight and amnion fluid volume.1
Day of incubation
Egg Embryo1 Amnion (mL) Amnion, % of Egg Wt.
(g) (g) Mean Min Max Mean Min Max 20E 76.9±6.60 57.2b±5.27 10.4a±2.24 7.5 14.0 13.5a±2.32 10.0 18.4 21E 77.4±5.13 59.4b±4.94 8.03b±1.23 5.1 10.5 10.4b±1.37 7.9 13.3 22E 77.6±5.04 62.3ab±6.76 5.28b±1.70 2.2 8.0 6.8b±2.14 3.0 10.7 23E 78.6±5.34 66.1a±5.73 1.37c±1.19 0.1 5.4 1.7c±1.37 0.01 5.57 24E 77.4±5.39 66.0a±5.92 0.25c±0.19 0.0 0.6 0.7c±0.02 0.0 0.1
P-value 0.859 0.0001 0.0001 - - 0.0001 - -
a,b,cMeans followed by different superscripted letters in the same column are statistically different (P<0.01). 1Values are means ± standard error of 25 eggs sampled per day of incubation.
189
Discussion Amnion fluid volume of 20E BUT embryos ranged from a maximum of 12 mL to
a minimum of 3.5 mL, with an average of 7.7 mL. The amnion fluid volume did not
decrease significantly until after 21E. The embryos imbibed the amnion fluid at a rate of
about 0.16 mL/hr from 21E to 22E and then at slower a rate of 0.07 mL/hr from 22E until
24E when negligible amnion fluid remained (Table 6.2). Because amnion volume is a
function of egg or embryo size, the changes in amnion fluid volume during the later
stages of embryonic development is best expressed relative to egg weight (Figure 6.2).
The amnion comprised about 9% of the total egg weight at 20-21E, which agrees with the
proportion described by Romanoff and Hayward (1943) at the time of the second and
maximum peak of amnion volume. During the following 24 hr period, over half of the
amnion was consumed. Indeed, some of the 22E eggs had as little as 0.4 mL, while others
had as much as 8 mL (Table 6.2). Apparently by 23E, most of the embryos had consumed
either all or nearly all of the amniotic fluid. At 22E, some embryos may only begin
imbibing the amnion while at 24E most of the embryos have completed the process of
consuming the amnion and begun to pip into the air cell.
According to the results of this survey, the best time to inject an IOF solution in
BUT eggs would be between 22E and 24E, with an optimum injection time at 23E. As
the embryo consumes the amniotic fluid and his body size increases, the capacity to
accept the IOF solution also changes. Assuming the maximum capacity of about 9 mL of
amnion fluid, as observed in over 80% of the eggs at 20E, all eggs have a capacity to
accept a maximum volume of 1 mL of IOF solution at 22E. By 23E, the embryos
consumed at least 25% of the amnion, but its body size increased only 5%, leaving a
190
capacity of at least 20% of the initial amniotic volume at 20E. Thus, the 23E BUT
embryo should be able to accept at least 1.55 mL (7.75 mL X 0.20) of IOF solution
without compromise in an egg weighing an average of 83g (about 1.85% of total egg
mass). Based of BUT amnion disappearance data, the embryo consumes the amnion at a
rate of 0.07 mL/hr at 23E, so 1.55 mL of IOF solution would be fully consumed within
21 hr, well before internal pipping starts. Although the capacity of the amnion sac at 24E
may exceed 2mL of IOF solution, the embryos would likely be unable to consume it all
before internal pipping begins.
Osmolality of the amniotic fluid is an important factor that controls the fluid
balance of the embryo (Romanoff 1960; Vleck, 1991). If the osmolality of the amnion
exceeds the osmolality of the body fluids of the embryo, the embryo will dehydrate and
may be unable to proceed with the hatching process. For that reason the fluid of the
allantois can be moved to and from the amniotic sac by pumping sodium to keep amnion
fluid osmolality fairly unchanged during incubation (Hoyt, 1979). The osmolality of the
amniotic fluid from BUT eggs ranged from 292 mOsm to 346 mOsm with an average of
about 300 mOsm at 20E (Table 6.2), then decreasing to 285 mOsm by 23E and then back
to 292 at 24E. Even though this variation (3.3%) was statistically significant, it still
confirms Hoyt’s observation of small changes in amnion osmolality.
In experiment 2, embryonic weight significantly increased relative to egg mass by
a polynomial function (y=0.895x2-32.391x+321.53, R=0.9992) by day of incubation (x).
Amnion volume of 20E NIC embryos averaged about 11 mL (Table 6.4) and did not
decrease in volume until after 21E, as among BUT embryos observed in experiment 1.
This peak volume (18 mL maximum) is much greater than amnion volumes reported in
191
past literature (Romanoff and Hayward, 1943; Romanoff, 1960; Romanoff, 1967; Hoyt,
1979; Vleck, 1991), but it could be explained by an association of bigger egg size and
strain characteristics. Nevertheless it is an important strain difference to consider, since it
can influence embryonic survival and poult quality. Following the same logic as
discussed above for experiment 1, NIC embryos would have to consume amniotic fluid
faster and grow more during these later stages of development to hatch at the same time
as BUT embryos. Indeed, NIC embryos consumed about 40% of its amniotic fluid by
22E (Table 6.4), and grew about 18% (Table 6.3), leaving a capacity of about 20% of the
amnion realized at 20E-21E. Thus, NIC embryos should be able to accept at least 2 mL
(11 X 0.20) of IOF solution without compromise in an average egg weighting 85g (2.3%
of total egg mass). Based on data on Table 6.4, NIC embryos consumed the amnion at a
rate of 0.13 mL/hr at 22E, so they would take 16 hours to consume 2 mL of IOF solution.
Even if IOF would be administered at 23E, the NIC embryos would still be able to
consume it before pipping into the air cell. However, it must be noted that in this trial
NIC embryos finished consuming the amniotic fluid by 23E, so IOF may have to be
performed earlier than 23E for NIC embryos to receive it at the same physiological time
of amnion consumption as BUT.
Amnion fluid osmolality of NIC embryos ranged from 216 to 299 mOsm, which
corresponds to a 28% variation in the studied period. This greater variation in amnion
fluid osmolality observed among NIC than BUT embryos may indicate NIC embryos
manage osmotic balance differently. The lower amnion osmolality (21E) was observed
among NIC embryos around the time of highest allantoic fluid volume (20-22E), which
in this case was also the point of lowest embryonic serum osmolality (21E), and then
192
osmolality of both egg compartments increased concomitant with allantoic fluid decrease
(Tables 6.3 and 6.4). This apparent correlation between osmolality and water movement
between egg compartments agrees with Vleck (1991) who proposed that the embryos
must create an osmotic gradient to drain allantoic fluids prior to hatch, even when egg
water is abundant.
The maximum osmolality limit of the IOF solution can be estimated
mathematically based on amnion volume limits determined herein, and the osmolality
values of amniotic fluid and embryo serum. In the case of BUT eggs, where embryo
serum osmolality was not determined, the maximum observed amnion osmolality of 346
mOsm was assumed to be also the maximum possible serum osmolality value. An
equation was derived based on the idea that amnion osmolality must be less than embryo
serum osmolality to prevent embryo dehydration. Amnion fluid osmolality is due to a
proportion of residual fluid and IOF solution osmolality. The equation produced to
estimate IOF solution osmolality was:
IOFO<[EO(AVx+IOFVx)-AVx(AOx)]/IOFVx (Equation 1),
where: IOFO = in ovo feeding solution osmolality; EO = embryo blood serum osmolality;
AVx = residual amnion fluid volume at day x; AO23 = osmolality of residual amnion fluid
at day x; and IOFVx = maximum volume of in ovo feeding solution that can be
administered at day x.
Using the equation 1 above, BUT IOFO must be less than 427 mOsm for an IOF
solution to be safely injected into the amnion of a 23E embryo, assuming embryo blood
serum of 346 mOsm, maximum volume of 1.5 mL, and remaining 2 mL amnion fluid of
285 mOsm. The same equation applied for NIC eggs injecting 1.5 mL of IOF solution at

193
22E, with EO = 310 mOsm, EO = 7.5 mL, AV = 6 mL, and AO = 245 mOsm, will give
an IOFO value that should be less than 570 mOsm.
As observed among NIC embryos, the weight of HYB embryos significantly
increased with embryonic age (Table 6.5). Amnion volume was greatest at 20E and
decreased linearly thereafter at a rate of 0.10 mL/hr. In contrast to the other 2 strains that
were observed to begin consuming the amniotic fluid after 21E, the HYB embryos started
consuming the amnion after 20E (Table 6.5). HYB embryos are known by the industry to
develop at a faster rate and have shorter incubation period than BUT and NIC embryos.
Apparently, HYB embryos started consuming the amniotic fluid earlier completely
consumed the amnion fluid by 24E, as observed in NIC embryos (Table 6.5). This
observation may explain why Uni and Ferket (2003) found lower amnion fluid volumes
at 21E (Table 6.1) than herein observed for BUT and NIC. Based on the data observed in
experiment 3, the optimum time to administer an IOF solution for HYB embryos would
be between 22E and the first half of 23E. Thus following the same discussion logic as
used in experiment 1, the maximum capacity of the amnion for HYB eggs is assumed to
be 10 mL, as observed at 20E (Table 6.5). By 22E the embryos consumed at least 30% of
its amniotic fluid and increased body weight by about 15%, leaving a capacity of about
15% of its total amnion capacity realized at 20E. Thus, 22E HYB embryos should be able
to accept at least 1.5 mL (10 x 0.15) of IOF solution without compromise in an average
egg weighting 77 g (1.9% of total egg mass). With the embryo consuming the amnion at
a rate of 0.10 mL/hr at 22E, 2 mL of IOF solution would be fully consumed within 15 hr,
which is before internal pipping starts at 23E.

194
There were marked differences in egg size between breeds, and egg size
influences embryo weights and amnion volume. Therefore amnion volume must be
expressed relative to egg mass to properly compare amnion consumption patterns among
the different turkey strains. The results of amnion volume adjusted for egg size of all
three strains is presented on Figure 6.2. The HYB (BUT) embryos had the highest
amnion volume relative to egg size among the three strains, and that they were already
consuming the amnion at 20E, while the other 2 strains began consuming the amnion
only after 21E. Amnion consumption is best predicted as a function of hours of
incubation (Figure 6.2). Therefore, the best time for IOF solution administration would
be between 520 and 560 hr (22-23E) of incubation, independent of strain. The maximum
volume that can be injected without risk to any of the breeds would be 1.5 mL and
optimum IOF solution osmolality would be 450 mOsm and not higher than 570 mOsm.
More research needs to be done to confirm the impact of amnion volume and
consumption patterns on hatchability and poult quality of the different commercial turkey
strains. The volume and osmolality constraints for IOF administration determined herein
also needs to be confirmed by further experimentation. The relationship between water
movement among egg compartments and the embryo should also be established by
measuring solute (sodium) movement between egg compartments.
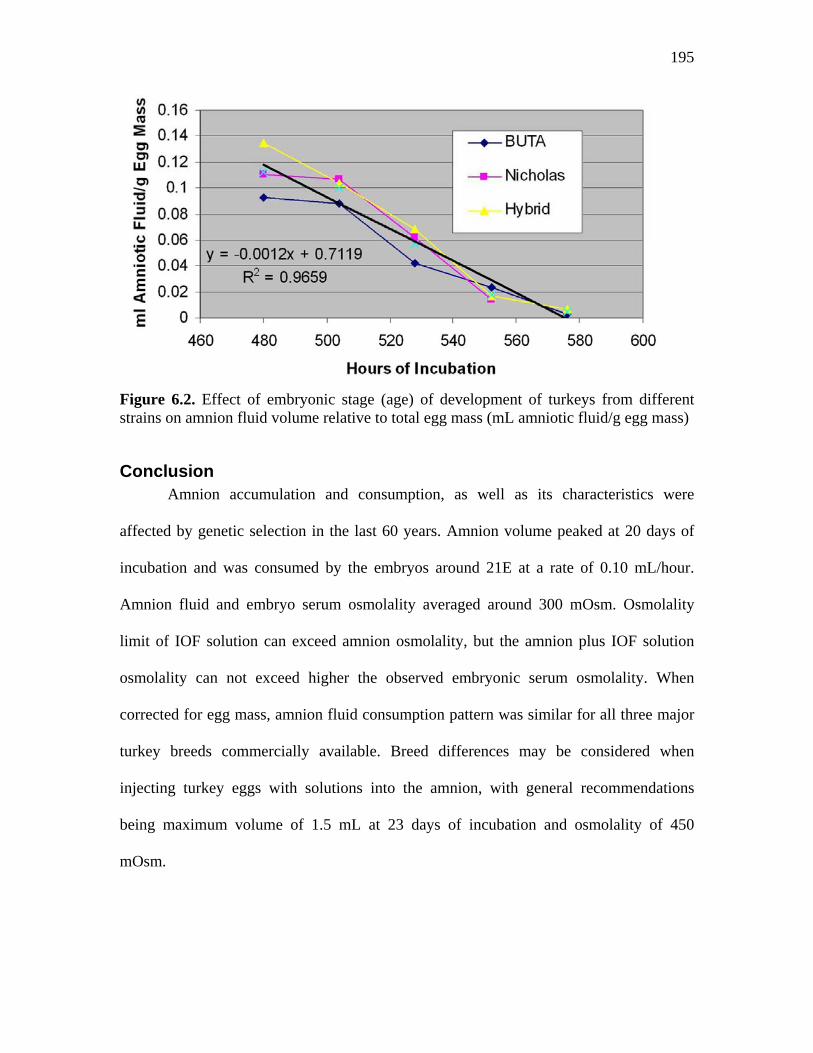
195
Figure 6.2. Effect of embryonic stage (age) of development of turkeys from different strains on amnion fluid volume relative to total egg mass (mL amniotic fluid/g egg mass)
Conclusion Amnion accumulation and consumption, as well as its characteristics were
affected by genetic selection in the last 60 years. Amnion volume peaked at 20 days of
incubation and was consumed by the embryos around 21E at a rate of 0.10 mL/hour.
Amnion fluid and embryo serum osmolality averaged around 300 mOsm. Osmolality
limit of IOF solution can exceed amnion osmolality, but the amnion plus IOF solution
osmolality can not exceed higher the observed embryonic serum osmolality. When
corrected for egg mass, amnion fluid consumption pattern was similar for all three major
turkey breeds commercially available. Breed differences may be considered when
injecting turkey eggs with solutions into the amnion, with general recommendations
being maximum volume of 1.5 mL at 23 days of incubation and osmolality of 450
mOsm.
196
References Amos, A. R. 1991. Roles of water in avian eggs. Pages 234-235 in Egg Incubation: its
effects on embryo development in birds and reptiles. D. C. Deeming, and Ferguson, M. W. J. eds. Cambridge University Press, New York, NY.
Christensen, V. L., W. E. Donaldson, K. E. Nestor. 1993. Effects of stressors on blood
glucose and hepatic glycogen concentrations in turkey poults. Comp Biochem Physiol A 100:945-947.
Christensen, V. L., J. L. Grimes, M. J. Wineland, and L. G. Bagley. 2001. Effects of
turkey breeder hen age, strain, and length of the incubation period on survival of embryos and hatchlings. J Appl Poult Res 10:5-15.
Christensen, V. L., D. T. Ort, and J. L. Grimes. 2003. Physiological factors associated
with weak neonatal poults (Meleagris gallopavo). Int J Poult Sci 2:7-14. Donaldson, W. E., and V. L. Christensen. 1991. Dietary carbohydrate level and glucose
metabolism in turkey poults. Comp Biochem Physiol A 98:347-350. Donaldson, W. E., V. L. Christensen, and K. K. Krueger. 1991. Effects of stressors on
blood glucose and hepatic glycogen concentrations in turkey poults. Comp Biochem Physiol A 100:945-947.
Donaldson, W. E. 1995. Carbohydrate, hatchery stressors affect poult survival. in
Feedstuffs 67(14):16-17. Ferket, P. R., Z. Uni, E. Tako, O. T. Foye, and J. E. Oliveira. 2005. In ovo feeding
nutrition: impact on gene expression, gut development, and growth performance. Pages 160-172 in The Annual Nutrition Conference. September 13-15. University of Arkansas. Rogers, AR.
Foye, O. T., Z. Uni, and P. R. Ferket. 2006. Effect of in ovo feeding egg white protein,
beta-hydroxy-beta-methylbutyrate, and carbohydrates on glycogen status and neonatal growth of turkeys. Poult Sci 85:1185-1192.
Gray, J. 1926. The role of water in the evolution of the terrestrial vertebrates. Brit Jour
Exp Biol 6:26-31. Hammerstedt, R. H. 1999. Symposium summary and challenges for the future. Poult Sci
78:459-466. Havenstein, G. B., P. R. Ferket, J. L. Grimes, M. A. Qureshi, and K. E. Nestor. 2007.
Comparison of the performance of 1966- versus 2003-type turkeys when fed representative 1966 and 2003 turkey diets: growth rate, livability, and feed conversion. Poult Sci 86:232-240.
197
Hoyt, D. F. 1979. Osmoregulation by avian species: the allantois functions like a toad's bladder. Physiol Zool 52:354-362.
Hulet, R. M. 2007. Managing incubation: where are we and why? Poult Sci 86:1017-
1019. Johnston, P. A., H. Liu, T. O'Connell, P. Phelps, M. Bland, J. Tyczkowski, A. Kemper, T.
Harding, A. Avakian, E. Haddad, C. Whitfill, R. Gildersleeve, and C. A. Ricks. 1997. Applications in ovo technology. Poult Sci 76:165-178.
Lourens, A., H. van der Brand, R. Meijerhof, B. Kemp. 2005. Effect of eggshell
temperature during incubation and embryo development, hatchability, and posthatch development. Poult Sci 84:914-920.
Moran, E. T., Jr. 2007. Nutrition of the developing embryo and hatchling. Poult Sci
86:1043-1049. Mortola, J. P. 2006. Metabolic response to cooling temperatures in chicken embryos and
hatchlings after cold incubation. Comp Biochem Physiol 145:4410448. Noble, D. O., K. E. Nestor, and C. R. Polley. 1999. Factors influencing early poult flip-
overs in experimental populations of turkeys. Poult Sci 78:178-181. Romanoff, A. L., and F. W. Hayward. 1943. Changes in volume and physical proprieties
of allantoic and amniotic fluids under normal and extreme temperatures. Biol Bull 84:141-147.
Romanoff, A. L. 1960. The avian embryo; structural and functional development.
Macmillian, New York, NY. Romanoff, A. L. 1967. Biochemistry of the avian embryo; a quantitative analysis of
prenatal development. Interscience Publishers, New York. SAS Institute. 2004. SAS/STAT User's guide: statistics. SAS Institute, Cary. NC. Schaal, T., and G. Cherian. 2007. A survey of the hatchability of broiler and Turkey eggs
in the United States from 1985 through 2005. Poult Sci 86:598-600. Tona, K., O. Onagbesan, B. De Ketelaere, E. Decuypere, and V. Bruggeman. 2003.
Effects of turning duration during incubation on corticosterone and thyroid hormone levels, gas pressures in air cell, chick quality, and juvenile growth. Poult Sci 82:1974-1979.
198
Tona, K., O. Onagbesan, V. Bruggeman, K. Mertens, and E. Decuypere. 2005. Effects of turning duration during incubation on embryo growth, utilization of albumen, and stress regulation. Poult Sci 84:315-320.
Uni, Z., and P. R. Ferket 2003. Enhancement of development of oviparous species by in
ovo feeding. U.S. Patent no. 6,592,878 B2. Vleck, D. 1991. Water economy and solute regulation. Pages 252-256 in Egg Incubation:
its effects on embryo development in birds and reptiles. D. C. Deeming, and Ferguson, M. W. J. eds. Cambridge University Press, New York, NY.
199
Chapter 7
“Survey of energy metabolism and intestinal development gene expression in late-term turkey
embryos using microarrays”
Abstract
Microarray technology was used to identify differences in gene expression of key genes
of the metabolism of turkey embryos from 20 days of incubation (E) until hatch. The
objective of this study was to map development of turkey embryos incubated under
standard conditions. The information from this study could be used to better understand
changes and shifts in metabolism that happens during the perinatal period and to serve as
a baseline for future incubation and in ovo manipulation studies. A customized two-color
focused oligonucleotide microarray was designed to annotate 96 chicken gene sequences.
This array was utilized to study turkey embryo gene expression of liver, pectoral muscle,
hatching muscle, and duodenum. The turkey gene sequences successfully hybridized to
chicken sequence probes in all four tissues. Gene expression data was utilized to
determine gene expression patterns for all genes that significantly changed in the studied
period. The gene expression patterns in the liver showed that the embryo switches form
lipid to carbohydrate metabolism at 22E. Both enzymes responsible for glycogen
synthesis and glycogen degradation follow the same pattern gene expression in liver and
muscle. Genes of enzymes associated with carbohydrate digestion in the intestine begin
to be expressed 48hrs before hatch, while nutrient transporter gene expression peaked at
hatch. Based on these data gluconeogenic compounds may be good candidates to be fed
in ovo after 22E, but digestion capacity of complex carbohydrates may not be developed
200
by the time the embryo consumes the amniotic fluid. These results will also be useful as
baseline data for future research involving turkey embryo development.
Introduction
The importance of poultry production has been growing tremendously. In 2006
the United States alone produced 10.9 billion broiler chickens and 261.9 million turkeys
(USDA, 2007). This progress is based on fast application of current and new technologies
(Smith, 2006). The turkey industry alone has grown 70% since 1985 (Schaal and Cherian,
2007). To ensure continuous success and sustainability, it is necessary to identify and
solve problems that affect production efficiency and animal welfare. One problem that
affects both production efficiency and animal welfare in the turkey industry is poor
hatchability and poult quality, which has not improved much during the last 20 years
(Schaal and Cherian, 2007).
High embryonic mortality during the late stages on incubation has been identified,
to occur between internal pipping and egg emergence (Christensen et al., 1993; Foye,
2005). Little is known about what metabolic perturbations cause late-term embryonic
mortality. However, since the completion of the chicken genome (International Chicken
Genome Sequencing Consortium, 2004) new doors of possibilities has opened to study
avian biology (Lamont, 2006), particularly during periods of early development. Even
though turkey sequences are not available yet for most genes, there is a chance that both
species, chicken and turkeys, will be similar enough so chicken target sequences could
hybridize to turkey probes. Investigation of gene expression during critical periods of
development could accelerate the identification of metabolic distress points that affect
early growth performance and viability. Previous molecular approach methods were very
201
time consuming, expensive and subject to many causes of variation (Harris, 2000;
Wiseman, 2002; Yadetie, et al., 2004).
The advent of microarrays revolutionizes the understanding of biological systems
(Garosi et al., 2005). Microarray is a technique that permits studying thousands of genes
in a single experiment, or even the entire genome at once (Harris, 2000; Spielbauer and
Stahl, 2005). This method consists in having the desired sequences of genes fixed on a
surface, usually a glass slide or chip, and then hybridizing them with complementary
cDNA obtained from the samples to be tested. The single stranded cDNA sample
sequences are labeled with a fluorescent dye (target) and during hybridization they base-
pair to DNA sequence on the array (probe) if complementary to each other (Spielbauer
and Stahl, 2005). Fluorescence is then measured through laser scanning, so image color
intensity can be used to compare samples (Harris, 2000). The higher the amount of
hybridized labeled sample attached to the probe, the higher the color intensity for that
spot on the array. The high throughput is possible because microarrays are based on
miniaturization of gene printing patterns that can only be produced by automation. Whole
genome arrays have their sequences synthesized on the array surface, while focused
arrays can have cDNA sequences synthesized and then printed on the surface as spots.
Focused arrays have become very popular in academic studies because they can be
customized as desired and are not as costly as whole genome arrays (Spielbauer and
Stahl, 2005). If the objective of the study is to compare gene expression of samples from
different conditions, they can be labeled with different fluorescent dyes and then
hybridized together on the same array. The most popular of these methods is the two-
color arrays, where two samples, one labeled with Cy3 (cyanide 3-NHS ester) and the
202
other with Cy5 (cyanide 5-NHS ester), are being compared (Harris, 2000; Spielbauer and
Stahl, 2005). Two-color arrays are scanned with two separate laser settings, one for each
cydye, so color intensity differences between the two conditions can be compared
(Gibson, 2003; Garosi et al., 2005).
The objective of this study was to produce a customized focused array containing
key genes of metabolic importance based on chicken genome information, and utilize it
to map the development of turkey embryos during the critical period from internal
pipping to hatch. This information could be used to better understand normal
development and to identify changes that occur during developmental perturbations or
during various interventions during incubation or in ovo.
Materials and methods
Incubation and sampling
Two hundred fertilized turkey eggs from the same breed were obtained from a
commercial hatchery1. Upon arrival the eggs were weighted and divided into groups with
similar weight distribution. The eggs were incubated in a Jamesway 252 incubator, set to
37.8C of temperature and 60% humidity. A group of 25 eggs were sampled at 20, 22, 24
and 26 days of incubation (E) and at day of hatch (28E), respectively. Each egg was
opened at the blunt end of the egg using surgical scissors, and then the embryo was
extracted from the shell and euthanized by cervical dislocation. Each embryo had liver,
duodenum, pectoral muscle and hatching muscle removed (500 samples total), dissected
1 Prestage Farms, Clinton, NC
203
to be 200 mg in weight and immediately placed on labeled 7 mL scintillation vials2
previously filled with 2 mL of RNA Later3 kept at room temperature. Tissue samples
were stored at -20C until processed for RNA extraction. The remaining of the liver and
muscle samples were immediately place on ice and stored at -20C for posterior glycogen
determination. All sampling procedures were performed in a clean laboratory facility
with surfaces and instruments wiped with RNAseZap4 decontamination wipes. To cross
validate gene expression data with poult energy status, liver, pectoral muscle and
hatching muscle samples were also used to determine glycogen concentration [GLY],
using the modified iodine binding method described by Foye et al. (2006).
RNA extraction and quality control
The tubes containing tissue samples were thawed and 100g of tissue was weighted
and placed on a 2 mL microcentrifuge tube filled with 1 mL of TRI Reagent5. Muscle
sample tubes were also filled with 0.3 mL of 0.1 mm glass beads to improve
disintegration. The tubes were shaken in a 45 tube block using a Mini-Beadbeater-966 for
1 minute or until tissue samples were completely dissolved. When more than one cycle
was needed, the block was placed on ice for a minute in between cycles to avoid sample
overheating. The tubes contained beads had the homogenate transferred to a new tube.
Each tube received 300 µl of chloroform and then vortexed for 10 seconds. Homogenate
tubes were centrifuged at 12,000g for 5 minutes at 4C to separate phases. The top
aqueous phase was carefully transferred to a 1.5 mL microcentrifuge. Each tube received
2 Fisher Scientific, Pittsburg, PA 3 Ambion, Inc., Austin, TX 4 Ambion, Inc., Austin, TX 5 Molecular Research Center, Inc., Cincinnati, OH 6 Biospec, Inc., Bartlesville, OK
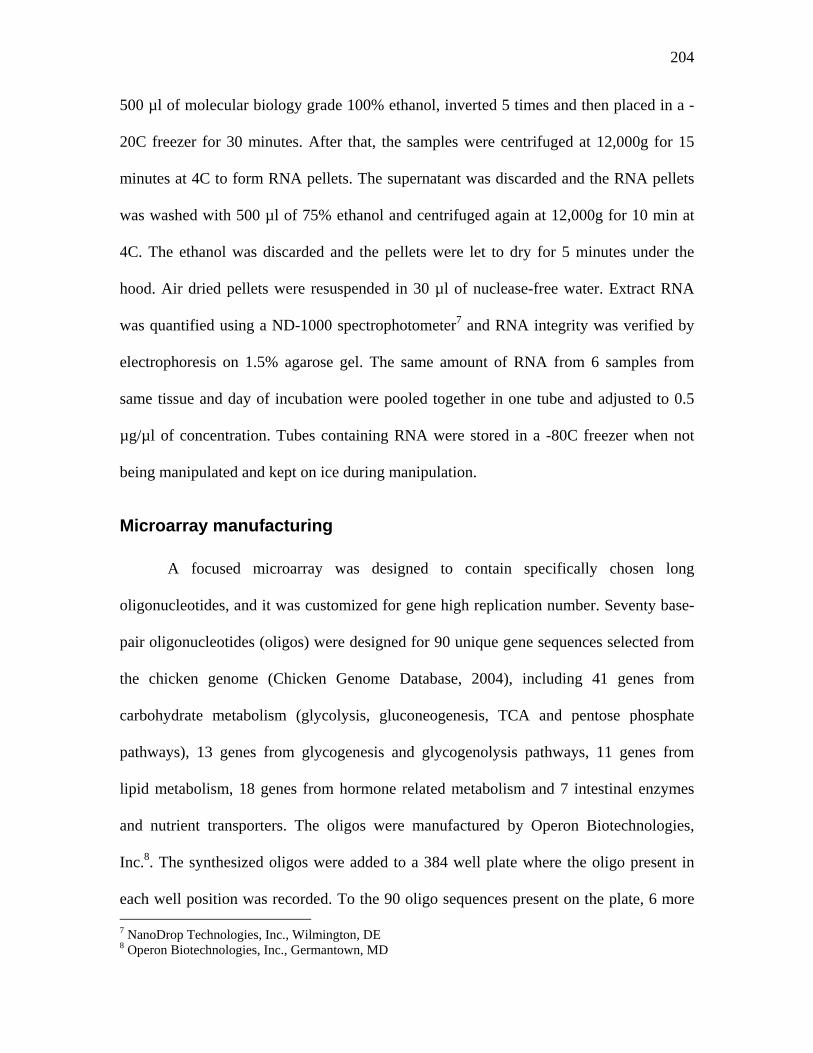
204
500 µl of molecular biology grade 100% ethanol, inverted 5 times and then placed in a -
20C freezer for 30 minutes. After that, the samples were centrifuged at 12,000g for 15
minutes at 4C to form RNA pellets. The supernatant was discarded and the RNA pellets
was washed with 500 µl of 75% ethanol and centrifuged again at 12,000g for 10 min at
4C. The ethanol was discarded and the pellets were let to dry for 5 minutes under the
hood. Air dried pellets were resuspended in 30 µl of nuclease-free water. Extract RNA
was quantified using a ND-1000 spectrophotometer7 and RNA integrity was verified by
electrophoresis on 1.5% agarose gel. The same amount of RNA from 6 samples from
same tissue and day of incubation were pooled together in one tube and adjusted to 0.5
µg/µl of concentration. Tubes containing RNA were stored in a -80C freezer when not
being manipulated and kept on ice during manipulation.
Microarray manufacturing
A focused microarray was designed to contain specifically chosen long
oligonucleotides, and it was customized for gene high replication number. Seventy base-
pair oligonucleotides (oligos) were designed for 90 unique gene sequences selected from
the chicken genome (Chicken Genome Database, 2004), including 41 genes from
carbohydrate metabolism (glycolysis, gluconeogenesis, TCA and pentose phosphate
pathways), 13 genes from glycogenesis and glycogenolysis pathways, 11 genes from
lipid metabolism, 18 genes from hormone related metabolism and 7 intestinal enzymes
and nutrient transporters. The oligos were manufactured by Operon Biotechnologies,
Inc.8. The synthesized oligos were added to a 384 well plate where the oligo present in
each well position was recorded. To the 90 oligo sequences present on the plate, 6 more 7 NanoDrop Technologies, Inc., Wilmington, DE 8 Operon Biotechnologies, Inc., Germantown, MD
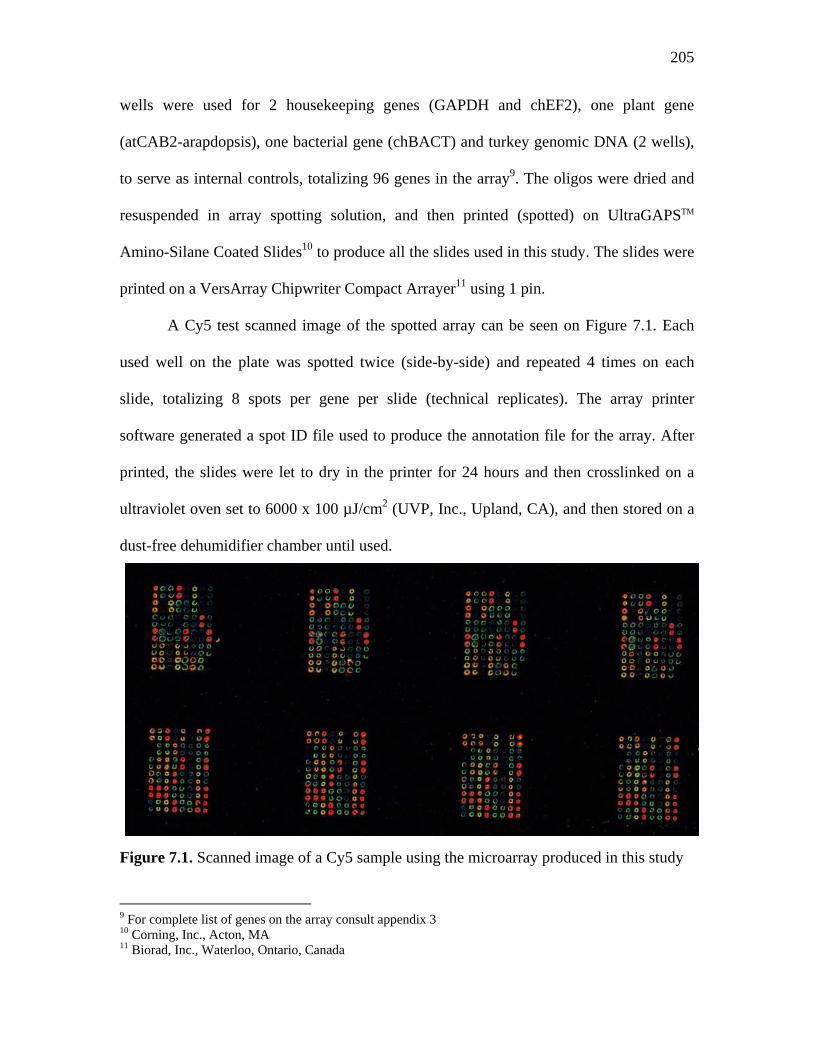
205
wells were used for 2 housekeeping genes (GAPDH and chEF2), one plant gene
(atCAB2-arapdopsis), one bacterial gene (chBACT) and turkey genomic DNA (2 wells),
to serve as internal controls, totalizing 96 genes in the array9. The oligos were dried and
resuspended in array spotting solution, and then printed (spotted) on UltraGAPSTM
Amino-Silane Coated Slides10 to produce all the slides used in this study. The slides were
printed on a VersArray Chipwriter Compact Arrayer11 using 1 pin.
A Cy5 test scanned image of the spotted array can be seen on Figure 7.1. Each
used well on the plate was spotted twice (side-by-side) and repeated 4 times on each
slide, totalizing 8 spots per gene per slide (technical replicates). The array printer
software generated a spot ID file used to produce the annotation file for the array. After
printed, the slides were let to dry in the printer for 24 hours and then crosslinked on a
ultraviolet oven set to 6000 x 100 µJ/cm2 (UVP, Inc., Upland, CA), and then stored on a
dust-free dehumidifier chamber until used.
Figure 7.1. Scanned image of a Cy5 sample using the microarray produced in this study
9 For complete list of genes on the array consult appendix 3 10 Corning, Inc., Acton, MA 11 Biorad, Inc., Waterloo, Ontario, Canada
206
Sample labeling
Tissue RNA pooled samples were used to produce cydye labeled cDNA, using the
indirect labeling technique. ChipShotTM Indirect Labeling and Clean-up System12 kits
were used to produce aminoallyl-cDNA, which was labeled either with Cy3 or Cy5
fluorescent dyes13 according to the experimental design. Samples from each day of
incubation were labeled twice with each cydye using different pools of RNA. All
laboratory protocols were followed as recommended by the kits’ manufacturer manual.
Hybridization and image scanning
Pre-hybridization and hybridization of array slides were performed utilizing the
Pronto Plus! Microarray Hybridization Kit14. The labeled cDNA from two distinct time
point samples were mixed, dried and resuspended in hybridization solution. The cDNA
mix was then applied to pre-hybridized slide covered with a pre-cleaned glass coverslip15,
and hybridized overnight. The same procedure was repeated with all pair of samples
according to the experimental design, assuring the samples hybridized together were also
labeled together. Microarray slides were scanned on a ScanArray GX PLUS Microarray
Scanner16 set to 65% laser power. All sample and slide manipulation from labeling until
slide scanning was performed while protecting them from light.
12 Promega, Madison, WI 13 Amersham Biosciences Corp., Piscataway, NJ 14 Corning, Inc., Acton, MA 15 Lifterslip, Portsmouth, NH 16 PerkinElmer Life and Analytical Sciences, Shelton, CT
207
Array data processing and statistical analysis
The experimental design was a complete interwoven loop design (Garosi et al.,
2005). Generated data files were converted into image intensity raw data files for each
slide-dye combination using ScanAlyze Software (Eisen et al., 1998). Raw data files
were joined, transformed to a log2 base and analyzed in JMP Genomics (SAS Institute.
2007). The log2-transformed data for all spot measures were subjected to loess
normalization according to the model,
Y = μ + A + Dye + (A X Dye) + e,
where μ is the sample mean, A is the effect of the array, Dye is the effect of dye, (A X
Dye) is the array-dye interaction (channel effect), and e is the stochastic error. The
residuals from this model were analyzed by mixed ANOVA according to the gene-
specific model,
Y = μ + E + Dye + Hyb + e,
with day of incubation (E) and cydye (Dye) as fixed effects, hybridization batch (Hyb) as
a random effect. Mean intensities were compared using False Discovery Rate (FDR) at
P<0.01. Results were used to produce clustering plots and parallel plots.
Embryonic growth and glycogen concentration statistical analysis
Embryonic growth and [GLY] followed the same experimental design, which was
completely randomized. Data was analyzed by fit model procedure in JMP (SAS
Institute. 2005), according to the model,
Y = μ + E + e,
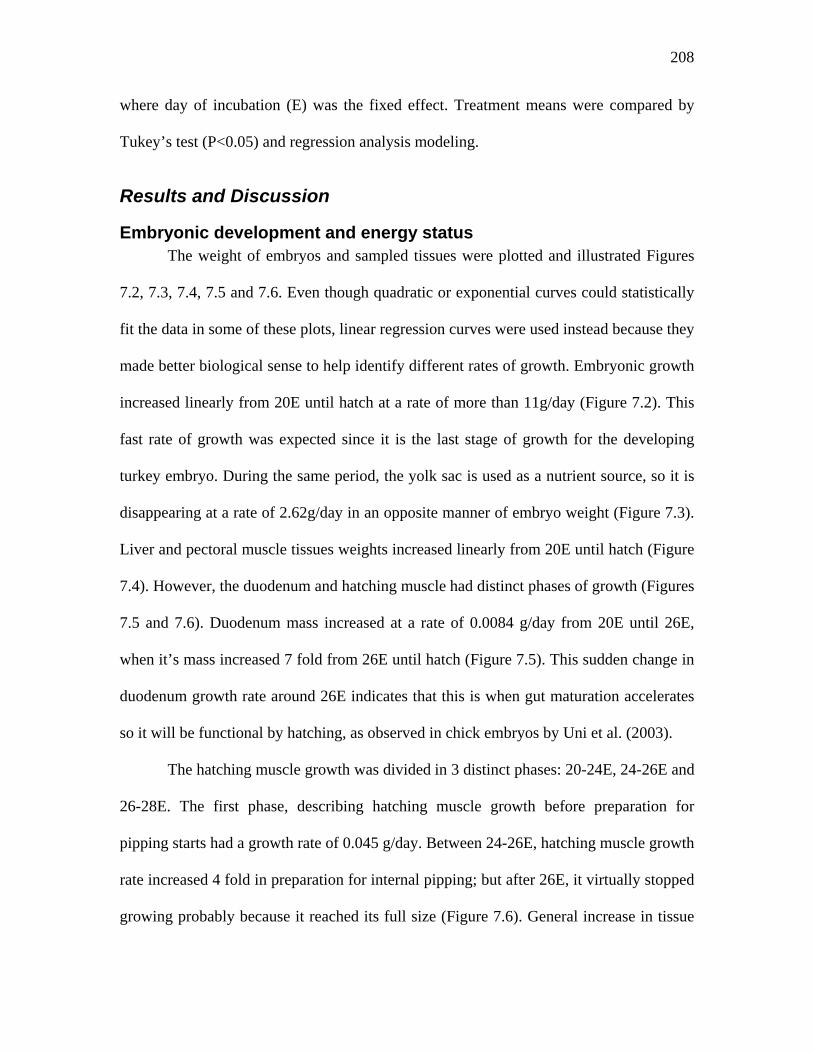
208
where day of incubation (E) was the fixed effect. Treatment means were compared by
Tukey’s test (P<0.05) and regression analysis modeling.
Results and Discussion
Embryonic development and energy status The weight of embryos and sampled tissues were plotted and illustrated Figures
7.2, 7.3, 7.4, 7.5 and 7.6. Even though quadratic or exponential curves could statistically
fit the data in some of these plots, linear regression curves were used instead because they
made better biological sense to help identify different rates of growth. Embryonic growth
increased linearly from 20E until hatch at a rate of more than 11g/day (Figure 7.2). This
fast rate of growth was expected since it is the last stage of growth for the developing
turkey embryo. During the same period, the yolk sac is used as a nutrient source, so it is
disappearing at a rate of 2.62g/day in an opposite manner of embryo weight (Figure 7.3).
Liver and pectoral muscle tissues weights increased linearly from 20E until hatch (Figure
7.4). However, the duodenum and hatching muscle had distinct phases of growth (Figures
7.5 and 7.6). Duodenum mass increased at a rate of 0.0084 g/day from 20E until 26E,
when it’s mass increased 7 fold from 26E until hatch (Figure 7.5). This sudden change in
duodenum growth rate around 26E indicates that this is when gut maturation accelerates
so it will be functional by hatching, as observed in chick embryos by Uni et al. (2003).
The hatching muscle growth was divided in 3 distinct phases: 20-24E, 24-26E and
26-28E. The first phase, describing hatching muscle growth before preparation for
pipping starts had a growth rate of 0.045 g/day. Between 24-26E, hatching muscle growth
rate increased 4 fold in preparation for internal pipping; but after 26E, it virtually stopped
growing probably because it reached its full size (Figure 7.6). General increase in tissue
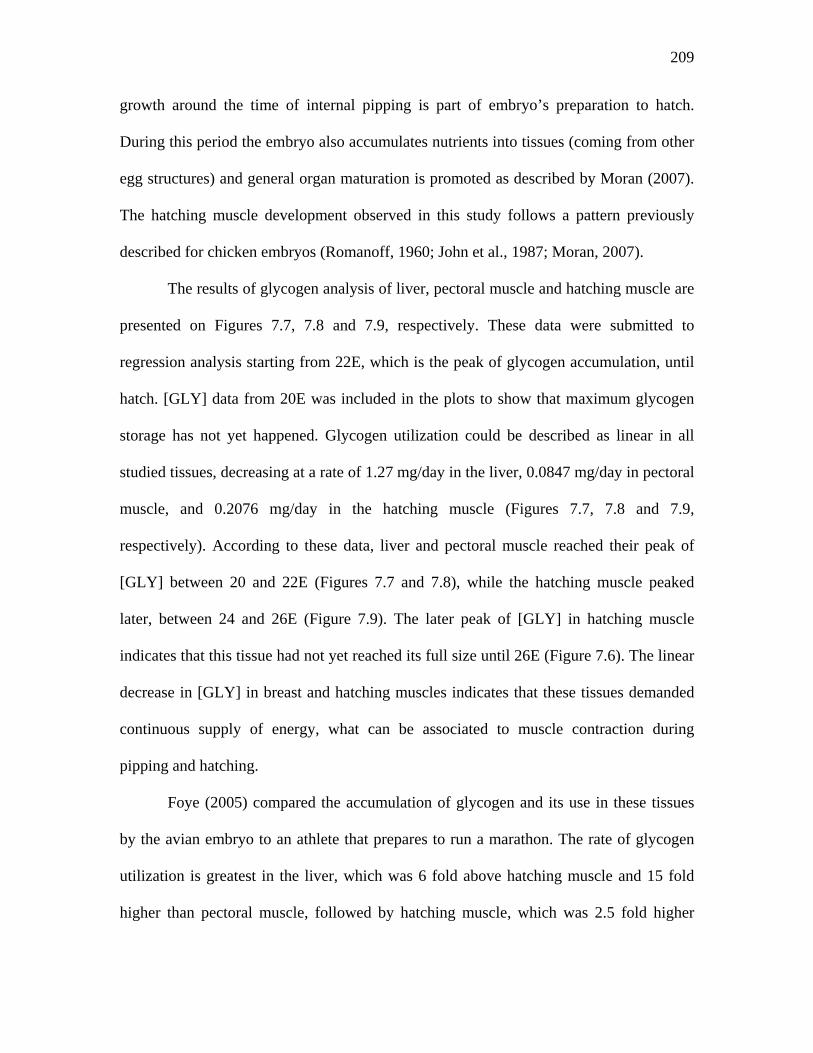
209
growth around the time of internal pipping is part of embryo’s preparation to hatch.
During this period the embryo also accumulates nutrients into tissues (coming from other
egg structures) and general organ maturation is promoted as described by Moran (2007).
The hatching muscle development observed in this study follows a pattern previously
described for chicken embryos (Romanoff, 1960; John et al., 1987; Moran, 2007).
The results of glycogen analysis of liver, pectoral muscle and hatching muscle are
presented on Figures 7.7, 7.8 and 7.9, respectively. These data were submitted to
regression analysis starting from 22E, which is the peak of glycogen accumulation, until
hatch. [GLY] data from 20E was included in the plots to show that maximum glycogen
storage has not yet happened. Glycogen utilization could be described as linear in all
studied tissues, decreasing at a rate of 1.27 mg/day in the liver, 0.0847 mg/day in pectoral
muscle, and 0.2076 mg/day in the hatching muscle (Figures 7.7, 7.8 and 7.9,
respectively). According to these data, liver and pectoral muscle reached their peak of
[GLY] between 20 and 22E (Figures 7.7 and 7.8), while the hatching muscle peaked
later, between 24 and 26E (Figure 7.9). The later peak of [GLY] in hatching muscle
indicates that this tissue had not yet reached its full size until 26E (Figure 7.6). The linear
decrease in [GLY] in breast and hatching muscles indicates that these tissues demanded
continuous supply of energy, what can be associated to muscle contraction during
pipping and hatching.
Foye (2005) compared the accumulation of glycogen and its use in these tissues
by the avian embryo to an athlete that prepares to run a marathon. The rate of glycogen
utilization is greatest in the liver, which was 6 fold above hatching muscle and 15 fold
higher than pectoral muscle, followed by hatching muscle, which was 2.5 fold higher
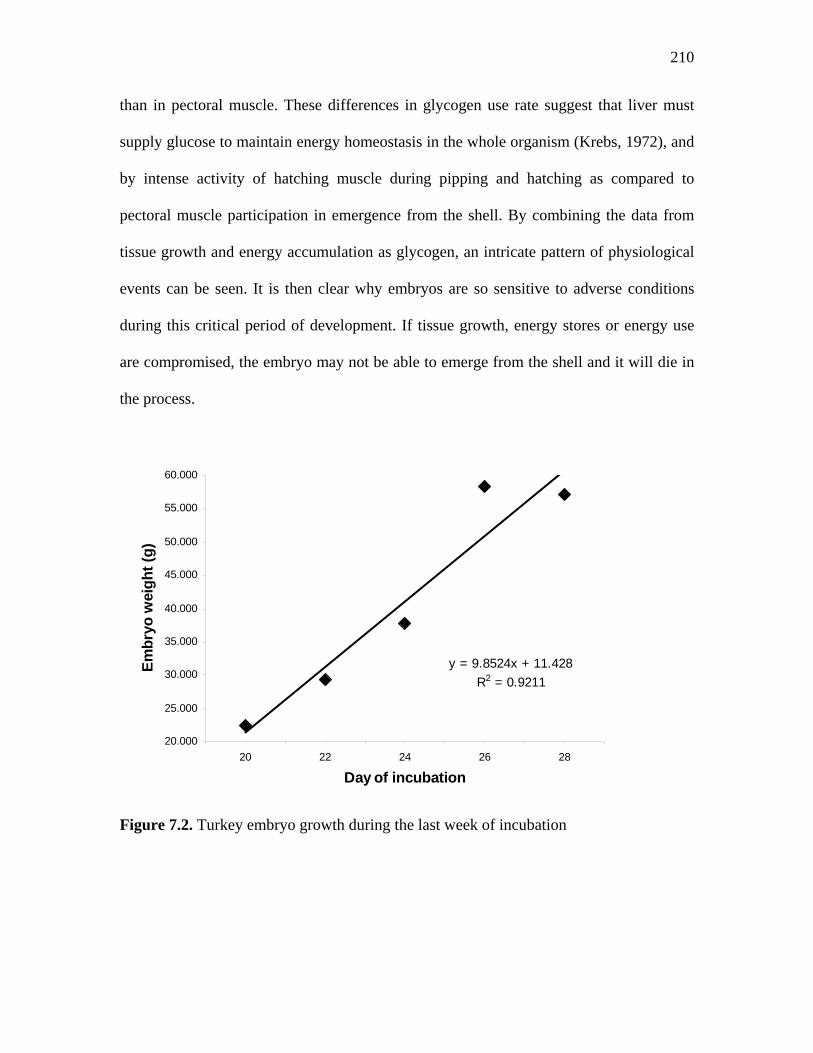
210
than in pectoral muscle. These differences in glycogen use rate suggest that liver must
supply glucose to maintain energy homeostasis in the whole organism (Krebs, 1972), and
by intense activity of hatching muscle during pipping and hatching as compared to
pectoral muscle participation in emergence from the shell. By combining the data from
tissue growth and energy accumulation as glycogen, an intricate pattern of physiological
events can be seen. It is then clear why embryos are so sensitive to adverse conditions
during this critical period of development. If tissue growth, energy stores or energy use
are compromised, the embryo may not be able to emerge from the shell and it will die in
the process.
y = 9.8524x + 11.428R2 = 0.9211
20.000
25.000
30.000
35.000
40.000
45.000
50.000
55.000
60.000
20 22 24 26 28
Day of incubation
Embr
yo w
eigh
t (g)
Figure 7.2. Turkey embryo growth during the last week of incubation
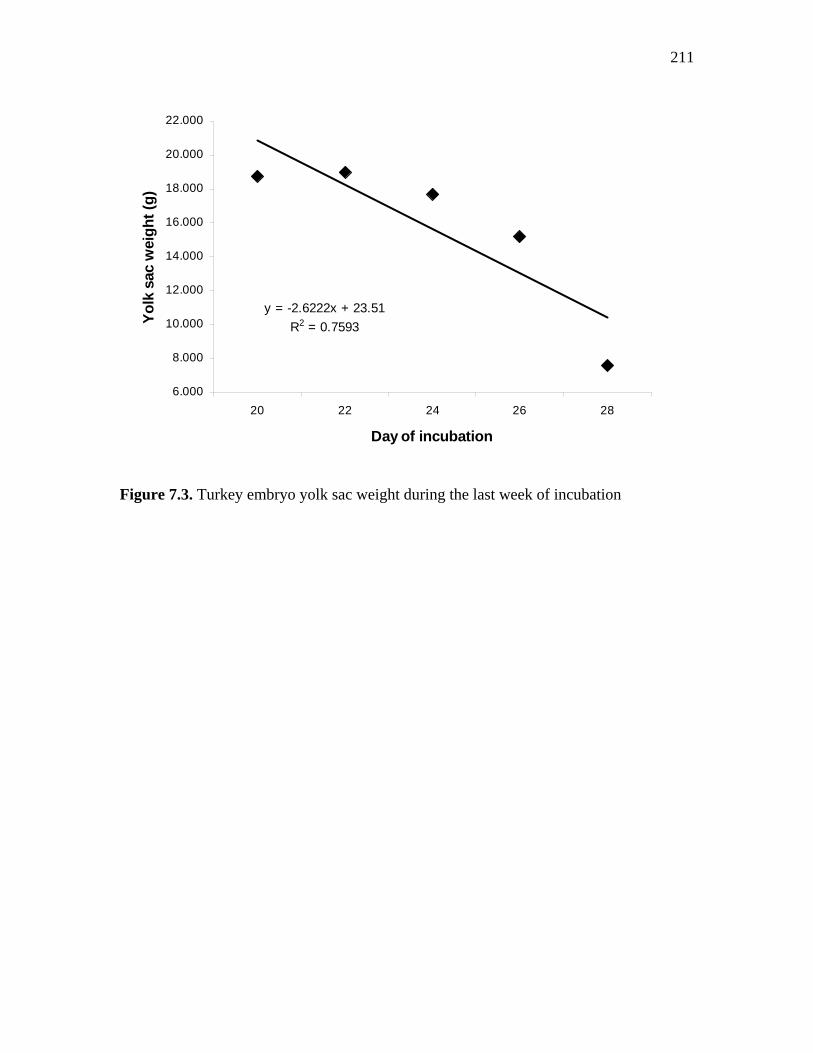
211
y = -2.6222x + 23.51R2 = 0.7593
6.000
8.000
10.000
12.000
14.000
16.000
18.000
20.000
22.000
20 22 24 26 28
Day of incubation
Yolk
sac
wei
ght (
g)
Figure 7.3. Turkey embryo yolk sac weight during the last week of incubation
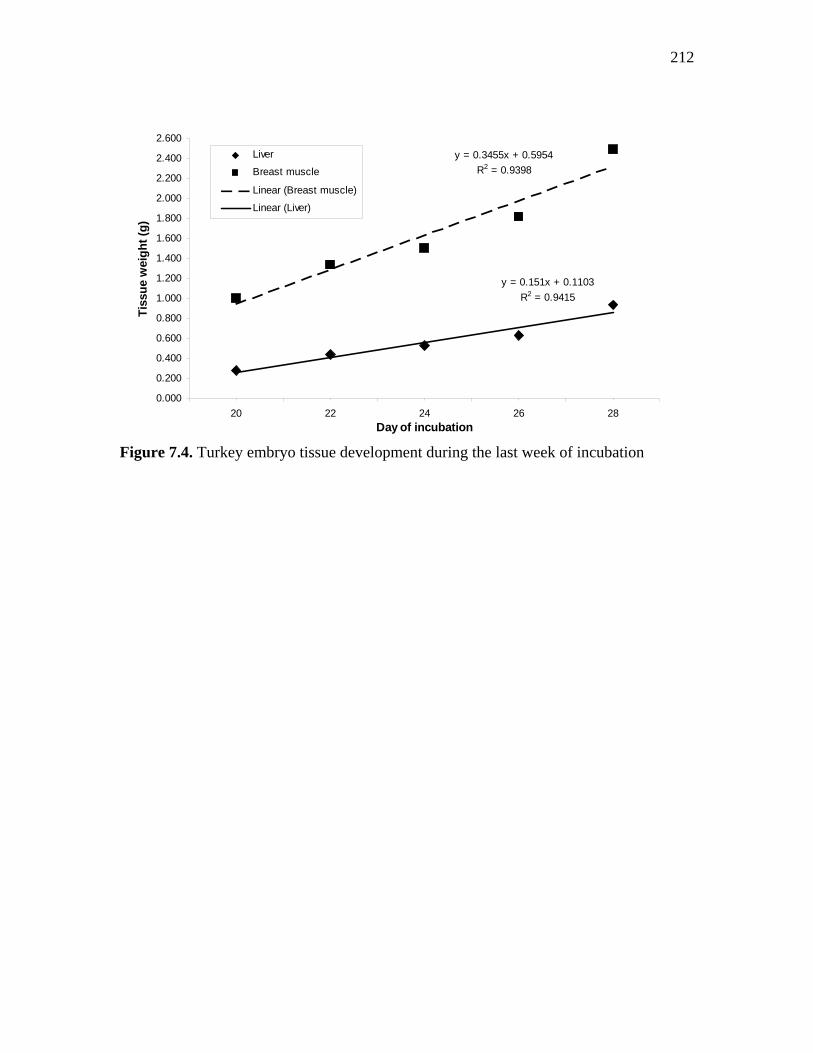
212
y = 0.3455x + 0.5954R2 = 0.9398
y = 0.151x + 0.1103R2 = 0.9415
0.000
0.200
0.400
0.600
0.800
1.000
1.200
1.400
1.600
1.800
2.000
2.200
2.400
2.600
20 22 24 26 28Day of incubation
Tiss
ue w
eigh
t (g)
Liver
Breast muscle
Linear (Breast muscle)
Linear (Liver)
Figure 7.4. Turkey embryo tissue development during the last week of incubation
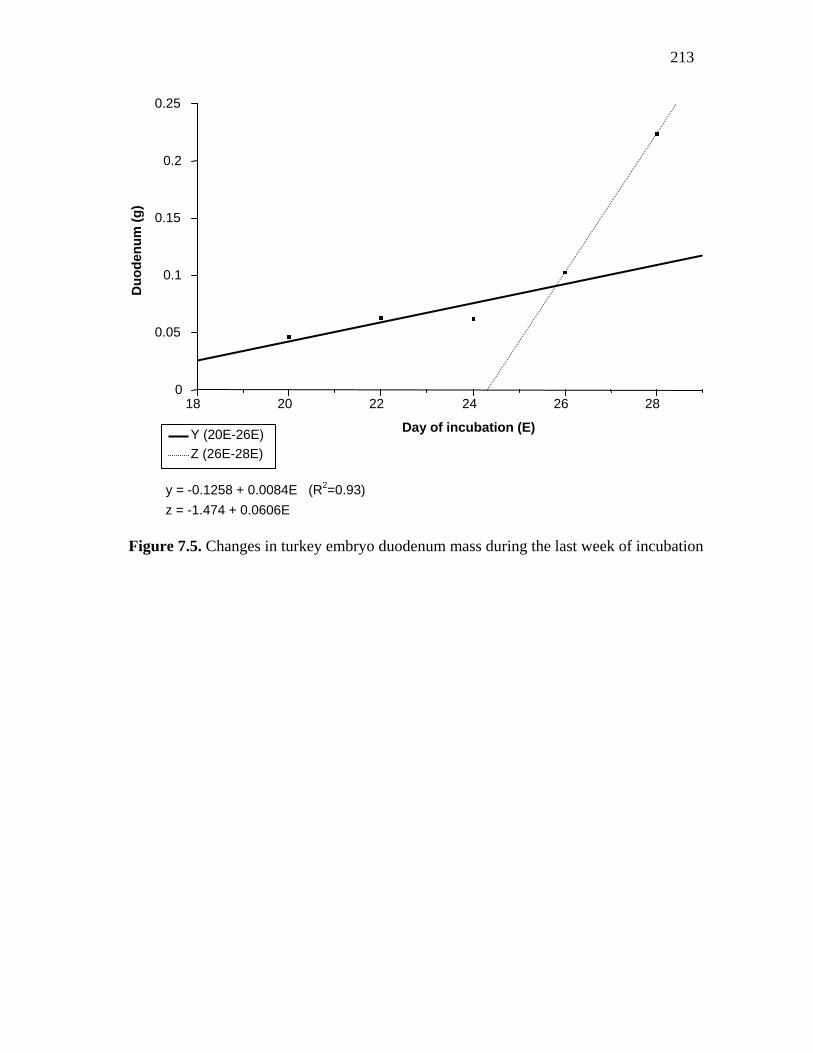
213
Figure 7.5. Changes in turkey embryo duodenum mass during the last week of incubation
0
0.05
0.1
0.15
0.2
0.25
18 20 22 24 26 28
y = -0.1258 + 0.0084E (R2=0.93)z = -1.474 + 0.0606E
Y (20E-26E) Z (26E-28E)
Duo
denu
m (g
)
Day of incubation (E)
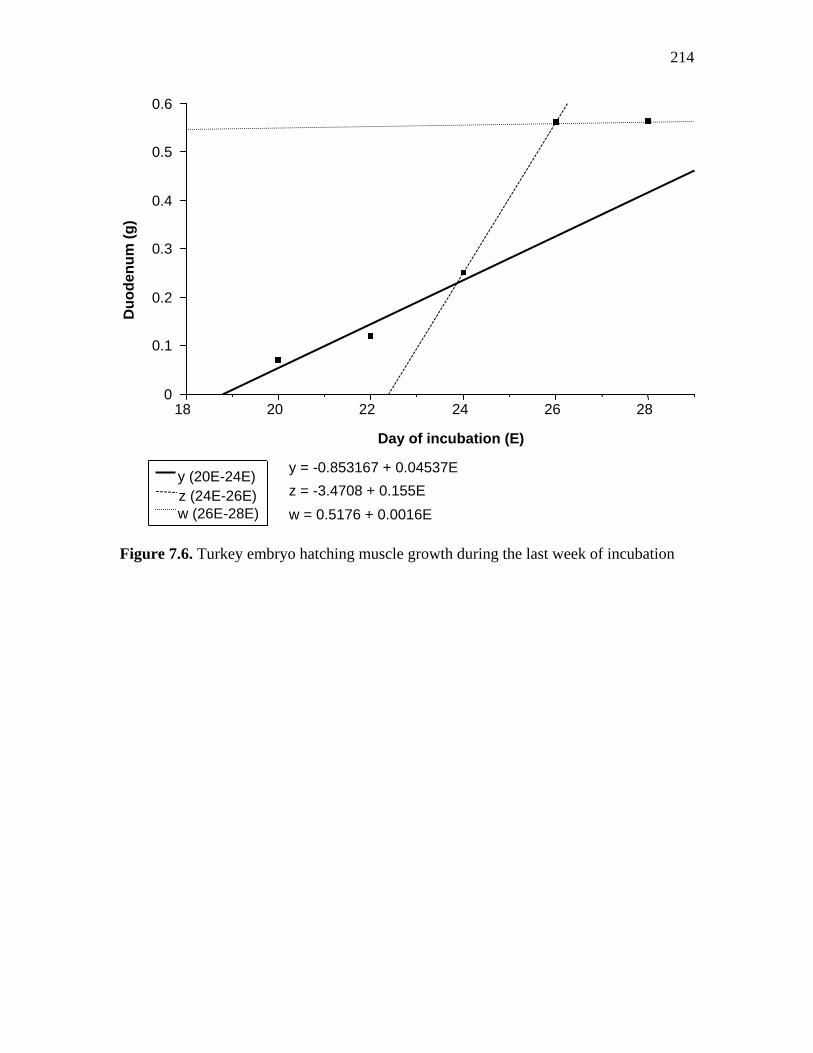
214
Figure 7.6. Turkey embryo hatching muscle growth during the last week of incubation
0
0.1
0.2
0.3
0.4
0.5
0.6
18 20 22 24 26 28
y (20E-24E)
w (26E-28E) z (24E-26E)
y = -0.853167 + 0.04537E
w = 0.5176 + 0.0016Ez = -3.4708 + 0.155E
Duo
denu
m (g
)
Day of incubation (E)
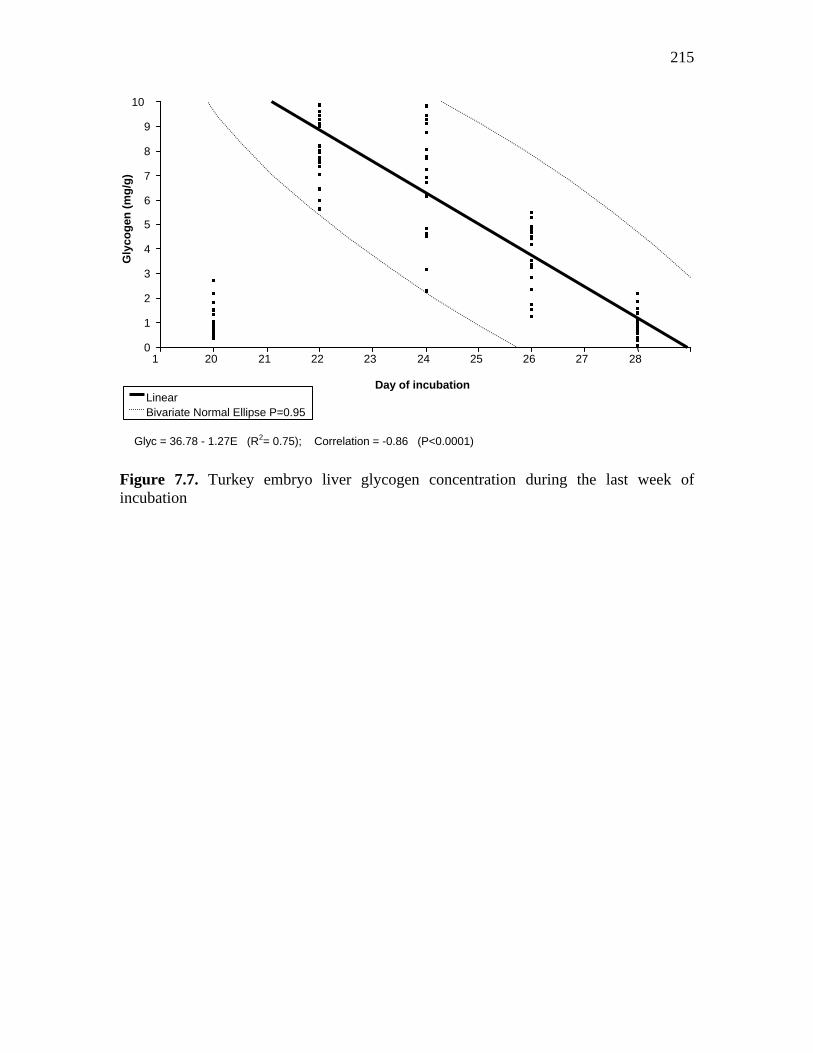
215
Figure 7.7. Turkey embryo liver glycogen concentration during the last week of incubation
0
1
2
3
4
5
6
7
8
9
10 G
lyco
gen
(mg/
g)
1 20 21 22 23 24 25 26 27 28 Day of incubation
Linear Bivariate Normal Ellipse P=0.95
Glyc = 36.78 - 1.27E (R2= 0.75); Correlation = -0.86 (P<0.0001)
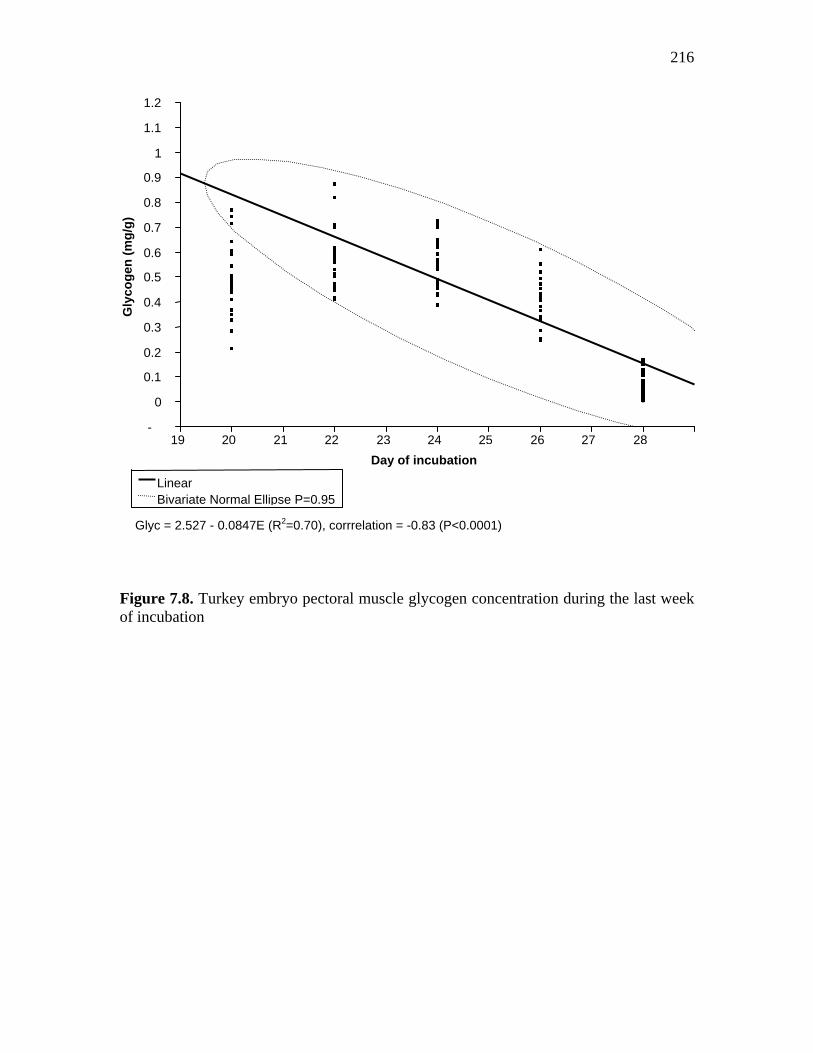
216
Figure 7.8. Turkey embryo pectoral muscle glycogen concentration during the last week of incubation
-
0 0.1 0.2 0.3 0.4 0.5 0.6 0.7 0.8 0.9
1 1.1 1.2
Gly
coge
n (m
g/g)
19 20 21 22 23 24 25 26 27 28 Day of incubation
Linear Bivariate Normal Ellipse P=0.95
Glyc = 2.527 - 0.0847E (R2=0.70), corrrelation = -0.83 (P<0.0001)
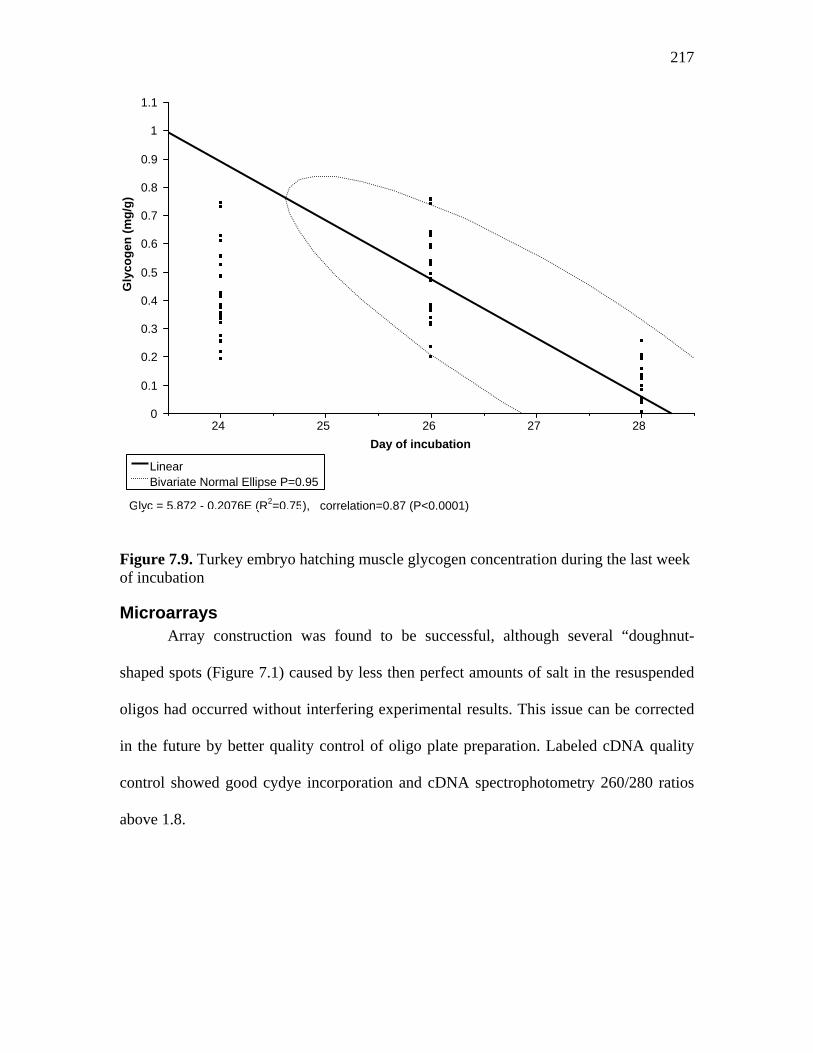
217
Figure 7.9. Turkey embryo hatching muscle glycogen concentration during the last week of incubation
Microarrays Array construction was found to be successful, although several “doughnut-
shaped spots (Figure 7.1) caused by less then perfect amounts of salt in the resuspended
oligos had occurred without interfering experimental results. This issue can be corrected
in the future by better quality control of oligo plate preparation. Labeled cDNA quality
control showed good cydye incorporation and cDNA spectrophotometry 260/280 ratios
above 1.8.
0
0.1 0.2 0.3 0.4 0.5 0.6 0.7 0.8 0.9
1
1.1 G
lyco
gen
(mg/
g)
24 25 26 27 28 Day of incubation
Linear Bivariate Normal Ellipse P=0.95
Glyc = 5.872 - 0.2076E (R2=0.75), correlation=0.87 (P<0.0001)

218
Cluster Analysis
Genes, whose expressions were significantly different in at least one time point
from 20E to hatch, were included in the cluster analysis. The results of the cluster
analysis of liver, pectoral muscle, hatching muscle, and duodenum are presented on
Figures 7.10, 7.12, 7.14 and 7.16, respectively. The list of significant genes appears on
the figures left column, the color map can be seen in the middle and the clustering is
shown on the right of the figures. The expression patterns are grouped by their similarity
along days of incubation, which appear on the very bottom of the color map. The color
and its intensity represents the level of expression of that gene at the specific embryonic
age, blue indicating lower expression or down regulation and red meaning higher
expression or up-regulation. Based on the clustering, the liver genes were divided into 6
clusters of similar expression patterns, and the genes of other tissues were divided into 4
clusters each. The clusters in each tissue were color coded and identified by a lower case
letter starting with “a” from top to bottom (right hand side of figures).
The mean expression of each cluster in liver, pectoral muscle, hatching muscle
and duodenum are plotted on Figures 7.11, 7.13, 7.15 and 7.17, respectively. The tissue
with the largest number of genes significantly affected by embryonic age was the
duodenum with 85 significant genes, followed by the liver with 60 genes and then
pectoral muscle (53 genes), and hatching muscle (51 genes).
One important observation is that usual housekeeping genes, chGAPDH and
chEF2, can change significantly between days due to high rate of development. Also, due
to high sensitivity of this array, even very small changes in color intensity can be
significant for genes with very consistent signals. For example, a gene with constant zero
219
color intensity (or background intensity) can be significant if an intensity higher than zero
spikes in one time point. This is the case when atCAB2-arapdopsis and chBACT, which
are not present in animal tissues, showed as significant in some clusters (Figures 7.12,
7.14 and 7.16). The same thing happens when a gene seems to be expressed in a tissue
where it is not expected to be expressed, like alpha-amylase in liver and muscle tissues
(Figures 7.10 and 7.12). This inherent error can occur by using a false discovery rate
(FDR) of 0.01, as one false positive or negative gene every one hundred genes is
expected. A general discussion of each cluster by tissue will be presented next.
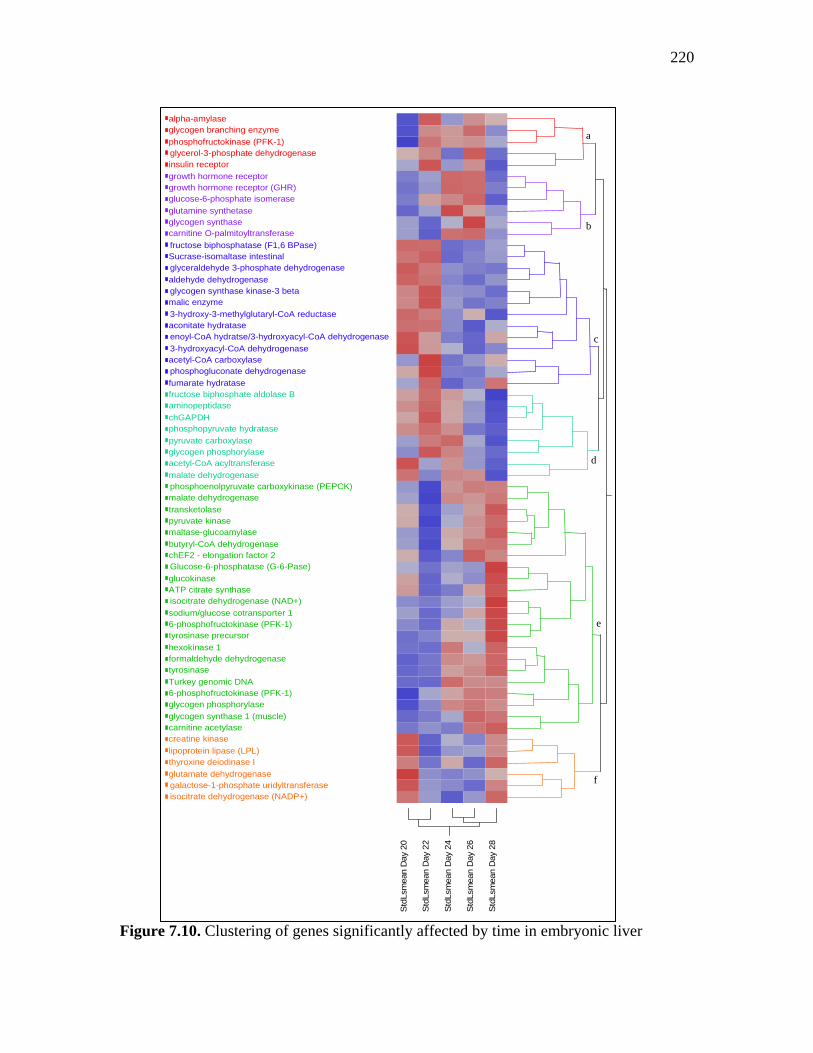
220
Figure 7.10. Clustering of genes significantly affected by time in embryonic liver
alpha-amylase
phosphoenolpyruvate carboxykinase (PEPCK)
fructose biphosphatase (F1,6 BPase)
Glucose-6-phosphatase (G-6-Pase)
glycerol-3-phosphate dehydrogenase
transketolase
creatine kinase
aconitate hydratase
glycogen branching enzyme
malate dehydrogenase
maltase-glucoamylase
hexokinase 1
fructose biphosphate aldolase B
formaldehyde dehydrogenase
acetyl-CoA acyltransferasemalate dehydrogenase
enoyl-CoA hydratse/3-hydroxyacyl-CoA dehydrogenase
glucokinase
glutamate dehydrogenase
Sucrase-isomaltase intestinalglyceraldehyde 3-phosphate dehydrogenase
growth hormone receptor
phosphopyruvate hydratasepyruvate carboxylase
acetyl-CoA carboxylase
glycogen synthase 1 (muscle)
glycogen synthase
pyruvate kinase
glycogen phosphorylase
fumarate hydratase
isocitrate dehydrogenase (NADP+)
insulin receptor
glutamine synthetase
phosphofructokinase (PFK-1)
carnitine O-palmitoyltransferase
glycogen synthase kinase-3 betamalic enzyme
butyryl-CoA dehydrogenase
carnitine acetylase
aminopeptidase
6-phosphofructokinase (PFK-1)
ATP citrate synthase
phosphogluconate dehydrogenase
aldehyde dehydrogenase
3-hydroxy-3-methylglutaryl-CoA reductase
3-hydroxyacyl-CoA dehydrogenase
isocitrate dehydrogenase (NAD+)
lipoprotein lipase (LPL)thyroxine deiodinase I
6-phosphofructokinase (PFK-1)tyrosinase precursor
growth hormone receptor (GHR)
glycogen phosphorylase
tyrosinase
chGAPDH
galactose-1-phosphate uridyltransferase
chEF2 - elongation factor 2
Turkey genomic DNA
glucose-6-phosphate isomerase
sodium/glucose cotransporter 1
Std
Lsm
ean
Day
20
Std
Lsm
ean
Day
22
Std
Lsm
ean
Day
24
Std
Lsm
ean
Day
26
Std
Lsm
ean
Day
28
a
b
c
d
e
f
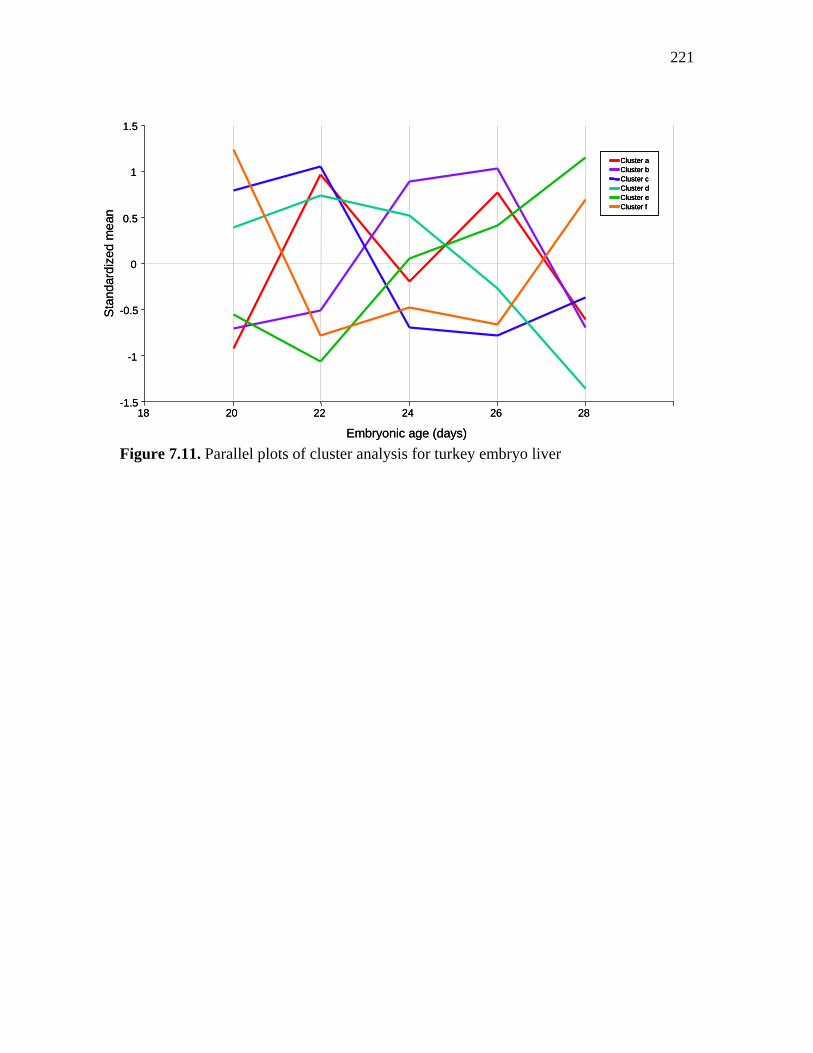
221
Figure 7.11. Parallel plots of cluster analysis for turkey embryo liver
-1.5
-1
-0.5
0
0.5
1
1.5S
tand
ardi
zed
mea
n
18 20 22 24 26 28
Embryonic age (days)
Cluster aCluster bCluster cCluster dCluster eCluster f
-1.5
-1
-0.5
0
0.5
1
1.5S
tand
ardi
zed
mea
n
18 20 22 24 26 28
Embryonic age (days)
Cluster aCluster bCluster cCluster dCluster eCluster f
Cluster aCluster bCluster cCluster dCluster eCluster f
Cluster aCluster bCluster cCluster dCluster eCluster f
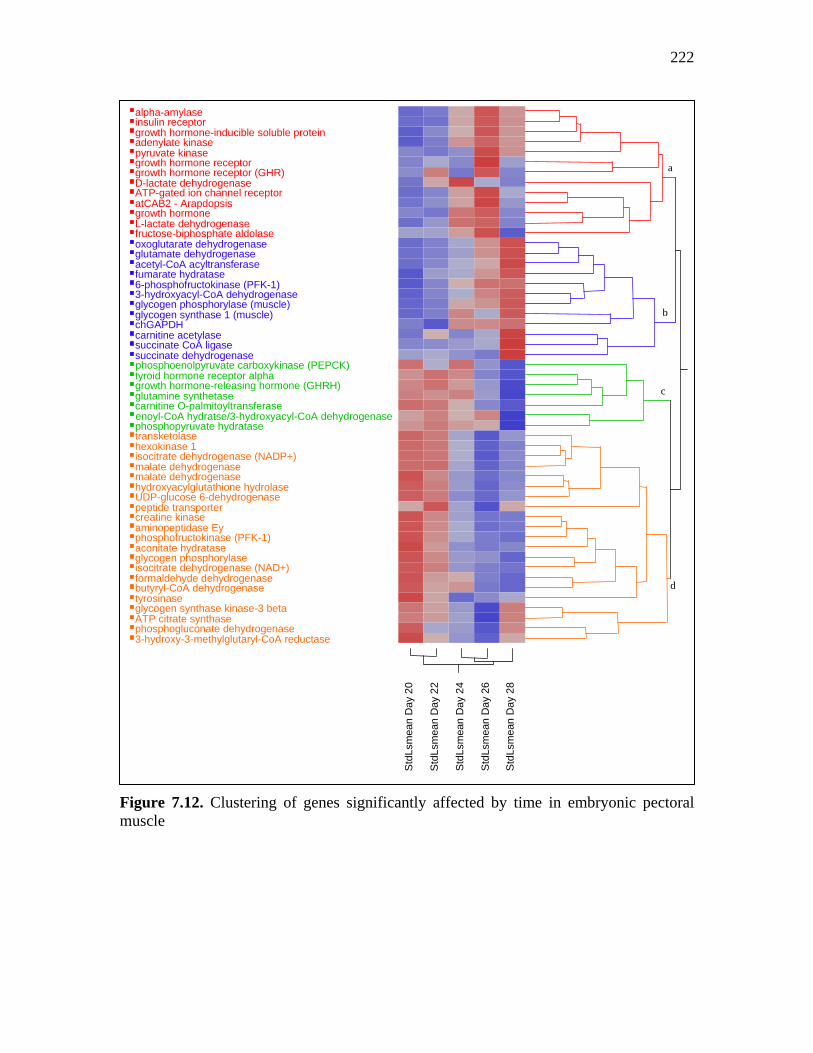
222
Figure 7.12. Clustering of genes significantly affected by time in embryonic pectoral muscle
alpha-amylase
phosphoenolpyruvate carboxykinase (PEPCK)
oxoglutarate dehydrogenase
growth hormone-inducible soluble protein
transketolase
creatine kinase
aconitate hydratase
malate dehydrogenase
hexokinase 1
formaldehyde dehydrogenase
acetyl-CoA acyltransferase
adenylate kinase
D-lactate dehydrogenase
tyroid hormone receptor alpha
ATP-gated ion channel receptor
malate dehydrogenase
enoyl-CoA hydratse/3-hydroxyacyl-CoA dehydrogenase
glutamate dehydrogenase
fructose-biphosphate aldolase
growth hormone
growth hormone receptor
phosphopyruvate hydratase
glycogen synthase 1 (muscle)
pyruvate kinase
glycogen phosphorylase
hydroxyacylglutathione hydrolase
fumarate hydratase
isocitrate dehydrogenase (NADP+)
insulin receptor
glutamine synthetase
phosphofructokinase (PFK-1)
carnitine O-palmitoyltransferase
glycogen synthase kinase-3 beta
L-lactate dehydrogenase
butyryl-CoA dehydrogenase
carnitine acetylase
6-phosphofructokinase (PFK-1)
ATP citrate synthase
succinate CoA ligase
phosphogluconate dehydrogenase3-hydroxy-3-methylglutaryl-CoA reductase
3-hydroxyacyl-CoA dehydrogenase
UDP-glucose 6-dehydrogenase
isocitrate dehydrogenase (NAD+)
growth hormone-releasing hormone (GHRH)
glycogen phosphorylase (muscle)
growth hormone receptor (GHR)
succinate dehydrogenase
tyrosinase
chGAPDH
atCAB2 - Arapdopsis
aminopeptidase Ey
peptide transporter
Std
Lsm
ean
Day
20
Std
Lsm
ean
Day
22
Std
Lsm
ean
Day
24
Std
Lsm
ean
Day
26
Std
Lsm
ean
Day
28
a
b
c
d

223
Figure 7.13. Parallel plots of cluster analysis for turkey embryo pectoral muscle
-2
-1.5
-1
-0.5
0
0.5
1
1.5
Sta
ndar
dize
d m
ean
18 20 22 24 26 28
Embryonic age (days)
Cluster aCluster bCluster cCluster d
-2
-1.5
-1
-0.5
0
0.5
1
1.5
Sta
ndar
dize
d m
ean
18 20 22 24 26 28
Embryonic age (days)
Cluster aCluster bCluster cCluster d
Cluster aCluster bCluster cCluster d
Cluster aCluster bCluster cCluster d

224
Figure 7.14. Clustering of genes significantly affected by time in embryonic hatching muscle
oxoglutarate dehydrogenase
transaldolase
growth hormone-inducible soluble protein
transketolase
creatine kinase
malate dehydrogenase
phosphorylase kinase B alpha regulatory chain
acetyl-CoA acyltransferase
citrate lyase
adenylate kinase
D-lactate dehydrogenase
tyroid hormone receptor alpha
malate dehydrogenase
glutamate dehydrogenasefructose-biphosphate aldolase
phosphopyruvate hydratase
glycogen synthase 1 (muscle)
glycogen synthase
pyruvate kinase
hydroxyacylglutathione hydrolase
fumarate hydrataseinsulin receptor
glutamine synthetase
carnitine O-palmitoyltransferase
glycogen synthase kinase-3 beta
malic enzyme
L-lactate dehydrogenase
butyryl-CoA dehydrogenase
aminopeptidase
6-phosphofructokinase (PFK-1)ATP citrate synthase
succinate CoA ligase
phosphogluconate dehydrogenase
3-hydroxy-3-methylglutaryl-CoA reductase
3-hydroxyacyl-CoA dehydrogenase
UDP-glucose 6-dehydrogenase
isocitrate dehydrogenase (NAD+)
lipoprotein lipase (LPL)
growth hormone-releasing hormone (GHRH)
glycogen phosphorylase (muscle)
succinate dehydrogenase
glycogen phosphorylasetyrosinase
chGAPDH
atCAB2 - Arapdopsis
chEF2 - elongation factor 2Turkey genomic DNATurkey genomic DNA
aminopeptidase Eypeptide transporter
glucose-6-phosphate isomerase
Std
Lsm
ean
Day
20
Std
Lsm
ean
Day
22
Std
Lsm
ean
Day
24
Std
Lsm
ean
Day
26
Std
Lsm
ean
Day
28
a
b
c
d
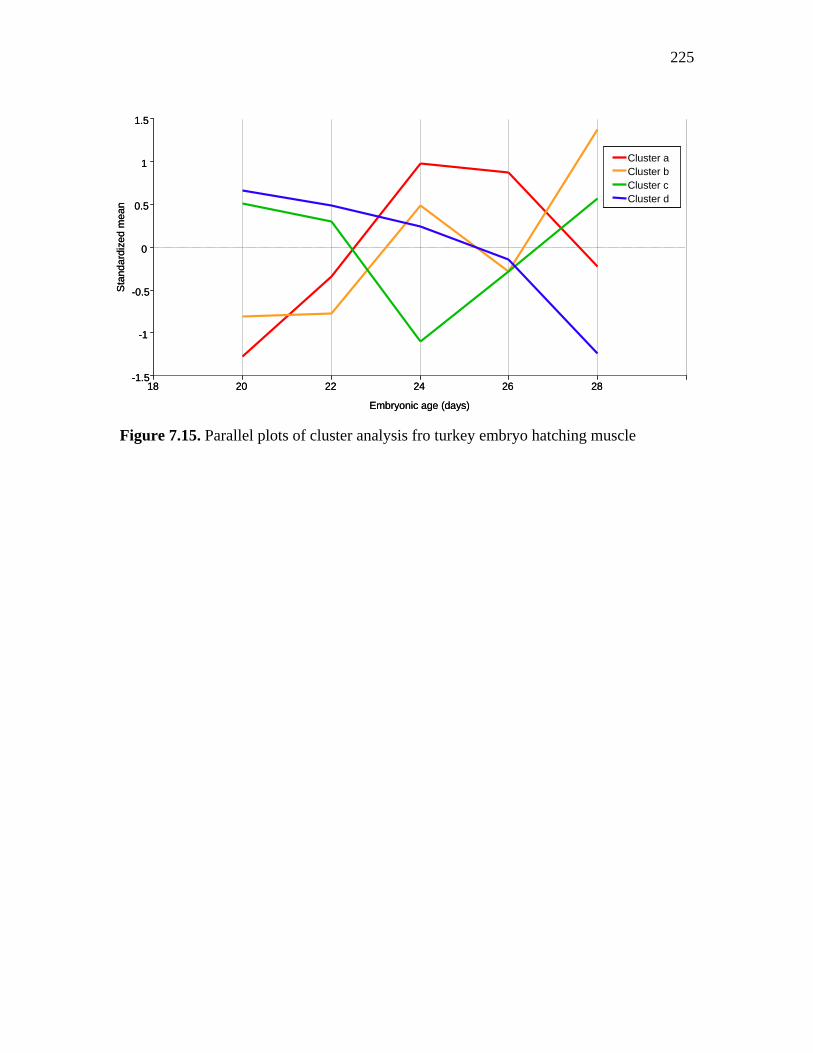
225
Figure 7.15. Parallel plots of cluster analysis fro turkey embryo hatching muscle
-1.5
-1
-0.5
0
0.5
1
1.5S
tand
ardi
zed
mea
n
18 20 22 24 26 28
Embryonic age (days)
Cluster aCluster bCluster cCluster d
-1.5
-1
-0.5
0
0.5
1
1.5S
tand
ardi
zed
mea
n
18 20 22 24 26 28
Embryonic age (days)
Cluster aCluster bCluster cCluster d
Cluster aCluster bCluster cCluster d

226
Figure 7.16. Clustering of genes significantly affected by time in embryonic duodenum
alpha-amylase
CaM kinase II gamma
fructose biphosphatase (F1,6 BPase)
Glucose-6-phosphatase (G-6-Pase)
oxoglutarate dehydrogenase
transaldolase
growth hormone-inducible soluble protein
phosphoglucomutase
glycerol-3-phosphate dehydrogenase
transketolase
creatine kinase
aconitate hydratase
glycogen branching enzyme
malate dehydrogenase
maltase-glucoamylase
phosphorylase kinase B alpha regulatory chain
hexokinase 1
fructose biphosphate aldolase B
pyruvate dehydrogenase
acetyl-CoA acyltransferase
adenylate kinase
hexokinase II
D-lactate dehydrogenase
tyroid hormone receptor beta
tyroid hormone receptor alpha
ATP-gated ion channel receptor
malate dehydrogenase
enoyl-CoA hydratse/3-hydroxyacyl-CoA dehydrogenase
glucokinase
protein phosphatase 1
glutamate dehydrogenase
acetyl CoA hydrolase
Sucrase-isomaltase intestinal
glyceraldehyde 3-phosphate dehydrogenase
fructose-biphosphate aldolase
growth hormone receptor
glucagon receptor
pyruvate carboxylase
acetyl-CoA carboxylase
glycogen synthase 1 (muscle)glycogen synthase
pyruvate kinase
glycogen phosphorylase
hydroxyacylglutathione hydrolase
isocitrate dehydrogenase (NADP+)
insulin receptorglutamine synthetase
phosphofructokinase (PFK-1)
carnitine O-palmitoyltransferase
glycogen synthase kinase-3 beta
malic enzyme
butyryl-CoA dehydrogenase
carnitine acetylase
aminopeptidase
6-phosphofructokinase (PFK-1)
ATP citrate synthase
succinate CoA ligase
phosphogluconate dehydrogenase
aldehyde dehydrogenase3-hydroxy-3-methylglutaryl-CoA reductase
UDP-glucose 6-dehydrogenase
isocitrate dehydrogenase (NAD+)
lipoprotein lipase (LPL)
thyroxine deiodinase I
6-phosphofructokinase (PFK-1)
tyrosinase precursor
growth hormone-releasing hormone (GHRH)
glycogen phosphorylase (muscle)
growth hormone receptor (GHR)
succinate dehydrogenase
glycogen phosphorylase
tyrosinase
chGAPDH
galactose-1-phosphate uridyltransferase
atCAB2 - Arapdopsis
chEF2 - elongation factor 2
chBACT
Turkey genomic DNATurkey genomic DNA
aminopeptidase Ey
insulin-like growtg factor 2 receptor (ILGF-2 receptor)
peptide transporter
growth hormone-releasing hormone (GHRH)
UTP-glucose-1-phosphate urydyltransferase
glucose-6-phosphate isomerase
sodium/glucose cotransporter 1
Std
Lsm
ean
Day
20
Std
Lsm
ean
Day
22
Std
Lsm
ean
Day
24
Std
Lsm
ean
Day
26
Std
Lsm
ean
Day
28
a
b
c
d
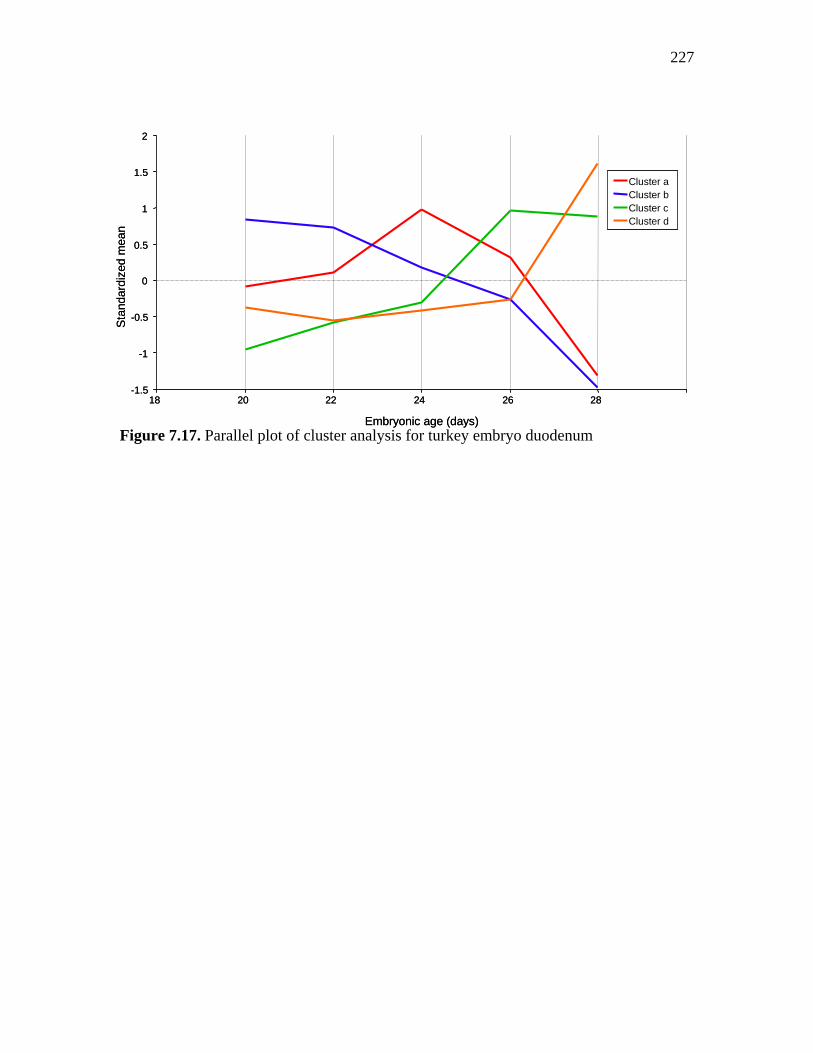
227
Figure 7.17. Parallel plot of cluster analysis for turkey embryo duodenum
-1.5
-1
-0.5
0
0.5
1
1.5
2St
anda
rdiz
ed m
ean
18 20 22 24 26 28
Embryonic age (days)
Cluster aCluster bCluster cCluster d
-1.5
-1
-0.5
0
0.5
1
1.5
2St
anda
rdiz
ed m
ean
18 20 22 24 26 28
Embryonic age (days)
Cluster aCluster bCluster cCluster d
Cluster aCluster bCluster cCluster d

228
Liver
According to the results, the liver had 60 genes whose gene expression
significantly changed during the last week of embryonic development. This large number
of genes was expected because the liver is the most metabolic active organ (Krebs, 1972),
and even more during this stage of development when the embryo is preparing for its life
outside the shell. The complexity of liver metabolism is also reflected in the number of
clusters, being the tissue with the most clusters (six). The liver is known for being the
organ with the most enzymes and able to perform almost any pathway that exists in the
animal (Kietzmann and Jungermann, 1997). During the last days of incubation, two main
hepatic functions can be highlighted: storage of energy as glycogen for hatching (Uni and
Ferket, 2004) and transfer of many nutrients from other egg compartments to the liver,
especially large amounts of cholesterol from the yolk sac (Moran, 2007).
The liver parallel plot of the six clusters can be seen on Figure 7.11. The first
observation is paired clusters with almost perfect opposite patterns, like cluster “a” is
opposite of “f”, “b” is opposite of “c” and “d is the opposite of “e”. This observation
facilitates understanding of gene functions by associating their pattern of expression with
their pathways.
Lipid metabolism
Identifying the stage of embryonic development when the embryo switches from
lipid- to carbohydrate-based metabolism was one of the main objectives of this study.
This change in metabolism has being suggested by several authors (Romanoff, 1967;
Donaldson et al., 1991; Noy and Sklan, 1999; Uni and Ferket, 2004; Foye, 2005; Moran,
2007) to be based on the fact that fatty acid beta-oxidation must be limited by low oxygen
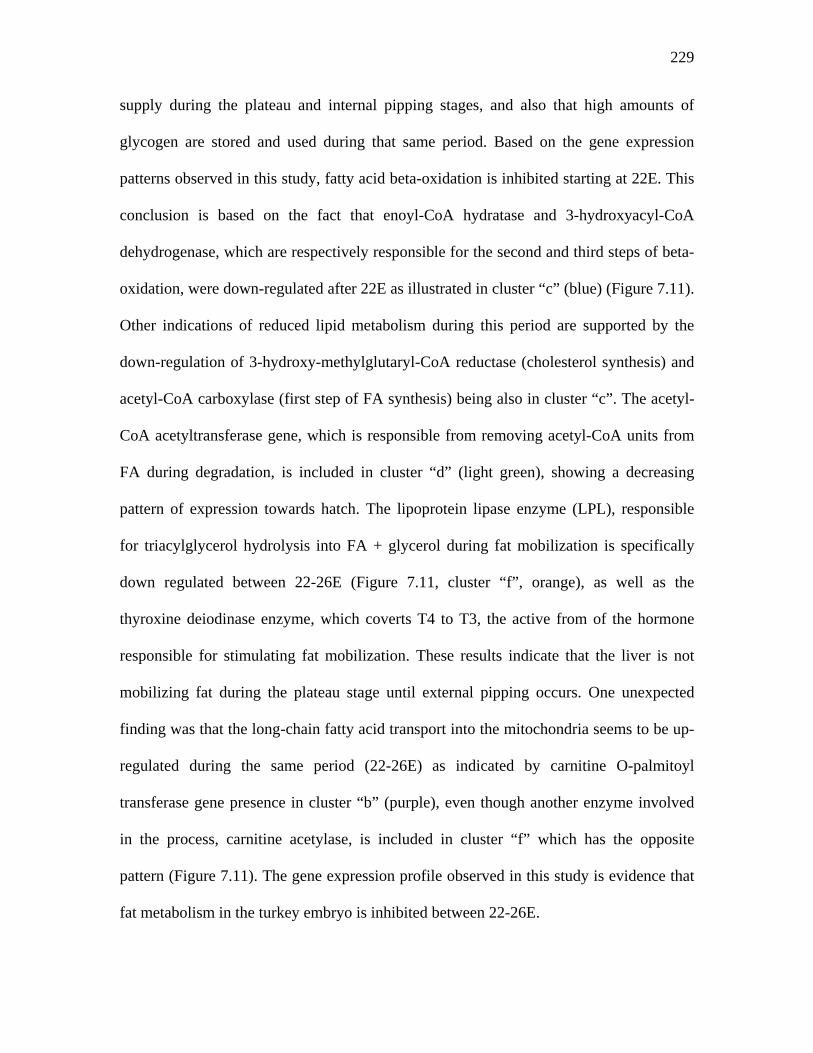
229
supply during the plateau and internal pipping stages, and also that high amounts of
glycogen are stored and used during that same period. Based on the gene expression
patterns observed in this study, fatty acid beta-oxidation is inhibited starting at 22E. This
conclusion is based on the fact that enoyl-CoA hydratase and 3-hydroxyacyl-CoA
dehydrogenase, which are respectively responsible for the second and third steps of beta-
oxidation, were down-regulated after 22E as illustrated in cluster “c” (blue) (Figure 7.11).
Other indications of reduced lipid metabolism during this period are supported by the
down-regulation of 3-hydroxy-methylglutaryl-CoA reductase (cholesterol synthesis) and
acetyl-CoA carboxylase (first step of FA synthesis) being also in cluster “c”. The acetyl-
CoA acetyltransferase gene, which is responsible from removing acetyl-CoA units from
FA during degradation, is included in cluster “d” (light green), showing a decreasing
pattern of expression towards hatch. The lipoprotein lipase enzyme (LPL), responsible
for triacylglycerol hydrolysis into FA + glycerol during fat mobilization is specifically
down regulated between 22-26E (Figure 7.11, cluster “f”, orange), as well as the
thyroxine deiodinase enzyme, which coverts T4 to T3, the active from of the hormone
responsible for stimulating fat mobilization. These results indicate that the liver is not
mobilizing fat during the plateau stage until external pipping occurs. One unexpected
finding was that the long-chain fatty acid transport into the mitochondria seems to be up-
regulated during the same period (22-26E) as indicated by carnitine O-palmitoyl
transferase gene presence in cluster “b” (purple), even though another enzyme involved
in the process, carnitine acetylase, is included in cluster “f” which has the opposite
pattern (Figure 7.11). The gene expression profile observed in this study is evidence that
fat metabolism in the turkey embryo is inhibited between 22-26E.
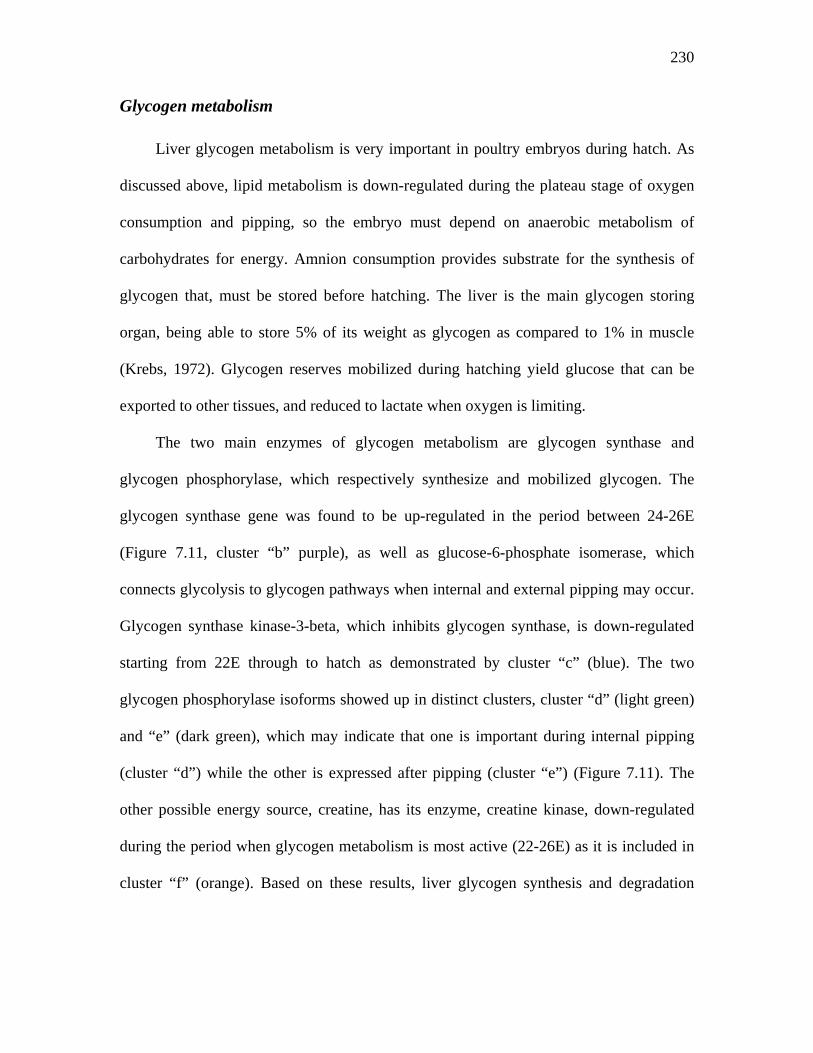
230
Glycogen metabolism
Liver glycogen metabolism is very important in poultry embryos during hatch. As
discussed above, lipid metabolism is down-regulated during the plateau stage of oxygen
consumption and pipping, so the embryo must depend on anaerobic metabolism of
carbohydrates for energy. Amnion consumption provides substrate for the synthesis of
glycogen that, must be stored before hatching. The liver is the main glycogen storing
organ, being able to store 5% of its weight as glycogen as compared to 1% in muscle
(Krebs, 1972). Glycogen reserves mobilized during hatching yield glucose that can be
exported to other tissues, and reduced to lactate when oxygen is limiting.
The two main enzymes of glycogen metabolism are glycogen synthase and
glycogen phosphorylase, which respectively synthesize and mobilized glycogen. The
glycogen synthase gene was found to be up-regulated in the period between 24-26E
(Figure 7.11, cluster “b” purple), as well as glucose-6-phosphate isomerase, which
connects glycolysis to glycogen pathways when internal and external pipping may occur.
Glycogen synthase kinase-3-beta, which inhibits glycogen synthase, is down-regulated
starting from 22E through to hatch as demonstrated by cluster “c” (blue). The two
glycogen phosphorylase isoforms showed up in distinct clusters, cluster “d” (light green)
and “e” (dark green), which may indicate that one is important during internal pipping
(cluster “d”) while the other is expressed after pipping (cluster “e”) (Figure 7.11). The
other possible energy source, creatine, has its enzyme, creatine kinase, down-regulated
during the period when glycogen metabolism is most active (22-26E) as it is included in
cluster “f” (orange). Based on these results, liver glycogen synthesis and degradation
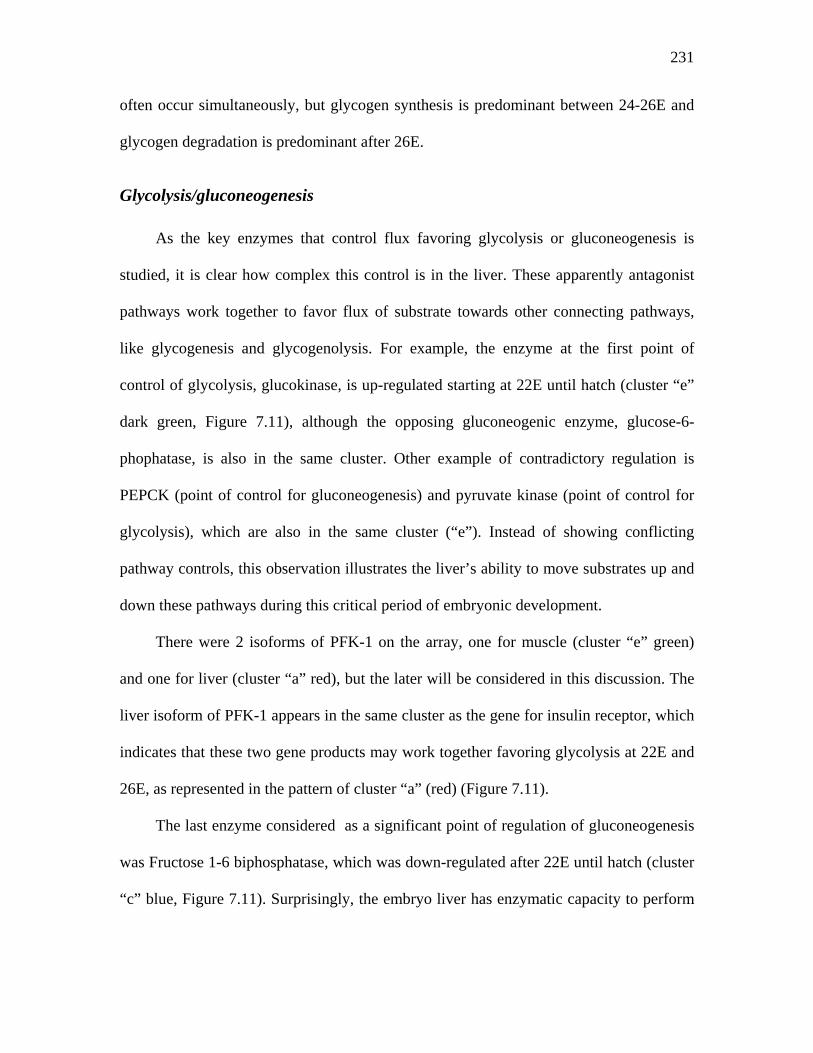
231
often occur simultaneously, but glycogen synthesis is predominant between 24-26E and
glycogen degradation is predominant after 26E.
Glycolysis/gluconeogenesis
As the key enzymes that control flux favoring glycolysis or gluconeogenesis is
studied, it is clear how complex this control is in the liver. These apparently antagonist
pathways work together to favor flux of substrate towards other connecting pathways,
like glycogenesis and glycogenolysis. For example, the enzyme at the first point of
control of glycolysis, glucokinase, is up-regulated starting at 22E until hatch (cluster “e”
dark green, Figure 7.11), although the opposing gluconeogenic enzyme, glucose-6-
phophatase, is also in the same cluster. Other example of contradictory regulation is
PEPCK (point of control for gluconeogenesis) and pyruvate kinase (point of control for
glycolysis), which are also in the same cluster (“e”). Instead of showing conflicting
pathway controls, this observation illustrates the liver’s ability to move substrates up and
down these pathways during this critical period of embryonic development.
There were 2 isoforms of PFK-1 on the array, one for muscle (cluster “e” green)
and one for liver (cluster “a” red), but the later will be considered in this discussion. The
liver isoform of PFK-1 appears in the same cluster as the gene for insulin receptor, which
indicates that these two gene products may work together favoring glycolysis at 22E and
26E, as represented in the pattern of cluster “a” (red) (Figure 7.11).
The last enzyme considered as a significant point of regulation of gluconeogenesis
was Fructose 1-6 biphosphatase, which was down-regulated after 22E until hatch (cluster
“c” blue, Figure 7.11). Surprisingly, the embryo liver has enzymatic capacity to perform
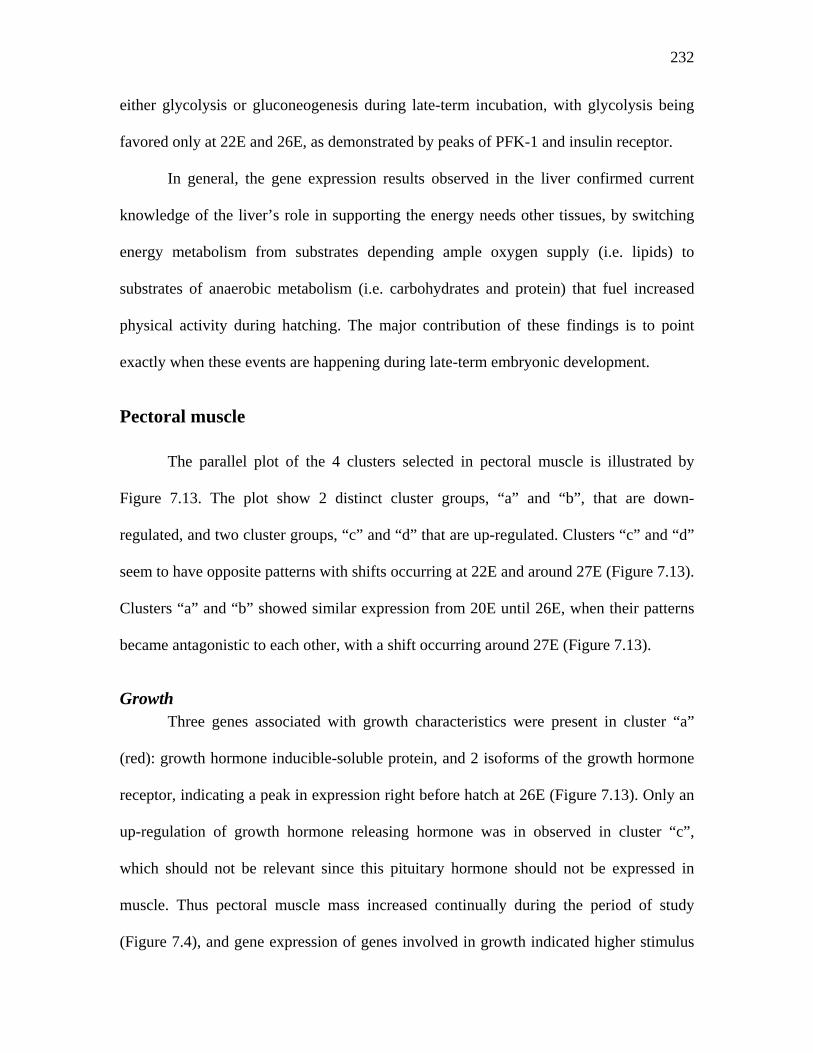
232
either glycolysis or gluconeogenesis during late-term incubation, with glycolysis being
favored only at 22E and 26E, as demonstrated by peaks of PFK-1 and insulin receptor.
In general, the gene expression results observed in the liver confirmed current
knowledge of the liver’s role in supporting the energy needs other tissues, by switching
energy metabolism from substrates depending ample oxygen supply (i.e. lipids) to
substrates of anaerobic metabolism (i.e. carbohydrates and protein) that fuel increased
physical activity during hatching. The major contribution of these findings is to point
exactly when these events are happening during late-term embryonic development.
Pectoral muscle
The parallel plot of the 4 clusters selected in pectoral muscle is illustrated by
Figure 7.13. The plot show 2 distinct cluster groups, “a” and “b”, that are down-
regulated, and two cluster groups, “c” and “d” that are up-regulated. Clusters “c” and “d”
seem to have opposite patterns with shifts occurring at 22E and around 27E (Figure 7.13).
Clusters “a” and “b” showed similar expression from 20E until 26E, when their patterns
became antagonistic to each other, with a shift occurring around 27E (Figure 7.13).
Growth Three genes associated with growth characteristics were present in cluster “a”
(red): growth hormone inducible-soluble protein, and 2 isoforms of the growth hormone
receptor, indicating a peak in expression right before hatch at 26E (Figure 7.13). Only an
up-regulation of growth hormone releasing hormone was in observed in cluster “c”,
which should not be relevant since this pituitary hormone should not be expressed in
muscle. Thus pectoral muscle mass increased continually during the period of study
(Figure 7.4), and gene expression of genes involved in growth indicated higher stimulus
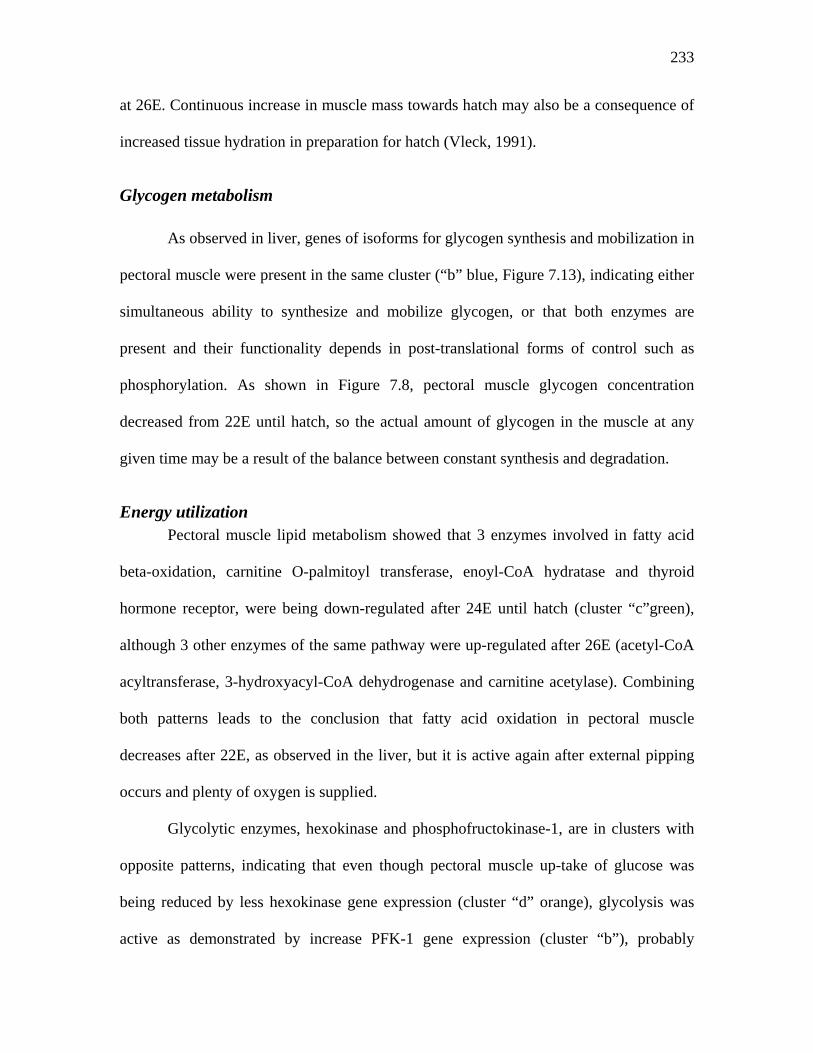
233
at 26E. Continuous increase in muscle mass towards hatch may also be a consequence of
increased tissue hydration in preparation for hatch (Vleck, 1991).
Glycogen metabolism
As observed in liver, genes of isoforms for glycogen synthesis and mobilization in
pectoral muscle were present in the same cluster (“b” blue, Figure 7.13), indicating either
simultaneous ability to synthesize and mobilize glycogen, or that both enzymes are
present and their functionality depends in post-translational forms of control such as
phosphorylation. As shown in Figure 7.8, pectoral muscle glycogen concentration
decreased from 22E until hatch, so the actual amount of glycogen in the muscle at any
given time may be a result of the balance between constant synthesis and degradation.
Energy utilization Pectoral muscle lipid metabolism showed that 3 enzymes involved in fatty acid
beta-oxidation, carnitine O-palmitoyl transferase, enoyl-CoA hydratase and thyroid
hormone receptor, were being down-regulated after 24E until hatch (cluster “c”green),
although 3 other enzymes of the same pathway were up-regulated after 26E (acetyl-CoA
acyltransferase, 3-hydroxyacyl-CoA dehydrogenase and carnitine acetylase). Combining
both patterns leads to the conclusion that fatty acid oxidation in pectoral muscle
decreases after 22E, as observed in the liver, but it is active again after external pipping
occurs and plenty of oxygen is supplied.
Glycolytic enzymes, hexokinase and phosphofructokinase-1, are in clusters with
opposite patterns, indicating that even though pectoral muscle up-take of glucose was
being reduced by less hexokinase gene expression (cluster “d” orange), glycolysis was
active as demonstrated by increase PFK-1 gene expression (cluster “b”), probably
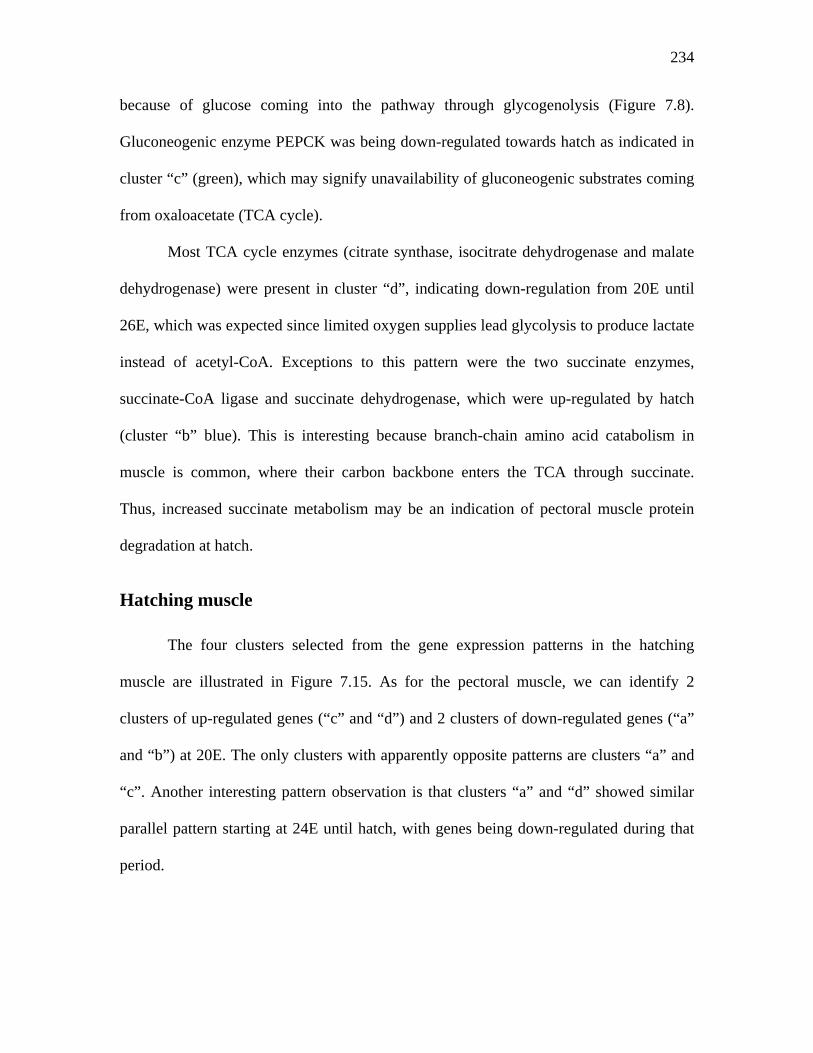
234
because of glucose coming into the pathway through glycogenolysis (Figure 7.8).
Gluconeogenic enzyme PEPCK was being down-regulated towards hatch as indicated in
cluster “c” (green), which may signify unavailability of gluconeogenic substrates coming
from oxaloacetate (TCA cycle).
Most TCA cycle enzymes (citrate synthase, isocitrate dehydrogenase and malate
dehydrogenase) were present in cluster “d”, indicating down-regulation from 20E until
26E, which was expected since limited oxygen supplies lead glycolysis to produce lactate
instead of acetyl-CoA. Exceptions to this pattern were the two succinate enzymes,
succinate-CoA ligase and succinate dehydrogenase, which were up-regulated by hatch
(cluster “b” blue). This is interesting because branch-chain amino acid catabolism in
muscle is common, where their carbon backbone enters the TCA through succinate.
Thus, increased succinate metabolism may be an indication of pectoral muscle protein
degradation at hatch.
Hatching muscle
The four clusters selected from the gene expression patterns in the hatching
muscle are illustrated in Figure 7.15. As for the pectoral muscle, we can identify 2
clusters of up-regulated genes (“c” and “d”) and 2 clusters of down-regulated genes (“a”
and “b”) at 20E. The only clusters with apparently opposite patterns are clusters “a” and
“c”. Another interesting pattern observation is that clusters “a” and “d” showed similar
parallel pattern starting at 24E until hatch, with genes being down-regulated during that
period.
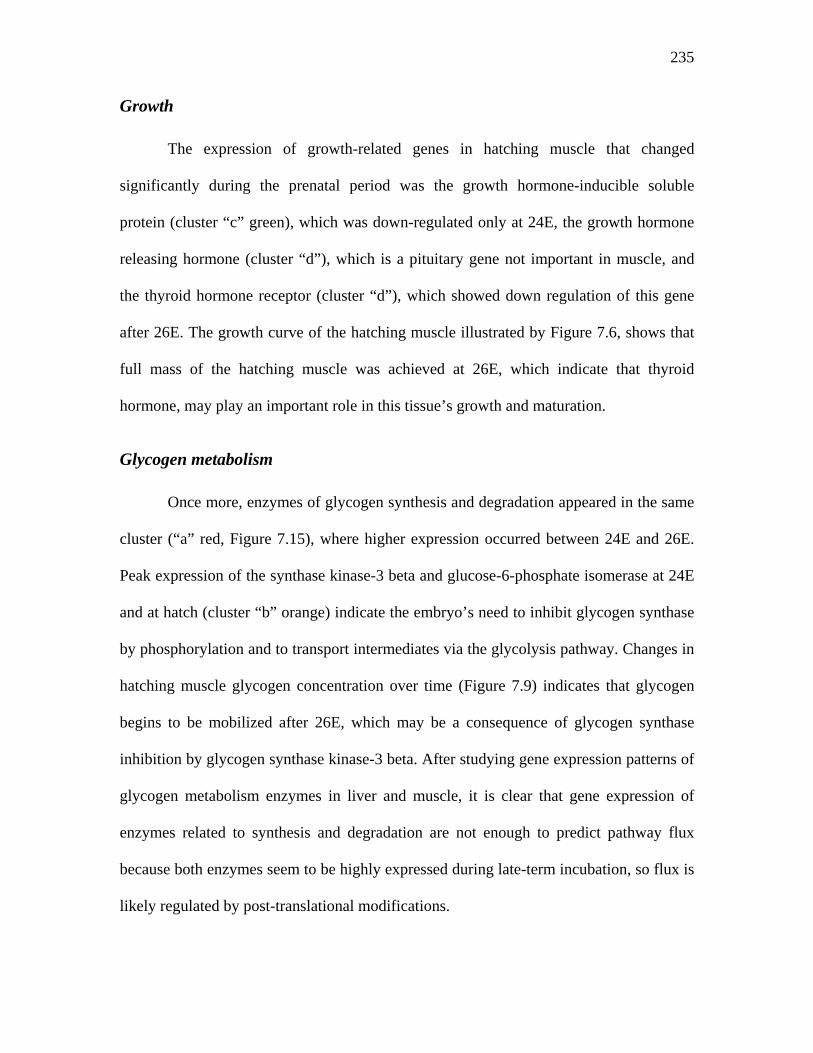
235
Growth
The expression of growth-related genes in hatching muscle that changed
significantly during the prenatal period was the growth hormone-inducible soluble
protein (cluster “c” green), which was down-regulated only at 24E, the growth hormone
releasing hormone (cluster “d”), which is a pituitary gene not important in muscle, and
the thyroid hormone receptor (cluster “d”), which showed down regulation of this gene
after 26E. The growth curve of the hatching muscle illustrated by Figure 7.6, shows that
full mass of the hatching muscle was achieved at 26E, which indicate that thyroid
hormone, may play an important role in this tissue’s growth and maturation.
Glycogen metabolism
Once more, enzymes of glycogen synthesis and degradation appeared in the same
cluster (“a” red, Figure 7.15), where higher expression occurred between 24E and 26E.
Peak expression of the synthase kinase-3 beta and glucose-6-phosphate isomerase at 24E
and at hatch (cluster “b” orange) indicate the embryo’s need to inhibit glycogen synthase
by phosphorylation and to transport intermediates via the glycolysis pathway. Changes in
hatching muscle glycogen concentration over time (Figure 7.9) indicates that glycogen
begins to be mobilized after 26E, which may be a consequence of glycogen synthase
inhibition by glycogen synthase kinase-3 beta. After studying gene expression patterns of
glycogen metabolism enzymes in liver and muscle, it is clear that gene expression of
enzymes related to synthesis and degradation are not enough to predict pathway flux
because both enzymes seem to be highly expressed during late-term incubation, so flux is
likely regulated by post-translational modifications.
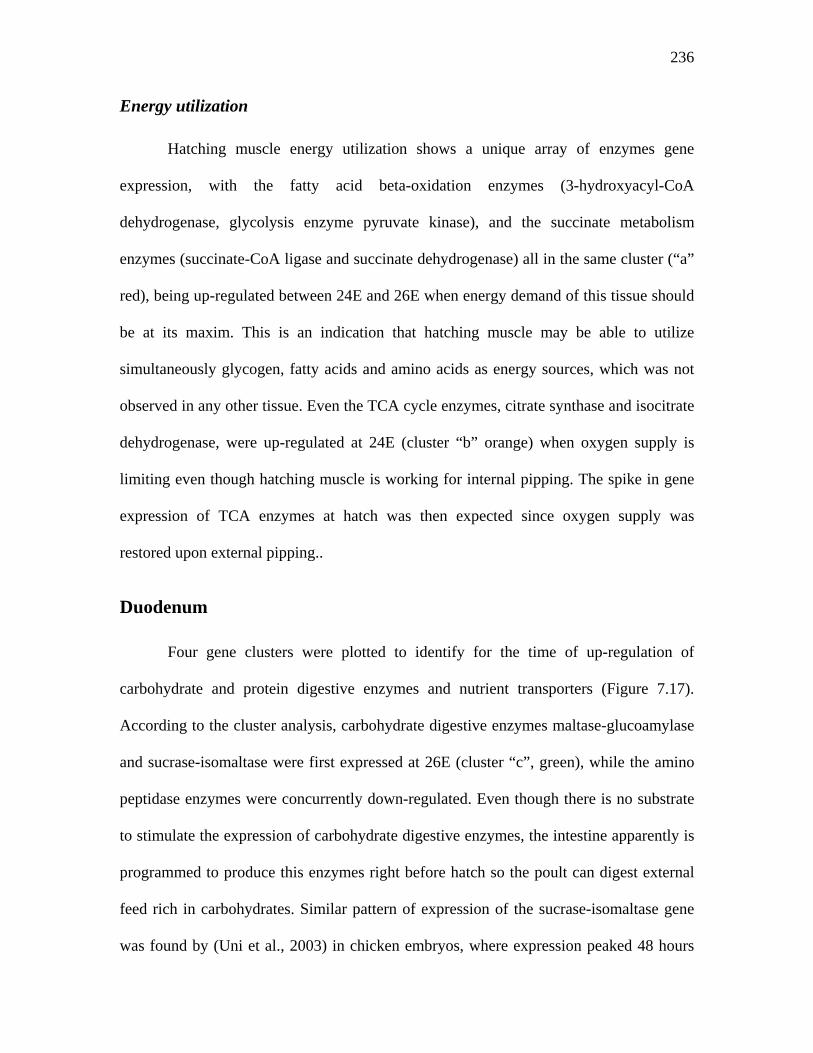
236
Energy utilization
Hatching muscle energy utilization shows a unique array of enzymes gene
expression, with the fatty acid beta-oxidation enzymes (3-hydroxyacyl-CoA
dehydrogenase, glycolysis enzyme pyruvate kinase), and the succinate metabolism
enzymes (succinate-CoA ligase and succinate dehydrogenase) all in the same cluster (“a”
red), being up-regulated between 24E and 26E when energy demand of this tissue should
be at its maxim. This is an indication that hatching muscle may be able to utilize
simultaneously glycogen, fatty acids and amino acids as energy sources, which was not
observed in any other tissue. Even the TCA cycle enzymes, citrate synthase and isocitrate
dehydrogenase, were up-regulated at 24E (cluster “b” orange) when oxygen supply is
limiting even though hatching muscle is working for internal pipping. The spike in gene
expression of TCA enzymes at hatch was then expected since oxygen supply was
restored upon external pipping..
Duodenum
Four gene clusters were plotted to identify for the time of up-regulation of
carbohydrate and protein digestive enzymes and nutrient transporters (Figure 7.17).
According to the cluster analysis, carbohydrate digestive enzymes maltase-glucoamylase
and sucrase-isomaltase were first expressed at 26E (cluster “c”, green), while the amino
peptidase enzymes were concurrently down-regulated. Even though there is no substrate
to stimulate the expression of carbohydrate digestive enzymes, the intestine apparently is
programmed to produce this enzymes right before hatch so the poult can digest external
feed rich in carbohydrates. Similar pattern of expression of the sucrase-isomaltase gene
was found by (Uni et al., 2003) in chicken embryos, where expression peaked 48 hours

237
prior to hatch. Although peptides present in the amniotic fluid justify amino peptidase
gene expression as early as 20E, completion of amnion consumption around 24E may
remove the stimulus for the expression of this enzyme. This AP expression pattern
differed from the pattern found by (Uni et al., 2003) in chicken embryos, where the
expression peaked only 48 hours before hatch (19E).
Nutrient transporters, sodium-glucose co-transporter-1 (SGLT-1) and peptide
transporter-1 (pept-1) were grouped in cluster “d” (orange) showing sharp gene up-
regulation at hatch (Figure 7.17). Van et al. (2005) observed studied PepT-1 gene
expression in turkey embryo peaks between 27E and hatch in an identical pattern as
observed in cluster “d” in this study. This agreement in observations confirms that the
present array results are as precise as the Northern Blots. In comparison to the SGLT-1
expression pattern observed in chicken embryos by Uni et al. (2003), SGLT-1 gene
expression in turkey embryos peak closer to hatch (28E) than in chicken embryos, which
peak 48 hours prior to hatch. This difference in SGLT-1 expression may indicate that the
turkey has delayed capacity to absorbing glucose relative to the chicken. The pattern of
intestinal enzymes described here indicates gut maturation occurring in the 48 hrs prior to
hatch. Moreover, the increase in duodenum mass illustrated by Figure 7.5 may be due to
cell proliferation as well as maturation of existing cells, which agrees with the down-
regulation of the growth inducing genes (growth hormone receptor, insulin-like growth
factor-2 receptor and thyroid hormone receptor) observed herein after 26E (cluster “b”).
Evidently, intestinal enzymes in both chicken and turkey embryos are produced before
hatch so that they can be present by the time of hatch to digest incoming external feed
(Uni et al., 2003).
238
One interesting observation was that turkey genomic DNA showed in the intestine
in cluster “a” (red). This may be an indication of some DNA cross-contamination during
RNA extraction. Moreover, more important is the fact that the pattern observed shows
intensity being significantly reduced in the 48 hours previous to hatch. This reduction
indicates that the ratio between DNA and RNA in intestinal cells was high during
incubation, with prevalence of DNA. Right before hatch the ratio reversed due to high
amounts of RNA produced through gene expression as a consequence of intense
intestinal cell maturation and function as preparation for post-hatch life.
Conclusion
The production of a gene microarray to be utilized to study chicken and turkey
gene expression was successful. Using this array it was possible to identify the pattern of
expression of many key genes of turkey embryo metabolism and development. One
major finding was the indication that the turkey embryo switches from lipid- to
carbohydrate-based metabolism at 22 days of incubation, and that the glycogen
metabolism related enzymes are produced in parallel in liver and muscle.
Based on intestinal gene expression patterns, carbohydrate digestive enzymes start
being produced 48 hours prior to hatch, while nutrient transporter gene expression peaked
at hatch. The approach used in this study could bring substantial contribution to current
knowledge about late-term poultry embryo development.
239
References Chicken genome database. 2004. http://www.tigr.org Accessed June 2004. Christensen, V. L., W. E. Donaldson, K. E. Nestor. 1993. Embryonic viability and
metabolism in turkey lines selected for egg production and growth. Poult Sci 72:829-838.
Donaldson, W. E., V. L. Christensen, and K. K. Krueger. 1991. Effects of stressors on
blood glucose and hepatic glycogen concentrations in turkey poults. Comp Biochem Physiol A 100:945-947.
Eisen, M. B., P. T. Spellman, P. O. Brown, D. Botstein. 1998. Cluster analysis and
display of genome-wide expression patterns. Proc Natl Acad Sci USA 95:14863-14868.
Foye, O. T. 2005. The biochemical and molecular effects of amnionic nutrient
administration, “in ovo feeding” on intestinal development and function and carbohydrate metabolism in turkey embryos and poults. Ph.D. Dissertation. North Carolina State University. Raleigh, NC.
Foye, O. T., Z. Uni, and P. R. Ferket. 2006. Effect of in ovo feeding egg white protein,
beta-hydroxy-beta-methylbutyrate, and carbohydrates on glycogen status and neonatal growth of turkeys. Poult Sci 85:1185-1192.
Garosi, P., C. De Filippo, M. van Erk, P. Rocca-Serra, S. A. Sansone, and R. Elliott.
2005. Defining best practice for microarray analyses in nutrigenomic studies. Br J Nutr 93:425-432.
Gibson, G. 2003. Microarray analysis: genome-scale hypothesis scanning. PLoS Biol
1:E15. Harris, E. D. 2000. Differential PCR and DNA microarrays: the modern era of nutritional
investigations. Nutrition 16:714-715. International Chicken Genome Sequencing Consortium. 2004. Sequence and comparative
analysis of the chicken genome provide unique perspectives on vertebrate evolution. Nature 432:695-716.
John, T. M., J. C. George, and E. T. Moran, Jr. 1987. Pre- and post-hatch ultrastructural
and metabolic changes in the hatching muscle of turkey embryos from antibiotic and glucose treated eggs. Cytobios 49:197-210.
Kietzmann, T., and K. Jungermann 1997. Metabolic zonation of liver parenchyma and its
short-term and long-term regulation. Pages 1-42 in Functional Heterogeneity of Liver Tissue: from cell lineage diversity to sublobular compartment-specific pathogenesis. F. Vidal-Vanaclocha ed. Chapman & Hall, New York, NY.
240
Krebs, H. A. 1972. Some aspects of the regulation of fuel supply in omnivorous animals. Adv Enzyme Regul 10:397-420.
Lamont, S. J. 2006. Perspectives in chicken genetics and genomics. Poult Sci 85:2048-
2049. Moran, E. T., Jr. 2007. Nutrition of the developing embryo and hatchling. Poult Sci
86:1043-1049. Noy, Y., and D. Sklan. 1999. Energy utilization in newly hatched chicks. Poult Sci
78:1750-1756. Romanoff, A. L. 1960. The avian embryo; structural and functional development.
Macmillian, New York, NY. Romanoff, A. L. 1967. Biochemistry of the avian embryo; a quantitative analysis of
prenatal development. Interscience Publishers, New York. SAS Institute. 2005. JMP Version 6 User's Guide. SAS Inst., Cary, NC. SAS Institute. 2007. JMP Genomics Version 3.0 User's Guide. SAS Inst., Cary, NC. Schaal, T., and G. Cherian. 2007. A survey of the hatchability of broiler and Turkey eggs
in the United States from 1985 through 2005. Poult Sci 86:598-600. Smith, R. 2006. Poultry industry must partner with researchers. in Feedstuffs 78(32):8. Spielbauer, B., and F. Stahl. 2005. Impact of microarray technology in nutrition and food
research. Mol Nutr Food Res 49:908-917. Uni, Z., E. Tako, O. Gal-Garber, and D. Sklan. 2003. Morphological, molecular, and
functional changes in the chicken small intestine of the late-term embryo. Poult Sci 82:1747-1754.
Uni, Z., and P. R. Ferket. 2004. Methods for early nutrition and their potential. Worlds
Poult Sci J 60:101-111. USDA. 2007. National agriculture statistic service: livestock & animals.
http://www.nass.usda.gov Accessed June 2007. Van, L., Y. X. Pan, J. R. Bloomquist, K. E. Webb, Jr., and E. A. Wong. 2005.
Developmental regulation of a turkey intestinal peptide transporter (PepT1). Poult Sci 84:75-82.
241
Vleck, D. 1991. Water economy and solute regulation. Pages 252-256 in Egg Incubation: its effects on embryo development in birds and reptiles. D. C. Deeming, and Ferguson, M. W. J. eds. Cambridge University Press, New York, NY.
Wiseman, G. 2002. State of the art and limitations of quantitative polymerase chain
reaction. J AOAC Int 85:792-796. Yadetie, F., A. K. Sandvik, H. Bergum, K. Norsett, and A. Laegreid. 2004. Miniaturized
fluorescent RNA dot blot method for rapid quantitation of gene expression. BMC Biotechnol 4:12.
242
Chapter 8
“Effects of in ovo feeding on late-term turkey embryo growth, intestinal morphology, poult quality, energy status, and their association to differences in gene
expression observed by microarrays”
Abstract
In ovo feeding (IOF) has been demonstrated to enhance the development of digestive
capacity and energy status of late-term turkey embryos, but the effect of IOF on energy
metabolism is not yet clearly understood. An experiment was designed to correlate the
effect of IOF on the growth and energy status of turkey embryos from 22 days of
incubation (E) until hatch with the expression of critical metabolic genes using
microarrays and hatchling quality. Three hundred turkey eggs were divided into 2 groups
with similar egg weight. At 24E one group of eggs was injected with a nutritive solution
containing co-factors of metabolism. At 25E, 26E and 28E (day of hatch) sixteen eggs
from each treatment (IOF and control) were sampled to measure embryo and yolk mass
to calculate embryonic yolk-free body weight (YFBW). Liver, pectoral muscle, hatching
muscle, duodenum and ileum were collected from the same embryos for microarray
analysis. Liver, pectoral and hatching muscles were also sampled for glycogen analysis.
Poult quality scores and relative shank asymmetry were calculated from 35 poults from
each treatment at hatch. The IOF embryos were heavier and had less pectoral muscle
glycogen than controls at 25E, but there were no treatment differences at hatch. IOF
poults had less glycogen in the liver at hatch, but 15 points higher quality scores and
more symmetric legs than control poults. Evaluation of gene expression by microarray
revealed that IOF reduced energetic stress in the liver at 25E and 26E, enhanced hatching
243
muscle maturation, and reduced energy metabolism in the intestine of in comparison to
controls. IOF of metabolic co-factors changed embryonic development, favoring skeleton
maturation stead of intestinal metabolism, resulting in improved poult quality at hatch.
Introduction
Despite great advances in growth performance (Havenstein et al., 2007) turkey
hatchability has not improved much above 80% of fertile during the last 20 years (Schaal
and Cherian, 2007). Embryonic mortality during the last stages of incubation is a
significant problem of poult production (Christensen et al., 1993; Foye, 2005), in addition
to weak poults, starve-outs and flip-over poults (Noble et al., 1999; Christensen et al.,
2003). These depressed conditions have been associated to poult low energy status
(Donaldson, 1995; Christensen et al., 1999).
It has been documented that poultry embryos undergo several shifts in
metabolism during incubation and early development (Romanoff, 1960; Romanoff, 1967;
Moran, 2007), but little is known about when these metabolic shifts occur and how they
can be manipulated to improve poult quality. A new technology called in ovo feeding
(IOF) may provide a means to improve the nutrition and energy status of turkeys before,
during, and after hatch (Uni and Ferket, 2004; Ferket et al., 2005). Turkey embryos that
struggle to hatch are good candidates for IOF technology. In ovo feeding involves
injecting a nutritive solution into the amnion, which will be orally consumed by the
embryo before hatching (Uni and Ferket, 2003). IOF has been demonstrated to enhance
energy status (Uni et al., 2005; Foye et al., 2006), promote gastrointestinal maturation
through improvements in morphology and mucus production (Tako et al., 2004; Smirnov
et al., 2006; Uni et al., 2006), and to alter gene expression of intestinal enzymes and
244
nutrient transporters (Tako et al., 2005; Foye et al., 2006). Because many of these
changes are not always predictable, advanced molecular techniques and poult quality
assessments may help explain the potential of IOF.
Microarrays were used in this study to identify changes in metabolism by gene
expression after IOF of turkey embryos. Microarrays are powerful tools that capable of
measuring thousands of mRNA populations in a single experimental sample (Wolfinger
et al., 2001; Garosi et al., 2005). Using focused microarrays, slides or chips can be
customized by robotically spotting large numbers of known gene sequences, and then
hybridizing them with two cDNA populations labeled with different fluorescent dyes that
can be scanned for color intensity and produce data for statistical analysis (Spielbauer
and Stahl, 2005). This approach allows high throughput gene expression profile
production that would not be impossible to obtain by other techniques, like real-time PCR
or Northern Blot (Spielbauer and Stahl, 2005). Page et al. (2003) recommend the use of
microarrays in nutritional studies because it can lead to major contributions to nutritional
research.
Poult quality is usually assessed by measuring hatchability, chick vitality and
uniformity (Boerjan, 2006). Poult quality assessment can also be very subjective, often
involving the visual observation by an experienced hatchery manager. The need for more
objective methods to assess the quality of hatchlings motivated different research groups
to develop scoring methods. One method was an adaptation of the Apgar score for
newborn children, the Pasgar score (Boerjan, 2002). This scoring method is based on
morphological criteria like reflex, naval, legs, beak and yolk condition, where the chick
starts with a score of 10 and then loses points for each abnormality observed (Boerjan,
245
2006). Another method was developed by Tona et al. (2003), in which physical
conditions such as activity, feathering, eyes, leg conformation, aspect of naval area and
yolk absorption are given different scoring weights, depending on their importance to the
survival of the chick and the severity of any abnormality. Points are accumulated with
maximum score of 100, which would be a perfect chick (Tona et al., 2003). These
scoring systems may also be used to assess the quality of turkey poults.
Leg abnormalities are of concern in turkey production due to its high recurrence
in fast growing heavy flocks (Hester et al., 1987). Many important leg integrity features
are defined very early in life and may be a consequence of nutrient usage during
incubation and brooding (Simsa and Ornan, 2007). A method to evaluate leg
conformation in chicks and poults was proposed based on symmetry between both legs
(Moller et al., 1995; Yalcin et al., 2003). Leg relative asymmetry (RA) can be calculated
based on measurements performed on chick shank lengths at hatch (Yalcin et al., 2005).
Perfect symmetry will be RA = 0, with values deviating from this number as asymmetry
is found.
This experiment was conducted to evaluate the effects of IOF on embryonic
development, energy status, gut maturation and poult quality, comparing differences in
these parameters with changes in gene expression assessed by microarrays.
246
Materials and methods
Incubation and sampling
Three hundred fertilized turkey eggs from first-cycle Nicholas breeder hens at 7
weeks of lay were obtained from the a commercial farm1 from the first egg collection (8
am) on the day they were laid. The eggs were transported to the North Carolina State
University Turkey Research Unit2, weighed and then divided into 6 groups of eggs with
similar weight distribution (averaging 85.2g±15). The eggs were incubated in a
Jamesway 252 incubator set to 37.8o C and 60% RH. At 20 days of incubation (E), all
eggs were candled to remove infertile eggs and dead embryos, and each egg group was
assigned to one of 6 treatments, corresponding to IOF or control eggs and three sampling
times (25E, 26E and 28E). IOF treatment eggs were manually injected with 0.4 mL of
nutritive solution containing metabolic co-factors3 from the blunt end of the egg into the
amnion at 24E. Control eggs were kept outside the incubator for the same amount of time
as IOF eggs (20 min). Sixteen eggs from each group (IOF and control) were sampled on
days 25E, 26E and at day of hatch (28E). Sample eggs were opened at the blunt end of
the egg using surgical scissors, and the embryos were extracted from the shell and
euthanized by cervical dislocation. Subsequently, the embryos were separated from the
yolk sac and had their individual weights recorded. Liver, duodenum, ileum, pectoral
muscle, and hatching muscle were removed from each embryo (480 total), and about 200
mg samples of each tissue were immediately placed in labeled 7 mL scintillation vials
1 Talley Farms, Stanfield, NC 2 Lake Wheeler Field Laboratory, Raleigh, NC 3 proprietary formulation of Pfizer-Embrex, Durham, NC and North Carolina State University, Raleigh, NC (see Appendix 4, Table A4.2 for details)
247
(Fisher Scientific, Pittsburg, PA) containing 2 mL of RNA Later4 kept at room
temperature. The remaining of liver and muscle tissues were immediately placed on ice,
and then stored at -20C for subsequent glycogen analysis. RNA tissue samples were
stored at -20C until extraction. All sampling procedures were performed in a clean
laboratory facility with surfaces and instruments wiped with RNAseZap decontamination
wipes4. To correlate gene expression data with poult energy status, liver, pectoral and
hatching muscle samples were analyzed to determine glycogen concentration using the
modified iodine binding method described by Foye et al. (2006).
RNA extraction and quality control
The tubes containing tissue samples were thawed and 100 mg of tissue was
weighed and placed in a 2 mL microcentrifuge tube filled with 1 mL of TRI Reagent5.
Muscle sample tubes were also filled with 0.3 mL of 0.1 mm glass beads to improve
disintegration. The tubes were shaken in a 45 tube block using a Mini-Beadbeater-966 for
1 minute or until tissue samples were completely dissolved. When more than one cycle
was needed, the block was placed on ice for one minute to avoid sample overheating.
Homogenates were transferred from the tubes containing beads to new tubes, and each of
these tubes received 300 µl of chloroform and was vortexed for 10 seconds. These
homogenate tubes were then centrifuged at 12,000g for 5 minutes at 4C to separate
phases. The top aqueous phase was carefully transferred to a 1.5 mL microcentrifuge tube
using a 1000 µl micropipette. Each tube received 500 µl of molecular biology grade
100% ethanol, inverted 5 times, and placed in a -20C freezer for 30 minutes. After that,
4 Ambion, Inc., Austin, TX 5 Molecular Research Center, Inc., Cincinnati, OH 6 Biospec, Inc., Bartlesville, OK

248
the samples were centrifuged at 12,000g for 15 minutes and 4C to form RNA pellets. The
supernatant was discarded and the RNA pellets were washed with 500 µl of 75% ethanol
and centrifuged again at 12,000g for 10 min at 4C. The ethanol was discarded and the
pellets were let to dry for 5 minutes under the hood. Air-dried pellets were resuspended in
30 µl of nuclease-free water. Extracted RNAs were quantified using a ND-1000
spectrophotometer7 and RNA quality was assessed by running samples on an Experion
Automated Electrophoresis Station8 using standard sensitivity chips. Four samples from
the same tissue, treatment, and day of incubation were pooled together in one tube and
adjusted to 0.5 µg/µl of concentration. These tubes containing RNA were finally stored in
a -80C freezer until assessed by microarray analysis.
Microarray manufacturing
A focused microarray customized for gene high replication number was designed
to contain specifically chosen long oligonucleotides. Seventy base-pair oligonucleotides
(oligos) were designed for 320 unique gene sequences selected from the chicken genome
(International Chicken Sequencing Consortium, 2004), so the same array would serve
several research groups at North Carolina State University. The gene list included 41
genes from carbohydrate metabolism (glycolysis, gluconeogenesis, TCA and pentose
phosphate pathways), 13 genes from glycogenesis and glycogenolysis pathways, 11
genes from lipid metabolism, 18 genes from hormone related metabolism, 7 intestinal
enzymes and nutrient transporter genes, 120 genes related to cardiovascular and blood
system development, and 84 immunity related genes. The list also included 2
housekeeping genes (GAPDH and chEF2), one plant (atCAB2-arapdopsis) and one 7 NanoDrop Technologies, Inc., Wilmington, DE 8 Biorad Laboratories, Hercules, CA
249
bacterial gene (chBACT), and chicken and turkey genomic DNA, with the goal to serve
as internal controls. Oligos were manufactured by Operon Biotechnologies, Inc.9 and
obtained in a 384 well plate where each of 32010 wells corresponded to one gene and had
their position documented. Plate oligos were resuspended in array spotting solution and
printed (spotted) on UltraGAPSTM Amino-Silane Coated Slides11 to produce all the slides
used in this study. The slides were printed on a VersArray Chipwriter Compact Arrayer12
using 4 pins.
A test scanned image of a slide hybridized with Syto 61 fluorescent dye can be
seen on Figure 8.1. Each gene was spotted 3 times (side-by-side) in the same grid, and
grids were replicated 4 times on each slide; so each gene was spotted a total of 12 times
per array (technical replicates) (Figure 8.1). The array printer software generated a spot
ID file used to produce the annotation file for this array. After printed, the slides were let
to dry for 24 hours in the printer and then the oligos were attached to the slide surface on
a CL-1000 ultraviolet crosslinker (UVP, Inc., Upland, CA) set to 6000 x 100 µJ/cm2.
Slides were stored on a dust-free dehumidifier chamber until used.
9 Operon Biotechnologies, Inc., Germantown, MD 10 Complete list of genes printed on this array is available at Appendix 2 11 Corning, Inc., Acton, MA 12 Biorad, Inc., Waterloo, Ontario, Canada
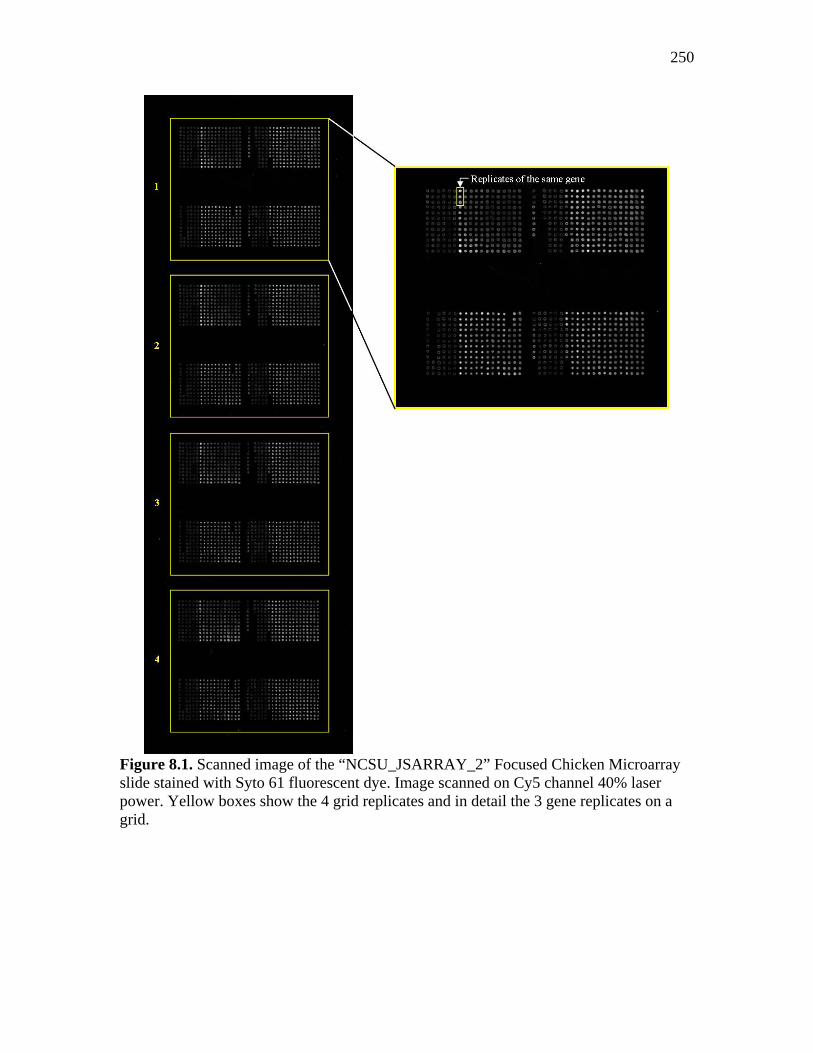
250
Figure 8.1. Scanned image of the “NCSU_JSARRAY_2” Focused Chicken Microarray slide stained with Syto 61 fluorescent dye. Image scanned on Cy5 channel 40% laser power. Yellow boxes show the 4 grid replicates and in detail the 3 gene replicates on a grid.
251
Sample labeling
Tissue RNA pooled samples were used to produce cydye labeled cDNA using the
indirect labeling technique. The ChipShotTM Indirect Labeling and Clean-up System13 kit
was used to produce aminoallyl-cDNA, which was labeled either with Cy3 or Cy5
fluorescent dye14 according to the experimental design. Samples from each treatment and
day of incubation combination were labeled twice with each cydye using different pools
of RNA (biological replicates). All laboratory protocols were followed as recommended
by manufacturer manuals.
Hybridization and image scanning
Labeled cDNA from two distinct treatment samples were mixed, dried and
resuspended in hybridization solution. The cDNA mix was then applied to a pre-
hybridized slide covered with a pre-cleaned glass coverslip15, and hybridized overnight.
The Pronto Plus! Microarray Hybridization Kit16 was used for hybridization, following
their manual recommendations. The same procedure was repeated with all sample pairs
according to the experimental design, caring that samples that were be hybridized
together were also labeled together. Microarray slides were scanned on a ScanArray GX
PLUS Microarray Scanner17 set to 65% laser power. All sample and slide manipulations
from labeling until slide scanning were performed protecting them from light.
13 Promega, Madison, WI 14 Amersham Biosciences Corp., Piscataway, NJ 15 Lifterslip, Portsmouth, NH 16 Corning, Inc., Acton, MA 17 PerkinElmer Life and Analytical Sciences, Shelton, CT
252
Data processing, Normalization and statistical analysis
Generated data files were converted into image intensity raw data files for each slide and
dye combination using ScanAlyze Software (Eisen et al., 1998). Raw data files were
joined, transformed to a log2 base and analyzed by JMP Genomics (SAS Institute, 2007).
The log2-transformed data for all spot measures were subjected to lowess18 normalization
The experimental design was an complete interwoven loop design (Garosi et al., 2005).
Differences in gene expression between IOF and control poults
Array data was analyzed by mixed ANOVA according to the model:
Y = μ + IOF + E +IOF*E+ Dye + Hyb + e,
with in ovo feeding (IOF), day of incubation (E), in ovo feeding and day of incubation
interaction (IOF*E), and cydye (Dye) as fixed effects. Hybridization batch (Hyb) was
added as a random effect. Log2-transformed mean intensities were tested by False
Discovery Rate (FDR) (P<0.01) (Yang and Speed, 2003). Analysis output was used to
create volcano plots.
Embryonic growth, glycogen concentration and poult quality statistical
analysis
Embryonic growth, glycogen concentration, poult quality scores and leg RA had
the same experimental design, which was completely randomized. The analysis was done
by fit model procedure in JMP (SAS Institute. 2005), according to the model:
Y = μ + IOF +Age + IOF X Age + e,
18 locally weighted scatterplot smoothing
253
where in ovo feeding (IOF), age (Age) and IOF‐Age interaction were fixed effects.
Treatment means were compared by t-student test (P<0.05).
Results and discussion
Embryonic and yolk sac weights were used to calculate embryonic yolk-free body
weight (YFBW). There were no differences between IOF treatments on yolk weights at
any of the studied days of incubation, with yolk averaging 14.84g (±2.98), 13.32 (±2.93)
and 5.67g (±2.24) at 25E, 26E and 28E (hatch), respectively. YFBW of embryos from
IOF and control embryos were plotted and shown on Figure 8.2. IOF embryos had
heavier YFBW than controls 24 hours after receiving IOF (25E), but they had minimal
weight gain during the following 24 hours, resulting in similar mass as the controls at
hatch. There was no need to correct embryonic mass by egg weight because egg weight
distribution was randomized at 20E, so there were no statistical differences in egg weight
between treatments. The apparent increase in YFBW followed by a period of attenuated
growth rate of IOF poults could be due to several reasons, including insufficient nutrients
to support growth or some uncontrolled issue with incubation. Because treatment
differences in embryo size were observed at 25E, treatment differences in gene
expression were also expected, as discussed later. At 25E, 28% of eggs exhibited
internal-pipping, whereas at 26E 31% of the eggs achieved internal-pipping and 59% of
eggs were external pipping. No treatment effects were observed on the proportion of pips,
at either 25E or 26E.
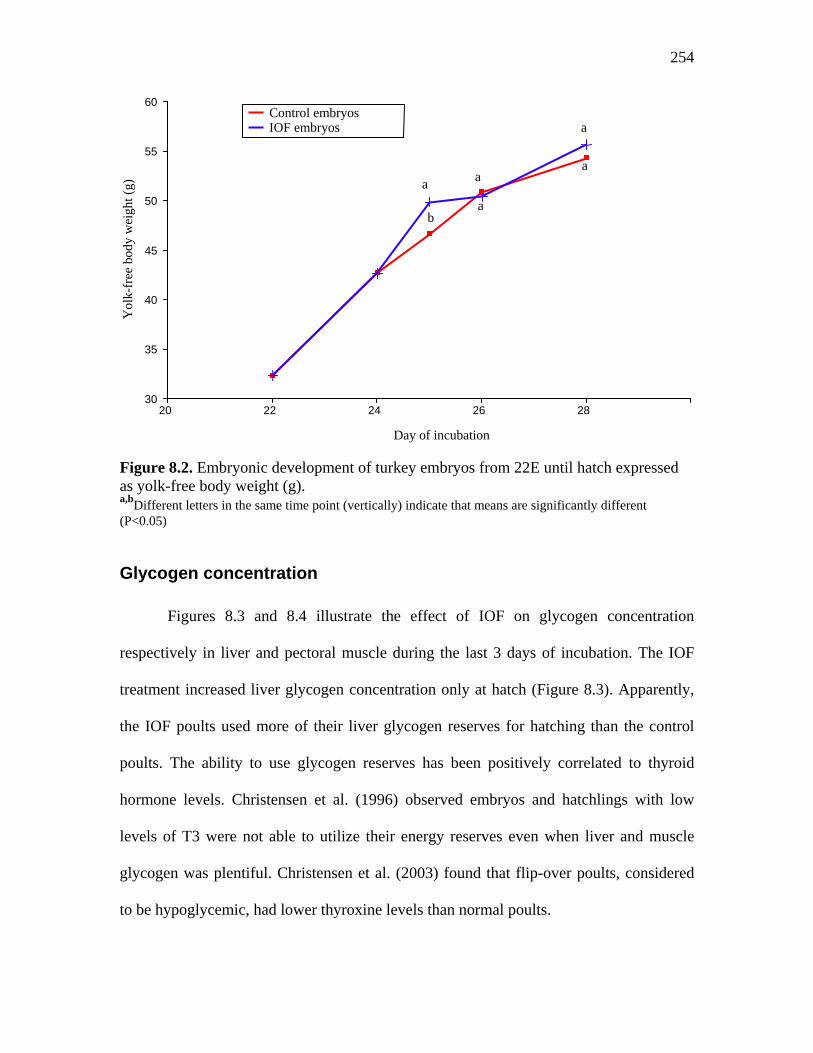
254
Figure 8.2. Embryonic development of turkey embryos from 22E until hatch expressed as yolk-free body weight (g). a,bDifferent letters in the same time point (vertically) indicate that means are significantly different (P<0.05)
Glycogen concentration
Figures 8.3 and 8.4 illustrate the effect of IOF on glycogen concentration
respectively in liver and pectoral muscle during the last 3 days of incubation. The IOF
treatment increased liver glycogen concentration only at hatch (Figure 8.3). Apparently,
the IOF poults used more of their liver glycogen reserves for hatching than the control
poults. The ability to use glycogen reserves has been positively correlated to thyroid
hormone levels. Christensen et al. (1996) observed embryos and hatchlings with low
levels of T3 were not able to utilize their energy reserves even when liver and muscle
glycogen was plentiful. Christensen et al. (2003) found that flip-over poults, considered
to be hypoglycemic, had lower thyroxine levels than normal poults.
60 Y
olk-
free
bod
y w
eigh
t (g)
30
35
40
45
50
55
20 22 24 26 28 Day of incubation
Control embryosIOF embryos
a
b
a
a
a
a
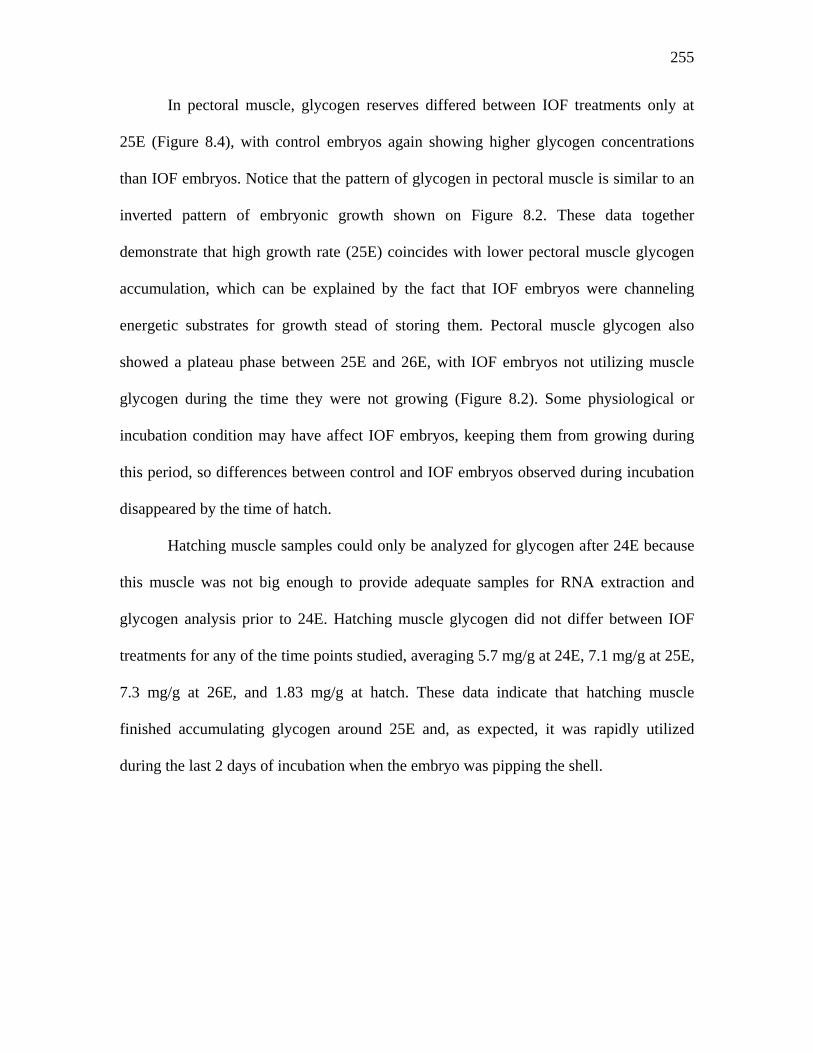
255
In pectoral muscle, glycogen reserves differed between IOF treatments only at
25E (Figure 8.4), with control embryos again showing higher glycogen concentrations
than IOF embryos. Notice that the pattern of glycogen in pectoral muscle is similar to an
inverted pattern of embryonic growth shown on Figure 8.2. These data together
demonstrate that high growth rate (25E) coincides with lower pectoral muscle glycogen
accumulation, which can be explained by the fact that IOF embryos were channeling
energetic substrates for growth stead of storing them. Pectoral muscle glycogen also
showed a plateau phase between 25E and 26E, with IOF embryos not utilizing muscle
glycogen during the time they were not growing (Figure 8.2). Some physiological or
incubation condition may have affect IOF embryos, keeping them from growing during
this period, so differences between control and IOF embryos observed during incubation
disappeared by the time of hatch.
Hatching muscle samples could only be analyzed for glycogen after 24E because
this muscle was not big enough to provide adequate samples for RNA extraction and
glycogen analysis prior to 24E. Hatching muscle glycogen did not differ between IOF
treatments for any of the time points studied, averaging 5.7 mg/g at 24E, 7.1 mg/g at 25E,
7.3 mg/g at 26E, and 1.83 mg/g at hatch. These data indicate that hatching muscle
finished accumulating glycogen around 25E and, as expected, it was rapidly utilized
during the last 2 days of incubation when the embryo was pipping the shell.
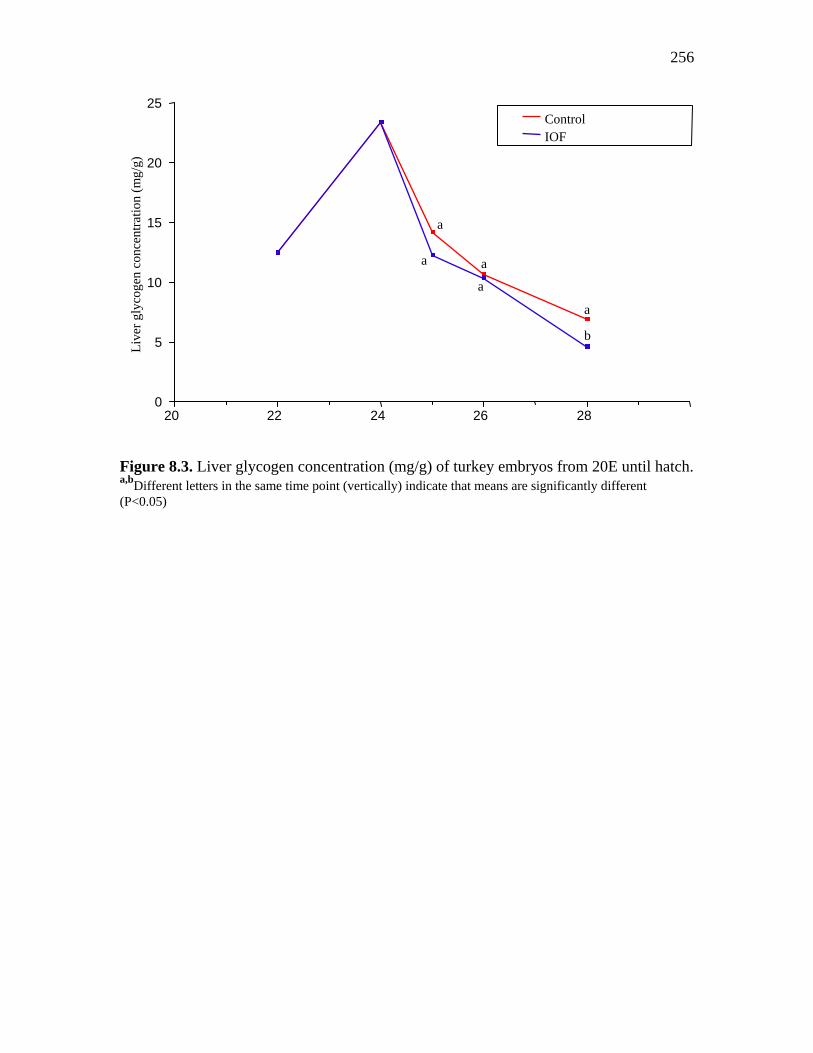
256
Figure 8.3. Liver glycogen concentration (mg/g) of turkey embryos from 20E until hatch. a,bDifferent letters in the same time point (vertically) indicate that means are significantly different (P<0.05)
0
5
10
15
20
25 Li
ver g
lyco
gen
conc
entra
tion
(mg/
g)
20 22 24 26 28
Control IOF
a
b
a
a
a
a
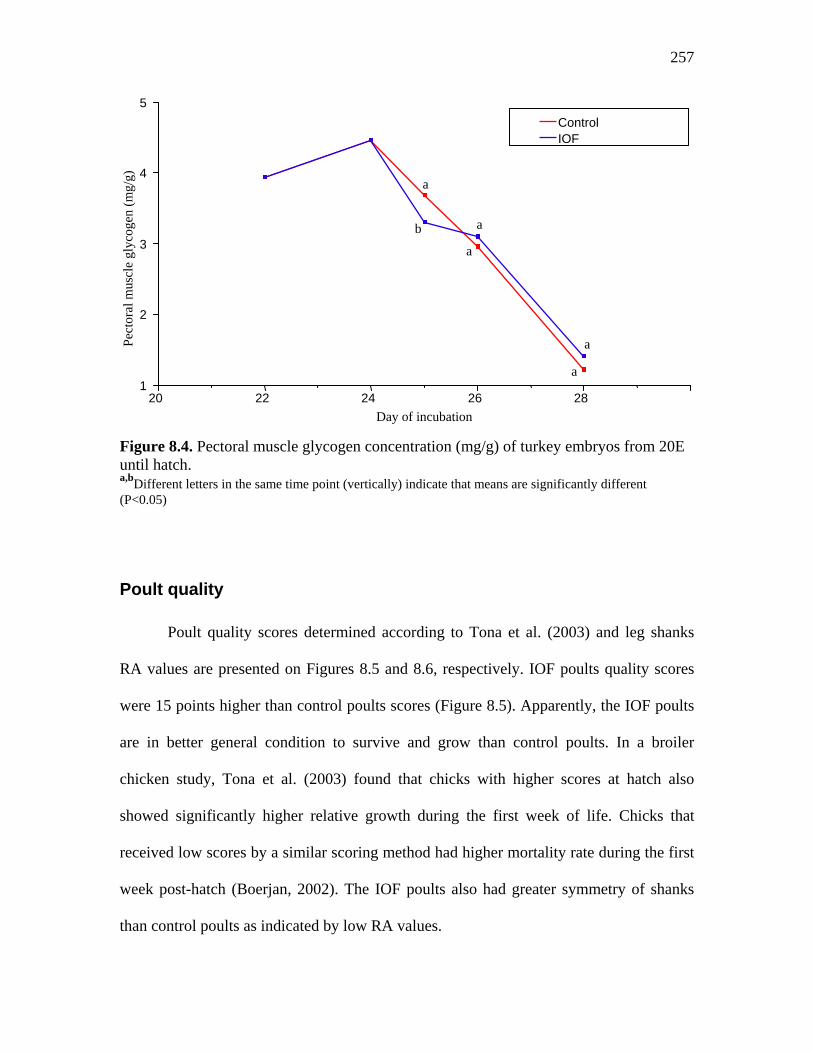
257
Figure 8.4. Pectoral muscle glycogen concentration (mg/g) of turkey embryos from 20E until hatch. a,bDifferent letters in the same time point (vertically) indicate that means are significantly different (P<0.05)
Poult quality
Poult quality scores determined according to Tona et al. (2003) and leg shanks
RA values are presented on Figures 8.5 and 8.6, respectively. IOF poults quality scores
were 15 points higher than control poults scores (Figure 8.5). Apparently, the IOF poults
are in better general condition to survive and grow than control poults. In a broiler
chicken study, Tona et al. (2003) found that chicks with higher scores at hatch also
showed significantly higher relative growth during the first week of life. Chicks that
received low scores by a similar scoring method had higher mortality rate during the first
week post-hatch (Boerjan, 2002). The IOF poults also had greater symmetry of shanks
than control poults as indicated by low RA values.
1
2
3
4
5 Pe
ctor
al m
uscl
e gl
ycog
en (m
g/g)
20 22 24 26 28
Control IOF
a
a
a
a
a
b
Day of incubation
258
According to Simsa and Ornan (2007), long bone formation in turkeys starts with
cartilaginous elements that can be found at 11E. At 15E ossification of the skeletal
elements starts but it is not completed until 7d post-hatch. During this period, ossification
of the skeleton formed during incubation occurs simultaneously with fast bone growth at
the growth plate (Simsa and Ornan, 2007). Calcification of the cartilaginous skeleton is
promoted by dissolution of mammary knobs adjacent to the choriallantois-shell
membrane interface, mobilizing great amounts of calcium into circulation right before
hatch. Even during the period from hatch until placement, ossification continues using
calcium from calcium-enriched lipid granules present in the internalized yolk sac (Moran,
2007). Thus, symmetry of shanks may signify better nutrient utilization during cartilage
formation and ossification in ovo, which will reduce the animal’s chances to develop leg
problems later in life. More studies need to be done to confirm this hypothesis.
Figure 8.5. Poult quality scores of in ovo fed and control turkey poults at hatch. A,BTreatment bars with different letters are statistically different (P<0.05)
B
A
50.00
55.00
60.00
65.00
70.00
75.00
80.00
Control IOF
Treatments
Scor
e
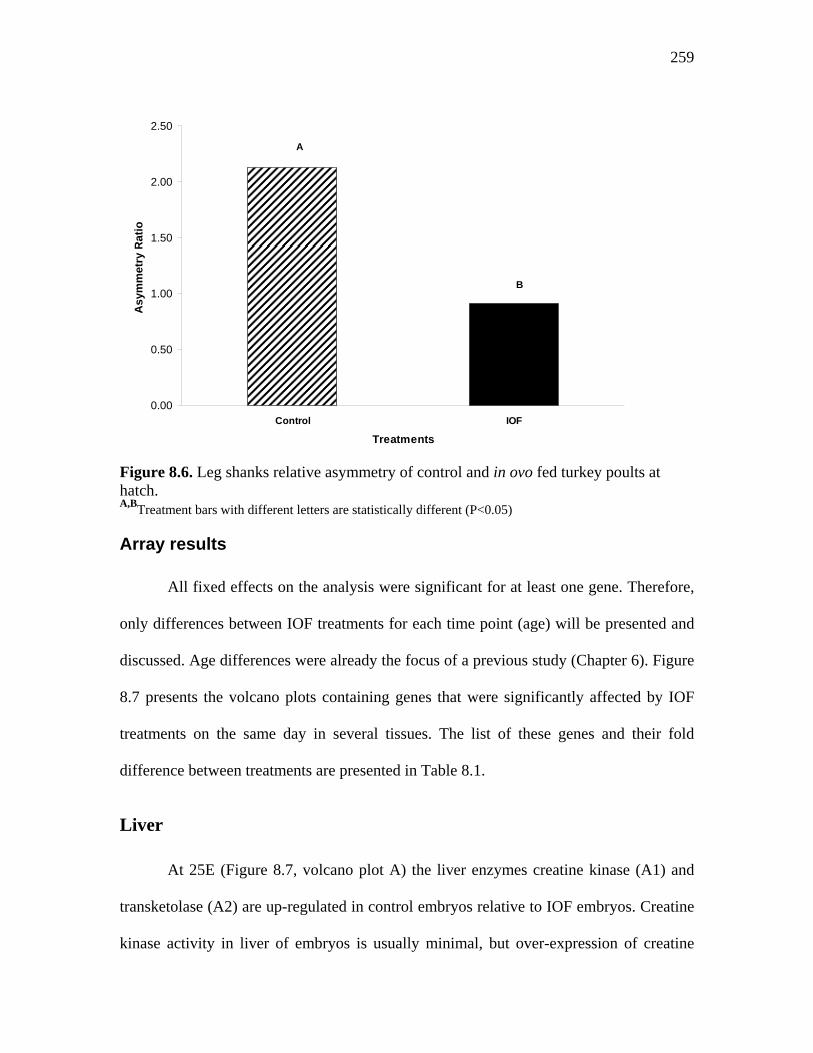
259
Figure 8.6. Leg shanks relative asymmetry of control and in ovo fed turkey poults at hatch. A,BTreatment bars with different letters are statistically different (P<0.05)
Array results
All fixed effects on the analysis were significant for at least one gene. Therefore,
only differences between IOF treatments for each time point (age) will be presented and
discussed. Age differences were already the focus of a previous study (Chapter 6). Figure
8.7 presents the volcano plots containing genes that were significantly affected by IOF
treatments on the same day in several tissues. The list of these genes and their fold
difference between treatments are presented in Table 8.1.
Liver
At 25E (Figure 8.7, volcano plot A) the liver enzymes creatine kinase (A1) and
transketolase (A2) are up-regulated in control embryos relative to IOF embryos. Creatine
kinase activity in liver of embryos is usually minimal, but over-expression of creatine
B
A
0.00
0.50
1.00
1.50
2.00
2.50
Control IOF
Treatments
Asy
mm
etry
Rat
io
260
kinase isozymes in the liver have been reported as a way to stabilize energy metabolism
under low oxygen stress and after metabolic challenges (Meffert et al., 2005).
Apparently, the control embryos were more energetically challenged at 25E than the IOF
embryos. Transketolase is an enzyme that connects pentose phosphate pathway to
glycolysis, usually to bring 5 carbon substrates (pentoses) to glucose (hexose). The higher
expression of transketolase among control embryos at 25E may be an indication of their
need to increase efficiency of glycolysis by gathering energetic substrates from other
pathways. Evidently, the IOF treatment help the embryo deal with the energetic challenge
at the time of internal pipping.
At 26E (Figure 8.7.7, volcano plot B), the glycolytic enzyme glyceraldehydes-3-
phosphate (B3) was significantly up-regulated among IOF embryos relative to the
controls (Table 8.1). The IOF embryos appeared to be able to move substrates up-and
down the glycolysis pathway more effectively than control embryos. Gluconeogenesis is
the major embryonic energetic pathway in the liver during pre-pipping embryonic energy
storage, to produce glycogen for hatching (Donaldson, 1995; Keirs et al., 2002; Moran,
2007), and compounds will need to pass through liver this enzyme to produce glucose.
The other affected enzyme gene was the heat-shock protein-1 (HSP1) (B4). This gene is
expressed in situations of distress, including heat or cold embryo distress (Leandro et al.,
2004). Heat shock protein gene expression is induced during heat and many other distress
conditions in poultry (Givisiez et al., 2001; Rivera et al., 2005). The fact that HSP1 was
more highly expressed in the livers of control embryo than IOF embryos (Table 8.1)
indicating that the control embryos may have suffered greater distress during this period
of incubation, which was alleviated by the IOF treatment.
261
Pectoral muscle
The only gene in pectoral muscle that was significantly affected at day of hatch
(28E) by the IOF treatment was tropoelastin (5) (Figure 8.7, volcano plot C). This gene
was more highly expressed in muscle of control embryo than in IOF embryos (Table 7.1).
Tropoelastin is the precursor of elastin fibers that are part of muscle cell matrix.
According to Parks et al. (1988), this gene is highly expressed during a specific stage of
embryonic development, with lower levels of expression in mature animals. Higher
expression on control embryos may indicate a distinct pattern on elastin formation on
IOF embryos when compared to the controls. More research needs to be done to confirm
this finding and to determine the consequences of this differential in tropoelastin gene
expression.
Hatching muscle
Hatching muscle gene expression was affected by IOF at two time points. At 25E
(Figure 8.7, volcano plot D), UDP-glucose dehydrogenase (6) was up-regulated in IOF
embryos, indicating the production of glycosaminoglycans, involved in cell
osmoregulation, causing extra-cellular space filling with water (Wormbase, 2007). This
may indicate advanced hatching muscle maturation in IOF embryos, as hatching muscle
hypertrophy must happen prior to hatch (John et al. 1987). Glycogen branching enzyme
was the other gene that was up-regulated at 25E among control embryos (7). Up-
regulation of this gene may lead to more branching of glycogen granules; however the
results of glycogen analysis showed no actual difference in glycogen concentration
between treatments.
262
At 26E (Figure 8.7, volcano plot E), the tyrosinase gene (8) was expressed at
higher levels in the hatching muscle of IOF embryos than controls (Table 8.1).
Tyrosinase enzyme activity has been shown to stabilize protein systems by forming
additional covalent bonds between tyrosine residues in muscle fiber proteins (Lantto et
al., 2007), so elevated expression of this gene may indicate enhanced muscle structure in
the hatching muscle of IOF-treated embryos, and this response continued at 28E (Figure
8.7, volcano plot F) (Table 8.1).
The other gene significantly affected by IOF at 26E and 28E was HOXA3 (9 and
11, respectively). HOXA3 is a transcription factor whose gene expression is an indicator
of whole tissue gene expression (Kameda et al., 2004). This gene was up-regulated in the
hatching muscle of 26E control embryos, but it was up-regulated in hatching muscle of
IOF embryos at hatch (28E). This difference in response between control- and IOF-
treated embryos demonstrate the differences in hatching muscle general metabolism,
where increased gene expression that occurs during hatching in control embryos only
happened after hatch in IOF embryos. Thus the outcome of both treatments was the same
as far as hatching muscle function. However, IOF treatment apparently increased
hatching muscle hypertrophy and muscle fiber structuring at hatch, but it delayed the
peak in general gene expression.
Duodenum
Intestinal tissues are expected to undergo many changes during late-term
incubation in preparation for external feeding. Four genes in the duodenum were found to
be expressed differently among control and IOF-treated embryos.
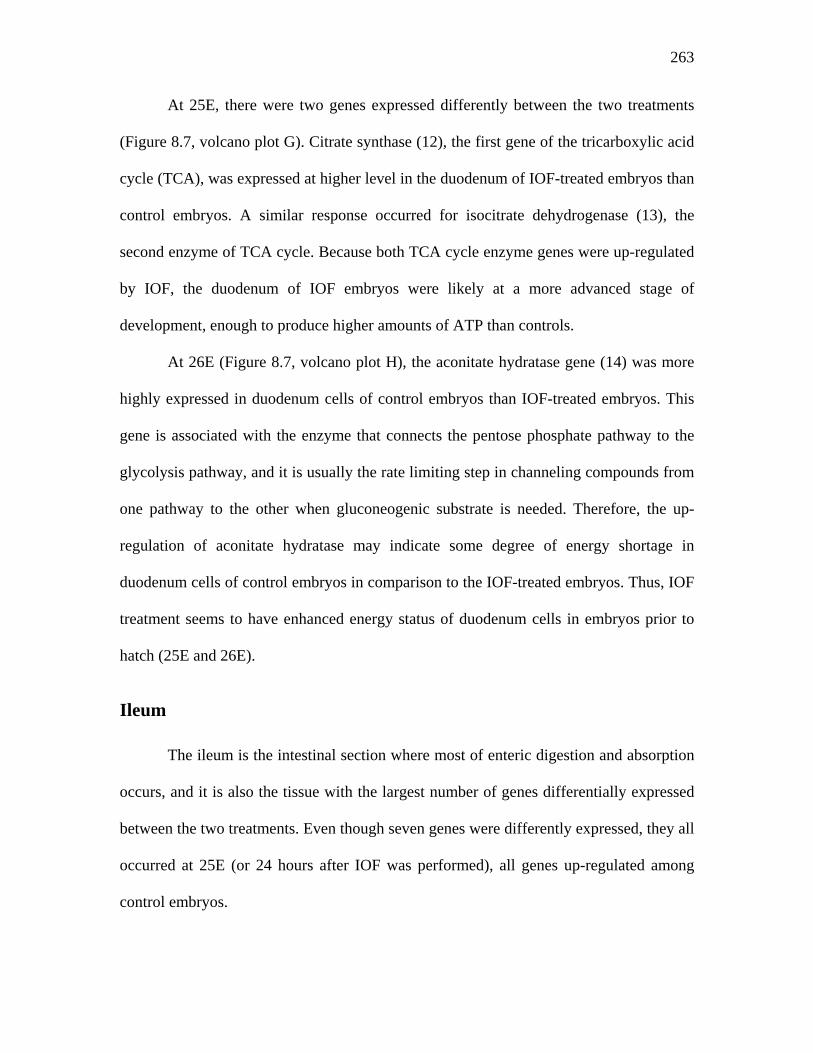
263
At 25E, there were two genes expressed differently between the two treatments
(Figure 8.7, volcano plot G). Citrate synthase (12), the first gene of the tricarboxylic acid
cycle (TCA), was expressed at higher level in the duodenum of IOF-treated embryos than
control embryos. A similar response occurred for isocitrate dehydrogenase (13), the
second enzyme of TCA cycle. Because both TCA cycle enzyme genes were up-regulated
by IOF, the duodenum of IOF embryos were likely at a more advanced stage of
development, enough to produce higher amounts of ATP than controls.
At 26E (Figure 8.7, volcano plot H), the aconitate hydratase gene (14) was more
highly expressed in duodenum cells of control embryos than IOF-treated embryos. This
gene is associated with the enzyme that connects the pentose phosphate pathway to the
glycolysis pathway, and it is usually the rate limiting step in channeling compounds from
one pathway to the other when gluconeogenic substrate is needed. Therefore, the up-
regulation of aconitate hydratase may indicate some degree of energy shortage in
duodenum cells of control embryos in comparison to the IOF-treated embryos. Thus, IOF
treatment seems to have enhanced energy status of duodenum cells in embryos prior to
hatch (25E and 26E).
Ileum
The ileum is the intestinal section where most of enteric digestion and absorption
occurs, and it is also the tissue with the largest number of genes differentially expressed
between the two treatments. Even though seven genes were differently expressed, they all
occurred at 25E (or 24 hours after IOF was performed), all genes up-regulated among
control embryos.
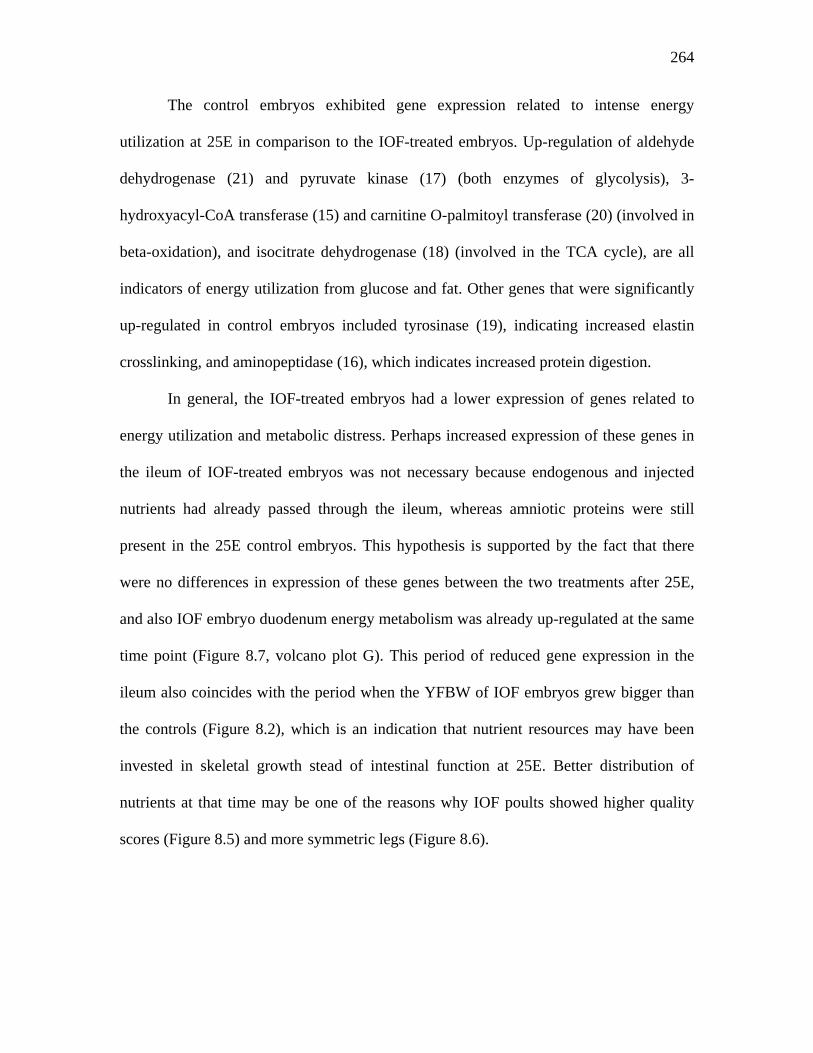
264
The control embryos exhibited gene expression related to intense energy
utilization at 25E in comparison to the IOF-treated embryos. Up-regulation of aldehyde
dehydrogenase (21) and pyruvate kinase (17) (both enzymes of glycolysis), 3-
hydroxyacyl-CoA transferase (15) and carnitine O-palmitoyl transferase (20) (involved in
beta-oxidation), and isocitrate dehydrogenase (18) (involved in the TCA cycle), are all
indicators of energy utilization from glucose and fat. Other genes that were significantly
up-regulated in control embryos included tyrosinase (19), indicating increased elastin
crosslinking, and aminopeptidase (16), which indicates increased protein digestion.
In general, the IOF-treated embryos had a lower expression of genes related to
energy utilization and metabolic distress. Perhaps increased expression of these genes in
the ileum of IOF-treated embryos was not necessary because endogenous and injected
nutrients had already passed through the ileum, whereas amniotic proteins were still
present in the 25E control embryos. This hypothesis is supported by the fact that there
were no differences in expression of these genes between the two treatments after 25E,
and also IOF embryo duodenum energy metabolism was already up-regulated at the same
time point (Figure 8.7, volcano plot G). This period of reduced gene expression in the
ileum also coincides with the period when the YFBW of IOF embryos grew bigger than
the controls (Figure 8.2), which is an indication that nutrient resources may have been
invested in skeletal growth stead of intestinal function at 25E. Better distribution of
nutrients at that time may be one of the reasons why IOF poults showed higher quality
scores (Figure 8.5) and more symmetric legs (Figure 8.6).
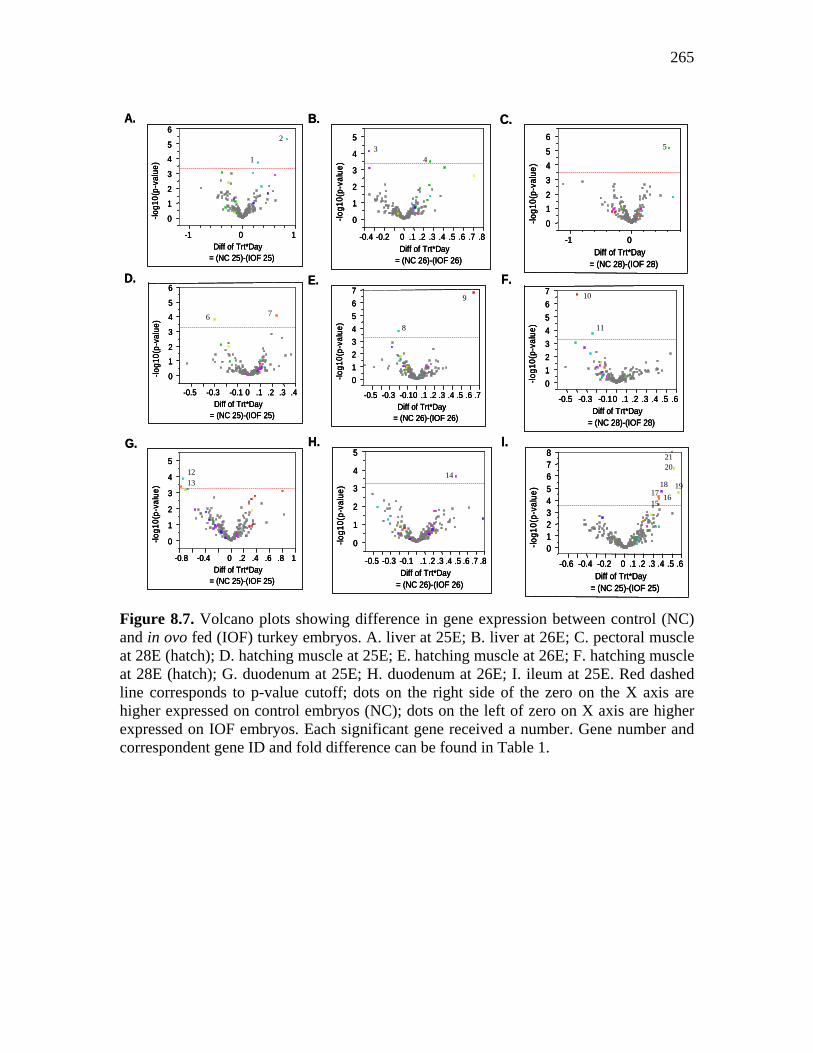
265
Figure 8.7. Volcano plots showing difference in gene expression between control (NC) and in ovo fed (IOF) turkey embryos. A. liver at 25E; B. liver at 26E; C. pectoral muscle at 28E (hatch); D. hatching muscle at 25E; E. hatching muscle at 26E; F. hatching muscle at 28E (hatch); G. duodenum at 25E; H. duodenum at 26E; I. ileum at 25E. Red dashed line corresponds to p-value cutoff; dots on the right side of the zero on the X axis are higher expressed on control embryos (NC); dots on the left of zero on X axis are higher expressed on IOF embryos. Each significant gene received a number. Gene number and correspondent gene ID and fold difference can be found in Table 1.
0
1
2
3
4
5
6
-log1
0(p-
valu
e)
-1 0 1Diff of Trt*Day
= (NC 25)-(IOF 25)
A.
0
1
2
3
4
5
6
-log1
0(p-
valu
e)
-1 0 1Diff of Trt*Day
= (NC 25)-(IOF 25)
0
1
2
3
4
5
6
-log1
0(p-
valu
e)
-1 0 1Diff of Trt*Day
= (NC 25)-(IOF 25)
A.
1
2
0
1
2
3
4
5
-log1
0(p-
valu
e)
-0.4 -0.2 0 .1 .2 .3 .4 .5 .6 .7 .8Diff of Trt*Day
= (NC 26)-(IOF 26)
B.
0
1
2
3
4
5
-log1
0(p-
valu
e)
-0.4 -0.2 0 .1 .2 .3 .4 .5 .6 .7 .8Diff of Trt*Day
= (NC 26)-(IOF 26)
0
1
2
3
4
5
-log1
0(p-
valu
e)
-0.4 -0.2 0 .1 .2 .3 .4 .5 .6 .7 .8Diff of Trt*Day
= (NC 26)-(IOF 26)
B.
3 4
0123456
-log1
0(p-
valu
e)
-1 0Diff of Trt*Day
= (NC 28)-(IOF 28)
C.
0123456
-log1
0(p-
valu
e)
-1 0Diff of Trt*Day
= (NC 28)-(IOF 28)
0123456
-log1
0(p-
valu
e)
-1 0Diff of Trt*Day
= (NC 28)-(IOF 28)
C.
5
0
1
2
3
4
5
6
-log1
0(p-
valu
e)
-0.5 -0.3 -0.1 0 .1 .2 .3 .4Diff of Trt*Day
= (NC 25)-(IOF 25)
D.
0
1
2
3
4
5
6
-log1
0(p-
valu
e)
-0.5 -0.3 -0.1 0 .1 .2 .3 .4Diff of Trt*Day
= (NC 25)-(IOF 25)
0
1
2
3
4
5
6
-log1
0(p-
valu
e)
-0.5 -0.3 -0.1 0 .1 .2 .3 .4Diff of Trt*Day
= (NC 25)-(IOF 25)
D.
6 7
01234567
-log1
0(p-
valu
e)
-0.5 -0.3 -0.10 .1 .2 .3 .4 .5 .6 .7Diff of Trt*Day
= (NC 26)-(IOF 26)
E.
01234567
-log1
0(p-
valu
e)
-0.5 -0.3 -0.10 .1 .2 .3 .4 .5 .6 .7Diff of Trt*Day
= (NC 26)-(IOF 26)
01234567
-log1
0(p-
valu
e)
-0.5 -0.3 -0.10 .1 .2 .3 .4 .5 .6 .7Diff of Trt*Day
= (NC 26)-(IOF 26)
E.
8
9
01234567
-log1
0(p-
valu
e)
-0.5 -0.3 -0.10 .1 .2 .3 .4 .5 .6Diff of Trt*Day
= (NC 28)-(IOF 28)
F.
01234567
-log1
0(p-
valu
e)
-0.5 -0.3 -0.10 .1 .2 .3 .4 .5 .6Diff of Trt*Day
= (NC 28)-(IOF 28)
01234567
-log1
0(p-
valu
e)
-0.5 -0.3 -0.10 .1 .2 .3 .4 .5 .6Diff of Trt*Day
= (NC 28)-(IOF 28)
F.10
11
0
1
2
3
4
5
-log1
0(p-
valu
e)
-0.8 -0.4 0 .2 .4 .6 .8 1Diff of Trt*Day
= (NC 25)-(IOF 25)
G.
0
1
2
3
4
5
-log1
0(p-
valu
e)
-0.8 -0.4 0 .2 .4 .6 .8 1Diff of Trt*Day
= (NC 25)-(IOF 25)
0
1
2
3
4
5
-log1
0(p-
valu
e)
-0.8 -0.4 0 .2 .4 .6 .8 1Diff of Trt*Day
= (NC 25)-(IOF 25)
G.
13 12
0
1
2
3
4
5
-log1
0(p-
valu
e)
-0.5 -0.3 -0.1 .1 .2 .3 .4 .5 .6 .7 .8Diff of Trt*Day
= (NC 26)-(IOF 26)
H.
0
1
2
3
4
5
-log1
0(p-
valu
e)
-0.5 -0.3 -0.1 .1 .2 .3 .4 .5 .6 .7 .8Diff of Trt*Day
= (NC 26)-(IOF 26)
0
1
2
3
4
5
-log1
0(p-
valu
e)
-0.5 -0.3 -0.1 .1 .2 .3 .4 .5 .6 .7 .8Diff of Trt*Day
= (NC 26)-(IOF 26)
H.
14
012345678
-log1
0(p-
valu
e)
-0.6 -0.4 -0.2 0 .1 .2 .3 .4 .5 .6Diff of Trt*Day
= (NC 25)-(IOF 25)
I.
012345678
-log1
0(p-
valu
e)
-0.6 -0.4 -0.2 0 .1 .2 .3 .4 .5 .6Diff of Trt*Day
= (NC 25)-(IOF 25)
012345678
-log1
0(p-
valu
e)
-0.6 -0.4 -0.2 0 .1 .2 .3 .4 .5 .6Diff of Trt*Day
= (NC 25)-(IOF 25)
I.
19 17
20
15 16
21
18

266
Table 8.1. Genes that were significantly affected1 by in ovo feeding (IOF) in different turkey embryo tissues analyzed by microarrays.2
Tissue Day of incubation
Gene Treat. *Fold diff.
(1) creatine kinase NC 0.8428 25E (2) transketolase NC 0.2951 (3) Glyceraldehyde-3P dehydrogenase IOF -0.3554
Liver
26E (4) HSP1 NC 0.2640
Pectoral muscle
28E (5) tropoelastin NC 0.6189
25E (6) UDP-glucose-6 dehydrogenase IOF -0.3012 (7) Glycogen branching enzyme NC 0.2377
26E (8) Tysrosinase IOF -0.2062 (9) HOXA3 NC 0.6427
28E (10) Tyrosinase IOF -0.2427
Hatching muscle
(11) HOXA 3 IOF -0.4014 (12)ATP citrate synthase IOF -0.7441 25E (13) Isocitrate dehydrogenase IOF -0.7790
Duodenum
26E (14) Aconitate hydratase NC 0.4635 (15) 3-hydroxyacyl-CoA transferase NC 0.3583 (16) Aminopeptidase NC 0.3608 (17) Pyruvate kinase NC 0.3554 (18) Isocitrate dehydrogenase NC 0.3874 (19) Tyrosinase NC 0.5666 (20) Carnitine O-palmitoyl transferase NC 0.5206
Ileum
25E
(21) Aldehyde dehydrogenase NC 0.4953 1(P<0.01) 2Treat. column identifies which treatment had highest expression of that gene; Day column identify which day the significant difference was found; Gene column identify which gene and its number on the volcano plot (Figure 7.7); Fold Diff. column corresponds to the fold difference on gene expression between treatments, being negative when IOF expression was higher and positive when control expression was higher.
267
Conclusion
In ovo feeding enhanced turkey embryo growth and glycogen storage and use in
comparison to non-injected controls. These positive changes were confirmed by
differences in the expression of several genes related to energy metabolism in liver,
muscle, and intestinal tissues. Although these gene expression results by IOF did not
yield heavier poults at hatch than the controls, they may be associated with improved
poult quality and vigor at hatch, which may improve post-hatch survival and growth
performance.
268
References Boerjan, M. 2002. Programs for single stage incubation and chick quality. Avian and
Poultry Biol Rev 13:237-238. Boerjan, M. 2006. Chick vitality and uniformity. in International Hatchery Practice
20(8):7-9. Christensen, V. L., W. E. Donaldson, and K. E. Nestor. 1993. Embryonic viability and
metabolism in turkey lines for egg production and growth. Poult Sci 72:829-838. Christensen, V. L., W. E. Donaldson, and J. P. McMurtry. 1996. Physiological
differences in late embryos from turkey breeders at different ages. Poult Sci 75:172-178.
Christensen, V. L., W. E. Donaldson, and K. E. Nestor. 1999. Length of the plateau and
pipping stages of incubation affects the physiology and survival of turkeys. Br Poult Sci 40:297-303.
Christensen, V. L., D. T. Ort, and J. L. Grimes. 2003. Physiological factors associated
with weak neonatal poults (Meleagris gallopavo). Int J Poult Sci 2:7-14. Donaldson, W. E. 1995. Carbohydrate, hatchery stressors affect poult survival. in
Feedstuffs 67(14):16-17. Eisen, M. B., P. T. Spellman, P. O. Brown, and D. Botstein. 1998. Cluster analysis and
display of genome-wide expression patterns. Proc Natl Acad Sci USA 95:14863-14868.
Ferket, P. R., Z. Uni, E. Tako, O. T. Foye, and J. E. Oliveira. 2005. In ovo feeding
nutrition: impact on gene expression, gut development, and growth performance. Pages 160-172 in The Annual Nutrition Conference. September 13-15. University of Arkansas. Rogers, AR.
Foye, O. T. 2005. The biochemical and molecular effects of amnionic nutrient
administration, “in ovo feeding” on intestinal development and function and carbohydrate metabolism in turkey embryos and poults. Ph.D. Dissertation. North Carolina State University. Raleigh, NC.
Foye, O. T., Z. Uni, and P. R. Ferket. 2006. Effect of in ovo feeding egg white protein,
beta-hydroxy-beta-methylbutyrate, and carbohydrates on glycogen status and neonatal growth of turkeys. Poult Sci 85:1185-1192.
Garosi, P., C. De Filippo, M. van Erk, P. Rocca-Serra, S. A. Sansone, and R. Elliott.
2005. Defining best practice for microarray analyses in nutrigenomic studies. Br J Nutr 93:425-432.
269
Givisiez, P. E. N., M. M. da Silva, C. M. Mazzi, M. I. T. Ferro, J. A. Ferro, E. Gonzales, M. Macari. 2001. Heat and cold chronic stress organ weights and hsp70 levels in chicken embryos. Can J Anim Sci 81:83-87.
Havenstein, G. B., P. R. Ferket, J. L. Grimes, M. A. Qureshi, and K. E. Nestor. 2007.
Comparison of the performance of 1966- versus 2003-type turkeys when fed representative 1966 and 2003 turkey diets: growth rate, livability, and feed conversion. Poult Sci 86:232-240.
Hester, P. Y., A. L. Sutton, and R. G. Elkin. 1987. Effect of light intensity, litter source,
and litter management on the incidence of leg abnormalities and performance of male turkeys. Poult Sci 66:666-675.
International Chicken Sequencing Consortium. 2004. Chicken genome database.
http://www.tigr.org Accessed June 2004. John, T. M., J. C. George, and E. T. Moran, Jr. 1987. Pre- and post-hatch ultrastructural
and metabolic changes in the hatching muscle of turkey embryos from antibiotic and glucose treated eggs. Cytobios 49:197-210.
Kameda, Y., Y. Arai, T. Nishimaki, and O. Chisaka. 2004. The role of Hoxa3 gene in
parathyroid gland organogenesis of the mouse. J Histochem Cytochem 52:641-651. Keirs, R. W., E. D. Peebles, S. A. Hubbard, and S. K. Whitmarsh. 2002. Effects of
supportative gluconeogenic substrates on early performance of broilers under adequate brooding conditions. J Appl Poult Res 11:367-372.
Lantto, R., E. Puolanne, K. Kruus, J. Buchert, and K. Autio. 2007. Tyrosinase-aided
protein cross-linking: effects on gel formation of chicken breast myofibrils and texture and water-holding of chicken breast meat homogenate gels. J Agric Food Chem 55:1248-1255.
Leandro, N. S. M., E. Gonzales, J. A. Ferro, M. I. T. Ferro, P. E. N. Giviziez, Macari.
2004. Expression of heat shock protein in broiler embryos tissues after acute cold or heat stress. Mol Reprod Develop 67:172-177
Meffert, G., F. N. Gellerich, R. Margreiter, and M. Wyss. 2005. Elevated creatine kinase
activity in primary hepatocellular carcinoma. BMC Gastroenterol 5:9. Moller, A. P., G. S. Sanotra, and K. S. Vestergaard. 1995. Developmental stability in
relation to population density and breed of chickens Gallus gallus. Poult Sci 74:1761-1771.
Moran, E. T., Jr. 2007. Nutrition of the developing embryo and hatchling. Poult Sci
86:1043-1049.
270
Noble, D. O., K. E. Nestor, and C. R. Polley. 1999. Factors influencing early poult flip-overs in experimental populations of turkeys. Poult Sci 78:178-181.
Page, G. P., J. W. Edwards, S. Barnes, R. Weindruch, and D. B. Allison. 2003. A design
and statistical perspective on microarray gene expression studies in nutrition: the need for playful creativity and scientific hard-mindedness. Nutrition 19:997-1000.
Parks, W. C., H. Secrist, L. C. Wu, and R. P. Mecham. 1988. Developmental regulation
of tropoelastin isoforms. J Biol Chem 263:4416-4423. Rivera, R. E., V. L. Christensen, F. W. Edens, M. J. Wineland. 2005. Influence of
selenium on heat shock protein 70 expression in heat stressed turkey embryos. Comp Biochem Physiol A 142:427-432.
Romanoff, A. L. 1960. The avian embryo; structural and functional development.
Macmillian, New York, NY. Romanoff, A. L. 1967. Biochemistry of the avian embryo; a quantitative analysis of
prenatal development. Interscience Publishers, New York. SAS Institute. 2005. JMP Version 6 User's Guide. SAS Inst., Cary, NC. SAS Institute. 2007. JMP Genomics Version 3.0 User's Guide. SAS Inst., Cary, NC. Schaal, T., and G. Cherian. 2007. A survey of the hatchability of broiler and Turkey eggs
in the United States from 1985 through 2005. Poult Sci 86:598-600. Simsa, S., and E. M. Ornan. 2007. Endochondral ossification process of the turkey
(Meleagris gallopavo) during embryonic and juvenile development. Poult Sci 86:565-571.
Smirnov, A., E. Tako, P. R. Ferket, and Z. Uni. 2006. Mucin gene expression and mucin
content in the chicken intestinal goblet cells are affected by in ovo feeding of carbohydrates. Poult Sci 85:669-673.
Spielbauer, B., and F. Stahl. 2005. Impact of microarray technology in nutrition and food
research. Mol Nutr Food Res 49:908-917. Tako, E., P. R. Ferket, and Z. Uni. 2004. Effects of in ovo feeding of carbohydrates and
beta-hydroxy-beta-methylbutyrate on the development of chicken intestine. Poult Sci 83:2023-2028.
Tako, E., P. R. Ferket, and Z. Uni. 2005. Changes in chicken intestinal zinc exporter
mRNA expression and small intestinal functionality following intra-amniotic zinc-methionine administration. J Nutr Biochem 16:339-346.
271
Tona, K., F. Bamelis, B. De Ketelaere, V. Bruggeman, V. M. Moraes, J. Buyse, O. Onagbesan, and E. Decuypere. 2003. Effects of egg storage time on spread of hatch, chick quality, and chick juvenile growth. Poult Sci 82:736-741.
Uni, Z., and P. R. Ferket 2003. Enhancement of development of oviparous species by in
ovo feeding. U.S. Patent no. 6,592,878 B2. Uni, Z., and P. R. Ferket. 2004. Methods for early nutrition and their potential. Worlds
Poult Sci J 60:101-111. Uni, Z., P. R. Ferket, E. Tako, and O. Kedar. 2005. In ovo feeding improves energy status
of late-term chicken embryos. Poult Sci 84:764-770. Uni, Z., P. R. Ferket, and E. Tako. 2006. In ovo feeding: impact on gut development,
energetic status, gene expression and growth performance. Pages 47-48 in The 29th Technical Turkey Conference. Turkey.
Wolfinger, R. D., G. Gibson, E. D. Wolfinger, L. Bennett, H. Hamadeh, P. Bushel, C.
Afshari, and R. S. Paules. 2001. Assessing gene significance from cDNA microarray expression data via mixed models. J Comput Biol 8:625-637.
Wormbase. 2007. Gene Summary for sqv-4.
http://www.wormbase.org/db/gene/gene?name=WBGene00005022;class=Gene Accessed Jul, 29 2007.
Yalcin, S., S. Ozkan, M. Cabuk, and P. B. Siegel. 2003. Criteria for evaluating husbandry
practices to alleviate heat stress in broilers. J Appl Poult Res 12:382-388. Yalcin, S., S. Ozkan, M. Cabuk, J. Buyse, E. Decuypere, and P. B. Siegel. 2005. Pre- and
postnatal conditioning induced thermotolerance on body weight, physiological responses and relative asymmetry of broilers originating from young and old breeder flocks. Poult Sci 84:967-976.
Yang, Y. H., and T. Speed 2003. Design and analysis of comparative microarrays
experiments. Pages 35-87 in Statistical analysis of gene expression microarray data. T. Speed ed. Chapman & Hall/CRC, Boca Raton, FL.

272
Chapter 9
Conclusions
Historically the success of the poultry industry has been associated with genetic
selection for increased rate of growth, feed conversion efficiency, and meat yield. As the
age of commercial poultry to reach market age decreases, the period of incubation and
brooding accounts for a greater portion of total production period. This genetic selection
for increased growth performance favors the selection of animals that devote more
resources on growth (i.e. altricial birds) than on survival (i.e. precocial birds) (Figure
9.1). As commercial poultry become more altricial, increased growth rate and production
efficiency comes at the expense of weaker hatchlings that are more susceptible to high
mortality during the late stages of incubation and early post-hatch development. This is
especially true for turkey embryos, which spend considerable time in the plateau stage of
oxygen consumption and pipping, and they are at great risk to low energy status during
anaerobic metabolism. Improper incubation (E) conditions can aggravate these risks even
further. In order to improve the energy status of these “altricial” hatchlings, early
nutrition must be enhanced to facilitate the development of digestive capacity,
thermoregulation, and immune system. In ovo feeding (IOF) was identified as a feasible
and practical method to support the perinatal development of “altricial” turkeys so they
can achieve their genetic potential for growth without compromise to survivability.
In this dissertation, chapters 2, 3, 4 and 5 demonstrated that in ovo feeding
improved energy status of perinatal turkeys, but its effects on hatchability and
performance were variable (Table 9.1). Therefore, greater understanding of the
273
physiology and metabolism of the late-term embryo was concluded to be necessary to
advance in ovo feeding technology further.
First to be studied were the changes in amnion volume and embryonic fluid
osmolality that occur during the late-term incubation of the three major breeds of
commercial turkeys. These studies revealed that the embryos of all breeds consumed
amniotic fluid at a rate of 0.10 ml/hr between 20E and 25E. Based on embryo fluid
osmolality and amnion volume data, to the optimum IOF solution osmolality (460
mOsm) and volume (1.5 mL), and the optimum time of IOF solution delivery (between
22E and 23E) could be predicted.
The second step was to better understand metabolism of the late-term (20E to
hatch) embryo by surveying gene expression of key enzymes associated with energy
metabolism using a customized focused microarray. These results indicated that the
embryos were switching from lipid to carbohydrate metabolism at 22E, confirmed
metabolism associated with glycogen synthesis and degradation, and revealed that
intestinal enzymes and nutrient transporters began to be up-regulated 48 hours prior to
hatch. A summary of my compiled understanding on turkey embryo development from
consulted literature and knowledge acquired through this research is illustrated on Figure
9.2.
Finally, with this information about the physiology and metabolism of the late-
term embryo together with automated application of IOF solution delivery by the
Inovoject® system1, a new IOF solution was formulated to be injected at 24E, containing
several metabolic co-factors. The embryonic development and hatchling quality of poults
that were subjected to this new IOF treatment was compared to non-injected control 1 Pfizer-Embrex, Inc., Research Triangle Park, Durham, NC
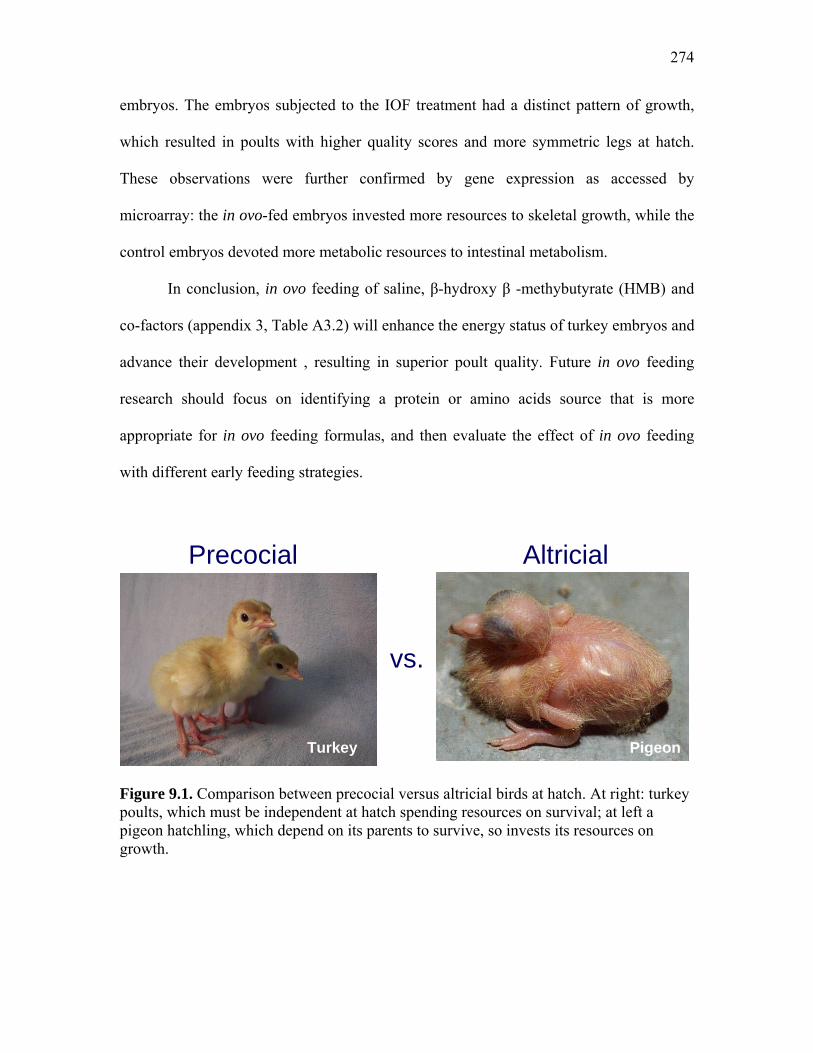
274
embryos. The embryos subjected to the IOF treatment had a distinct pattern of growth,
which resulted in poults with higher quality scores and more symmetric legs at hatch.
These observations were further confirmed by gene expression as accessed by
microarray: the in ovo-fed embryos invested more resources to skeletal growth, while the
control embryos devoted more metabolic resources to intestinal metabolism.
In conclusion, in ovo feeding of saline, β-hydroxy β -methybutyrate (HMB) and
co-factors (appendix 3, Table A3.2) will enhance the energy status of turkey embryos and
advance their development , resulting in superior poult quality. Future in ovo feeding
research should focus on identifying a protein or amino acids source that is more
appropriate for in ovo feeding formulas, and then evaluate the effect of in ovo feeding
with different early feeding strategies.
Figure 9.1. Comparison between precocial versus altricial birds at hatch. At right: turkey poults, which must be independent at hatch spending resources on survival; at left a pigeon hatchling, which depend on its parents to survive, so invests its resources on growth.
vs.
Precocial Altricial
Turkey Pigeon
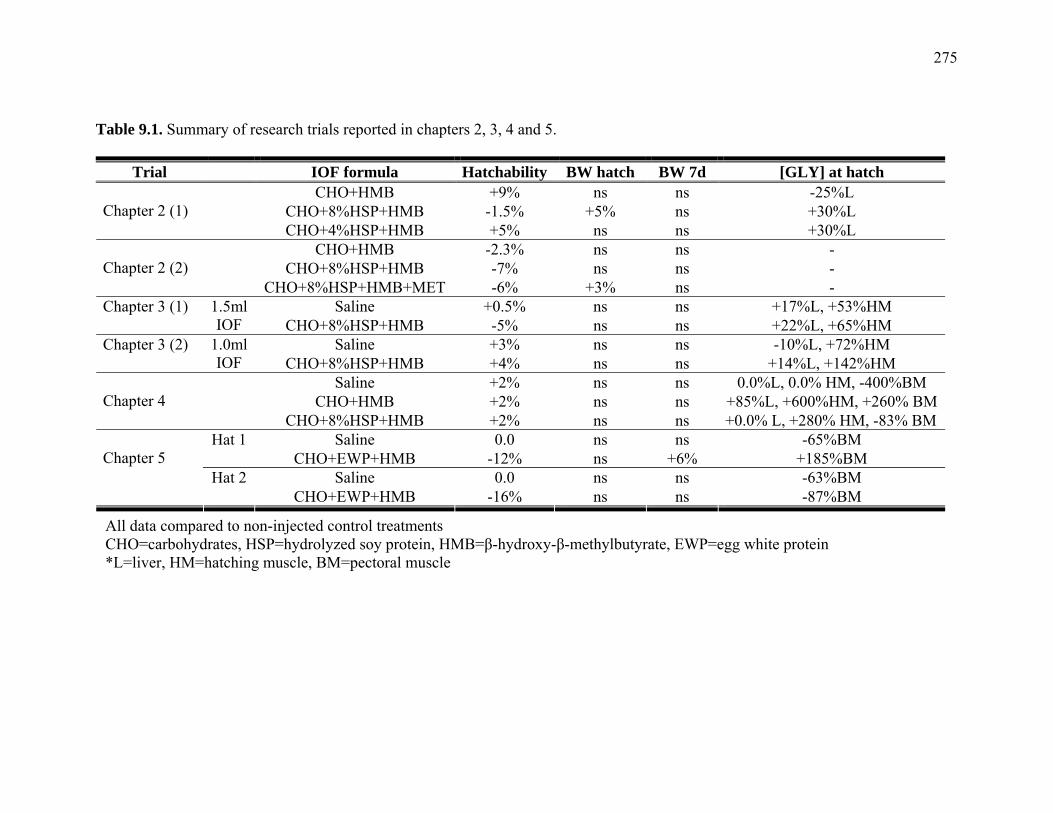
275
Table 9.1. Summary of research trials reported in chapters 2, 3, 4 and 5.
Trial IOF formula Hatchability BW hatch BW 7d [GLY] at hatch CHO+HMB +9% ns ns -25%L CHO+8%HSP+HMB -1.5% +5% ns +30%L
Chapter 2 (1)
CHO+4%HSP+HMB +5% ns ns +30%L CHO+HMB -2.3% ns ns - CHO+8%HSP+HMB -7% ns ns -
Chapter 2 (2)
CHO+8%HSP+HMB+MET -6% +3% ns - Saline +0.5% ns ns +17%L, +53%HM Chapter 3 (1) 1.5ml
IOF CHO+8%HSP+HMB -5% ns ns +22%L, +65%HM Saline +3% ns ns -10%L, +72%HM Chapter 3 (2) 1.0ml
IOF CHO+8%HSP+HMB +4% ns ns +14%L, +142%HM Saline +2% ns ns 0.0%L, 0.0% HM, -400%BM CHO+HMB +2% ns ns +85%L, +600%HM, +260% BM
Chapter 4
CHO+8%HSP+HMB +2% ns ns +0.0% L, +280% HM, -83% BM Saline 0.0 ns ns -65%BM Hat 1
CHO+EWP+HMB -12% ns +6% +185%BM Saline 0.0 ns ns -63%BM
Chapter 5
Hat 2 CHO+EWP+HMB -16% ns ns -87%BM
All data compared to non-injected control treatments CHO=carbohydrates, HSP=hydrolyzed soy protein, HMB=β-hydroxy-β-methylbutyrate, EWP=egg white protein *L=liver, HM=hatching muscle, BM=pectoral muscle
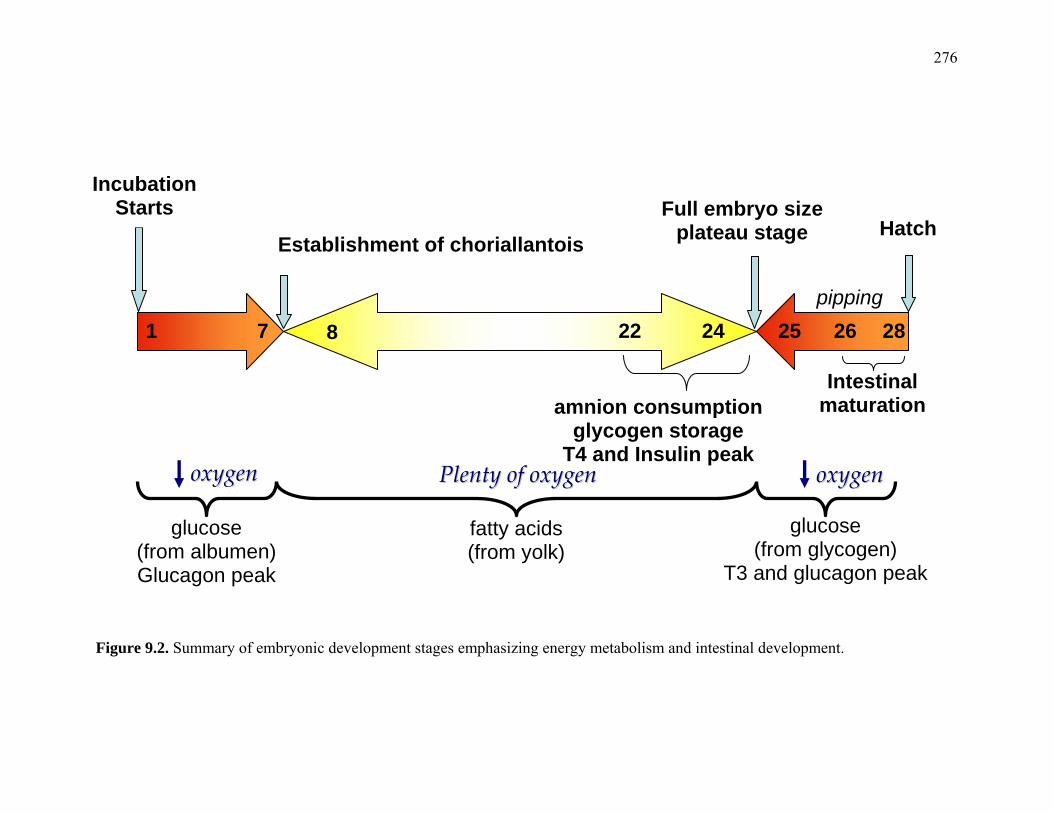
276
Figure 9.2. Summary of embryonic development stages emphasizing energy metabolism and intestinal development.
1 7 8 24 25 28
pipping 22
amnion consumption glycogen storage
T4 and Insulin peak ooxxyyggeenn PPlleennttyy ooff ooxxyyggeenn ooxxyyggeenn
glucose (from albumen) Glucagon peak
fatty acids (from yolk)
glucose (from glycogen)
T3 and glucagon peak
26
Intestinal maturation
Establishment of choriallantois
Full embryo size plateau stage Hatch
Incubation Starts

277
Appendices
278
Appendix 1
“The effect of various forms of administration of nutritive
solutions on turkey performance” Project justification or rational
Previous research showed that productive performance of poultry embryos was improved after they were in ovo fed a combination of HMB and arginine (Foye, 2005). Some other methods of administration (Keers et al., 2002; Peebles et al., 2006) of the same solution could also have beneficial effects and be less expensive or more feasible in the industry setting. This trial will try to determine if the improvements seen with IOF can only be achieved by that method or also by other methods. Objective This experiment was designed to compare the efficacy of giving poults extra nutrients in ovo or post-hatch by several methods in order to identify the best delivery method that yields the greatest effect on early development.
Material and methods Eight-hundred-forty BUT turkey eggs were obtained from a commercial hatchery
at 20 days of incubation (E). The eggs were candled, weighted and divided into 5 groups of 105 eggs with similar weight distribution. Each egg group was assigned to one of five treatment groups: 1) in ovo injection from the top at 24E (ITP); 2) in ovo injection from the side at 22E (ISD); 3) non-injected controls (NC); 4) gavage at hatch; and 5) subcutaneous injection on the neck at hatch (INK). At 28E the hatch was pulled and hatchability and poult body weight was recorded for each treatment. Pectoral muscle, liver and yolk as a percent of embryo weight were calculated at hatch. Poults were sexed and placed in floor pens according to treatment X gender combination (14 poults/pen) at day of hatch or 24hrs later. The poults placed 24 hrs later remained in transport boxed under heating lamps in the brooding house. Once placed, treatments received feed and water ad libitum. Feed was formulated to attend or exceed NRC (1994) requirements. Poults were raised until 42d of age, and poults were individually weighted at 3, 7, 14, 21, 35 and 42d. The experimental protocol was approved by the North Carolina State University Institutional Animal Care and Use Committee.

279
Results Table A1.1. Hatchability, piped eggs and dead eggs1 Treatment Hatchability (%) Piped (%) Dead (%) IOF top injected (ITP) 79.58 13.47 6.52 IOF side injected (ISD) 83.63 13.21 3.16 NC 83.38 10.68 5.93 Gavage 84.25 12.12 3.62 Neck Injected 80.67 15.32 4.00 SEM 3.273 2.602 1.523 p-value 0.8056 0.8575 0.6474
1Values are mean of 12 replicate baskets. Table A1.2. Body weight of turkey pouts at day of hatch1
Treatment Body Weight (g) IOF top injected (ITP) 62.58b IOF side injected (ISD) 67.46a NC 61.60b Gavage 63.74b Neck Injected 62.40b SEM 1.482 p-value 0.0233
1Values are mean of 175 poults. a,bMeans with different upper case letter superscripts are significantly different (P<0.05) Table A1.3. Body weight of turkey pouts at day of hatch, by gender. Gender Body weight (g) Male 63.49 Female 63.63 SEM 0.939 p-value 0.9128
2Values are mean of 435 poults Table A1.4 – Pectoral muscle, liver and yolk of turkeys at day of hatch1,2
Treatment Pectoral Muscle (%) Liver (%) Yolk (%) IOF top injected (ITP) 2.66 2.14 10.80a IOF side injected (ISD) 2.51 2.36 8.23b NC 2.37 2.26 10.14a SEM 0.147 0.080 0.756 p-value 0.3699 0.1767 0.0611
1results for pectoral muscle (without bones), liver and yolk, expressed as percentage of body weight. 2Values are mean of 10 samples a,bMeans with different upper case letter superscripts in the same column are significantly different (P<0.05)
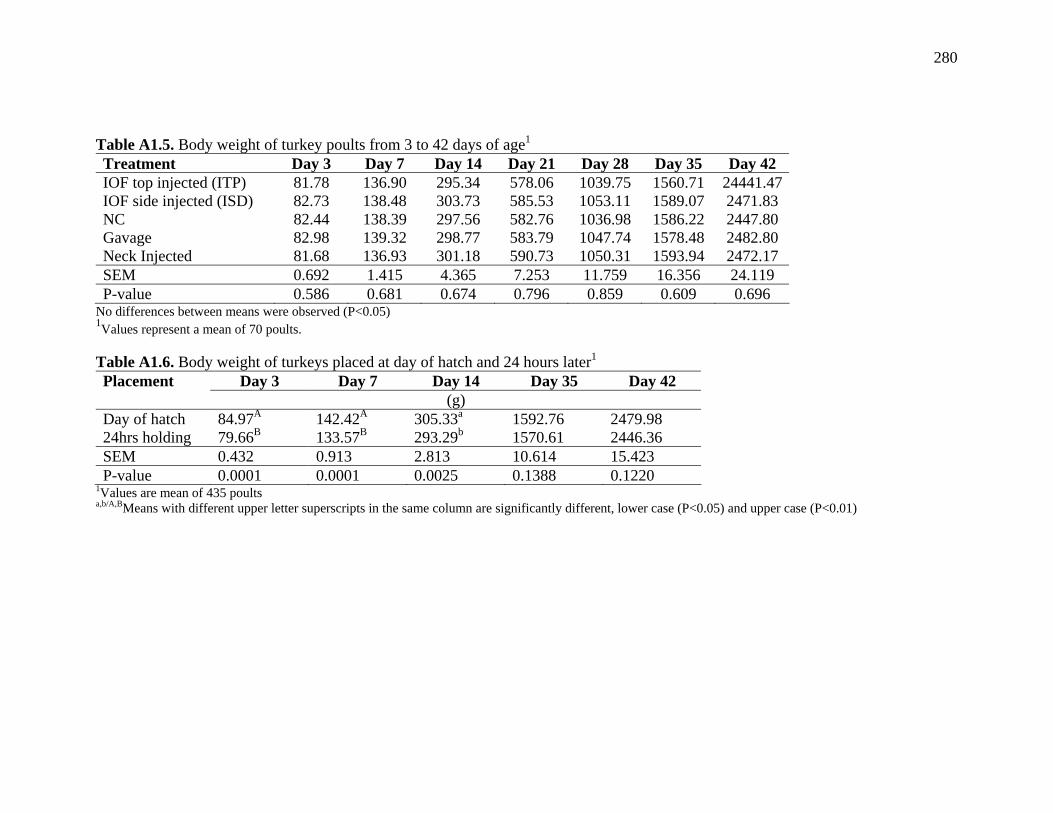
280
Table A1.5. Body weight of turkey poults from 3 to 42 days of age1 Treatment Day 3 Day 7 Day 14 Day 21 Day 28 Day 35 Day 42 IOF top injected (ITP) 81.78 136.90 295.34 578.06 1039.75 1560.71 24441.47IOF side injected (ISD) 82.73 138.48 303.73 585.53 1053.11 1589.07 2471.83 NC 82.44 138.39 297.56 582.76 1036.98 1586.22 2447.80 Gavage 82.98 139.32 298.77 583.79 1047.74 1578.48 2482.80 Neck Injected 81.68 136.93 301.18 590.73 1050.31 1593.94 2472.17 SEM 0.692 1.415 4.365 7.253 11.759 16.356 24.119 P-value 0.586 0.681 0.674 0.796 0.859 0.609 0.696
No differences between means were observed (P<0.05) 1Values represent a mean of 70 poults. Table A1.6. Body weight of turkeys placed at day of hatch and 24 hours later1
Placement Day 3 Day 7 Day 14 Day 35 Day 42 (g) Day of hatch 84.97A 142.42A 305.33a 1592.76 2479.98 24hrs holding 79.66B 133.57B 293.29b 1570.61 2446.36 SEM 0.432 0.913 2.813 10.614 15.423 P-value 0.0001 0.0001 0.0025 0.1388 0.1220
1Values are mean of 435 poults a,b/A,BMeans with different upper letter superscripts in the same column are significantly different, lower case (P<0.05) and upper case (P<0.01)
281
Conclusion The different forms of delivering the nutritive solution did not affected
hatchability, but poults that were injected from the side at 22E were heavier at hatch than all the other treatment groups. Embryos in ovo fed by side injection also had less yolk at hatch. There were no differences among treatments for body weight post-hatch. Poults that had immediate access to feed and water were heavier and gained more weight than poults that were hold for 24 hours all the way to 42d of age.
In ovo feeding enhanced poult body weight at hatch and was identified as the
most feasible method of delivering nutritive products that impact early development. Poults held for 24 hours had inferior performance in comparison to those poults give ad libitum access to feed and water right after hatch.
References Keirs, R. W., E. D. Peebles, S. A. Hubbard, and S. K. Whitmarsh. 2002. Effects of
supportative gluconeogenic substrates on early performance of broilers under adequate brooding conditions. J Appl Poult Res 11:367-372.
Peebles, E. D., W. D. Berry, R. W. Keirs, L. W. Bennett, and P. D. Gerard. 2006. Effects
of injected gluconeogenic supplementation on the performance of broilers from young breeders. Poult Sci 85:371-376.
282
Appendix 2
“The effect of osmolality and protein sources of nutrition solutions injected in ovo”
Project justification or rationale:
Several in ovo feeding solution components have been evaluated on the development of perinatal chickens and turkeys (Foye 2005; Smirnov et al 2006; Tako et al. 2004; Tako et al., 2005; Uni et al. 2005). However, optimum formulation of more complex IOF solutions requires knowledge about the osmolality limits for IOF applications using different ingredients. Therefore, a study was designed to determine the effect of in ovo feeding solution osmolality on hatchability of turkey poults. Objectives
1. Study the optimum osmolality for in ovo feeding solutions. 2. Compare two sources of protein (egg white and whole egg).
Material and methods Six-hundred fertile turkey eggs were obtained from a commercial hatchery. The
eggs were weighted and divided into 8 groups of eggs with similar weight distribution. Six treatment groups of 50 eggs each were injected into the amnion with isocaloric solutions of dextrin and glucose formulated to 5 osmolality levels (200, 500, 800, 1100 and 1400 mOsm, corresponding to treatments 1 through 6, respectively). These 5 treatment groups of increasing osmolality were compared to non-injected eggs (NC). The last 2 groups of 50 eggs were in ovo fed solutions containing whole egg (24% Protomax + 0.1% HMB + 0.4% saline) (WEG) or egg white (24% egg white protein + 0.1% HMB + 0.4% NaCl) (EWP). The in ovo feeding protocol was performed at 23E. At day of hatch ,hatchability and poult body weight was recorded for each treatment. At the end of the trial poults were euthanized by CO2. The experimental protocol was approved by the North Carolina State University Institutional Animal Care and Use Committee.

283
Results Table A2.1. Osmolality of Injected Solutions Solution Osmolality T2 (250 mOsm) 253 T3 (550 mOsm) 542 T4 (850 mOsm) 863 T5 (1150 mOsm) 1176 T6 (1450 mOsm) 1455 T7 (Protomax) 448 T8 (Egg White) 665 Values are mean of triplicate readings1
Hatchability Table A2.2. Percent hatchability of turkey eggs in ovo fed with different solutions1
Treatment Hatchability (%) T1 (control) 70.67B T2 (250 mOsm) 90.00AB T3 (550 mOsm) 91.67A T4 (850 mOsm) 88.33AB T5 (1150 mOsm) 91.67A T6 (1450 mOsm) 81.67AB T7 (protomax) 26.00C T8 (Egg white) 76.67AB SEM 7.363 P-value 0.0002 A,B,CMeans within columns with different upper case superscript letters differ significantly (P<0.01) 1Values are mean of triplicate hatching baskets Table A2.3. Percent of turkey poults that piped the egg shell but did not hatch1
Treatment Piped Eggs (%) T1 (control) 0.00 T2 (250 mOsm) 1.67 T3 (550 mOsm) 5.00 T4 (850 mOsm) 5.00 T5 (1150 mOsm) 0.00 T6 (1450 mOsm) 1.67 T7 (protomax) 54.00 T8 (Egg white) 10.00 SEM 6.036 P-value 0.2045 1Values are mean of triplicate hatching baskets
1 Micro osmometer Model 3300, Advanced Instruments, Inc., Norwood, MA
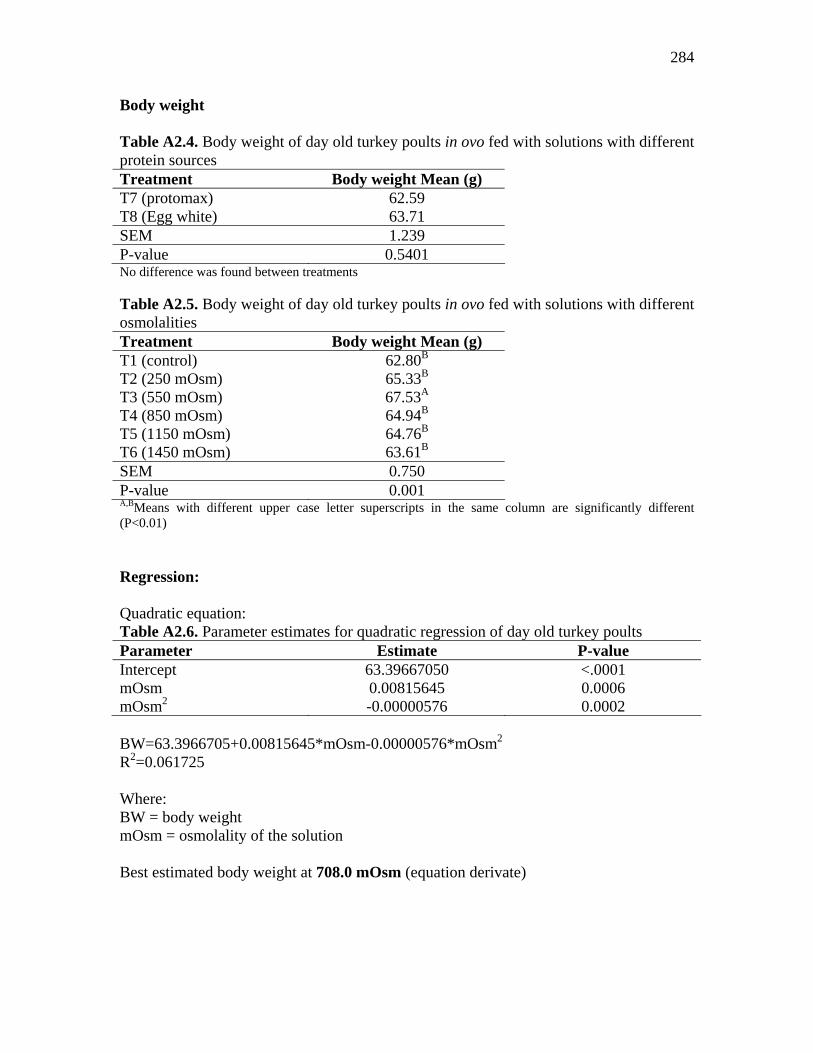
284
Body weight Table A2.4. Body weight of day old turkey poults in ovo fed with solutions with different protein sources Treatment Body weight Mean (g) T7 (protomax) 62.59 T8 (Egg white) 63.71 SEM 1.239 P-value 0.5401 No difference was found between treatments Table A2.5. Body weight of day old turkey poults in ovo fed with solutions with different osmolalities Treatment Body weight Mean (g) T1 (control) 62.80B T2 (250 mOsm) 65.33B T3 (550 mOsm) 67.53A T4 (850 mOsm) 64.94B T5 (1150 mOsm) 64.76B T6 (1450 mOsm) 63.61B SEM 0.750 P-value 0.001 A,BMeans with different upper case letter superscripts in the same column are significantly different (P<0.01) Regression: Quadratic equation: Table A2.6. Parameter estimates for quadratic regression of day old turkey poults Parameter Estimate P-value Intercept 63.39667050 <.0001 mOsm 0.00815645 0.0006 mOsm2 -0.00000576 0.0002 BW=63.3966705+0.00815645*mOsm-0.00000576*mOsm2 R2=0.061725 Where: BW = body weight mOsm = osmolality of the solution Best estimated body weight at 708.0 mOsm (equation derivate)
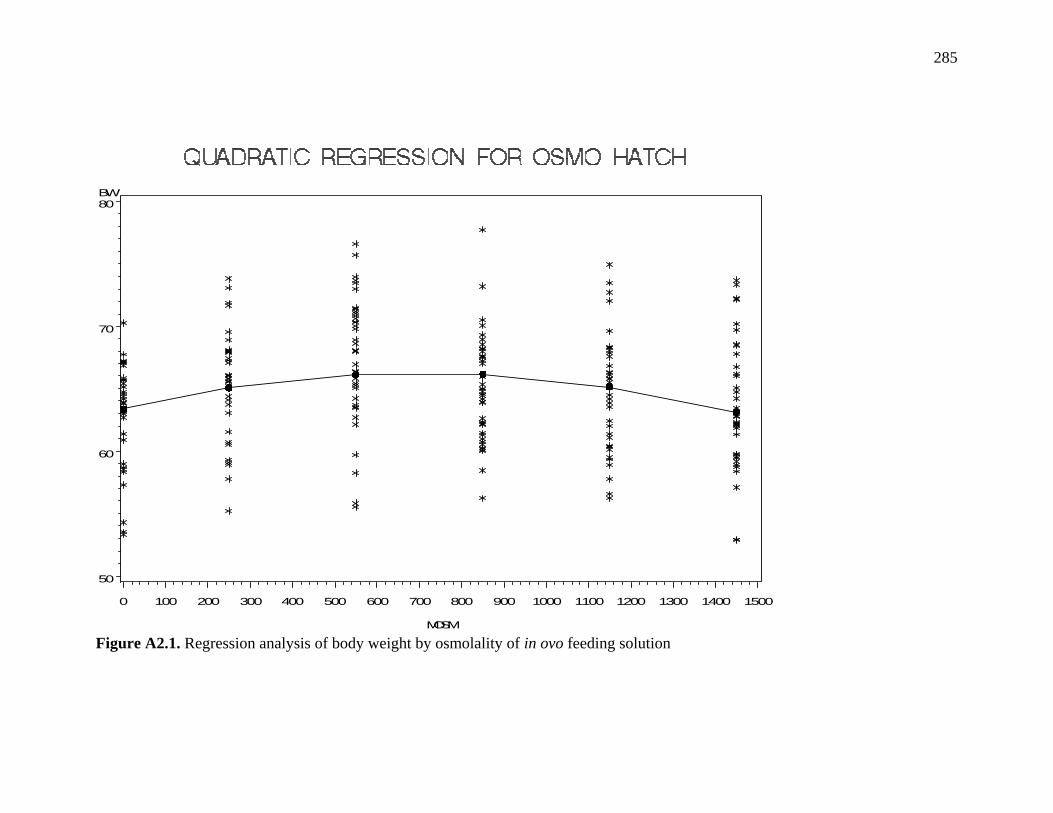
285
BW
50
60
70
80
MOSM
0 100 200 300 400 500 600 700 800 900 1000 1100 1200 1300 1400 1500
Figure A2.1. Regression analysis of body weight by osmolality of in ovo feeding solution
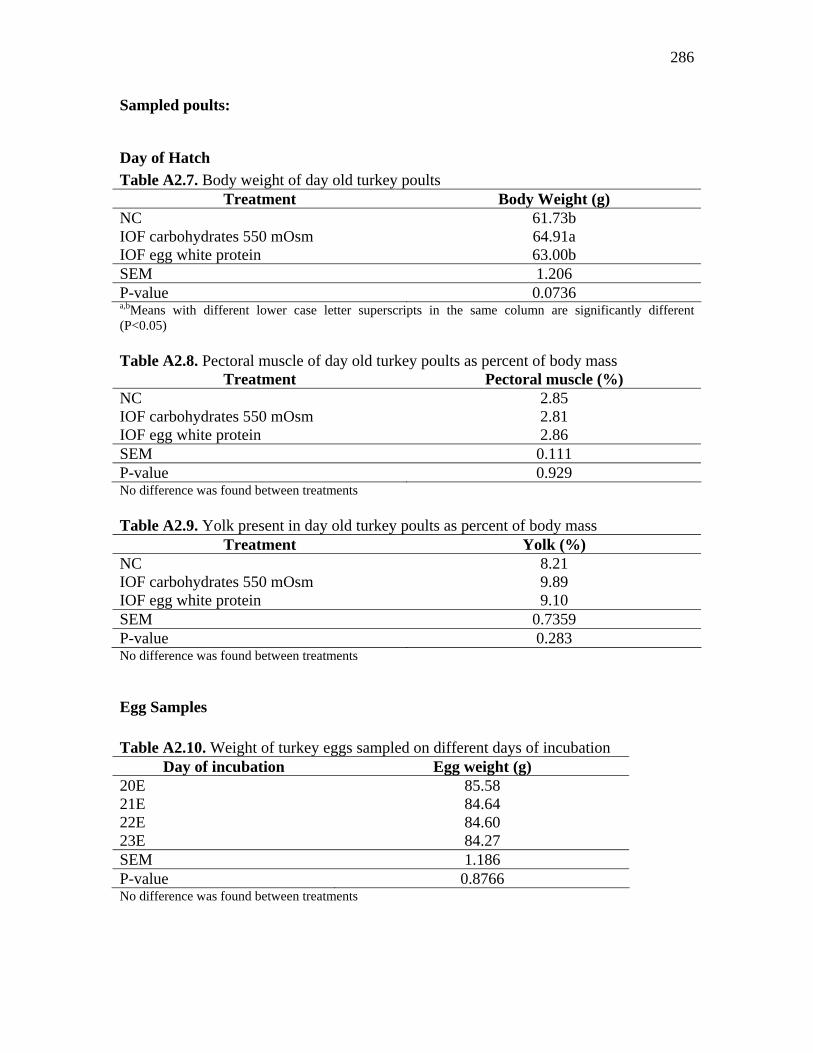
286
Sampled poults:
Day of Hatch Table A2.7. Body weight of day old turkey poults
Treatment Body Weight (g) NC 61.73b IOF carbohydrates 550 mOsm 64.91a IOF egg white protein 63.00b SEM 1.206 P-value 0.0736 a,bMeans with different lower case letter superscripts in the same column are significantly different (P<0.05) Table A2.8. Pectoral muscle of day old turkey poults as percent of body mass
Treatment Pectoral muscle (%) NC 2.85 IOF carbohydrates 550 mOsm 2.81 IOF egg white protein 2.86 SEM 0.111 P-value 0.929 No difference was found between treatments Table A2.9. Yolk present in day old turkey poults as percent of body mass
Treatment Yolk (%) NC 8.21 IOF carbohydrates 550 mOsm 9.89 IOF egg white protein 9.10 SEM 0.7359 P-value 0.283 No difference was found between treatments
Egg Samples Table A2.10. Weight of turkey eggs sampled on different days of incubation
Day of incubation Egg weight (g) 20E 85.58 21E 84.64 22E 84.60 23E 84.27 SEM 1.186 P-value 0.8766 No difference was found between treatments
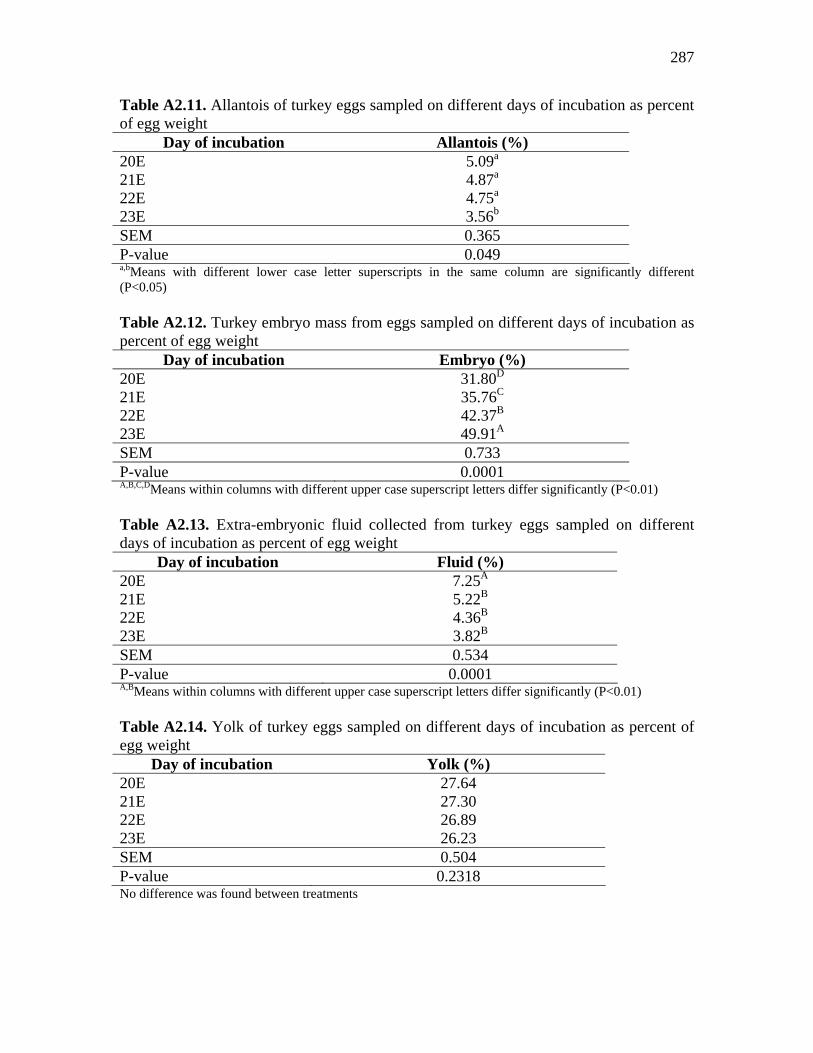
287
Table A2.11. Allantois of turkey eggs sampled on different days of incubation as percent of egg weight
Day of incubation Allantois (%) 20E 5.09a 21E 4.87a 22E 4.75a 23E 3.56b SEM 0.365 P-value 0.049 a,bMeans with different lower case letter superscripts in the same column are significantly different (P<0.05) Table A2.12. Turkey embryo mass from eggs sampled on different days of incubation as percent of egg weight
Day of incubation Embryo (%) 20E 31.80D 21E 35.76C 22E 42.37B 23E 49.91A SEM 0.733 P-value 0.0001 A,B,C,DMeans within columns with different upper case superscript letters differ significantly (P<0.01) Table A2.13. Extra-embryonic fluid collected from turkey eggs sampled on different days of incubation as percent of egg weight
Day of incubation Fluid (%) 20E 7.25A 21E 5.22B 22E 4.36B 23E 3.82B SEM 0.534 P-value 0.0001 A,BMeans within columns with different upper case superscript letters differ significantly (P<0.01) Table A2.14. Yolk of turkey eggs sampled on different days of incubation as percent of egg weight
Day of incubation Yolk (%) 20E 27.64 21E 27.30 22E 26.89 23E 26.23 SEM 0.504 P-value 0.2318 No difference was found between treatments
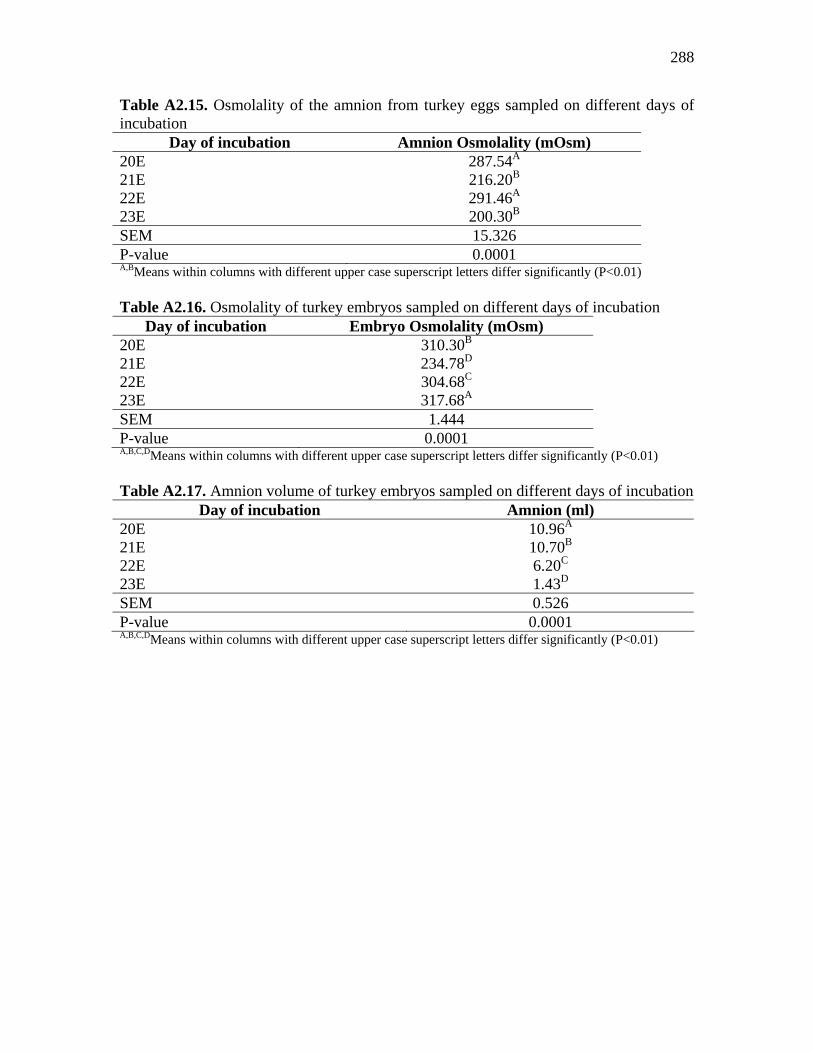
288
Table A2.15. Osmolality of the amnion from turkey eggs sampled on different days of incubation
Day of incubation Amnion Osmolality (mOsm) 20E 287.54A 21E 216.20B 22E 291.46A 23E 200.30B SEM 15.326 P-value 0.0001 A,BMeans within columns with different upper case superscript letters differ significantly (P<0.01) Table A2.16. Osmolality of turkey embryos sampled on different days of incubation
Day of incubation Embryo Osmolality (mOsm) 20E 310.30B 21E 234.78D 22E 304.68C 23E 317.68A SEM 1.444 P-value 0.0001 A,B,C,DMeans within columns with different upper case superscript letters differ significantly (P<0.01) Table A2.17. Amnion volume of turkey embryos sampled on different days of incubation
Day of incubation Amnion (ml) 20E 10.96A 21E 10.70B 22E 6.20C 23E 1.43D SEM 0.526 P-value 0.0001 A,B,C,DMeans within columns with different upper case superscript letters differ significantly (P<0.01)
289
Conclusion The optimum IOF solution osmolality based on body weight at hatch was
determined to be 708 mOsm, but this level of osmolality may adversely affect hatchability. In ovo feeding of whole egg reduced hatchability by 70%, so it is not a viable ingredient for in ovo feeding formulation. Osmolality of amniotic fluid averaged 241.90 mOsm, while embryo osmolality averaged 291.86 mOsm. In ovo feeding osmolality combined with amniotic fluid osmolality should not exceed embryo osmolality, but this hypothesis must be confirmed by future investigation.
References Foye, O. T. 2005. The biochemical and molecular effects of amnionic nutrient
administration, “in ovo feeding” on intestinal development and function and carbohydrate metabolism in turkey embryos and poults. Ph.D. Dissertation. North Carolina State University. Raleigh, NC.
Smirnov, A., E. Tako, P. R. Ferket, and Z. Uni. 2006. Mucin gene expression and mucin
content in the chicken intestinal goblet cells are affected by in ovo feeding of carbohydrates. Poult Sci 85:669-673.
Tako, E., P. R. Ferket, and Z. Uni. 2004. Effects of in ovo feeding of carbohydrates and
beta-hydroxy-beta-methylbutyrate on the development of chicken intestine. Poult Sci 83:2023-2028.
Tako, E., P. R. Ferket, and Z. Uni. 2005. Changes in chicken intestinal zinc exporter
mRNA expression and small intestinal functionality following intra-amniotic zinc-methionine administration. J Nutr Biochem 16:339-346.
Uni, Z., P. R. Ferket, E. Tako, and O. Kedar. 2005. In ovo feeding improves energy status
of late-term chicken embryos. Poult Sci 84:764-770.
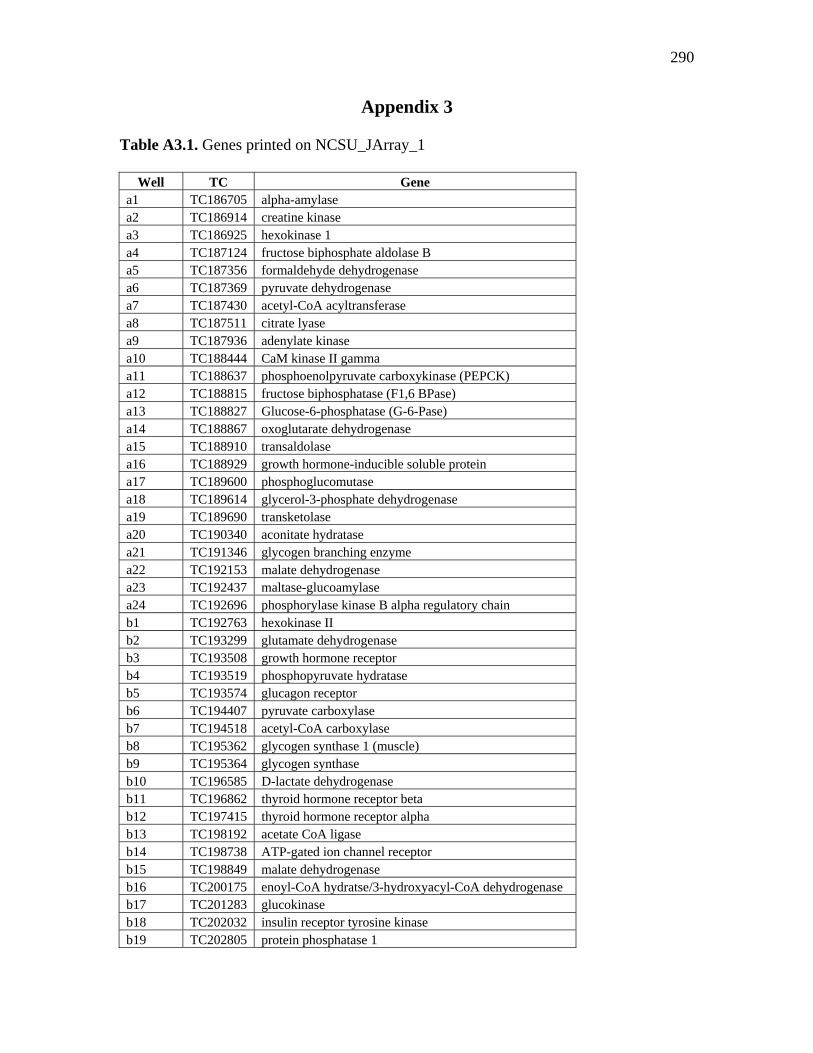
290
Appendix 3 Table A3.1. Genes printed on NCSU_JArray_1
Well TC Gene a1 TC186705 alpha-amylase a2 TC186914 creatine kinase a3 TC186925 hexokinase 1 a4 TC187124 fructose biphosphate aldolase B a5 TC187356 formaldehyde dehydrogenase a6 TC187369 pyruvate dehydrogenase a7 TC187430 acetyl-CoA acyltransferase a8 TC187511 citrate lyase a9 TC187936 adenylate kinase a10 TC188444 CaM kinase II gamma a11 TC188637 phosphoenolpyruvate carboxykinase (PEPCK) a12 TC188815 fructose biphosphatase (F1,6 BPase) a13 TC188827 Glucose-6-phosphatase (G-6-Pase) a14 TC188867 oxoglutarate dehydrogenase a15 TC188910 transaldolase a16 TC188929 growth hormone-inducible soluble protein a17 TC189600 phosphoglucomutase a18 TC189614 glycerol-3-phosphate dehydrogenase a19 TC189690 transketolase a20 TC190340 aconitate hydratase a21 TC191346 glycogen branching enzyme a22 TC192153 malate dehydrogenase a23 TC192437 maltase-glucoamylase a24 TC192696 phosphorylase kinase B alpha regulatory chain b1 TC192763 hexokinase II b2 TC193299 glutamate dehydrogenase b3 TC193508 growth hormone receptor b4 TC193519 phosphopyruvate hydratase b5 TC193574 glucagon receptor b6 TC194407 pyruvate carboxylase b7 TC194518 acetyl-CoA carboxylase b8 TC195362 glycogen synthase 1 (muscle) b9 TC195364 glycogen synthase b10 TC196585 D-lactate dehydrogenase b11 TC196862 thyroid hormone receptor beta b12 TC197415 thyroid hormone receptor alpha b13 TC198192 acetate CoA ligase b14 TC198738 ATP-gated ion channel receptor b15 TC198849 malate dehydrogenase b16 TC200175 enoyl-CoA hydratse/3-hydroxyacyl-CoA dehydrogenase b17 TC201283 glucokinase b18 TC202032 insulin receptor tyrosine kinase b19 TC202805 protein phosphatase 1
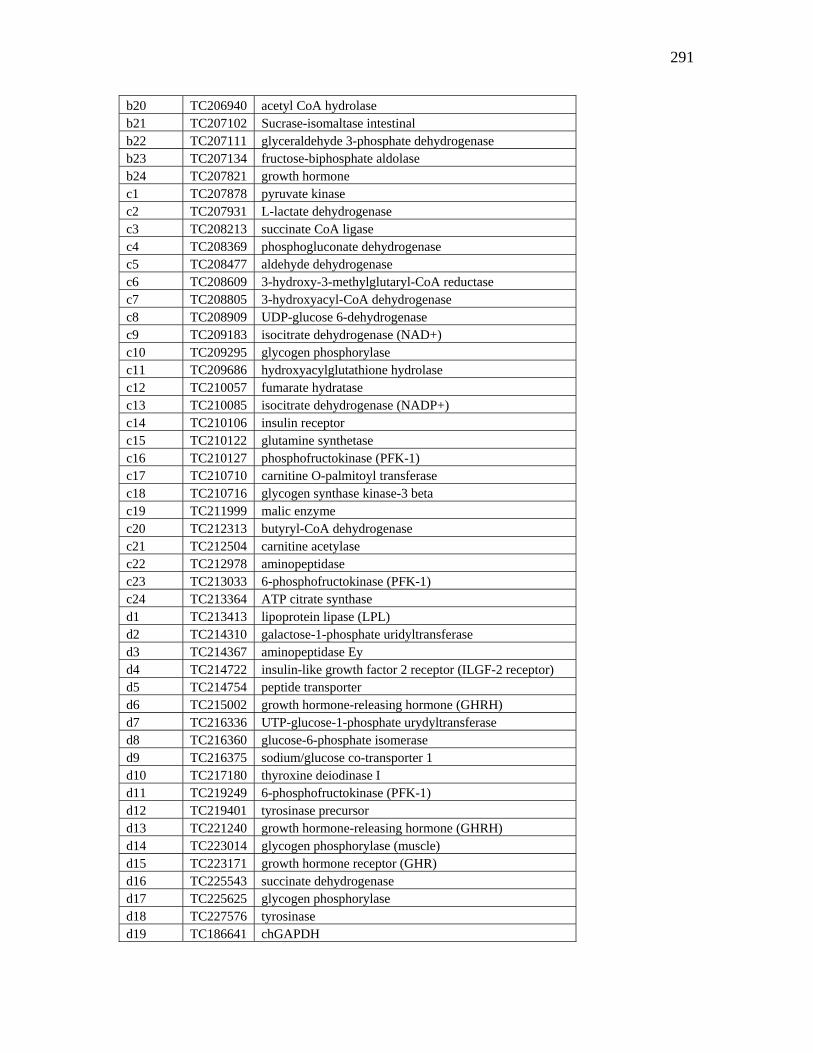
291
b20 TC206940 acetyl CoA hydrolase b21 TC207102 Sucrase-isomaltase intestinal b22 TC207111 glyceraldehyde 3-phosphate dehydrogenase b23 TC207134 fructose-biphosphate aldolase b24 TC207821 growth hormone c1 TC207878 pyruvate kinase c2 TC207931 L-lactate dehydrogenase c3 TC208213 succinate CoA ligase c4 TC208369 phosphogluconate dehydrogenase c5 TC208477 aldehyde dehydrogenase c6 TC208609 3-hydroxy-3-methylglutaryl-CoA reductase c7 TC208805 3-hydroxyacyl-CoA dehydrogenase c8 TC208909 UDP-glucose 6-dehydrogenase c9 TC209183 isocitrate dehydrogenase (NAD+) c10 TC209295 glycogen phosphorylase c11 TC209686 hydroxyacylglutathione hydrolase c12 TC210057 fumarate hydratase c13 TC210085 isocitrate dehydrogenase (NADP+) c14 TC210106 insulin receptor c15 TC210122 glutamine synthetase c16 TC210127 phosphofructokinase (PFK-1) c17 TC210710 carnitine O-palmitoyl transferase c18 TC210716 glycogen synthase kinase-3 beta c19 TC211999 malic enzyme c20 TC212313 butyryl-CoA dehydrogenase c21 TC212504 carnitine acetylase c22 TC212978 aminopeptidase c23 TC213033 6-phosphofructokinase (PFK-1) c24 TC213364 ATP citrate synthase d1 TC213413 lipoprotein lipase (LPL) d2 TC214310 galactose-1-phosphate uridyltransferase d3 TC214367 aminopeptidase Ey d4 TC214722 insulin-like growth factor 2 receptor (ILGF-2 receptor) d5 TC214754 peptide transporter d6 TC215002 growth hormone-releasing hormone (GHRH) d7 TC216336 UTP-glucose-1-phosphate urydyltransferase d8 TC216360 glucose-6-phosphate isomerase d9 TC216375 sodium/glucose co-transporter 1 d10 TC217180 thyroxine deiodinase I d11 TC219249 6-phosphofructokinase (PFK-1) d12 TC219401 tyrosinase precursor d13 TC221240 growth hormone-releasing hormone (GHRH) d14 TC223014 glycogen phosphorylase (muscle) d15 TC223171 growth hormone receptor (GHR) d16 TC225543 succinate dehydrogenase d17 TC225625 glycogen phosphorylase d18 TC227576 tyrosinase d19 TC186641 chGAPDH

292
d20 TC251311 atCAB2 - Arapdopsis d21 TC207783 chEF2 - elongation factor 2 d22 TC201083 chBACT d23 N/A Turkey genomic DNA d24 N/A Turkey genomic DNA
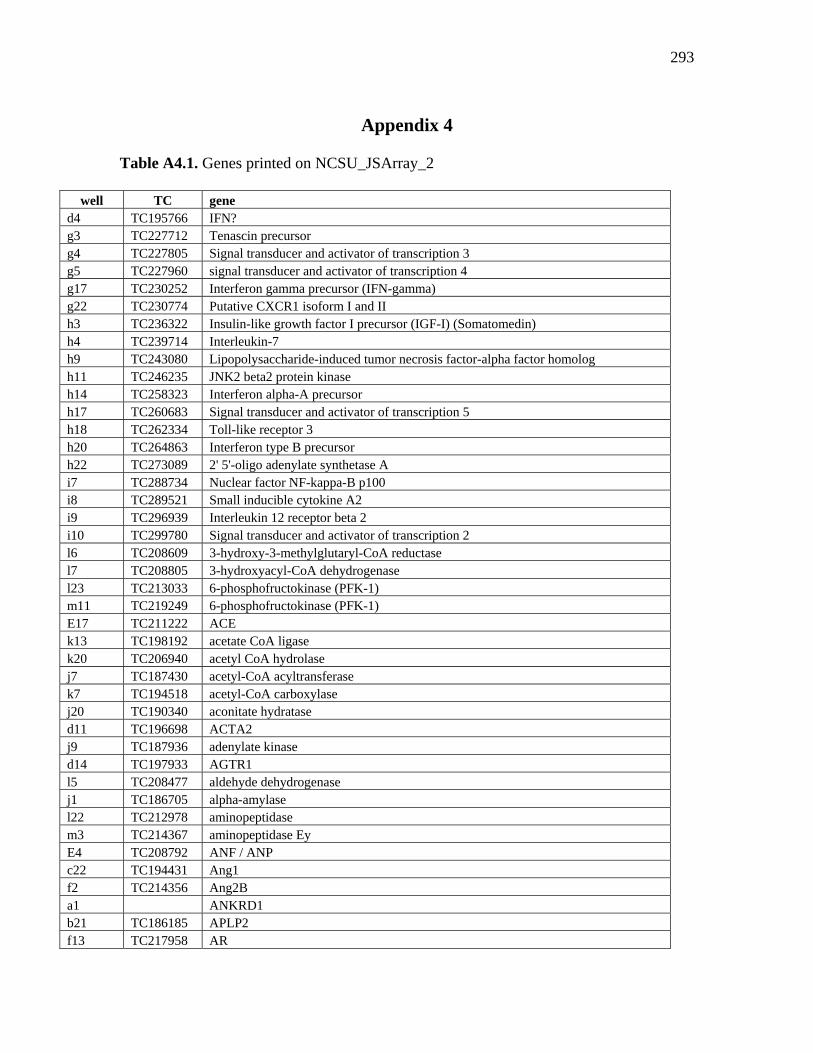
293
Appendix 4
Table A4.1. Genes printed on NCSU_JSArray_2
well TC gene d4 TC195766 IFN? g3 TC227712 Tenascin precursor g4 TC227805 Signal transducer and activator of transcription 3 g5 TC227960 signal transducer and activator of transcription 4 g17 TC230252 Interferon gamma precursor (IFN-gamma) g22 TC230774 Putative CXCR1 isoform I and II h3 TC236322 Insulin-like growth factor I precursor (IGF-I) (Somatomedin) h4 TC239714 Interleukin-7 h9 TC243080 Lipopolysaccharide-induced tumor necrosis factor-alpha factor homolog h11 TC246235 JNK2 beta2 protein kinase h14 TC258323 Interferon alpha-A precursor h17 TC260683 Signal transducer and activator of transcription 5 h18 TC262334 Toll-like receptor 3 h20 TC264863 Interferon type B precursor h22 TC273089 2' 5'-oligo adenylate synthetase A i7 TC288734 Nuclear factor NF-kappa-B p100 i8 TC289521 Small inducible cytokine A2 i9 TC296939 Interleukin 12 receptor beta 2 i10 TC299780 Signal transducer and activator of transcription 2 l6 TC208609 3-hydroxy-3-methylglutaryl-CoA reductase l7 TC208805 3-hydroxyacyl-CoA dehydrogenase l23 TC213033 6-phosphofructokinase (PFK-1) m11 TC219249 6-phosphofructokinase (PFK-1) E17 TC211222 ACE k13 TC198192 acetate CoA ligase k20 TC206940 acetyl CoA hydrolase j7 TC187430 acetyl-CoA acyltransferase k7 TC194518 acetyl-CoA carboxylase j20 TC190340 aconitate hydratase d11 TC196698 ACTA2 j9 TC187936 adenylate kinase d14 TC197933 AGTR1 l5 TC208477 aldehyde dehydrogenase j1 TC186705 alpha-amylase l22 TC212978 aminopeptidase m3 TC214367 aminopeptidase Ey E4 TC208792 ANF / ANP c22 TC194431 Ang1 f2 TC214356 Ang2B a1 ANKRD1 b21 TC186185 APLP2 f13 TC217958 AR
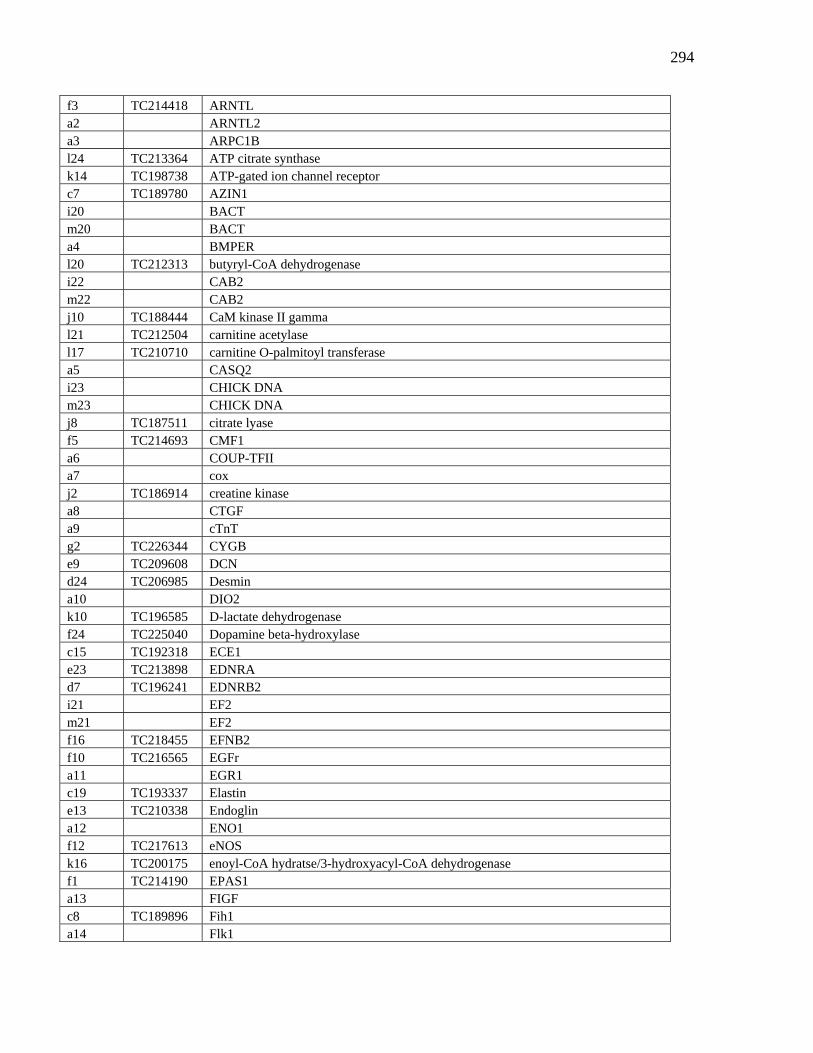
294
f3 TC214418 ARNTL a2 ARNTL2 a3 ARPC1B l24 TC213364 ATP citrate synthase k14 TC198738 ATP-gated ion channel receptor c7 TC189780 AZIN1 i20 BACT m20 BACT a4 BMPER l20 TC212313 butyryl-CoA dehydrogenase i22 CAB2 m22 CAB2 j10 TC188444 CaM kinase II gamma l21 TC212504 carnitine acetylase l17 TC210710 carnitine O-palmitoyl transferase a5 CASQ2 i23 CHICK DNA m23 CHICK DNA j8 TC187511 citrate lyase f5 TC214693 CMF1 a6 COUP-TFII a7 cox j2 TC186914 creatine kinase a8 CTGF a9 cTnT g2 TC226344 CYGB e9 TC209608 DCN d24 TC206985 Desmin a10 DIO2 k10 TC196585 D-lactate dehydrogenase f24 TC225040 Dopamine beta-hydroxylase c15 TC192318 ECE1 e23 TC213898 EDNRA d7 TC196241 EDNRB2 i21 EF2 m21 EF2 f16 TC218455 EFNB2 f10 TC216565 EGFr a11 EGR1 c19 TC193337 Elastin e13 TC210338 Endoglin a12 ENO1 f12 TC217613 eNOS k16 TC200175 enoyl-CoA hydratse/3-hydroxyacyl-CoA dehydrogenase f1 TC214190 EPAS1 a13 FIGF c8 TC189896 Fih1 a14 Flk1
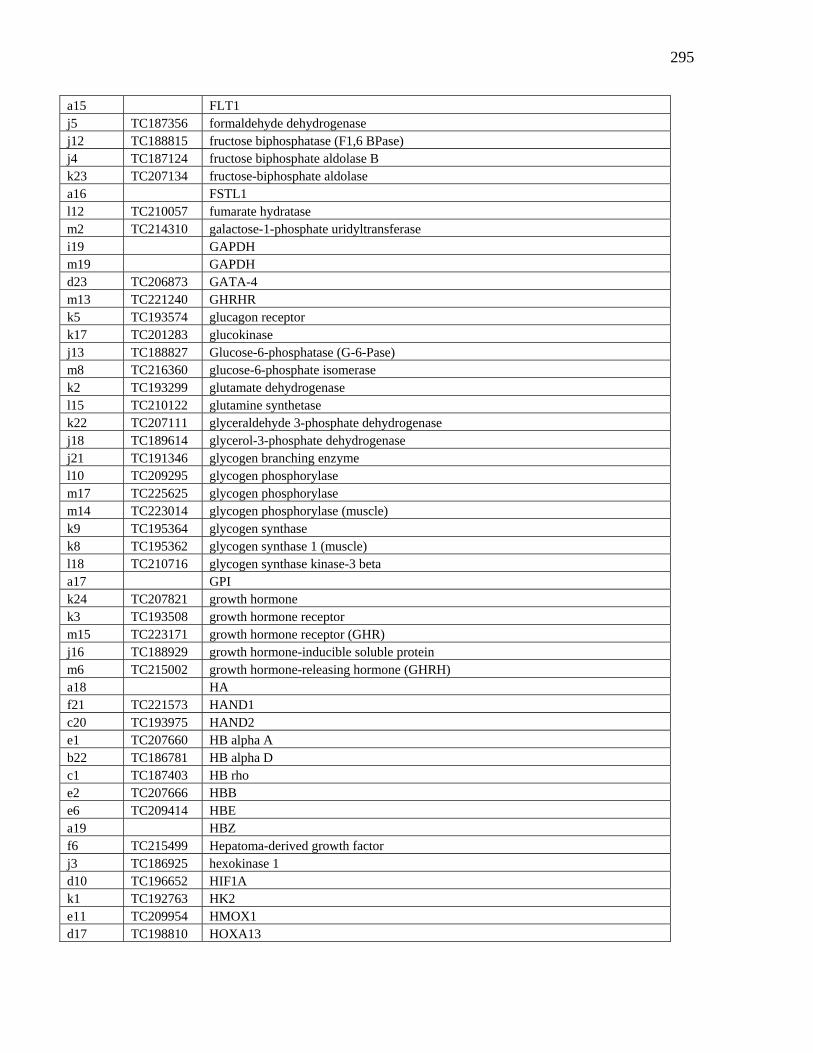
295
a15 FLT1 j5 TC187356 formaldehyde dehydrogenase j12 TC188815 fructose biphosphatase (F1,6 BPase) j4 TC187124 fructose biphosphate aldolase B k23 TC207134 fructose-biphosphate aldolase a16 FSTL1 l12 TC210057 fumarate hydratase m2 TC214310 galactose-1-phosphate uridyltransferase i19 GAPDH m19 GAPDH d23 TC206873 GATA-4 m13 TC221240 GHRHR k5 TC193574 glucagon receptor k17 TC201283 glucokinase j13 TC188827 Glucose-6-phosphatase (G-6-Pase) m8 TC216360 glucose-6-phosphate isomerase k2 TC193299 glutamate dehydrogenase l15 TC210122 glutamine synthetase k22 TC207111 glyceraldehyde 3-phosphate dehydrogenase j18 TC189614 glycerol-3-phosphate dehydrogenase j21 TC191346 glycogen branching enzyme l10 TC209295 glycogen phosphorylase m17 TC225625 glycogen phosphorylase m14 TC223014 glycogen phosphorylase (muscle) k9 TC195364 glycogen synthase k8 TC195362 glycogen synthase 1 (muscle) l18 TC210716 glycogen synthase kinase-3 beta a17 GPI k24 TC207821 growth hormone k3 TC193508 growth hormone receptor m15 TC223171 growth hormone receptor (GHR) j16 TC188929 growth hormone-inducible soluble protein m6 TC215002 growth hormone-releasing hormone (GHRH) a18 HA f21 TC221573 HAND1 c20 TC193975 HAND2 e1 TC207660 HB alpha A b22 TC186781 HB alpha D c1 TC187403 HB rho e2 TC207666 HBB e6 TC209414 HBE a19 HBZ f6 TC215499 Hepatoma-derived growth factor j3 TC186925 hexokinase 1 d10 TC196652 HIF1A k1 TC192763 HK2 e11 TC209954 HMOX1 d17 TC198810 HOXA13
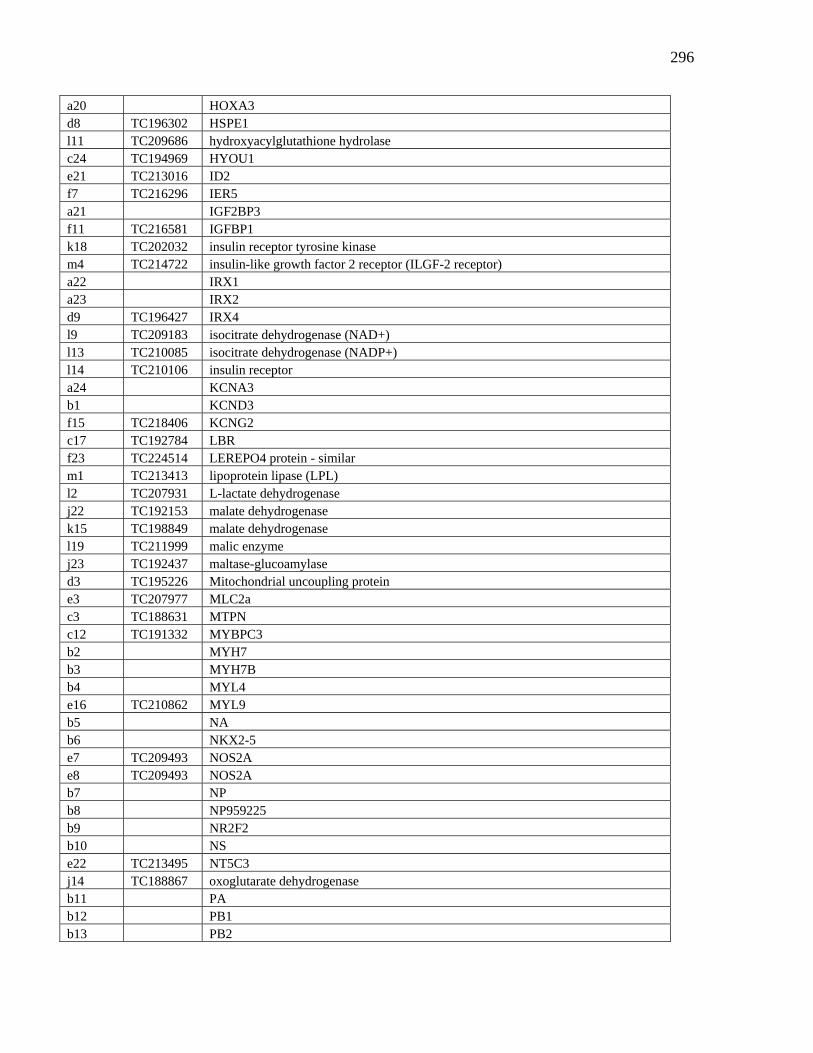
296
a20 HOXA3 d8 TC196302 HSPE1 l11 TC209686 hydroxyacylglutathione hydrolase c24 TC194969 HYOU1 e21 TC213016 ID2 f7 TC216296 IER5 a21 IGF2BP3 f11 TC216581 IGFBP1 k18 TC202032 insulin receptor tyrosine kinase m4 TC214722 insulin-like growth factor 2 receptor (ILGF-2 receptor) a22 IRX1 a23 IRX2 d9 TC196427 IRX4 l9 TC209183 isocitrate dehydrogenase (NAD+) l13 TC210085 isocitrate dehydrogenase (NADP+) l14 TC210106 insulin receptor a24 KCNA3 b1 KCND3 f15 TC218406 KCNG2 c17 TC192784 LBR f23 TC224514 LEREPO4 protein - similar m1 TC213413 lipoprotein lipase (LPL) l2 TC207931 L-lactate dehydrogenase j22 TC192153 malate dehydrogenase k15 TC198849 malate dehydrogenase l19 TC211999 malic enzyme j23 TC192437 maltase-glucoamylase d3 TC195226 Mitochondrial uncoupling protein e3 TC207977 MLC2a c3 TC188631 MTPN c12 TC191332 MYBPC3 b2 MYH7 b3 MYH7B b4 MYL4 e16 TC210862 MYL9 b5 NA b6 NKX2-5 e7 TC209493 NOS2A e8 TC209493 NOS2A b7 NP b8 NP959225 b9 NR2F2 b10 NS e22 TC213495 NT5C3 j14 TC188867 oxoglutarate dehydrogenase b11 PA b12 PB1 b13 PB2
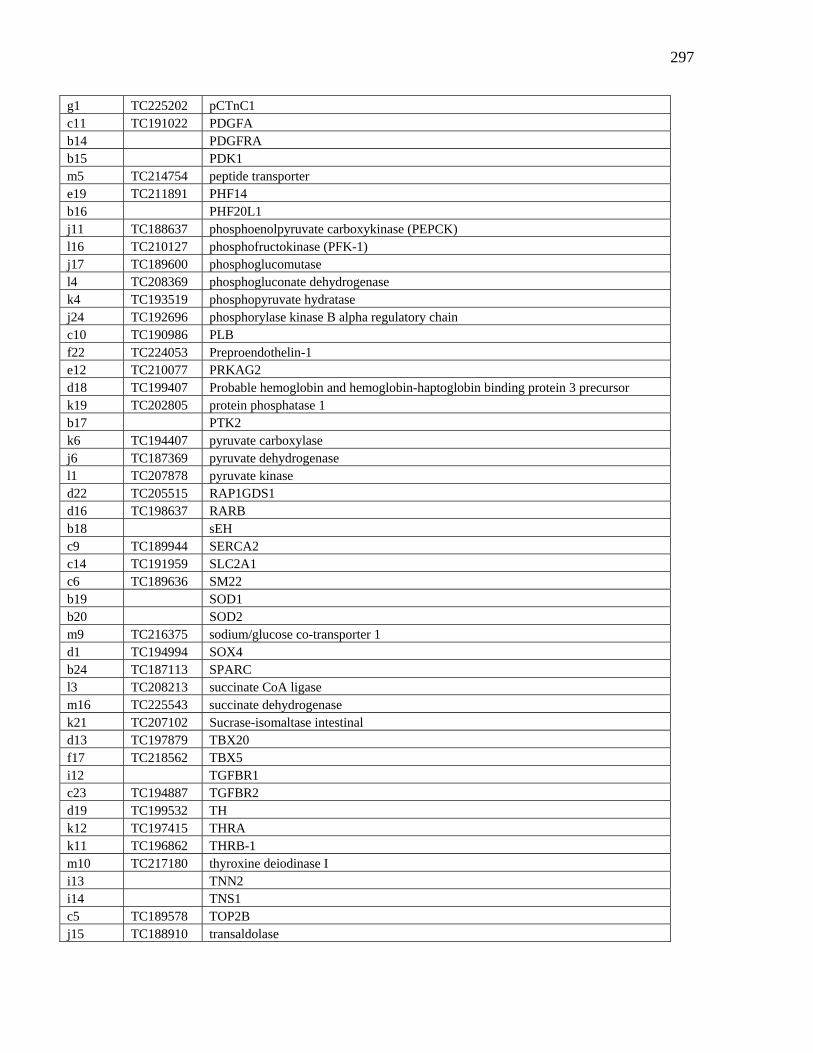
297
g1 TC225202 pCTnC1 c11 TC191022 PDGFA b14 PDGFRA b15 PDK1 m5 TC214754 peptide transporter e19 TC211891 PHF14 b16 PHF20L1 j11 TC188637 phosphoenolpyruvate carboxykinase (PEPCK) l16 TC210127 phosphofructokinase (PFK-1) j17 TC189600 phosphoglucomutase l4 TC208369 phosphogluconate dehydrogenase k4 TC193519 phosphopyruvate hydratase j24 TC192696 phosphorylase kinase B alpha regulatory chain c10 TC190986 PLB f22 TC224053 Preproendothelin-1 e12 TC210077 PRKAG2 d18 TC199407 Probable hemoglobin and hemoglobin-haptoglobin binding protein 3 precursor k19 TC202805 protein phosphatase 1 b17 PTK2 k6 TC194407 pyruvate carboxylase j6 TC187369 pyruvate dehydrogenase l1 TC207878 pyruvate kinase d22 TC205515 RAP1GDS1 d16 TC198637 RARB b18 sEH c9 TC189944 SERCA2 c14 TC191959 SLC2A1 c6 TC189636 SM22 b19 SOD1 b20 SOD2 m9 TC216375 sodium/glucose co-transporter 1 d1 TC194994 SOX4 b24 TC187113 SPARC l3 TC208213 succinate CoA ligase m16 TC225543 succinate dehydrogenase k21 TC207102 Sucrase-isomaltase intestinal d13 TC197879 TBX20 f17 TC218562 TBX5 i12 TGFBR1 c23 TC194887 TGFBR2 d19 TC199532 TH k12 TC197415 THRA k11 TC196862 THRB-1 m10 TC217180 thyroxine deiodinase I i13 TNN2 i14 TNS1 c5 TC189578 TOP2B j15 TC188910 transaldolase

298
j19 TC189690 transketolase c18 TC193336 Tropoelastin i24 TURKEY DNA m24 TURKEY DNA m18 TC227576 tyrosinase m12 TC219401 tyrosinase precursor l8 TC208909 UDP-glucose 6-dehydrogenase m7 TC216336 UTP-glucose-1-phosphate urydyltransferase i15 VEGF i17 XIN i16 YWHAB i18 YWHAB e5 TC209233 ZYX i1 TC284742 IL-2 precursor g21 TC230691 Interleukin-1beta g19 TC230515 IL-8 g20 TC230515 IL-8 h23 TC274133 Gal-1 alpha h24 TC279522 Gal-1 alpha i3 TC286576 Gal-2 g15 TC229568 Q4JIM4 g9 TC228700 Q5ZKW4 g8 TC228683 Carnitine palmitoyl transferase I h12 TC251657 CD3 glycoprotein h15 TC259029 CD3 glycoprotein complete h13 TC253132 Cytoskeletal beta actin h19 TC264669 Bu-1b h5 TC240827 Chemokine K203 precursor h1 TC234083 Beta-actin g12 TC228810 CCR i4 TC287964 CCR5 i5 TC288248 CCR9 h10 TC243402 CNDP dipeptidase 2 g18 TC230261 CXCR4 h2 TC234344 FasL h6 TC242243 GAPDH h7 TC242243 GAPDH f18 TC219402 GM-CSF i11 TC301924 homologue to T-cell immunoglobulin and mucin domain containing 4 g14 TC229540 IFNAR2 i6 TC288597 IFNGR2 e20 TC212665 IL1 d12 TC197579 IL10 h16 TC259509 IL10RA h8 TC242575 IL11RA f19 TC221524 IL13 h21 TC272839 IL13RA2 f4 TC214674 IL15
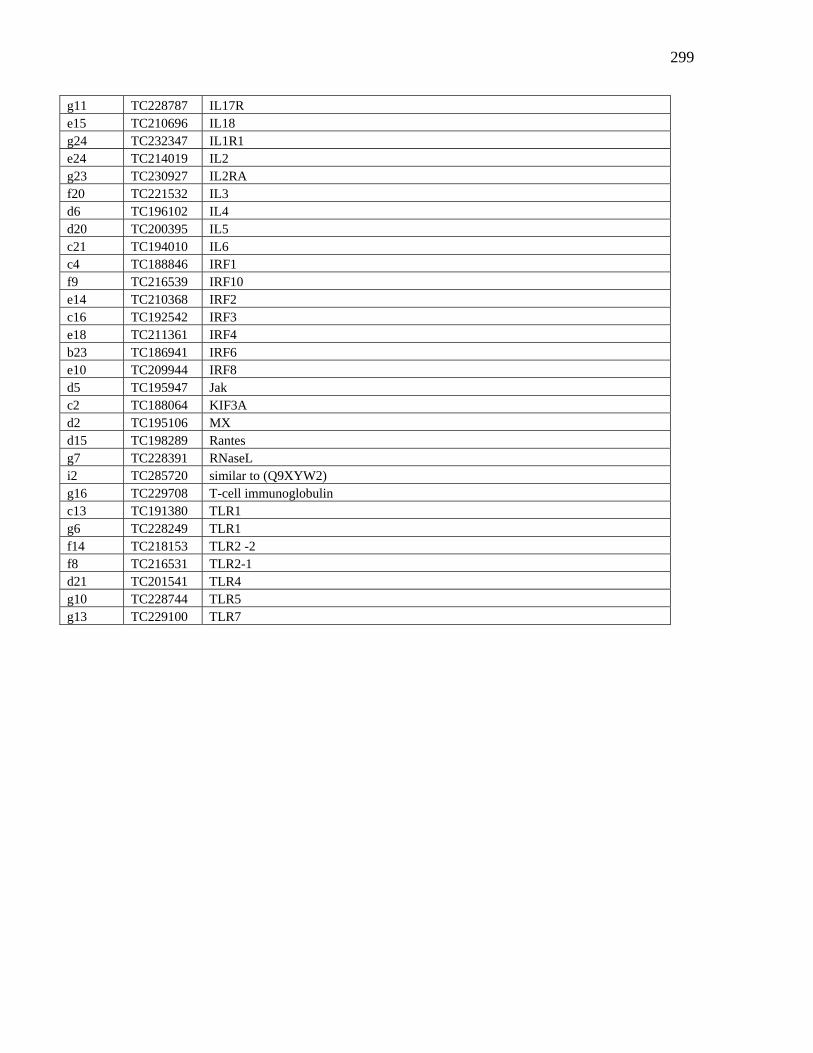
299
g11 TC228787 IL17R e15 TC210696 IL18 g24 TC232347 IL1R1 e24 TC214019 IL2 g23 TC230927 IL2RA f20 TC221532 IL3 d6 TC196102 IL4 d20 TC200395 IL5 c21 TC194010 IL6 c4 TC188846 IRF1 f9 TC216539 IRF10 e14 TC210368 IRF2 c16 TC192542 IRF3 e18 TC211361 IRF4 b23 TC186941 IRF6 e10 TC209944 IRF8 d5 TC195947 Jak c2 TC188064 KIF3A d2 TC195106 MX d15 TC198289 Rantes g7 TC228391 RNaseL i2 TC285720 similar to (Q9XYW2) g16 TC229708 T-cell immunoglobulin c13 TC191380 TLR1 g6 TC228249 TLR1 f14 TC218153 TLR2 -2 f8 TC216531 TLR2-1 d21 TC201541 TLR4 g10 TC228744 TLR5 g13 TC229100 TLR7
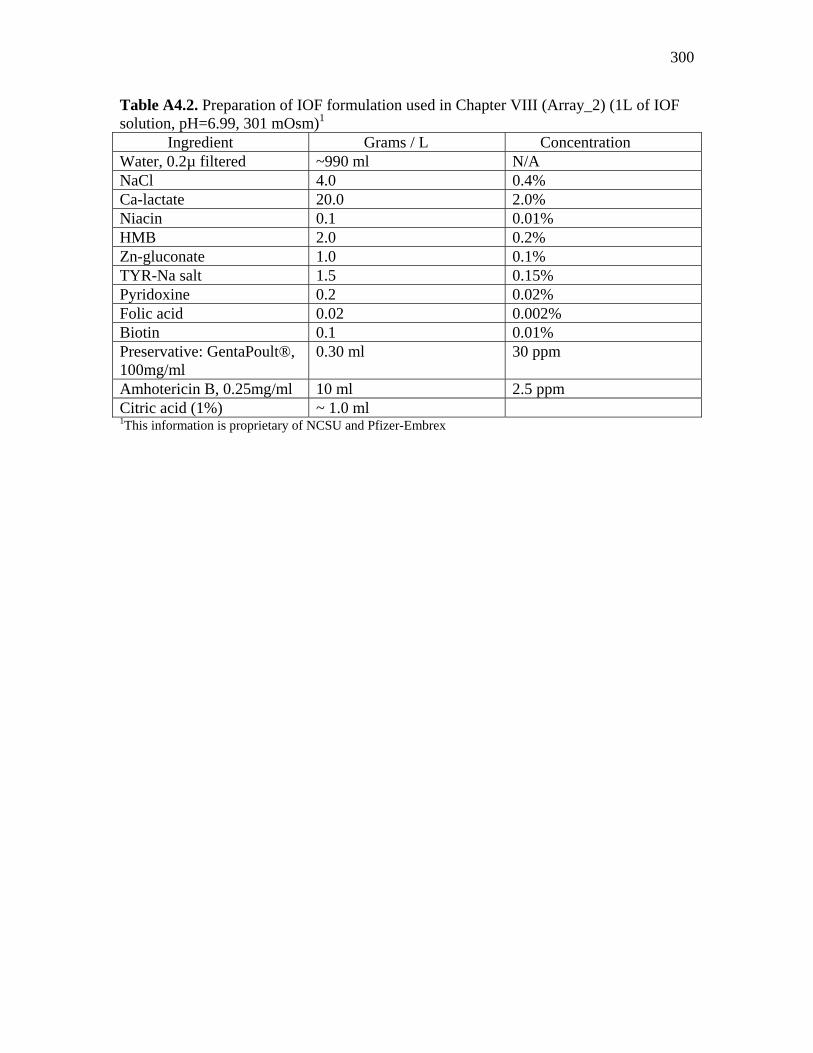
300
Table A4.2. Preparation of IOF formulation used in Chapter VIII (Array_2) (1L of IOF solution, pH=6.99, 301 mOsm)1
Ingredient Grams / L Concentration Water, 0.2µ filtered ~990 ml N/A NaCl 4.0 0.4% Ca-lactate 20.0 2.0% Niacin 0.1 0.01% HMB 2.0 0.2% Zn-gluconate 1.0 0.1% TYR-Na salt 1.5 0.15% Pyridoxine 0.2 0.02% Folic acid 0.02 0.002% Biotin 0.1 0.01% Preservative: GentaPoult®, 100mg/ml
0.30 ml 30 ppm
Amhotericin B, 0.25mg/ml 10 ml 2.5 ppm Citric acid (1%) ~ 1.0 ml 1This information is proprietary of NCSU and Pfizer-Embrex