ABSTRACT BOOK - Metrology Society of India – …. Anil Agarwal Sr. Metrologist NRC, Canada Dr....
207
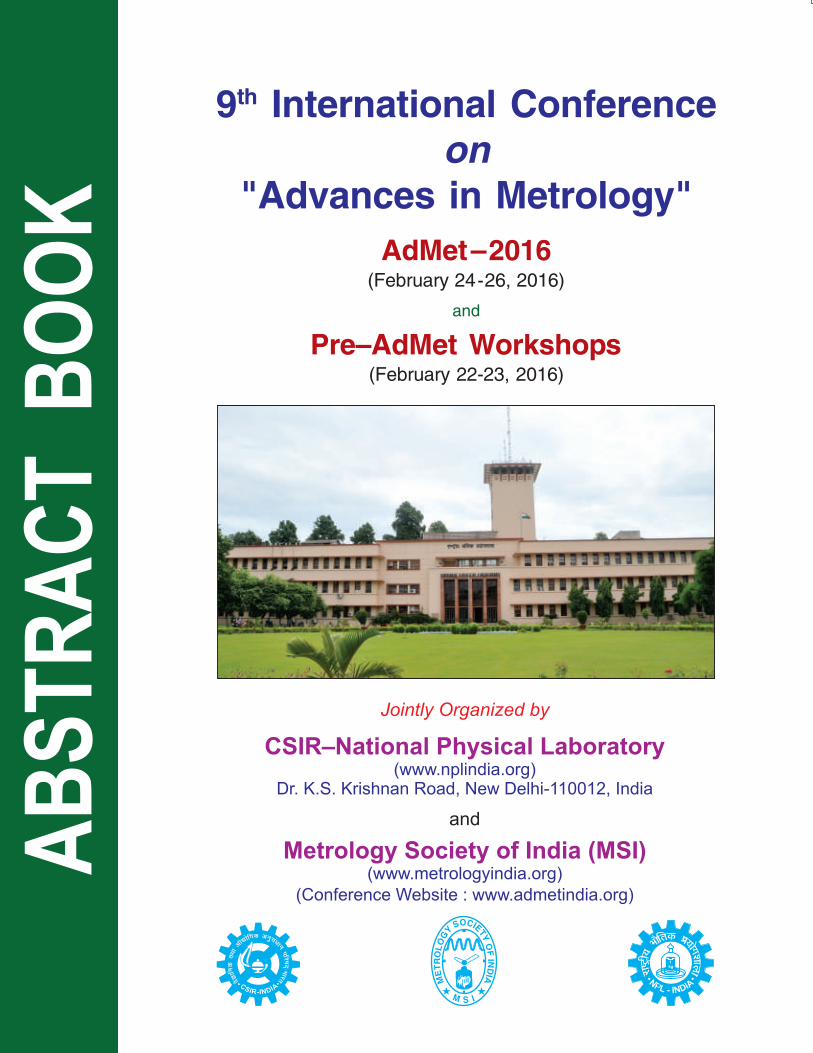
1 kg Jointly Organized by CSIR–National Physical Laboratory Metrology Society of India (MSI) and (www.nplindia.org) Dr. K.S. Krishnan Road, New Delhi-110012, India (www.metrologyindia.org) (Conference Website : www.admetindia.org) ABSTRACT BOOK
Transcript of ABSTRACT BOOK - Metrology Society of India – …. Anil Agarwal Sr. Metrologist NRC, Canada Dr....
1kg
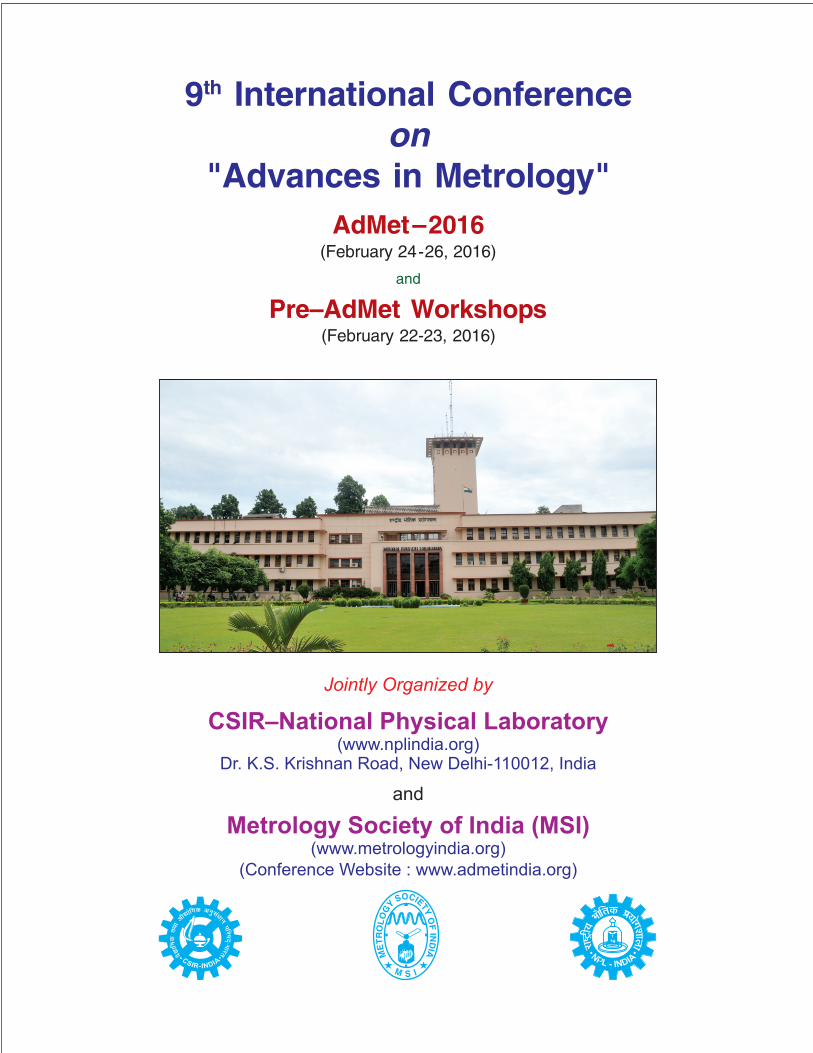
Jointly Organized by
CSIR–National Physical Laboratory
Metrology Society of India (MSI)
and
(www.nplindia.org)Dr. K.S. Krishnan Road, New Delhi-110012, India
(www.metrologyindia.org)(Conference Website : www.admetindia.org)
AB
ST
RA
CT
BO
OK
1kg
Jointly Organized by
CSIR–National Physical Laboratory
Metrology Society of India (MSI)
and
(www.nplindia.org)Dr. K.S. Krishnan Road, New Delhi-110012, India
(www.metrologyindia.org)(Conference Website : www.admetindia.org)
1kg
Council of Scientific and Industrial Research
CSIR-National Physical Laboratory
Metrological Soceity of India
National Accredation Board for Testing and Calibration Laboratories Gurgaon
Department of Science and Technology
Defence Research and Development Organization
Indian Space Research Organisation
Anusandhan Bhavan, 2 Rafi MargNew Delhi-110001, India
Dr. K.S.Krishnan MargNew Delhi-110012, India
CSIR-National Physical LaboratoryDr. K.S.Krishnan MargNew Delhi-110012, India
NABL House ,Plot No. 45 Sector 44, Gurgaon-122002, India
Technology Bhawan, New Mehrauli Road, New Delhi-110016, India
Ministry of Defence, DRDO Bhavan,Rajaji Marg, New Delhi, India
Dept. of Space, Antariksh Bhavan,New B.E.L. Road, Bangalore-560231, India
List of Govt. Sponsors

SILVER SPONSOR
GOLD SPONSOR
List of Private Sponsors
Mitutoyo South Asia Pvt. Ltd.C-122, Okhla Industrial Area, Phase-I,
New Delhi-110020, (India)
PLATINUM SPONSORS
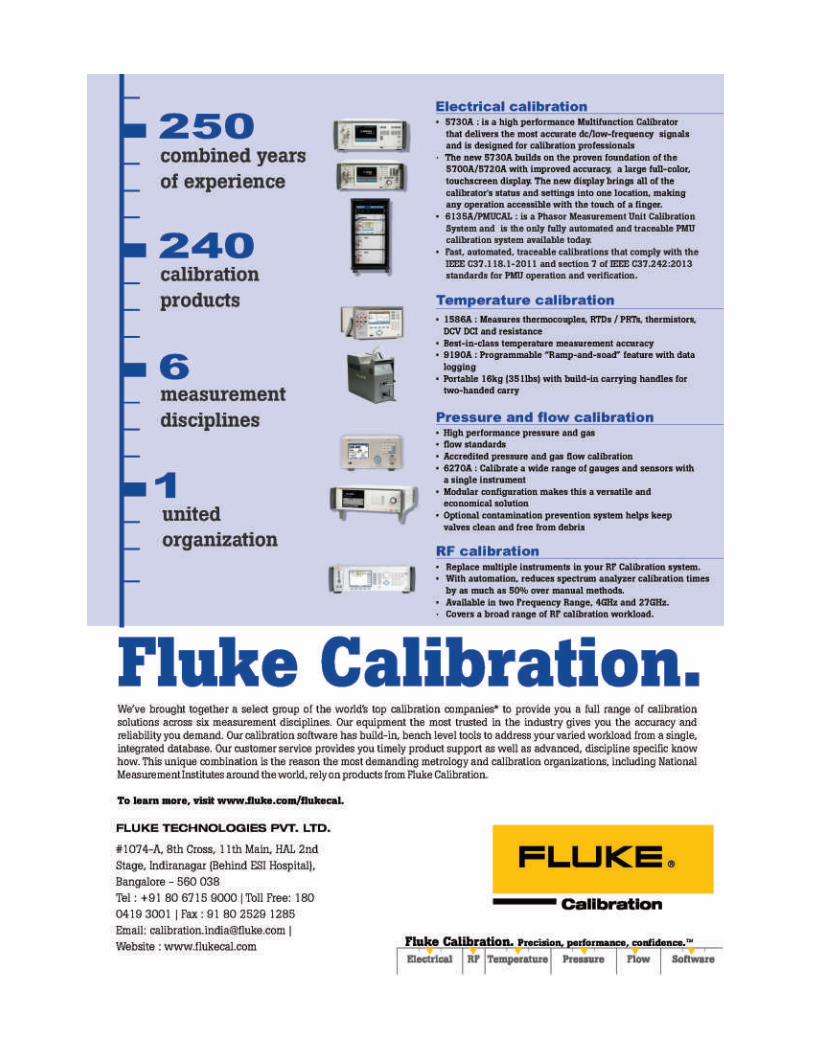
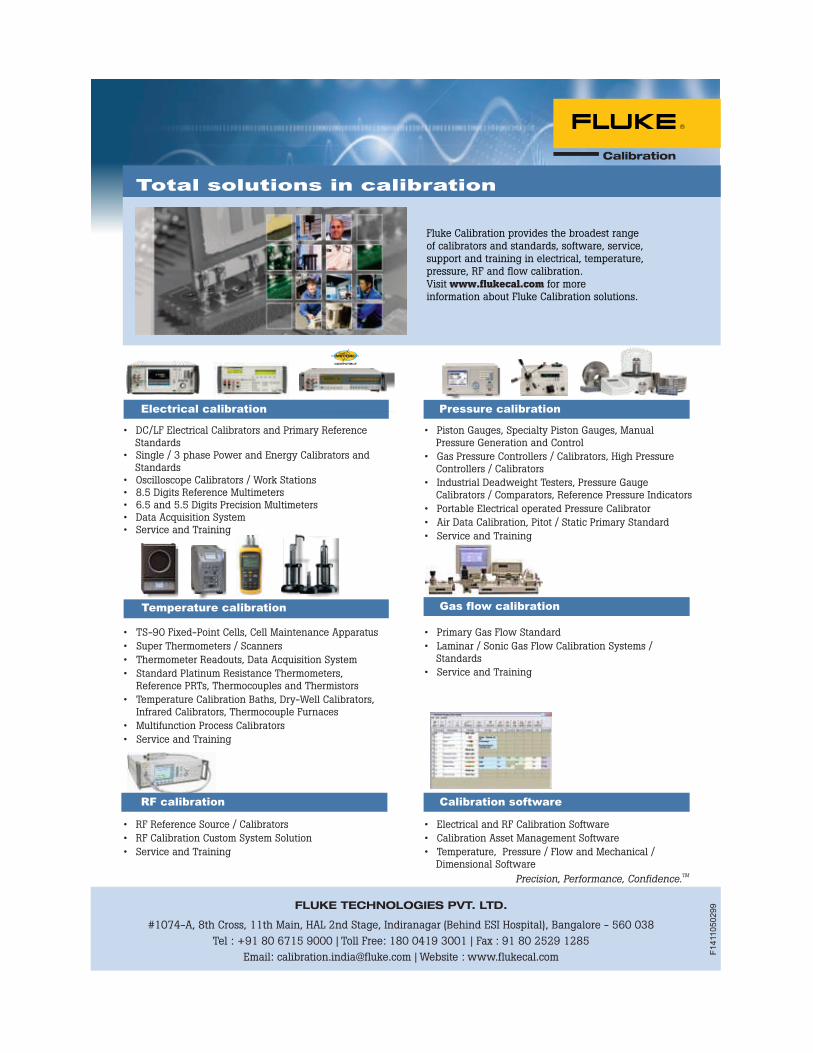
Fluke Technologies Pvt. Ltd.Deodhar Center, #424,
Marol Maroshi Road, Andheri (E),
Mumbai-400059, India
DIAMOND SPONSOR
Advance Technical Systems Pvt. Ltd.305, Pankaj Tower-III, L.S.C., Plot No. 6, Mayur Vihar
Phase-1, New Delhi-110091, India
Wika Instruments India Pvt. Ltd.Plot No. 40, Gate No. 94 & 100,
High Cliff Industrial Estate Village Kesnand,
Wagholi, Pune-412207, India
Octagon Precision (India) Pvt. Ltd.3/19 Girija Society, M.I.T. College Road,
Kothrud, Pune-411029, India

Fiem Industries Ltd.Corporate Office & LEDD Marketing Division
Area Commercial Tower (Unit No. 1A & 1C),st1 Floor, J.W. Marriott Hotel
Aerocity, New Delhi-110037, India
ACE Gas Analysers Pvt. Ltd.1, Biradari, Opp. Bank of Baroda, M. G. Road,
Ghatkopar (W), Mumbai–400 086, India
TEA SPONSOR
Sartorius Weighing India Private Limitedth rd17, 5 Main, 3 Phase, Peenya, Kiadb Industrial Area,
Peenya, Bangalore, Karnataka-560058, India
Exhibitore/Advirtisers
Zeal Manufacturing Co.13, Konark Udyog, Off. Karve Road, Nr. Satyam Indl. Estate,
Erandwane, Pune-411038, India
Belz Instruments Pvt. Ltd.5L-123, N.I.T., Faridabad-121001 (Haryana)
Institute for Design of Electrical
Measuring InstrumentsSwatantryaveer Tatya Tope Marg, Chunabhatti,
Sion, Mumbai-400022, India
Sushma Industries Pvt. Ltd.ndstPlot No. 18E, Block-B, I ‘C’ Main Road, 2 Phase,
Peenya Industrial Area, Peenya, Bangalore-560058, India
MARS Bioanalytical Pvt. Ltd.201-203, Atlantic Plaza DDA LSC, Opp. Samachar Appts.,
Mayur Vihar, Phase-1, Delhi-110091, India
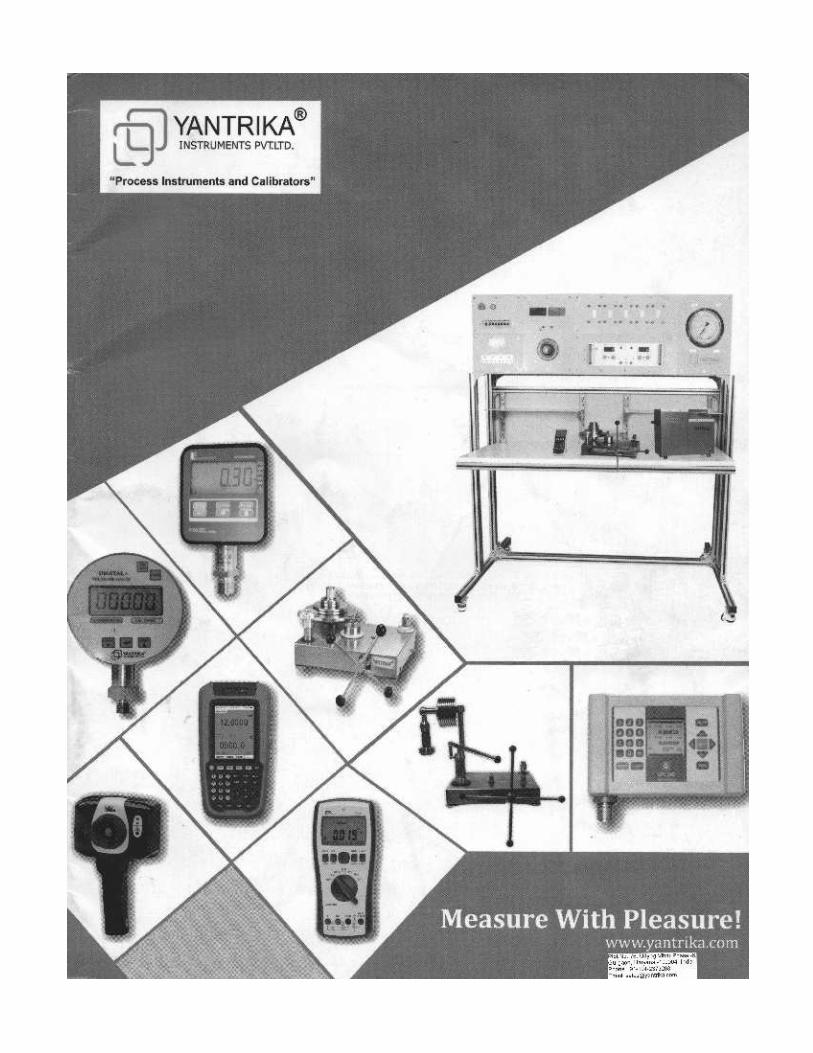
Yantrika Instruments Pvt. Ltd.Plot No. 76, Udyog Vihar, Phase-6, Gurgaon,
Haryana-122001, India
Isothermal Technology Pvt. Ltd.303, Plot No. 6, Chetan Complex,
LSC Shrestha Vihar, Delhi-110092, India
LCGCLCGC Tower, 161/166, Paigah Colony, Near Anand Theatre,
S.P. Road, Secunderabad-500003, India
Agmatel India Pvt. Ltd.E-366, IInd Floor, Nirman Vihar, Vikas Marg,
Delhi-110092 (India)
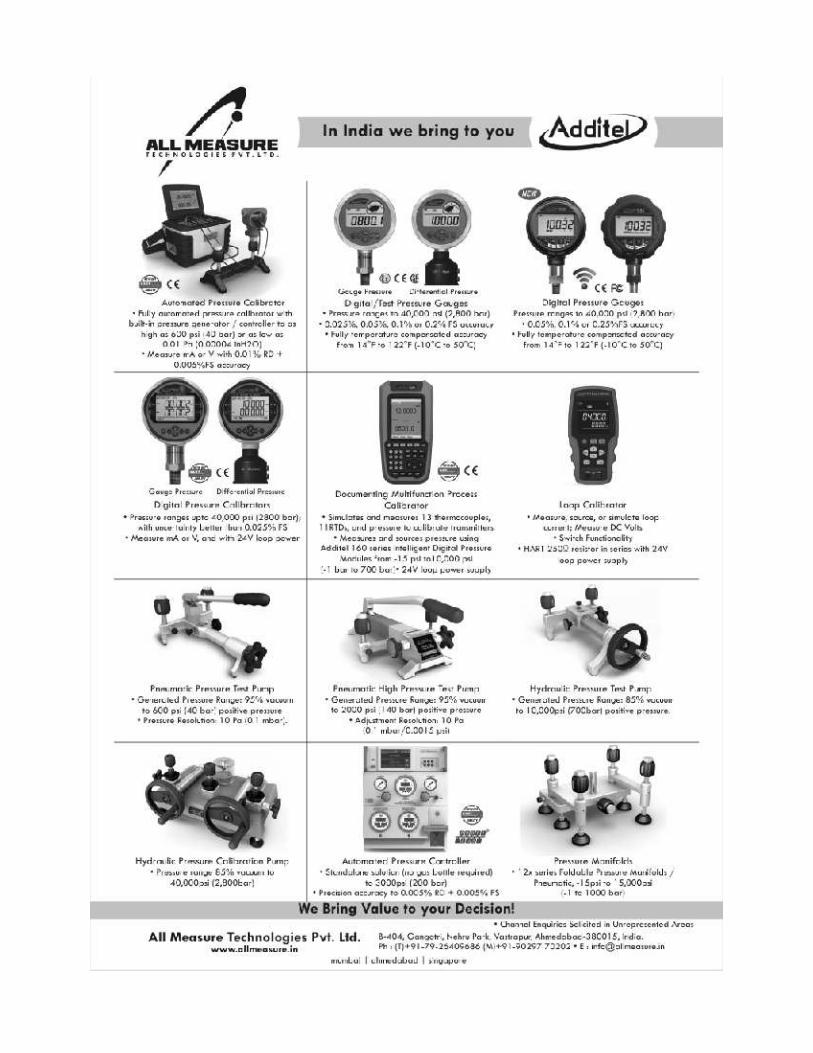
All MeasureB-404, Gangotri, Nehru Park, Vastrapur,
Ahmedabad-380015, India
Wensar Weighing Scales LimitedNo. 83, Audiappa Naicken Street,
Near Elephant Gate, Sowcarpet, Chennai-600079, India
Beatus Social Compliance Services Ltd.Utsav Bhawan, Kamardanga Road,
Ichapur, Howrah, West Bengal-711104, India
Sika India53, Soham Row House, B/H Bhavin School, Thaltej,
Ahmedabad-380059, Gujarat, India
National Council for Cement and Building MaterialsNH2, Industrial Area, Sector 4,
Ballabgarh, Faridabad, Haryana-121001
9th International Conference on “Advances in Metrology - 2016”
vi
INTERNATIONAL ADVISORY COMMITTEE
Dr. Girish SahniDG, CSIR, India
Dr. D.K. AswalDirector, CSIR-NPL, India
Dr. A. Sen GuptaPresident, MSI, India
Prof. Martin J. MiltonDirector, BIPM, France
Dr. Joachim UllrichPresident, PTB, Germany
Prof. S. K. JoshiEx-Director General, CSIR, India
Prof. Ajay Kumar SoodIISc. Bangalore, India
Prof. R. C. BudhaniIIT, Kanpur, Ex-DirectorCSIR-NPL, India
Dr. Chandra ShekharEx-Director, CSIR-NPL, India
Prof. E. S. RajagopalINSA Hon. Scientist, IISc, Bangaloreand Ex-Director CSIR-NPL, India
Prof. A. K. Ray ChaudhuriEx-Director, CSIR-NPL, India
Dr. Joachim FischerPTB, Germany
Dr. Douglas OlsonNIST, USA
Dr. Graham MachinETCT-Chair & Head TemperatureStandards, NPL, UK
Dr. Peter FiskChief Executive and Chief MetrologistNMIA, Australia
Prof. Krishan LalEx-President, INSA andEx-Director, CSIR-NPL, India
Prof. Vikram KumarIIT, Delhi and Ex-Director,CSIR-NPL, India
Dr. Tokihiko KobataDy. Director, NMIJ, Japan
Dr. Wu FangdiDy. Director, NIM, China
Dr. Armin SperlingDirector, Photometry, PTB, Germany
Dr. Kamal HossainDirector, Research & International, NPL, UK
Dr. Stefan KueckDirector, Photometry & Radiometry, PTB, Germany
Dr. Young-Gyoo KimKRISS, TCT Chair, Korea
Dr. Toshiyuki TakatsujiDirector, Research Institute forEngineering Measurement, NMIJ, Japan
Dr. Peter MansonProject Leader, Optical StandardsPhysical Metrology, NMIA, Austrailia
Dr. Dae-iM KangMember CIPM, KRISS, KoreaDr. Jin-Wan ChungHead, Mass Metrology, KRISS, Korea
Dr. Zhang JintaoNIM, China
Dr. Jorge C. Torres GuzmanDirector, Force and Pressure Metrology,CENAM, Mexico
Dr. Mohamed SadliHead, Contact ThermometryLNE-CNAM, France
Dr. Yoshiro YamadaHead, Radiation ThermometryNMIJ, Japan
Dr. Jiunn-Haur ShawCMS/ITRI, Taiwan
Dr. Chun-Min SuVice Chair, TCFF-APMPCMS/ITRI, Taiwan
Dr. Yi Hua TangQuantum Electrical Metrology Division, NIST, USA
9th International Conference on “Advances in Metrology - 2016”
vii
Dr. Michael PodestaPrincipal Research ScientistNPL, UK
Dr. Howard W. YoonPhysicist, Sensor ScienceDivision, NIST, USA
Dr. Anil AgarwalSr. MetrologistNRC, Canada
Dr. James K. OlthoffDirector, Physical Measurement Laboratory,NIST, USA
Mr. John WhiteCEO, Budenburg, UK
Prof. Paolo LajCNRS-Université Grenoble-Alpes, France
Prof. C.J. TsaiDistinguish Professor, NCTU, Taiwan
NATIONAL ADVISORY COMMITTEE
Dr. D.K. AswalDirector, CSIR-NPL, New Delhi
Dr. A. Sen GuptaPresident, MSI, New Delhi
Dr. Chandra ShekharEx-Director, CSIR-NPL, New Delhi
Dr. R.P. SinghSecretary General, QCI, New Delhi
Mr. Anil ReliaDirector, NABL, Gurgaon
Dr. B. N. DixitDirector, Legal Metrology, New Delhi
Mr. S. Satish KumarDirector In-charge, CMTI, Bengaluru
Mrs. Veena S. KamathDirector, ETDC, Bangalore
Mr. S. V. RasalPrincipal Director, IDEMI, Mumbai
Mr. S. K. KimothiEx-Director, ERTL (N), New Delhi
Dr. Pius PaulActing Director, CMERI, Durgapur
Prof. S. H. PawarVC, D.Y. Patil University, Kolhapur
Prof. B. P. PatelIIT, Delhi, New Delhi
Prof. K. S. NanglaNIT, Jalandhar
Prof. Ravinder AgarwalThapar University andGeneral Secretary, MSI (NR), Patiala, Punjab
Dr. Anuj BhatnagarBIS, New Delhi
Mr. R. Sadanand MurthyCEO, Sushma Industries andGeneral Secretary, MSI (SR), Bangalore
Mr. N. BajajMD, Mitutoyo South Asia Pvt. Ltd., New Delhi
Mr. Arindam MazumdarFluke Technologies Pvt. Ltd., New Delhi
Mr. Arun JhaAdvance Technical Systems (ATS), New Delhi
Mr. Hemant PandaWIKA Instruments, Pune
Mr. Arun KudaleMD, Kudale Calibration Lab. andVice-President, MSI (WR), Pune
Mr. Vivek BaggaM/s Bagson Calibration Lab. Pvt. Ltd., New Delhi
Mr. P. K. AggarwalTAFE, Chennai
Mr. Shekhar SinghaniaWeigh India, New Delhi
Mr. Karunakar GiriBudenburg Gauge Pvt. Ltd., Chennai
Mr. Garauv JainYantrika Instruments Pvt. Ltd, Gurgaon
9th International Conference on “Advances in Metrology - 2016”
viii
LOCAL ORGANIZING COMMITTEE
Dr. A. Sen Gupta Dr. V.N. Ojha Dr. Y.P. Singh
Dr. K.P. Chaudhary Dr. Sanjay Yadav Mr. Anil Kumar
Dr. Prabhat Gupta Dr. Ranjana Mehrotra Dr. R.K. Kotnala
Dr. Rajeev Chopra Mr. Thomas John Dr. Rina Sharma
KEY NOTE SPEAKER PLENARY TALK
Prof. Martin J. Milton Prof. J. Hermann UllrichDirector, BIPM, France President, PTB, Germany
PATRON CONFERENCE CHAIR CO-CHAIRS
Dr. D.K. Aswal Dr. A. Sen Gupta Dr. V. N. OjhaDirector, CSIR-NPL, India President, MSI, India CSIR-NPL, India
Dr. K.P. ChaudharyCSIR-NPL, India
CONVENER CO-CONVENER
Dr. Y. P. Singh Dr. Sanjay YadavCSIR-NPL, India CSIR-NPL, India
LOCAL ORGANIZING SUB-COMMITTEES
Finance & Resource Committee
Mr. Anil Kumar, ChairmanDr. Sanjay Yadav, ConvenerDr. K.P. ChaudharyDr. Y.P. SinghDr. Prabhat Kumar GuptaDr. Ranjana MehrotraDr. R.K. KotnalaDr. M.V.S.N. PrasadMr. Thomas JohnMr. P.S. NegiDr. Shankar AgarwalDr. S.S.K. Titus
Technical Program Committee
Dr. V.N. Ojha, ChairmanDr. Shankar Agarwal, Convener
Dr. K.P. ChaudharyDr. Y.P. SinghMr. Anil KumarDr. Sanjay YadavDr. P.S. NegiDr. Sudhir Kumar SharmaDr. Sukhvir SinghDr. D.D. Shivagan
Reception & Registration Committee
Dr. Ranjana Mehrotra, ChairmanMs. Girja Mona, ConvenerDr. Nita Dilawar SharmaDr. Manju AroraMs. Usha KiranMs Kirti SoniMs Sandhya Patel
9th International Conference on “Advances in Metrology - 2016”
ix
Mr. Sandeep KumarMr. Raman Kumar SharmaMr. R.B. SibalMr. Vijay KumarMr. S.K. DubeyMr. Ashok Kumar
Hall Management Committee
Dr. R.K. Kotnala, ChairmanDr. D.D. Shivagan, ConvenerDr. S.S.K. TitusDr. Parag SharmaDr. Subhasis PanjaDr. Nahar SinghDr. Harish RathoreMr. K.P. S. YadavMr. Gaurav GuptaMr. Harish KumarMr. Rajesh KumarMs. Jyoti Pokhariyal
Hospitality, Accommodation and Transport
Dr. K.P. Chaudhary, ChairmanMr. SK. Jaiswal, ConvenerDr. Y.P. SinghMr. Gautam MandalMr. A.K. SuriMr. Niranjan SinghMr. M.K. GandhiMr. Jokhan RamMr. Mukesh KumarMr. Anish KumarMr. Jagannath PrasadMr. Hansraj MeenaMr. HansrajMr. Dinesh SharmaMr. YatendraMr. I.S. TaakDr. Khem SinghMr. Saod AhmadMr. Amreek Singh
Mr. Jai TawaleMr. Mohit Saxena
Exhibition, Poster & Signage Committee
Dr. P. K. Gupta, ChairmanDr. P. K. Dubey, ConvenerDr. Yudhister KumarDr. H.K. SinghDr. Ashis Kumar AgarwalDr. Ashok KumarDr. Subhadeep deMr. V.K. JaiswalMs Dipti ChadhaDr. Harish KumarMr. Arif SanjidMr. Jasveer SinghMr. R.K. SharmaMr. Bhikham Singh
Cultural Program Committee
Dr. Rina Sharma, ChairmanMr. J. N. Upadhyay, ConvenerDr. Rajiv RakshitDr. Punam AroraMr. V.K. GuptaMr. Manoj KumarMr. Lalit KumarMr. Prasun BhowalMr. Om PrakashMr. Chatar Singh Chauhan
Website and Internet
Dr. Rajiv Chopra, ChairmanMr. Nitin Sharma, ConvenerMr. N.K. WadhwaDr. Naveen GargDr. S.K. DubeyMr. Tri Lok BhardwajM. Rajiv JainMr. SatishMr. M.A Ansari

9th International Conference on “Advances in Metrology - 2016”
x
9:00-9:30 h Registration
9:30-9:40 h Welcome by Director, NPLI
9:40-9:50 h About workshop by Prabhat K. Gupta
9:50-10:30 h Paolo Laj, Executive Editor - AMT
Chair of Scientific Advisory Group on Aerosol GAW/WMO, France
"Concepts for a sustainable international aerosol network"
10:30-10:50 h Tea
10:50-11:30 h Alfred Wiedensohler, Editors-in-Chief - AE
World Calibration Center for Aerosol Physics, Germany
"The world calibration center for aerosol physics - duties and measures for quality assurance"
11:30-12:10 h S.D. Attri, Dy Director General, IMD, India
"QA/QC challenges in environmental monitoring"
12:10-12:50 h C.J. Tsai, Editors-in-Chief - AAQR, NCTU, Taiwan
"PM2.5
sampling and artifacts"
12:50-13:50 h Lunch
13:50-14:30 h S.K. Tyagi, CPCB, India
"Air quality monitoring in India: Issues and challenges"
14:30-15:10 h C. Sharma, NPLI
"Ambient air quality monitoring at Himalaya region"
15:10-15:30 h Tea
15:30-16:10 h S. G. Aggarwal, NPLI
"Air quality metrology"
16:10-16:50 h Markus Fiebig, World Data Center on Aerosol, Norway
"Management of aerosol data in GAW: making data count for global applications"
16:50-17:30 h Presentation from industries and panel discussions chaired by Prabhat K. Gupta
17:30 h Closing of the workshop
Pre-AdMet Workshop on
"Metrology in Chemistry: Ambient Air Quality Measurements"Date: 23rd February, 2016 • Venue : CSIR-National Physical Laboratory, New Delhi-110012, INDIA
Jointly organized by CSIR-NPLI, MSI and WMO/GAW
Technical Program

9th International Conference on “Advances in Metrology - 2016”
xi
Two days Pre-AdMet Workshop on
Best Practices in Measurement and Evaluation of UncertaintyCSIR-National Physical Laboratory, New Delhi
Venue : TEC Conference Room
Programme Schedule
February 22, 2016
09:30 - 09:45 Registration
09:45 - 10:00 Welcome of the Participants and about the Workshop by Dr. V. N. Ojha, HOD, ALSIM
Time Speaker Title of the talk
10:00 - 10:30 Mr. Anil Relia, Director, NABL Accreditation process
Tea (10:30 - 11:00)
11:00 - 11:30 Mr. B. Dixit, Director, Legal Metrology Legal Metrology
11:30 - 12:30 Mr. S. K. Kimothi, Ex-Director, ERTL(N) Best Practices in Measurements
12:30 - 13:30 Dr. K. P. Chaudhary, Ex-Chief Scientist, CSIR-NPL Excellence in measurements
Lunch (13:30 - 14:30)
14:30 - 15:30 Hands-on training
Tea (15:30 - 15:45)
15:45 - 17:00 Hands-on training
February 23, 2016
Time Speaker Title of the talk
9:30 - 10:30 Dr. V. N. Ojha, Chief Scientist, CSIR-NPL Basics in Metrology and Evaluation of
Uncertainty
10:30 - 11:30 Mr. Anil Kumar, Chief Scientist, CSIR-NPL Requirements of ISO/IEC 17025
Tea (11:30 - 11:45)
11:45 - 12:30 Mr. D. K. Nayyar, Scientist G & Dy. Standards and Standardization Process
DG (Standardization), BIS
12:30 - 13:15 Mr. A. K. Saxena, Ex-Chief Scientist, CSIR-NPL Quality system and CMC approval
Lunch (13:15 - 14:15)
14:15 - 16:15 Hands-on training
Tea (16:15 - 16:30)
16:30 - 17:00 Valedictory Session and Certificates distribution
9th International Conference on “Advances in Metrology - 2016”
xii
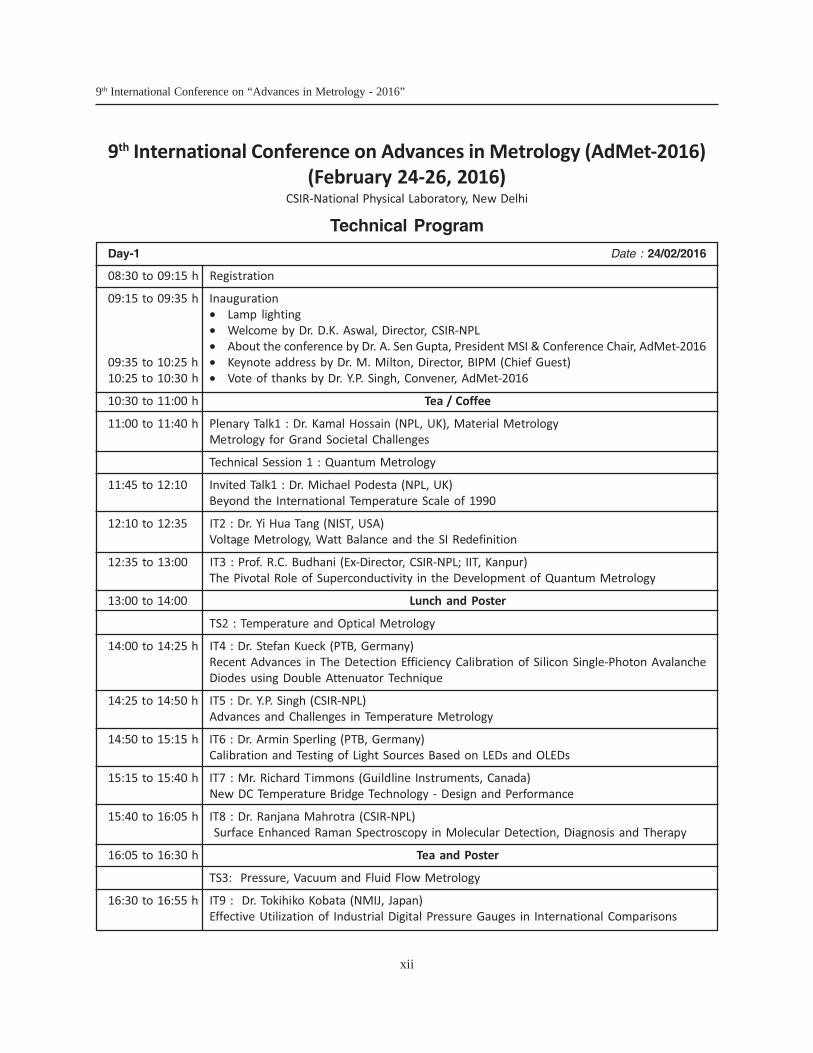
08:30 to 09:15 h Registration
09:15 to 09:35 h Inauguration
• Lamp lighting
• Welcome by Dr. D.K. Aswal, Director, CSIR-NPL
• About the conference by Dr. A. Sen Gupta, President MSI & Conference Chair, AdMet-2016
09:35 to 10:25 h • Keynote address by Dr. M. Milton, Director, BIPM (Chief Guest)
10:25 to 10:30 h • Vote of thanks by Dr. Y.P. Singh, Convener, AdMet-2016
10:30 to 11:00 h Tea / Coffee
11:00 to 11:40 h Plenary Talk1 : Dr. Kamal Hossain (NPL, UK), Material Metrology
Metrology for Grand Societal Challenges
Technical Session 1 : Quantum Metrology
11:45 to 12:10 Invited Talk1 : Dr. Michael Podesta (NPL, UK)
Beyond the International Temperature Scale of 1990
12:10 to 12:35 IT2 : Dr. Yi Hua Tang (NIST, USA)
Voltage Metrology, Watt Balance and the SI Redefinition
12:35 to 13:00 IT3 : Prof. R.C. Budhani (Ex-Director, CSIR-NPL; IIT, Kanpur)
The Pivotal Role of Superconductivity in the Development of Quantum Metrology
13:00 to 14:00 Lunch and Poster
TS2 : Temperature and Optical Metrology
14:00 to 14:25 h IT4 : Dr. Stefan Kueck (PTB, Germany)
Recent Advances in The Detection Efficiency Calibration of Silicon Single-Photon Avalanche
Diodes using Double Attenuator Technique
14:25 to 14:50 h IT5 : Dr. Y.P. Singh (CSIR-NPL)
Advances and Challenges in Temperature Metrology
14:50 to 15:15 h IT6 : Dr. Armin Sperling (PTB, Germany)
Calibration and Testing of Light Sources Based on LEDs and OLEDs
15:15 to 15:40 h IT7 : Mr. Richard Timmons (Guildline Instruments, Canada)
New DC Temperature Bridge Technology - Design and Performance
15:40 to 16:05 h IT8 : Dr. Ranjana Mahrotra (CSIR-NPL)
Surface Enhanced Raman Spectroscopy in Molecular Detection, Diagnosis and Therapy
16:05 to 16:30 h Tea and Poster
TS3: Pressure, Vacuum and Fluid Flow Metrology
16:30 to 16:55 h IT9 : Dr. Tokihiko Kobata (NMIJ, Japan)
Effective Utilization of Industrial Digital Pressure Gauges in International Comparisons
9th International Conference on Advances in Metrology (AdMet-2016)
(February 24-26, 2016)CSIR-National Physical Laboratory, New Delhi
Technical Program
Day-1 Date : 24/02/2016
9th International Conference on “Advances in Metrology - 2016”
xiii
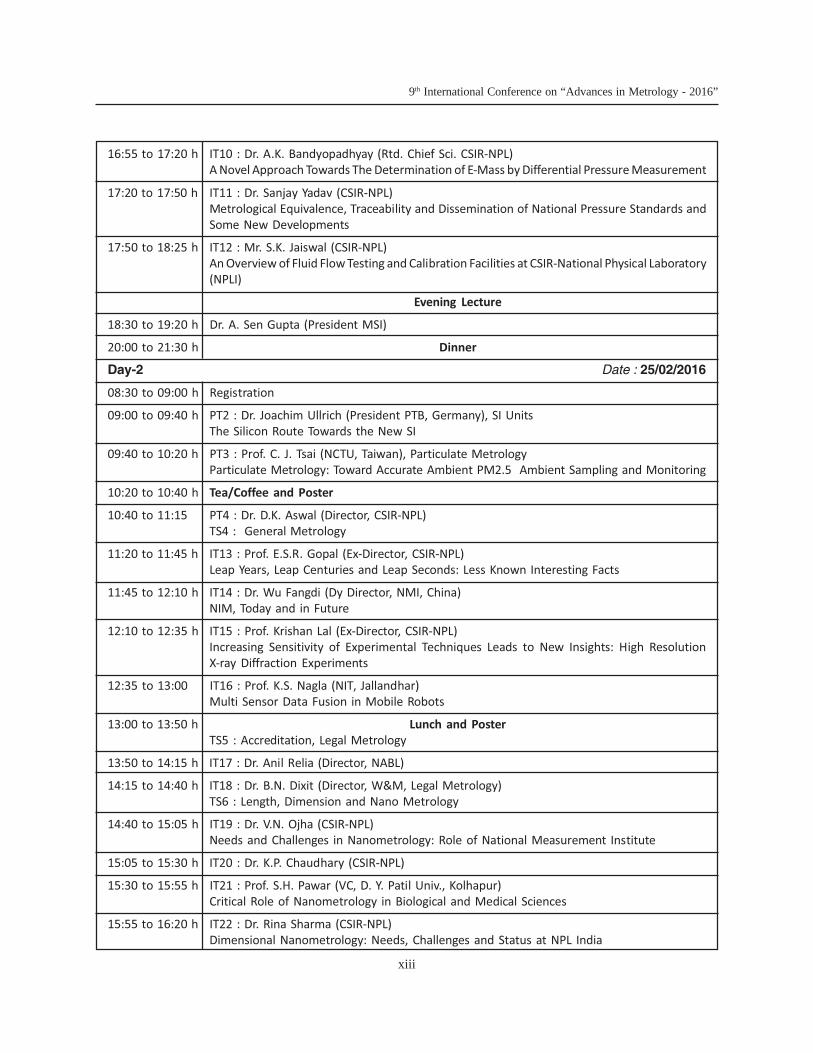
16:55 to 17:20 h IT10 : Dr. A.K. Bandyopadhyay (Rtd. Chief Sci. CSIR-NPL)
A Novel Approach Towards The Determination of E-Mass by Differential Pressure Measurement
17:20 to 17:50 h IT11 : Dr. Sanjay Yadav (CSIR-NPL)
Metrological Equivalence, Traceability and Dissemination of National Pressure Standards and
Some New Developments
17:50 to 18:25 h IT12 : Mr. S.K. Jaiswal (CSIR-NPL)
An Overview of Fluid Flow Testing and Calibration Facilities at CSIR-National Physical Laboratory
(NPLI)
Evening Lecture
18:30 to 19:20 h Dr. A. Sen Gupta (President MSI)
20:00 to 21:30 h Dinner
Day-2 Date : 25/02/2016
08:30 to 09:00 h Registration
09:00 to 09:40 h PT2 : Dr. Joachim Ullrich (President PTB, Germany), SI Units
The Silicon Route Towards the New SI
09:40 to 10:20 h PT3 : Prof. C. J. Tsai (NCTU, Taiwan), Particulate Metrology
Particulate Metrology: Toward Accurate Ambient PM2.5 Ambient Sampling and Monitoring
10:20 to 10:40 h Tea/Coffee and Poster
10:40 to 11:15 PT4 : Dr. D.K. Aswal (Director, CSIR-NPL)
TS4 : General Metrology
11:20 to 11:45 h IT13 : Prof. E.S.R. Gopal (Ex-Director, CSIR-NPL)
Leap Years, Leap Centuries and Leap Seconds: Less Known Interesting Facts
11:45 to 12:10 h IT14 : Dr. Wu Fangdi (Dy Director, NMI, China)
NIM, Today and in Future
12:10 to 12:35 h IT15 : Prof. Krishan Lal (Ex-Director, CSIR-NPL)
Increasing Sensitivity of Experimental Techniques Leads to New Insights: High Resolution
X-ray Diffraction Experiments
12:35 to 13:00 IT16 : Prof. K.S. Nagla (NIT, Jallandhar)
Multi Sensor Data Fusion in Mobile Robots
13:00 to 13:50 h Lunch and Poster
TS5 : Accreditation, Legal Metrology
13:50 to 14:15 h IT17 : Dr. Anil Relia (Director, NABL)
14:15 to 14:40 h IT18 : Dr. B.N. Dixit (Director, W&M, Legal Metrology)
TS6 : Length, Dimension and Nano Metrology
14:40 to 15:05 h IT19 : Dr. V.N. Ojha (CSIR-NPL)
Needs and Challenges in Nanometrology: Role of National Measurement Institute
15:05 to 15:30 h IT20 : Dr. K.P. Chaudhary (CSIR-NPL)
15:30 to 15:55 h IT21 : Prof. S.H. Pawar (VC, D. Y. Patil Univ., Kolhapur)
Critical Role of Nanometrology in Biological and Medical Sciences
15:55 to 16:20 h IT22 : Dr. Rina Sharma (CSIR-NPL)
Dimensional Nanometrology: Needs, Challenges and Status at NPL India
9th International Conference on “Advances in Metrology - 2016”
xiv
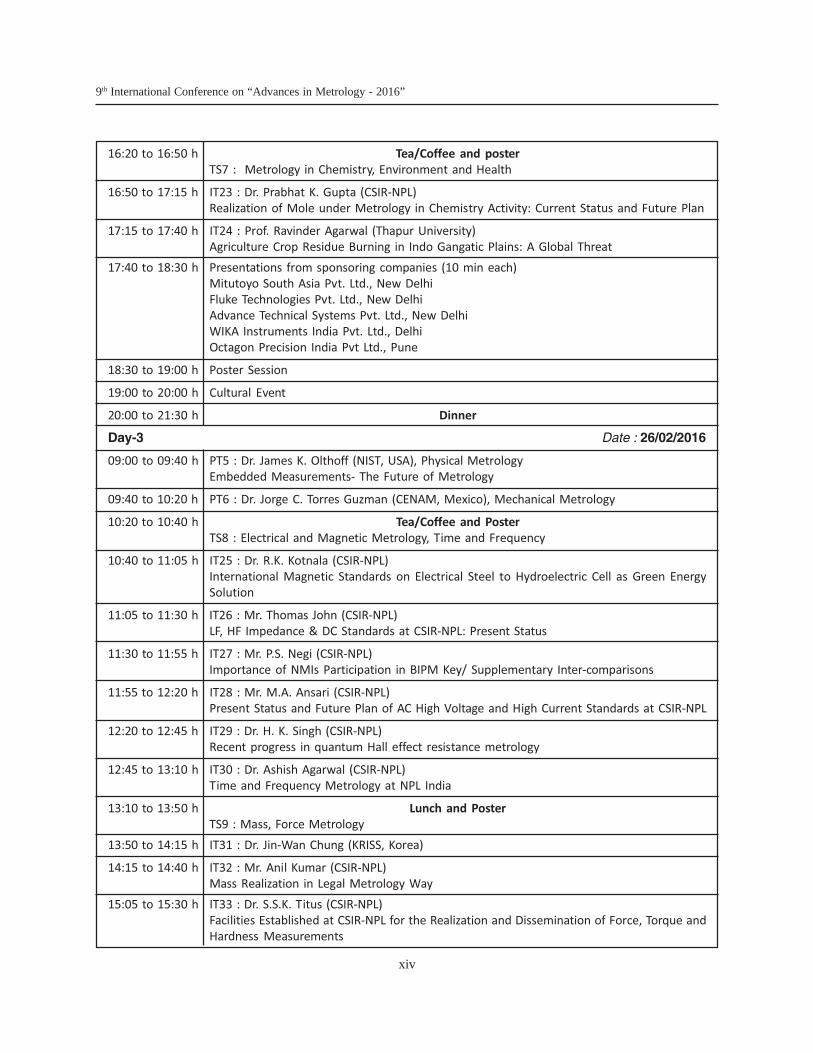
16:20 to 16:50 h Tea/Coffee and poster
TS7 : Metrology in Chemistry, Environment and Health
16:50 to 17:15 h IT23 : Dr. Prabhat K. Gupta (CSIR-NPL)
Realization of Mole under Metrology in Chemistry Activity: Current Status and Future Plan
17:15 to 17:40 h IT24 : Prof. Ravinder Agarwal (Thapur University)
Agriculture Crop Residue Burning in Indo Gangatic Plains: A Global Threat
17:40 to 18:30 h Presentations from sponsoring companies (10 min each)
Mitutoyo South Asia Pvt. Ltd., New Delhi
Fluke Technologies Pvt. Ltd., New Delhi
Advance Technical Systems Pvt. Ltd., New Delhi
WIKA Instruments India Pvt. Ltd., Delhi
Octagon Precision India Pvt Ltd., Pune
18:30 to 19:00 h Poster Session
19:00 to 20:00 h Cultural Event
20:00 to 21:30 h Dinner
Day-3 Date : 26/02/2016
09:00 to 09:40 h PT5 : Dr. James K. Olthoff (NIST, USA), Physical Metrology
Embedded Measurements- The Future of Metrology
09:40 to 10:20 h PT6 : Dr. Jorge C. Torres Guzman (CENAM, Mexico), Mechanical Metrology
10:20 to 10:40 h Tea/Coffee and Poster
TS8 : Electrical and Magnetic Metrology, Time and Frequency
10:40 to 11:05 h IT25 : Dr. R.K. Kotnala (CSIR-NPL)
International Magnetic Standards on Electrical Steel to Hydroelectric Cell as Green Energy
Solution
11:05 to 11:30 h IT26 : Mr. Thomas John (CSIR-NPL)
LF, HF Impedance & DC Standards at CSIR-NPL: Present Status
11:30 to 11:55 h IT27 : Mr. P.S. Negi (CSIR-NPL)
Importance of NMIs Participation in BIPM Key/ Supplementary Inter-comparisons
11:55 to 12:20 h IT28 : Mr. M.A. Ansari (CSIR-NPL)
Present Status and Future Plan of AC High Voltage and High Current Standards at CSIR-NPL
12:20 to 12:45 h IT29 : Dr. H. K. Singh (CSIR-NPL)
Recent progress in quantum Hall effect resistance metrology
12:45 to 13:10 h IT30 : Dr. Ashish Agarwal (CSIR-NPL)
Time and Frequency Metrology at NPL India
13:10 to 13:50 h Lunch and Poster
TS9 : Mass, Force Metrology
13:50 to 14:15 h IT31 : Dr. Jin-Wan Chung (KRISS, Korea)
14:15 to 14:40 h IT32 : Mr. Anil Kumar (CSIR-NPL)
Mass Realization in Legal Metrology Way
15:05 to 15:30 h IT33 : Dr. S.S.K. Titus (CSIR-NPL)
Facilities Established at CSIR-NPL for the Realization and Dissemination of Force, Torque and
Hardness Measurements

9th International Conference on “Advances in Metrology - 2016”
xv
15:30 to 16:00 h Presentaions by exhibition stall holders (5 min each)
16:00 to 16: 30 h Closing
16:30 to 18:00 Tea and AGM of MSI
Venue : Registration desk will be situated at Dr. A. R. Verma lawn (in front of auditorium NPL).
All talks and functions will be held at auditorium NPL

9th International Conference on “Advances in Metrology - 2016”
xvi

9th International Conference on “Advances in Metrology - 2016”
xvii
PLENARPLENARPLENARPLENARPLENARYYYYY
TTTTTALKSALKSALKSALKSALKS

9th International Conference on “Advances in Metrology - 2016”
xviii
9th International Conference on “Advances in Metrology - 2016”
1
PT - 1
Metrology for Grand Societal Challenges
Kamal Hossain
National Physical Laboratory, Teddington, UK
Abstract
Metrology has a vital underpinning role in global trade, industrial productivity and competitiveness.It also serves as an essential tool for scientific research and development and innovation. Fundamentalwork on metrology carried out mostly by National Metrology Institutes (NMI) is concerned withthe development, maintenance and dissemination of the international system of units (SI) andMeasurement Standards. These standards enable traceable measurements to be made for all sectorsand across the globe.
Increasingly, as our modern society faces grand challenges such as the provision of advanced, safeand cost-effective healthcare to citizens, secure supply of clean and affordable energy, and thesustainability of our environment we live in, there is recognition and awareness that new andreliable measurement technologies with traceability are needed urgently. Successful developmentof the necessary measurement capability will be crucial for meeting these societal challenges.
Development of such measurement techniques often requires tools and techniques involvingmultidisciplinary metrology, and the engagement of end users and stakeholders is critical.Furthermore, the resources required to develop metrology to meet grand challenges places heavydemand on individual countries and Governments. For cost effective and timely development,many countries in Europe have joined forces and initiated major metrology research programmeswith shared funding from the European Commission to deal with metrology for grand challenges.
This talk will cover the key measurement challenges in Europe in healthcare, energy, andenvironmental sustainability and how NMIs are working together to address these challenges.Results from some key projects and their impacts will be discussed.
9th International Conference on “Advances in Metrology - 2016”
2
PT - 2
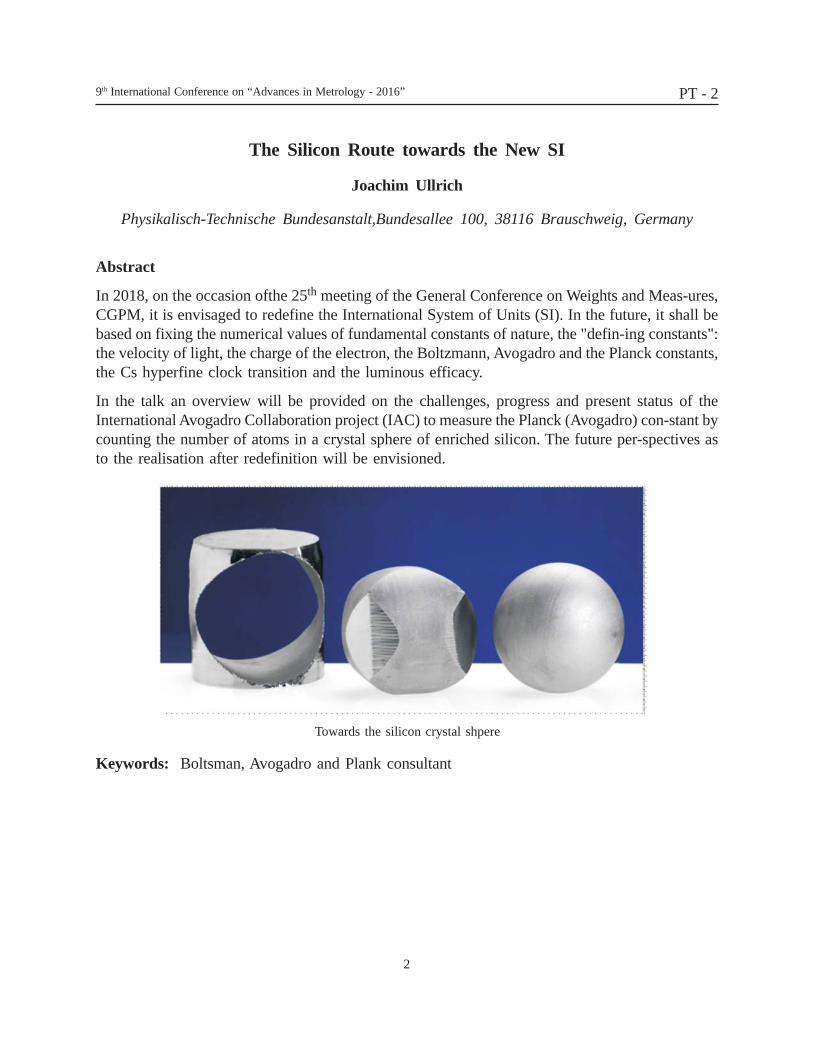
The Silicon Route towards the New SI
Joachim Ullrich
Physikalisch-Technische Bundesanstalt,Bundesallee 100, 38116 Brauschweig, Germany
Abstract
In 2018, on the occasion ofthe 25th meeting of the General Conference on Weights and Meas-ures,CGPM, it is envisaged to redefine the International System of Units (SI). In the future, it shall bebased on fixing the numerical values of fundamental constants of nature, the "defin-ing constants":the velocity of light, the charge of the electron, the Boltzmann, Avogadro and the Planck constants,the Cs hyperfine clock transition and the luminous efficacy.
In the talk an overview will be provided on the challenges, progress and present status of theInternational Avogadro Collaboration project (IAC) to measure the Planck (Avogadro) con-stant bycounting the number of atoms in a crystal sphere of enriched silicon. The future per-spectives asto the realisation after redefinition will be envisioned.
Keywords: Boltsman, Avogadro and Plank consultant
Towards the silicon crystal shpere
9th International Conference on “Advances in Metrology - 2016”
3
PT - 3
Particulate Metrology: Toward Accurate Ambient PM2.5Ambient sampling and monitoring
Chuen-Jinn Tsai
Institute of Environmental Engineering, National Chiao Tung University, Hsinchu, Taiwan(*E-mail: [email protected])
Abstract
Currently, manual US EPA FRM (Federal Reference Method) PM2.5 samplers and real-time FEM(Federal Equivalent Method) monitors are used for measuring ambient PM2.5 concentrations todetermine the compliance with PM2.5 air quality standards. However, the difference in PM2.5between these measurements and actual ambient level often exists due to the existence of samplingartifacts. Field results showed that due to evaporation loss, PM2.5 concentrations measured by theFRM WINS PM2.5 sampler (WINS), Dichotomous sampler (Dichot) were lower than those by theTEOM-FDMS (tapered element oscillating microbalance-filter dynamic measurement) PM2.5 FEMby 16.6 ± 9.0 and 15.2 ± 10.6. However, when PM2.5 concentrations were corrected for theevaporation loss determined by using a porous-metal denuder sampler (PDS), good agreement withthose by the TEOM-FDMS was achieved. Results showed that the evaporation loss of PM2.5 wassevere during sampling, accounting for 5.8 to 36.0 % of the PM2.5 concentration and the deviationincreased with decreasing loaded particle mass and increasing filtration velocity. Lowering theincoming aerosol temperature and humidity was shown to reduce the evaporation loss considerablyleading to much more accurate PM2.5 sampling. Field experimental results will be reported in thistalk.
Semi-continuous chemical composition measurement for PM2.5 is as important as that for massconcentration as sources and meteorological condition are ever-changing. The accuracy of anAerosol Chemical Speciation Monitor (ACSM) for monitoring the inorganic soluble ions wasevaluated using a PPWD-PILS (Parrel-Plate-Wet-Denuder Particle-into-Liquid Sampler) monitor.The latter was first validated using the manual PDS. It was found that the agreement was poor whenthe PM1 aerodynamic lens was used. For comparison when a new PM2.5 lens was used, theagreement was much better improved for NH4+and SO42- with R2 > 0.78. The CMB resultsshowed that SOA was the main component of organic aerosols in Judong and NCTU campus,which are sub-urban sites, due to photochemical reaction, representing 62.2 ± 16.3 and 65 ± 19.3%of organic aerosols, respectively. In contrast, POA was the main component of organic aerosols inSinjhung, which is the urban site, due to traffic emission, representing 61 ± 2.54% of the totalorganic aerosols. The conversion factors of OC measured by the Sunset OC/EC field analyzer toOM measured by the ACSM in Judong?Sinjhung and NCTU campus were 1.63 ± 0.76, 1.93 ± 1.84and 1.61 ± 0.79, respectively.
Keywords: PM2.5, Particulate metrology, Aerosol measurement, Secondary aerosols.
9th International Conference on “Advances in Metrology - 2016”
4
Embedded Measurements – The Future of Metrology
James K. Olthoff
National Institute of Standards and Technical (Physical MeasurementLaboratory, NIST, Gaithersburg, MD USA)
(E-mail : [email protected])
Abstract
Improved dissemination of national standards is a primary priority of the Physical MeasurementLaboratory (PML) of NIST in order to advance U.S. commerce and spur innovation. To meetindustry’s need for every more precise and reliable measurements, NIST has embarked upon aprogram to develop embedded standards that will provide quantum-based measurements whereverindustry needs them. This program is intended to revolutionize measurement services andmeasurement science through development and dissemination of “NIST-on-a-Chip” technologies.In general, these would consist of ultra-miniature measurement tools based on quantum sensorsand photonic circuits, and traceable to NIST standards and the SI that are designed and producedto meet the performance and cost needs of specific applications. Current devices invented and/ordeveloped within PML include: chip-scale atomic clocks, magnetometers and related devices;microscale laser frequency combs to flexibly link input/output with quantum measurements;quantum-based electrical measurements; photonic and mechanical precision thermometry; micro-force measurement techniques; quantum pressure measurement systems; microfluidic-basedmeasurements of chemical and physical properties; micro-opto-mechanical systems combiningbroad ranges of measurement capabilities; and unique micro/nanofabrication and characterizationcapabilities. Eventually it is anticipated that this research will enable the integration of a broadrange of precision measurement technologies into single, small-form system that can be utilizedfor many applications.
This talk will highlight the goals and anticipated impact of this program, the significant progressmade so far, and plans for the future. It will also present the impact of the development of thesecapabilities on the future role of national metrology institutes.
Keywords: Embedded standards, Quantum standards, Miniaturization
PT - 5

9th International Conference on “Advances in Metrology - 2016”
5
INVITEDINVITEDINVITEDINVITEDINVITED
TTTTTALKSALKSALKSALKSALKS

9th International Conference on “Advances in Metrology - 2016”
6
9th International Conference on “Advances in Metrology - 2016”
7
IT - 1
Beyond the International Temperature Scale of 1990
Michael de Podesta1, Robin Underwood1, Gavin Sutton1, Leigh Stanger1,Richard Rusby1, Peter Harris1, Paul Morantz2, Graham Machin1
1National Physical Laboratory (NPL), Teddington, Middlesex, UK2School of Applied Sciences, Cranfield University, Cranfield, Bedfordshire MK43 0AL, UK
Abstract
The International Temperature Scale of 1990 (ITS-90) is an approximation to thermodynamictemperature, and provides a practical scale that is the reference method for dissemination of thekelvin. By following the procedures of ITS-90, users worldwide are able to produce approximations,called T90, to thermodynamic temperature, T, based on primary thermometry results published priorto 1990. However, advances in primary thermometry since 1990 - most notably developments inacoustic gas thermometry - have revealed differences between T90 and T which approach 1 part in104.
In this talk I will describe the NPL-Cranfield combined acoustic and microwave resonator and itsuse as a primary thermometer. After describing its use in our measurement of the Boltzmannconstant, I will present our recent estimates of T T90 in the temperature range from 118 K to 303K [1], highlighting the procedures that have enabled exceptionally low uncertainty. Significantly,the uncertainty associated with primary thermometry is now lower than that achievable usingstandard platinum resistance thermometers. I will then discuss the implications of this work for thefuture of ITS-90, and whether a new temperature scale is required.
[1] Estimates of the difference between thermodynamic temperature and the ITS-90 in the range118 K to 303 K, R. Underwood, M. de Podesta, G. Sutton, L. Stanger, R. Rusby, P. Harris,P. Morantz, G. Machin.Accepted for publication in Philosophical Transactions of the RoyalSociety A.
Keywords:
9th International Conference on “Advances in Metrology - 2016”
8
IT - 2
Voltage Metrology, Watt Balanceand the SI Redefinition
Yi-Hua Tang
NIST, USA
Abstract
Planck constant, h is one of the seven fundamental constants proposed to redefine the SI. It hasbeen measured bythe Watt balance experiment since the 1980s.In its early days, the Watt balanceexperiment played a vital role in determining the Josephson constant KJ-90 which was adoptedinternationally on January 1, 1990. The development of Josephson technologies, especially theimplementation of Programmable Josephson Voltage Standard (PJVS) in voltage metrology hasgreatly improved the uncertainty of voltage measurement in the Watt balance by more than an orderof magnitude. The intertwined interaction between voltage measurement technology and the Wattbalance plays an important role in the proposed SI redefinition based on a set of fundamentalconstants. This talk will present a brief history from the original NIST Watt balance in 1980sup tothe most recent development of NIST-4 Watt balance and the impact that this experiment has hadon the voltage metrology.
Keywords:
9th International Conference on “Advances in Metrology - 2016”
9
IT - 3
The Pivotal Role of Superconductivity in thedevelopment of Quantum Metrology
R.C. Budhani
Indian Institute of Technology Kanpur, Kanpur 208016, IndiaFormer Director National Physical Laboratory (2009-2014)
9th International Conference on “Advances in Metrology - 2016”
10
Recent Advances in the Detection Efficiency Calibration of SiliconSingle-Photon Avalanche Diodes using Double Attenuator Technique
S. Kück1, M. López1, K. Dhoska2, T. Kübarsepp2,3, H. Hofer1 and B. Rodiek1
1Physikalisch-Technische Bundesanstalt, Bundesallee 100, D-38116, Braunschweig, Germany2Tallinn University of Technology, Ehitajate tee 5, 19086 Tallinn, Estonia
3AS Metrosert, Teaduspargi 8, 12618 Tallinn, Estonia(*E-mail : [email protected])
Abstract
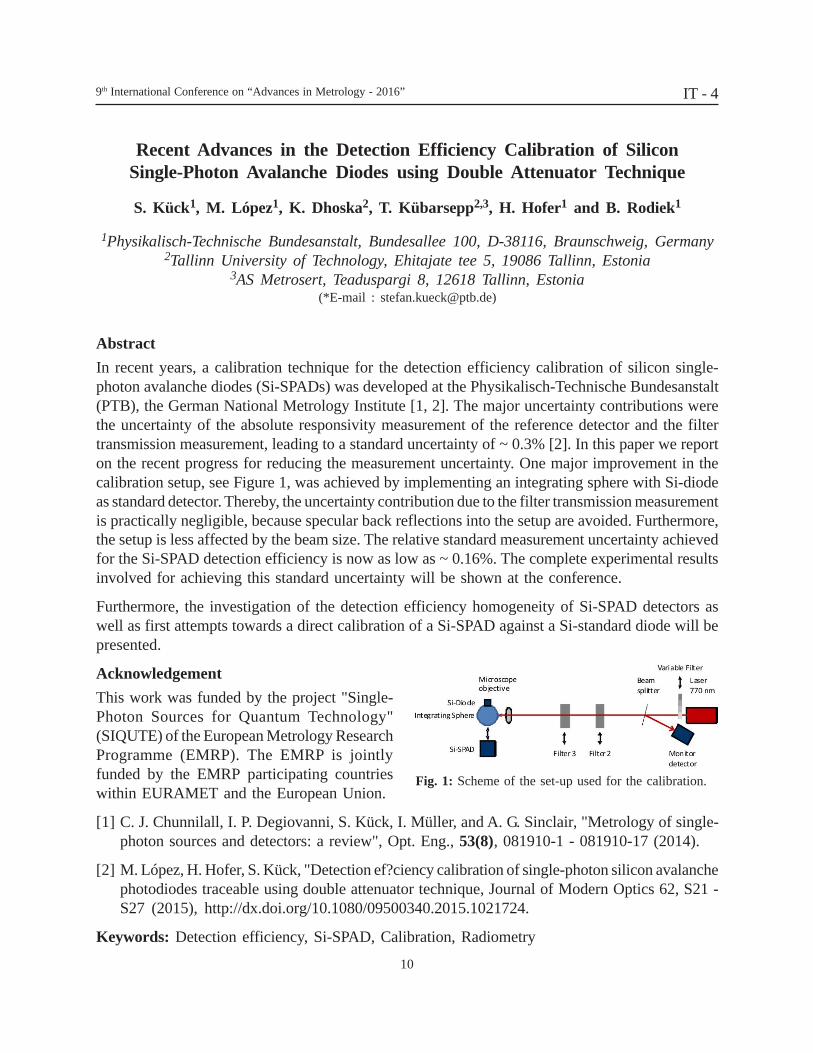
In recent years, a calibration technique for the detection efficiency calibration of silicon single-photon avalanche diodes (Si-SPADs) was developed at the Physikalisch-Technische Bundesanstalt(PTB), the German National Metrology Institute [1, 2]. The major uncertainty contributions werethe uncertainty of the absolute responsivity measurement of the reference detector and the filtertransmission measurement, leading to a standard uncertainty of ~ 0.3% [2]. In this paper we reporton the recent progress for reducing the measurement uncertainty. One major improvement in thecalibration setup, see Figure 1, was achieved by implementing an integrating sphere with Si-diodeas standard detector. Thereby, the uncertainty contribution due to the filter transmission measurementis practically negligible, because specular back reflections into the setup are avoided. Furthermore,the setup is less affected by the beam size. The relative standard measurement uncertainty achievedfor the Si-SPAD detection efficiency is now as low as ~ 0.16%. The complete experimental resultsinvolved for achieving this standard uncertainty will be shown at the conference.
Furthermore, the investigation of the detection efficiency homogeneity of Si-SPAD detectors aswell as first attempts towards a direct calibration of a Si-SPAD against a Si-standard diode will bepresented.
Acknowledgement
This work was funded by the project "Single-Photon Sources for Quantum Technology"(SIQUTE) of the European Metrology ResearchProgramme (EMRP). The EMRP is jointlyfunded by the EMRP participating countrieswithin EURAMET and the European Union.
[1] C. J. Chunnilall, I. P. Degiovanni, S. Kück, I. Müller, and A. G. Sinclair, "Metrology of single-photon sources and detectors: a review", Opt. Eng., 53(8), 081910-1 - 081910-17 (2014).
[2] M. López, H. Hofer, S. Kück, "Detection ef?ciency calibration of single-photon silicon avalanchephotodiodes traceable using double attenuator technique, Journal of Modern Optics 62, S21 -S27 (2015), http://dx.doi.org/10.1080/09500340.2015.1021724.
Keywords: Detection efficiency, Si-SPAD, Calibration, Radiometry
Fig. 1: Scheme of the set-up used for the calibration.
IT - 4
9th International Conference on “Advances in Metrology - 2016”
11
Advances and Challenges in Temperature Metrology
Y.P. Singh
Temperature & Humidity StandardsCSIR-National Physical Laboratory, Dr. K.S. Krishnan Marg, New Delhi-110012, India
(Email: [email protected])
Abstract
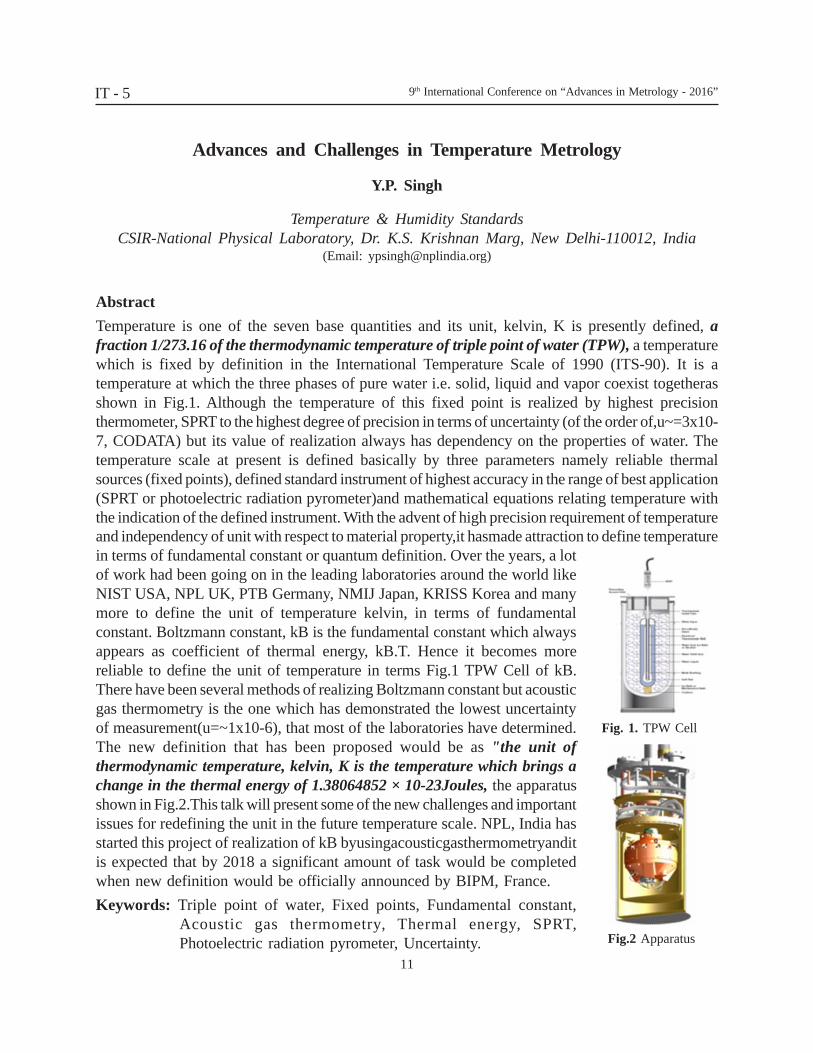
Temperature is one of the seven base quantities and its unit, kelvin, K is presently defined, afraction 1/273.16 of the thermodynamic temperature of triple point of water (TPW), a temperaturewhich is fixed by definition in the International Temperature Scale of 1990 (ITS-90). It is atemperature at which the three phases of pure water i.e. solid, liquid and vapor coexist togetherasshown in Fig.1. Although the temperature of this fixed point is realized by highest precisionthermometer, SPRT to the highest degree of precision in terms of uncertainty (of the order of,u~=3x10⁻⁷, CODATA) but its value of realization always has dependency on the properties of water. Thetemperature scale at present is defined basically by three parameters namely reliable thermalsources (fixed points), defined standard instrument of highest accuracy in the range of best application(SPRT or photoelectric radiation pyrometer)and mathematical equations relating temperature withthe indication of the defined instrument. With the advent of high precision requirement of temperatureand independency of unit with respect to material property,it hasmade attraction to define temperaturein terms of fundamental constant or quantum definition. Over the years, a lotof work had been going on in the leading laboratories around the world likeNIST USA, NPL UK, PTB Germany, NMIJ Japan, KRISS Korea and manymore to define the unit of temperature kelvin, in terms of fundamentalconstant. Boltzmann constant, kB is the fundamental constant which alwaysappears as coefficient of thermal energy, kB.T. Hence it becomes morereliable to define the unit of temperature in terms Fig.1 TPW Cell of kB.There have been several methods of realizing Boltzmann constant but acousticgas thermometry is the one which has demonstrated the lowest uncertaintyof measurement(u=~1x10⁻⁶), that most of the laboratories have determined.The new definition that has been proposed would be as "the unit ofthermodynamic temperature, kelvin, K is the temperature which brings achange in the thermal energy of 1.38064852 × 10⁻²³Joules, the apparatusshown in Fig.2.This talk will present some of the new challenges and importantissues for redefining the unit in the future temperature scale. NPL, India hasstarted this project of realization of kB byusingacousticgasthermometryanditis expected that by 2018 a significant amount of task would be completedwhen new definition would be officially announced by BIPM, France.
Keywords: Triple point of water, Fixed points, Fundamental constant,Acoustic gas thermometry, Thermal energy, SPRT,Photoelectric radiation pyrometer, Uncertainty.
IT - 5
Fig.2 Apparatus
Fig. 1. TPW Cell
9th International Conference on “Advances in Metrology - 2016”
12
Calibration and Testing of Light Sources based on LEDs and OLEDs
A. Sperling*, P. Schneider, N. Leise and T. Gerloff
Physikalisch-Technische Bundesanstalt, Bundesallee 100, D-38116,Braunschweig, Germany
(*E-mail : [email protected])
Abstract
The worldwide phase-out of incandescent lamps used for general lighting has a big influence notonly on the development of possible replacements, but also on the metrology for lighting. On theone hand side, modern light sources based on LEDs and OLED are very versatile and adaptableto nearly any application, but on the other side they are much more sensitive to environmentaloperation conditions and challenging spectral measurements become indispensible. Internationalcomparisons, e.g. the IEA IC 2013 [1], show that measurement uncertainty is often underestimatedin many testing laboratories. As a consequence, the International Commission on Illumination,CIE, developed the new standard CIE S025/E:2015 [2] for testing LED based lamps, modules andluminaires. This new standard necessitates the declaration of uncertainties even for test results.This is up to now unique for such test standards.
In this paper we will report on measurement techniques to improve the transfer of the units ofphotometric quantities to calibration laboratories and test laboratories. Examples are given showingthe typical behaviour of LED lamps and OLEDs to underpin the need of the comprehensivecharacterization of the devices under test, of the references and of the measurement system to getsatisfying uncertainties for measurement results of solid state lighting devices. Finally, also therealization of the photometric units needs to be reconsidered if the tungsten filament lamps typicallyused for the realization and distribution of the units are no longer available. First interim resultson the improvement of the traceability chain for the photometric units at PTB are presented.
Acknowledgement
This work was partly funded by the project “Metrology for Efficient and Safe Innovative Lighting”(MESaIL) of the European Metrology Research Programme (EMRP). The EMRP is jointly fundedby the EMRP participating countries within EURAMET and the European Union
[1] 2013 IC Comparison Report; http://ssl.iea-4e.org/files/otherfiles/0000/0067/IC2013_Final_Report_final_10.09.2014a.pdf
[2] CIE S 025/E:2015: Test Methods for LED Lamps, LED Luminaires and LED Modules
Keywords: LED, OLED, Reference, Testing, Calibration. Photometry
IT - 6
9th International Conference on “Advances in Metrology - 2016”
13
New DC Thermometry Bridge TechnologyDesign and Performance
Richard Timmons, P.Eng., M.Sc.
President (Guildline Instruments, Smiths Falls, Ontario, Canada)(E-mail : [email protected])
Abstract
Direct Current Comparator (DCC) Bridges, despite their many advantages over their AlternatingCurrent (AC) counterparts, have traditionally not been selected for primary thermometry applications.Rational for these decisions is that historically DCC Bridges have been optimized for higher powerresistance measurements, lacked software designed for temperature applications, lacked thermometryaccessories, and because AC Bridge technology typically provided faster measurements. Innovativedesign and performance techniques have been applied to the development of a new DCCThermometry Bridge which provides improved performance and operational interface in comparisonto AC temperature bridges and existing DCC temperature bridges. Many of these techniques haveassociated patents granted or pending. These techniques include:
- reducing the noise and improving the repeatability of temperature measurements by addressingfundamental limitations of the physics associated with the magnetic cores used in DCC bridges,
- increasing the ampere-turns of bridges to improve measurements with the low current levelsrequired for thermometry,
- using a null detector rather than a resistor-divider network (i.e. sometimes called simulatedwindings) to provide additional resolution,
- applying the latest analogue design techniques and components to improve the null detector,- decoupling the measurement rate from the polarity reversal rate in order to speed up measurements
and provide more stable measurements,- optimizing the tradeoff between digital filtering, latency, and measurement repeatability,- using adaptive real time control and measurement algorithms to dynamically adjust to the
measurement speed in accordance to the rate of temperature change,- using techniques to speed up the time for a temperature measurement to stabilize,- using the interchange technique to remove DCC bridge errors, and- using a modern graphical user interface, and associated software, to improve real time analysis
of temperature measurements.
Examples will be discussed with respect to the design techniques presented. In addition data willbe presented and analyzed with respect to improved uncertainties versus traditional DCC and ACtemperature bridges.
Keywords: Thermometry bridge, Temperature bridge, Direct current comparator, DCC,Temperature measurements
IT - 7
9th International Conference on “Advances in Metrology - 2016”
14
Surface Enhanced Raman Spectroscopy in Molecular Detection,Diagnosis and Therapy
Ranjana Mehrotra
Quantum Phenomena & ApplicationsCSIR-National Physical Laboratory, Dr. K.S. Krishnan Road, New Delhi-110012
(Email: [email protected])
Abstract
The application of plasmonics in the field of biomedical sciences has the potential to usher in a newdirection of research and development. Nanoscale materials, being on a similar size scale asbiological materials like DNA, lipids and proteins, can act as powerful research tools in biologicalsciences. A large number of applications include detection, bio sensing, cellular and in situhybridization, cell tagging and sorting, diagnostics, kinetic and binding studies and cell imaging.Noble metal nanoparticles are especially interesting because of their unusual optical properties,which arise from their ability to support surface plasmons. Noble metals, especially gold, alongwith being biocompatible are relatively easy to synthesize and chemically functionalize. No toxiceffect even at higher dosage is also an attractive property of these nanoparticles for in vivo imagingand therapeutic applications. Furthermore, gold nanoparticle based surface modification for proteinimmobilization is straightforward and is based on thiol chemistry.
Surface-enhanced Raman spectroscopy (SERS) is emerging as an important method for thecharacterization of biological materials. The limitation of Raman spectroscopy for bio-analytedetection is overcome in surface enhanced Raman Spectroscopy by exciting the sample in contactwith a plasmonic surface with an appropriate laser line. In SERS, the signal intensity is extraordinarilyincreased, thus, enhancing the detection limits up to single molecule, while retaining all thestructural information. For instance, gold nanoparticles can be used as a probe to detect multipleoligonucleotide targets with micro-SERS and different Raman dyes.
Keywords:
IT - 8
9th International Conference on “Advances in Metrology - 2016”
15
Effective Utilization of Industrial Digital Pressure Gauges inInternational Comparisons
Tokihiko Kobata*, Momoko Kojima and Hiroaki Kajikawa
National Metrology Institute of Japan (NMIJ)/National Institute of Advanced Industrial Science and Technology (AIST),
(Research Institute for Engineering Measurement, Tsukuba, Japan)(*E-mail : [email protected])
Abstract
Recently, characteristics of industrial digital pressure gauges have been improved remarkably. Wefocused on high-precision digital pressure gauges that were small, lightweight, as well as easy tohandle, and engaged them in the world-leading development of transfer devices for internationalcomparisons of standards. Using the developed transfer devices, several international comparisonshave been carried out for promoting the international mutual recognition.
Keywords: Pressure standard, Digital pressure gauge, International comparison
IT - 9
9th International Conference on “Advances in Metrology - 2016”
16
A Novel Approach Toward the Determination of E-mass byDifferential Pressure Measurement
A.K. Bandyoapdhyay
Chief Scientist (Retd), CSIR-National Physical Laboratory, Dr. K. S. Krishnan Road,New Delhi-110012, India
Abstract
A watt balance is relatively simple in principle but the real challenge is to perform the experiment witha relative uncertainty in measurement of 1x 10⁻⁸.The hardest parts of the experiment are: (a) movingthe coil in a strictly vertical line, (2) aligning the coil axis with gravity and the magnetic field at rightangles to gravity. Existing Watt Balance experiments require correction systems, which add complexityand potentially introduce 'noise' to the system.MSL (New Zealand) [1] has developed a novel approachto overcoming these design problems.
A twine pressure balances is used as a mass comparator. As the differential pressure (∆p) is directlyrelated to differential mass (∆m). The force generated by this ∆m can be compensated by the utilizationof an electromagnetic force which is generated by a moving coil in a magnetic field.In other words,as the coil is immersed in a horizontal magnetic flux, the current I in the coil exerts a vertical forceon the conductor that is balanced against the weight (∆m). There will be an equilibrium condition,that is, the force generated by the differential pressure (say upward) and electromagnetic force (saydownward) and vice versa. Under this condition, the fall of the piston is sinusoidal with reference tothe equilibrium condition. Under a typical balancing situation where the upward force is balanced bythe downward force, the amplitude of the oscillation decreases as the downward force is trimmed byincreasing the coil current under a constant magnetic field maintaining the same mass at the other sideof the differential pressure balance. If the piston fall ismeasured by a laser interferometer andelectromagnetic force by measuring the current and voltage as are done in the conventional WattBalance technique that is, the calibration and measurement modes of operation, the same principle canbe used. Under this condition, the coil is moved at a constant velocity v in the vertical direction throughthe flux and the voltage U induced across the coil and also in the calibration mode if the current I underthe magnetic field B moves the coil velocity v : ∆m = UI/gv.If we have a laser measuring systemwhich can track the oscillatory motion of the coil with very high accuracy, we will get rid of theshortcoming of conventional Watt Balance where fall is at a constant speed. Pressure balances meetthe key Watt balance requirements (a) means of moving coil straight and vertical as it is directlyconnected with a piston which moves in a well-defined axis and as a result the movement of the coilis almost vertical, (b) Floating element moves vertically within 1 ∆m over 10 mm(c) it is aweighingdevice of sensitivity with 1 part in 108, (d) very low friction because of very narrow clearance lessthan 1 µm; (e) aerodynamic bearing with strong piston centring forces; finally, (f)no contact betweenpiston-cylinder.
[1] Chris M Sutton, Measurement Standards Laboratory of New Zealand "MSL watt balance research:Status report to CCM Workshop on the mise en pratiqueof the new definition of the kilogram" 21&22 November 2012, BIPM, Sèvres, France.
Keywords: E-mass, Differential pressure, Twine pressure balance
IT - 10
9th International Conference on “Advances in Metrology - 2016”
17
Metrological Equivalence, Traceability and Dissemination ofNational Pressure Standards and Some New Developments
Sanjay Yadav*
CSIR-National Physical Laboratory, Dr. K.S. Krishnan Road, New Delhi-110012, India(*E-mail : [email protected])
Abstract
The national pressure standards established at NPL are mostly dead weight piston gauges. Pistongauge is a device that realizes pressure directly from the fundamental definition of the pressure andis often used as a primary / secondary pressure standard. Its main components are a piston-cylinderassembly and a weight. In order to keep pace with advancement in the field and cater the everincreasing demands of the industry and users for better and improved traceable pressure standards,NPL is also continuously focusing on to develop, establish and upgrade its pressure measurementcapabilities. In recent past, NPL has established and characterized controlled clearance pistongauges (CCPGs) type primary hydraulic pressure standards in the pressure ranges of (10 - 100)MPa and (20 - 200) MPa. Most recently, our long efforts are resulted in to establishment of semi-automatic CCPG type primary pressure standards in the low pressure range (5 - 50) MPa and inhigh pressure range (50 - 500) MPa. These CCPGs are the unique systems being established atNPL having expected measurement uncertainties associated with effective area (A0) better than60 ×10–6 at a coverage factor, k = 2. The system is also equipped with a reentrant type pistoncylinder assembly of secondary pressure standard to cover low pressure range (1-10) MPa.We havealso developeda twin post pressure balance type new facilities for the differential hydraulic pressuremeasurements up to 50 MPa, first time in India.The present paper describes the overview of thepiston gauge type hydraulic pressure standards established at NPL over the years, their measurementtraceability, existing calibration services, the CMCs registered in the Appendix 'C' of BIPM, recentresults of the key comparisons and the progress towards new developments being carried out.
Keywords: Primary pressure standards; Controlled clearance piston gauge; Hydraulic differentialpressure measurement
IT - 11
9th International Conference on “Advances in Metrology - 2016”
18
An Overview of Fluid Flow Testing and Calibration Facilities atCSIR-National Physical Laboratory (NPLI)
Shiv Kumar Jaiswal
CSIR-National Physical Laboratory, Dr. K. S. Krishnan Road, New Delhi-110012, India(Email : skjaiswal@ nplindia.org)
Abstract
CSIR-National Physical Laboratory (NPLI) is the National Metrology Institute (NMI) for India and is responsiblefor establishment, maintenance, upgradation and dissemination of National Standards of Measurements exceptfor ionizing radiations. The Fluid Flow Measurement Standard group at NPLI was formed in 1989 with theobjective to establish, maintenance and upgrade the National Standards of Fluid Flow (gas and liquid) and toprovide apex level testing and calibration services. The group has water meter testing facility up to 50 mm andit is being used to provide testing of Woltman type water meters as per IS 779, IS 6784 and ISO 4064 standardsto the various user organizations traceable to the 'National Standards'. Initially, the Water Flow CalibrationFacility at NPLI was established in joint collaboration with PTB, Germany during 1992 to 1998 under NPLI-PTB Technical Collaboration Program for calibration of different types of high accuracy water flow meters suchas coriolis, ultrasonic, electromagnetic, differential pressure, etc. using static-gravimetric method as per ISO4185. The facility was operational till 2001. The facility comprises of two test rigs, namely, DN50 and DN200for calibration of water flowmeters of different sizes ranging from 10 mm to 200 mm. Both of the Test Rigswere revived during 2008 and 2009. As this old facility has traceability problem and also become obsolete dueto technological advancement, therefore, its upgradation using state-of-the-art instrumentation and control wasplanned to improve our facility compatible to international level to maintain the NMI status in water flow area.As a follow-up of the upgradation and to develop capabilities for design and development of water flowcalibration system, a prototype Water Flow Calibration System of size DN100 was designed and developedindigenously recently as per ISO 4185 standard. This is the low-cost solution to Indian industries as establishmentof water flow calibration system requires huge funding. The expanded uncertainty of this prototype calibrationsystem at 2000 kg and 1000 kg collected mass is ±0.03% and ±0.05% (at k=2) respectively. This system issimpler and easy to maintain. Once the acquisition of the system is over, it would be used to provide traceablecalibration and measurement services to the various user organizations in the country.
Keeping in view the requirement of in-house users such as Chemical Metrology group, Radio and AtmosphericScience Division, Solar Energy group, etc. and external users such as Pollution Control Boards, pharmaceuticalindustries, petrochemical industries, environmental monitoring equipment manufacturers, R&D laboratories,NABL accredited laboratories, gas flowmeters manufacturers, aerospace industries, etc., the Gas Flow CalibrationSystem has been established recently which is based on laminar flow elements and sonic nozzles. The flowrange of laminar flow element is from 10 sccm to 50 slm with operating pressure of 100 kPa absolute to 525kPa absolute. The flow range of sonic nozzle (also called critical flow nozzle) is from 10 slm to 1000 slm withoperating pressure of 50 kPa absolute to 525 kPa absolute. The expanded uncertainty of the Gas Flow CalibrationSystem is ±0.2 % at k=2 in the flow range of 10 sccm to 1000 slm. This system is being used for calibrationof different types of flowmeters such as mass flow controllers, mass flow meters, rotameters, totalizer typemeters (dry gas meters), digital flow calibrators, orifice flow calibrators, compact provers, etc. The systemsupports multi-gas calibration such as nitrogen, air, carbon dioxide, helium etc. In the present paper, anoverview of NPLI fluid flow facilities has been presented.
Keywords : Uncertainty, National Metrology Institute (NMI), mass flow rate, volume flow rate, WaterFlow Calibration Facility, Water Meter Testing Facility, Gas Flow Calibration System.
IT - 12
9th International Conference on “Advances in Metrology - 2016”
19
Leap Years, Leap Centuries and Leap Seconds :Less known Interesting Facts
E.S. Raja Gopal
Indian Institute of Science, Department of Physics, Bangalore-560012(Formerly Director, CSIR-National Physical Laboratory, Dr. K. S. Krishnan Road,
New Delhi-110012, India)
Abstract
The substantially higher accuracy of the atomic clocks introduced from the 1960s has enabled oneto measure the fluctuations and a gradual slowing down of the rotational speed of the Earth. Theleap second correction was introduced in 1972 to make the atomic clock based time to be insynchronism with the Sun based time. While the Y2K problem of 2000 was avoided by the robustprofessional programs, when the leap second correction was made on 30 June 2012 many WEBbased systems had problems, the most dramatic being the 5 hour crash of the QANTAS AirlineReservation System. Major social dislocations were present when Julius Caesar introduced theLeap Year in 46 B.C. and when Pope Gregory XIII introduced the Leap Century in 1582 A.D.Modern research has thrown doubts about even the date and year of the birth of Jesus Christ.Currently the matters connected with the leap second corrections are under discussions and thepresent scenario will be summarised.
Keywords: Atom clock, Y2K Problem, Leap Year, Leap century
IT - 13
9th International Conference on “Advances in Metrology - 2016”
20
NIM, Today and in Future
Wu Fangdi
NIM, China
Abstract
What is NIM : Founded in 1955, the National Institute of Metrology (NIM) is a non-profit researchorganization under the General Administration of Quality Supervision, Inspection and Quarantine(AQSIQ).It is China's national metrology institute (NMI) and the state-level technical center forlegal metrology. It is China's signatory to the CIPM MRA and a full member of the APMP. It staysat the top of China's traceability chain.
History
1955: NIM was founded 1970: a sub-institute of NIM was founded, which later become the National Institute of
Measurement and Testing Technology (NIMTT) at Sichuan Province 1989: the National Research Center for Certified Reference Materials (NRCCRM) was
independent of NIM 1998: the State Council approved NIM to build a new campus at Changping district of Beijing 2005: NRCCRM merged into NIM, marking the birth of new NIM that covers metrology both
in general physics and chemistry 2009: The Changping campus was put into service
Technical Capabilities : As of March 2015, NIM maintains 130 national primary standards, 296national standards and provides 1270 types of certified reference materials. NIM has 1224 calibrationand measurement capabilities (CMCs) published in the BIPM KCDB. NIM provides 587 AQSIQ-authorized verification services, 568 CNAS (Chinese national laboratory accreditation body)accreditated calibration services and 335 testing services.
Research : NIM is committed to pushing back the frontiers of metrology science to supporteconomic and social development of China. Since 2006, the beginning of the 11th "Five-Year Plan"period of China, Chinese Government has significantly increased its funding for research. Basedon metrology science development and national needs, NIM has identified two major researchdirections: (1) SI redefinition and development of advanced quantum standards, and (2) emergingpriority fields, including new energy, advanced materials and nano-metrology, biologicalmeasurement, environmental measurement, medical measurement, and metrology for the new-generation IT metrology. A number of new laboratories were built in the Changping Campus.
Vision : To promote industrial competitiveness and underpin the economic and social developmentof the country with world-advanced science, standards and measurement capabilities.
IT - 14

9th International Conference on “Advances in Metrology - 2016”
21
Increasing Sensitivity of Experimental Techniques Leads toNew Insights : High Resolution X-ray Diffraction Experiments
Krishan Lal
CSIR-National Physical Laboratory, Dr. K.S. Krishnan Road, New Delhi-110012University of Delhi, Delhi
Association of Academies and Societies of Sciences in Asia AASSA(Email: [email protected])
Abstract
In physical sciences there is an unending endeavour to take the sensitivity of measurements to limitsX-ray diffraction is a unique area of science where normal experiments are performed at a resolutionlevel that is a hundred to thousand times lower than the ideal condition. The author and his collaboratorshave learned that a push in the sensitivity of experimental techniques has led to deeper understandingof physical phenomena and new facts could be revealed. In this presentation a few examples will bepresented which illustrate this point.
The dynamical theory of diffraction is the most rigorous theory of X-ray diffraction. The theoryassumes the specimen crystal to be nearly perfect and 'thick' defined as t > 10. It predicts that thehalf widths of diffraction maxima will be of a few arc sec and the reflectivity will be close to 100 %in reflection geometry. Also, two diffracted beams are expected in transmission geometry One needsa highly collimated X-ray beam with divergence of below 1 arc sec and wave length spread of about10–5. A variety of high resolution X-ray diffractometers had been developed in author's laboratory. Themost sophisticated among them is a Five Crystal X-ray Diffractometer with state-of-the-art levelresolution. Experiments at highest resolution had given several results of considerable fundamentalimportance and of value in applications. A systematic study of diffuse X-ray scattering very close tothe diffraction maxima established that at and near room temperature the scattering is primarily dueto defects and not due to thermal vibrations of crystal lattices as was considered until this work. Thistechnique enables non-destructive characterization of point defects and their clusters and is now oftenreferred to as reciprocal lattice mapping. For example in silicon crystals it could correlate crystallineperfection with oxygen content. In implanted crystals it has demonstrated the segregation of implantedimpurities. It has led to discovering a new defect, named as 'very' low angle boundary with tilt anglesas low as a quarter of a arc minute For the first time electric field induced microstructural changescould be directly observed in semiconductors and insulators. In-depth investigations of MBE grownthin epitaxial layers demonstrated the presence of an orientational mis-match in addition to the usuallattice match. An accurate technique of determining biaxial stress has demonstrated that initial bendingof substrates must be taken into account otherwise the value of stress as well as its sense will becomequestionable. Dynamical diffraction effects like the presence of a forward diffracted X-ray beam anda loss in absorption could be directly observed with 'thin' diamond crystals ( t<<1) of varying degreesof perfection. Recently it has been possible to image a few nanometer thick layers on silicon crystalsby high resolution X-ray reflection technique.
Keywords:
IT - 15
9th International Conference on “Advances in Metrology - 2016”
22
Multi Sensor Data Fusion in Mobile Robots
K. S. Nagla
Dr BR Ambedkar National Institute of Technology Jalandhar, India(E-mail : [email protected])
Abstract
An important and useful feature of autonomous mobile robots is their ability to adopt themselvesto operate in unstructured environment. Modern robots are performing autonomously in industrialfloor, office environments, as well as in domestic environment where the robots need to maintaina model of their surrounding environment. The acquired knowledge of an environment throughlearning process is used to build an internal representation. To attain such type of knowledge,robots must possess sensors that enable them to perceive the outside world. There are severalsensor modalities commonly brought to bear for this task such as ultrasonic, laser range finders,radar, vision and infrared, etc. However, most robot sensors are subjected to strict range limitationsand errors often referred as measurement noise. From the last two decade, multisensor data fusionin mobile robots has become a dominant paradigm due to its potential advantages like reductionin uncertainty, increase in accuracy and reliability and reduction of cost. Sensors play fundamentalrole in mobile robot mapping. It is the process of generating models of a mobile robot's environmentbased on sensory information with an aim to determine the location of various entities such aslandmarks or obstacles. An accurate model of the environment is needed so that a robot completescomplex tasks with high reliability and efficiency. Without such a model, a robot neither can plana path nor effectively search for an object or place. The mapping problem is generally regarded asone of the most important problems in the pursuit of building truly autonomous mobile robots.Despite significant progress in this area, it still poses great challenge such as robustness in map.A new architecture of sensor fusion framework is developed to make the map robust and reliable.The qualitative comparisons show the improvement in the results where the overall occupied andempty area of the resultant map is extremely near to the reference map.
Keywords: Fusion framework Mobile robots
IT - 16
9th International Conference on “Advances in Metrology - 2016”
23
Needs and Challenges in Nanometrology: Role of NationalMeasurement Institute
V N Ojha*, Rina Sharma and Thomas John
CSIR-National Physical Laboratory, Dr. K. S. Krishnan Road, New Delhi-110012, India(*E-mail : [email protected])
Abstract
Nanoscience, Nanotechnology and Nanometrology areas have open up a new world in the field ofscience due to its vast importance in today's world. In this paper we will discuss about the needof nanometrology (the science of measurement and its application at nanoscale) and challenges andopportunities therein. Furthermore we will discuss about the role of 'National MeasurementInstitute' (NMI), to tackle these situation, in view of the demands of nanoscience and technologymeasurements in the country. In the end of this paper, in brief, we shall discuss the status ofnanometrology at NPL-I, the task of establishing the traceability infrastructure for nanometrologyof few of the parameters. At first instance. facilities which have been established at NPL-I forproviding traceability are namely: line width, step height, surface texture measurement in the fieldof nano dimension measurements; as well as for calibration of low voltage (nV), low current (pA),low resistance (µΩ) and electric charge (nC), at the low level electric measurements.
Keywords: Nanoscience, Nanotechnology and Nanometrology
IT - 19
9th International Conference on “Advances in Metrology - 2016”
24
Critical role of Nanometrology in Biological and Medical Sciences
S.H. Pawar*
Centre for Interdisciplinary ResearchD.Y. Patil University, Kolhapur (M.S.), India
(*E-mail: [email protected])
Abstract
The science of measurement at the nanoscale is called Nanometrology. The ability to measure andcharacterize materials which determine their size, shape and physical properties at the nanoscaleis vital if nanomaterials and nanodevices are to be produced to a high degree of accuracy anddependability. It is well known that at nanoscale, the properties of materials are prone and verysensitive to the diameter of their nanoparticles. Hence, designing and manufacturing of nanoparticleswith singular and specific diameter are of crucial importance for nanodevices, specifically in healthcare industries. In view of this, the field of Nanobiotechnology cannot progress independentlywithout progress in Nanometrology. Nanometrology includes measurements where dimensions aretypically between 100 nm and includes measurements of force, mass, electrical, magnetic and otherproperties. If techniques for making these measurements are advanced, then one can understandnanoscale behavior of materials. The instruments for making such measurements are many andvaried. The applications of Nanometrology in medical sciences such as drug delivery, bacteriadetection and capturing, magnetic hyperthermia, repairing of bones, implant of soft tissues, artificialtooth development and cavity repair are important biomedical applications where in the greatercontrol on nanoscale is required. In addition to this, the emphasis will be given to highlight thework carried out in the “Centre for Interdisciplinary Research”, D.Y.Patil University, Kolhapur.
Keywords: Nanometrology, Nanoparticles, Drug and bacteria
IT - 21
9th International Conference on “Advances in Metrology - 2016”
25
Dimensional Nanometrology: Needs, Challenges and Status at NPL India
Rina Sharma* and V N Ojha
CSIR-National Physical Laboratory, Dr. K. S. Krishnan Road, New Delhi-110012, India(*E-mail : [email protected])
Abstract
Nanometrology is still an emerging area in field of metrology. Recent trends of miniaturization inmanufacturing and rapid growth of nanoscience and nanotechnology has led to the concern fornanometrology. Nanometrology encompasses metrology at nanoscale in various measurementareas and thus there are fields within nanometrology e.g. Nanooptics metrology, Nano-dimensionmetrology, nano chemical metrology, nano electrical metrology and soon. Nano-dimension metrologyis important as it underpins the developments in miniaturization in various areas of manufacturinglike automobile sector, semiconductors, thin films and surfaces. Nano-dimension metrology alsois an essential part in some of other areas of nanometrology e.g, mechanical properties such ashardness, and other measurements / properties dependent on size.
The need for metrology is as essential to nanotechnology related product as in classical products.For quality assurance in nanotechnology, one has to demonstrate that the products and manufacturingprocess meet demanded specifications. This requires quantitative measurements traceable to commonstandards. Nano-metrology is not only a matter of change of scale of measurements, but it is matterof change of underlying physics also, for example Casimir forces may become relevant at nanoscale.Thus Challenges of nanometrology are unique. International workings groups have been workingto identify needs, & challenges and make work programs for nano-dimensional metrology.
At NPL India we have made a modest beginning by setting up traceable measurements infrastructurein nanometrology. In case of Nano dimension measurements we have setup traceable facilities forstep height measurements, Surface texture measurements and line spacing measurements. Ametrological atomic force microscope with integrated laser interferometers for x,y,z scalemeasurements and a 3D optical profiler have been established. In this paper we shall discuss needsand challenges in nano- dimension metrology and also present the present status of nano-dimensionmetrology capability at NPL India.
Keywords:
IT - 22
9th International Conference on “Advances in Metrology - 2016”
26
Realization of Mole under Metrology in ChemistryActivity: Current Status and Future Plan
Prabhat K. Gupta
CSIR-National Physical Laboratory, Dr. K. S. Krishnan Road, New Delhi-110012, India(*E-mail : [email protected])
Abstract
The mole, symbol mol, is the SI unit of amount of substance of a specified elementary entity, whichmay be an atom, molecule, ion, electron, any other particle or a specified group of such particles;its magnitude is set by fixing the numerical value of the Avogadro constant NA to be 6.022 141 29× 1023 when expressed in the SI unit mol–1. In other words, the number of entities in one mole isequal to the numerical value of the Avogadro constant, which is known as the Avogadro number.This definition was agreed for the planned 26th CGPM in 2018. It may replace the definition agreedin 1971, which defined the mole as the amount of substance of a system which contains as manyelementary entities as there are atoms in 0.012 kilogram of carbon 12. In practice, the uncertaintyin primary realization of mole differs from methods generally used to realize the mole. In metrologyin chemistry, the realization of mole in all types of chemical entities is done using variety of primarymethods of measurements in terms of the amount of substance concentration (mol/m3), amount ofsubstance content (mole/kg) or amount of substance fraction (mol/mol). Three widely used methodsto realize the mole are: gravimetric, use of the ideal gas law and electrolysis. Currently for therealization of mole, a network project on the "International Avogadro Coordination" is formulatedin which few NMIs are jointly working to determining the best experiment values of both theAvogadro and Planck constants prior to fixing their current values. Other than this constant, inpractice the dissemination of traceability (of mole measurement/ realization) in metrology inchemistry is done by an artefact (e.g. in the case of ozone measurement) and using certifiedreference materials (this is a widely used practice in chemistry). At CSIR-NPL, our focus is toprepare elemental calibration solutions and primary gas standards (especially for greenhouse gases,and criteria pollution gases and particulate matter). We have our network partners in different sisterlaboratories of CSIR those involved in preparation of CRMs in water, food material, etc. Also, wehave a joint technical cooperation project with PTB, Germany for supporting this activity in India.Recently, NABL with the cooperation of CSIR-NPL has also started a "Reference Material Producer(RMP)" program in India in which they are giving accreditation to RMPs. Beside this there are somany challenges in this area as it is directly linked with quality of life. This talk will be focusedon such issues and future plan of MiC activity at CSIR-NPL.
Keywords: Mole realization, MiC, International-national status, Challenges, Future plan.
IT - 23
9th International Conference on “Advances in Metrology - 2016”
27
Agriculture Crop Residue Burning in Indo GangaticPlains : A Global Threat
Ravinder Agarwal
Electrical and Instrumentation Department, Thapar University, Patiala, India(E-mail : [email protected])
Abstract
From few decades, the intense burning of agricultural waste is being considered as burden foratmospheric environment on global scale. This activity releases a huge amount of hazardous gasesand respirable suspended particulate matters into ambient environment, which are responsible ofmortality and morbidity. As per WHO reports, they cause several chronic diseases like asthma,shortness of breath etc. From several satellites based studies and research activities it has beenobserved that the Indo Gangatic plain areas like Punjab, Haryana, Utter Pradesh are the key regionswhere agriculture waste fire counts were more than other regions. Due to high yield crop seeds andmodernisation in harvesting process, every year 27 million tonnes (approx.) of crop residue wastegenerated and burnt in this belt. Despite the legislative acts and policies, the fire counts wereintense in few peak months (October -November and March April). It has been observed inliterature survey that there are veryfew ground based studieswho evaluated the health status ofliving beings in these regions. To evaluate the health level of inhabitants, a study was conductedin Punjab region. We randomly select 150 healthy children from different cities of Punjab. Spirometrictests were conducted on selected children for minimum four crop burning seasons. The results werealarming. During and after burning episodes, a fall was observed in various respiration relatedparameters which were statistically significant when related to pollutant levels like PM10 andPM2.5. It has been seen that the maximum degradation was observed in capacity and flow of lungs.From the research it can be concluded that the physiological parameters were very sensitive to theraised levels of pollutants than the permitted levels. It has been seen that the agriculture cropresidue burning affect the carbon credits of South East Asia. From the trends and ground realityit can be concluded that this practice is very harmful for local and regional level. This practice notonly affects the ambient environment but also the health level of human subjects. With the exponentialgrowth in agriculture field, it can be predicted that the trends are likely to be more adverse in future.There are various methods to handle the agriculture waste like use for energy generation, as fodderfor cattle, as fertilizer etc. So strong legislative steps should be taken in the areas to stop thispractice, otherwise results will be chronic.
Keywords: Agriculture crop residue burning, Pollution levels, Respiratory parameters, Healthof children, Indo Gangatic Plains
IT - 24
9th International Conference on “Advances in Metrology - 2016”
28
International Magnetic Standards on Electrical Steel toHydroelectric Cell as Green Energy Solution.
R. K. Kotnala
CSIR-National Physical Laboratory, Dr. K. S. Krishnan Road, New Delhi-110012, India(*E-mail : [email protected]
Abstract
Primary standard laboratory at NPL for advanced primary standards on magnetic measurementswas established further extending the work for a low magnetic field range (100µT to 2000 µT withan uncertainty 10-4). Recently on Jan 8, 2012 this lab has been internationally recognized for 10magnetic measurements parameters in the preview of ISO:17025 for International Bureau ofWeights & Measure, (BIPM) France. It certifies that these parameters capability is comparable tothe best in the world and certificates. It includes electrical steel power loss measurements by IEC-404.2 international standard test.
In this talk primary standards on magnetic measurements have been elaborated and especiallyinternational standard on electrical steel power loss measurements (used for transformer, motor andgenerator cores) has been outlined. Regulating this test on distribution transformer very effectivelyshall save a huge power loss from the transformers.
After long persistent & consistent efforts a green electrical energy source has been innovated as -Hydroelectric Cell based on water molecule dissociation at room temperature by Lithium substitutedMagnesium Ferrite. Hydroelectric Cell is a combination of materials property with electrodereduction potential, not reported by anyone. Nano pores created in magnesium ferrite developenough electric field so that physisorbed water molecule is dissociated spontaneously into ions togenerate electric power of 82 mW.The process is physical phenomenon of material followed byions collection.This work is based on porous Lithium substituted magnesium ferrite materialproperty for the first time to dissociate water molecule at room temperature and we have exploitedcollection of hydrogen & hydroxide ions using electrode reduction potential of zinc & silver inlarge quantity continuously. Its working principle has been elucidated in this talk.
Keywords: Magnetic standard, Hydro electric cell
IT - 25
9th International Conference on “Advances in Metrology - 2016”
29
LF, HF Impedance & DC Standards at CSIR-NPL: Present Status
Thomas John*, Satish, Priyanka Jain and V N Ojha
ALSIM, CSIR-National Physical Laboratory, New Delhi 110012, India(*E-mail: [email protected])
Abstract
The LF, HF Impedance & DC standards at CSIR-NPL is concerned with the realization, up-gradation, maintenance and dissemination of primary standards of capacitance, inductance, resistance(both DC & AC) and DC voltage to provide highest level of precision calibration facilities to thevarious regional calibration and testing laboratories and other organizations and industries of thecountry providing traceability to the SI units. In this presentation we shall provide an overview ofthe present capabilities at CSIR-NPL in this area. The presentation will also cover the in-housedevelopmental activities directed towards upgrading the present capabilities.
Keywords:
IT - 26
9th International Conference on “Advances in Metrology - 2016”
30
Importance of NMIs Participation in BIPMKey/ Supplementary Inter-comparisons
P. S. Negi
LF & HF Voltage, Current and Microwave StandardsALSIM-NPL, New Delhi
Abstract
The Regional Metrology Organizations (RMOs) of Bureau of Weights and Measures (BIPM) playan important role in the CIPM Mutual Recognition Arrangement (MRA) and also has theresponsibility for carrying out comparisons to support mutual confidence in the validity of thecalibration and measurement certificates of their member National Metrology Institutes (NMIs).The NMIs through CIPM MRA demonstrate the international equivalence of their measurementstandards and the calibration and measurement certificates they issue. The result is internationallyrecognized (peer-reviewed and approved) Calibration and Measurement Capabilities (CMCs) ofthe participating institutes. The Consultative Committee (CC) of the CIPM selects the key quantityto be compared, approves the protocol of the comparison, and the results before publication in theKey Comparison Data Base (KCDB). The comparison can be CIPM of international scope deliveringa reference value for the chosen key quantity or RMO of regional scope with a number of commonparticipants and with protocols allowing their results to be linked to those of the CC key comparison.
As a Sub-Division of ALSIM-NPL (NMI India) our activity has the responsibility to establish,maintain and upgrade the present apex level standards and related calibration facilities for LF &HF Voltage, Current and Microwave parameters and to continuously participate in BIPM/ APMPinter-comparisons to establish a close degree of equivalence in measurements among the participatingNMIs. ALSIM-NPL India has participated in many comparisons in the past and demonstrated itscapability to Initiate & Pilot APMP comparisons in Electrical and Physico-Mechanical parameters.We share our experiences in the recently piloted APMP comparisons for AC and microwaveparameters.
Keywords:
IT - 27
9th International Conference on “Advances in Metrology - 2016”
31
Present Status and Future Plan of AC High Voltage andHigh Current Standards at CSIR-NPL
M.A. Ansari*, L. Sridhar, M.K. Tamrakar, Shrikrishan and V.N. Ojha
Apex Level Standards and Industrial MetrologyCSIR-National Physical Laboratory, Dr. K. S. Krishnan Road, New Delhi-110012, India
(*E-mail: [email protected])
Abstract
AC High Voltage and High Current Standards of NPLI is maintaining National Standards for ACHigh Voltage (HV) and High Current Ratios at power frequencies (50Hz) by using ReferenceStandard High Voltage Ratio Measuring System (upto 100kV) and Reference Standard CurrentTransformers (upto 5kA), respectively. It is also maintaining the National Standards for the calibrationand measurement of AC HV Capacitance and Tan δ upto 200kV at 50Hz by using ReferenceStandard HV Capacitors and High Precision C & Tan δ Measuring System. This activity isdisseminating the traceability at par with international level for voltage transformers, currenttransformers, HV capacitors, HV capacitance bridges and allied equipments.
It is planned to enhance the facilities of AC high voltage upto 300kV in recent times and upto 765kV in future, to meet the needs of the power sector industries and utilities. Similarly, the highcurrent facilities are also planned to be enhanced from 5kA to 20kA. The present status and futureplan of various parameters in this activity, along with their traceability and uncertainty inmeasurements will be presented in detail.
Keywords: AC High Voltage, AC High Current, Current and Voltage Transformers
IT - 28
9th International Conference on “Advances in Metrology - 2016”
32
Recent progress in quantum Hall effect resistance metrology
H K Singh
CSIR-National Physical Laboratory, Dr. K. S. Krishnan Road, New Delhi-110012, India
Abstract
The quantum Hall effect (QHE), which is a fundamental characteristic of high mobility 2DEGsystemswas discovered by K von Klitzing [Phys. Rev. Lett. 45, 494 (1980)]. QHE provides aninvariant reference for resistance linked to fundamental constants e and h (RH=h/ie2=RK/i). Thequantized resistance given by RK = h/e2 = 25812.807557(18) Ω is called the von Klitzing constant[Rep. Prog. Phys. 64, 1603 (2001), Phil. Trans. R. Soc. A 363, 2221 (2005), Phil. Trans. R. Soc.A 369, 3954 (2011)].The QHE (at 1.3 K and a magnetic field of 5-14 T) supplies a quantumresistance standard of value RK/i (i=2), with a relative reproducibility better than 10-10. The bridgeused for comparison of resistance standards iseither cryogenic current comparator (CCC, operatingat 4.2 K) or a room temperature direct current comparator (DCC); the former having much betteraccuracy (uncertainty ~10–9 in terms of RK-90). The most widely QHE device is the GaAs/AlGaAsquantum well. Current state of the art in carrier mobility for ultralow disorder in GaAs/AlGaAssystem is 35 x 106 cm2/Vs[J. Cryst. Growth 311, 1658 (2009)]. In recent years several other new2DEG systems have emerged. Among the new 2DEG systems, Graphene has stolen all the limelight ever since its discovery in 2004. After the first demonstration of QHE in graphene[Science315,1379 (2007)], NPL-UK took the lead and made the first demonstration of the quantumHall effect in Graphene in quantum resistance metrology [Nature Nanotechnology 5, 186 (2010),New J. Phys. 13, 093026 (2011). Metrologia 49, 294 (2012)]. The most recent report (LNE-France)in this direction [Nature Nanotechnology 10, 965 (2015)] clearly establishes the applicability ofGraphene based devices in quantum resistance metrology. The agreement between quantized Hallresistance in Graphene and GaAs/AlGaAs with an ultimate relative uncertainty of 8.2×10⁻¹¹ [NatureCommunications 6,1 (2015)] is also very encouraging. Recently, 2DEG showing the integer andfractional QHE has also been realized in ZnO/MgxZn1-xO hetero-interface [Science 315, 1388(2007), Nat. Mate. 9, 889 (2010), Phys. Rev. B.89, 075307 (2014)].
Keywords:
IT - 29
9th International Conference on “Advances in Metrology - 2016”
33
Time and Frequency Metrology at NPL India
Ashish Agarwal
CSIR-National Physical Laboratory, Dr. K. S. Krishnan Road, New Delhi-110012, India(E-mail: [email protected])
Abstract
Atomic Clocks of NPL have the prime responsibility of maintaining the Indian Standard Time(IST). The atomic clocks provide a standard against which all the time and frequency signals in thecountry are mandated to be calibrated. This internationally accepted standard provides the mostprecise reference standard to the society for their timing applications in precision navigation,location determination, mobile and broadband telecommunication, Bank and Stock markettransactions, Flights and aviation, Power distribution, automated traffic signaling system and manymore. In the recent years, NPL has started contributing to the development of Indian RegionalNavigational Satellite System (IRNSS) by developing atomic clocks suited to be operated in space.Further time scale of IRNSS is being provided traceability to the Coordinated Universal Time(known as UTC) by NPL, wherein even billionths of a second are significant. The accurate timingssignals generated by atomic clocks are also used to develop various national primary standardssuch as those of length and voltage.
NPL has indigenously developed a new atomic clock, the cesium fountain, based on control ofatomic motion using laser cooling and trapping of atoms. This has led to the most accuratemeasurement of frequency in the country. The cesium fountain frequency is stable to few parts in1015 at less than one day of averaging time and realize the second of the international system ofunits. The fountain is now contributing to calculation of the international timescales, UTC(Coordinated Universal Time) and TAI (International Atomic Time. NPL is in process of developingan improved version of the current cesium fountain.
NPL has also started working on an atomic clock based on an optical transition of a single trapped171Yb+ ion. Accuracy of such a clock is expected to be two orders of magnitude higher than thefountain clock, since the operational frequency is about ten thousand times larger than that of thefountain clock.
Keywords:
IT - 30
9th International Conference on “Advances in Metrology - 2016”
34
Mass Determination in Legal Metrology
Anil Kumar
CSIR-National Physical Laboratory, Dr. K. S. Krishnan Road, New Delhi-110012, India(*E-mail : [email protected])
Abstract
Mass measurement should be looked from two angles: first of all its importance lies in being oneof the base units. Here is scientific metrology in mass is involved. Secondly, mass measurementis an important parameter in industry and trade and finally falls under the preview of legal metrology,so subjected to certain mandatory controls.
Mass measurement in scientific metrology way and legal metrology is carried out on basis of OIML(the International Organization of Legal Metrology) Recommendation R-111. Most of the NMI's(National Metrology Institutes) follow R 111-1: 2004 standard for mass determination. The otherstandard for mass determination is ASTM E617: 2013. This is also broadly based on OIML R 111-1: 2004. The standard OIML R 111-1 covers every aspect of the verification and criterion of weightof nominal values from 500 kg to 1 mg and covering all classes.
Mass measurement from scientific angles has nine classes of weights, E1, E2, F1, F2, M1, M1-2,M2, M2-3 and M3 according to their maximum permissible error (MPE).
Mass measurement from legal metrology angle has three classes namely, 1) reference standardweights, 2) Secondary standard weights, 3) Working standards weights.
In this paper, we elaborate discuss the MPE of different classes of weights as per OIML R-111-1legal metrology weights as per Legal Metrology Act 2009, which came in effective from 1st April2011.
Author will also throw some light on special type of weights under Indian Regulation like caratweights, flat cylindrical weights, hexagonal weights etc.
Keywords: Mass measurement, OIML, R 111-1: 2004.
IT - 32
9th International Conference on “Advances in Metrology - 2016”
35
Facilities Established at CSIR-NPL for the Realization andDissemination of Force, Torque and Hardness Measurements
S.S.K. Titus*
CSIR-National Physical Laboratory, Dr. K. S. Krishnan Road, New Delhi-110012, India(*E-mail : [email protected])
Abstract
CSIR-National Physical Laboratory, India is the National Measurement Institute (NMI) of India, which hasbeen the custodian of national standards in India at apex level which also disseminates the national standardsto the users including strategic sectors, calibration laboratories and various industries. Precision measurementsof Force, torque and hardness are very much essential to several mechanical industries like automobile,aviation, etc. and for testing of materials under stress which involves compressive and tensile forces.
This group has been actively involved in establishing the primary standards,at par with other internationallyreputed NMIs, for realizing the scales of force, torque and hardness in order to provide the necessary traceabilityto the user industries across the county. This group is also constantly engaged in research and developmentalactivity for augmentingand upgrading the capability of the machines to keep abreast with the changes takingplace in the international standards and also equips itself to participate in the international inter-comparisonsto establish equivalence of the standards to the international system of measurements.
We have established facilities for realizing these derived parameters based on the first principle methodaccording to the requirements of international standards at national level and maintain them to their bestpossible performance. For the realization of force in range of 1 N – 3 MN, many standard machines have beenused having different measurement capabilities. A force standard machine (FSM) of 1 MN capacity is establishedat CSIR-NPL to provide precise measurement of force in range of 1 kN – 1 MN which is serving as the primarystandard for force and from which other force calibration machines such as dead weight force machine(DWFM), dead weight cum hydraulic/ lever multiplication machine and force comparator machines derive theirtraceability.This machine consists of a deadweight part to generate a nominal force of 100 kN capacity and alever amplification part with a nominal forceof 1 MN. The uncertainty associated with the realized forces is± 0.002 % (k=2) for the dead weight side and ± 0.009 % (k=2) for lever multiplication side of the machine whichwas reaffirmed through a bilateral comparison with the PTB, Germany.
A primary torque standard machine has been established in our lab for realizing torque in the range of 2-2000Nm, consisting of a double sided lever supported on strain controlled elastic hinges, having a best measurementcapability (BMC) of ± 0.01% in this range. The established bmc of the machine was reaffirmed by participatingin the CCM TK1.1 inter-national key comparison and this primary machine is used to provide the traceabilityin torque measurement to the other torque machinecomprises of a lever balanced on device axis and calibrateddead weights to generatetorque in the range of 20-2000Nm and also to the user industries.
Hardness standardizing machines are established for the precision measurements of hardness values in theBrinell, Vickers and Rockwell scales as per the requirements of the international standards.The CMC valuesof these machines are reaffirmed by comparing the realized hardness values using high precision standardhardness blocks having traceability to a leading NMI. The CMC values in HRA and HRB scales are alsoreaffirmed in APMP key comparison.In this presentation, we will discuss about some of the salient features ofthese machines, the inter-comparison results, the impact of the precision measurements in traceability and theinfluence of such measurements in the industrial growth.
Keywords: BMC, CCM TK1.1, Hardness, Force
IT - 33

9th International Conference on “Advances in Metrology - 2016”
36

9th International Conference on “Advances in Metrology - 2016”
37
POSTERPOSTERPOSTERPOSTERPOSTER

9th International Conference on “Advances in Metrology - 2016”
38
9th International Conference on “Advances in Metrology - 2016”
39
P001
Thermoelectric Technology :An Overview on Fundamental Theory to Physical Measurement
N. S. Chauhan1 and D. K. Misra2*
1CSIR-National Physical Laboratory, Dr. K. S. Krishnan Road, New Delhi-110012, India2Academy of Scientific & Innovative Research (AcSIR),
CSIR-National Physical Laboratory, New Delhi-110012, India(*E-mail : [email protected])
AbstractThermoelectric research has witnessed ground breaking progress over the past few decades.Improvement in the thermoelectric figure of merit, ZT, a measure of the competition betweenelectronic transport (i.e. power factor) and thermal transport (i.e. total thermal conductivity) haslong been surpassed long time barrier of ~1. Technology that was once considered too inefficientto be cost effective, is now looked as a potential technology for future and thermoelectric scientistsare targeting ZT > 2 as the new goal.
Development activity of thermoelectric materials at CSIR-National Physical Laboratory (NPL)focuses on the mid to high temperature range (i.e. RT to 900°C). An extensive spectrum ofmeasuring techniques (temperature dependence of the Seebeck coefficient, thermal and electricalconductivity, Hall coefficient and thermoelectric figure of merit) is required for comprehensivefunctional characterization and transport properties analysis in thermoelectric materials, whichinvolves a wide temperature range spanning from ambient up to highest relevant temperatures. Thisarticle discusses an overview of fundamental theory to physical measurement used in thermoelectricanalysis. Real thermoelectric material properties are highly temperature dependent and are oftenmeasured individually using multiple measurement tools on different samples resulting in largeuncertainties in the reported ZT values.
Keywords: Thermoelectric, Measurement Techniques, CSIR-NPL,
9th International Conference on “Advances in Metrology - 2016”
40
P002
Preparation of Primary Gas Standard Mixture ofCarbon Monoxide in Nitrogen by Gravimetric Method
Ravleen Kaur, Khem Singh, Daya Soni, Prabha Johri, Sulakshina Koul,Shankar G. Aggarwal* and Prabhat K. Gupta
CSIR-National Physical Laboratory, Dr. K. S. Krishnan Road, New Delhi-110012, India(*E-mail : [email protected])
AbstractCarbon monoxide (CO) gas is emitted to the atmosphere from the incomplete combustion of fuelsand carbonaceous material, such as crude oil and petroleum products, wood, coal, charcoal, trashes,etc.It is toxic to hemoglobicanimals and humans. According to Occupational Safety and HealthAdministration (OSHA), the maximum allowable concentration, i.e. time weighted average (TWA)permissible exposure limit (PEL) of CO for continuous exposure in any 8-hour period is 35 ppm(40 mg/m3). When encountered in concentration above about 35 ppm,it combineswithhemoglobinwith an affinity ranging from 210 to 240 times greater than that of oxygen toproduce carboxyhemoglobin, which usurps the space in hemoglobin that normally carries oxygen.The natural concentration of carbon monoxide in air is around 0.2 ppm, however it varies with sitedepending on the sources at the sites. Therefore it is an important criteria pollutant of many nationalambient air quality standards (NAAQS). Analyzers based on several adequate techniques (e.g.NDIR/GFC, CRDS, etc.) exist for highly reliable monitoring of CO to ensure compliance with theNAAQS. Gas chromatography technique is also used for semi-continuous monitoring or off-linemeasurements. For reliable measurement, it is essentially required that instrument is calibratedusing SI traceable gas standards. Therefore, in this paper we discuss about the preparation of gasmixture of CO in N2at National Physical Laboratory India (NPLI) facility. These mixtures areprepared gravimetrically in accordance with ISO 6142 "Gas analysis-Preparation of calibration gasmixtures-Gravimetric method". Two sets of the CO gas mixtures at a nominal concentration of 87- 113 µmol.mol-1are prepared. Each set consists of 3 dilution steps in a series starting from pureCO (99.97%) and targeting to the mole fractions of 5/95, 0.25/99.75 and 0.01/99.99, respectively.The cylinders used were made up of aluminium having a pressure of approximately 120 bar andvolume of 5 dm3. All the weighing of the gas cylinders was done using equal arm double panbalance with the precision of 1 mg in 25 kg. Further, the analysis of the impurities in the diluentgas (especially CO, CO2 and CH4) was determined using CRDS and GC techniques. Preparedstandards are validated/tested against SI traceable standard using GC-FID technique in accordancewith ISO Guide 34.
Keywords: Carbon monoxide, Primary gas standard mixture, Gravimetric method
9th International Conference on “Advances in Metrology - 2016”
41
P003
Two Rules based Fuzzy Swing-up and Four Rules based Non-linear FuzzyStabilization of Rotary inverted Pendulum and Comparison with Linear
Fuzzy Controller and LQR
Navjeet Kaur and Pradeep Yadav*
Control and Instrumentation, Dr. B. R. Ambedkar NIT, Jalandhar, India(*E-mail : [email protected])
AbstractThe application of fuzzy control to large-scale complex systems is not, by no means, trouble-free.For such systems the number of the fuzzy IF-THEN rules as the number of sensory variablesincrease, increases very quickly to an unmanageable level. When we take into account more inputvariables in control system, the number of rules grows exponentially, if we have l possible valuesfor each of n variables, we must describe control corresponding to all 1^n possible combinationsof input variables. In this paper, Swing-up and Stabilization of the Rotary inverted pendulum (RIP)is done through the fuzzy controller. The attraction of this paper is achieving the above stated aimthrough lesser number of rules. RIP is highly unstable and nonlinear in nature, so stabilization ofthe RIP is itself a challenging task. Swing-up mechanism in RIP is a type of unstable mechanismwhich is done effectively by using a fuzzy controller only, by just two rules. There are four statesof RIP that needs to be controlled and they are controlled by fuzzy controller with the help of onlyfour rules. Fusion technique has been applied to reduce the number of inputs of the fuzzy controllerso that the fuzzy controllers which have less number of rules can also be applied on complexsystems. Simulation which is done on MATLAB/SIMULINK shows the effectiveness of the proposedcontroller and its implementation, successfully in real time.
Keywords: Swing-up fuzzy, Stabilization fuzzy, RIP
9th International Conference on “Advances in Metrology - 2016”
42
P004
Dispersivity: A New Parameter for the Ultrasonic MetrologicalCharacterization of Liquids
Deepa Joshi*1, Ashok Kumar2, Reeta Gupta1 and Sanjay Yadav1
1CSIR-National Physical Laboratory, Dr. K. S. Krishnan Road, New Delhi-110012, India2Former Scientist, CSIR-National Physical Laboratory, Dr. K. S. Krishnan Road,
New Delhi-110012, India(*E-mail : [email protected]
AbstractThe velocity at which an ultrasonic wave propagates through a medium and the amount by whichit is attenuated are governed by interactions between the ultrasonic wave and the medium particles.The parameters responsible for such interactions are attenuation and dispersion. Till now ultrasonicattenuation was the only parameter to act as a probing tool for assessing losses occurring in themedium due to propagation of ultrasonic waves. Attenuation is not an absolute but relative parameterand hence includes measurement errors. The reported values for these measurement errors availablein literature vary among different studies. The alternate approach is to measure dispersion insteadof attenuation. The measurement accuracy improves in the dispersion measurement because velocityestimation is fundamentally a time based measurement, while attenuation estimation is a voltagebased measurement. Furthermore, the use of advance instrumentation and state of art electronicsresults in detection of even a small quantity of dispersion, which was not possible earlier as itsvalue is comparable to experimental uncertainty. To quantify dispersion, higher accuracy inmeasurements is expected with dispersivity as it is a time based measurement.
In this paper, we introduce a new parameter namely Dispersivity, with the aim to explore the highfrequency sound dispersion in liquids. Experiments are conducted for the measurement of ultrasonicphase velocity as a function of frequency in several liquids and liquid mixtures. We carry outdispersion measurements in a series of liquids/mixtures. The maximum estimated uncertainty isfound to be ±0.02%. Water showed minimum dispersivity of 5%, which earlier supposed to behaving dispersion less. Binary mixture of ethylene glycol showed a maximum dispersivity of 28%.The results thus obtained are on the dispersivity measurements in these liquids are discussed indetails.
This work could find potential applications in the development of ultrasonic spectroscopy as acharacterization tool. Further studies are required to explore the possibilities of its applications inthe fields of ultrasonic metrology as reference liquids for intercomparison exercises and in non-destructive testing (NDT).
Keywords: Metrology, Dispersion, Ultrasonic, Liquids, Uncertainty.
9th International Conference on “Advances in Metrology - 2016”
43
P005
Measurements of Shear Strength ofHigh Strength Reinforced Concrete Beams
Harpal Singh1 and Balwinder Kaur2
1Professor,Guru Nanak Dev Engineering College, Ludhiana, India2PG Student, Civil Engineering Deptt., Guru Nanak Dev Engg. College, Ludhiana, India
(*E-mail : [email protected])
AbstractMeasurements were carried out to study the shear behavior of high strength reinforced concretebeams without web reinforcement. Comparison of the experimental results with various availabledata and the shear models has been made. The effect of shear span to depth ratio (a/d-2.4) andcompressive strength of concrete (M60, M80) with different percentage of longitudinal reinforcement(0.66%, 1.04%, 1.32%, 1.5%, 2.08% and 3%) on the shear strength was investigated. The studyhas revealed that there is a great impact of longitudinal reinforcement on the shear strength of thebeams. The experimental results are also compared with two different shear models namely ACICode equation and Indian Standards (IS 456:2000).
Keywords: Measurements Shear strength, Concrete
9th International Conference on “Advances in Metrology - 2016”
44
P006
Proposal for Establishment of DC High Voltage Standardup to 300 kV at NPL
K B Ravat, Harish Kumar, Thomas John and V.N. Ojha
CSIR-National Physical Laboratory, Dr. K. S. Krishnan Road, New Delhi-110012, India(*E-mail : [email protected])
AbstractThis paper describes the design and plan of implementation of D C high Voltage measurementlaboratory up to 300kV. The Precision high Voltage divider is the Primary standard of the laboratory,it is traceable to the Josephson Voltage Standard through Binary step up method. Two similardividers of 150 kV each connected in sequence of steps that combine and separate to evaluatevoltage coefficient of each divider up to 300kV. The expended uncertainty for the divider up to300kV is 35 x 10-6 µV/V. To confirm the validity of the method, the ratio at 1 kV is compared withthe resistance ratio of the divider is with in 15 x 10-6.
The space required to establish DC High Voltage Standard of 300 kV are 5 m X 10 m X 6 m, Itcan be accommodate in existing DC high voltage Laboratory with some change of arrangementlike shielding and shifting of fence. The automation of High voltage source through optical fibreprovides galvanic isolation, it's protected the computer from high voltage surge, life of user andalso improved the uncertainty of measurement. The advance graphical software to analysis theoutput data of HV divider and role of stability study to determine voltage coefficient is also discussin this proposal.
Keywords: DC High Voltage, Voltage divider, Binary setup method
9th International Conference on “Advances in Metrology - 2016”
45
P007
Performance Evaluation of Clamp-on Ultrasonic Flow Meterfor Non-ideal Conditions
A. Gopan C. K.*, B. K. G. Jayesh, C. P. K. Suresh and Jacob Chandapillai
Water Flow Laboratory, FCRI, Palakkad, India.(*E-mail :[email protected])
AbstractThe accuracy of flow measurement plays a very vital role in industry and is decisive in the qualityand quantity of products. Different types of flow meters based on over a hundred different operatingprinciples are available for flow measurement in pipe lines. Proper installation of flow meter is verymuch essential for achieving better accuracy in flow measurement. Flow meter performances areaffected by valves and bends disturbing the flow as well as by electromagnetic noise, acoustic noiseand pulsations, and particles, droplets and bubbles. Different meters respond to installation effectin different ways. For accurate measurement of flow in pipes, it is recommended that a straightsection of pipe be installed immediately upstream from the flow meter to avoid distorted flowpatterns at the metering location. In this paper the performance of ultrasonic flow meters in non-ideal piping scenarios was studied by laboratory experiments. Clamp-on ultrasonic flow meters hasbecome very popular because it is non invasive and can be used in a wide range of pipe sizes.Currently, calibration of clamp-on ultrasonic flow meter is conducted under proper conditionsavailable at the calibration laboratories. In many existing piping scenarios, however, such flowconditions are impossible to achieve. Apart from this the meter is used in pipe line sizes which isdifferent from the pipe size in which the meter was calibrated. The performance of clamp-on flowmeter in non-ideal upstream conditions, and also in varying pipeline diameters is studied here.From this study we could establish that pipe line diameter has significant effect on the accuracyof clamp-on ultrasonic flow meter for same velocity range. The effect of up-stream straight lengthon the meter performance is also evaluated for various up-stream configurations and was able toestablish that a straight length of 10 tomes pipe diameter shall be provided at site for getting anaccuracy of ± 1% in flow rate measurement.
Keywords: Clamp-on ultrasonic flow meter, non-ideal conditions, straight length
9th International Conference on “Advances in Metrology - 2016”
46
P008
Establishment of Metrological Traceability ofHF Impedance Standards at CSIR-NPL: Present Status
Satish*, Sachin Kumar and Thomas John
CSIR-National Physical Laboratory, Dr. K. S. Krishnan Road, New Delhi-110012, India(*E-mail : [email protected])
AbstractLF, HF Impedance and DC Standard laboratory of CSIR-NPL is responsible for maintainingnational and reference standards of dc voltage, current, resistance and impedance parameters at lowand high frequency. During recent years, this laboratory has initiated the work of establishing themetrological traceability of impedance standards at high frequency (HF). This paper provides thepresent status of the work performed in this direction. The high precision air-dielectric-coaxial-transmission-lines from 3 to 30 cm are at the apex of the traceability chain of impedance standardsat HF. The transfer or reference standards of impedance at HF include coaxial impedance standards,coaxial capacitors, three terminals (3T), and four-terminal-pair (4TP) capacitance standards. LCRmeters and impedance analyzers are used as working standards of impedance at HF. The coaxialair-lines (Type 900-LZ series) have been characterized in the frequency range of 10 kHz to 250MHz using transmission line theory. The characterization procedure of air-lines involves thedetermination of distributed primary impedance parameters using dimensions of air-lines whichare traceable to Length and Dimension Standard. The reference capacitance value (1 kHz) of eachof these air-lines has also been measured which thereafter extrapolated upto 250 MHz usingresonance technique. The resonance frequency of coaxial air-lines is traceable to Time and FrequencyStandard through impedance analyzer. Reference capacitance value of air-lines is traceable to crosscalculable capacitance standard which is being maintained as the primary standard of capacitanceat low frequency at CSIR-NPL. 3T GR1404 type air capacitance standards of nominal values 100pF and 1000 pF have been evaluated using frequency-dependent-inductance. The evaluationprocedure involves the measurement of reference capacitance value and residual capacitive andinductive parameters of each standard. Frequency-dependent-inductance has been thereafter estimatedusing linear regression from measured residual inductive parameters. Then frequency dependentcapacitance value for capacitance standards has been computed upto 1 MHz. 16380A type 4TP aircapacitance standards of nominal values 1, 10, 100 and 1000 pF have also been evaluated usingelectrical equivalent circuit model (EECM). The approach used for the evaluation is based on thedetermination of capacitive and inductive residual components of EECM. A measurement automationprogram has been developed in order to control the evaluation procedure. The working standardsof impedance have been calibrated using the evaluated reference standards. The work performedwill ensure the establishment of apex level calibration services of capacitance standards at highfrequency.
Keywords: High Frequency, Impedance, Standards, Metrological traceability, Calibration
9th International Conference on “Advances in Metrology - 2016”
47
P009
Selection and Calibration of Acoustic Sensors
A.Tamil Chandran, M.P. Dhanya, P. Surendran* and Jacob Chandapillai
Fluid Control Research Institute, Palakkad, India(*E-mail : [email protected] )
AbstractThe basic elements of a noise measuring system are a microphone, an amplifier, a signal processorand a readout or monitoring unit. The simplest practical realization of such a system is the portablesound level meter. The microphones are the standard acoustical transducer for all sound and noisemeasurement. Different types of microphones are available; each has its own advantage anddisadvantage. This paper attempts to compile the information on different types of microphonesavailable, its characteristics, calibration methods and relevant standards. This paper also discussesthe secondary free field calibration procedure as per IEC 61094/8 -2012 and highlight the contributionof various uncertainty factors affecting calibration.
Keywords: Acoustic sensor, Calibration method, Free field
9th International Conference on “Advances in Metrology - 2016”
48
P010
Performance Study of Capacitance Type Probes in Level Measurement
K. Suresh*, P.K. Suresh and Jacob Chandapillai
Fluid Control Research Institute, Palakkad, India(*E-mail : [email protected])
AbstractIn petroleum dispensing station, liquids such as petrol, diesel, and other hydrocarbons are storedin tanks of different capacities. The amount of such liquid stored can be found by measuring levelof the liquid in the container or tank, which is done by manual dip method in the present scenario.Continuous level sensors measure the level to determine the exact amount of fuel in a continuousmanner. In petrol and diesel dispenser outlets, these type of probes are becoming popular for onlinelevel monitoring in the storage tanks. Level probe is an ideal solution for the dispensing station infuel inventory monitoring system. The level probe monitors fuel density and inventory levels in thetanks and provides accurate, reliable information without manually taking tank readings. For theretail outlet automation, additional features of the level probes communicate the status of tankcontents, including volume, temperature, mass, water level and continuous tank leak detection. Thecomputer - web interface feature allows authorized users access to tank information remotely fromany computer connected to the internet or wide area network, as well as custom alerts which canbe sent to email or mobile devices. These type of probes are tested for its accuracy at the FCRIlaboratory before installing at site. In this paper we discuss on different types of probes, workingprinciple, testing methods and advantages of the level probes in continuous level measurement.
Keywords: Level probe, Dispensing station, Automation, Density.
9th International Conference on “Advances in Metrology - 2016”
49
P011
Studies on Use of Ferroelectric Relaxor as High Pressure Sensor
Vinay Kumar1* and Sanjay Yadav2
1Jubail Industrial College,Jubail Industrial City, Saudi Arabia2CSIR-National Physical Laboratory, Dr. K. S. Krishnan Road, New Delhi-110012, India
(*E-mail : [email protected])
AbstractDevelopment of a low cost high pressure sensor with reasonable accuracy is always a challengefor researchers and metrologists. The ferroelectric relaxorexhibits high strain response and highdielectric constant near the transition temperature. During last few decades, these relaxorshaveextensively been studiedand found useful in several applications incapacitors, memories, opticalwave guide and detectors etc.The present paper describes an effort made to find new applicationof ferroelectric material as pressure sensor. The Present study describes the studies carried outonpressureand temperature dependent dielectric properties of (1-x) PbFe2/3W1/3O3 - xPbTiO3binaryrelaxor systems with x=0, 0.02, 0.1 and 0.18 in the pressure range. In the present investigation,we have optimized the concentration of lead titanate (PT) in lead iron tungstate-lead titanate (PFW-PT) binary system to obtain high pressure coefficient and low temperature coefficient which is aprime requirement for a binary system to be used as a high pressure sensing element. The samplespecimensare prepared by conventional mixed oxide route. The results thus obtained clearly establishthe feasibility of use of PFW with 2%PT as pressure sensing element having low temperature andhigh pressure coefficient in the pressure range 0 to 416 MPa and temperature range 283 to 323K.The results are discussed in details.
Keywords : Relaxor; Dielectric; Pressure; Sensor
9th International Conference on “Advances in Metrology - 2016”
50
P012
A Knowledge Based Framework for Metrology Based Homologationand Traceability
S. C. Ganganalli, Y. S. Thipse*, V. K. Jadhav and M. S. Kurane
Automotive Research Association of India (Pune, India)(*E-mail : [email protected])
AbstractIn the quest for producing high quality products, manufacturers are becoming more and more awareof taking control over all stages of the entire product lifecycle. An important requirement towardsmeeting this objective is deploying of systematic methods aimed towards standardization andstreamlining of processes. It is also highly desirable that the procedures, heuristics and evaluationcriteria outlined in the homologation standards be integrated directly by use of automation into thedaily testing or measurement processes, to streamline the process and render it accurate andproductive. The field of Knowledge Management effectively addresses all these requirements. Thispaper elucidates knowledge based techniques deployed for streamlining standard operatingprocedures in order to ensure conformance of metrological measurement processes as perhomologation standards. A case study is presented on application of knowledge management to themetrological process. Also, a knowledge based framework for ease of traceability is outlined. Thissystematic way of working through knowledge management techniques thus achieves concurrentobjectives of continual improvement, integration of homologation knowledge into daily metrologicalprocesses, all round efficiency and accuracy, and ease of traceability.
Keywords: Knowledge Management, Traceability, Automation, Standardization, Homologation
9th International Conference on “Advances in Metrology - 2016”
51
P013
Frugal Techniques for Streamlining Calibration Process of MechanicalMeasurements for Automotive Applications
S. S. Ekbote, Y.S. Thipse* and V. K. Jadhav
Automotive Research Association of India (Pune, India)(*E-mail : [email protected])
AbstractMeasurement process capability of an instrument is a requisite for qualifying the instrument for usein a particular application in the automotive industry. This calls for precise and error-freequantification of uncertainty of calibration of the instrument. This quantification thus needs to meetthe second generation measurement process capability criteria, and requires a high level of accuracy.To ensure the fidelity of calibration, the authors hereby elucidate an innovative knowledge basedfrugal methodology that integrates the entire workflow from calibration data acquisition phase,data management, uncertainty calculations, reporting and application of heuristics per standards.This is achieved by leveraging cost effective virtual platforms and instrument interfaces. Thisstreamlines the calibration and certification procedure for equipment used to measure mechanicalquantities such as mass, load, torque, and pressure for automotive R & D testing applications.Deployment of such systematic knowledge based tools streamlines the entire calibration procedure,fosters standardization and ensures fidelity of instrument calibration. Advantages of this are reflecteddownstream where it lends a robust hand to high quality automotive R & D testing and productdevelopment which are crucial to build the best of automotive products.
Keywords: Frugal Engineering, Knowledge Management, Uncertainty, Process Capability Index,Automation
9th International Conference on “Advances in Metrology - 2016”
52
P014
Experimental Investigation on Effect of Orifice Diameter onDischarge Coefficient
K.G. Jayesh*, C.K. Gopan and P.K. Suresh
Fluid Control Research Institute, Palakkad, India.(*E-mail : [email protected])
AbstractOrifice meters are one of the most commonly used instruments for fluid flow measurement becauseof its low cost, ruggedness and simplicity in construction. In closed conduits, Coefficient ofdischarge (Cd) of an orifice plate is used to find the actual flow rate. This is accomplished bymeasuring differential head across the orifice and calculating the theoretical flow rate and multiplyingby Cd. For the last two decades, large number of different type of orifice plate assemblies werecalibrated at our institute for various industries. An analysis was done on the calibration data ofvarious orifice plates to study the variation of Cd with respect to beta ratio, ? ranging from 0.30to 0.70. The Cd value was analyzed for different beta ratios with respect to Reynolds number. Thispaper attempts to correlate Cd, beta ratio and Reynolds number for different flow rates rangingfrom high, medium to low flow rates and to optimize the beta ratio for efficient pipe flowmeasurement.
Keywords: Coefficient of Discharge, Beta ratio, Head loss.
9th International Conference on “Advances in Metrology - 2016”
53
P015
Experimental Investigation of RF Sputtered SiO2 Thin Filmsfor Evaluation of Uniformity
Sunil Magadum*, Niranjan Reddy, Ankit S, Chellamalai M and Balashanmugam N
Central Manufacturing Technology Institute, Bangalore, India(*E-mail : [email protected])
AbstractSiO2 layers were deposited on Si substrate in an UHV chamber by magnetron sputtering from ahigh purity silicon dioxide target with working pressure of 1.9 mTorr. The substrate temperaturewas held at 300 °C and the films were deposited to a thickness of 300 nm, at a rate of 0.4 A° /sec.Thickness measurement of the deposited SiO2 thin film was performed by a Profilometer-contacttype and Ellipsometry for evaluation of uniformity of films. The results of the measurement provedthat for RF sputtered SiO2 thin films Ellipsometry is the suitable method for evaluation of uniformityas in case of profilometer measurements substrate effects creeps into the measurement accuracy.
Keywords: SiO2, Thin films, RF sputtering, Ellipsometry
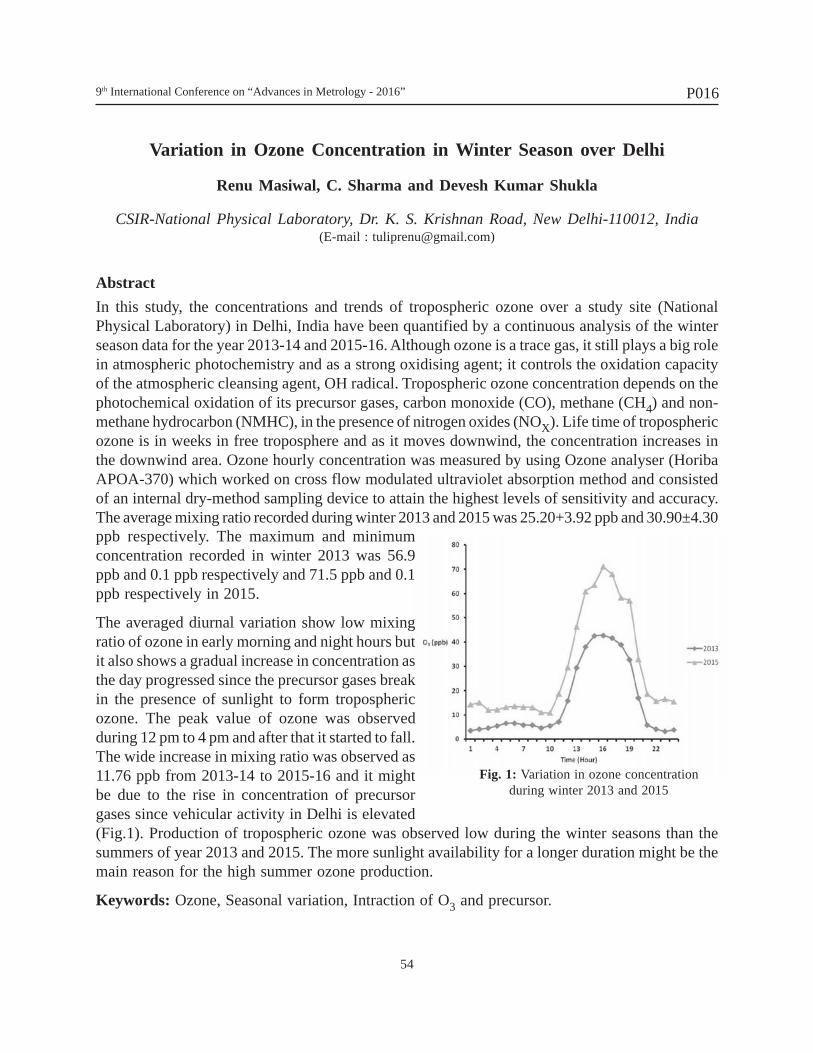
9th International Conference on “Advances in Metrology - 2016”
54
P016
Variation in Ozone Concentration in Winter Season over Delhi
Renu Masiwal, C. Sharma and Devesh Kumar Shukla
CSIR-National Physical Laboratory, Dr. K. S. Krishnan Road, New Delhi-110012, India(E-mail : [email protected])
AbstractIn this study, the concentrations and trends of tropospheric ozone over a study site (NationalPhysical Laboratory) in Delhi, India have been quantified by a continuous analysis of the winterseason data for the year 2013-14 and 2015-16. Although ozone is a trace gas, it still plays a big rolein atmospheric photochemistry and as a strong oxidising agent; it controls the oxidation capacityof the atmospheric cleansing agent, OH radical. Tropospheric ozone concentration depends on thephotochemical oxidation of its precursor gases, carbon monoxide (CO), methane (CH4) and non-methane hydrocarbon (NMHC), in the presence of nitrogen oxides (NOX). Life time of troposphericozone is in weeks in free troposphere and as it moves downwind, the concentration increases inthe downwind area. Ozone hourly concentration was measured by using Ozone analyser (HoribaAPOA-370) which worked on cross flow modulated ultraviolet absorption method and consistedof an internal dry-method sampling device to attain the highest levels of sensitivity and accuracy.The average mixing ratio recorded during winter 2013 and 2015 was 25.20+3.92 ppb and 30.90±4.30ppb respectively. The maximum and minimumconcentration recorded in winter 2013 was 56.9ppb and 0.1 ppb respectively and 71.5 ppb and 0.1ppb respectively in 2015.
The averaged diurnal variation show low mixingratio of ozone in early morning and night hours butit also shows a gradual increase in concentration asthe day progressed since the precursor gases breakin the presence of sunlight to form troposphericozone. The peak value of ozone was observedduring 12 pm to 4 pm and after that it started to fall.The wide increase in mixing ratio was observed as11.76 ppb from 2013-14 to 2015-16 and it mightbe due to the rise in concentration of precursorgases since vehicular activity in Delhi is elevated(Fig.1). Production of tropospheric ozone was observed low during the winter seasons than thesummers of year 2013 and 2015. The more sunlight availability for a longer duration might be themain reason for the high summer ozone production.
Keywords: Ozone, Seasonal variation, Intraction of O3 and precursor.
Fig. 1: Variation in ozone concentrationduring winter 2013 and 2015
9th International Conference on “Advances in Metrology - 2016”
55
P017
To Study the behavior of Capacitance Standards as a function ofFrequency, Temperature and Time using Measurement Automation
Satish1*, Deepak Sekhawat2, Sachin Kumar1 and Thomas John1
1CSIR-National Physical Laboratory, Dr. K. S. Krishnan Road, New Delhi-110012, India2 Amity University, Jaipur
(*E-mail : [email protected])
AbstractLF, HF Impedance and DC Standards laboratory of CSIR-NPL has the responsibility to establishand maintain primary and reference standards of impedance at low and high frequency. It isrequired to study the stability, temperature and frequency characteristics of impedance standardsfor the advancement in their measurement techniques. In the reported work, the behavior of air (10,100 and 1000 pF) and mica type capacitance standards (0.1, 0.01 and 0.001 µF) have been studiedwith respect to frequency, temperature and time using measurement automation program (MAP)developed in LabVIEW programming environment. The ultra-precision capacitance bridge AH2700and high-precision (±0.03 oC) variable temperature air-bath Guildlines 5032 have been automatedusing SCPI (Standard Commands for Programmable Instruments) commands. To determine thechange in effective value of capacitance standard with respect to frequency, the measurements havebeen carried out using MAP at set of frequencies ranging from 55 Hz to 20 kHz. It has beenobserved that the value of capacitance standard decreases with the increase in frequency. Todetermine the temperature coefficient (TC) of the capacitance standards, initially air bath has beenset at a temperature of 24 °C and thereafter MAP facilitates the user to compute their temperaturecoefficients using capacitance bridge. Then the temperature of air bath is increased in a step of1 oC from 24 °C to 28 °C and TC have been computed for each of the capacitance standard at everytemperature. The whole process has been repeated by decreasing the temperature of air bath inreverse direction, i.e., from 28 °C to 24 °C in a step of again 1 °C. A small hysteresis effect hasbeen observed in the TC of standards both in forward and reverse direction. The TC of 0.001 and1 µF standards have been found to be 46 and 22 ppm respectively with an uncertainty of ± 0.5%per ? C. The stability of each capacitance standard at 1 kHz has also been studied by maintainingthe constant temperature of 25 oC. The temperature of the air-bath has been monitored regularlyusing MAP. The standard deviation in the value of 1 µF mica capacitance standard has been foundto be 4 ppm with its average value = 0.999944 µF. This kind of study may be useful in Inter-Comparisons & ILC programs where each parameter related to the standard, contributes significantlyto the measurement uncertainty.
Keywords: Measurement Automation, Capacitance Standard, Temperature Coefficients,Frequency, Stability
9th International Conference on “Advances in Metrology - 2016”
56
Measuring Human Intelligence Through Fingerprint Patterns
Komal
Thapar University, Patiala (Punjab), India
AbstractThe word dermatoglyphics comes from two Greek words (derma, skin and glyphe, carve) andrefers to the friction ridge formations which appear on the palms of the hands and soles of the feet.Dermatoglyphics is the scientific study of fingerprints. The term was coined by Dr. Harold Cummins,the father of American fingerprint analysis. Personality can be traced early in the mother's womb,and it is reflected in fingerprints (dermatoglyphics). Since each person's fingerprints are unique,we can understand one's innate potential, personality, and preferences by analyzing dermatoglyphics.In simple words, Dermatoglyphics can disclose our inherent qualities and talents. It is analyzed andverified with facts in anthropology, genetics, medicine and statistics. Dermatoglyphics helps tounderstand your student's natural character traits, Identify best learning style for students, andidentify student's innate talents and weaknesses. The fingerprint patterns are mainly classified asloop, arch and whorls. We intend to build an automatic fingerprint classifier that gives the knowledgeabout an individual by pattern detection and then by the conclusions drawn from the study ofdermatoglyphics.
Keywords: Human intelligence, Finger print
P018
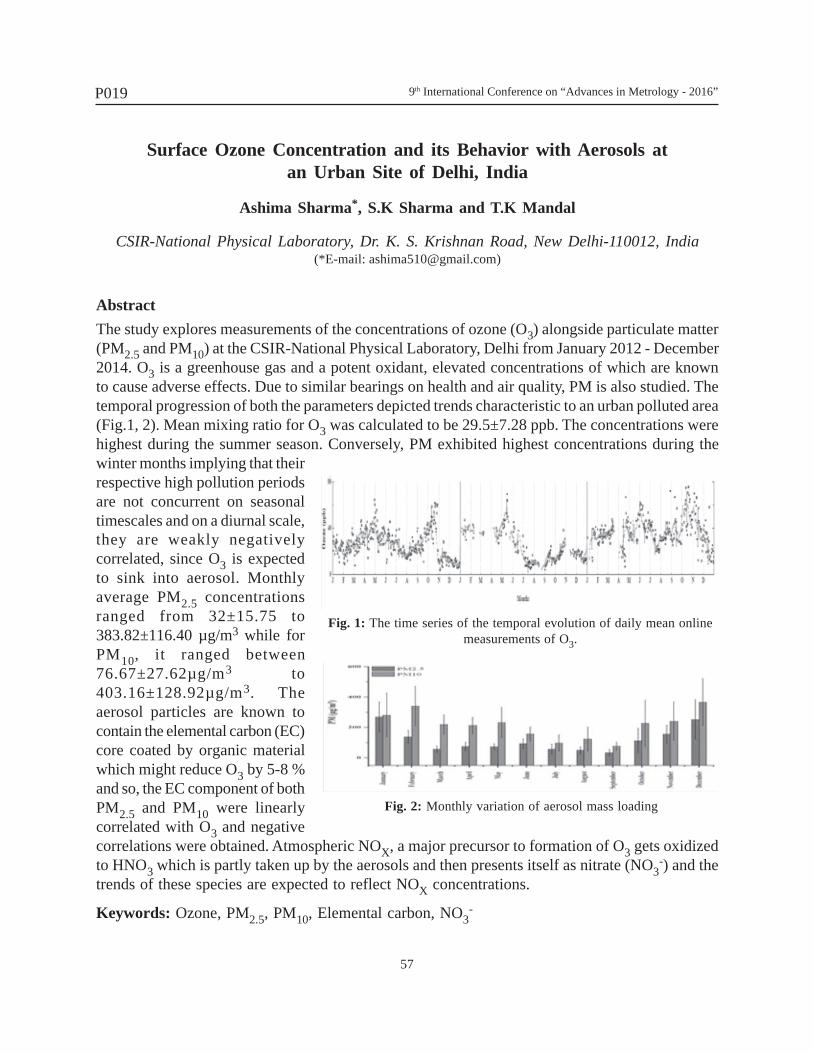
9th International Conference on “Advances in Metrology - 2016”
57
Surface Ozone Concentration and its Behavior with Aerosols atan Urban Site of Delhi, India
Ashima Sharma*, S.K Sharma and T.K Mandal
CSIR-National Physical Laboratory, Dr. K. S. Krishnan Road, New Delhi-110012, India(*E-mail: [email protected])
AbstractThe study explores measurements of the concentrations of ozone (O3) alongside particulate matter(PM2.5 and PM10) at the CSIR-National Physical Laboratory, Delhi from January 2012 - December2014. O3 is a greenhouse gas and a potent oxidant, elevated concentrations of which are knownto cause adverse effects. Due to similar bearings on health and air quality, PM is also studied. Thetemporal progression of both the parameters depicted trends characteristic to an urban polluted area(Fig.1, 2). Mean mixing ratio for O3 was calculated to be 29.5±7.28 ppb. The concentrations werehighest during the summer season. Conversely, PM exhibited highest concentrations during thewinter months implying that theirrespective high pollution periodsare not concurrent on seasonaltimescales and on a diurnal scale,they are weakly negativelycorrelated, since O3 is expectedto sink into aerosol. Monthlyaverage PM2.5 concentrationsranged from 32±15.75 to383.82±116.40 µg/m3 while forPM10, it ranged between76.67±27.62µg/m3 to403.16±128.92µg/m3. Theaerosol particles are known tocontain the elemental carbon (EC)core coated by organic materialwhich might reduce O3 by 5-8 %and so, the EC component of bothPM2.5 and PM10 were linearlycorrelated with O3 and negativecorrelations were obtained. Atmospheric NOX, a major precursor to formation of O3 gets oxidizedto HNO3 which is partly taken up by the aerosols and then presents itself as nitrate (NO3
-) and thetrends of these species are expected to reflect NOX concentrations.
Keywords: Ozone, PM2.5, PM10, Elemental carbon, NO3-
Fig. 1: The time series of the temporal evolution of daily mean onlinemeasurements of O3.
Fig. 2: Monthly variation of aerosol mass loading
P019
9th International Conference on “Advances in Metrology - 2016”
58
Traceability of Reflection Coefficient Measurements upto 2 GHz at NPLI
Archana Sahu, Saood Ahmad, P.S. Negi and V.N. Ojha
CSIR-National Physical Laboratory, Dr. K. S. Krishnan Road, New Delhi-110012, India(E-mail : [email protected])
AbstractNational Physical Laboratory India (NPLI) is the premier research and development center and theNational Metrology Institute, which provides traceability in measurements by calibration throughoutthe country. RF Impedance is an important quantity in Electrical Metrology. This paper presentsthe measurement technique to provide traceability for reflection coefficient from 1 MHz to 2 GHzat NPLI. A vector network analyzer (VNA) has been used for measurements .Thus traceability ofmeasurements uncertainties and the vector error correction are of great importance. It is achievedthrough coaxial airline and standard load from dimensional metrology and DC Resistance standard.This paper shows calibration results of reflection coefficient measurements using SOLT techniqueapplied to VNA. The expanded uncertainty of 0.0019 (k=1) has been achieved at 1 MHz forreflection coefficient measurement of the DUC (device under calibration).
Keywords: Reflection coefficient, vector network analyzer, measurement, calibration,measurement uncertainty, traceability
P020
9th International Conference on “Advances in Metrology - 2016”
59
LabVIEW based Automation and Measurement System for PicoampereCurrent Source using the Capacitance Charging Method
Bushra Ehtesham*, Poonam Sethi Bist and Thomas John
CSIR-National Physical Laboratory, Dr. K. S. Krishnan Road, New Delhi-110012, India(*E-mail : [email protected])
AbstractA picoampere current generator using capacitance charging by a linear ramp voltage is developed.The ramp parameters, viz., its slope and slope polarity, amplitude and duration are factors thatdecide the magnitude and polarity of the current generated, measuring time and the amount of datathat will be acquired. The ability to generate currents over a wide range of values using a singlesetup depends on the ability to reconfigure the ramp parameters to the required values as needed.It is difficult to realize the desired flexibilities in a purely hardware oriented design. We have usedautomation to eliminate the hardware constraints while optimizing its capabilities. In this paperimplementation of computer automation in the various aspects of the current generator's design,operation and measurement is presented. With computer control, the ramp slope and its polarity,ramp duration and amplitude are made software configurable which allow generation of currentsof both polarities over a range of values and different measuring modes with provision for repeatinga measurement as many times as needed without any hardware modifications. The system can beconfigured for generation of highly linear ramps of any value between 100mVs-1 and 1mVs-1 andamplitudes of any value up to 10V by software inputs. The automation software is developed inLabVIEW and its details are also presented. The software is designed to communicate betweenPC and the instruments, monitor experimental parameters, acquire and store the measurement data.Program variables are input through the interactive front panel. LabVIEW with its extensive arrayof built-in functions for communication between the instruments and the computer, data acquisition,data analysis and data visualization made the programming task fast and easy. The current generatordesign is tested and validated for current generation in the range of 100pA to 1pA using a 1nFair capacitor.
Keywords: Capacitance Charging, Linear Ramp, Constant Current Source, Data Acquisition
P021
9th International Conference on “Advances in Metrology - 2016”
60
Traceability for DC charge measurements at CSIR-NPL: Present Status
Bushra Ehtesham*, Poonam Sethi Bist, Thomas John and V.N. Ojha
CSIR-National Physical Laboratory, Dr. K. S. Krishnan Road, New Delhi-110012, India(*Email : [email protected])
AbstractA calibration system for electric charges in the range of 2µC to 10pC is established. Initial workcarried out under the project "Generic Development of Nanometrology at NPLI" achievedmeasurements in the range of 2µC to 200 pC. The system has subsequently been modified andimproved which resulted in extending the lowest measurement range down to 10pC at present.Depending on the charge level, two methods have been used for standard charge generation, viz.,the current-time method (Q = I t ) for charges in the micro-coulomb range and the capacitancecharging method (Q = C V) for charges of lower values. Measurement uncertainties realized arein the range of 0.01 % at 2µC and 1% at 10pC. In this paper we will present the details of thecalibration setup and the measurement results, particularly for charges of nanocoulomb and lower.
Keywords: Calibration, Electric Charge, Uncertainty.
P022
9th International Conference on “Advances in Metrology - 2016”
61
P023
Precise and Accurate Determination of Isotopic Abundance Ratio of107Ag/109Ag in Silver Granules by Sector Field Inductively Coupled
Plasma Mass Spectrometry
S. Swarupa Tripathy1*, Swati1, Poonam Chauhan2, Rajiv K. Saxena1,Sunita Raina1 and Nahar Singh1
1CSIR-National Physical Laboratory, Dr. K. S. Krishnan Road, New Delhi-110012, India2Department of Chemistry, Indian Institute of Technology, Roorkee-247667, India
(*Email : [email protected])
AbstractIsotopic fractionation of elements in the natural environment occurs due to the atmospheric,geologic, biologic etc. process, which varies from place to place through transport mechanism. Theisotopic ratio of stable isotopes helps as an isotopic signature in natural system to identify thesource. High resolution (sector field) inductively coupled plasma mass spectrometry is a very goodtool for the measurement of stable isotopic ratio analysis on the basis of mass-to-charge ratio ofisotopes of a particular element. In order to attain reliable and precise measurement of the isotopicratios of the element of a material, the use of matrix based isotopic reference materials are necessary.The isotopic reference materials provide either 'δ' measurement or absolute isotopic ratio to comparethe isotopic ratio result of the desired element in the compound. In the present study, an effort hasbeen taken to develop a precise and reliable measurement method to determine the 107Ag/109Agratio for an absolute isotopic reference material of silver granules. Initially, the silver granules werecleaned properly. Five replicates of known quantity were dissolved in high purity HNO3 and madeto appropriate dilution by mass. The isotopic ratio analysis of 107Ag/109Ag was carried out by ahigh resolution inductively coupled plasma mass spectrometry (HR-ICPMS, AttoM, Nu Instrument,U.K.). Single point calibration method was opted for the calibration of HR-ICPMS using NBSUSA make Standard Reference Material 978a, which certified for absolute isotopic abundanceratio of 107Ag/109Ag is 1.07638 ± 0.00022. The 'δ' measurement value of absolute isotopic abundanceratio of 107Ag/109Ag in silver granules was also calculated with the deviation from the certifiedvalue of NBS, SRM 978a. The evaluation of expanded uncertainty in measurement of 107Ag/109Agwas done at 95% confidence level (k=2) according to EURACHEM GUM GUIDE. The absoluteisotopic abundance ratio of 107Ag/109Ag in silver granules is found to be 1.06923 which is veryclose to the certified value of the standard. The associated measurement uncertainty is found to beless than 0.05 %.
Keywords: Isotopic ratio, silver granules, sector field, mass spectrometry
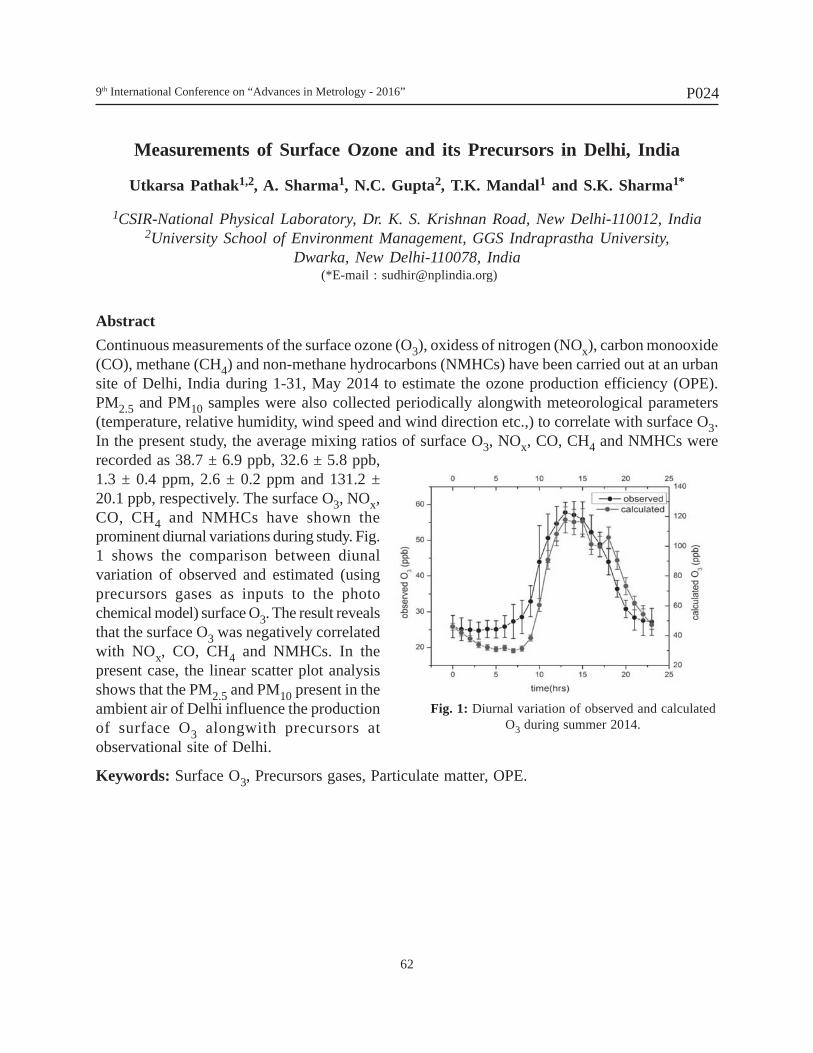
9th International Conference on “Advances in Metrology - 2016”
62
P024
Measurements of Surface Ozone and its Precursors in Delhi, India
Utkarsa Pathak1,2, A. Sharma1, N.C. Gupta2, T.K. Mandal1 and S.K. Sharma1*
1CSIR-National Physical Laboratory, Dr. K. S. Krishnan Road, New Delhi-110012, India2University School of Environment Management, GGS Indraprastha University,
Dwarka, New Delhi-110078, India (*E-mail : [email protected])
AbstractContinuous measurements of the surface ozone (O3), oxidess of nitrogen (NOx), carbon monooxide(CO), methane (CH4) and non-methane hydrocarbons (NMHCs) have been carried out at an urbansite of Delhi, India during 1-31, May 2014 to estimate the ozone production efficiency (OPE).PM2.5 and PM10 samples were also collected periodically alongwith meteorological parameters(temperature, relative humidity, wind speed and wind direction etc.,) to correlate with surface O3.In the present study, the average mixing ratios of surface O3, NOx, CO, CH4 and NMHCs wererecorded as 38.7 ± 6.9 ppb, 32.6 ± 5.8 ppb,1.3 ± 0.4 ppm, 2.6 ± 0.2 ppm and 131.2 ±20.1 ppb, respectively. The surface O3, NOx,CO, CH4 and NMHCs have shown theprominent diurnal variations during study. Fig.1 shows the comparison between diunalvariation of observed and estimated (usingprecursors gases as inputs to the photochemical model) surface O3. The result revealsthat the surface O3 was negatively correlatedwith NOx, CO, CH4 and NMHCs. In thepresent case, the linear scatter plot analysisshows that the PM2.5 and PM10 present in theambient air of Delhi influence the productionof surface O3 alongwith precursors atobservational site of Delhi.
Keywords: Surface O3, Precursors gases, Particulate matter, OPE.
Fig. 1: Diurnal variation of observed and calculatedO3 during summer 2014.
9th International Conference on “Advances in Metrology - 2016”
63
P025
Design and Development of Humidity and Temperature Data Logger forAmbient Condition Monitoring of Calibration Laboratories
Shashank Singh and P K Dubey*
CSIR-National Physical Laboratory, Dr. K. S. Krishnan Road, New Delhi-110012, India(*E-mail: [email protected])
AbstractMonitoring of environmental condition in calibration laboratories is an essential requirement toachieve ultimate measurement uncertainty and repeatable results. Generally, periodic temperatureand humidity data is manually recorded from a calibrated temperature and humidity indicatingdevice. Reading the data on time in a periodic manner performed by a technician of the laboratoryis a tedious and cumbersome task. With the advent of computer controlled and automated systemsvarious cumbersome tasks have been simplified. In this article a fully automated low cost systemfor recording temperature and humidity data is discussed. The device is indigenously developedand interfaced to computer for data transfer at regular interval specified by the user. The RH andtemperature sensor used is DHT22 which provides serial digital data for RH and temperature withan uncertanity of ±2% and ±0.5°C respectively. The resolution in humidity and temperature are0.1% and 0.1°C respectively. ATmega 8535 microcontroller is used as the main processor andperforming functions such as receiving serial data from sensor, decoding it and converting it intoreadable form, display on LCD screen and also, if required; sending data to computer. LabVIEWprogram has also been developed to receive periodic data from the device. Parameters such asSerial communication port, data recording interval are specified through the developed graphicaluser interface (GUI). The minimum data recording interval can be 5 second. The GUI developeddisplays the humidity and temperature variations graphically.
Keywords: Humidity and temperature; DHT 22 sensor; Microcontroller; Serial communication;LabVIEW program.
9th International Conference on “Advances in Metrology - 2016”
64
P026
Fog Forecasting and Variability with Physico-Chemical Parameters inWinter Season By Using Time Series Modelling
Kirti Soni1*, Kulwinder Singh Parmar2, Naveen Garg1 and Nishant Kumar3
1CSIR-National Physical Laboratory, Dr. K. S. Krishnan Road, New Delhi-110012, India2Dr. B. R. Ambedkar National Institute of Technology Jalandhar, India
3Thapar University, Patiala (Punjab)(E-mail : [email protected])
AbstractShort-term forecasting of fog is a difficult subject which can have a large societal impact. Fogappears in the surface boundary layer and is driven by the interactions between land surface andthe lower layers of the atmosphere. Air-traffic security and operational efficiency depend heavilyupon accurate and timely forecasts of fog. Poor visibility conditions can strongly decrease theefficiency of area traffic flow. The goal of the proposed methodology is to improve the localprediction of poor visibility and fog at Delhi. The historical data of atmospheric boundary layer(ABL) along with meteorological parameter measured during foggy days in winter season (December-January) at New Delhi are used for fog forecasting. Artificial neural network (ANN) and AdaptiveNeuro-Fuzzy Inference System (ANFIS) have an wide range of applications in air qualitymanagement. Wavelet transformation as a preprocessing approach can improve the ability of aforecasting model by capturing useful information on different resolution levels. The objective ofthis study is to compare several data-driven models for fog forecasting. In this research, a numberof model structures for Artificial Neural Network (ANN), Adaptive Neuro-Fuzzy Inference System(ANFIS), Wavelet-ANN and Wavelet-ANFIS models have been compared to estimate theirperformances to forecast fog.
Keywords : Fog, Forecasting, Mixing Height, Artificial Neural Network (ANN), Adaptive Neuro-Fuzzy Inference System (ANFIS)
9th International Conference on “Advances in Metrology - 2016”
65
P027
Development of Mixing Height based Fog Predication Models usingArtificial Neural Network and Fuzzy Logic
Nishant Kumar1,2, Kirti Soni1*, Ravinder Agarwal2, Naveen Garg1 and Gurbir Singh1
1CSIR-National Physical Laboratory, Dr. K. S. Krishnan Road, New Delhi-110012, India2Thapur Unitersity, Patiala (Punjab)
(*E-mail : [email protected])
AbstractFog prediction is extremely important since it not only causes low visibility but also is consideredas a hazard as it disrupts the normal life and traffic. The main objective of the present study is toutilize feed forward back propagation type of artificial neural network (ANN) and fuzzy logic tofind the combined effect of mixing height, temperature and humidity on the foggy days. Fordeveloping the models, six days comprising hourly average temperature, humidity and mixingheight have been used. To ensure the effectiveness of Artificial neural network and Fuzzy logictechniques, different models employing a different training and test data set have been tested. Thecriteria of performance evaluation are calculated for estimating and comparing the performancesof Artificial neural network and Fuzzy logic models. Finally, the models have been tested and theresults confirm that the proposed models are competent to predict the fog using mixing height,temperature, humidity. The performance comparisons of Artificial neural network and Fuzzy logicmodels due to MAE (Moving Average Error), RMSE- R2 (Root-Mean-Square error) criteria, showthat Fuzzy logic models yields better results.
Keywords: Mixing Height, Fog, Artificial neural network, Fuzzy logic
9th International Conference on “Advances in Metrology - 2016”
66
P028
Spatio-temporal Chemical Characteristics and Source Apportionment ofPM10 over Indo Gangetic Plain of India
S.K. Sharma1*, T.K. Mandal1, Saraswati1, Srishti Jain1, M. Saxena1, A. Sharma1, D.M.Shenoy2, M.K. Srivastava3, A. Chatterjee4 and S.K. Ghosh4
1CSIR-National Physical Laboratory, Dr. K S Krishnan Road, New Delhi-110012, India2CSIR-National Institute of Oceanography, Dona Paula, Panaji 403004, Goa, India
3Department of Geophysics, Banaras Hindu University, Varanasi-221005, India4Centre for Astroparticle Physics and Space Sciences, Bose Institute, Kolkata-700091, India
(*E-mail : [email protected])
AbstractThe paper presents the spatio-temporal variation of chemical compositions (organic carbon (OC),elemental carbon (EC), water soluble inorganic ionic components (WSIC), total carbon (TC), totalnitrogen (TN) and isotopic ratios of δ13C and δ15N along with δ13OC) of PM10 over three locations(Delhi, Varanasi and Kolkata) of Indo Gangetic plain (IGP) of India for the year 2011. Averagemass concentration of PM10 was observed in the middle IGP (Varanasi: 206.2±77.4 µg m-3) ascompared to upper IGP (Delhi: 202.3±74.3 µg m-3) and lower IGP (Kolkata: 171.5±38.5 µg m-3).Large variation in OC values from 23.57 µg m-3 (Delhi) to 12.74 µg m-3 (Kolkata) indicating roleof formation of secondary aerosols, whereas, EC have not shown much variation with maximumconcentration over Delhi (10.07 µg m-3) and minimum over Varanasi (7.72 µg m-3). For Delhi,the average concentrations of TC and TN of PM10 were 53.0 ± 33.6 µg m-3 and 14.9 ± 10.8 µgm-3, whereas δ13C and δ15N of PM10 were -25.5 ± 0.5‰ and 9.6±2.8‰, respectively. For Varanasi,the average values of δ13C and δ15N of PM10 were -25.4 ± 0.8‰ and 6.8 ± 2.4‰, respectively. Theaverage concentrations of δ13C and δ15N were -26.0 ± 0.4‰ and 7.4 ± 2.7‰, respectively overKolkata. Principal Component Analysis (PCA) identifies the contribution of secondary aerosol,biomass burning, fossil fuel combustion, vehicular emission and sea salt to PM10 mass concentrationat the observational sites of IGP, India. The isotopic analysis revealed that biomass burning,vehicular emission and secondary inorganic aerosols were likely sources of PM10 mass over IGP,India Backward trajectory analysis indicated the influence of continental type aerosols beingtransported from the Bay of Bengal, Pakistan, Afghanistan, Rajasthan, Gujarat and surroundingareas to IGP region.
Keywords: PM10, Chemical characteristics, Source apportionment, Carbon and nitrogen isotopes.
9th International Conference on “Advances in Metrology - 2016”
67
P029
High Precision Measurements of a Piston Diameter ofa Primary Pressure Standard
Mukesh kumar, K.P. Chaudhary and Sanjay Yadav
CSIR-National Physical Laboratory, Dr. K. S. Krishnan Road, New Delhi-110012, India(E-mail: [email protected])
AbstractThe traceability of pressure balance type primary pressure standards is realized through highprecision dimensional measurements. In order to achieve utmost measurement uncertainty associatedwith pressure measurements using pressure balanced based primary pressure standards, it isessentially required to measure the form geometry of piston cylinder assemblies with utmostprecision. Among the form geometrical parameters of the piston cylinder assembly, accurate andprecise measurement of piston diameter is of foremost important. Therefore, the associated pressuremeasurement uncertainty is always limiting to the uncertainty achieved in measurement of pistondiameter. In the present paper, efforts have been made to measure the piston diameter (nominaldiameter, 2.5 mm) of a controlled clearance piston gauge (CCPG) primary hydraulic pressurestandard (CCPG1000 / NPL-H1), recently established at NPL for hydrostatic pressure measurementsup to 1.0 GPa, using a high precision Form Tester, make-Mitotoyo, model RA-2200CNC withinthe resolution 0.001 µm. During the measurements, the centring / tilting values have been controlledwell within 0.012 µm. Before performing measurements, the high precision Form Tester wascalibrated using a hemisphere roundness reference standard, well calibrated by METAS within theuncertainty of ± 0.01µm. The linear measurement of diameter of piston were performed usingcontact probe method utilizing high sensitive probe having resolution of 0.001 µm and the rotaryindexing table of the Form Tester is having provision of 3 mounting Jaw Chuck for holding thepiston. The measurements of diameter were performed at 19 measurement positions along thepiston engagement length (50 mm), starting at 5.52 mm from bottom to 41.51 mm at top in a spaceof 2 mm each. After the adjustment of first piston position, the rotary table is rotated for continuouslyrecoding the deviations of diameter from starting at 00 to 3600. The value of diameter at this z-position is determined as the average from the maximum and minimum diameter values at theircorresponding angles. The measurements were repeated in a similar way for the 19 z-positions. Theaverage diameter is found to be 2.521498 mm within the expanded measurement uncertainty of+0.018 m, determined from the measurements performed at all z-positions. The improveddimensional measurements thus performed have helped us to improve the relative measurementuncertainty in zero pressure effective area (A0) of CCPG100 from 24 x 10-6, estimated earlier toless than 10 x 10-6.
Keywords: Piston diameter, pressure standard
9th International Conference on “Advances in Metrology - 2016”
68
P030
Compensation of Error due to Change in Buoyancy of an AbsorbingTarget at High Ultrasonic Power Measurement
P K Dubey* and Shashank Singh
CSIR-National Physical Laboratory, Dr. K. S. Krishnan Road, New Delhi-110012, India(*E-mail : [email protected])
AbstractRadiation force balance (RFB) is well known, universally accepted primary approach formeasurement of total ultrasonic power. At low power (typically few mW) measurement type Auncertainty is highly affected due to the inherent resolution of the microbalance in use. At higherpower level (typically few watts) error contribution due thermal heating of the absorbing targetbecomes dominant. Manual recording of microbalance output does not detect such error and resultin over estimation of the ultrasonic power output. In this article method of continuous recordingof balance output to estimate the contribution of error due to thermal expansion of target isdescribed. The approach can be used to detect error contribution in the ultrasonic power measurementdue to thermal heating of the absorber and can be eliminated using a suitable mechanism.
Keywords: Total ultrasonic power; Radiation force balance; Thermal heating
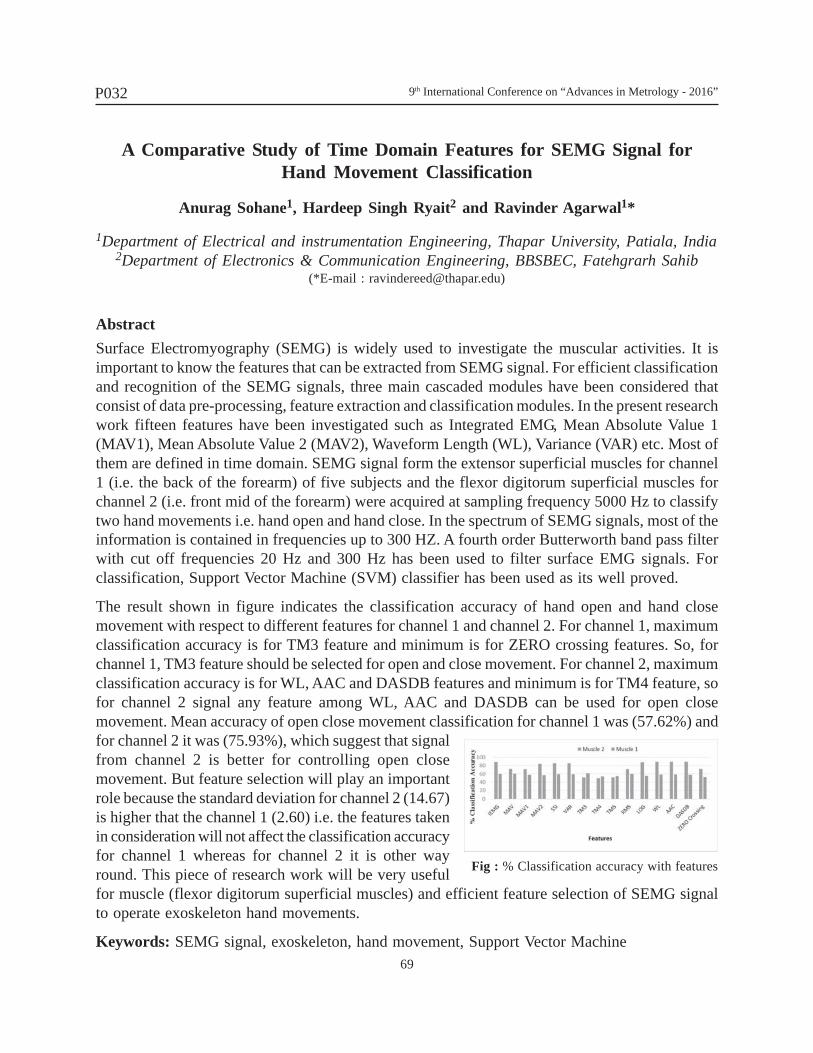
9th International Conference on “Advances in Metrology - 2016”
69
P032
Fig : % Classification accuracy with features
A Comparative Study of Time Domain Features for SEMG Signal forHand Movement Classification
Anurag Sohane1, Hardeep Singh Ryait2 and Ravinder Agarwal1*
1Department of Electrical and instrumentation Engineering, Thapar University, Patiala, India2Department of Electronics & Communication Engineering, BBSBEC, Fatehgrarh Sahib
(*E-mail : [email protected])
AbstractSurface Electromyography (SEMG) is widely used to investigate the muscular activities. It isimportant to know the features that can be extracted from SEMG signal. For efficient classificationand recognition of the SEMG signals, three main cascaded modules have been considered thatconsist of data pre-processing, feature extraction and classification modules. In the present researchwork fifteen features have been investigated such as Integrated EMG, Mean Absolute Value 1(MAV1), Mean Absolute Value 2 (MAV2), Waveform Length (WL), Variance (VAR) etc. Most ofthem are defined in time domain. SEMG signal form the extensor superficial muscles for channel1 (i.e. the back of the forearm) of five subjects and the flexor digitorum superficial muscles forchannel 2 (i.e. front mid of the forearm) were acquired at sampling frequency 5000 Hz to classifytwo hand movements i.e. hand open and hand close. In the spectrum of SEMG signals, most of theinformation is contained in frequencies up to 300 HZ. A fourth order Butterworth band pass filterwith cut off frequencies 20 Hz and 300 Hz has been used to filter surface EMG signals. Forclassification, Support Vector Machine (SVM) classifier has been used as its well proved.
The result shown in figure indicates the classification accuracy of hand open and hand closemovement with respect to different features for channel 1 and channel 2. For channel 1, maximumclassification accuracy is for TM3 feature and minimum is for ZERO crossing features. So, forchannel 1, TM3 feature should be selected for open and close movement. For channel 2, maximumclassification accuracy is for WL, AAC and DASDB features and minimum is for TM4 feature, sofor channel 2 signal any feature among WL, AAC and DASDB can be used for open closemovement. Mean accuracy of open close movement classification for channel 1 was (57.62%) andfor channel 2 it was (75.93%), which suggest that signalfrom channel 2 is better for controlling open closemovement. But feature selection will play an importantrole because the standard deviation for channel 2 (14.67)is higher that the channel 1 (2.60) i.e. the features takenin consideration will not affect the classification accuracyfor channel 1 whereas for channel 2 it is other wayround. This piece of research work will be very usefulfor muscle (flexor digitorum superficial muscles) and efficient feature selection of SEMG signalto operate exoskeleton hand movements.
Keywords: SEMG signal, exoskeleton, hand movement, Support Vector Machine
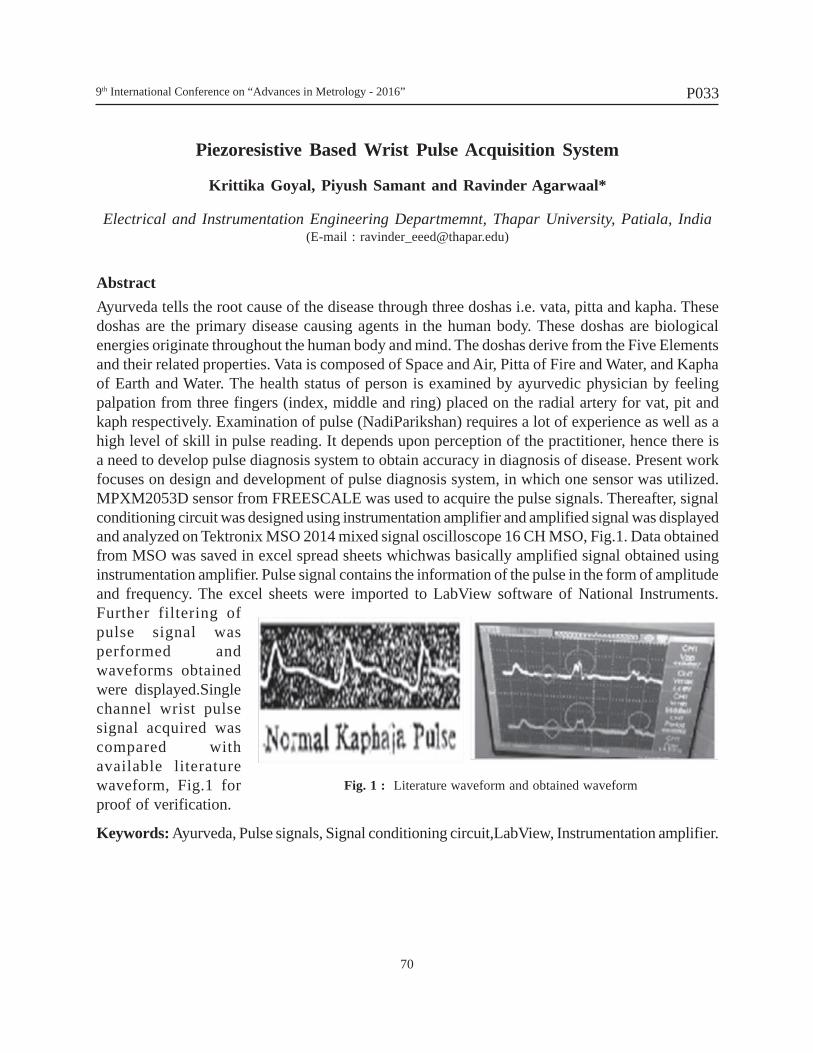
9th International Conference on “Advances in Metrology - 2016”
70
P033
Fig. 1 : Literature waveform and obtained waveform
Piezoresistive Based Wrist Pulse Acquisition System
Krittika Goyal, Piyush Samant and Ravinder Agarwaal*
Electrical and Instrumentation Engineering Departmemnt, Thapar University, Patiala, India(E-mail : [email protected])
AbstractAyurveda tells the root cause of the disease through three doshas i.e. vata, pitta and kapha. Thesedoshas are the primary disease causing agents in the human body. These doshas are biologicalenergies originate throughout the human body and mind. The doshas derive from the Five Elementsand their related properties. Vata is composed of Space and Air, Pitta of Fire and Water, and Kaphaof Earth and Water. The health status of person is examined by ayurvedic physician by feelingpalpation from three fingers (index, middle and ring) placed on the radial artery for vat, pit andkaph respectively. Examination of pulse (NadiParikshan) requires a lot of experience as well as ahigh level of skill in pulse reading. It depends upon perception of the practitioner, hence there isa need to develop pulse diagnosis system to obtain accuracy in diagnosis of disease. Present workfocuses on design and development of pulse diagnosis system, in which one sensor was utilized.MPXM2053D sensor from FREESCALE was used to acquire the pulse signals. Thereafter, signalconditioning circuit was designed using instrumentation amplifier and amplified signal was displayedand analyzed on Tektronix MSO 2014 mixed signal oscilloscope 16 CH MSO, Fig.1. Data obtainedfrom MSO was saved in excel spread sheets whichwas basically amplified signal obtained usinginstrumentation amplifier. Pulse signal contains the information of the pulse in the form of amplitudeand frequency. The excel sheets were imported to LabView software of National Instruments.Further filtering ofpulse signal wasperformed andwaveforms obtainedwere displayed.Singlechannel wrist pulsesignal acquired wascompared withavailable literaturewaveform, Fig.1 forproof of verification.
Keywords: Ayurveda, Pulse signals, Signal conditioning circuit,LabView, Instrumentation amplifier.
9th International Conference on “Advances in Metrology - 2016”
71
P034
Investigation and Development of Cognitive Abilities inBasketball Sportspersons
Navjot Saini* and Ravinder Agarwal
Electrical and Instrumentation Engineering Department, Thapar University, Patiala (India)(*E-mail : [email protected])
AbstractAugmenting the mental abilities is as necessary for a sportsperson as training the physical abilities,to achieve the top positions in the sports competitions. The present work focuses on refining thecognitive skills such as selective attention and working memory in the basketball sportspersons.Ten sportspersons took part in the study, out of them, five athletes are exposed to the trainingtechniques (test group), while the remaining five athletes are not exposed to any training techniques(control group). Computer-based games are used as training technique for the selective attentionand working memory cognitive abilities. The physiological assessment of these athletes includedacquiring their electroencephalogram (EEG) data. Two sets of pre and post-training physiologicaldata have been acquired over the duration of the study. The theta/beta band power ratio is used toassess the selective attention ability in the sportspersons. Furthermore, the theta band power (powerper radians per sample) is used to measure the working memory ability in the sportspersons. In thefirst set of physiological data, the results demonstrate that the selective attention skill assessed overthe AF3 and AF4 channels of the data acquisition system [Emotiv EPOC headset, Emotiv, Inc.,California, USA], is improved on an average by 50% in the test group athletes in comparison toan improvement of 10%, on an average, in the control group athletes. Similarly, the workingmemory skill assessed over the F3 and F4 channels, is improved on an average by 80% in the testgroup athletes in comparison to an average increase of 40% in the control group athletes. In thesecond set of data, the results exhibit an average increase of 60% in the selective attention skill,measured over the AF3 and AF4 channels, in the test group sportspersons in comparison to anaverage increase of 10% in the control group sportspersons. In the same way, the results show anaverage increase of 80% in the working memory skill, measured over the F3 and F4 channels ofthe data acquisition system, in the test group athletes as compared to an average increase of 40%in the control group athletes. The correlation values have been calculated for the physiologicaltesting through Pearson correlation coefficient. A low correlation, in the range of + (0.1 - 0.4),between the pre and post-training physiological data for the selective attention skill has beenobserved. Additionally, there is a low correlation, in the range of 0 to 0.2, between the pre and post-training physiological data for the working memory skill in the first set of data and mediumcorrelation, in the range of + (0.3 - 0.51), in the second set of data. The physiological and statisticalresults demonstrate the effectiveness of the training methodology used, for improving the mentalabilities of the basketball players.
Keywords: Basketball, Cognitive, EEG, Physiological, Selective Attention.
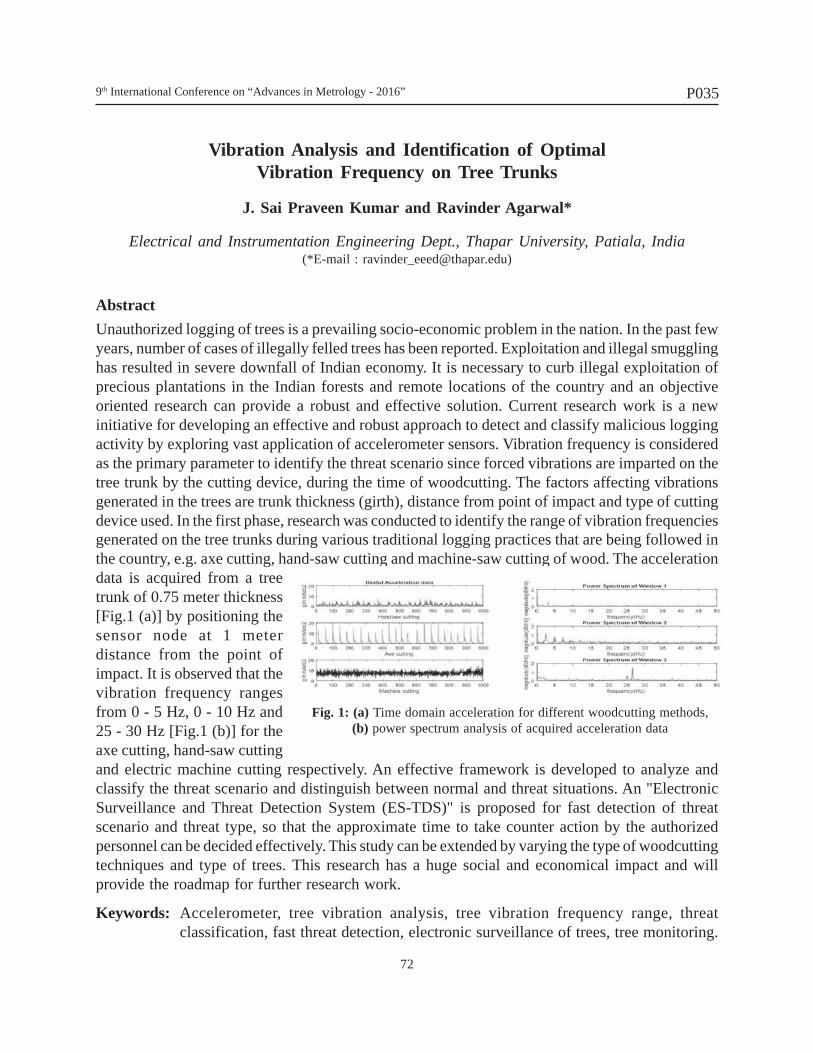
9th International Conference on “Advances in Metrology - 2016”
72
P035
Vibration Analysis and Identification of OptimalVibration Frequency on Tree Trunks
J. Sai Praveen Kumar and Ravinder Agarwal*
Electrical and Instrumentation Engineering Dept., Thapar University, Patiala, India(*E-mail : [email protected])
AbstractUnauthorized logging of trees is a prevailing socio-economic problem in the nation. In the past fewyears, number of cases of illegally felled trees has been reported. Exploitation and illegal smugglinghas resulted in severe downfall of Indian economy. It is necessary to curb illegal exploitation ofprecious plantations in the Indian forests and remote locations of the country and an objectiveoriented research can provide a robust and effective solution. Current research work is a newinitiative for developing an effective and robust approach to detect and classify malicious loggingactivity by exploring vast application of accelerometer sensors. Vibration frequency is consideredas the primary parameter to identify the threat scenario since forced vibrations are imparted on thetree trunk by the cutting device, during the time of woodcutting. The factors affecting vibrationsgenerated in the trees are trunk thickness (girth), distance from point of impact and type of cuttingdevice used. In the first phase, research was conducted to identify the range of vibration frequenciesgenerated on the tree trunks during various traditional logging practices that are being followed inthe country, e.g. axe cutting, hand-saw cutting and machine-saw cutting of wood. The accelerationdata is acquired from a treetrunk of 0.75 meter thickness[Fig.1 (a)] by positioning thesensor node at 1 meterdistance from the point ofimpact. It is observed that thevibration frequency rangesfrom 0 - 5 Hz, 0 - 10 Hz and25 - 30 Hz [Fig.1 (b)] for theaxe cutting, hand-saw cuttingand electric machine cutting respectively. An effective framework is developed to analyze andclassify the threat scenario and distinguish between normal and threat situations. An "ElectronicSurveillance and Threat Detection System (ES-TDS)" is proposed for fast detection of threatscenario and threat type, so that the approximate time to take counter action by the authorizedpersonnel can be decided effectively. This study can be extended by varying the type of woodcuttingtechniques and type of trees. This research has a huge social and economical impact and willprovide the roadmap for further research work.
Keywords: Accelerometer, tree vibration analysis, tree vibration frequency range, threatclassification, fast threat detection, electronic surveillance of trees, tree monitoring.
Fig. 1: (a) Time domain acceleration for different woodcutting methods,(b) power spectrum analysis of acquired acceleration data
9th International Conference on “Advances in Metrology - 2016”
73
P036
Feature Reduction and Selection of SEMG Signal forLocomotion Identification
Rohit Gupta and Ravinder Agarwal*
Department of Electrical and instrumentation Engineering, Thapar University, Patiala, India(*E-mail : [email protected])
AbstractSurface Electromyography (SEMG) signal is the electrical manifestation of the neuromuscularactivation associated with a muscle. It contains useful information which can be used to enhancethe man machine interface, particularly for lower limb (ankle-foot) prosthetic. Identification oflocomotion and anticipation of amputee intention is very crucial for delay free operation of prosthesis.In the present research work, SEMG data of Fibularis longus (below knee) and Biceps Femoris(above knee) muscle of each subject were taken by using wireless SEMG acquisition unit (NeXus-10, TMSi). Five healthy subjects having normal gait walk were selected. Three locomotions wereconsidered i.e. plane walking (L1), stair ascending (L2) and stair descending (L3). The acquiredSEMG signal was filtered and segmented using overlapped windowing method with length of 256ms and window shift of 32 ms. Sixteen time domain features like integrated EMG, variance, slopesign change, auto-regressive coefficients etc. and seven frequency domain features like meanfrequency, median frequency, peak frequency, power spectrum ratio etc. were extracted. Two casesof locomotion identification were considered, in first case SEMG data is divided in two parts withrespect to phase of gait walk i.e. stance phase (P1) and swing phase (P2), and in second case nodivision of data was done. Identical methodology was applied for phase dependent and phaseindependent locomotion identification mode. Support Vector Machine (SVM) classifier is appliedover the calculated feature vector for locomotion identification. The calculated features werenormalized using min-max normalization method and randomly selected 80% data was used fortraining and 20% for testing. Locomotion classification accuracy for phase independent classifieris 30.21%-52.56% for M1 and 29.45%-54.36% for M2 for individual feature, similarly for phasedependent classifier it is 18.54%-69.35% for muscle one stance phase (P1M1), 30.76%-51.50% formuscle two stance phase (P1M2), 24.17%-55.92% for muscle one swing phase and 26.65%-57.82% for muscle two swing phase. Further the feature vectors are formed on basis of characteristicsof features named as group 1(G1), group 2(G2), group3 (G3) and group 4 (G4). Locomotionclassification accuracy for phase independent classifier and phase dependent classifier. Group 1feature vector shows better identification accuracy for muscle one SEMG signal with phaseindependent classifier and also for phase dependent classifier for locomotion identification.
Keywords : Feature vector, Locomotion identification, SVM, SEMG
9th International Conference on “Advances in Metrology - 2016”
74
P037
Future Trend in Conformity Assessment- Influence ofError and Measurement Uncertainty
A Dasgupta1* and Alok Jain2
1Former Scientist CMTI, Former Tech Director HFPL,Accreditation Committee member, NABL
2Technical Manager, NABL, Gurgaon(*E-mail: [email protected])
AbstractConformity assessment is the demonstration that specified requirements relating to a product,process, system, person or body are fulfilled. Conformity assessment activities may include Testing,Surveillance, Inspection, Auditing, Certification, Registration and Accreditation. In all type ofconformity assessment, a measurement result is used to decide if an item of interest conforms toa specified requirement. The decison on complinace of a product to the specification lies on acombination of both error & uncertainty. The paper is about to take decisions on compliance withregulatory or manufacturing limits considering the measurement result accompanied by informationon the uncertainty associated with the result. Broadly the area covers are related to (1) safety andhealth aspects (2) legal metrology (3) Design & manufacturing of products.
Keywords: Conformity Assessment, Error in Measurement, Uncertainty in Measurement
9th International Conference on “Advances in Metrology - 2016”
75
P039
Automated Primary Ultrasonic Power Measurement Setup for Calibrationat mW Region with Reduced Uncertainty
P K Dubey* and Shashank Singh
CSIR-National Physical Laboratory, Dr. K. S. Krishnan Road, New Delhi-110012, India(*E-mail : [email protected])
AbstractIEC61161 recommends Radiation Force Balance (RFB) as a primary approach for measurementof total ultrasonic power generated by an ultrasonic transducer. In RFB method ultrasonic outputgenerated from the transducer exerts force on the target attached to a highly sensitive balance. Thechange in the balance output is directly proportional to the total ultrasonic power radiated by thetransducer. Manual observing the output of microbalance for change in effective mass becomesdifficult at low power (few mW) level as the change is of the order of few µg and leads to increasederror. Further, the error contribution also depends on the alertness of the system operator. In theview of drawbacks associated with above manual approach of recording balance output it has beendecided to interface the balance to personal computer for continuous recording of output data. Thecontinuous recording of balance output (10 readings/sec) during transducer off and on providesuseful information about effective change in mass as well as external disturbances. This methodis adopted to reduce the external noise and disturbances which are prominent at low powermeasurement. The improved functionality of this approach particularly below 100 mW over theconventional manual method is described in this paper.
Keywords: Low ultrasonic power; Radiation force balance; LabVIEW, Automation
9th International Conference on “Advances in Metrology - 2016”
76
P040
Expression of CMC using Conservative Regression Equation
A. Dasgupta1, S.K. Nag2*, A. Das3, P. Singha4 and D.Samanta5
1Former Scientist CMTI, Former Tech. Dir. HFPL, Tech. Committee Member NABL2Former System Manager HFCL, Former QM/TM EMC, CEO BSCSL, NABL Assessor
3Manager Technical, YEA Group4Quality Manager, BSCSL
5Director(Operation), YEA Group(*E-mail : [email protected])
AbstractAccording to ILAC as well as NABL recommendation, when the CMC is expressed in form of arange, calibration laboratory should have proper assumption for the interpolation to find theuncertainty at Intermediate values. Apart from this NABL also recommends that in all the cases,a more conservative fit should be applied by correcting the best fit equation. This paper describeshow to derive the best fit equation with lowest uncertainty due to interpolation and a correctionfactor to be introduced to obtain a conservative fit, by using Microsoft excel platform. The AB(NABL) gives several opportunities of expressing the uncertainty for CMC i.e. a) single value, b)range, c) an explicit function, d) matrix or d) a graphical form. Generally. When expressed in asingle value- the absolute or relative terms, the largest value is taken as CMC during accreditationassessment process. This can be done when the MU values at each points do not vary much withinthe range. However in many cases of calibration, it is observed that 1) Values of MU is widelyvarying at different point of calibration within a range, 2) a pattern ( either increasing or decreasing)is observed over the range. Such be the case, the CMC can be preferably be described in for of arange, giving the lowest and highest value or vice versa at lowest and highest points of calibration.In such situation, it is imperative to give an suitable interpolation equation in order to obtain theCMC value which a calibration laboratory can give at any intermediate points. This requirementcomes from the testing lab, who wants to decide the particular calibration of laboratory equipmentsfor their requirements. Hence, it becomes commercially important for a calibration laboratory toprovide the interpolation equation to their prospective customer. Since one may find the interpolationline/curve go the MU points, it becomes necessary to give a correction factor for the reason thatthe calculated value of uncertainty by interpolation cannot be less than MU value at any point ofcalibration. The absolute value (without considering the sign) obtained from max negative valuein deviation is considered to be the correction factor. This value is added to the best regressionequation, previously obtained.
When the so called corrected best regression equation is obtained, it is also called a conservativefit. In such a situation the calculated uncertainty values for calibration points will find above allMU values, excepting where max negative value of deviation was found. In this point the line willpass through that point.
Keywords: CMC, Regression analysis, Calibration
9th International Conference on “Advances in Metrology - 2016”
77
P041
A Novel Approach for Reducing Measurement Uncertainty in AirborneSound Insulation and Single-number Quantities
N Garg1*, L. Gandhi2, K. Soni1, A. Kumar1, P. Kumar2 and P. K. Saini3
1CSIR-National Physical Laboratory, Dr. K. S. Krishnan Road, New Delhi-110012, India2NIT Kurukshetra, Kurukshetra - 136 119, India
3Kurukshetra University, Kurukshetra - 136 119, India.(*E-mail : [email protected])
AbstractThe paper presents an analytical approach in calculating the measurement uncertainty in airbornesound insulation single-number quantity (SNQ). The study ascertains the magnitude of uncertaintydifference for single-number quantities considering the sound pressure approach; sound intensityapproach and a combined approach utilizing sound intensity method for low frequency measurements(50 Hz to 160 Hz) and sound pressure for the frequency range (200 Hz to 5 kHz). The work presentstwo case studies: one utilizing the standard deviation of reproducibility recommended in ISO12999-1:2014, ISO 15186-1:2000 and ISO 15186-3:2002 approach and other utilizing the standarddeviation of reproducibility reported by Dijckmans et al. 2013. The analytical results are consistentwith Hongisto et al. 2012 recommendations for using a combined approach i.e. sound intensity inrange 50 Hz to 160 Hz as per ISO 15186-3 and sound pressure in range 200 Hz to 5 kHz forreducing the measurement uncertainty in sound reduction index and single number quantities infrequency range 50 Hz to 5 kHz. Thus, it is recommended to use ISO 15186-3 for low frequencymeasurements (50 to 160 Hz) and sound pressure approach (200 Hz to 5 kHz) for reducing themeasurement uncertainty in airborne sound insulation in extended frequency range and Single-number Quantities (SNQs).
Keywords: Spectrum adaptation terms (C, Ctr), Sound pressure, Sound intensity, MeasurementUncertainty, Single-number quantity (SNQ).
9th International Conference on “Advances in Metrology - 2016”
78
P042
Determination of Inductive and Capacitive Components of ElectricalEquivalent Circuit of Four-Terminal-Pair Capacitance Standards
Satish1*, Manish Grover2, Sachin Kumar1 and Thomas John1
1CSIR-National Physical Laboratory, Dr. K. S. Krishnan Road, New Delhi-110012, India2Maharaja Agrasen Institute of Technology, New Delhi, India
(*E-mail : [email protected])
AbstractLF, HF Impedance and DC Standards laboratory of CSIR-National Physical Laboratory has theresponsibility to establish and maintain primary and reference standards of impedance at low andhigh frequency. Four-Terminal-Pair (4TP) capacitance standards are used upto 30 MHz as referencestandards of impedance at CSIR-NPL and other National Metrology Institutes worldwide. In recentyears, the work for the establishment of metrological traceability of impedance at high frequencyhas been initiated at CSIR-NPL. The reported work has been performed in this direction. The 4TPcapacitance standards used in the present work are Agilent 16380A type of nominal values 100 and1000 pF. These standards can be represented by electrical equivalent circuit model (EECM) asdescribed by Suzuki. The admittance of the 4TP capacitance standards has been determined interms of driving-point-impedances (Z11, Z11S3, Z22, Z11S2, Z44, Z44S3, and Z44, Z44S2) at each portas defined by Cutkosky. These impedances have been measured by the Agilent's E4991A impedanceanalyzer from 1 to 200 MHz. The inductive components of EECM have been determined usingcircuit theory. The capacitive components of EECM are measured directly at 1 kHz using GR1616precision capacitance bridge. The resonance frequency of each driving-point-impedance has beenmeasured using impedance analyzer. The four driving-point-impedances (Z11, Z11S3, Z22, Z11S2) aresufficient to produce four equations with four unknown inductive-components. These unknowninductive-components are thereafter determined as a function of frequency with the help of measuredcapacitive-components of EECM and resonance frequency of driving-point-impedance. The inductiveand capacitive components of the EECM will be used to estimate the frequency characteristics of4TP capacitance standards at higher frequency.
Keywords: Capacitance Standard, Resonance Frequency, Electrical Equivalent Circuit, Impedance
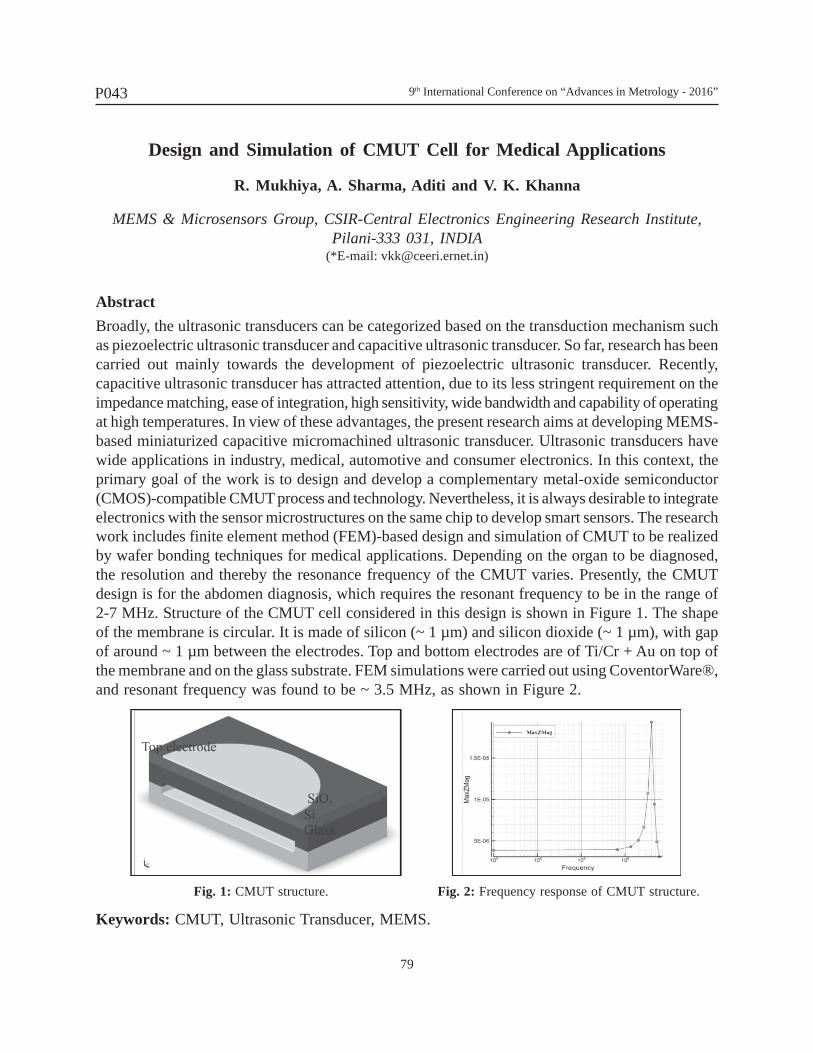
9th International Conference on “Advances in Metrology - 2016”
79
P043
Design and Simulation of CMUT Cell for Medical Applications
R. Mukhiya, A. Sharma, Aditi and V. K. Khanna
MEMS & Microsensors Group, CSIR-Central Electronics Engineering Research Institute,Pilani-333 031, INDIA
(*E-mail: [email protected])
AbstractBroadly, the ultrasonic transducers can be categorized based on the transduction mechanism suchas piezoelectric ultrasonic transducer and capacitive ultrasonic transducer. So far, research has beencarried out mainly towards the development of piezoelectric ultrasonic transducer. Recently,capacitive ultrasonic transducer has attracted attention, due to its less stringent requirement on theimpedance matching, ease of integration, high sensitivity, wide bandwidth and capability of operatingat high temperatures. In view of these advantages, the present research aims at developing MEMS-based miniaturized capacitive micromachined ultrasonic transducer. Ultrasonic transducers havewide applications in industry, medical, automotive and consumer electronics. In this context, theprimary goal of the work is to design and develop a complementary metal-oxide semiconductor(CMOS)-compatible CMUT process and technology. Nevertheless, it is always desirable to integrateelectronics with the sensor microstructures on the same chip to develop smart sensors. The researchwork includes finite element method (FEM)-based design and simulation of CMUT to be realizedby wafer bonding techniques for medical applications. Depending on the organ to be diagnosed,the resolution and thereby the resonance frequency of the CMUT varies. Presently, the CMUTdesign is for the abdomen diagnosis, which requires the resonant frequency to be in the range of2-7 MHz. Structure of the CMUT cell considered in this design is shown in Figure 1. The shapeof the membrane is circular. It is made of silicon (~ 1 µm) and silicon dioxide (~ 1 µm), with gapof around ~ 1 µm between the electrodes. Top and bottom electrodes are of Ti/Cr + Au on top ofthe membrane and on the glass substrate. FEM simulations were carried out using CoventorWare®,and resonant frequency was found to be ~ 3.5 MHz, as shown in Figure 2.
Fig. 1: CMUT structure. Fig. 2: Frequency response of CMUT structure.
Keywords: CMUT, Ultrasonic Transducer, MEMS.
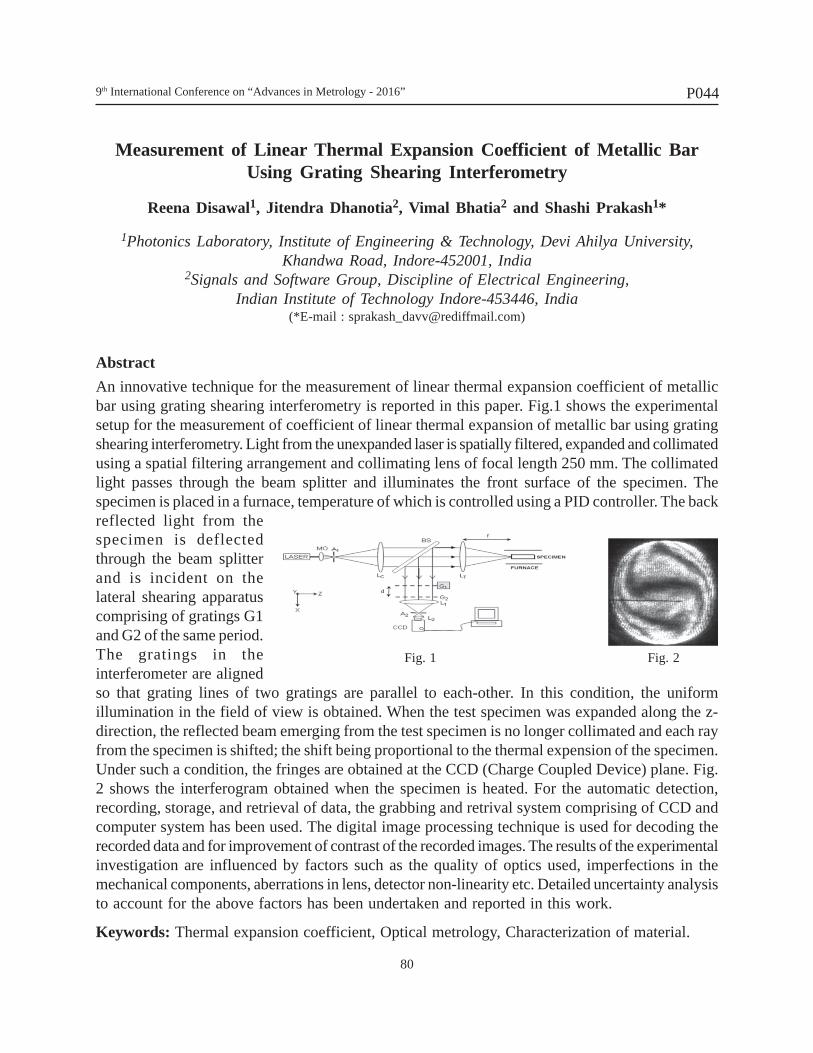
9th International Conference on “Advances in Metrology - 2016”
80
P044
Measurement of Linear Thermal Expansion Coefficient of Metallic BarUsing Grating Shearing Interferometry
Reena Disawal1, Jitendra Dhanotia2, Vimal Bhatia2 and Shashi Prakash1*
1Photonics Laboratory, Institute of Engineering & Technology, Devi Ahilya University,Khandwa Road, Indore-452001, India
2Signals and Software Group, Discipline of Electrical Engineering,Indian Institute of Technology Indore-453446, India
(*E-mail : [email protected])
AbstractAn innovative technique for the measurement of linear thermal expansion coefficient of metallicbar using grating shearing interferometry is reported in this paper. Fig.1 shows the experimentalsetup for the measurement of coefficient of linear thermal expansion of metallic bar using gratingshearing interferometry. Light from the unexpanded laser is spatially filtered, expanded and collimatedusing a spatial filtering arrangement and collimating lens of focal length 250 mm. The collimatedlight passes through the beam splitter and illuminates the front surface of the specimen. Thespecimen is placed in a furnace, temperature of which is controlled using a PID controller. The backreflected light from thespecimen is deflectedthrough the beam splitterand is incident on thelateral shearing apparatuscomprising of gratings G1and G2 of the same period.The gratings in theinterferometer are alignedso that grating lines of two gratings are parallel to each-other. In this condition, the uniformillumination in the field of view is obtained. When the test specimen was expanded along the z-direction, the reflected beam emerging from the test specimen is no longer collimated and each rayfrom the specimen is shifted; the shift being proportional to the thermal expension of the specimen.Under such a condition, the fringes are obtained at the CCD (Charge Coupled Device) plane. Fig.2 shows the interferogram obtained when the specimen is heated. For the automatic detection,recording, storage, and retrieval of data, the grabbing and retrival system comprising of CCD andcomputer system has been used. The digital image processing technique is used for decoding therecorded data and for improvement of contrast of the recorded images. The results of the experimentalinvestigation are influenced by factors such as the quality of optics used, imperfections in themechanical components, aberrations in lens, detector non-linearity etc. Detailed uncertainty analysisto account for the above factors has been undertaken and reported in this work.
Keywords: Thermal expansion coefficient, Optical metrology, Characterization of material.
Fig. 1 Fig. 2
9th International Conference on “Advances in Metrology - 2016”
81
P045
Long-term Measurement of Ambient Ammonia and itsImpacts on Air Quality of Delhi, India
Saraswati*, A. Sharma, Mohit Saxena, T.K. Mandal and S.K. Sharma
CSIR-National Physical Laboratory, Dr. K. S. Krishnan Road, New Delhi-110012, India(E-mail: [email protected])
AbstractAmbient ammonia (NH3) has important environmental implications due to its role in ecosystemand global nitrogen cycle, as well as contribution to particle formation. In the present study, wereport long-term continuous measurements of ambient NH3, NO, NO2 and SO2 at an urban site ofDelhi, India during January 2010 to December 2014, which provide temporal characteristics ofambient NH3. In the present study, average mixing ratios of ambient NH3, NO, NO2 and SO2 wererecorded as 17.1 ± 3.2, 22.4 ± 5.6, 12.4 ± 4.2, 1.8 ± 0.5 ppb, respectively at Delhi, India. Thepositive correlation matrix between ambient NH3 and related water soluble ionic components ofPM2.5 (NH4
+, SO42-, NO3
- and Cl- etc.,) indicated the possible formation of secondary inorganicaerosol over Delhi. In addition, we observed significant positive correlations between NH4
+/(NH4+
+ NH3) and PM2.5 mass concentrations, implying a contribution to gas-to-particle conversion.During study, we observed that the lower temperature and higher humidity favour the coversionof gaseous NH3 to particulate NH4
+ (PM2.5 mass) and particulate NH4+ always lower than the
gaseous NH3.
Keywords: Ambient NH3, PM2.5, Long-term
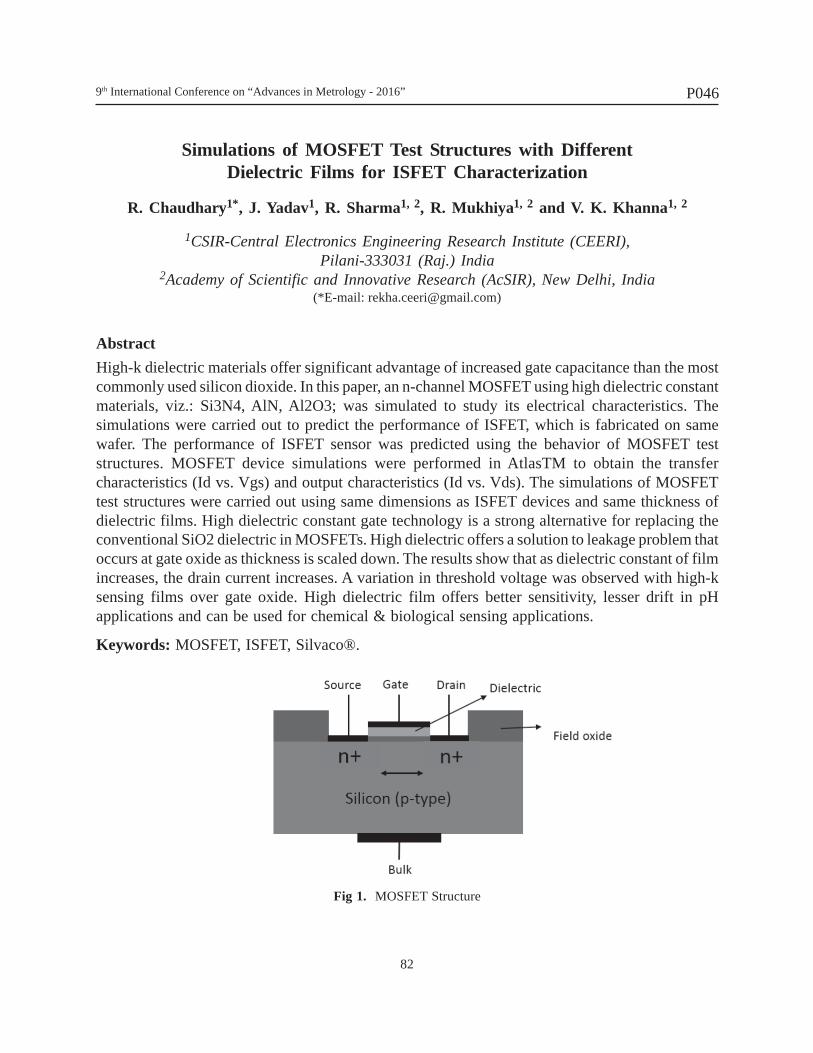
9th International Conference on “Advances in Metrology - 2016”
82
P046
Simulations of MOSFET Test Structures with DifferentDielectric Films for ISFET Characterization
R. Chaudhary1*, J. Yadav1, R. Sharma1, 2, R. Mukhiya1, 2 and V. K. Khanna1, 2
1CSIR-Central Electronics Engineering Research Institute (CEERI),Pilani-333031 (Raj.) India
2Academy of Scientific and Innovative Research (AcSIR), New Delhi, India(*E-mail: [email protected])
AbstractHigh-k dielectric materials offer significant advantage of increased gate capacitance than the mostcommonly used silicon dioxide. In this paper, an n-channel MOSFET using high dielectric constantmaterials, viz.: Si3N4, AlN, Al2O3; was simulated to study its electrical characteristics. Thesimulations were carried out to predict the performance of ISFET, which is fabricated on samewafer. The performance of ISFET sensor was predicted using the behavior of MOSFET teststructures. MOSFET device simulations were performed in AtlasTM to obtain the transfercharacteristics (Id vs. Vgs) and output characteristics (Id vs. Vds). The simulations of MOSFETtest structures were carried out using same dimensions as ISFET devices and same thickness ofdielectric films. High dielectric constant gate technology is a strong alternative for replacing theconventional SiO2 dielectric in MOSFETs. High dielectric offers a solution to leakage problem thatoccurs at gate oxide as thickness is scaled down. The results show that as dielectric constant of filmincreases, the drain current increases. A variation in threshold voltage was observed with high-ksensing films over gate oxide. High dielectric film offers better sensitivity, lesser drift in pHapplications and can be used for chemical & biological sensing applications.
Keywords: MOSFET, ISFET, Silvaco®.
Fig 1. MOSFET Structure
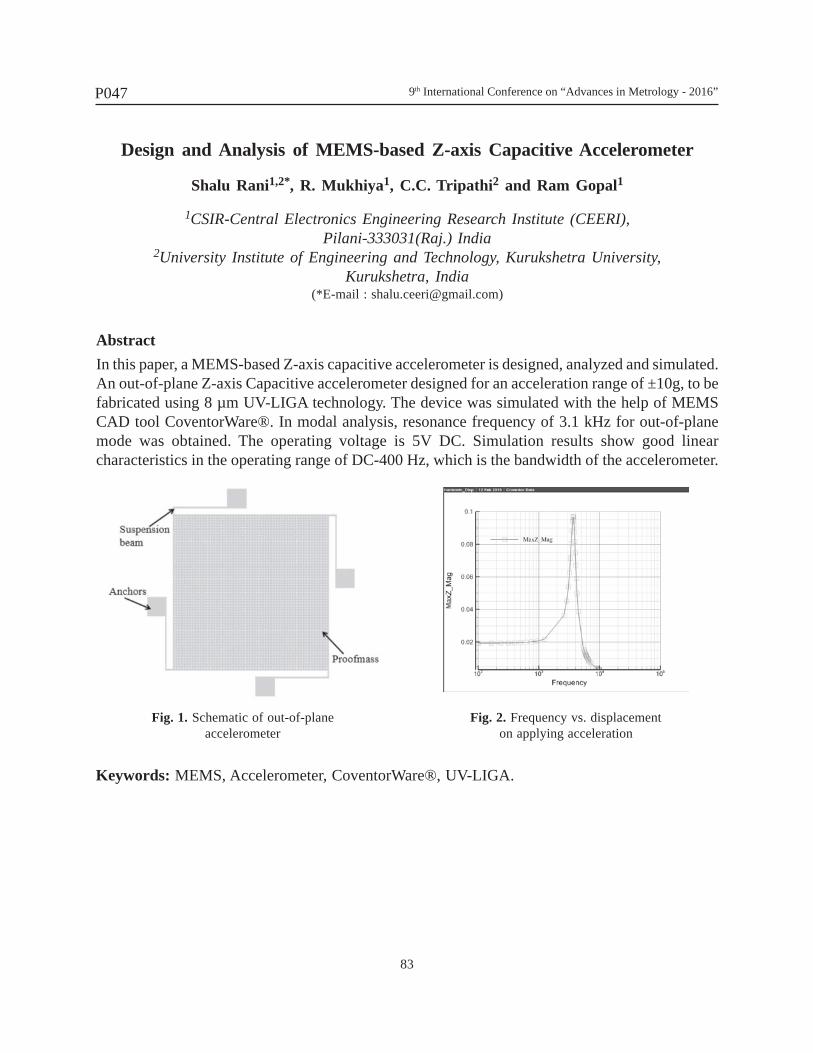
9th International Conference on “Advances in Metrology - 2016”
83
P047
Design and Analysis of MEMS-based Z-axis Capacitive Accelerometer
Shalu Rani1,2*, R. Mukhiya1, C.C. Tripathi2 and Ram Gopal1
1CSIR-Central Electronics Engineering Research Institute (CEERI),Pilani-333031(Raj.) India
2University Institute of Engineering and Technology, Kurukshetra University,Kurukshetra, India
(*E-mail : [email protected])
AbstractIn this paper, a MEMS-based Z-axis capacitive accelerometer is designed, analyzed and simulated.An out-of-plane Z-axis Capacitive accelerometer designed for an acceleration range of ±10g, to befabricated using 8 µm UV-LIGA technology. The device was simulated with the help of MEMSCAD tool CoventorWare®. In modal analysis, resonance frequency of 3.1 kHz for out-of-planemode was obtained. The operating voltage is 5V DC. Simulation results show good linearcharacteristics in the operating range of DC-400 Hz, which is the bandwidth of the accelerometer.
Fig. 1. Schematic of out-of-plane Fig. 2. Frequency vs. displacementaccelerometer on applying acceleration
Keywords: MEMS, Accelerometer, CoventorWare®, UV-LIGA.
9th International Conference on “Advances in Metrology - 2016”
84
P048
Determination of Total Arsenic in Brown Rice Flour byHigh Resolution Inductively Coupled Plasma MassSpectrometry-Result of APMP.QM-P21 Pilot Study
S. Swarupa Tripathy*, Rajiv K. Saxena, Swati, Sunita Raina,Niranjan Singh and Nahar Singh
CSIR-National Physical Laboratory, Dr. K. S. Krishnan Road, New Delhi-110012, India(*E-mail : [email protected])
AbstractContamination of arsenic in the environment at very low concentration also causes several diseasesto human beings. It enters to human body probably by ingestion and inhalation, among whichingestion occurs mainly through water and food. Worldwide rice is being consumed as a staplefood. Arsenic (As) can easily be taken up by rice plant through which it enters in the food chain.Determination of As in trace level is a challenging and difficult task due to its volatile nature. Thusreliable analytical results are required for compliance with international regulations and trade.
Recent past, NPL- India had participated in the APMP.QM-P21 pilot study on toxic elements inbrown rice flour organized by National Metrology Institute of Japan. Five replicates of approximate0.5 g rice sample were digested in microwave digestion system with 4 mL of nitic acid, 2 mLhydrogen peroxide and 0.1 mL of hydrofluoric acid. The aliquot had been prepared to the appropriatedilution by mass. The quantification of As was done by using fast scanning single collector sectorfield high resolution inductively coupled plasma mass spectrometry (HR-ICPMS, AttoM, NuInstrument, UK). Internal standard of 72Ge was used for drift correction for the analysis of 75As.The aliquots had been prepared gravimetrically spiked with known concentration of 72Ge. NISTSRM 1643e, multi elemental aqueous solution containing As was used for the calibration of HR-ICPMSs system. A reference material of fish sample is digested in duplicate along with the intercomparison samples for the recovery test for As. The evaluation of expanded uncertainty inmeasurement of total As was done at 95% confidence level (k=2) according to EURACHEM GUMGUIDE. The concentration of total As in the brown rice flour reference material is found to be 0.29mg/kg which is close agreement with the reference value. The associated measurement uncertaintyobtained is less than 3 %.
Keywords: Arsenic, Rice, Pilot study, High Rresolution, Mass spectrometry
9th International Conference on “Advances in Metrology - 2016”
85
P049
Studies of Short term satiability of convectron vacuum gauge
Harish Kumar, Rakesh Kumar Sharma and Ashok Kumar
CSIR-National Physical Laboratory, Dr. K. S. Krishnan Marg, New Delhi-110012(*E-mail : [email protected])
Abstruct
Present paper describes studies carried out on an industrial convectron vacuum gauge for a shortterm period. A study was carried out on industrial convectron pressure measurement gauge tubesensor.It is the popularly known as upgraded version of Pirani gauge and widely used in industrialestablishment. Industrial convectron gauge is capable to measure pressure from atmosphere to1×10-4 Torr and are used for roughing and foreline pressure measurement. The gauge undercalibration is calibrated against secondary vacuum standards i.e. Capacitance Diaphragm gauge(CDG), Spinning Rotor gauge (SRG) and Digital Pressure indicator (DPI). We have performed thefine calibrations starting from 2009 to 2013, annually. The stability of the gauge is studied bycomparing the calibration factor of the gauge over the years. A small change was observed duringthe 5 years of successive yearly measurement. Results were well within their claimed manufactureruncertainties in the short term stability.
Keywords: Calibration, Measurement, convectron
9th International Conference on “Advances in Metrology - 2016”
86
P050
Uncertainty Evaluation of Recently Developed Prototype Water FlowCalibration System at NPLI
Shiv Kumar Jaiswal1*, Sanjay Yadav1 and Ravinder Agarwal2
1CSIR-National Physical Laboratory, Dr. K. S. Krishnan Road, New Delhi-110012, India2Thapar University, Patiala -147004, India
(*E-mail: skjaiswal@ nplindia.org)
AbstractIn order to provide low-cost solution for Indian industries, NPLI has recently developed a prototypewater flow calibration system of size DN100 (a mid size facility between DN50 and DN200) asper ISO 4185 standard. The system is comprising of different parts / devices like weighing tanks,load cells, pressure indicator, temperature sensor (with indicator), flow control valve, electromagneticflowmeter, drain valves, diverter, flow nozzle, fishtail, pumps, constant level overhead tank, etc.The present paper describes the efforts made to identify different sources of measurement uncertaintyand their evaluation process in a single and double weighing methods. The major error anduncertainty components thus indentified are collected mass, collection time and water density. Theerror and uncertainty of the collected water mass depends on the balance indication, balance drift,balance calibration, buoyancy correction, leaks and splashes, storage effects and the evaporation.The error and uncertainty of the collection time depends on the timer calibration, timer actuationand the diverter error. The error and uncertainty of density depends on the accuracy of the densitymeter, quality of tap water and temperature of water used as flow medium The Type A uncertaintyassociated with DUC flow meter will have to be included separately. The volume flow rateuncertainty associated with water flow measurements thus evaluated using this system at 1000 kg,1500 kg and 2000 kg collected mass are ±0.055%, ±0.053% and ±0.052% respectively at k=2. Incomparison to single weighing, a second weighing tank is required for increasing the collectedmass and collection time for improvement of measurement error and uncertainty. Therefore, in adouble weighing tank approach, the PC clock along with universal counter is used for collectiontime measurement for improving measurement error and uncertainty. The measurement results thusobtained are described in details.
Keywords : Uncertainty, collected mass, collection time, volume flow rate, mass flow rate, divertererror.
9th International Conference on “Advances in Metrology - 2016”
87
P051
Calibration of an Air Flow Calibrator using Recently Established Gas FlowCalibration Facility at CSIR-NPL, India
Chatar Singh, I. S. Taak and Shiv Kumar Jaiswal
CSIR-National Physical Laboratory, Dr. K. S. Krishnan Road, New Delhi-110012, India(E-mail : [email protected])
AbstractNational Physical Laboratory, New Delhi (NPLI) is the National Metrology Institute (NMI) forIndia and is responsible for establishment, maintenance, upgradation and dissemination of NationalStandards of Measurements. The group has Water Flow Calibration Facility and Water MeterTesting Facility. Recently, Gas Flow Calibration System (GFCS) based on laminar flow elementsand sonic nozzles has been established in the Fluid Flow Measurement Standard group of NPLIin the flow range from 10 sccm (standard cubic centimeter per minute) to 1100 slm (standard litreper minute) referenced to 0ºC and 101.325 kPa. The expanded measurement uncertainty of thesystem in the above flow range is ±0.2 % at k=2. The flow rate lower than 10 sccm is also availablewith higher uncertainty. This system has been established keeping in view the requirement of in-house users of NPL such as Chemical Metrology group, Radio and Atmospheric Science Division,Solar Energy group, etc. and external users such as Pollution Control Boards, pharmaceuticalindustries, petrochemical industries, environmental monitoring equipment manufacturers, R&Dlaboratories, NABL accredited laboratories, gas flow meters (mass flow controllers, mass flowmeters, rotameters, digital flow calibrators) manufacturers, aerospace industries, etc. This systemis used for calibration of different types of flowmeters such as mass flow controllers, mass flowmeters, rotameters, totalizer type meters, digital flow calibrators, compact provers, etc used inmany research, development and industrial applications mainly process controls, environmentalmonitoring, pharmaceuticals and drugs manufacturing, health assessment etc. and also in manyNABL accredited laboratories. Present paper describes the details of the GFCS and calibration ofa air flow calibrator (i.e. volumetric flow rate device) as a case study. The uncertainty has beenestimated as per ISO 'GUM' document guidelines [1]. The standards used for calibration aretraceable to appropriate "National standards".
Keywords: Gas flow calibration system, uncertainty, national metrology institute (NMI), laminarflow element, sonic nozzle, volume flow rate, mass flow rate.
9th International Conference on “Advances in Metrology - 2016”
88
P052
Capacitive & Resistive Load of an Ion Trap AffectingSystematics of Trapped Ions in it
S. Majhi1, N. Batra1,2, A. Roy1, C.Samal1, S. Panja1 and S. De1*
1CSIR-National Physical Laboratory (Dr. K. S. Krishnan Marg, New Delhi-110012, India)2Academy of Scientific & Innovative Research (CSIR road, Taramani, Chennai-600113, India)
Abstract
We are developing single trapped ytterbium-ion (171Yb+) based optical frequency standard toachieve more accurate frequency standards than the cesium atomic fountain clock. A precision iontrap, mounted inside an ultra high vacuum environment, is needed to trap a single ion. We plan touse an end cap type Paul trap geometry. It consist a pairs of a solid inner electrode surrounded bya hollow cylindrical outer electrode, both mounted on holders for placing the electrode pairs facingeach other. Dimensions of the parts are critical to ~20 micron to achieve quadrupole trappingpotential. A high amplitude rf at ~10 MHz will be supplied to the inner electrode and a small dcwill be fed to the outer electrode. The capacitive load, which shifts the resonance frequency, needsto be estimated for delivering desired rf to the trap. On the other hand effective individual capacitanceon two opposite electrodes will introduce rf phase difference on them. That will result to extramicromotions and hence 2nd order Doppler shift to the precise frequency measurement. Thesources of the capacitances are as following: low density air spaced inner and outer electrodes, twoair sapced outer electrodes facing each other, two air spaced inner electrodes facing each other,inner electrode facing the opposite outer electrode, inner and outer trap holder separated by air andthe inner and outer trap holders separated by macor spacer. The total resistance is contributed bythe highly conductive electrodes and holders. The total resistance contributed by the holders andelectrodes is few micro-ohms. An equivalent series resistance (ESR) of few ohms is contributedby the macor spacers in the ion trap assembly. All the capacitances are being calculated using bothanalytical and numerical techniques. There are various numerical techniques to calculate thecapacitances as for example, Method of moments (MoM) and finite element methods (FEM). HereMethod of Moments has been used. The numerical and analytical values differ from each other byapproximately 3% which is below desired accuracy of our estimation. The capacitances which arisedue to macor as dielectric have real capacitances including ESR which have been calculated usingthe loss tangent value of the dielectric. Remaining all the capacitances are very near to their idealvalues as the trap will be in an ultra high vaccum chamber giving a relative permittivity equals to1 in the chamber environment. This work and their relevance in building an accurate frequencystandard will be presented in the meeting.
Keywords: Paul Trap, Method of Moments, Frequency Standard.
9th International Conference on “Advances in Metrology - 2016”
89
P053
Energy Shifts and Magic Wavelength of Yb+1 Clock Transition
A.Roy1, S. Majhi1, N. Batra1,2, C. Samal1, S. Panja1, B. K. Sahoo3 and S. De1*
1CSIR-National Physical Laboratory, Dr. K. S. Krishnan Road, New Delhi-110012, India2Academy of Scientific & Innovative Research CSIR Road, Taramani, Chennai-600113, India
3Theoretical Physics Division, Physical Research Laboratory, Ahmedabad, India(*E-mail : [email protected])
AbstractAtomic Clocks based on forbidden transition in optical frequency region have reached fractionaluncertainty of the order of 10-18. Ytterbium-ion have three highly forbidden transitions, two ofthem are quadrupole transition 6s 2S1/2 → 5d 2D3/2 (435.5nm), 6s 2S1/2 →5d 2D5/2 (411nm) andother one is octupole transition 6s 2S1/2? 4f136s2 2F7/2 (467nm), that can be used for frequencystandards. Dominant sources of systematic uncertainties in Yb-ion arise from DC Stark shifts,Light shifts and BBR shifts which are directly proportional to polarization of the states associatedto the clock transition. The shift results from interaction of the external dc electric field orelectromagnetic wave with the atomic states and the exact coupling occurs in a complex manner.For calculating these couplings we calculate the electric dipole (E1) matrix elements using couplecluster method that couples to the associated states of the clock transitions. For that we useavailable experimental spectroscopic information. After getting the E1 matrix elements we calculatestatic and dynamic polarizabilities which has contributions from core of the atom, valence electronsand core-valence interactions. We assume a linearly polarized light hence the static and dynamicpolarizabilities have scalar and tensor components only and the vector part cancels out. Staticpolarizability of 6s 2S1/2 ground state is (8.368 ± 0.2422) × 10-40 Jm2/v and the dynamic polarizabilityis (21.51 ± 0.3514) × 10-40 Jm2/v at the wavelength 435.5 nm and (28.11 ± 0.5441) × 10-40 Jm2/v at the wavelength 411 nm. Static scalar polarizability of the 5d 2D3/2 and 5d 2D5/2 excitedmetastable states are (17.57 ± 1.261) × 10-40 Jm2/v and (13.50 ± 1.063) × 10-40 Jm2/v, respectively.Static tensor polarizability for these states are - (12.25 ± 0.4426) × 10-40 Jm2/v and - (11.57 ±0.3942) × 10-40 Jm2/v, respectively. Dynamic scalar polarizability and tensor polarizability for 5d2D3/2 state is (2.88 ± 1.05) × 10-40 Jm2/v and - (4.08 ± 1.51) × 10-42 Jm2/v, respectively at thewavelength 435 nm. Whereas the same for the 5d 2D5/2 states are (1.94 ± 1.07) × 10-40 Jm2/v and(2.72 ± 0.245) × 10-41 Jm2/v, respectively, at the wavelength 411 nm. We also obtain frequencydependent dynamic polarization of the 6s 2S1/2 and 5d 2D3/2 states over a wide range of frequency.At some particular frequency of the electromagnetic radiation energy shift for both of the statescancel each which is known as magic frequency (inverse of it is magic wavelength). We calculatemagic wavelength for metastable clock transition 6s 2S1/2 → 5d 2D3/2 and these are 354.74 nm,193.95 nm, 164.37 nm. Among these wavelengths only 354.74 nm magic wavelength is useful fortrapping ion in optical lattice. We propose to trap Ytterbium-ions in an optical lattice prepared outof lasers at that magic wavelength. Hence we will be able to probe multiple ions which might besuitable for building next generation commercial atomic clock in chip traps with accuracies on theorder of 10-15, or forming qubits for quantum computers.Keywords: Polarizability, magic wavelength, optical lattice, atomic clock.
9th International Conference on “Advances in Metrology - 2016”
90
P054
Sound Insulation Metrology of Transmission Suite of CSIR-NPL
Mahavir Singh and Gurbir Singh
CSIR-National Physical Laboratory, Dr. K. S. Krishnan Road, New Delhi-110012, India(E-mail : [email protected])
AbstractThe acoustical measurements were made in the suite of sound transmission (i.e. reverberationchambers) of CSIR-NPL. All tests of wall specimens are mounted in a removable test framebetween two chambers, without rigid contact to either reverberation chamber. Tests were conductedin accordance with the requirements of ASTM E90, and of ISO 140/III 1995. In presenting andevaluating the results of measurements, three basic aspects will be considered: (i) Repeatability ofsound transmission results when specimens are replicated with nominally equivalent materials, (ii)The effect on the sound transmission results due to modifications to the test facility; and (iii) Thedesign of the measurement and the analysis of the experimental results to provide a basis foraccurate estimates of the effect of specific changes in specimens.
This paper presents information primarily on the first two of these issues. All three are addressedfurther on analysis of results.
Keywords: Sound transmission loss (TL), Transmission suite, Repeatability, Sound transmissionclass (STC).
9th International Conference on “Advances in Metrology - 2016”
91
P055
Measurement of Contact Angle and Meniscus Shape using MoiréDeflectometry and Fourier Fringe Analysis
Jitendra Dhanotia1, Vimal Bhatia1 and Shashi Prakash2*
1Signals and Software Group, Discipline of Electrical Engineering, Indian Institute ofTechnology Indore-453446, India
2Photonics Laboratory, Department of Electronics & Instrumentation Engineering,Institute of Engineering & Technology, Devi Ahilya University,
Khandwa Road, Indore-452001, India(*E-mail : [email protected])
AbstractMeasurement of the contact angle between a solid surface and liquid, and the liquid meniscus shapeis of importance in characterizing the liquids. In present communication, we report non-invasivemeasurement of contact angle meniscus shape of liquid using Moiré deflectometry and Fouriertransform method. For the measurement of meniscus shape of liquid, spatially filtered collimatedlight from the He-Ne laser (wavelength 632nm) is incident onto a beam splitter as shown in Figure-1. The deflected light from beam splitter illuminates the liquid surface. Silicon oil has been usedas a reference liquid. The back-reflected light from the top surface passes through the beam splitterand is incident onto a set of two identical gratings of period 0.04mm each, separated by a distanceof 20mm. An aperture is used to separate the needless diffraction orders. Ultimately, the first orderspot is allowed to pass and resulting superposed beams (fringe pattern) are focused onto the phaseplate of the CCD camera. The recorded fringe pattern is used for further analysis. Towards this,Fourier transform method has been developed inMatlab environment to determine the phase. TheFourier transform method involves undertaking FFT(Fast Fourier Transform) of the recorded data, designof suitable digital filters to select the desiredfrequency spectrum and shifting it to the centre.Undertaking the inverse Fourier transform the phaseof reflected wavefront is determined. From the phasedata, the information regarding meniscus shape andcontact angle is decoded. Good agreement betweentheoretical and experimental investigation has beenachieved. Detailed error and uncertainty analysis hasalso been undertaken. The values of precision(standard deviation) achieved by the proposedmethod conforms to the uncertainty of measurement.
Keywords: Meniscus shape, Optical metrology, Moiré deflectometry, Fourier transform
Fig. 1
9th International Conference on “Advances in Metrology - 2016”
92
P056
Design Study for Cutting Force Measuring Dynamometer
Shahroz A. Khan1* and Harish Kumar2
1Galgotias College of Engineering & Technology, Greater Noida, India 2CSIR-National Physical Laboratory, Dr. K. S. Krishnan Road, New Delhi-110012, India
(*E-mail : [email protected])
AbstractForce measurement is essential requirement in metal cutting as it is related to machine part design,tool design, power consumptions, vibrations, part accuracy, etc. It is the purpose of the measurementof cutting force to be able to understand the cutting mechanism such as the effects of cuttingvariables on the cutting force, the machinability of the work piece, the process of chip formation,chatter and tool wear. For over 100 years, metal-cutting researches attempting to understand thecutting behaviour better have investigated the cutting forces in metal cutting. It has been observedthat the force values obtained by engineering calculations contain some errors compared toexperimental measurements. Since the undeformed chip thickness and the direction of cuttingspeed vary at every moment, cutting process generally is geometrically complex. Owing to suchcomplexity, the cutting forces even in steady-state conditions is affected by many parameters andthe variation of cutting force with time has a peculiar characteristic. The need for measurement ofall cutting force component arises from many factors, but probably the most important is the needfor correlation with the progress of tool wear. In a three-dimensional cutting operation, three forcecomponents are necessary, whereas while drilling or tapping, only a torque and thrust drill arerequired. The strain gauge produces a clear relation between the measured quantity and the strainon a suitable spot on the spring element. In most cases, the static force is obtained by a strain gaugetype sensor which produces an output voltage proportional to elastic deformation. The cutting forcedynamometers must be manufactured at sufficient accuracy and high rigidity, and particularlysuitable for dynamic loads. In designing the dynamometer, some principles such as parallel beamtype, circular hole, piezo-electric, etc., have been used widely. In comparison of the piezoelectricsensors, semiconductor (silicon) strain gages and strain gages, the desirable features of piezoelectricsensors include their rugged construction, small size, high speed, and selfgenerated signal. On theother hand, they are sensitive to temperature variations and require special cabling and amplification.The rigidity and sensitivity are two opposing but basic requirements in dynamometer design. Inaddition, the structure of the dynamometer has to meet more strict requirements concerning thenatural frequency and wide frequency response and small cross-sensitivity.
Keywords: Cutting Force, Strain Gauge, Force Measurement, Dynamometer.
9th International Conference on “Advances in Metrology - 2016”
93
P057
A Terse Review of Strain Gauge Type Pressure Transducers
Vivek Singh1, S. Chattopadhyaya2, Sanjay Yadav3 and Harish Kumar3
1Galgotias College of Engineering and Technology, Greater Noida, India2Indian School of Mines, Dhanbad, India
3CSIR-National Physical Laboratory, Dr. K. S. Krishnan Road, New Delhi-110012, India(*E-mail : [email protected])
AbstractPressure is one of the most important thermodynamic process parameters and is measured inprocess industry and other scientific and engineering applications of prime importance. There arevarieties of sensing devices used to measure pressure in terms of an electrical output proportionalto applied pressure. Strain gauge type sensing devices are the most common used in the pressuretransducers because of their unique set of operational characteristics, ease in availability and costeffective nature for the last 4 decades or so. Due to variety of strain gauge pressure transducerscommercially available in the market, it is always a complex choice for the consumer to select forthe good one according to their requirements. The present paper describes the critical review of thestrain gauge type pressure transducers. The review of the strain gauge pressure transducer startsfrom the historical background, type of strain gauges, measurement ranges, minimum requiredspecifications, optimum precision and accuracy, recent advancement, advantages, limitations andfinally choice criterion. Efforts made towards the analytical simulations carried out for developmentof a high precision high pressure transducer in the pressure range up to 200 MPa is also described.
Keywords: Strain gauges, Pressure transducer, Sensing devices
9th International Conference on “Advances in Metrology - 2016”
94
P058
Effect of Crop Residue Burning on Pulmonary Function ofSchool Children in Rural Areas of Punjab
Gurpreet S Saggu1*, Susheel K Mittal2 and Ravinder Agarwal3
1Department of Chemical Engineering, Thapar University Patiala2School of Chemistry & Biochemistry, Thapar University, Patiala
3Department of Electrical and Instrumentation Engineering, Thapar University, Patiala(*E-mail : [email protected])
AbstractTo assess the effects of air pollution associated with crop residue burning on pulmonary functionsof school children, pulmonary function tests (FVC, FEV1), Blood pressure (BP) and OxygenSaturation (SpO2) level of 172 healthy school children between the age group of 9-15 years inSangrur, Fatehgarh Sahib and Patiala, located in Malwa region of Punjab, were done twice everymonth between September 2014 and November 2015. Concentration levels of PM1.0, PM2.5 andPM10 were measured using portable Aerosol Spectrometer and for Pulmonary Function Tests,spirometers were used. The airborne PM concentration was higher in rice crop burning period ascompared to wheat crop burning period with concentration of PM1 reaching up to maximum of247, 186 and 157 µgm-3 in the indoor classroom air of Patiala, Fatehgarh Sahib and Sangrur site,respectively, during the month of October in 2015. PFTs undergo a significant decrease during thesame period in their respective values. Effect of Agriculture Crop Residue Burning (ACRB) on theForce vital capacity is more than that on Force expiratory volume in 1 second, which had a delayedeffect on pulmonary functions.The study shows that reduction in lung functions (FVC and FEV1)can be attributed to higher particulate matter concentration in ambient air during the local cropresidue burning episodes.
Keywords: Crop residue burning, RSPM, Aerosol spectrometer, Spirometer, Pulmonary functiontest.
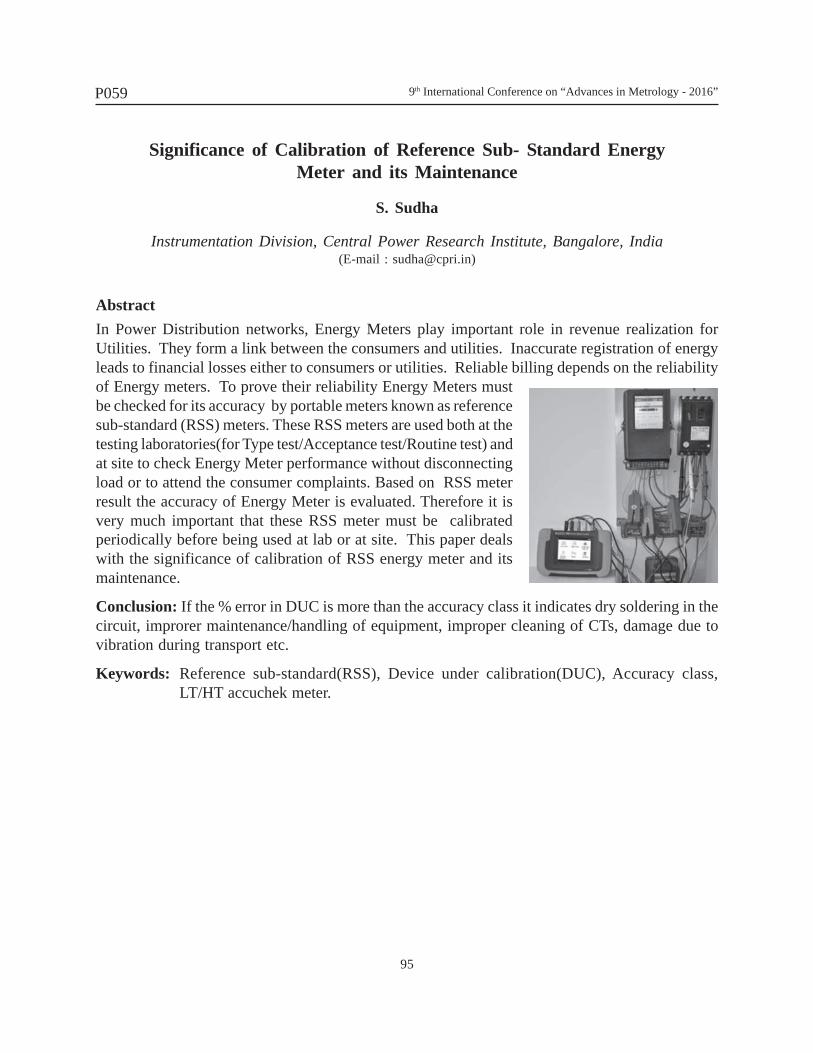
9th International Conference on “Advances in Metrology - 2016”
95
P059
Significance of Calibration of Reference Sub- Standard EnergyMeter and its Maintenance
S. Sudha
Instrumentation Division, Central Power Research Institute, Bangalore, India(E-mail : [email protected])
AbstractIn Power Distribution networks, Energy Meters play important role in revenue realization forUtilities. They form a link between the consumers and utilities. Inaccurate registration of energyleads to financial losses either to consumers or utilities. Reliable billing depends on the reliabilityof Energy meters. To prove their reliability Energy Meters mustbe checked for its accuracy by portable meters known as referencesub-standard (RSS) meters. These RSS meters are used both at thetesting laboratories(for Type test/Acceptance test/Routine test) andat site to check Energy Meter performance without disconnectingload or to attend the consumer complaints. Based on RSS meterresult the accuracy of Energy Meter is evaluated. Therefore it isvery much important that these RSS meter must be calibratedperiodically before being used at lab or at site. This paper dealswith the significance of calibration of RSS energy meter and itsmaintenance.
Conclusion: If the % error in DUC is more than the accuracy class it indicates dry soldering in thecircuit, improrer maintenance/handling of equipment, improper cleaning of CTs, damage due tovibration during transport etc.
Keywords: Reference sub-standard(RSS), Device under calibration(DUC), Accuracy class,LT/HT accuchek meter.
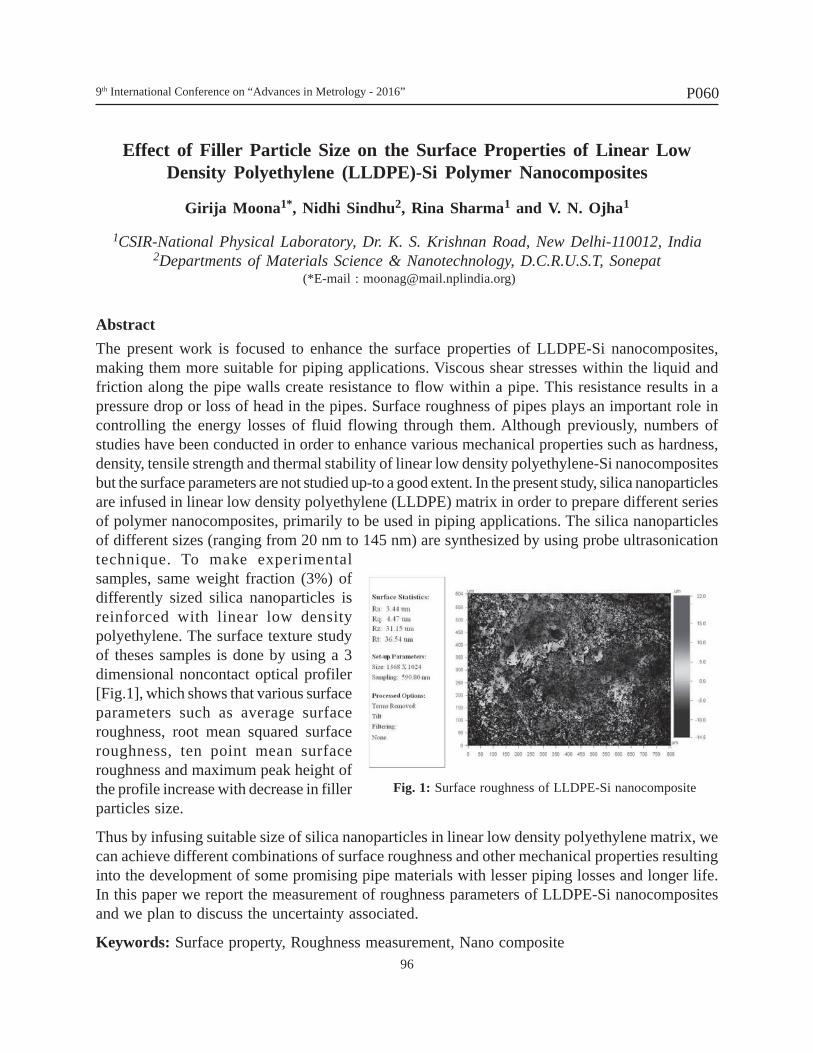
9th International Conference on “Advances in Metrology - 2016”
96
P060
Effect of Filler Particle Size on the Surface Properties of Linear LowDensity Polyethylene (LLDPE)-Si Polymer Nanocomposites
Girija Moona1*, Nidhi Sindhu2, Rina Sharma1 and V. N. Ojha1
1CSIR-National Physical Laboratory, Dr. K. S. Krishnan Road, New Delhi-110012, India2Departments of Materials Science & Nanotechnology, D.C.R.U.S.T, Sonepat
(*E-mail : [email protected])
AbstractThe present work is focused to enhance the surface properties of LLDPE-Si nanocomposites,making them more suitable for piping applications. Viscous shear stresses within the liquid andfriction along the pipe walls create resistance to flow within a pipe. This resistance results in apressure drop or loss of head in the pipes. Surface roughness of pipes plays an important role incontrolling the energy losses of fluid flowing through them. Although previously, numbers ofstudies have been conducted in order to enhance various mechanical properties such as hardness,density, tensile strength and thermal stability of linear low density polyethylene-Si nanocompositesbut the surface parameters are not studied up-to a good extent. In the present study, silica nanoparticlesare infused in linear low density polyethylene (LLDPE) matrix in order to prepare different seriesof polymer nanocomposites, primarily to be used in piping applications. The silica nanoparticlesof different sizes (ranging from 20 nm to 145 nm) are synthesized by using probe ultrasonicationtechnique. To make experimentalsamples, same weight fraction (3%) ofdifferently sized silica nanoparticles isreinforced with linear low densitypolyethylene. The surface texture studyof theses samples is done by using a 3dimensional noncontact optical profiler[Fig.1], which shows that various surfaceparameters such as average surfaceroughness, root mean squared surfaceroughness, ten point mean surfaceroughness and maximum peak height ofthe profile increase with decrease in fillerparticles size.
Thus by infusing suitable size of silica nanoparticles in linear low density polyethylene matrix, wecan achieve different combinations of surface roughness and other mechanical properties resultinginto the development of some promising pipe materials with lesser piping losses and longer life.In this paper we report the measurement of roughness parameters of LLDPE-Si nanocompositesand we plan to discuss the uncertainty associated.
Keywords: Surface property, Roughness measurement, Nano composite
Fig. 1: Surface roughness of LLDPE-Si nanocomposite
9th International Conference on “Advances in Metrology - 2016”
97
P061
Control & Data Acquisition System for Automation of theOptical Frequency Standard
N. Batra1, 2, A. Roy1, S. Majhi1, C.Samal1, A. Sengupta, S. Panja1 and S. De1*
1CSIR-National Physical Laboratory, Dr. K. S. Krishnan Marg, New Delhi-110012, India.2Academy of Scienti?c and Industrial Research, CSIR Road, Taramani, Chennai-600113, India
(*E-mail: [email protected])
Abstract
Any experiment using numerous instruments and electronic devices needs to be handled carefullyin order to avoid human errors like inaccurate input, wrong sequential operation etc. But for aprecision experiment which needs to be operated uninterruptedly and reliably over long period oftime requirements are more critical. As in our experiment i.e. single trapped ion optical clock theconstraints are also on remote control, coherence and time delays in the operation of these numerousdevices. All these stringent requirements can be fulfilled by a computer operated control systemwhich can be remotely operated (isolated from experiment), for addressing, controlling the inputsand acquiring data from the whole experiment. For this we are developing one such automatedcontrol and data acquisition system indigenously for use in our optical atomic clock. This systemuses hardware and software modules such as workstation computer, peripheral componentinterconnect data acquisition card (DAQ, NI PCIe 6353), addressing module, digital buffer circuits,pair of 50 line flat ribbon cables (FRCs) for digital data and address, coaxial cables for analog dataetc. and LabVIEW software. Traditionally used microcontrollers are not a good for tuning theparameters over a range. Here, each device has an addressing module associated with it which isaddresses by the computer program enabling the device at that address and latching the digital datasent from computer. Up to 64 devices can be selected using 6 bit digital address and controlledusing a 16 bit digital data travelling to the device from the DAQ in the computer. The devices arethus controlled remotely as they are near the experiment and the FRCs are spread all throughoutthe lab (~ 30 meters) to travel them. Devices like computer controlled dc power supply, AOMcontroller are already tested with this prototype system. Some more hardware parts such as digitalbuffers are currently under development. The entire scheme will be universal and can be incorporatedfor many other experiments, which will be presented.
Keywords: Automation, Data acquisition, Control system.
9th International Conference on “Advances in Metrology - 2016”
98
P062
Trends of Ozone, PM2.5 and PM10 and Their Correlations with Meteorologyin Indo Gangetic Plains of India during 2014
Madhvi Rana* and Susheel K. Mittal
School of Chemistry and Bio Chemistry, Thapar University Patiala, India(*E-mail of corresponding author: [email protected])
AbstractFortnightly averaged levels of Ozone, PM2.5 and PM10 are presented along with meteorologicalparameters, carried out at an urban location, Patiala, in Punjab plain of Indo-Gangetic plain fromDecember 2013 (FN-1) to November 2014 (FN-24). These observations were plotted to showtrends of pollutants and meteorological parameters. The mean concentration of ozone, PM2.5 andPM10 over the entire study period were 38.52±10.57ppp, 88.08±54.96 µgm-3 and 176.29±73.23µgm-3, respectively. The highest fortnightly averaged temperature of 38o C was recorded in FN-13 corresponding to the lowest relative humidity of 44%. Concentration profiles of PM2.5 andPM10 vary on similar patterns except for their magnitude. The relationship between atmosphericpollutants and meteorological parameters was studied using correlation analysis. Ozone showed asignificant positive correlation with temperature, solar radiation and wind speed. PM10 and PM2.5showed a significant positive correlation with each other and negatively correlated with temperature,solar radiation and wind speed. The fortnight maxima levels of ozone, PM2.5 and PM10 variedbetween 47-144 ppb, 83-673 µgm-3 and 187-810 µgm-3, respectively.
Keywords: Surface Ozone, PM2.5 and PM10, Meteorology, Correlation analysis
9th International Conference on “Advances in Metrology - 2016”
99
P063
Suitable Ion Trap with Reduced Systematics for Ytterbium-ion
S. De1*, N. Batra1, 2, A. Roy1, C. Samal1, S. Majhi1, S. Panja1 and B. K. Sahoo3
1CSIR-National Physical Laboratory, Dr. K. S. Krishnan Road, New Delhi-110012, India2Academy of Scientific and Innovative Research, CSIR road, Taramani,
Chennai-600113, India.3Theoretical Physics division, Physical research Laboratory, Ahmedabad, India.
(*Email :[email protected])
AbstractAn Ytterbium-ion trap experiment for probing its highly forbidden ultra-narrow 2S1/2 - 2F7/2electric octupole transition at the wavelength 467 nm is under development at CSIR-NPL. Thisaims to build a precise secondary frequency standard with an accuracy few parts part in 1017 whichwill also enable us to investigate temporal constancy of the fine structure constant or violation oflocal Lorenz invariance or non-conservation of parity. Since we are aiming for precisionmeasurements, we have indigenously designed an ion trap with careful study of the systematicsinduced by the trap itself. In particular electric quadrupole and 2nd or Doppler shifts are discussedhere. We have estimated the electric quadrupole moments θ of the states associated to the clocktransitions since the previous theoretical and experimental values differ by factor of five. Here wehave obtained a θ value of the 2F7/2 state which is comparable to other theoretical values but differsfrom the one and only experimental result. New measurements will be required for validation.Through numerical simulations we have identified a suitable trap geometry producing nearly idealharmonic confinement which will allow us for a precise measurement of θ. The trap and its vacuumassembly is designed such that the quadrupole shift will be cancelled below the projected accuracyof the frequency standard. The second order Doppler shift plays a significant role at this level ofaccuracy. The ions acquire excess micromotion due to phase difference θ of rf at the two electrodesof the ion-trap, which induces significant 2nd order Doppler shifts. The differential capacitive andinductive loads at the electrode path are the sources of this phase difference which arise due toimperfect machining and assembling of the components associated to the trap. We have estimatedeffective loads resulting from individual trap components and their connections in our trap as wellas from the entire assembly. These loads are used in an equivalent circuit analysis to estimate theeffective θ which depends on the achievable machining tolerance or assembling inaccuracy. Inreverse, aiming for a fraction accuracy of 10-17 the tolerable θ is estimated to be 1/2o and assumingof a machining tolerance ± 20 micron we have identified a suitable ion trap design where the 2nd
order Doppler shift is minimized. The subcomponents of the experiment, e.g., fabrication of thetrap, vacuum vessel, optical systems, electronic modules and data acquisition system are currentlyunder development.
Keywords: frequency standard, atomic clock, ion trap, precision measurement, systematic shifts.
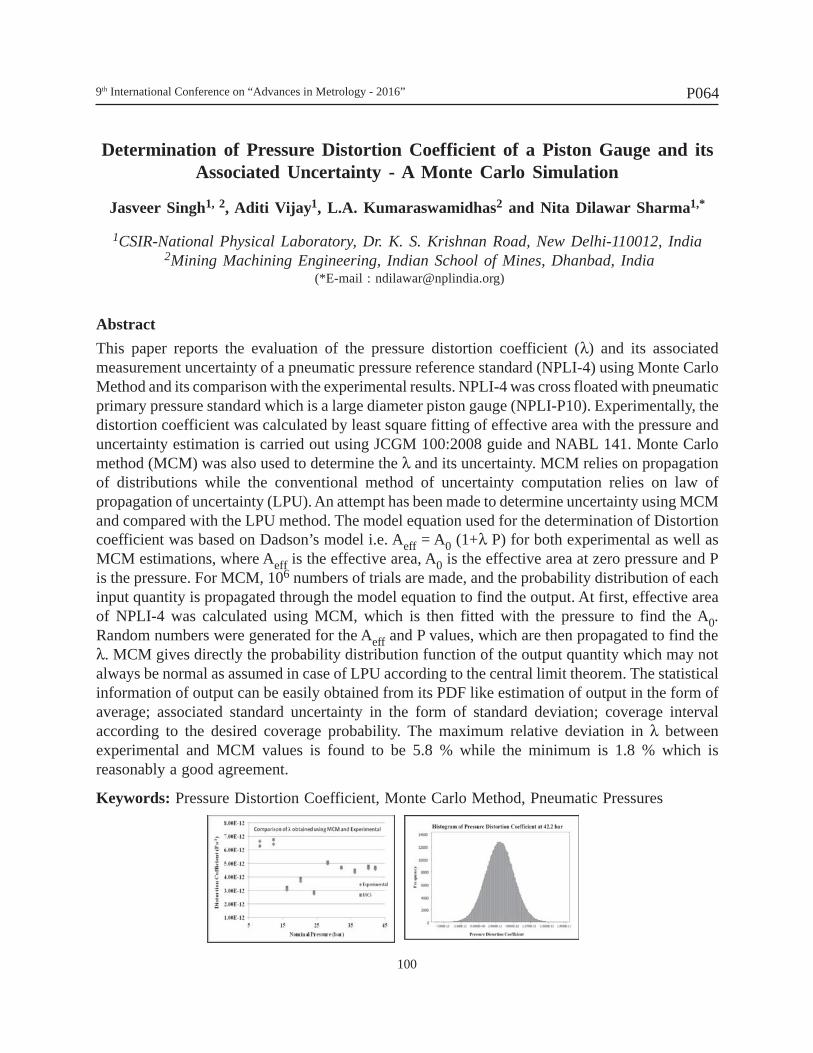
9th International Conference on “Advances in Metrology - 2016”
100
P064
Determination of Pressure Distortion Coefficient of a Piston Gauge and itsAssociated Uncertainty - A Monte Carlo Simulation
Jasveer Singh1, 2, Aditi Vijay1, L.A. Kumaraswamidhas2 and Nita Dilawar Sharma1,*
1CSIR-National Physical Laboratory, Dr. K. S. Krishnan Road, New Delhi-110012, India 2Mining Machining Engineering, Indian School of Mines, Dhanbad, India
(*E-mail : [email protected])
AbstractThis paper reports the evaluation of the pressure distortion coefficient (λ) and its associatedmeasurement uncertainty of a pneumatic pressure reference standard (NPLI-4) using Monte CarloMethod and its comparison with the experimental results. NPLI-4 was cross floated with pneumaticprimary pressure standard which is a large diameter piston gauge (NPLI-P10). Experimentally, thedistortion coefficient was calculated by least square fitting of effective area with the pressure anduncertainty estimation is carried out using JCGM 100:2008 guide and NABL 141. Monte Carlomethod (MCM) was also used to determine the λ and its uncertainty. MCM relies on propagationof distributions while the conventional method of uncertainty computation relies on law ofpropagation of uncertainty (LPU). An attempt has been made to determine uncertainty using MCMand compared with the LPU method. The model equation used for the determination of Distortioncoefficient was based on Dadson’s model i.e. Aeff = A0 (1+λ P) for both experimental as well asMCM estimations, where Aeff is the effective area, A0 is the effective area at zero pressure and Pis the pressure. For MCM, 106 numbers of trials are made, and the probability distribution of eachinput quantity is propagated through the model equation to find the output. At first, effective areaof NPLI-4 was calculated using MCM, which is then fitted with the pressure to find the A0.Random numbers were generated for the Aeff and P values, which are then propagated to find theλ. MCM gives directly the probability distribution function of the output quantity which may notalways be normal as assumed in case of LPU according to the central limit theorem. The statisticalinformation of output can be easily obtained from its PDF like estimation of output in the form ofaverage; associated standard uncertainty in the form of standard deviation; coverage intervalaccording to the desired coverage probability. The maximum relative deviation in λ betweenexperimental and MCM values is found to be 5.8 % while the minimum is 1.8 % which isreasonably a good agreement.
Keywords: Pressure Distortion Coefficient, Monte Carlo Method, Pneumatic Pressures
9th International Conference on “Advances in Metrology - 2016”
101
P065
Development of VCO based Drivers for Frequency Modulation
C. Samal1, N. Batra1,2, A. Roy1, S. Majhi1, S. De1, S. Panja1 and A. Sen Gupta1
1CSIR-National Physical Laboratory, Dr. K. S. Krishnan Road, New Delhi-110012, India2Academy of Scientific & Innovative Research, CSIR Road, Taramani,
Chennai-600113, India.(E-mail : [email protected])
AbstractModulation of phase and frequency of lasers are an essential and common practice in atomicmolecular and optical physics experiments. Acousto-optic modulator (AOM) and electro-opticmodulator (EOM) driven by voltage controlled oscillator (VCO) are widely used for controllingand modulating output frequencies of semiconductor diode lasers.AOMs are usually working formodulating laser frequencies by several hundred Megahertz, whereas EOMs are useful for modulatinglaser frequency in the range of several GHz. One of the critical issues about working with AOMand EOM is unavailability of good quality of the self drivers for those modulators. In CSIR-NPLwe are developing drivers for AOMs and EOMsto achieve low phase noise and ultrastable laserfrequency with wide range of tunability. The drivers are made with VCOs and applicable in the highfrequency to ultra-high frequency region. Integrating VCOs output frequencies with AOM andEOM, laser frequencies can be modulated by fewMHz to several GHz. When an AC signal isapplied to thepiezoelectrictransducer of an AOM, it starts oscillating and produces sound wavewhich causes variable kind of refractive index of the medium and leads to scattering of theincoming light and interference pattern similar to Bragg diffraction occurs.The incoming lightpasses through the AOMs will be Doppler shifted by the amount equal to the frequency of soundwave.On the other hand in EOM electro-optic effect is used to modulate the phase, frequency andamplitudeof light beam.The main element of these drivers isa VCO, an electronic oscillator circuitand its oscillating frequency can be tuned within certain range by changing its input voltage. Thistuning voltage is controlled with a 12 bits input digital to analog converter (DAC) and the outputof the DAC is connected to a differential amplifier. The output RF frequency of the VCO isconnected to a pre-amplifying stage through an attenuator and finally a broad band amplifier is usedfor generating 1-2 watt output power for driving the AOM and EOMs.An attenuator will controlthe output signal of the VCO and finally fed the signal to another amplification unit before sendingit to the optical modulator. The input voltage of the VCO can be tuned to generate desired RFfrequency from the VCO and the RF power can be controlled with the combination of the attenuatorand amplifiers.While generating such a high frequency with VCO instability in the output frequencymay occur and we have designed a high performance phase locked loop (PLL) for stabilizing theoutput frequencies of the VCOs.
Keywords: Frequency modulation, VCO, Electro optic effect
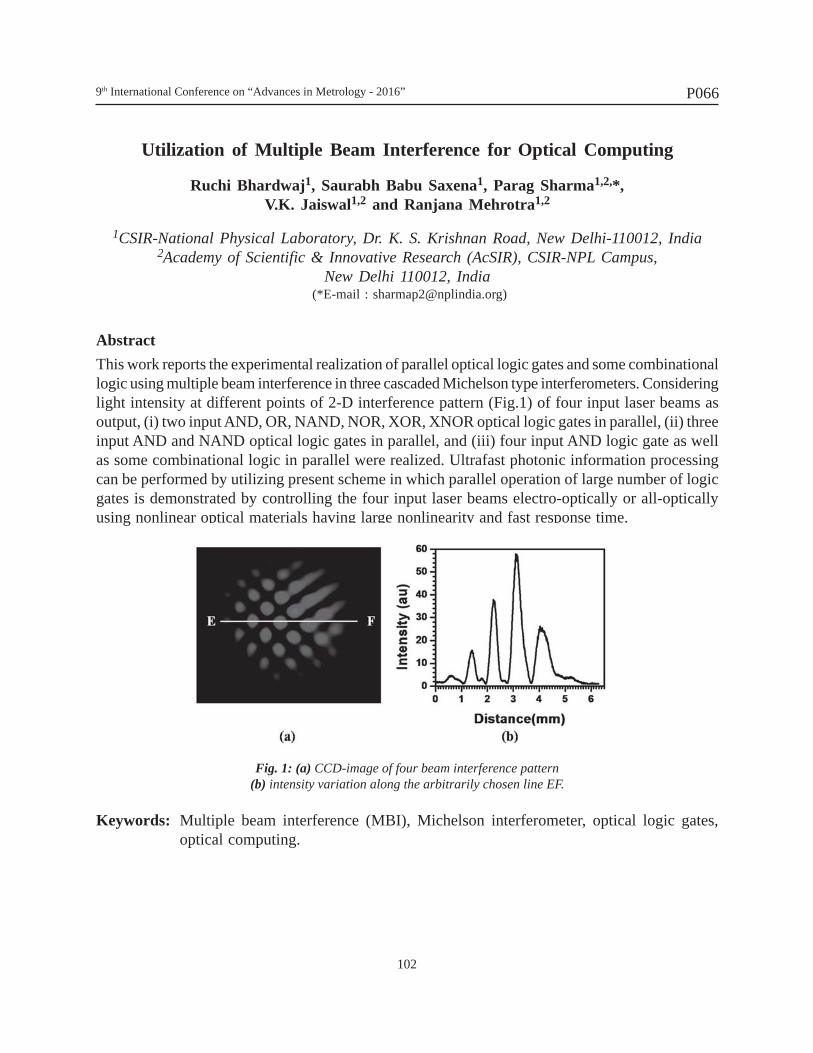
9th International Conference on “Advances in Metrology - 2016”
102
P066
Utilization of Multiple Beam Interference for Optical Computing
Ruchi Bhardwaj1, Saurabh Babu Saxena1, Parag Sharma1,2,*,V.K. Jaiswal1,2 and Ranjana Mehrotra1,2
1CSIR-National Physical Laboratory, Dr. K. S. Krishnan Road, New Delhi-110012, India2Academy of Scientific & Innovative Research (AcSIR), CSIR-NPL Campus,
New Delhi 110012, India (*E-mail : [email protected])
AbstractThis work reports the experimental realization of parallel optical logic gates and some combinationallogic using multiple beam interference in three cascaded Michelson type interferometers. Consideringlight intensity at different points of 2-D interference pattern (Fig.1) of four input laser beams asoutput, (i) two input AND, OR, NAND, NOR, XOR, XNOR optical logic gates in parallel, (ii) threeinput AND and NAND optical logic gates in parallel, and (iii) four input AND logic gate as wellas some combinational logic in parallel were realized. Ultrafast photonic information processingcan be performed by utilizing present scheme in which parallel operation of large number of logicgates is demonstrated by controlling the four input laser beams electro-optically or all-opticallyusing nonlinear optical materials having large nonlinearity and fast response time.
Fig. 1: (a) CCD-image of four beam interference pattern(b) intensity variation along the arbitrarily chosen line EF.
Keywords: Multiple beam interference (MBI), Michelson interferometer, optical logic gates,optical computing.
9th International Conference on “Advances in Metrology - 2016”
103
P067
New Approach in Calibration of Tilt Tables UsingCoordinate Metrology
Mallappa H.K*, K. Niranjan Reddy, Khushboo and Siddaraju K.G
Precision Metrology Laboratory, Central Manufacturing Technology Institute,Tumkur Road, Bangalore-560022 (*E-mail : [email protected])
AbstractCoordinate measuring machine (CMM) is an equipment having spatial (X, Y, Z) coordinate systemand it offers the advantage of aligning the machine coordinate system with job coordinate system.The measured spatial coordinates on the work piece surface are further analyzed to determine therequired parameters. By using Coordinate metrology, the tilt (inclination) of the tilt table can bemeasured by which accuracy of tilt tables can be evaluated. Generally tilt or inclination is measuredby using angle measuring instruments like Autocollimator, Electronic Levels, Laser Interferometersetc. which are having the limitation of range of angle measurement. This Paper focuses on Tiltangle or compound angle measurement of tilt tables using CMM where there is no limitation inthe range of measurement. The feature available in the Tilt Table for CMM measurement is topplane surface. Initially zero position of the Tilt Table is set on surface plate using the Electroniclevel for datum reference. The setup for measurement includes the Tilt Table assembly mountedon CMM Table, with axis of worm wheel in XZ & XY plane, the feature is in YZ plane. At zeroposition of Tilt Table (i.e. in Horizontal orientation), the table surface was aligned with CMM XZ& YZ Planes and at maximum tilt position other plane - XY was aligned. Angular movementsin YZ plane shown by Digital Readout (Sensor) are compared with CMM readings and these aretermed as Pitch Angle. The angle in other plane (XZ Plane) is unwanted movement and is calledas Roll Angle.
Keywords: CMM, Calibration, Tilt/ Inclination, Tilt Table,
9th International Conference on “Advances in Metrology - 2016”
104
P069
Advanced NRW Algorithm based Low Loss PermittivityMeasurement for Xn-Band Waveguide System
Naina Narang1,2, Satya K. Dubey2*, Parmendra S. Negi2 and Vijay N. Ojha2
1AcSIR, CSIR-National Physical Laboratory, Dr. K. S. Krishnan Road, New Delhi-110012, India 2CSIR-National Physical Laboratory, Dr. K. S. Krishnan Road, New Delhi-110012, India
(*E-mail : [email protected])
AbstractA scattering (S-) parameter based transmission-reflection microwave measurement method toretrieve relative permittivity of low loss material, such as Teflon, has been performed. The methoduses Nicolson-Ross-Weir (NRW) algorithm that works on raw scattering parameters to extract thepermittivity value. The measurement of S-parameters is performed on a waveguide based setup forXn-band frequencies (5.85-8.20GHz). The paper explains NRW algorithm in graphical manneralong with the MATLAB code. Application of proposed method is to establish dielectric propertymeasurement required for specific absorption rate (SAR) evaluation for different microwavefrequencies band.
Keywords: Dielectric, NRW-algorithm, S-parameters, Specific Absorption Rate (SAR)
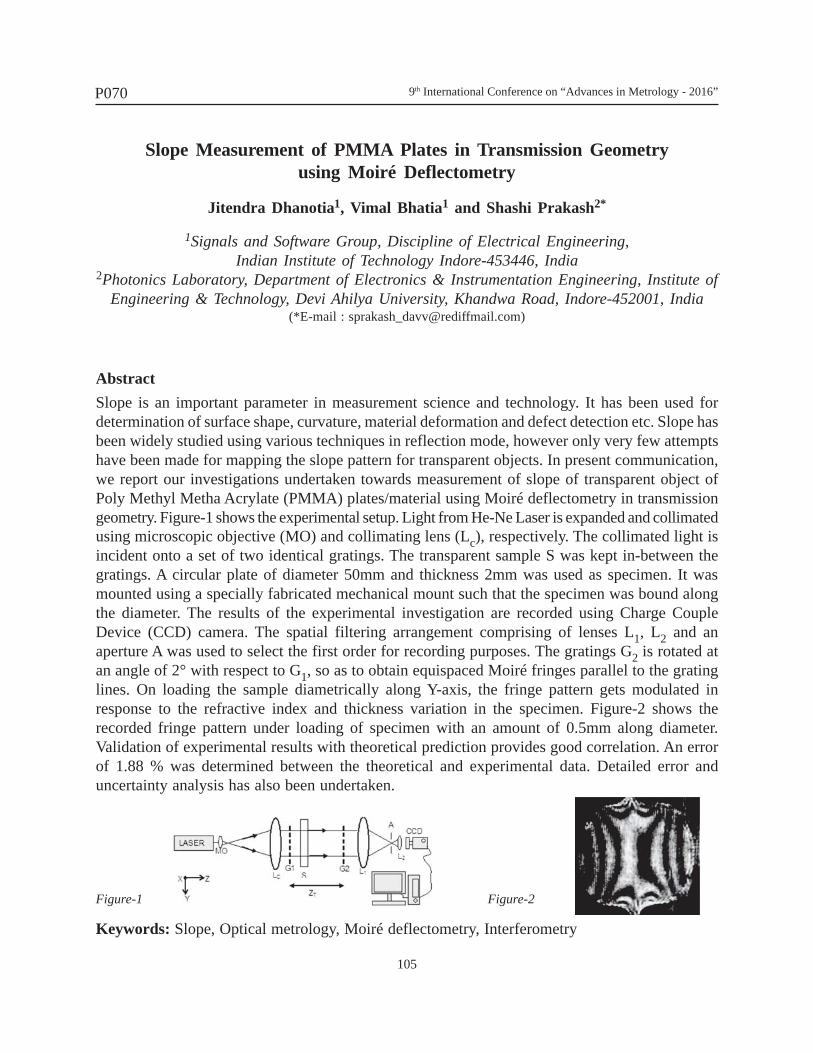
9th International Conference on “Advances in Metrology - 2016”
105
P070
Slope Measurement of PMMA Plates in Transmission Geometryusing Moiré Deflectometry
Jitendra Dhanotia1, Vimal Bhatia1 and Shashi Prakash2*
1Signals and Software Group, Discipline of Electrical Engineering,Indian Institute of Technology Indore-453446, India
2Photonics Laboratory, Department of Electronics & Instrumentation Engineering, Institute ofEngineering & Technology, Devi Ahilya University, Khandwa Road, Indore-452001, India
(*E-mail : [email protected])
AbstractSlope is an important parameter in measurement science and technology. It has been used fordetermination of surface shape, curvature, material deformation and defect detection etc. Slope hasbeen widely studied using various techniques in reflection mode, however only very few attemptshave been made for mapping the slope pattern for transparent objects. In present communication,we report our investigations undertaken towards measurement of slope of transparent object ofPoly Methyl Metha Acrylate (PMMA) plates/material using Moiré deflectometry in transmissiongeometry. Figure-1 shows the experimental setup. Light from He-Ne Laser is expanded and collimatedusing microscopic objective (MO) and collimating lens (Lc), respectively. The collimated light isincident onto a set of two identical gratings. The transparent sample S was kept in-between thegratings. A circular plate of diameter 50mm and thickness 2mm was used as specimen. It wasmounted using a specially fabricated mechanical mount such that the specimen was bound alongthe diameter. The results of the experimental investigation are recorded using Charge CoupleDevice (CCD) camera. The spatial filtering arrangement comprising of lenses L1, L2 and anaperture A was used to select the first order for recording purposes. The gratings G2 is rotated atan angle of 2° with respect to G1, so as to obtain equispaced Moiré fringes parallel to the gratinglines. On loading the sample diametrically along Y-axis, the fringe pattern gets modulated inresponse to the refractive index and thickness variation in the specimen. Figure-2 shows therecorded fringe pattern under loading of specimen with an amount of 0.5mm along diameter.Validation of experimental results with theoretical prediction provides good correlation. An errorof 1.88 % was determined between the theoretical and experimental data. Detailed error anduncertainty analysis has also been undertaken.
Keywords: Slope, Optical metrology, Moiré deflectometry, Interferometry
Figure-1 Figure-2
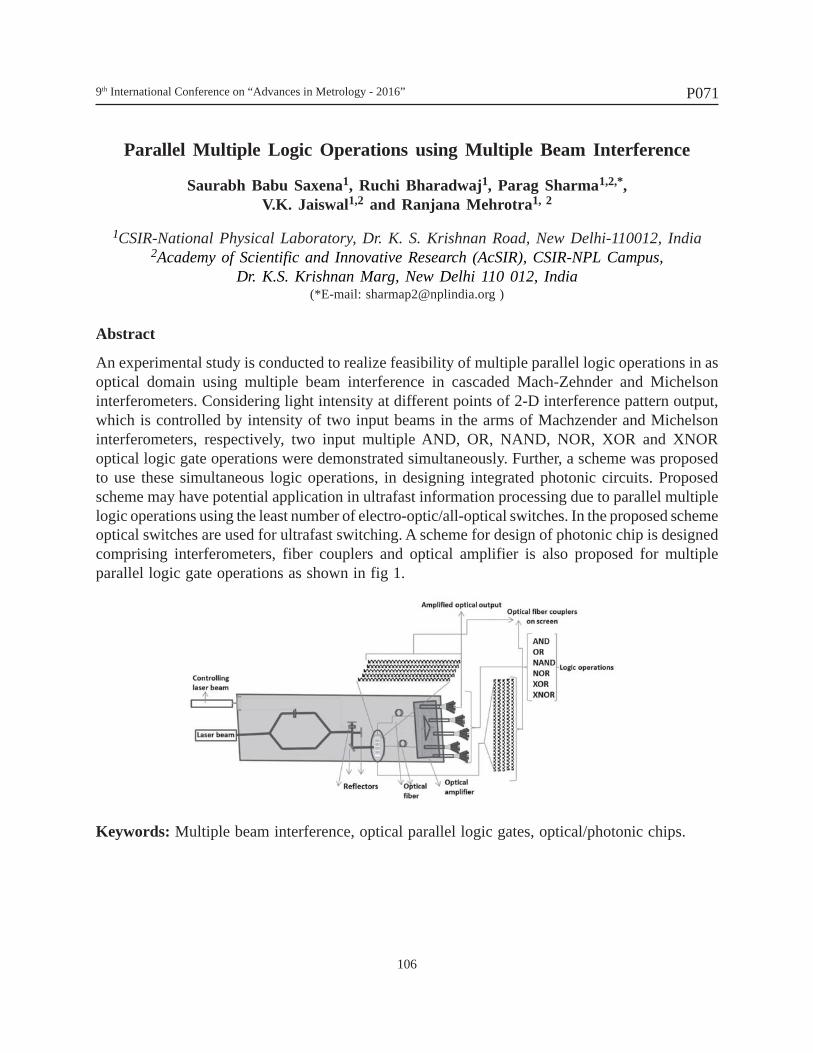
9th International Conference on “Advances in Metrology - 2016”
106
P071
Parallel Multiple Logic Operations using Multiple Beam Interference
Saurabh Babu Saxena1, Ruchi Bharadwaj1, Parag Sharma1,2,*,V.K. Jaiswal1,2 and Ranjana Mehrotra1, 2
1CSIR-National Physical Laboratory, Dr. K. S. Krishnan Road, New Delhi-110012, India2Academy of Scientific and Innovative Research (AcSIR), CSIR-NPL Campus,
Dr. K.S. Krishnan Marg, New Delhi 110 012, India(*E-mail: [email protected] )
Abstract
An experimental study is conducted to realize feasibility of multiple parallel logic operations in asoptical domain using multiple beam interference in cascaded Mach-Zehnder and Michelsoninterferometers. Considering light intensity at different points of 2-D interference pattern output,which is controlled by intensity of two input beams in the arms of Machzender and Michelsoninterferometers, respectively, two input multiple AND, OR, NAND, NOR, XOR and XNORoptical logic gate operations were demonstrated simultaneously. Further, a scheme was proposedto use these simultaneous logic operations, in designing integrated photonic circuits. Proposedscheme may have potential application in ultrafast information processing due to parallel multiplelogic operations using the least number of electro-optic/all-optical switches. In the proposed schemeoptical switches are used for ultrafast switching. A scheme for design of photonic chip is designedcomprising interferometers, fiber couplers and optical amplifier is also proposed for multipleparallel logic gate operations as shown in fig 1.
Keywords: Multiple beam interference, optical parallel logic gates, optical/photonic chips.
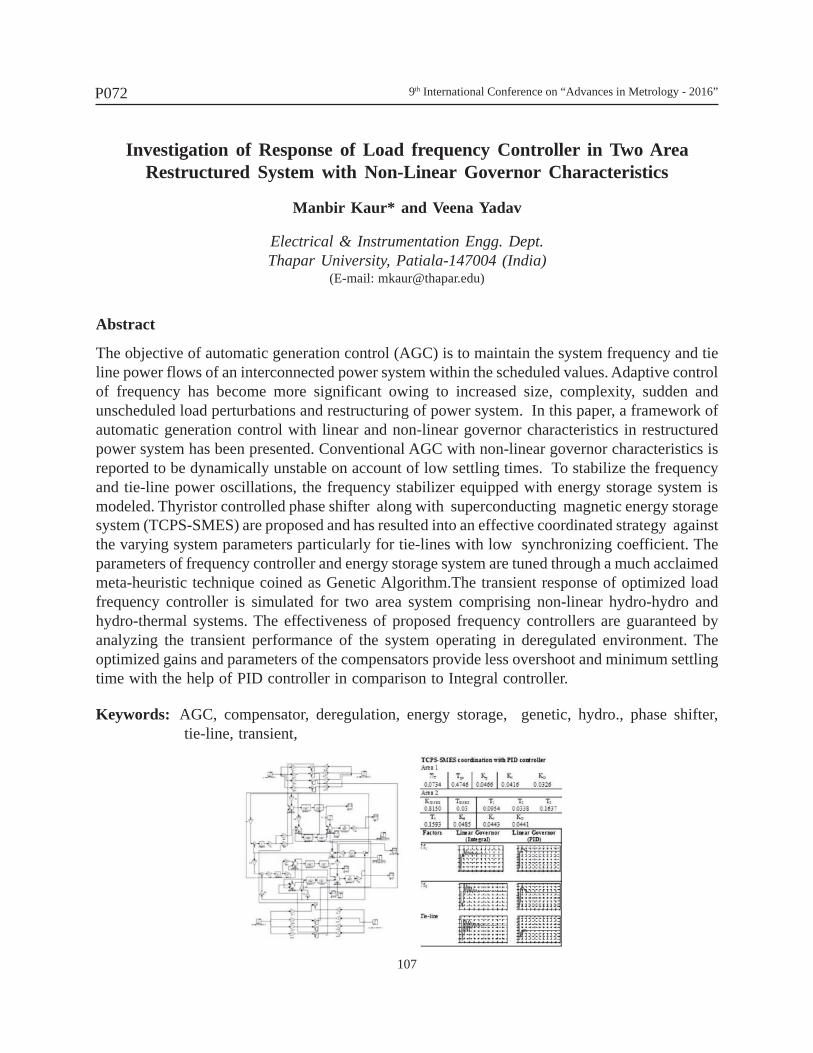
9th International Conference on “Advances in Metrology - 2016”
107
P072
Investigation of Response of Load frequency Controller in Two AreaRestructured System with Non-Linear Governor Characteristics
Manbir Kaur* and Veena Yadav
Electrical & Instrumentation Engg. Dept.Thapar University, Patiala-147004 (India)
(E-mail: [email protected])
Abstract
The objective of automatic generation control (AGC) is to maintain the system frequency and tieline power flows of an interconnected power system within the scheduled values. Adaptive controlof frequency has become more significant owing to increased size, complexity, sudden andunscheduled load perturbations and restructuring of power system. In this paper, a framework ofautomatic generation control with linear and non-linear governor characteristics in restructuredpower system has been presented. Conventional AGC with non-linear governor characteristics isreported to be dynamically unstable on account of low settling times. To stabilize the frequencyand tie-line power oscillations, the frequency stabilizer equipped with energy storage system ismodeled. Thyristor controlled phase shifter along with superconducting magnetic energy storagesystem (TCPS-SMES) are proposed and has resulted into an effective coordinated strategy againstthe varying system parameters particularly for tie-lines with low synchronizing coefficient. Theparameters of frequency controller and energy storage system are tuned through a much acclaimedmeta-heuristic technique coined as Genetic Algorithm.The transient response of optimized loadfrequency controller is simulated for two area system comprising non-linear hydro-hydro andhydro-thermal systems. The effectiveness of proposed frequency controllers are guaranteed byanalyzing the transient performance of the system operating in deregulated environment. Theoptimized gains and parameters of the compensators provide less overshoot and minimum settlingtime with the help of PID controller in comparison to Integral controller.
Keywords: AGC, compensator, deregulation, energy storage, genetic, hydro., phase shifter, tie-line, transient,
9th International Conference on “Advances in Metrology - 2016”
108
P073
Investigation and Evaluation of Systematics in PrimaryFrequency Standard at NPL, India
A. Acharya1,2,*, P. Arora1,2, V. Bharath1,2, S. Yadav1,A. Agarwal1,2 and A. Sen Gupta1,2
1CSIR-National Physical Laboratory, Dr. K. S. Krishnan Road, New Delhi-110012, India2Academy of Scientific & Innovative Research (CSIR road, Taramani,
Chennai-600113, India)(*E-mail : [email protected])
AbstractCSIR-NPL, India (NPLI) has developed its first Cesium atomic fountain (NPLI-CsF1) primaryfrequency standard (PFS). The indigenously developed fountain frequency standard is now fullyoperational and its frequency is being evaluated along with all the systematic and statisticaluncertainties. NPLI-CsF1 is periodically evaluated with respect to TAI (International Atomic Time).The fountain frequency is compared with the Hydrogen MASER (H-MASER) which is contributingto TAI already and hence fountain frequency is traceable to TAI. The present experimental dataconfirms that fountain frequency is stable to few parts in 1015 at less than one day averaging time.
It is now possible to run the fountain continuously for days without major interruptions providedthe ambient temperature of the room is stable. Estimation of various systematic shifts to thefountain frequency is periodically done. The magnetic field is measured for each evaluation toestimate second order Zeeman shift. The temperature of the flight tube ismonitored to calculate theblackbody radiation (BBR) shift. The gravitational red-shift is fixedand is calculated from theestimated height of the microwave cavity above the geoid. The collision shift is estimated byoperating the fountain alternatively in high and low density of detected atoms several days. Thefrequency offset with respect to the atomic density is extrapolated to zero density in order to getthe collision coefficient.Presently, we are investigating this bias more carefully as this one is oneof the major contributor of the uncertainty budget of NPLI-CsF1. In this paper, present evaluationof NPLI-CsF1 with respect to TAI with detailed uncertainty budget and detailed measurementprocedure of systematics are presented. During May 2013 to February 2014 total seven evaluationcycles were performed and the results were submitted to BIPM. On November 2014 BIPM acceptedthe results of NPLI CsF1 and published it in its monthly report, Circular-T. We are now performingrigorous evaluation of NPLI-CsF1 in order to contribute regularly to TAI.
Keywords: Laser Cooling, Cold Atoms, Systematic Uncertainty, Time Scale.
9th International Conference on “Advances in Metrology - 2016”
109
P074
Indigenous Development of 2nd Cs Atomic Fountain Clock
Vattikonda Bharath1,2, Poonam Arora1,2, Aishik Acharya1,2, Suchi yadav1,Ashish Agarwal1,2 and Amitava Sengupta1,2.
1CSIR-National Physical Laboratory, Dr. K. S. Krishnan Road, New Delhi-110012, India2Academy of Scientific and Innovative Research, NPL-Campus, Chennai.
(E-mail: [email protected])
AbstractThere are only 12 working Cesium (Cs) atomic fountains all over the world which is the primarystandard of Time &frequency. NPL India has also developed an atomic fountain named NPLI-CsF1which is now fully operational. Its frequency is periodically evaluated and it got BIPM (InternationalBureau of Weights and Measures) acceptance as primary frequency standard in November 2014.Nowwe are establishing a second Cs atomic fountain with some novel techniques and new designswhich enhances the accuracy of time measurement and increases the contribution of India in timemeasurement to TAI (International Atomic Time). The novel techniques which are going to beimplemented in the second fountain, the new design of the 3D MOT chamber and the UHV (ultrahigh vacuum) assembly techniques will be discussed and presented in detail. To increase the signalto noise ratio and thus the accuracy of the frequency measurement a novel technique Opticalpumping is going to be implemented in the second fountain. The theoretical calculations of the 25level system by rate equation approach and further elaboration of these calculations by densitymatrix approach and its status will be discussed in detail. The design criteria of four feed microwavecavity which decreases the distributed cavity phase shift and its advantages will be discussed. Thedesign of the 3D MOT (magneto optical trap) chamber which decreases the light shift in thefrequency measurement will be discussed. And the extremely critical UHV and optical assemblytechniques will be discussed. A novel technique of UHV viewport design and its assembly will bepresented.
Keywords: Primary standard of Time & Frequency, optical pumping, 3d MOT, UHV assembly, microwave cavity
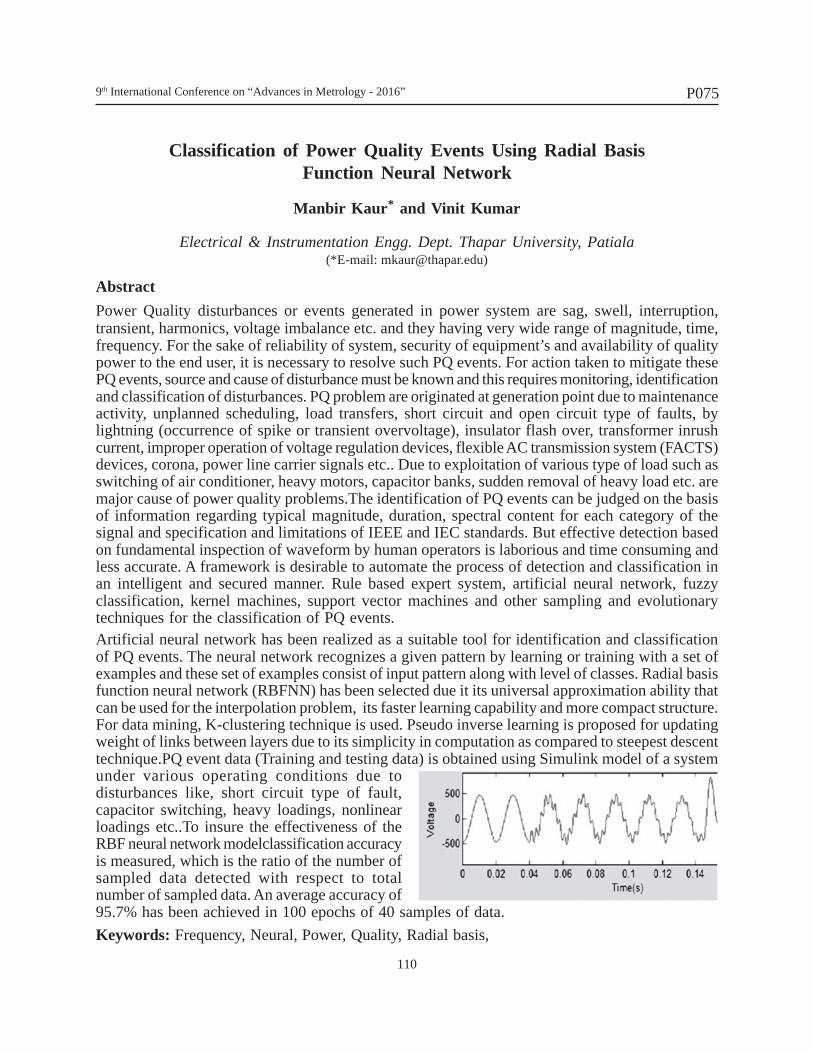
9th International Conference on “Advances in Metrology - 2016”
110
P075
Classification of Power Quality Events Using Radial BasisFunction Neural Network
Manbir Kaur* and Vinit Kumar
Electrical & Instrumentation Engg. Dept. Thapar University, Patiala(*E-mail: [email protected])
AbstractPower Quality disturbances or events generated in power system are sag, swell, interruption,transient, harmonics, voltage imbalance etc. and they having very wide range of magnitude, time,frequency. For the sake of reliability of system, security of equipment’s and availability of qualitypower to the end user, it is necessary to resolve such PQ events. For action taken to mitigate thesePQ events, source and cause of disturbance must be known and this requires monitoring, identificationand classification of disturbances. PQ problem are originated at generation point due to maintenanceactivity, unplanned scheduling, load transfers, short circuit and open circuit type of faults, bylightning (occurrence of spike or transient overvoltage), insulator flash over, transformer inrushcurrent, improper operation of voltage regulation devices, flexible AC transmission system (FACTS)devices, corona, power line carrier signals etc.. Due to exploitation of various type of load such asswitching of air conditioner, heavy motors, capacitor banks, sudden removal of heavy load etc. aremajor cause of power quality problems.The identification of PQ events can be judged on the basisof information regarding typical magnitude, duration, spectral content for each category of thesignal and specification and limitations of IEEE and IEC standards. But effective detection basedon fundamental inspection of waveform by human operators is laborious and time consuming andless accurate. A framework is desirable to automate the process of detection and classification inan intelligent and secured manner. Rule based expert system, artificial neural network, fuzzyclassification, kernel machines, support vector machines and other sampling and evolutionarytechniques for the classification of PQ events.Artificial neural network has been realized as a suitable tool for identification and classificationof PQ events. The neural network recognizes a given pattern by learning or training with a set ofexamples and these set of examples consist of input pattern along with level of classes. Radial basisfunction neural network (RBFNN) has been selected due it its universal approximation ability thatcan be used for the interpolation problem, its faster learning capability and more compact structure.For data mining, K-clustering technique is used. Pseudo inverse learning is proposed for updatingweight of links between layers due to its simplicity in computation as compared to steepest descenttechnique.PQ event data (Training and testing data) is obtained using Simulink model of a systemunder various operating conditions due todisturbances like, short circuit type of fault,capacitor switching, heavy loadings, nonlinearloadings etc..To insure the effectiveness of theRBF neural network modelclassification accuracyis measured, which is the ratio of the number ofsampled data detected with respect to totalnumber of sampled data. An average accuracy of95.7% has been achieved in 100 epochs of 40 samples of data.Keywords: Frequency, Neural, Power, Quality, Radial basis,
9th International Conference on “Advances in Metrology - 2016”
111
P076
Progress towards Indigenous Development of a Hydrostatic PressureTransducer in the Pressure Range up to 500MPa
Afaqul Zafer*, Sanjay Yadav, Lalit Kumar, Raman Kumar Sharma,Arif Sanjid and V. K. Gupta3
CSIR-National Physical Laboratory, Dr. K. S. Krishnan Road, New Delhi-110012, India (*E-mail : [email protected])
AbstractThe development of low cost high accuracy (0.5 % or better) pressure transducers in high pressurerange up to 500 MPa is a challenge. The commercially available pressure transducers are veryexpansive. As a part of Make in India plan, we have made focused efforts to design and fabricatea pressure transducer in this range. The fabrication of the transducer is done adopting a uniquedesign based on deformation in a tubular sensing element as a function of applied pressure. For thedesign optimization, we have also carried out the stress analysis on the sensing element usingSolidWork 2014 SP1.0 software. The stress analysis clearly reveals that sensing element cansustain pressure up to 550 MPa or 1.1 times of working pressure range. After ascertaining thepressure sustainability of the sensing element, the strain gauges of 350 ohm were cemented on thesensing element in a full bridge, 2 each in longitudinal and radial directions to get maximumpressure sensitivity. The output of the pressure transducer in mV is recorded using digital multimeter.The pressure was then calibrated against national primary pressure standard at 11 equally spacedpressure points (0, 50, 100, 150, 200, 250, 300, 350, 400, 450 and 500) MPa. The 6 observationswere taken at each pressure point which include, 3 each in increasing and decreasing orders ofpressures thus making total 60 observations. The output of the sensor varies from 0 to 0.86 mV inthe working pressure range. The results show an excellent linearity between pressure and recodedsensor output in mV having coefficient of determination R2 as 0.998. The progress made towardsthe development of a pressure transducer is reported in this paper.
Keywords: Pressure transducer, stress analysis, foil type strain gauge.
9th International Conference on “Advances in Metrology - 2016”
112
P077
Purity Evaluation of Chromium Chips by Gravimetric Method
Niranjan Singh, S. Swarupa Tripathy, Rajiv K. Saxena,Prabhat K. Gupta and Nahar Singh
CSIR-National Physical Laboratory, Dr. K. S. Krishnan Road, New Delhi-110012, India(*E-mail : [email protected])
AbstractThe industrial and technical importance of high-purity Chromium metal has been extensively usedsince many decades as catalyst, alloys mostly in the manufacture of stainless steel. In metrologicalpoint of view, the starting material of SI-traceable standards should be of very high quality.Gravimetric analysis is the primary method, which is required to determine the purity of the metal.In this study attempt has been made to evaluate the purity of chromium chips gravimetrically. Arequired quantity of chromium chips in five replicates were taken and dissolved with sub boiledhydrochloric acid and nitric acid. Further the solutions were treated with ammonium chloride andammonium hydroxide to form chromium hydroxide. The precipitate formed were filtered, ignitedand weighed in a calibrated balance. The purity of the chromium chips was evaluated and foundto be 99.793 % with associated uncertainty 0.215 %. The evaluation of expanded uncertainty inevaluation of purity was done at 95% confidence level (k=2) according to EURACHEM GUMapproach.
Keywords: Purity, chromium, chips, gravimetric
9th International Conference on “Advances in Metrology - 2016”
113
P078
Long Term Stability of the Primary Torque Standard MachineEstablished at CSIR-NPL
S.S.K. Titus, Rajesh Kumar, Rakesh Khanna and R.M. Manikandan
CSIR-National Physical Laboratory, Dr. K. S. Krishnan Road, New Delhi-110012, India(E-mail : [email protected])
AbstractTorque is an important physical parameters which needs to be measured precisely as the applicationof torque plays a vital role in several industries such as mechanical, automobile, civil aviation,pharmaceuticals, etc.. Precision torque measurement is realized by applying dead weight forcetangentially at one end of a lever arm having the other end firmly fixed to a suitable mount. Wehave established a torque primary standard machine consisting of a double sided lever supportedon strain controlled elastic hinges, having a best measurement capability (BMC) of ± 0.01% in the2-2000 Nm range. This primary machine is used to provide traceability in torque measurement theuser industries. It is therefore important to monitor the measurement capability of the torquemachine and also to participate in international inter-comparisons with other NMI in order toestablish the stability of the performance of the machine over a period of time. In this paper, aneffort is made to discuss the stability of this primary standard machine over a period of seven years.This helps us to maintain the degree of equivalence and also to build confidence on the claimedBMC (best measurement capability of the machine) of the machine. For this purpose, a precisiontorque transducer of 2000Nm capacity was calibrated on this machine in the clockwise directionusing a standard calibration procedure based on BS 7882. The observed repeatability andreproducibility in the measured range changes from ±0.009% to ±0.001% and ±0.014% to ±0.003%respectively. The average calibration values are determined with the uncertainty associated in themeasurement considering deviation due to resolution, repeatability, reproducibility, reversibility,interpolation and the uncertainty in the applied torque which is less than 0.03% over the range of40-100% capacity of the transducer. The obtained average measured values are compared with themeasurement data taken previously on the same transducer over a period of time.The measured average values are also compared with the average values reported in the PTB,Germany certificate for the same transducer and with CCM TK1.1 key comparison results. Fromthese measurements and analysis, it is observed that there is a slight increase in the average torquevalues measured by the transducer which could be attributed to the drift of the torque transducervalues over the period of time. The small drift observed would not have any significant effect onthe claimed BMC of 0.01% of the machine so performance of the machine is determined to be quitestable within the claimed limits. However, further investigation will be taken up in future tounderstand and monitor the stability of the machine after getting the artefact (i.e. 2000Nm torquetransducer) calibrated again from PTB, Germany. This would enable us to analyse the characteristicsand behaviour of the machine as well as the transducer with better clarity and understanding.
Keywords: Torque measurements, Calibration of Torque transducer, Primary torque standard
9th International Conference on “Advances in Metrology - 2016”
114
P079
Novel Approaches for the Growth of Single Crystals byBridgman Technique
N. Vijayan, Anuj Krishna and K.K. Maurya
CSIR-National Physical Laboratory, Dr. K. S. Krishnan Road, New Delhi-110012, India(E-mail : [email protected])
AbstractIn the recent past, the requirement of single crystalline materials is suddenly increased because ofits numerous applications in different areas of research. Bridgman technique is one of the meltgrowth techniques and one can grow bulk size and good quality single crystals in the particularperiod of time. In this report, we are focussing for the growth defect free single crystal by alteringthe growth mechanism as well design of the ampoule which used for the growth. In this approach,we can enhance the quality of the single crystal and at the same time we can reduce the defectconcentration. We have attempted to grow benzimidazole single crystal by using the ampoulesupport and found interesting results. We have compared the results with the crystal grown withoutany support. The support is giving slowly the heat to the grown single crystal and it is acting likea annealing. In other approach we have used the different crucible designs in order to encouragethe single nucleation. We have grown the bismuth selenide single crystal and found enhancedcrystalline perfection. The grown crystals were thoroughly characterized by PXRD, HRXRD, PLetc and the observed results will be presented in detail.
Key words: Single crystal, Bridgman, Crucible, Nucleation
9th International Conference on “Advances in Metrology - 2016”
115
P080
An Inter-comparison Study between two Rockwell HardnessStandard Machines
S.S.K. Titus, J.P. Singh and Vikram
CSIR-National Physical Laboratory, Dr. K. S. Krishnan Road, New Delhi-110012, India(E-mail : [email protected])
AbstractHardness is an important mechanical parameter needs to be precisely measured and expressedaccording to the internationally recognized scale for proper application of materials. It is highlydesirable to optimize the hardness values of materials which play a vital role in our daily lifeparticularly in machines wherever the moving parts in contact with one another is involved. Themeasurement of hardness values of materials is absolutely inevitable for the development of novelmaterials having potential applications in high technology industries like automobile, electronics,foundries, casing etc.
We have established the hardness standardizing machines in the Rockwell, Vickers and Brinellscales to provide necessary calibration and dissemination of the scales to the user industries. Forperforming these hardness measurements, we need to penetrate an indenter of a defined geometryonto a metal surface by applying a precisely known force for a specific interval of time. Thereafter,depending upon the hardness scale, certain dimensions of the indentation made by the indenter ismeasured and is express in universally acceptable number according to the standard procedure. Inthis paper we would like present the Rockwell hardness measurements performed using twodifferent machines established at our laboratory on the HRA, HRB and HRC scales in order toachieve the degree of equivalence in the hardness measurements. For performing Rockwell hardnessmeasurements, one requires to apply a preliminary force of 10kg to establish a datum line and thenan additional test force of 50kg for HRA scales, 90kg for HRB scales and 140kg for HRC scales.These additional applied test forces are maintained for a specific duration time as defined in thestandard procedure and then removed retaining the preliminary test forces. The depth of thepermanent indentation made by the indenter on the hardness block is measured using a suitablemeasuring device and expressed in certain number called Rockwell unit.
For establishing the degree of equivalence of the machines, standard hardness blocks in differentranges are chosen on the HRA, HRB an HRC scales and the measurement was made on thesestandard blocks using the machines. As the mechanism behind the operations of the machines aredifferent, the salient features of the machines are discussed with the repeatability measured by themachines. The deviations in average values measured by the machines are found to be within theacceptable limits of the uncertainties which are also compared with the standard block averagevalues. The importance of the comparison study and the En ratios are discussed in this presentation.
Keywords: Rockwell scale, Hardness measurements, Primary hardness machine,
9th International Conference on “Advances in Metrology - 2016”
116
P081
Wet and Dry Deposition of Pollutants duringDiwali Festival at Central Delhi
Sanchita Singhal1, B. Kumar2, S. Chandra1 and M.J. Kulshrestha1*
1CSIR-National Physical Laboratory, New Delhi, India2Jawaharlal Nehru University, New Delhi, India
(*E-mail: [email protected])
Abstract
The present study compares the ionic concentrations of major ionic species (Na+, K+, Ca2+, Mg2+,Cl-, NO3-, SO4
2-) during day and night time in the dry and wet deposition during Diwali festivalat Central Delhi. The study revealed that the effect of fireworks on dry and wet deposition was notlong lasting. Though the impact of crackers was seen, the same pattern again maintained, thuspointing out that the settling velocity of all the episodic aerosols due to fireworks was alsocomparatively higher. Also, the results showed that the dry deposition was always higher than wetdeposition for different components. Studies also indicated that the effect of humidity on the rateof sedimentation was not among the major factors as the deposition was more in day time thannight time. All the studied ions almost showed the same trend except the nitrate ions that pointedthat their formation was a light sensitive reaction- sunlight or firework display. Also, the depositiontrend showed that the nitrate ions in the atmosphere were comparatively more hydrophilic than theother ions.
Keywords: Diwali festival, dry deposition, wet deposition, ionic species.
9th International Conference on “Advances in Metrology - 2016”
117
P082
Effect of Change in Acceleration of Gravity inAccuracy of Electronic Levels
A . Murugan*, K. Niranjan Reddy, H. K. Mallappa and Shashi Kumar
Central Manufacturing Technology Institute, Bangalore, India (*E-mail : [email protected])
AbstractElectronic levels are generally pendulum type and use an electrical detecting system to sense theprecise position of the pendulum with respect to the housing. These electronic levels are used formeasurement of inclination. The absolute value of acceleration of gravity differs with geophysicalposition of the earth and hence angular displacement of pendulum in inclination measuringequipments changes accordingly. In the present study the effect of global variation of accelerationof gravity was studied in inclination accuracy measurement of electronic levels. The associatederror with change of acceleration of gravity is estimated value to be 95.5756” per 10° of inclinationfor change in acceleration of gravity values of 9.8059 m s-2 and 9.7802 m s-2 and experimentallyfound this error as 96°. Hence it requires the calibration and error adjustment of electronic levelsat user’s geophysical region in case these are manufactured/ calibrated at different geophysicalregions.
Keywords: Inclination, acceleration of gravity, angular displacement, calibration, electronic level.
9th International Conference on “Advances in Metrology - 2016”
118
P083
Cavity Ring-Down Spectroscopy Technique for the ImpurityAnalysis of CH4 and H2O in Purity Nitrogen Gas
Khem Singh*, Shankar G. Aggarwal, Daya Soni and Prabhat K. Gupta
CSIR-National Physical Laboratory, Dr. K. S. Krishnan Road, New Delhi-110012, India(*E-mail : [email protected])
AbstractCavity ring-down spectroscopy (CRDS) also known as Cavity ring-down laser absorptionspectroscopy is a laser absorption technique used for quantitative determination of atomic andmolecular species with a high sensitivity compared to other techniques. Light from a tuneablesemiconductor diode is directed into a small high finesse optical cavity with high reflectivitymirrors (>99.995%) containing the analyte gas, which circulate in the cavity ≈107 times, travellingabout 20 km or more. The precession of CRDS comes from this incredibly long path lengthproviding part-per-billion (ppb) detection levels for some gases. The energy decays from the cavityas a result of loss mechanism is recorded as a function of time (τ). The unique advantage of usingCRDS is that τ is independent of the initial laser intensity and hence offer unmatched measurementprecession. In this paper we have used high accuracy CRDS (Tiger Optics) techniques for themeasurement of impurities of CH4 and H2O in purity nitrogen. The lowest detection limit of CRDSused is 2 ppb and 200 ppt for CH4 and H2O respectively, whereas the detection range of the CRDSis 0 - 8 ppm and 0 - 5 ppm for CH4 and H2O, respectively. Analysis of impurities was done incontrolled environmental condition. The concentration of CH4 and H2O in nitrogen is found to bein the range of 274±72 ppb and 884±14 ppb, respectively.
Keywords: CRDS technique, Impurity analysis, CH4 and H2O, Purity nitrogen gas
9th International Conference on “Advances in Metrology - 2016”
119
P084
Multipoint Calibration Versus Bracketing Method in Determination ofCarbon Monoxide in Nitrogen by Gas Chromatograph Technique
Daya Soni*, S. Koul, Khem Singh, Ravleen Kaur,Shankar G. Aggrawal, P. Johri and Prabhat K. Gupta
CSIR-National Physical Laboratory, Dr. K. S. Krishnan Road, New Delhi-110012, India(*E-mail : [email protected])
AbstractThe choice of calibration methodology to obtain the calibration function is crucial to calculate theaccurate amounts of an analyte as a function of an instrumental signal. It is well known that theanalysis of any analyte using any analytical techniques like Inductively Coupled Plasma, AtomicAbsorption Spectrometer, Gas Chromatograph etc need calibration ofequipments using calibrationstandards. Calibration by linear regression analysis requires minimum three standards and uncertaintyassociated with this is also higher. A two point method of calibration (bracketing) is proposed forthe calibration which reduces the uncertainty and also improves measurement. This method has theadvantage of approximately compensating for non-linearity in the analytical curve, if the twostandards are close in concentration to the sample. In this paper, multipoint calibration and bracketingmethod were applied to an in-house optimized GC-Flame Ionization Detectortechnique for COanalysis. The calibration curvefor multipoint calibration was obtained by regression analysis usingthree gas mixtures prepared gravimetrically as per ISO 6142 (at NPLI) in the range 87 - 113 µmol/molCO in nitrogen that covers the range of concentrations expected in sample gas mixture of COin Nitrogen. In bracketing method of calibration, two standards are taken - one with a lowerconcentration (87 µmol/mol) than the unknown and the other witha higher concentration(113µmol/mol). The calibration curve segment between the two standards can be considered linear andan accurate determination can be realized applying the linear equation for two points. The signalintensities of standardsand the sample in bracketing method is measured in such a sequence oneafter other that it compensates the drift of detector response, if any, during the run. A gravimetricallyprepared control sample is also used for quality control of the analytical method in sequence. Theamount of CO in unknown sample is calculated with the expanded uncertainty (at k=2) in adifferent way in each of these calibration methods and is found 101.71±4.22 µmol/mol and100.61±0.83 µmol/mol for multipoint and bracketing method respectively. The uncertainty of theCO in nitrogen gas mixture is found to reduce from 4% in multipoint calibration method to lessthan 1% in the bracketing method.
Keywords: GC-Flame Ionization Detector, Multipoint calibration, Bracketing method
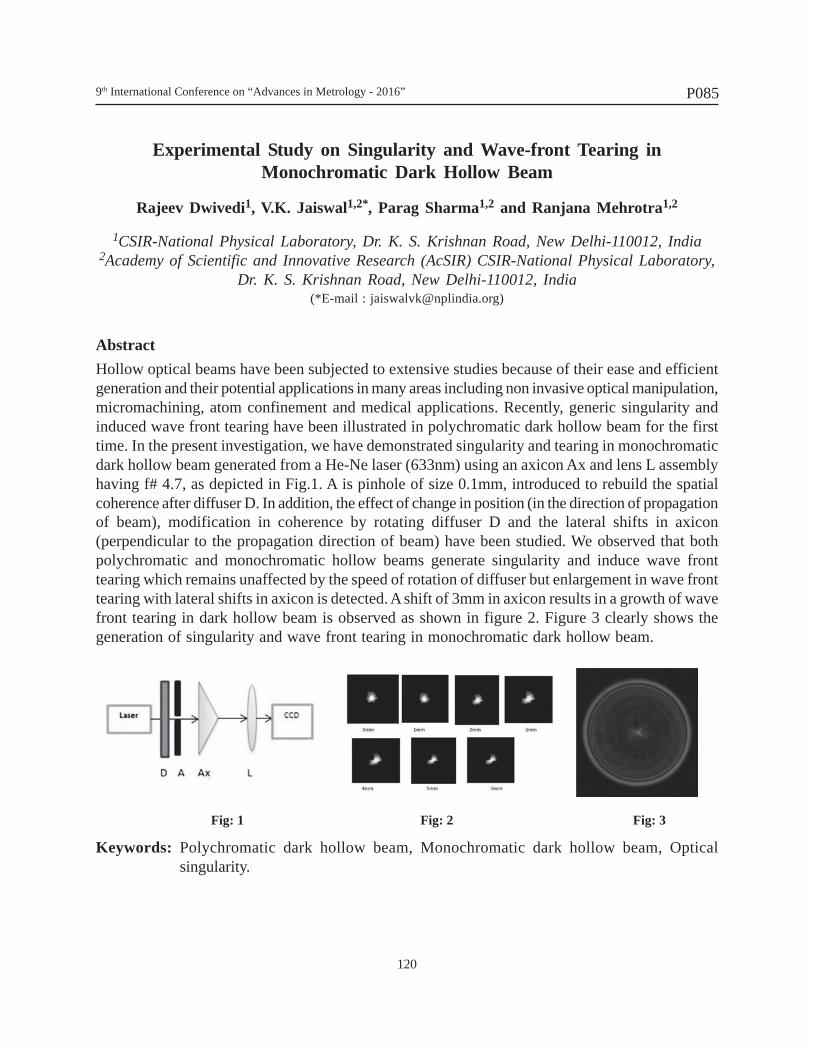
9th International Conference on “Advances in Metrology - 2016”
120
P085
Experimental Study on Singularity and Wave-front Tearing inMonochromatic Dark Hollow Beam
Rajeev Dwivedi1, V.K. Jaiswal1,2*, Parag Sharma1,2 and Ranjana Mehrotra1,2
1CSIR-National Physical Laboratory, Dr. K. S. Krishnan Road, New Delhi-110012, India2Academy of Scientific and Innovative Research (AcSIR) CSIR-National Physical Laboratory,
Dr. K. S. Krishnan Road, New Delhi-110012, India(*E-mail : [email protected])
AbstractHollow optical beams have been subjected to extensive studies because of their ease and efficientgeneration and their potential applications in many areas including non invasive optical manipulation,micromachining, atom confinement and medical applications. Recently, generic singularity andinduced wave front tearing have been illustrated in polychromatic dark hollow beam for the firsttime. In the present investigation, we have demonstrated singularity and tearing in monochromaticdark hollow beam generated from a He-Ne laser (633nm) using an axicon Ax and lens L assemblyhaving f# 4.7, as depicted in Fig.1. A is pinhole of size 0.1mm, introduced to rebuild the spatialcoherence after diffuser D. In addition, the effect of change in position (in the direction of propagationof beam), modification in coherence by rotating diffuser D and the lateral shifts in axicon(perpendicular to the propagation direction of beam) have been studied. We observed that bothpolychromatic and monochromatic hollow beams generate singularity and induce wave fronttearing which remains unaffected by the speed of rotation of diffuser but enlargement in wave fronttearing with lateral shifts in axicon is detected. A shift of 3mm in axicon results in a growth of wavefront tearing in dark hollow beam is observed as shown in figure 2. Figure 3 clearly shows thegeneration of singularity and wave front tearing in monochromatic dark hollow beam.
Keywords: Polychromatic dark hollow beam, Monochromatic dark hollow beam, Opticalsingularity.
Fig: 1 Fig: 2 Fig: 3
9th International Conference on “Advances in Metrology - 2016”
121
P086
Comparative Study of Natural Frequency on an L Structure withCrack and End Mass Induced
J. S. Thanmay1* and H. V. Ravindra2
1Department of Mechanical, Vidya Vikas Polytechnic College, Mysore, Karnataka, India 2Department of Mechanical, P.E.S College of Engineering, Mandya, Karnataka, India.
(*E-mail : [email protected])
AbstractIn this article the natural frequency is compared with the analytical and FEM method on an L-structure by inducing the Crack and End mass and the behavior of the structure is studied. The L-structure material is taken as Aluminium with dimension 30x50 mm cross section with length 900and 600 mm. The crack location is varied at 4 different locations in each length of structure withcrack size variations at 6 different progressive levels along with the end mass variations of 0.4, 0.6and 0.8 Kg which is applied on the L-structure. The L-structure which is in inverted position forms2 segments which has cantilever effect on one side but has strong vertical segment base. The resultsobtained when crack is induced along with End mass are equated with no crack and no End masscondition in both Analytical Euler-Bernoulli method and FEM method, later the comparison ismade with the Analytical method results to the FEM results generated using ANSYS software. Inthis comparison study, variations which are absorbed between the results obtained are discussed.Certain points of observed results which are affected are discussed with explanations.
Keywords: Natural frequency, crack size, crack depth, end mass, modal analysis.
9th International Conference on “Advances in Metrology - 2016”
122
P087
Uncertainty Estimation of Metal Determination inAerosols Listed in NAAQS
Sudhanshu Kumar1,2, Shankar G. Aggarwal1,2* and Prabhat K. Gupta2
1Academy of Scientific and Innovative Research (AcSIR), CSIR-National Physical Laboratory,Dr. K. S. Krishnan Road, New Delhi-110012, India
2CSIR-National Physical Laboratory, Dr. K. S. Krishnan Road, New Delhi-110012, India(*E-mail : aggarwalsg@nplindia)
AbstractDetermination of metal/metalloids in particulate matter (PM) samples is an important task. Toxiceffects of some metals have been observed worldwide leading to formulation of guidance formonitoring and regulating their concentrations in the aerosols. Here, we are presenting the uncertaintyinvolved in the determination of metals (e.g. As, Ni and Pb) which are criteria pollutants listed innational ambient air quality standards (NAAQS). The regulatory limits of As, Ni and Pb given inmost of the NAAQS of different countries are very low, e.g., in NAAQS - India it is regulated tobe 6, 20 and 500 ng/m3, respectively. Therefore to assess the air quality in context of these metalpollutions, precise and accurate measurement is very important. The reference analytical techniquesfor metal determination are atomic absorption spectrometry (AAS) and inductively coupled plasma(ICP) spectrometry. ICP- high resolution mass spectrometry (HRMS) is a very sensitive techniqueand can detect trace elements at very low concentration in a given matrix with comparatively loweruncertainty. Analysis of As using ICP-HRMS also does not require hydride generation as it isneeded in AAS, which may add further to the measurement uncertainty. Here we present theuncertainty involved in the determination of As, Ni and Pb using ICP-HRMS. The objective of thiswork is to evaluate whether low concentration of metals in PM matrix can be determined preciselyusing ICP-HRMS. Ambient aerosol particles collected on quartz filters were acid digested andanalyzed in triplicates. Average concentrationsof As, Ni and Pb in spring samples in New Delhi aredetermined to be 3.53±0.95 (range: 2.76–5.78), 11.75±3.48 (range: 7.70–16.49) and 204.9±102.3(range: 80.1 – 359.4) ng/m3, respectively. Expanded uncertainties (at k = 2) associated with As, Niand Pb determination varies between 15 – 22%, 12 – 15% and 12 – 15%, respectively. This studysuggests that major uncertainty components in metal measurements are related to sample digestionfollowed by instrumental determination and filter sampling.
Keywords: As, Ni and Pb measurement with uncertainty, NAAQS metal measurement, ICP-HRMS
9th International Conference on “Advances in Metrology - 2016”
123
P088
Variation in Particle Size Standards within and after Shelf-life Measuredusing Differential Mobility Analyzer
Bighnaraj Sarangi1,2, Shankar G. Aggarwal1,2* and Prabhat K. Gupta2
1Academy of Scientific and Innovative Research (AcSIR), CSIR-National Physical Laboratory,Dr. K. S. Krishnan Road, New Delhi-110012, India
2CSIR-National Physical Laboratory, Dr. K. S. Krishnan Road, New Delhi-110012, India(*E-mail : aggarwalsg@nplindia)
AbstractIn aerosol research, differential mobility analyzer (DMA) is widely used for particle size distributionmeasurements. In general polystyrene latex (PSL) particle size standards are used to calibrate theDMAs. However, these standards are expensive, and their shelf-life is limited. Therefore in thiswork, we have used PSL particle standard of sizes 60 and 100 nm (SRM® 1964 and SRM® 1963a,respectively) and checked their performance within and after the shelf-life period for 3 consecutiveyears (2013 – 2015) using acalibrated DMA (i.e., long-DMA, TSI 3081). Also the size results arecompared using a reference DMA (i.e., nano-DMA, TSI 3085). Using both long- and nano-DMA,the detail results of standard particle size measurements and involved uncertainties are discussedin this paper. We observed a continuous increase in the count mean diameter (CMD) calculatedfrom the size distribution of each standard particle size with the progress of time. Particle sizemeasured for PSL 60 and 100 nm using long-DMA are (56.01±5.05) nm and (92.86±7.11) nm in2013, (56.37±5.01) nm and (93.71±7.09) nm in 2014, and (57.42±5.00) nm and (94.79±7.38) nmin 2015, respectively. Whereas, these results when nano-DMA was used are (56.82±5.07) nm and(94.62±7.27) nm in 2014, and (58.08±4.47) nm and (95.15±7.29) nm in 2015, respectively.Uncertainty results show that the components which contribute significantly in total uncertainty (atk =2) in CMD measurements are DMA transfer function,DMA calibration, CPC counting precision,and DMA inner-electrode voltage. The size measurement results obtained from long-DMA andnano-DMA are agreed well. Based on the measurement results, we suggest that the increasing trendof particle sizes (CMDs) with the progress of time from 2013 to 2015 is possibly because of thecoating of contaminant residues (present in the standard liquid suspension) on the surface of thePSL particles which is further observed by high resolution tunneling electron microscope (HRTEM)imagesof particles.Particles standards are stable and well characterized more than two years evenafter their self-life within the uncertainty limits.Size performance results for PSL 60 nm usingcalibrated long- and reference nano-DMA show good agreement with the size value given in thecertificate, however standard PSL 100 nm size is found to be underestimated by ~7%.
Keywords: Performance check of PSL standards, DMA size measurement, Uncertainty calculation
9th International Conference on “Advances in Metrology - 2016”
124
P089
Resistively Heated Atomic Oven for Single Ion Trap Experiment
S. Panja1*, S. De1, N. Batraa, A. Roy1, C. Samal1, S. Majhi1 and A. Sen Gupta1.
1CSIR-National Physical Laboratory, Dr. K. S. Krishnan Road, New Delhi-110012, India2Academy of scientific & Innovative Research (CSIR Road, Taramani, Chennai-600113, India)
(*E-mail: [email protected])
AbstractIn CSIR-National Physical Laboratory, work in progress about developing one of the most accuratefrequency standards based on an ultra-narrow hyperfine transition of a single trapped ytterbium ion.A Single 171Yb+ ion will be confined and laser cooled within a specially designed radio frequencyion trap,where the tip to tip separation between the two electrodes of the trap is less than 1 mm.The ytterbium ions are produced by photo-ionization of ytterbium atoms and the neutral ytterbiumatoms areproduced by an effusive atomic oven. Low divergent atomic beam focused at the trapcentre is an essential requirement for stable trappingof single ion as any deposition of ytterbiumatoms on the electrodes may create a patch potential and leads to an unstable trapping of ion. Wehave designed and constructed an effusive atomic oven for the production of low divergent andcontrolled atomic beam. The oven has two major components, the first part made of stainless steels(SS) having a needle of inner diameter of ~ 0.5 mm for the emission of atomic beam and the needleis attached to a larger volume SS chamber filled with metallic ytterbium. The second part is aceramic cavity where the SS chamber is push fitted. A nichrome heating coil is wounded aroundthe ceramic cavity for heating the ceramic cavity and eventually heating the atomic oven and resultsinto emission of atomic beam through the SS needle. The temperature of the oven can be controlledby changing the current of the heating coil and flux of the atomic beam can also be controlled.When the atomic beams are coming out of the oven they are collected on a glass plate placeddirectly in front of the needle. The divergence of the atomic beam is measured by measuring thediameter of the atomic beam at different distance from the emission needle. The dependence ofatomic beam divergence on the oven parameters like length and diameter of the needle have alsobeen studied. A new method has been developed for quantifying the atomic flux and its dependenceon the oven temperature.
Keywords: Atomic oven, Single ion trap, Atomic beam
9th International Conference on “Advances in Metrology - 2016”
125
P090
Spectroscopic Investigations on the Adductation of AnticancerDrug Mitoxantrone with tRNA
Shweta Agarwal, Bhumika Ray and Ranjana Mehrotra*
CSIR-National Physical Laboratory, Dr. K. S. Krishnan Road, New Delhi-110012, India (*E-mail : [email protected])
AbstractMitoxantrone (1,4-dihydroxy-5,8-bis [[2-[(2-hydroxy ethyl) amino] ethyl] amino]-9,10-anthracenedione) is a rationally designed antineoplastic agent. It is widely used as a potentchemotherapeutic component in the treatment of various kinds of cancer. Widespread significancefor anticancer agent mitoxantrone has emerged due to its apparent lower risk of cardio-toxic effectswith respect to naturally occurring anthracyclines. In the present study, we have investigated thebinding attributes of mitoxantrone-tRNA complexation at physiological pH using attenuated totalreflection- Fourier transform infrared (ATR-FTIR) spectroscopy, circular dichroism (CD)spectroscopy and UV-Visible absorption spectroscopic techniques. FTIR analysis revealed theinteraction of mitoxantrone with heterocyclic nitrogen base residues of tRNA along with fineexternal binding with phosphate-sugar backbone. In particular, mitoxantrone binds on uracil (C=O)and adenine (C=N) sites on base residues of biomolecule. Circular dichroism spectroscopic resultssuggest that there is no major conformational transition in native A-form of tRNA upon mitoxantrone-tRNA adductation except the intensification in biomolecular secondary structure. The bindingconstant calculated for mitoxantrone-tRNA association was found to be 3.07 x 10³ M-1 indicatingmoderate affinity of drug with tRNA. Investigation of drug-tRNA interaction is an essential partof rational development of RNA targeting chemotherapeutic agents that also delineates structural-functional relations between drug and its target at molecular level.
Keywords: Mitoxantrone, tRNA-drug interaction, FTIR spectroscopy, CD spectroscopy
9th International Conference on “Advances in Metrology - 2016”
126
P091
Hybrid Nano-Biomaterials: an Endeavor to Curtail Constraints inNonlinear Applications
Kaweri Gambhir1,2, Ranjana Mehrotra1,2,* and Parag Sharma1,2
1CSIR-National Physical Laboratory, Dr. K. S. Krishnan Road, New Delhi-110012, India2Academy of Scientific & Innovative Research (AcSIR), CSIR-National Physical Laboratory,
Dr. K. S. Krishnan Road, New Delhi-110012, India (*E-mail : [email protected])
AbstractEfficient manipulation of photonic signals is extremely important for progress in technologies suchas optical communication and computing, dynamic image processing, optical processors, opticalswitches, wavelength filters and modulators. Thus, extensive research efforts have been directedtoward nonlinear optical (NLO) properties of materials. Among a wide range of NLO molecules,biomaterials have gained special interest for many investigators due to their remarkable propertieswhich cannot be easily replicated with conventional organic or inorganic materials in the laboratory.Furthermore, natural biomaterials are a renewable resource and are inherently biodegradable. ThusNano Bio-Photonics has emerged as a promising area of research which exhibits tremendousincrease in its constituent performance and functional opportunities. In order attain an increasedphoton–photon interaction and consequently, the NLO response with a greater tuneability, thispaper presents state-of-the-art fabrication and characterization of advanced hybrid Nano-Bio systemscomposed of a biomolecule exhibiting wavelength dependent field enhancement, nonlinear refractiveindex and optically switchable features for their potential applications in bio inspired engineeringsystems. We studied oligonucleotide as well as polypeptide functionalized nanoparticle assemblies.While the research confirmed generation of high local-field enhancement when excited at theirplasmon resonance.
Keywords: Nonlinear Optical Properties, Nano Bio-Photonics, Optical Switching, local-fieldenhancement
9th International Conference on “Advances in Metrology - 2016”
127
P092
Probing Nucleic Acid (tRNA) Interaction with Anti-cancer Alkaloid
Bhumika Ray and Ranjana Mehrotra*
CSIR-National Physical Laboratory, Dr. K. S. Krishnan Road, New Delhi-110012, India(*E-mail : [email protected])
AbstractFlavopiridol, a semi-synthetic derivative of rohitukine, has attained much attention owing to itsanticancer potential against various hematological malignancies and solid tumors in vitro and invivo. This work focuses towards understanding the interaction mechanism of flavopiridol withtRNA at molecular level. Various spectroscopic techniques such as attenuated total reflectance-Fourier transform infrared (ATR-FTIR) spectroscopy, circular dichroism (CD) and absorptionspectroscopy have been utilized to define direct influence of flavopiridol on the structural andconformational aspects of RNA. Vibrational spectroscopic techniques were employed to characterizethe binding of flavopiridol with tRNA. CD spectroscopy provided information on conformationaltransitions in tRNA associated with its complexation with flavopiridol. The other binding parameterssuch as binding mode, strength and stability were determined using UV-visible spectroscopy. Theoutcomes of this investigation will provide comprehensive understanding on the interaction offlavopiridol with nucleic acid and reinforces the capability of spectroscopic methods in decipheringthe action mechanism of small nucleic acid binding molecules. It can further helpful in probing thecyotoxicity induced by flavopiridol and in rational designing of more RNA targeted chemotherapeuticagents.
Keywords: Flavopiridol; Drug-tRNA interaction; CD spectroscopy; ATR-FTIR spectroscopy
9th International Conference on “Advances in Metrology - 2016”
128
P093
A Novel Methodology for Simulations in Metrology using Axioms
M. Arif Sanjid1*, Sanjay Yadav1, Sanjoy Ghoshal2 and K. P. Chaudhary1
1CSIR-National Physical Laboratory, Dr. K. S. Krishnan Road, New Delhi-110012, India2Indian School of Mines, Dhanbad.
(*E-mail: [email protected])
AbstractAxiomatization is a process of setting mathematical rules from linguistic understanding of realworld processes and phenomenon. Axiomatic basis is constituted by assertions, logical operationsand the resultant theorems. Simulations are derived from the axiomatic basis. Simulations havequalitative matrices of summarized assertions, assumptions and boundary conditions. A givenproblem e.g. external cylindrical diameter measurement can be measured using coordinatemeasurement, floating carriage methods. The uncertainty of measurement of these methods is 170nm at NPL-India. Diameter measurement is simulated for these two different methods. Unfortunately,the qualitative matrices of these simulations cannot be mathematically operated. Gödel’s theoremstates that no physical system can be simulated both complete - consistent.
A novel methodology is devised to quantize the axiomatic basis of simulations in metrology. Thismethod also circumvents the Gödel’s inconsistency - incompleteness impasse of simulations throughthree tier recursive querying. In the proposed method, the constituents of simulations are examinedfor 1) consistency 2) completeness 3) context sequentially. During three stages, the simulations arerecursive queried to quantize the axioms in to matrices. Thus, the mathematically operative matricesof simulations are derived.
The two simulations are compared using their respective matrices. An optimized diametermeasurement method is simulated with an inference of the above simulations. The simulation isrealized to achieve an improved uncertainty of measurement of the order of 90 nm.
Keyword: Metrology, axiom, simulations, uncertainty of measurement, calibration.
9th International Conference on “Advances in Metrology - 2016”
129
P094
Calibration of Dial Testers using Laser Interferometer atCSIR-NPL, India
M Arif Sanjid* and K. P. Chaudhary
CSIR-National Physical Laboratory, Dr. K. S. Krishnan Road, New Delhi-110012, India(*E-mail : [email protected])
AbstractDial gauges are extensively used in engineering industry to measure displacement. Digital dialgauge are popular for their digital display and improved resolution below 0.5 µm. dial gauges arecalibrated using dial testers. Commercially, various versions of dial testers are available up to 100mm measuring range. The least count of dial testers ranges from 0.01 µm (electronic read out) to0.2 µm (mechanical read out). Dial testers may be categorized as mechanical version, electronicversion, with rotating or non-rotating spindle.
Conventionally, dial tester calibration is carried out using electronic LVDT probe in conjunctionwith reference gauge blocks. Different sizes of gauge blocks are wrung between anvils of LDVTprobe - dial tester to determine the error at each graduation of dial tester. In this laborious processgauge blocks deteriorates. Because of continuous human intervention, the repeatability in thismethod is limits to 0.2 µm or sometimes even worse. The uncertainty of measurement will beapproximately 0.3 µm + 1.1×10⁻⁶ × L m. Here L represents the value of graduation of dial testerin metre.
At NPL-India, a new calibration method is devised using displacement laser interferometer (LI) fordifferent types of dial testers. The retro-reflector of LI is directly mounted on the non-rotatingspindle of dial tester to perform the calibration. In case of rotating spindle, the interferometer willbe misaligned when spindle rotates and LI will cease to work. A plunger mechanism of 50 mm longstock is fabricated using an abandoned precision dial gauge. This mechanism is mounted on dialtester above its anvil. The plunger transfers only translation movement of anvil of dial tester.Different dial testers are calibrated by either of this arrangement. The systematic error due tomisalignment of laser is determined using gauge blocks, LVDT probe and this error is compensated.Various error components involved in these calibrations are identified to estimate uncertaintybudget. An improved uncertainty of measurement 0.12 µm + 0.6×10⁻⁶ × L m is achieved.
Keywords: Dial Tester, Laser interferometer, Rotating spindle, Uncertainty measurement.
9th International Conference on “Advances in Metrology - 2016”
130
P095
Study of Effect of Eccentricity and Pyramidal Error ofthe Polygon Calibration
M Arif Sanjid*, Ankur Gupta and K.P. Chaudhary
CSIR-National Physical Laboratory, Dr. K. S. Krishnan Road, New Delhi-110012, India(*E-mail : [email protected])
Abstract
In order to realize the high precision measurement of encoder accuracy, the principle and methodto measure encoder accuracy by using polyhedron and autocollimator are introduced. The polyhedroncoordinate system and autocollimator measurement coordinate system are established, and theprecise mathematical model is established, which is relation with the measurement error of theencoder accuracy and pyramidal error. The simulation results show that the encoder shaft tilt angleand tilt direction will affect the measurement results of the encoder accuracy. Measurement errorof encoder accuracy increases with encoder shaft tilt angle, and approximately proportional to thesquare. Measurement error of encoder accuracy changes with encoder shaft tilt direction. Whenencoder shaft tilt direction is 0° or 180°, measurement error is the smallest; When encoder shafttilt direction is 90° or 270°, measurement error is the maximum. As encoder shaft tilt angle is 5?,the measurement errors can reach 0.11?~0.48?, which cannot be ignored for encoder with 1~3levels of precision grade. Pyramidal error should be cotrolled in the appropriate range based on theprecision grade of measured encoder. Specific requirements on pyramidal error are given forencoders with different precision grades. ©, 2015, Chinese Optical Society. All right reserved
Keywords: Dial Tester, Laser interferometer, Rotating spindle, Uncertainty measurement.
9th International Conference on “Advances in Metrology - 2016”
131
P096
A New Twin Post Pressure Balance Type HydraulicDifferential Pressure Standard
Sanjay Yadav*, Raman Kumar Sharma, Lalit Kumar and Afaqul Zafer
CSIR-National Physical Laboratory, Dr. K. S. Krishnan Road, New Delhi-110012, India(*Email: syadav@ nplindia.org)
AbstractThe differential pressure (p) is measured either between two points on independent systems orbetween two different points on the same system. One of the main uses of differential pressuresensor is to measure the difference in fluid or gas pressure across a restriction in a pipe. It is aknown fact that the accuracy of the differential pressure transducers / transmitters is greatlydependent on static or line pressure. Still most of the laboratories perform calibration keeping oneport of the differential pressure transducers / transmitters to an atmospheric pressure. One of themain reasons for this is that the calibration at high static pressures is very expensive and complexoperations. In order to address this problem, a new twin post pressure balance type hydraulicdifferential pressure standard is established for the calibration of differential pressure gauges andpressure transducers / transmitters. The system is capable to provide traceable calibration serviceto users and industries in the differential pressure range (0 - 50) MPa at high line / static pressurefrom (0.2 - 50) MPa having measurement uncertainty better than 100 ppm. This paper also describesthe studies carried out on a differential pressure transducer in the differential pressure range (0 -2) MPa at static pressure of (0, 0.2, 10, 20, 30, 40 and 50) MPa. It is clearly observed from thestudies that calibration factor shifts with increase in static pressure. It is also observed that the zeropressure value of the device under test reduces with increase in static pressure.
Keywords: Uncertainty, differential pressure, static pressure, twin post pressure balance
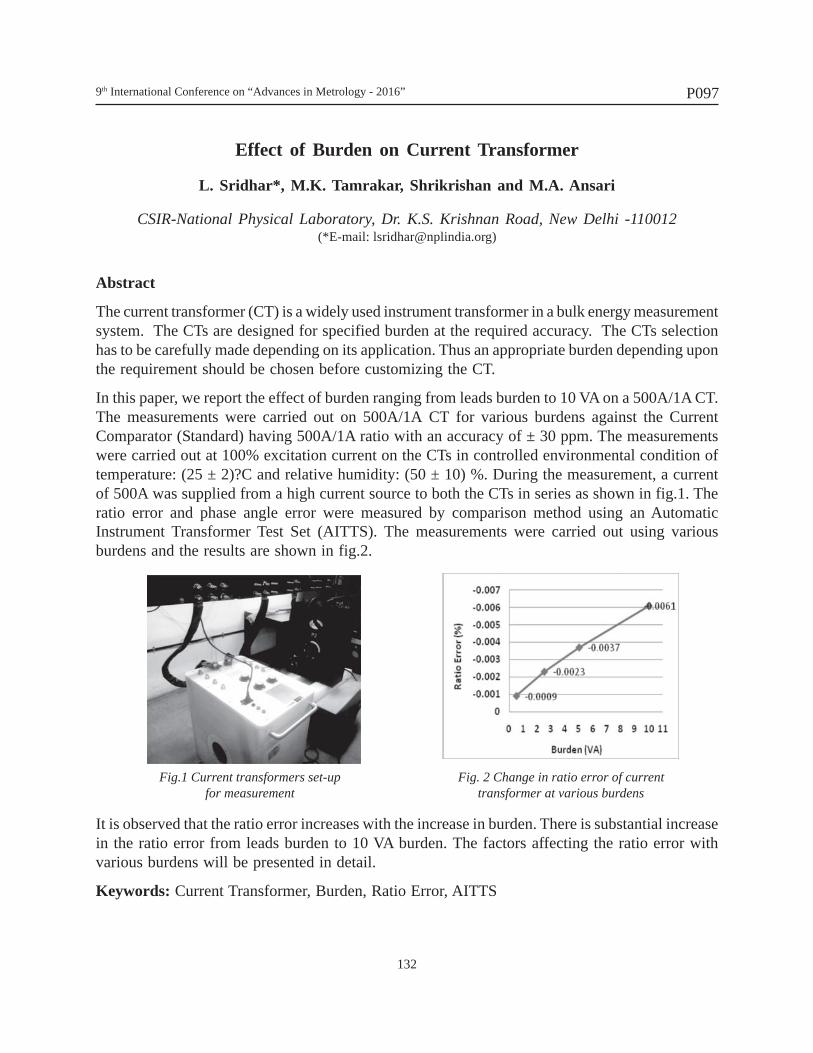
9th International Conference on “Advances in Metrology - 2016”
132
P097
Effect of Burden on Current Transformer
L. Sridhar*, M.K. Tamrakar, Shrikrishan and M.A. Ansari
CSIR-National Physical Laboratory, Dr. K.S. Krishnan Road, New Delhi -110012(*E-mail: [email protected])
Abstract
The current transformer (CT) is a widely used instrument transformer in a bulk energy measurementsystem. The CTs are designed for specified burden at the required accuracy. The CTs selectionhas to be carefully made depending on its application. Thus an appropriate burden depending uponthe requirement should be chosen before customizing the CT.
In this paper, we report the effect of burden ranging from leads burden to 10 VA on a 500A/1A CT.The measurements were carried out on 500A/1A CT for various burdens against the CurrentComparator (Standard) having 500A/1A ratio with an accuracy of ± 30 ppm. The measurementswere carried out at 100% excitation current on the CTs in controlled environmental condition oftemperature: (25 ± 2)?C and relative humidity: (50 ± 10) %. During the measurement, a currentof 500A was supplied from a high current source to both the CTs in series as shown in fig.1. Theratio error and phase angle error were measured by comparison method using an AutomaticInstrument Transformer Test Set (AITTS). The measurements were carried out using variousburdens and the results are shown in fig.2.
Fig. 2 Change in ratio error of currenttransformer at various burdens
Fig.1 Current transformers set-upfor measurement
It is observed that the ratio error increases with the increase in burden. There is substantial increasein the ratio error from leads burden to 10 VA burden. The factors affecting the ratio error withvarious burdens will be presented in detail.
Keywords: Current Transformer, Burden, Ratio Error, AITTS
9th International Conference on “Advances in Metrology - 2016”
133
P098
Measurement of the Gravity Induced Distortions on theSatellite Reflectors during CATF testing
Pravesh Mathur, Swapnil Pathak, C K Rao, Shreeniwas Sahu,N S Sundaram and V K Hariharan
ISRO Satellite Centre, Bangalore(E-mail : [email protected])
AbstractDuring the CATF testing of a satellite, the reflectors are deployed using simulated zero g setup. Tosimulate the in orbit conditions, gravity forces acting on the reflector have to be compensated. Thisis done usually by giving 0–g backup support for carrying out antenna characterisation. Duringthese tests, the antenna along with S/c is rotated about the mounting axis in elevation for variousscan angles. During this elevated antenna condition, there is a possibility that the reflector may getdeformed due to components of gravity forces acting on the reflector and the backup support. Thisis quantified by taking CRP measurements of the antenna w r t SCCS for various scan angles. Therelative distortion (angular) between the back up support and the reflectors can be derived usingtransformation equations. These bias/angular distortions are adjusted from the reflector pointing/coverage plots after the patterns measurements. This paper includes the methodology of themeasurement process, the challenges faced during measurements and the results for a typicalspacecraft.
Keywords: CATF, CRP, SCCS, Gravity Induced Distortion
9th International Conference on “Advances in Metrology - 2016”
134
P099
Importance of Temperature Suitability Test in Calibrationof Domestic Water Flow Meters
I.S. Taak, Chatar Singh, A. Wahid and S.K. Jaiswal
CSIR-National Physical Laboratory, Dr. K. S. Krishnan Road, New Delhi-110012, India(*E-mail : [email protected])
AbstractThe CSIR – National Physical Laboratory India New Delhi is the premear research and developmentorganization in India to maintain upgrade and desseminate the units of measurements like mass,temperature,time current etc. CSIR – National Physical Laboratory has also Fluid Flow Measurementfacility to realize, upgrade and desseminate the units of Flow Measurement.
While calibrating flow meters, the water temperature variation within the temperature range specifiedmust not adversly affect the material used in the construction of the water meter it should not affectthe potability of water. When the laboratory carring out calibration at National level, it is necessarythat the temperature of the liquid (water) does not change more than 1p C in one hour as thetemperature variation at new Delhi are quite high and touches extream both in summer as well asin winter for carring out the temperature suitability test the meter under test are immersed in waterbath having constant temperature 45p C ±1p C for 10 hours and is then kept out and kept for sometime in the open accalonatize it at the embient temperature. The meter is then again going for theaccuracy test , if it is deemed satisfy the performance after the temperature suitability test satisfythe requirements, the test equipment consists of a constant temperature water bath of about 25 Lts.Capacity housed in an insulated box is equiped with an electrical heater of 1.5 kw controlled bya microprocessor bassed temperature controller to maintain constant temperature of water within±1p C, the bath has enough space to accomodate more than 10 meters at a time (size 15 mm, 20mm,25 mm) and 2 meters of (sizes 40 mm & 50 mm dia) at a time for testing.
Keywords: Water Flow meter, Calibration, Flow measurement
9th International Conference on “Advances in Metrology - 2016”
135
P100
Study of Oxaliplatin Interaction with ctDNA Duplex by usingSpectroscopic Techniques
Bhumika Gupta, Bhumika Ray, Shweta Agarwaland Ranjana Mehrotra*
CSIR-National Physical Laboratory, Dr. K. S. Krishnan Road, New Delhi-110012, India(*E-mail : [email protected])
AbstractOxaliplatin is the first platinum-based anticancer drug to be approved for the treatment of colorectalcancer, a major cause of cancer deaths worldwide. It is an alkylating agent, which contains platinumcomplexed to oxalate and diaminocyclohexane (DACH). Like other platinum compounds, oxaliplatininhibits DNA replication and transcription through the formation of intra- and interstrand DNAadducts. In the present study, the binding properties of oxaliplatin with calf thymus DNA (ctDNA)was investigated using FTIR spectroscopy, circular dichroism and ultraviolet visible (UV-vis)spectroscopy. FTIR spectroscopy serves as an effective method for analyzing molecular structureas well as their confirmation. Binding sites and sequence specificity can also be determined byusing this technique. Circular dichroism (CD) spectroscopy is a valuable technique to explore non-covalent drug-DNA interactions where subtle conformational changes due to complex formationbetween the ctDNA and oxaliplatin can also be observed. While ultraviolet visible (UV-vis)spectroscopy can provide the binding strength of the interaction. The results obtained from thestudy are encouraging and suggests base binding of oxaliplatin with DNA. The proposed analysisof DNA-drug interaction studies can provide the better understanding of binding mechanism whichcan be applied in the process of rational drug development, possessing better efficacy and potentialbinding with biomolecules.
Keywords: Oxaliplatin, DNA-drug interaction, FTIR spectroscopy, UV-vis spectroscopy,Circular Dichroism
9th International Conference on “Advances in Metrology - 2016”
136
P101
Effect of Pressure on the Two Plates of Ultrasonic Sandwich Transducerfor Ultrasonic Cleaning and NDT Applications
Yudhisther Kumar Yadav* and Reeta Gupta
CSIR-National Physical Laboratory, Dr. K. S. Krishnan Road, New Delhi-110012, India (*E-mail : [email protected])
AbstractSandwich type of ultrasonic transducers is used in ultrasonic high power applications like ultrasoniccleaning, levitation, emulsifiers and ultrasonic NDT. In this sandwich type transducer piezoelectricelement are sandwiched by tightening the bolts through multiple rings or disc of ceramics. Presentwork reports results on measurement of impedance and conductance of PZT element at varyingfrequency at different pressures. Work will help to ensure and to determine nominal pressure atwhich these transducers offer maximum electro-acoustic efficiency, low heat generation and providemaximum amplitude at desired working frequency. A piezoelectric ceramic PZT-5 disc in ringshape with thickness 6 mm, inner diameter 9 mm and outer diameter of 23 mm is taken formeasurements. PZT Ring is sandwiched by two metal washer and acoustic absorbers near toelement through nut bolt. Pressure is varied by providing different torque on bolt. Impedance andconductance measurements for various frequencies in range 5 to 400 KHz at different pressures ismade using the Wayne Kerr- 6540A Precision Impedance Analyzer (1 KHz -120 MHz). Fundamentaland harmonic frequencies are clearly observed at various pressures. At higher pressures the efficiencyreduced and amplitude becomes negligible. Results will be helpful in designing the high powerultrasonic transducers for ultrasonic cleaning and NDT applications.
Keywords: Ultrasonic transducer, Sandwich transducer, Ultrasonic cleaner, NDT
9th International Conference on “Advances in Metrology - 2016”
137
P102
Optical Setup for Laser cooling, Launching andDetection of Cesium Atoms
Ashish Agarwal1*, Poonam Arora1, Aishik Acharya1 and A Sengupta2
1CSIR-National Physical Laboratory, Dr. K. S. Krishnan Road, New Delhi-110012, India2The North Cap University, HUDA Sector 23-A, Gurgaon – 122017
(*E-mail : [email protected])
AbstractNarrow linewidth lasers are routinely used for cooling, manipulation and detection of atoms [1].We use a narrow linewidth laser whose frequency is 351 THz to perform saturated absorptionspectroscopy and resolve peaks separated by few MHz. The cavity length and diode current of thelaser can be locked to get the desired laser frequency. The laser locking is implemented in thelaboratory to a frequency corresponding to the hyperfine transition in a cesium atom. The laserfrequency can be changed and controlled by an acousto-optic modulator within few tens of MHz.The ultra-fast frequency control allows polarisation gradient cooling of atoms, launching of atomsand also to drive light frequency out of atomic resonance to reduce light shift of energy levels. Wehave implemented such an optical setup for Cesium Fountain Frequency Standard, India Cs-F1 [2].For Cs-F2, an Interference filter-stabilized external cavity based diode laser is being implementedfor atom manipulation and control. The laser consists of very narrowband, low loss interferencefilter instead of diffraction grating for wavelength selection, and an output coupler to generate thefeedback. The optical set of Cs-F2 will be presented and compared with that of India Cs-F1. Thedesign of home-made beam expander producing laser beam for atom control and detection will alsobe presented.
[1] Frequency and Intensity Control of Lasers to Cool and Control Caesium Atoms, AshishAgarwal and A. Sen Gupta, MAPAN-Journal of Metrology Society of India; 27 (2012) p169,DOI:10.1007/s12647-012-0026-9
[2] Development of cesium fountain frequency standard at the National Physical Laboratory,India; A. Sengupta, Ashish Agarwal, P. Arora and K. Pant, Current Science 100 (2011) 1393.
Keywords: Atom manipulation; Cooling and trapping of atoms; Frequency standards; Diodelasers
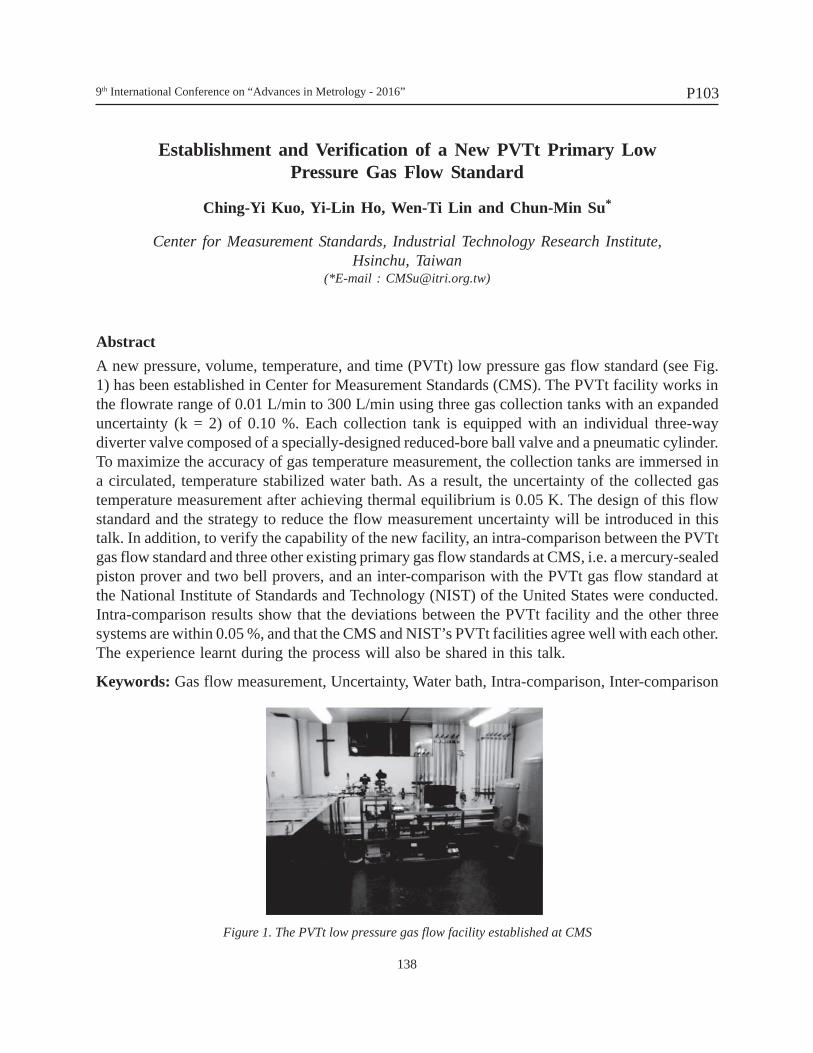
9th International Conference on “Advances in Metrology - 2016”
138
P103
Establishment and Verification of a New PVTt Primary LowPressure Gas Flow Standard
Ching-Yi Kuo, Yi-Lin Ho, Wen-Ti Lin and Chun-Min Su*
Center for Measurement Standards, Industrial Technology Research Institute,Hsinchu, Taiwan
(*E-mail : [email protected])
AbstractA new pressure, volume, temperature, and time (PVTt) low pressure gas flow standard (see Fig.1) has been established in Center for Measurement Standards (CMS). The PVTt facility works inthe flowrate range of 0.01 L/min to 300 L/min using three gas collection tanks with an expandeduncertainty (k = 2) of 0.10 %. Each collection tank is equipped with an individual three-waydiverter valve composed of a specially-designed reduced-bore ball valve and a pneumatic cylinder.To maximize the accuracy of gas temperature measurement, the collection tanks are immersed ina circulated, temperature stabilized water bath. As a result, the uncertainty of the collected gastemperature measurement after achieving thermal equilibrium is 0.05 K. The design of this flowstandard and the strategy to reduce the flow measurement uncertainty will be introduced in thistalk. In addition, to verify the capability of the new facility, an intra-comparison between the PVTtgas flow standard and three other existing primary gas flow standards at CMS, i.e. a mercury-sealedpiston prover and two bell provers, and an inter-comparison with the PVTt gas flow standard atthe National Institute of Standards and Technology (NIST) of the United States were conducted.Intra-comparison results show that the deviations between the PVTt facility and the other threesystems are within 0.05 %, and that the CMS and NIST’s PVTt facilities agree well with each other.The experience learnt during the process will also be shared in this talk.
Keywords: Gas flow measurement, Uncertainty, Water bath, Intra-comparison, Inter-comparison
Figure 1. The PVTt low pressure gas flow facility established at CMS
9th International Conference on “Advances in Metrology - 2016”
139
P104
Functionalized Cobalt Ferrite Nanoparticles for Removal of PathogenicBacteria: A Potential Material for Diagnostic Applications
Raghvendra A Bohara* and Shivaji H Pawar
Centre for Interdisciplinary ResearchD.Y. Patil University, Kolhapur (M.S.), India
(E-mail : [email protected])
AbstractThe present investigation deals with the synthesis and characterization of functionalized cobaltferrite nanoparticles for removal of pathogenic bacteria. The synthesized material reveals highsuperparamagnetic property and size ranging in ~5-6 nm. The functionalized MNPs are usedwithout the need of any further modifications with affinity biomolecules. The high surface area offunctionalized cobalt ferrite nanoparticles provides a promising and sophisticated platform fordetection of bacteria. The amine groups present on the surface functionalized cobalt ferritenanoparticles are robust and inexpensive ligands to ensure a high binding affinity for Gram-positive and Gram-negative bacteria. The functionalized cobalt ferrite nanoparticles allow rapidremoval of bacteria from water samples with high efficiency. These functionalized MNPs areattractive avenues for capturing a wide range of bacteria and will plays vital role in diagnosticapplications.
Keywords: Ferrite nanoparticles, Bacteria, Diagnostic applications
9th International Conference on “Advances in Metrology - 2016”
140
P105
Uncertainty Analysis of Developed ANN and ANFIS Models inPrediction of Daily Atmospheric Boundary Layer Height
Kirti Soni1, Naveen Garg1, Kulwinder Singh Parmar2 and Nishant Kumar3
1CSIR-National Physical Laboratory, Dr. K. S. Krishnan Road, New Delhi-110012, India2Dr. B. R. Ambedkar National Institute of Technology Jalandhar, India
3Thapar University, Patiala (Punjab)(E-mail : [email protected])
AbstractThis study aims to predict daily atmospheric boundary layer (ABL) height in the atmosphere ofDelhi by means of developed artificial neural network (ANN) and adaptive neuro-fuzzy inferencesystem (ANFIS) models. Forward selection (FS) and Gamma test (GT) methods are used forselecting input variables and developing hybrid models with ANN and ANFIS. From 9 inputcandidates are selected using FS and GT respectively. Evaluation of developed hybrid models andits comparison with ANN and ANFIS models fed with all input variables shows that both FS andGT techniques reduce not only the output error, but also computational cost due to less inputs.Finally, uncertainty analysis is carried out for FS-ANN and FS-ANFIS models.
Keywords: Forecasting, Mixing Height, Artificial Neural Network (ANN), AdaptiveNeuro-Fuzzy Inference System (ANFIS)
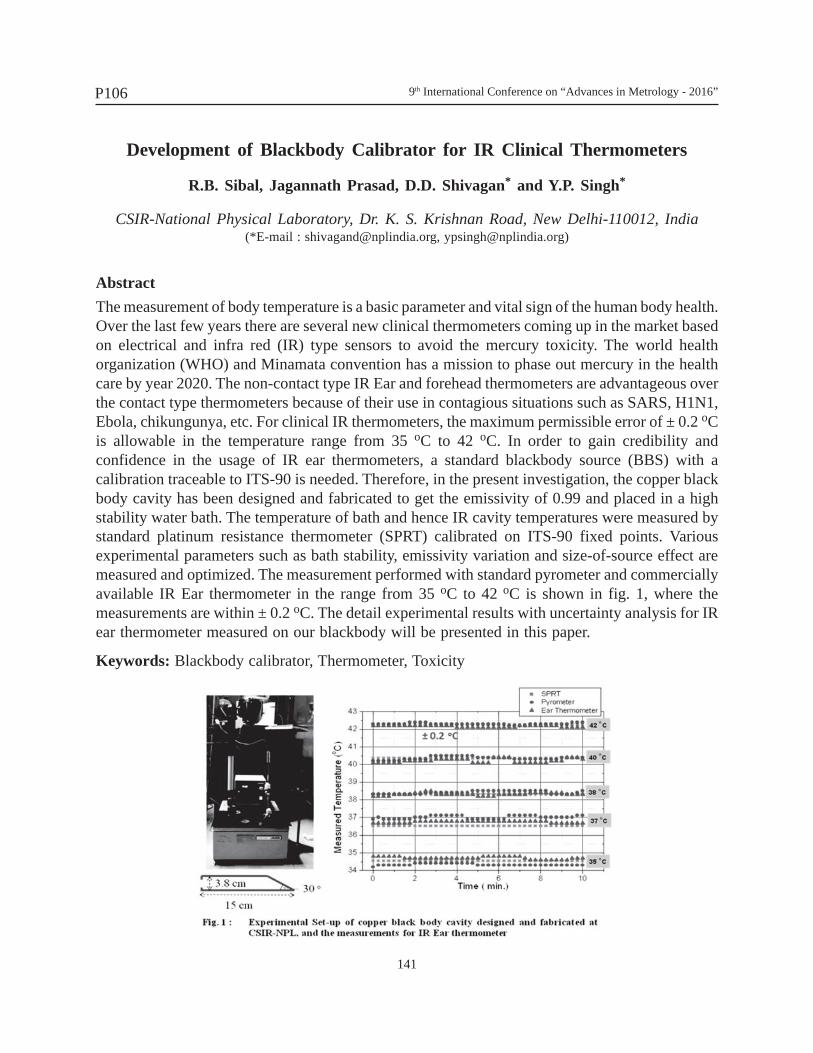
9th International Conference on “Advances in Metrology - 2016”
141
P106
Development of Blackbody Calibrator for IR Clinical Thermometers
R.B. Sibal, Jagannath Prasad, D.D. Shivagan* and Y.P. Singh*
CSIR-National Physical Laboratory, Dr. K. S. Krishnan Road, New Delhi-110012, India(*E-mail : [email protected], [email protected])
AbstractThe measurement of body temperature is a basic parameter and vital sign of the human body health.Over the last few years there are several new clinical thermometers coming up in the market basedon electrical and infra red (IR) type sensors to avoid the mercury toxicity. The world healthorganization (WHO) and Minamata convention has a mission to phase out mercury in the healthcare by year 2020. The non-contact type IR Ear and forehead thermometers are advantageous overthe contact type thermometers because of their use in contagious situations such as SARS, H1N1,Ebola, chikungunya, etc. For clinical IR thermometers, the maximum permissible error of ± 0.2 oCis allowable in the temperature range from 35 oC to 42 oC. In order to gain credibility andconfidence in the usage of IR ear thermometers, a standard blackbody source (BBS) with acalibration traceable to ITS-90 is needed. Therefore, in the present investigation, the copper blackbody cavity has been designed and fabricated to get the emissivity of 0.99 and placed in a highstability water bath. The temperature of bath and hence IR cavity temperatures were measured bystandard platinum resistance thermometer (SPRT) calibrated on ITS-90 fixed points. Variousexperimental parameters such as bath stability, emissivity variation and size-of-source effect aremeasured and optimized. The measurement performed with standard pyrometer and commerciallyavailable IR Ear thermometer in the range from 35 oC to 42 oC is shown in fig. 1, where themeasurements are within ± 0.2 oC. The detail experimental results with uncertainty analysis for IRear thermometer measured on our blackbody will be presented in this paper.
Keywords: Blackbody calibrator, Thermometer, Toxicity
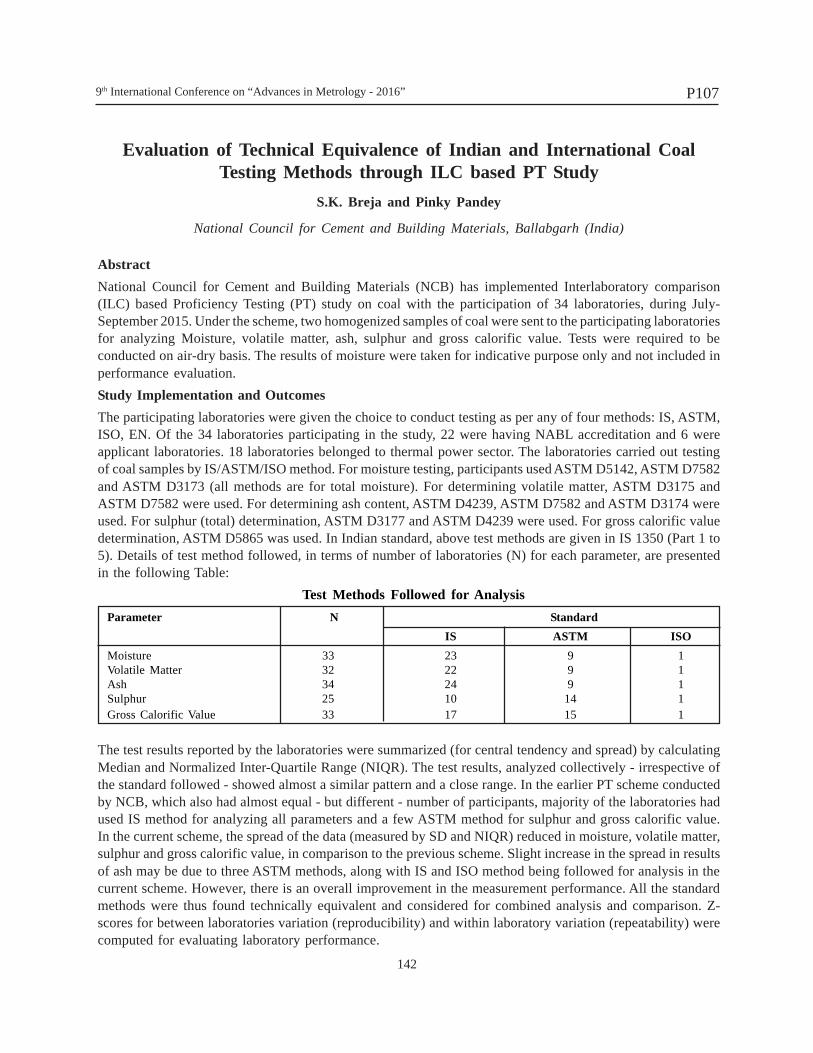
9th International Conference on “Advances in Metrology - 2016”
142
P107
Evaluation of Technical Equivalence of Indian and International CoalTesting Methods through ILC based PT Study
S.K. Breja and Pinky Pandey
National Council for Cement and Building Materials, Ballabgarh (India)
AbstractNational Council for Cement and Building Materials (NCB) has implemented Interlaboratory comparison(ILC) based Proficiency Testing (PT) study on coal with the participation of 34 laboratories, during July-September 2015. Under the scheme, two homogenized samples of coal were sent to the participating laboratoriesfor analyzing Moisture, volatile matter, ash, sulphur and gross calorific value. Tests were required to beconducted on air-dry basis. The results of moisture were taken for indicative purpose only and not included inperformance evaluation.Study Implementation and OutcomesThe participating laboratories were given the choice to conduct testing as per any of four methods: IS, ASTM,ISO, EN. Of the 34 laboratories participating in the study, 22 were having NABL accreditation and 6 wereapplicant laboratories. 18 laboratories belonged to thermal power sector. The laboratories carried out testingof coal samples by IS/ASTM/ISO method. For moisture testing, participants used ASTM D5142, ASTM D7582and ASTM D3173 (all methods are for total moisture). For determining volatile matter, ASTM D3175 andASTM D7582 were used. For determining ash content, ASTM D4239, ASTM D7582 and ASTM D3174 wereused. For sulphur (total) determination, ASTM D3177 and ASTM D4239 were used. For gross calorific valuedetermination, ASTM D5865 was used. In Indian standard, above test methods are given in IS 1350 (Part 1 to5). Details of test method followed, in terms of number of laboratories (N) for each parameter, are presentedin the following Table:
The test results reported by the laboratories were summarized (for central tendency and spread) by calculatingMedian and Normalized Inter-Quartile Range (NIQR). The test results, analyzed collectively - irrespective ofthe standard followed - showed almost a similar pattern and a close range. In the earlier PT scheme conductedby NCB, which also had almost equal - but different - number of participants, majority of the laboratories hadused IS method for analyzing all parameters and a few ASTM method for sulphur and gross calorific value.In the current scheme, the spread of the data (measured by SD and NIQR) reduced in moisture, volatile matter,sulphur and gross calorific value, in comparison to the previous scheme. Slight increase in the spread in resultsof ash may be due to three ASTM methods, along with IS and ISO method being followed for analysis in thecurrent scheme. However, there is an overall improvement in the measurement performance. All the standardmethods were thus found technically equivalent and considered for combined analysis and comparison. Z-scores for between laboratories variation (reproducibility) and within laboratory variation (repeatability) werecomputed for evaluating laboratory performance.
Test Methods Followed for AnalysisParameter N Standard
IS ASTM ISOMoisture 33 23 9 1Volatile Matter 32 22 9 1Ash 34 24 9 1Sulphur 25 10 14 1Gross Calorific Value 33 17 15 1
9th International Conference on “Advances in Metrology - 2016”
143
P108
Challenges in Metrology of Density Functional Theory
Archana Tripathi and Prapti Bajaj*
Gargi College, University of Delhi, Physics Department, New Delhi-110049, India(*E-mail: [email protected])
AbstractDensity Functional Theory is one of the most crucial and recent theories that promise to relatequantum physics with astrophysics with practical applications in all the fields of life. So far, ithas helped us to calculate the temperature of molten iron in Earth and its subsequent conditions,study the potential energy surface of transition metal complexes, inorganic spectroscopy, vibrationalspectroscopy, and to understand a plethora of other molecular dynamics and energetic. However,a major loophole in this theory is the complicated and cumbersome solution of the densityfunctional equations. These calculations require the usage of massive computers with multipleother highly expensive equipments for precision of calculation. This is also the reason for thevery slow advancement of this highly useful theory. This paper shall endeavor to introduce thesemetrological problems faced while working on Density Functional Theory and shall also give abasic introduction to this theory.
Keywords: Quantum Standards and Metrology, Density Functional Theory, Challenges inMetrology
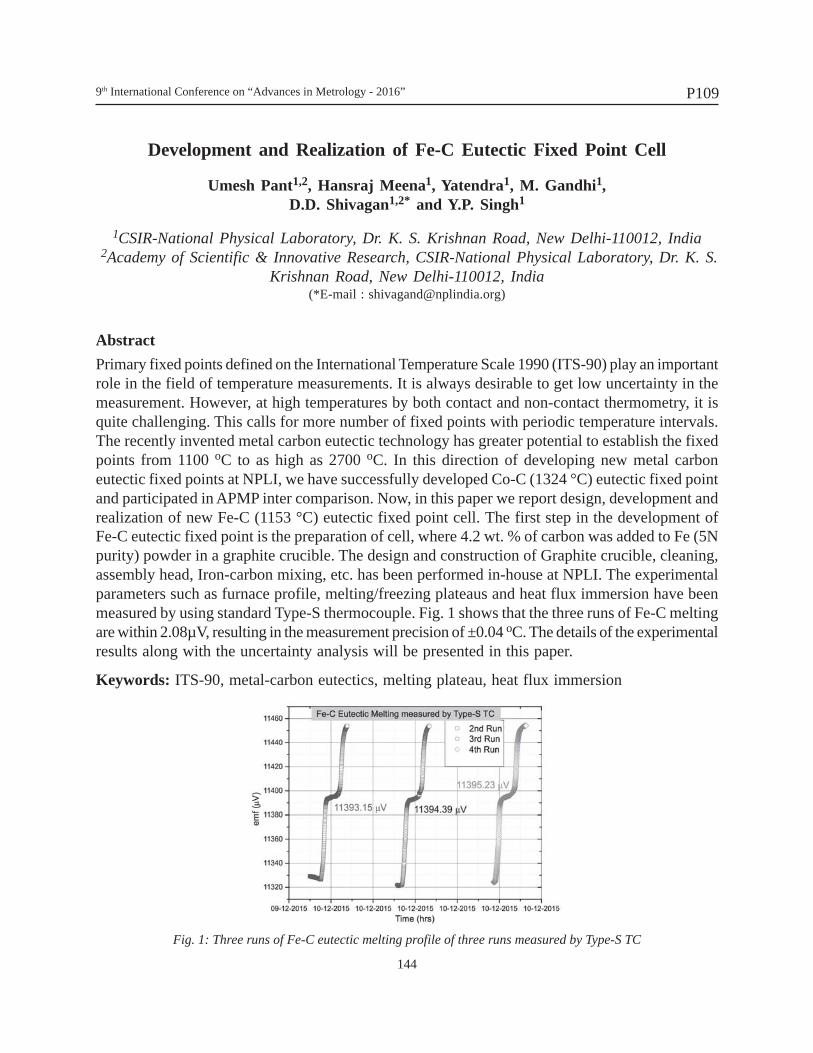
9th International Conference on “Advances in Metrology - 2016”
144
P109
Development and Realization of Fe-C Eutectic Fixed Point Cell
Umesh Pant1,2, Hansraj Meena1, Yatendra1, M. Gandhi1,D.D. Shivagan1,2* and Y.P. Singh1
1CSIR-National Physical Laboratory, Dr. K. S. Krishnan Road, New Delhi-110012, India 2Academy of Scientific & Innovative Research, CSIR-National Physical Laboratory, Dr. K. S.
Krishnan Road, New Delhi-110012, India(*E-mail : [email protected])
AbstractPrimary fixed points defined on the International Temperature Scale 1990 (ITS-90) play an importantrole in the field of temperature measurements. It is always desirable to get low uncertainty in themeasurement. However, at high temperatures by both contact and non-contact thermometry, it isquite challenging. This calls for more number of fixed points with periodic temperature intervals.The recently invented metal carbon eutectic technology has greater potential to establish the fixedpoints from 1100 oC to as high as 2700 oC. In this direction of developing new metal carboneutectic fixed points at NPLI, we have successfully developed Co-C (1324 °C) eutectic fixed pointand participated in APMP inter comparison. Now, in this paper we report design, development andrealization of new Fe-C (1153 °C) eutectic fixed point cell. The first step in the development ofFe-C eutectic fixed point is the preparation of cell, where 4.2 wt. % of carbon was added to Fe (5Npurity) powder in a graphite crucible. The design and construction of Graphite crucible, cleaning,assembly head, Iron-carbon mixing, etc. has been performed in-house at NPLI. The experimentalparameters such as furnace profile, melting/freezing plateaus and heat flux immersion have beenmeasured by using standard Type-S thermocouple. Fig. 1 shows that the three runs of Fe-C meltingare within 2.08µV, resulting in the measurement precision of ±0.04 oC. The details of the experimentalresults along with the uncertainty analysis will be presented in this paper.
Keywords: ITS-90, metal-carbon eutectics, melting plateau, heat flux immersion
Fig. 1: Three runs of Fe-C eutectic melting profile of three runs measured by Type-S TC
9th International Conference on “Advances in Metrology - 2016”
145
P110
Muscle Force Measurement from SEMG Signals for Exoskeleton Devices
Inderjeet Singh Dhindsa1, Ravinder Agarwal1* and Hardeep Singh Ryait2
1Electrical and Instrumentation Engineering Dept., Thapar University, Patiala, India2Electronic and Communication Engg Dept. BBSBEC, Fatehgarh Sahib, Punjab, India
(*E-mail : [email protected])
AbstractExoskeletons for human performance enhancement are wearable devices and machines that canincrease the speed, strength and endurance of the operator. Many of the new proposed exoskeletonpredicted the motion intent from EMG signals. The main advantage of EMG based exoskeletonsis the ability to estimate the forces that will be generated by the muscles before the actual occurrenceof mechanical contractions. This information is fed into the exoskeleton system such that by thetime the physiological muscles contract the exoskeleton amplifies the joint moment by a preselectedgain factor, resulting in a decrease in the reaction time of the human/machine system. In this paperthe active force developed in the leg muscles is predicted from the EMG signals obtained from thefour muscles of human lower limb while carrying out a task of standing to sitting. The predictedforces are then compared with inverse dynamic analysis of musculoskeletal model in AnyBodymodelling system.
A subject of height 180 cm and weight 105 kg was made to perform trials of standing to sittingin squat position. sEMG signals from four muscles Vastus Medialis (VM), Vastus Intermedius(VIM), Rectus Femoris (RF) and Gluteus Medius (GMEDA) were recorded using BioTrace+software and NeXus-10 biofeedback system at a sampling frequency of 2048Hz. The EMG signalswere then exported to MATLAB for evaluation. The raw sEMG signals were processed to removeDC offset and low frequency noise. This was achieved by using a zero-lag fourth order recursivehigh pass Butterworth filter (30 Hz). The filtered EMG signal was rectified and normalized.Normalization is achieved by dividing the rectified EMG by the peak rectified EMG signal obtainedfor all the trials. The muscle activation signal is obtained from the processed EMG signal. Fig 1shows the transformation of EMG to Muscle Activation Signal for VM. The Hill type musclemodel was then used for estimating muscle force. The force predicted is compared with the forceobtained from time musculoskeletal model performing similar task in AnyBody modeling system.Fig 2 shows the comparison of forces obtained.
Keywords: EMG, Exoskeleton, Inverse Dynamic Analysis, Muscle activation signal,Musculoskeletal model
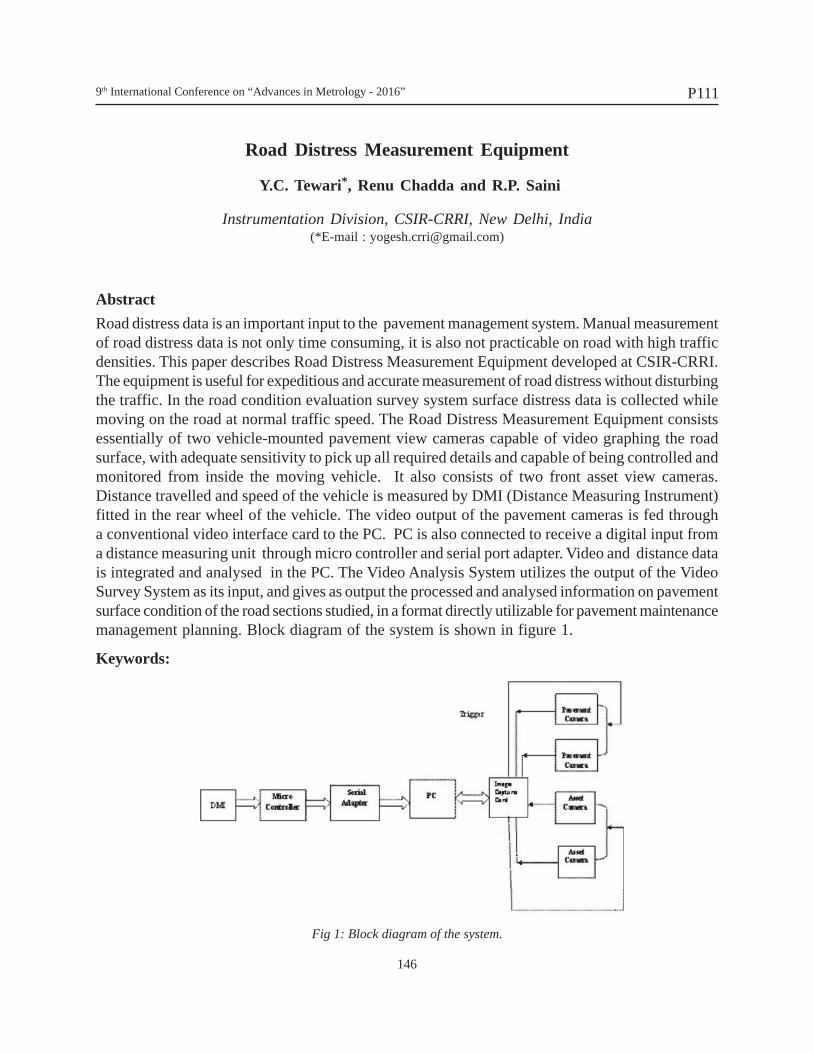
9th International Conference on “Advances in Metrology - 2016”
146
P111
Road Distress Measurement Equipment
Y.C. Tewari*, Renu Chadda and R.P. Saini
Instrumentation Division, CSIR-CRRI, New Delhi, India(*E-mail : [email protected])
AbstractRoad distress data is an important input to the pavement management system. Manual measurementof road distress data is not only time consuming, it is also not practicable on road with high trafficdensities. This paper describes Road Distress Measurement Equipment developed at CSIR-CRRI.The equipment is useful for expeditious and accurate measurement of road distress without disturbingthe traffic. In the road condition evaluation survey system surface distress data is collected whilemoving on the road at normal traffic speed. The Road Distress Measurement Equipment consistsessentially of two vehicle-mounted pavement view cameras capable of video graphing the roadsurface, with adequate sensitivity to pick up all required details and capable of being controlled andmonitored from inside the moving vehicle. It also consists of two front asset view cameras.Distance travelled and speed of the vehicle is measured by DMI (Distance Measuring Instrument)fitted in the rear wheel of the vehicle. The video output of the pavement cameras is fed througha conventional video interface card to the PC. PC is also connected to receive a digital input froma distance measuring unit through micro controller and serial port adapter. Video and distance datais integrated and analysed in the PC. The Video Analysis System utilizes the output of the VideoSurvey System as its input, and gives as output the processed and analysed information on pavementsurface condition of the road sections studied, in a format directly utilizable for pavement maintenancemanagement planning. Block diagram of the system is shown in figure 1.
Keywords:
Fig 1: Block diagram of the system.
9th International Conference on “Advances in Metrology - 2016”
147
P112
Graphene Oxide Thin Films for Oral Cancer Immunosensor
Namrata Pachauri1,2, Shilpi Verma1,3, Manjri Singh1,3, Kavita Arora4,Surinder P. Singh1 and Priti Singh1*
1CSIR-National Physical Laboratory, Dr. K. S. Krishnan Road, New Delhi-110012, India2Jayoti Vidyapeeth Women’s University, Jaipur-303007, India
3Academy of Scientific and Innovative Research (AcSIR), Chennai-600113, India4Advanced Instrumentation Research Facility, Jawaharlal Nehru University,
New Delhi-110067, India(*E-mail : [email protected])
AbstractOral cancer is the second most prevalent cancers in India. Despite of excellent developments intherapeutic modalities of oral cancer the survival rate is not encouraging. One of the major causesfor failure of treatment modalities is late diagnosis of oral cancer. Here, we present a sensitivelabel-free immunosensor designed for the detection of oral cancer biomarker, Interleukin 8 (IL8).The immuno-bioelectrode has been fabricated on graphene oxide thin films on ITO by immobilizinganti-IL8, antibodies (Ab) on its surface through EDC-NHS binding chemistry. Graphene oxidewith its high surface-to-volume ratio and various functional groups enables enhanced covalentbinding of Ab at the surface thus contributing to efficient analyte detection. The graphene oxidefilms were characterized using X-ray Diffraction (XRD), Scanning Tunneling Microsscopy (SEM)and Ultraviolet-Visible (UV-Vis) spectroscopy. The electrochemical activity of designed electrodesis studied using cyclic voltammetry revealing the quasi reversible behavior of graphene oxide. Thestandardization of bio-electrode was done by measuring different concentration of antigen intriplicate. Further, the maximum binding of Ab has been optimized by subjecting the electrode todifferent temperatures, time and pH. The fabricated immune-electrodes showed successful detectionof analyte even at very low concentration ranges (25 fg/mL to100 ng/mL). The designedelectrochemical immunosensor represents a cost-effective technique for detection of oral cancer atearlier stages.
Keywords: Graphene oxide, Immunosensor, cyclic voltammetry
9th International Conference on “Advances in Metrology - 2016”
148
P113
Preparation, Optimization and in vitro Cytotoxicity Evaluationof Gold Nanoparticles
Deepshikha Yadav1,2, Manjri Singh1, Braham Dutt1, Archita gupta2, Ramneek Kaur2,Manisha Singh2*, Priti Singh1 and Surinder P. Singh1*
1CSIR-National Physical Laboratory, Dr. K. S. Krishnan Road, New Delhi-110012, India2Department of Biotechnology, Jaypee Institute of Information Technology,
Sector-62, Noida, UP(*E-mail : [email protected], [email protected])
Abstract:Gold nanoparticles (AuNPs) have attracted enormous scientific and technological interest due totheir extraordinary physicochemical properties such as, high surface activity, chemical stability,and unique optical properties. Moreover, being biologically inert AuNPs are well documented tohave low toxicity and have been extensively explored in the areas of imaging, drug delivery,diagnostics and cancer therapeutics. Owing to their versatile applications the standardization ofAuNPs in relation to size, shape, stability and toxicity becomes imperative. The present study isfocused on the synthesis along with optimization of AuNPs using well established citrate reductionmethod. The synthesized AuNPs have been characterized using Transmission Electron Microscopy(TEM), Atomic Force Microscopy (AFM), UV-Visible spectroscopy and dynamic light scattering(DLS). Results of UV-Vis spectroscopy exhibits a well-defined surface Plasmon resonance (SPR)absorption peak at 520 nm indicating the formation of spherical nanoparticles which is reinforcedby TEM results revealing the formation of mono dispersed spherical nanoparticles of 15 nm ± 2nm in size. The stability of AuNPs was studied periodically (every month) by recording the UV-Vis spectra and morphology by TEM. Further the DLS measurements were corroborated with UV-Vis and TEM observations. The optimized AuNPs were also analyzed for in-vitro cytotoxicity onVero epithelial cell lines by MTT and NRU cell viability assays. The cell viability and IC-50 valuewith varied concentration of AuNPs has been calculated.
Keywords: Gold nanoparticles, standardization, in-vitro cytotoxicity, DLS, TEM.
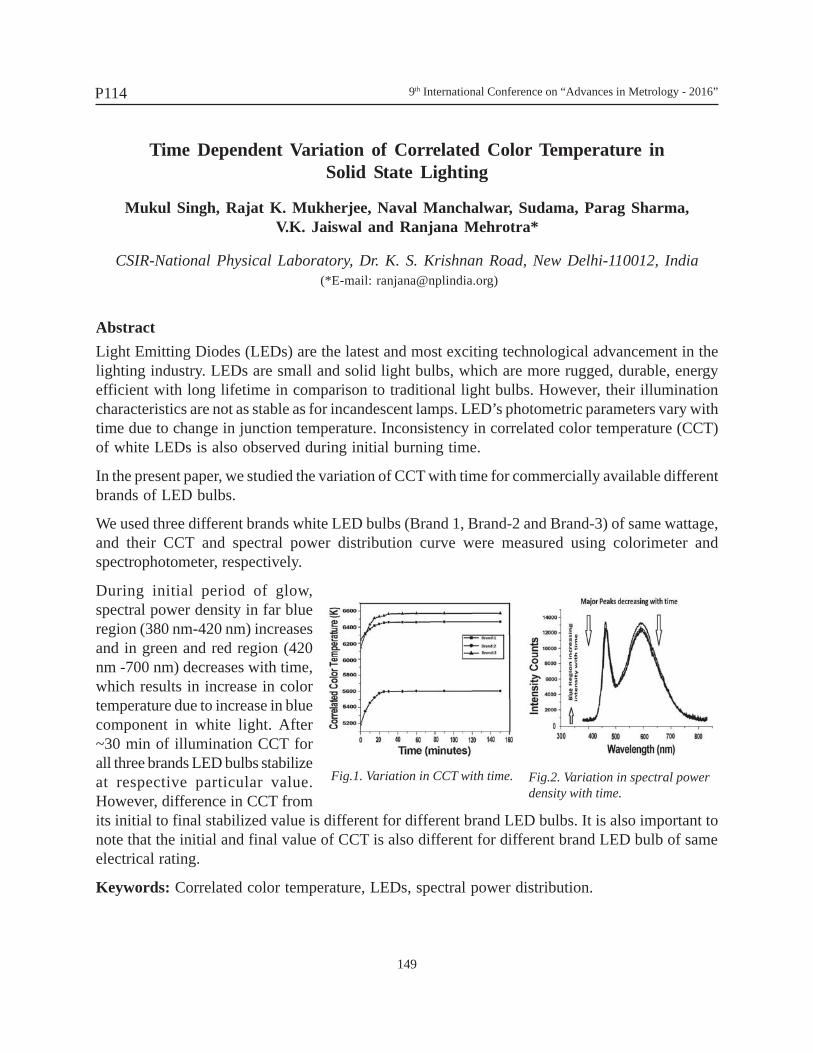
9th International Conference on “Advances in Metrology - 2016”
149
P114
Time Dependent Variation of Correlated Color Temperature inSolid State Lighting
Mukul Singh, Rajat K. Mukherjee, Naval Manchalwar, Sudama, Parag Sharma,V.K. Jaiswal and Ranjana Mehrotra*
CSIR-National Physical Laboratory, Dr. K. S. Krishnan Road, New Delhi-110012, India (*E-mail: [email protected])
AbstractLight Emitting Diodes (LEDs) are the latest and most exciting technological advancement in thelighting industry. LEDs are small and solid light bulbs, which are more rugged, durable, energyefficient with long lifetime in comparison to traditional light bulbs. However, their illuminationcharacteristics are not as stable as for incandescent lamps. LED’s photometric parameters vary withtime due to change in junction temperature. Inconsistency in correlated color temperature (CCT)of white LEDs is also observed during initial burning time.
In the present paper, we studied the variation of CCT with time for commercially available differentbrands of LED bulbs.
We used three different brands white LED bulbs (Brand 1, Brand-2 and Brand-3) of same wattage,and their CCT and spectral power distribution curve were measured using colorimeter andspectrophotometer, respectively.
During initial period of glow,spectral power density in far blueregion (380 nm-420 nm) increasesand in green and red region (420nm -700 nm) decreases with time,which results in increase in colortemperature due to increase in bluecomponent in white light. After~30 min of illumination CCT forall three brands LED bulbs stabilizeat respective particular value.However, difference in CCT fromits initial to final stabilized value is different for different brand LED bulbs. It is also important tonote that the initial and final value of CCT is also different for different brand LED bulb of sameelectrical rating.
Keywords: Correlated color temperature, LEDs, spectral power distribution.
Fig.1. Variation in CCT with time. Fig.2. Variation in spectral powerdensity with time.
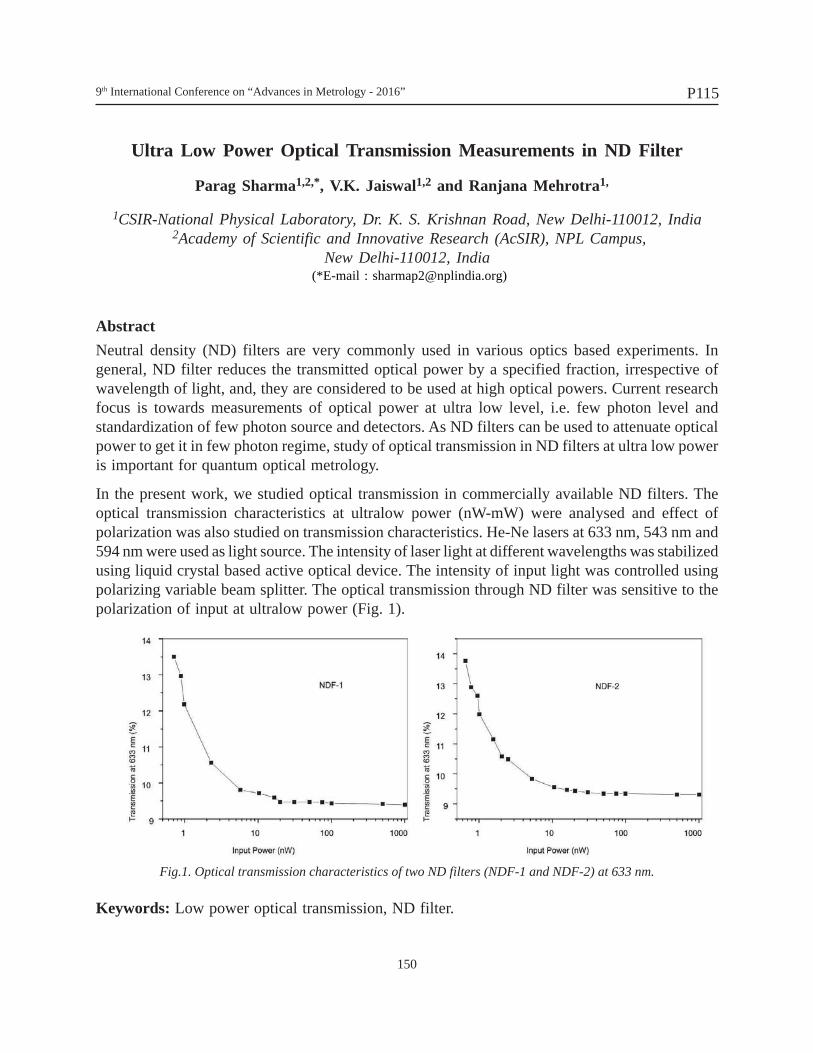
9th International Conference on “Advances in Metrology - 2016”
150
P115
Ultra Low Power Optical Transmission Measurements in ND Filter
Parag Sharma1,2,*, V.K. Jaiswal1,2 and Ranjana Mehrotra1, blank>>
1CSIR-National Physical Laboratory, Dr. K. S. Krishnan Road, New Delhi-110012, India 2Academy of Scientific and Innovative Research (AcSIR), NPL Campus,
New Delhi-110012, India (*E-mail : [email protected])
<<Two blank>>
AbstractNeutral density (ND) filters are very commonly used in various optics based experiments. Ingeneral, ND filter reduces the transmitted optical power by a specified fraction, irrespective ofwavelength of light, and, they are considered to be used at high optical powers. Current researchfocus is towards measurements of optical power at ultra low level, i.e. few photon level andstandardization of few photon source and detectors. As ND filters can be used to attenuate opticalpower to get it in few photon regime, study of optical transmission in ND filters at ultra low poweris important for quantum optical metrology.
In the present work, we studied optical transmission in commercially available ND filters. Theoptical transmission characteristics at ultralow power (nW-mW) were analysed and effect ofpolarization was also studied on transmission characteristics. He-Ne lasers at 633 nm, 543 nm and594 nm were used as light source. The intensity of laser light at different wavelengths was stabilizedusing liquid crystal based active optical device. The intensity of input light was controlled usingpolarizing variable beam splitter. The optical transmission through ND filter was sensitive to thepolarization of input at ultralow power (Fig. 1).
Fig.1. Optical transmission characteristics of two ND filters (NDF-1 and NDF-2) at 633 nm.<<One blank>>Keywords: Low power optical transmission, ND filter.
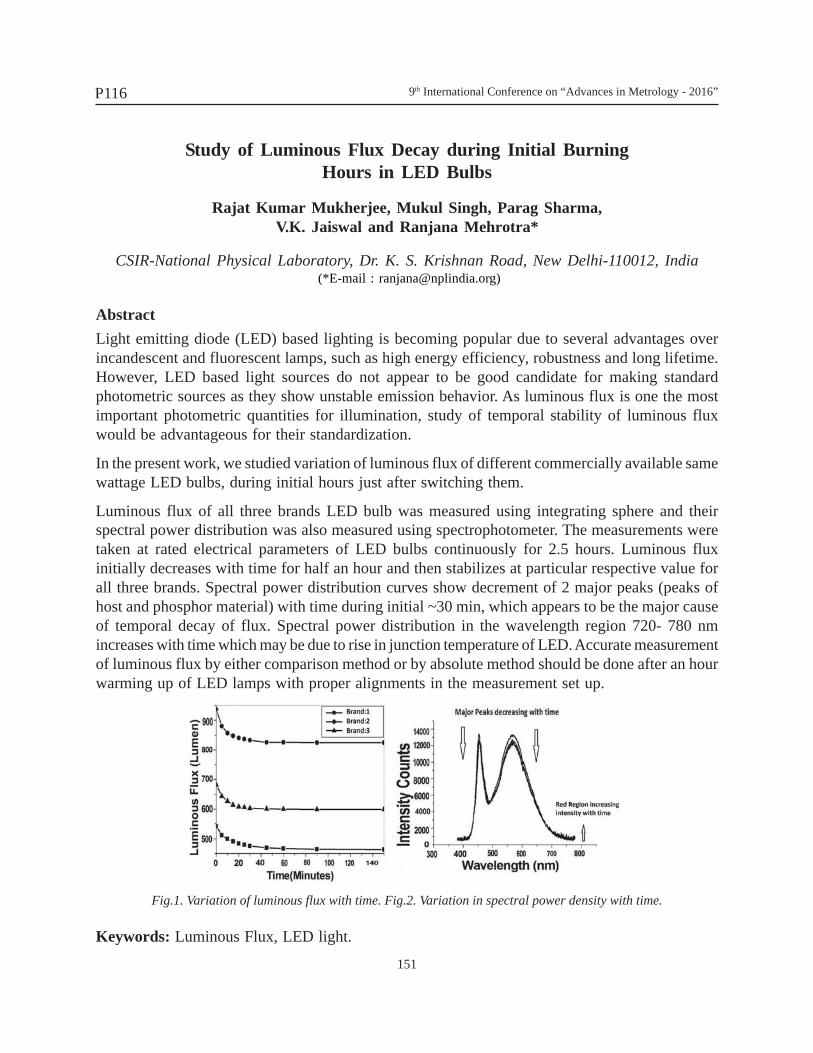
9th International Conference on “Advances in Metrology - 2016”
151
P116
Study of Luminous Flux Decay during Initial BurningHours in LED Bulbs
Rajat Kumar Mukherjee, Mukul Singh, Parag Sharma,V.K. Jaiswal and Ranjana Mehrotra*
CSIR-National Physical Laboratory, Dr. K. S. Krishnan Road, New Delhi-110012, India (*E-mail : [email protected])
<<Two blank>>AbstractLight emitting diode (LED) based lighting is becoming popular due to several advantages overincandescent and fluorescent lamps, such as high energy efficiency, robustness and long lifetime.However, LED based light sources do not appear to be good candidate for making standardphotometric sources as they show unstable emission behavior. As luminous flux is one the mostimportant photometric quantities for illumination, study of temporal stability of luminous fluxwould be advantageous for their standardization.
In the present work, we studied variation of luminous flux of different commercially available samewattage LED bulbs, during initial hours just after switching them.
Luminous flux of all three brands LED bulb was measured using integrating sphere and theirspectral power distribution was also measured using spectrophotometer. The measurements weretaken at rated electrical parameters of LED bulbs continuously for 2.5 hours. Luminous fluxinitially decreases with time for half an hour and then stabilizes at particular respective value forall three brands. Spectral power distribution curves show decrement of 2 major peaks (peaks ofhost and phosphor material) with time during initial ~30 min, which appears to be the major causeof temporal decay of flux. Spectral power distribution in the wavelength region 720- 780 nmincreases with time which may be due to rise in junction temperature of LED. Accurate measurementof luminous flux by either comparison method or by absolute method should be done after an hourwarming up of LED lamps with proper alignments in the measurement set up.
Fig.1. Variation of luminous flux with time. Fig.2. Variation in spectral power density with time.<<One blank>>Keywords: Luminous Flux, LED light.
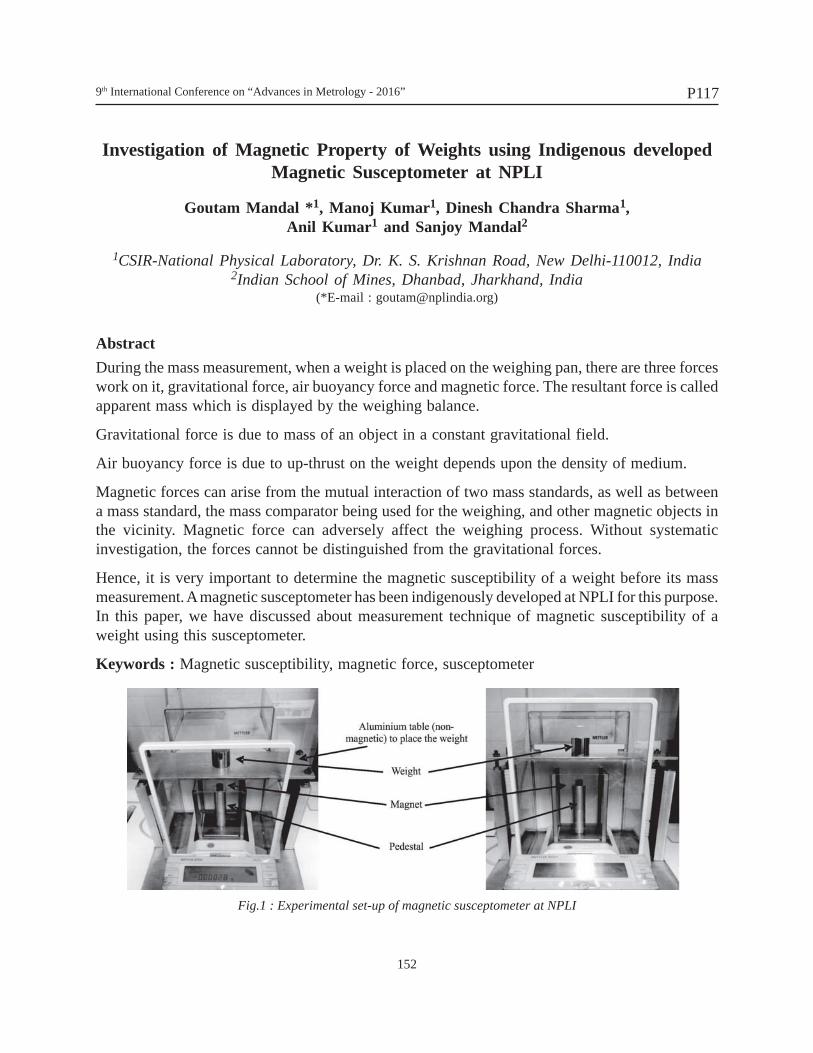
9th International Conference on “Advances in Metrology - 2016”
152
P117
Investigation of Magnetic Property of Weights using Indigenous developedMagnetic Susceptometer at NPLI
Goutam Mandal *1, Manoj Kumar1, Dinesh Chandra Sharma1,Anil Kumar1 and Sanjoy Mandal2
1CSIR-National Physical Laboratory, Dr. K. S. Krishnan Road, New Delhi-110012, India2Indian School of Mines, Dhanbad, Jharkhand, India
(*E-mail : [email protected])
AbstractDuring the mass measurement, when a weight is placed on the weighing pan, there are three forceswork on it, gravitational force, air buoyancy force and magnetic force. The resultant force is calledapparent mass which is displayed by the weighing balance.
Gravitational force is due to mass of an object in a constant gravitational field.
Air buoyancy force is due to up-thrust on the weight depends upon the density of medium.
Magnetic forces can arise from the mutual interaction of two mass standards, as well as betweena mass standard, the mass comparator being used for the weighing, and other magnetic objects inthe vicinity. Magnetic force can adversely affect the weighing process. Without systematicinvestigation, the forces cannot be distinguished from the gravitational forces.
Hence, it is very important to determine the magnetic susceptibility of a weight before its massmeasurement. A magnetic susceptometer has been indigenously developed at NPLI for this purpose.In this paper, we have discussed about measurement technique of magnetic susceptibility of aweight using this susceptometer.
Keywords : Magnetic susceptibility, magnetic force, susceptometer
Fig.1 : Experimental set-up of magnetic susceptometer at NPLI
9th International Conference on “Advances in Metrology - 2016”
153
P119
Evaluation of Critical Geometrical Parameters andAlignment Corrections of Large Size Aerospace Systems
R. Ashok Ponram*, B. Hari Prasad and S. Sai Kumar
Directorate of Engineering, DRDL, Hyderabad, India (*E-mail : [email protected])
AbstractMetrological assessment of geometrical, form parameters plays an important role in developmentof quality hardware of aerospace systems such as missiles. These parameters are critical for missionperformance and system evaluation studies. High precision CNC Coordinate Measuring Machines(CMMs), Portable Laser Tracker Systems and Photogrammetry etc., are extensively used forevaluating geometrical, form parameters in alignment checks of large missile subsystems, assembliesand tooling. These high precision metrological tools can also be used for geometrical and alignmentcorrections of critical missile subsystems.
Alignment checks of typical integrated missile is an important activity carried out during developmentof missile system. The critical aerodynamic parameters viz. nose tip deviation, cant angle andorthogonality of wings & fins and propulsion parameters such as thrust axis misalignment areevaluated using geometrical features available on integrated missile. These aerodynamic andpropulsion parameters are used for aerodynamic studies and predicting missile trajectory duringpre-flight simulation analysis. The deviation in these values directly affects the missile performanceduring flight. In case of high deviations, the above parameters are corrected mechanically in orderto meet the design requirements.
This paper brings out the applications and methodologies developed for evaluation and correctionof geometrical and form parameters in alignment checks of large size integrated missiles, sub-assemblies and tooling.
Keywords: Missiles, Coordinate Measuring Machine (CMM), Geometrical, Form andDimensional Parameters.
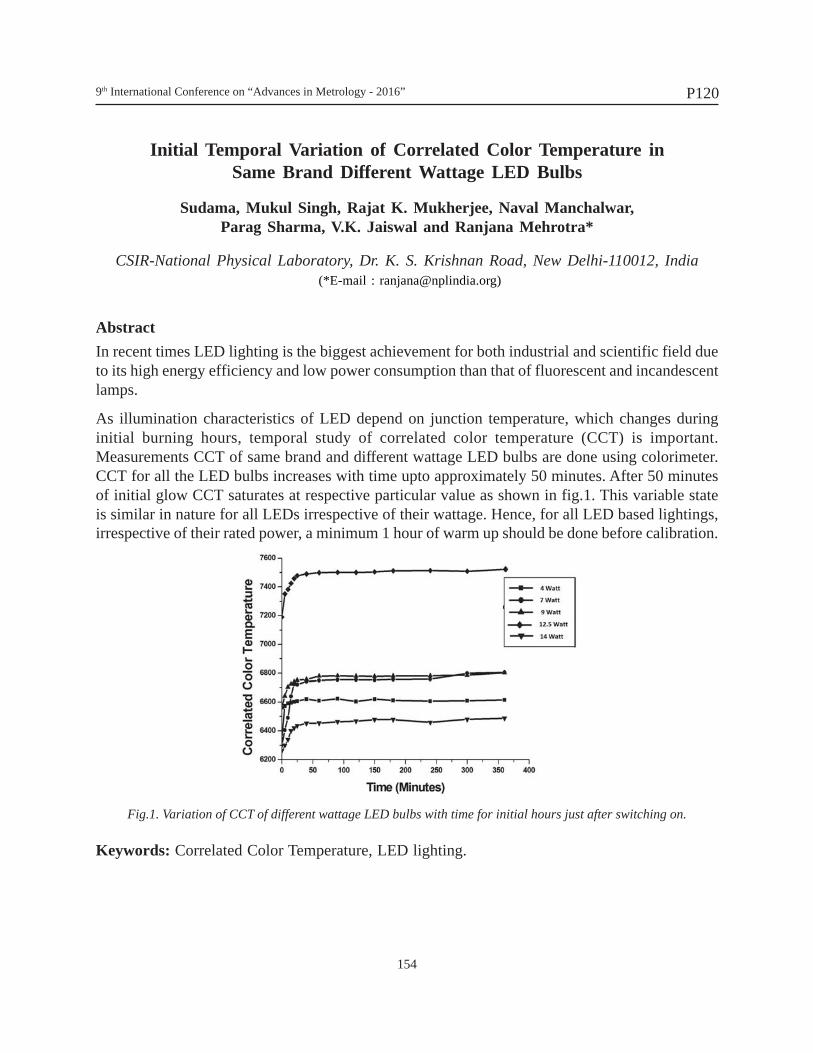
9th International Conference on “Advances in Metrology - 2016”
154
P120
Initial Temporal Variation of Correlated Color Temperature inSame Brand Different Wattage LED Bulbs
Sudama, Mukul Singh, Rajat K. Mukherjee, Naval Manchalwar,Parag Sharma, V.K. Jaiswal and Ranjana Mehrotra*
CSIR-National Physical Laboratory, Dr. K. S. Krishnan Road, New Delhi-110012, India (*E-mail : [email protected])
AbstractIn recent times LED lighting is the biggest achievement for both industrial and scientific field dueto its high energy efficiency and low power consumption than that of fluorescent and incandescentlamps.
As illumination characteristics of LED depend on junction temperature, which changes duringinitial burning hours, temporal study of correlated color temperature (CCT) is important.Measurements CCT of same brand and different wattage LED bulbs are done using colorimeter.CCT for all the LED bulbs increases with time upto approximately 50 minutes. After 50 minutesof initial glow CCT saturates at respective particular value as shown in fig.1. This variable stateis similar in nature for all LEDs irrespective of their wattage. Hence, for all LED based lightings,irrespective of their rated power, a minimum 1 hour of warm up should be done before calibration.
Fig.1. Variation of CCT of different wattage LED bulbs with time for initial hours just after switching on.>>FigKeywords: Correlated Color Temperature, LED lighting.
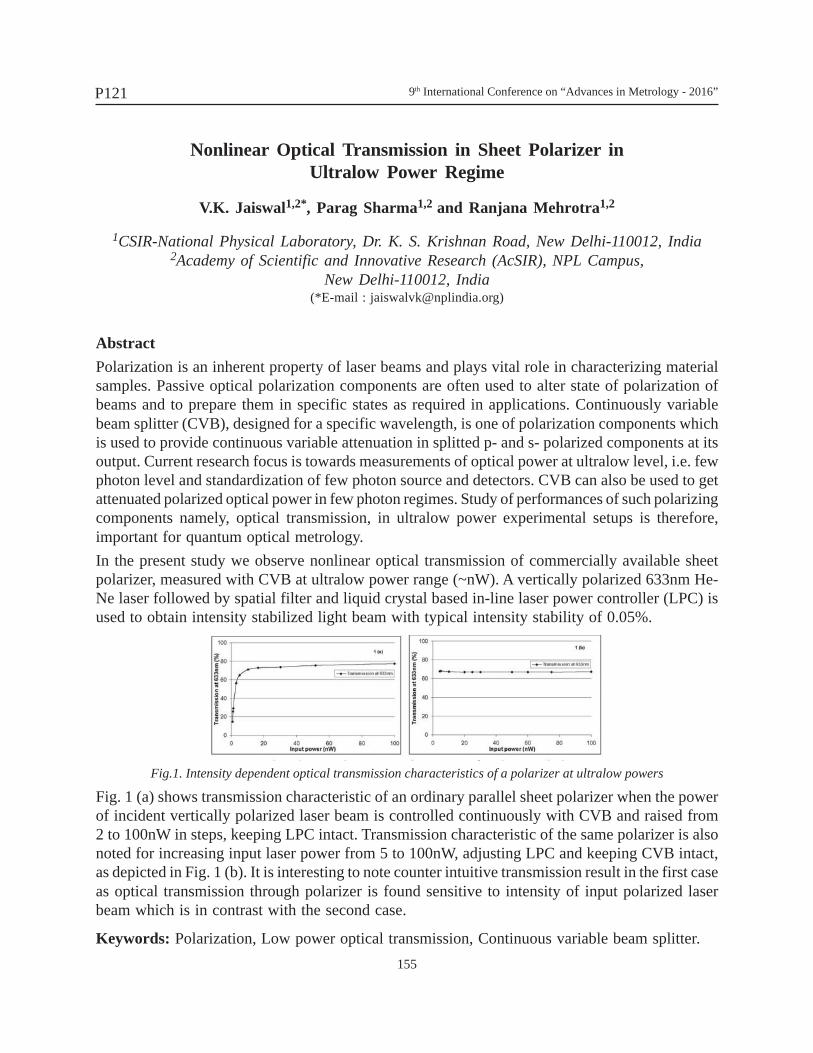
9th International Conference on “Advances in Metrology - 2016”
155
P121
Nonlinear Optical Transmission in Sheet Polarizer inUltralow Power Regime
V.K. Jaiswal1,2*, Parag Sharma1,2 and Ranjana Mehrotra1,2
1CSIR-National Physical Laboratory, Dr. K. S. Krishnan Road, New Delhi-110012, India2Academy of Scientific and Innovative Research (AcSIR), NPL Campus,
New Delhi-110012, India(*E-mail : [email protected])
AbstractPolarization is an inherent property of laser beams and plays vital role in characterizing materialsamples. Passive optical polarization components are often used to alter state of polarization ofbeams and to prepare them in specific states as required in applications. Continuously variablebeam splitter (CVB), designed for a specific wavelength, is one of polarization components whichis used to provide continuous variable attenuation in splitted p- and s- polarized components at itsoutput. Current research focus is towards measurements of optical power at ultralow level, i.e. fewphoton level and standardization of few photon source and detectors. CVB can also be used to getattenuated polarized optical power in few photon regimes. Study of performances of such polarizingcomponents namely, optical transmission, in ultralow power experimental setups is therefore,important for quantum optical metrology.In the present study we observe nonlinear optical transmission of commercially available sheetpolarizer, measured with CVB at ultralow power range (~nW). A vertically polarized 633nm He-Ne laser followed by spatial filter and liquid crystal based in-line laser power controller (LPC) isused to obtain intensity stabilized light beam with typical intensity stability of 0.05%.
Fig. 1 (a) shows transmission characteristic of an ordinary parallel sheet polarizer when the powerof incident vertically polarized laser beam is controlled continuously with CVB and raised from2 to 100nW in steps, keeping LPC intact. Transmission characteristic of the same polarizer is alsonoted for increasing input laser power from 5 to 100nW, adjusting LPC and keeping CVB intact,as depicted in Fig. 1 (b). It is interesting to note counter intuitive transmission result in the first caseas optical transmission through polarizer is found sensitive to intensity of input polarized laserbeam which is in contrast with the second case.
Keywords: Polarization, Low power optical transmission, Continuous variable beam splitter.
Fig.1. Intensity dependent optical transmission characteristics of a polarizer at ultralow powers
9th International Conference on “Advances in Metrology - 2016”
156
P122
Uncertainty Estimation in PM10 Mass Measurement
Jyoti Pokhariyal1,2, Shankar G. Aggarwal1*, Sumit K. Mishra1,Anubha Mandal2 and Prabhat K. Gupta1
1CSIR-National Physical Laboratory, Dr. K. S. Krishnan Road, New Delhi-110012, India2Department of Environmental Engineering, Delhi Technological University, Delhi, India
(*E-mail : [email protected])
AbstractMeasurements of particulate mass concentrations are important for regulatory and scientific reasons.Particulate matter < 10 µm (PM10) is one of the important parameters of the national ambient airquality standards (NAAQS) of most of the countries. In India, the regulatory limit of PM10 inNAAQS is 60 µg m-3 based on 24 hours time weighted average (i.e., annual average of minimum104 samples in a year at a particular site taken twice in a week). In this work, we have determinedand calculated the uncertainty components involved in the filter based sampling of PM10 followedby its gravimetric determination of mass. Following the standards, we have measured PM10 massat a representative site, National Physical Laboratory (NPL) for a year from January 2014 - January2015. The 24 hours time weighted average (n = 104) for a year round measurement ranged from244±51 to 396±89 µg/m3. During the measurement period, the particulate mass peak was observedduring December to February months. Uncertainty components, i.e. conditioning of the filter(36%), charge effect (32%) and weighing (30%) are the major contributors to the total uncertaintybudget in PM10 mass measurement. Importantly, the sampling flow component shows < 1%uncertainty contribution.
Keywords: PM10, NAAQS, mass measurements, uncertainty
9th International Conference on “Advances in Metrology - 2016”
157
P123
An Inter-comparison Study between two Vickers HardnessStandard Machines
S.S.K. Titus, Girish and Vikram
CSIR-National Physical Laboratory, Dr. K. S. Krishnan Road, New Delhi-110012, India(E-mail: [email protected])
AbstractPrecision hardness measurements is very much in need for several mechanical industries for theproper selection of materials for a given engineering application. Hardness is the measure ofresistance offered by a material against any scratch or indentation. Determining and optimizing thehardness values of materials is highly desirable as it plays a crucial role in our daily life whereverwear and tear of moving parts having close tolerances is involved. The measurement of hardnessvalues is absolutely inevitable for longer operational life of materials/ products, meeting specificationsof product components for their global acceptance, development of novel materials having higherstrength to weight ratio for potential applications in high technology industries like automobiles,aeronautics, railways, etc.
Industries use various kinds of materials such as metals, alloys, ceramics, plastics, rubber, etc.depending upon the application. Hardness values of these materials can be expressed on particulartypes of well established hardness scales like Rockwell, Vickers and Brinell. These scales areestablished by strictly adhering to the universally recognized documented procedures to unify thehardness measurement value of a substance universally acceptable. In CSIR-NPL We have establishedthe hardness standardizing machines in the Rockwell, Vickers and Brinell scales to provide thetraceability in hardness measurement to the user industries. In the present study we would likepresent the Vickers hardness measurements carried out by two different machines established at ourlaboratory on the selected HV scales in order to achieve the degree of equivalence in the hardnessmeasurements made using these machines. For performing Vickers hardness measurements, adiamond indenter, in the form of a right pyramid with a square base and with an angle of 136obetween opposite faces at the vertex, is forced into the surface of a test block and the diagonalsof the indentation left in the surface after removal of the test force, F, is measured. The Vickershardness is proportional to the ratio between the test force and the surface area of indentation whichis expressed as
HV = Constant (Test force/ Surface area of indentation),
For establishing the degree of equivalence of the machines, standard hardness blocks in differentranges are chosen on a few selected HV scales like HV10, HV20, HV30 and the measurements aremade on these blocks using both the machines. In this presentation, the salient features of themachines, the repeatability shown by the machines, the average hardness values measured by themachines and their deviations with respect to the standard block and the En ratios are discussed.
Key words : Vickers scale, Hardness measurements, Primary hardness machine
9th International Conference on “Advances in Metrology - 2016”
158
P124
Reliable Measurements by Quality Control Testing and CalibrationLaboratory – Kaizen / 5S Approach
Avijit Das
NABL, Delhi, India(E-mail: [email protected])
AbstractIt has been found that application of Kaizen/5s theory in other areas results with great success because topmanagement can see it as a way of "tuning" the quality control laboratory. It is a good way of interactingwith the stakeholders and to understand their needs towards test. Also a new positive way of identifyingimprovements areas on test/calibration for quality control. All the technical personnel can impact / influenceon what the improvement areas are and what one shall prioritize to work on. It verifies if testing/calibrationteam are working on the right improvement areas for quality control lab. In this paper a study made to verifythe Kaizen / 5S theory to practices by lean concept which means elimination of waste /non value addingwork and maintains flow (testing /calibration processes are made continuous) of production which isoutcome of testing/calibration laboratory. All aforesaid efforts resulting towards eliminating waste ,improving efficiency and increasing process consistency of laboratory.a. Seiri or Sort. Once the problem areas had been identified, the next task was to identify articles, tools, and
materials that were either not required at all or were only used occasionally. Another group of items couldbe the items that were required but were being currently stored in the wrong place.
b. Seiton or set in order. Everything that is needed to process a testing/calibration job should be placed foreasy access. The items that were needed were put at their point of use - where they would best supporttheir function. To evaluate which items would be directly utilized in the lab, the testing/calibration engineerand technical / quality manager were shown such items viz Equipment manual, Material Safety DataSheets (MSDS), training manuals and Standard Operational Procedures (SOP) were provided dedicatedshelves within a cabinet in the lab.
c. Seiso or shine. 5S states that this phase is not just about shining or cleaning. It is actually a process ofcollecting data to know the root cause of waste, dirt, and damage. This would have to be a regular activityduring the sustain stage
d. Seiketsu or standardize. It was important to communicate the working philosophy to the lab managementteam. It is suggested to the team who agreed upon a new method of working that would keep the workplace organized, clean, and functional. These included:1. Prioritize the use of tools and testing/calibration equipment found in the work place2. Find a location of these tools for easy access so that work flow is not disrupted3. Identify and document the sources of damage ,dirt or waste and how to avoid recurring4. Identify clearly all testing/calibration / equipment to make it a visual work place
e. Shitsuke or sustain. It is not enough to implement only the four steps of 5S because the entire 5S effortwould be futile if they cannot be sustained. "Practicing" 5S is more important and difficult than implementing.
This study involved the application of kaizen / 5S methodology in the laboratory management process. Thisimplementation is likely to benefit the Quality control laboratory technicians and Quality Process Managerto increase the efficiency of managing the lab.Keywords: Kaizen, Seiri, Seiton, Seiso, Seiketso, Shitsuke
9th International Conference on “Advances in Metrology - 2016”
159
P125
Air Quality Measurements According to the National AmbientAir Quality Standards in Raipur City: A Comparison between
Industrial and Urban Sites
Deepak Sinha1,2*, Shankar G. Aggarwal3, Bighnaraj Sarangi3 and Aditi Deopujari4
1Government Nagarjuna Post Graduate College of Science, Raipur 492010, CG, India.2Member State Expert Appraisal Committee Chhattisgarh, MoEF&CC, Government of India
3CSIR-National Physical Laboratory, Dr. K. S. Krishnan Road, New Delhi-110012, India4Indian Institute of Environmental Medicine, Sane Guruji Marg, Mumbai 400011, India
(*E-mail : [email protected])
AbstractRaipur city is known for its rapid urbanization since it becomes capital of Chhattisgarh state in2001. Also it has a big industrial area located at northwest direction. Therefore, it is expected thatthe urban city is largely affected by the neighboring industrial emissions. Major industries aresponge iron, coal washeries, steel and metal related facilities, etc. Recent reports suggested thatat the source site, the ambient parameters are mostly exceeding the regulatory limits, which maybe the possible reason for bad air quality of the city. However, there is no long-term report availableon the simultaneous air quality measurements at industrial and urban sites. In this work, we havecollected air quality data (PM2.5, PM10, SO2, NOx, CO) at Urla-Sarora Industrial area (2011 -2015) and an urban site located at the heart of the city (2013-2015), and compared the data. Ourresults suggest that air quality of the urban city is mostly not affected by the industrial emissions,although the limits of pollutants especially particulate matter mostly twice the regulatory limits. Inaddition this study suggests that the air quality of Raipur city is better than that of metro-cities inIndia.
Keywords: Air quality, NAAQS, Industrial and urban site.
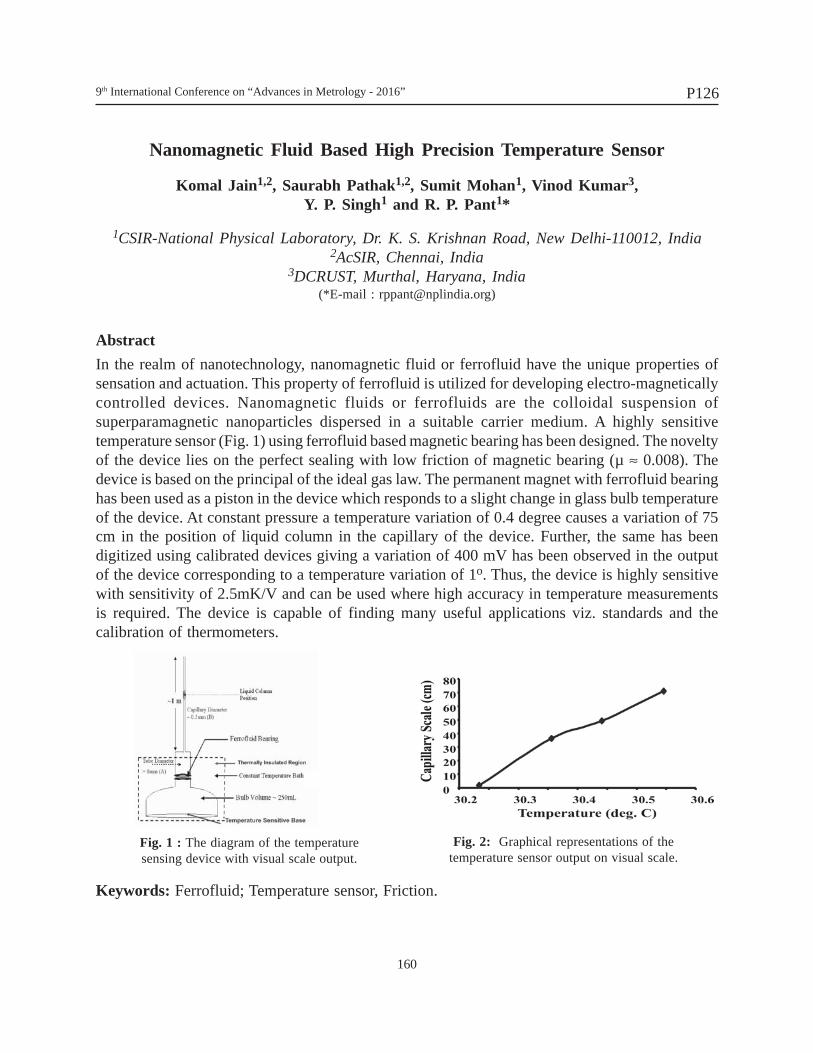
9th International Conference on “Advances in Metrology - 2016”
160
P126
Nanomagnetic Fluid Based High Precision Temperature Sensor
Komal Jain1,2, Saurabh Pathak1,2, Sumit Mohan1, Vinod Kumar3,Y. P. Singh1 and R. P. Pant1*
1CSIR-National Physical Laboratory, Dr. K. S. Krishnan Road, New Delhi-110012, India2AcSIR, Chennai, India
3DCRUST, Murthal, Haryana, India(*E-mail : [email protected])
AbstractIn the realm of nanotechnology, nanomagnetic fluid or ferrofluid have the unique properties ofsensation and actuation. This property of ferrofluid is utilized for developing electro-magneticallycontrolled devices. Nanomagnetic fluids or ferrofluids are the colloidal suspension ofsuperparamagnetic nanoparticles dispersed in a suitable carrier medium. A highly sensitivetemperature sensor (Fig. 1) using ferrofluid based magnetic bearing has been designed. The noveltyof the device lies on the perfect sealing with low friction of magnetic bearing (µ ≈ 0.008). Thedevice is based on the principal of the ideal gas law. The permanent magnet with ferrofluid bearinghas been used as a piston in the device which responds to a slight change in glass bulb temperatureof the device. At constant pressure a temperature variation of 0.4 degree causes a variation of 75cm in the position of liquid column in the capillary of the device. Further, the same has beendigitized using calibrated devices giving a variation of 400 mV has been observed in the outputof the device corresponding to a temperature variation of 1o. Thus, the device is highly sensitivewith sensitivity of 2.5mK/V and can be used where high accuracy in temperature measurementsis required. The device is capable of finding many useful applications viz. standards and thecalibration of thermometers.
Keywords: Ferrofluid; Temperature sensor, Friction.
Fig. 1 : The diagram of the temperaturesensing device with visual scale output.
Fig. 2: Graphical representations of thetemperature sensor output on visual scale.
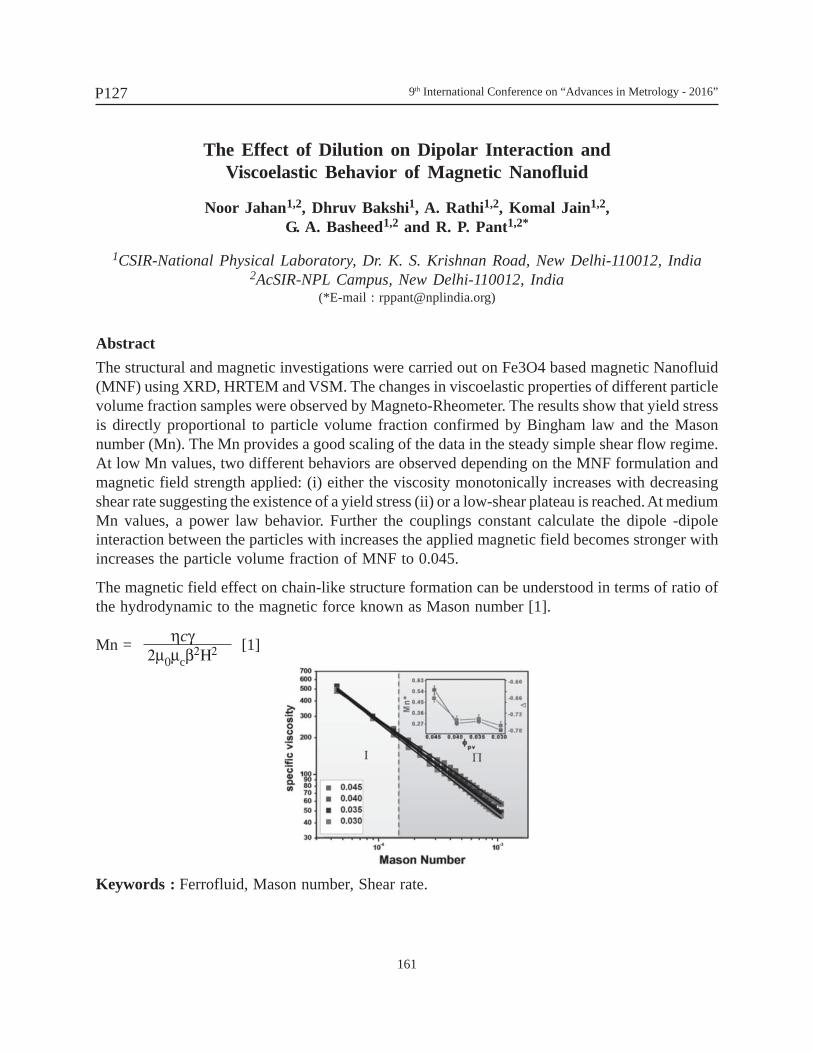
9th International Conference on “Advances in Metrology - 2016”
161
P127
The Effect of Dilution on Dipolar Interaction andViscoelastic Behavior of Magnetic Nanofluid
Noor Jahan1,2, Dhruv Bakshi1, A. Rathi1,2, Komal Jain1,2,G. A. Basheed1,2 and R. P. Pant1,2*
1CSIR-National Physical Laboratory, Dr. K. S. Krishnan Road, New Delhi-110012, India2AcSIR-NPL Campus, New Delhi-110012, India
(*E-mail : [email protected])
AbstractThe structural and magnetic investigations were carried out on Fe3O4 based magnetic Nanofluid(MNF) using XRD, HRTEM and VSM. The changes in viscoelastic properties of different particlevolume fraction samples were observed by Magneto-Rheometer. The results show that yield stressis directly proportional to particle volume fraction confirmed by Bingham law and the Masonnumber (Mn). The Mn provides a good scaling of the data in the steady simple shear flow regime.At low Mn values, two different behaviors are observed depending on the MNF formulation andmagnetic field strength applied: (i) either the viscosity monotonically increases with decreasingshear rate suggesting the existence of a yield stress (ii) or a low-shear plateau is reached. At mediumMn values, a power law behavior. Further the couplings constant calculate the dipole -dipoleinteraction between the particles with increases the applied magnetic field becomes stronger withincreases the particle volume fraction of MNF to 0.045.
The magnetic field effect on chain-like structure formation can be understood in terms of ratio ofthe hydrodynamic to the magnetic force known as Mason number [1].
Mn = [1]
Keywords : Ferrofluid, Mason number, Shear rate.
ηcγ2µ0µcβ
2Η2
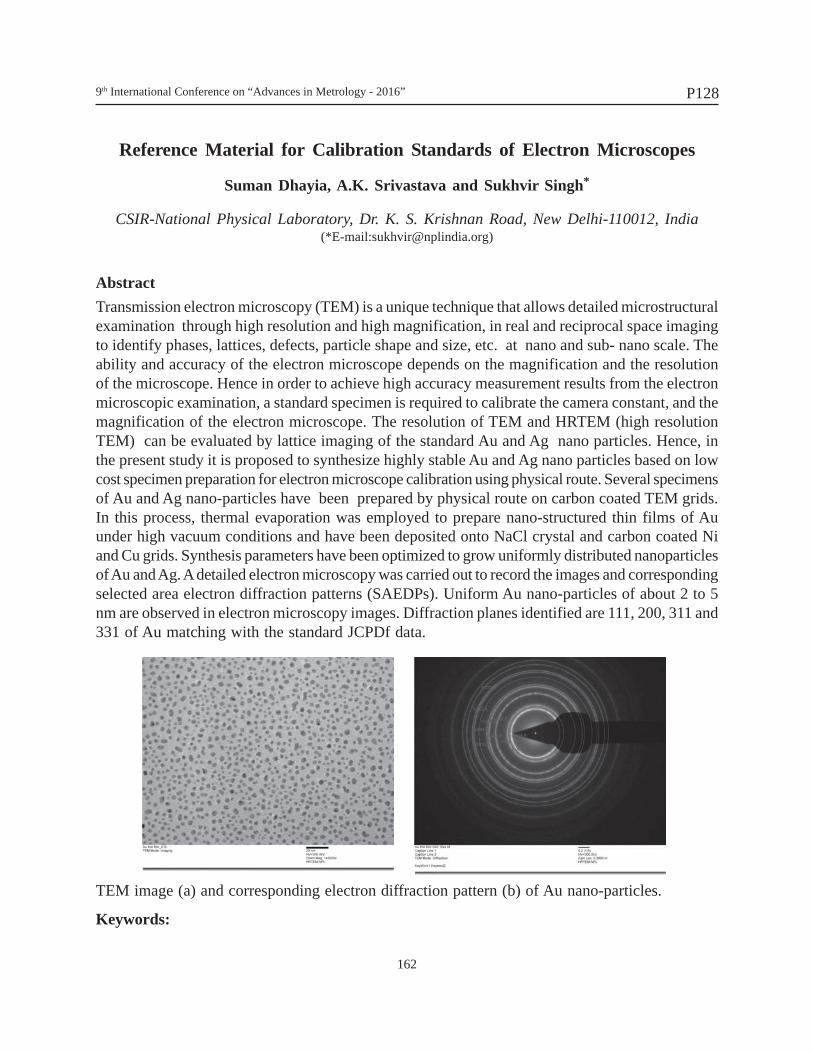
9th International Conference on “Advances in Metrology - 2016”
162
P128
Reference Material for Calibration Standards of Electron Microscopes
Suman Dhayia, A.K. Srivastava and Sukhvir Singh*
CSIR-National Physical Laboratory, Dr. K. S. Krishnan Road, New Delhi-110012, India(*E-mail:[email protected])
AbstractTransmission electron microscopy (TEM) is a unique technique that allows detailed microstructuralexamination through high resolution and high magnification, in real and reciprocal space imagingto identify phases, lattices, defects, particle shape and size, etc. at nano and sub- nano scale. Theability and accuracy of the electron microscope depends on the magnification and the resolutionof the microscope. Hence in order to achieve high accuracy measurement results from the electronmicroscopic examination, a standard specimen is required to calibrate the camera constant, and themagnification of the electron microscope. The resolution of TEM and HRTEM (high resolutionTEM) can be evaluated by lattice imaging of the standard Au and Ag nano particles. Hence, inthe present study it is proposed to synthesize highly stable Au and Ag nano particles based on lowcost specimen preparation for electron microscope calibration using physical route. Several specimensof Au and Ag nano-particles have been prepared by physical route on carbon coated TEM grids.In this process, thermal evaporation was employed to prepare nano-structured thin films of Auunder high vacuum conditions and have been deposited onto NaCl crystal and carbon coated Niand Cu grids. Synthesis parameters have been optimized to grow uniformly distributed nanoparticlesof Au and Ag. A detailed electron microscopy was carried out to record the images and correspondingselected area electron diffraction patterns (SAEDPs). Uniform Au nano-particles of about 2 to 5nm are observed in electron microscopy images. Diffraction planes identified are 111, 200, 311 and331 of Au matching with the standard JCPDf data.
TEM image (a) and corresponding electron diffraction pattern (b) of Au nano-particles.
Keywords:
9th International Conference on “Advances in Metrology - 2016”
163
P129
Mismatch Transfer Standard: S-parameter Analysis of AttenuatorsFollowed by Short
Jyoti Chauhan, Satya K. Dubey*, Parmendra S. Negi and Vijay N. Ojha
CSIR-National Physical Laboratory, Dr. K. S. Krishnan Road, New Delhi-110012, India(*E-mail : [email protected])
AbstractIn the present paper three different attenuators (3 dB, 6 dB and 10 dB) followed by short have beenanalyzed as mismatch transfer standard for frequency range from 100 MHz to 18 GHz. Scatteringparameter analysis have been carried out for reflection coefficient along with phase measurement.Measured results have been compared with existing mismatch standards. The results are in goodagreement with respect to existing mismatch standards. VSWR values have been given to 3.0, 1.67and 1.22 against 3dB, 6dB and 10 dB attenuator followed by short respectively with maximumexpanded uncertainty ±0.04. Proposed method is capable to eliminate the requirement of mismatchtransfer standard which is essential in VNA (Vector Network Analyzer) measurement and used asverification kit.
Keywords: VNA, Attenuator Followed by Short, S-parameters, Mismatch Standard Set
9th International Conference on “Advances in Metrology - 2016”
164
P130
Accuracy in Analysis of Cd, Cr and Pb inHigh Strength Matrix Waste Water
Santwana H. Dhongade1, Vilas M. Shinde2, N. N. Rao1 and Rita S. Dhodapkar1*
1Wastewater Technology division, CSIR-National Environmental EngineeringResearch Institute, Nagpur, India
2Analytical instruments division, CSIR-National Environmental engineeringResearch Institute, Nagpur, India(*E-mail : [email protected])
AbstractCadmium (Cd), Chromium (Cr) and Lead (Pb) are highly toxic metals released as effluents byindustrial activities. Cd consumption may lead to disease called itai-itai whereas Cr is known tocause mutagenic effects and allergic contact dermatitis. Pb affects the central nervous systemcausing several learning disabilities. According to Indian standard specification for drinking water(IS: 10500:2012), the permissible limits for Cd, Cr and Pb are 0.003 mg/L, 0.05 mg/L and 0.01 mg/L, respectively. The Environment (Protection) Rules, 1986, CPCB has delineated the treatedeffluent discharge standard into inland surface waters for Cd, Cr and Pb as 0.2 mg/L, 0.1 mg/L and0.1 mg/L, respectively for inorganic chemical industries. The low permissible concentration limitdemands the analysis to be accurate. Our paper describes the study of trace metals in a complexmatrix waste water and natural water by Inductively Coupled Plasma-Optical Emission Spectroscopy(ICP-OES). This analytical method should be robust for both water as well wastewater matrix. Theeffect of matrix components and interferences present in wastewaters are well documented in ISO/TC 147/SC2 and USEPA Method 200.7. The Limit of Blank (LOB) for Cd, Cr and Pb is found tobe 0.0003 mg/L, 0.0010 mg/L and 0.0015 mg/L, respectively. Limit of detection (LOD) for Cd, Crand Pb is found to be 0.0005 mg/L, 0.0014 mg/L and 0.0022 mg/L, respectively. Limit of quantitation(LOQ) for Cd, Cr and Pb is found to be 0.0011 mg/L, 0.0036 mg/L and 0.0060 mg/L, respectively.The precision and confidence in such measurements can be determined with laboratory fortified/ matrix matched standards. Quality control was performed by standard addition for determiningaccuracy as reported in "Standard method for examination of water and Wastewater, 20th edition".High matrix concentrations in waste water leads to interference in analysis and hence the computationshowed less recovery of analytes. On the other hand, ground water samples showed better recoveryof analytes due to absence of matrix effect. The acceptable % Recovery of analyte is 85-115 %. Theelimination of matrix effect was attempted by dilution of matrix and using matrix matched standards.
Keywords: ICP-OES, Wastewater matrix, Accuracy, Uncertainty.
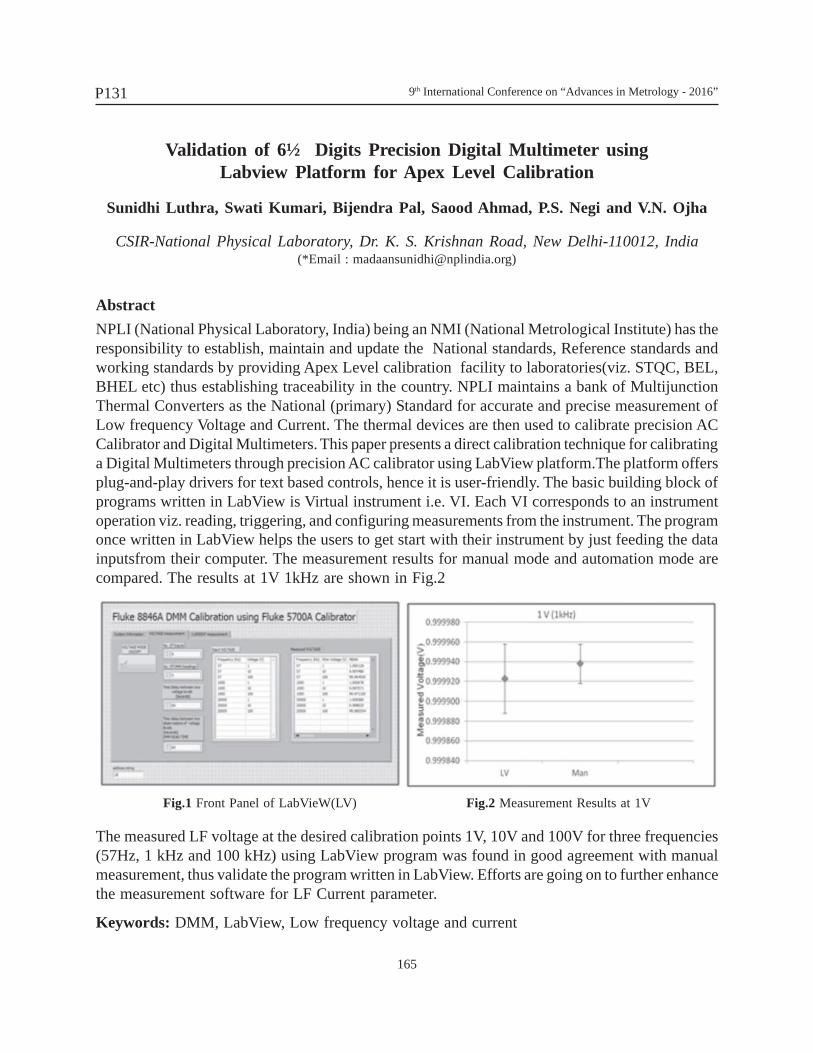
9th International Conference on “Advances in Metrology - 2016”
165
P131
Validation of 6½ Digits Precision Digital Multimeter usingLabview Platform for Apex Level Calibration
Sunidhi Luthra, Swati Kumari, Bijendra Pal, Saood Ahmad, P.S. Negi and V.N. Ojha
CSIR-National Physical Laboratory, Dr. K. S. Krishnan Road, New Delhi-110012, India(*Email : [email protected])
AbstractNPLI (National Physical Laboratory, India) being an NMI (National Metrological Institute) has theresponsibility to establish, maintain and update the National standards, Reference standards andworking standards by providing Apex Level calibration facility to laboratories(viz. STQC, BEL,BHEL etc) thus establishing traceability in the country. NPLI maintains a bank of MultijunctionThermal Converters as the National (primary) Standard for accurate and precise measurement ofLow frequency Voltage and Current. The thermal devices are then used to calibrate precision ACCalibrator and Digital Multimeters. This paper presents a direct calibration technique for calibratinga Digital Multimeters through precision AC calibrator using LabView platform.The platform offersplug-and-play drivers for text based controls, hence it is user-friendly. The basic building block ofprograms written in LabView is Virtual instrument i.e. VI. Each VI corresponds to an instrumentoperation viz. reading, triggering, and configuring measurements from the instrument. The programonce written in LabView helps the users to get start with their instrument by just feeding the datainputsfrom their computer. The measurement results for manual mode and automation mode arecompared. The results at 1V 1kHz are shown in Fig.2
The measured LF voltage at the desired calibration points 1V, 10V and 100V for three frequencies(57Hz, 1 kHz and 100 kHz) using LabView program was found in good agreement with manualmeasurement, thus validate the program written in LabView. Efforts are going on to further enhancethe measurement software for LF Current parameter.
Keywords: DMM, LabView, Low frequency voltage and current
Fig.1 Front Panel of LabVieW(LV) Fig.2 Measurement Results at 1V
9th International Conference on “Advances in Metrology - 2016”
166
P132
Evaluation of trends in physiological parameters variation of childrenduring rice crop residue burning seasons
Sachin Gupta, Susheel Mittal and Ravinder Agarwal*
Electrical and Instrumentation Department, Thapar University, Patiala, India(*E-mail: [email protected])
Abstract
According to World Health Organisation (WHO) report, Agriculture Crop Residue Burning (ACRB)is the second largest source of ambient air contamination after industrial pollution. ACRB isepisodic and this activity releases a huge amount of gaseous pollutants and respirable ParticulateMatters (PMs) having size PM10 and PM2.5. Toxicologically, raised level of PMs can cause adverseeffects like asthma cardiopulmonary disorders etc. on health level of human subjects of all agegroups especially children. Punjab is the second largest grain producer of INDIA. Rice and Wheatare the two main cyclic crops of this region. From previous findings, it was observed that Rice cropresidue burning seasons have more level of mass concentration than any other crop burningseasons. 75% of rice crop has unused residue waste. As per sensitive cyclic process of crops in thefields, the waste get disposed of by burning them in the open fields. This practice releases a hugeamount of harmful respirable particulate matters having size PM10 and PM2.5. The impact of twoconsecutive burning seasons on the children health has been quantified for the period September2013 to February 2014 and September 2014 to February 2015. Three strategically important sites(having maximum area under cultivation) Amritsar, Ludhiana and MandiGobindgarh were selectedfor fortnightly sampling and collection of data in Punjab state. 50 healthy volunteers (male andfemale) having age between 10 to 16 years were selected from each site as per American ThoracicSociety (ATS) guidelines. A portable aerosol spectrometer monitor was used to measure the massconcentration level and spirometer was used to measure the physiological parameters like ForcedVital capacity (FVC), Forced Expiratory volume in one second (FEV1), Peak Expiratory Flow(PEF),Forced Expiratory Flow (FEF25-75%) of selected children. For both seasons, the variation in PM10was from 64 to 149 µgm-3 and PM2.5 levels varied from 43 to 101 µgm-3. A negative correlationwas measured between increased level of PM concentration and physiological parameters ofchildren in both burning periods. Statistically, 3 to7% fall was observed in FVC which was higherthan PEF (3 to 4%), FEV1 (1 to 3%) and FEF25-75%(1 to 3 %) in both seasons at all sites. Amongthe sites, Mandi Gobindgarh had 21 to 40% more concentration of PMs than Amritsar and Ludhianaand had more negative impact on subjects in burning seasons. Results having p-value <0.05 wereconsidered significant. The results revel that burning episodes seems to be a extreme burden forphysiological parameters of children who are in growing stage. This may be the reason for anypermanent disorder in human subjects at pre stage of age.
Keywords: Rice crop residue burning, Children, Particulate matters, Physiological parameters
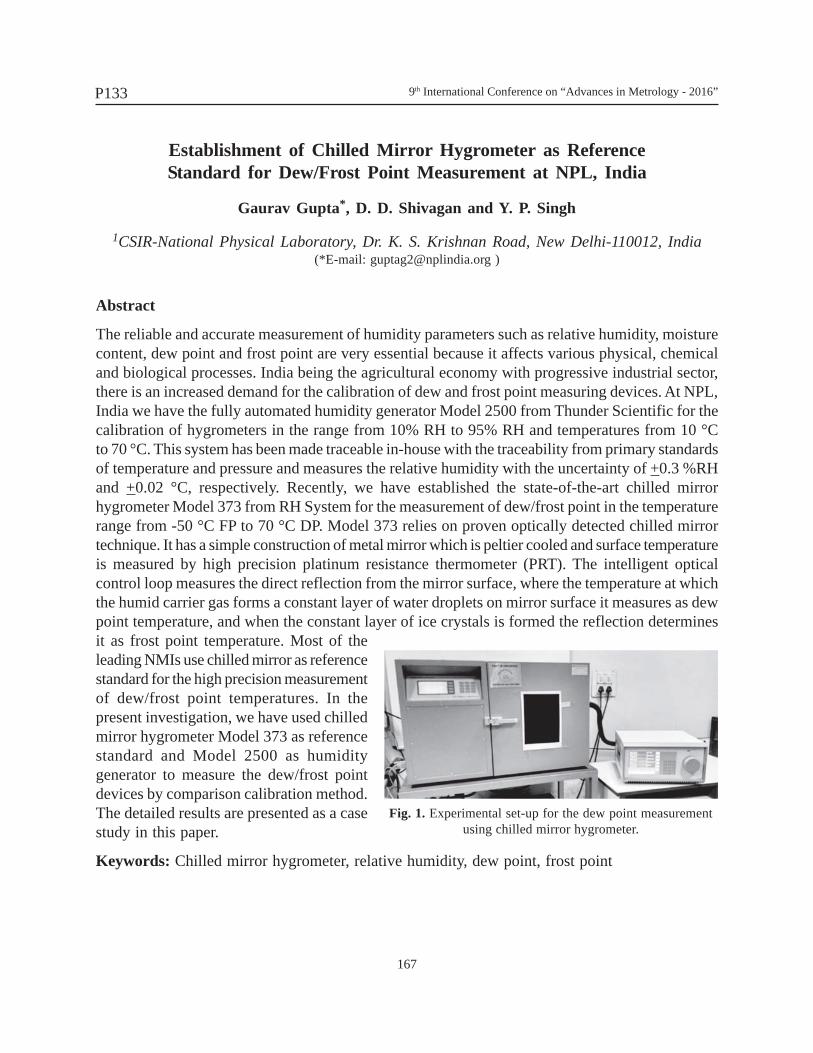
9th International Conference on “Advances in Metrology - 2016”
167
P133
Establishment of Chilled Mirror Hygrometer as ReferenceStandard for Dew/Frost Point Measurement at NPL, India
Gaurav Gupta*, D. D. Shivagan and Y. P. Singh
1CSIR-National Physical Laboratory, Dr. K. S. Krishnan Road, New Delhi-110012, India(*E-mail: [email protected] )
Abstract
The reliable and accurate measurement of humidity parameters such as relative humidity, moisturecontent, dew point and frost point are very essential because it affects various physical, chemicaland biological processes. India being the agricultural economy with progressive industrial sector,there is an increased demand for the calibration of dew and frost point measuring devices. At NPL,India we have the fully automated humidity generator Model 2500 from Thunder Scientific for thecalibration of hygrometers in the range from 10% RH to 95% RH and temperatures from 10 °Cto 70 °C. This system has been made traceable in-house with the traceability from primary standardsof temperature and pressure and measures the relative humidity with the uncertainty of +0.3 %RHand +0.02 °C, respectively. Recently, we have established the state-of-the-art chilled mirrorhygrometer Model 373 from RH System for the measurement of dew/frost point in the temperaturerange from -50 °C FP to 70 °C DP. Model 373 relies on proven optically detected chilled mirrortechnique. It has a simple construction of metal mirror which is peltier cooled and surface temperatureis measured by high precision platinum resistance thermometer (PRT). The intelligent opticalcontrol loop measures the direct reflection from the mirror surface, where the temperature at whichthe humid carrier gas forms a constant layer of water droplets on mirror surface it measures as dewpoint temperature, and when the constant layer of ice crystals is formed the reflection determinesit as frost point temperature. Most of theleading NMIs use chilled mirror as referencestandard for the high precision measurementof dew/frost point temperatures. In thepresent investigation, we have used chilledmirror hygrometer Model 373 as referencestandard and Model 2500 as humiditygenerator to measure the dew/frost pointdevices by comparison calibration method.The detailed results are presented as a casestudy in this paper.
Keywords: Chilled mirror hygrometer, relative humidity, dew point, frost point
Fig. 1. Experimental set-up for the dew point measurementusing chilled mirror hygrometer.
9th International Conference on “Advances in Metrology - 2016”
168
P134
HRTEM for Nano metrology
J. Sharma and V.N. Singh*
CSIR-National Physical Laboratory, Dr. K. S. Krishnan Road, New Delhi-110012, India(*Email : [email protected])
Abstract
Property of materials at nanoscale becomes size dependent. As the products made of nanomaterialsare increasing in numbers in the market, it is necessary to have a standard for the nanomaterials.This will help in global marketing, ease of acceptance of the product and thus innovation. Thestandard in nanotechnology will also help in studying the effect of nanomaterials on the health ofliving entities. In order to have a standard for nanomaterials, materials need to be characterized bydifferent techniques and the data needs to be calibrated. Transmission electron microscope providesa direct imaging method. In TEM, particle dimension is determined by the projection of the particleoutline onto a two-dimensional image plane. The crystal lattice images can serve as internalcalibration standards. The resolution of TEM reaching in sub angstrom range, this can be one ofthe standard techniques for standardization of nanomaterials. The modern generation TEM iscapable of sub-Angstrom imaging in both transmission and scanning mode technique development.TEM can provide information about particle size, size distribution, shape, structure etc. Electronenergy loss spectroscopy (EELS) and EDAX attached with TEM can provide the chemical mapping.Using EELS and EDAX, 3D spectroscopic identification of location and elemental identities of allatoms in a small nanostructure can be obtained. For the multilayer structures, the method canprovide the information regarding the thickness of various layers and interfaces. There are anumber of challenges to using this technique including careful sample preparation and choice ofimaging conditions. Traditional techniques of dimpling and ion milling provide large thin area withminimal artifacts. For films with poor adhesion, the focused ion beam can be used to prepare TEMsamples. This is the only technique to know the crystalline and amorphous structure at thenanoscale. Thus, TEM based techniques offer superior spatial resolution and highly sensitiveelemental analysis capabilities that can be exploited for metrology and materials characterizationof sub-nanometer sized device. Various phenomena have been explained using the HRTEMtechniques and these will be shown in the presentation.
Keywords: Nano technology, HRTEM, Nanoscale materials.
9th International Conference on “Advances in Metrology - 2016”
169
P135
Evaluation of Critical Geometrical Parameters andAlignment Corrections of Large Size Aerospace Systems
R. Ashok Ponram*, B. Hari Prasad and S. Sai Kumar
Directorate of Engineering, DRDL, Hyderabad, India(*E-mail: [email protected])
Abstract
Metrological assessment of geometrical, form parameters plays an important role in developmentof quality hardware of aerospace systems such as missiles. These parameters are critical for missionperformance and system evaluation studies. High precision CNC Coordinate Measuring Machines(CMMs), Portable Laser Tracker Systems and Photogrammetry etc., are extensively used forevaluating geometrical, form parameters in alignment checks of large missile subsystems, assembliesand tooling. These high precision metrological tools can also be used for geometrical and alignmentcorrections of critical missile subsystems.
Alignment checks of typical integrated missile are an important activity carried out duringdevelopment of missile system. The critical aerodynamic parameters viz. nose tip deviation, cantangle and orthogonality of wings & fins and propulsion parameters such as thrust axis misalignmentare evaluated using geometrical features available on integrated missile. These aerodynamic andpropulsion parameters are used for aerodynamic studies and predicting missile trajectory duringpre-flight simulation analysis. The deviation in these values directly affects the missile performanceduring flight. In case of high deviations, the above parameters are corrected mechanically in orderto meet the design requirements.
This paper brings out the applications and methodologies developed for evaluation and correctionof geometrical and form parameters in alignment checks of large size integrated missiles, sub-assemblies and tooling.
Keywords: Missiles, Coordinate Measuring Machine (CMM), Geometrical, Form andDimensional Parameters.
9th International Conference on “Advances in Metrology - 2016”
170
P136
An Investigation on Importance of Time Synchronization to IST in India,to Serve PAN India PAN Network Concept
Pranalee P. Thorat* and S. S. Rajput
Time & Frequency Division, CSIR-NPL, New Delhi, India-12(*E-mail: [email protected])
AbstractWith the revolution of Smartphone and 3G where speed is everything and almost anything can be doneusing them, Time synchronization has became extremely critical. Moreover as the application is usednationwide, a standard unique reference source to synchronize them all is unavoidable.Along with this, for many agencies precise and accurate time synchronization is a crucial requirement.Indian Banking and Financial Sector, Security Services, Telecommunication Networks, Aviation Services,ATMs, Gigabyte National Knowledge Network, the Certifying Authorities are a few to name. For theperfect operational assistance of all these sectors precise time synchronization throughout India is the mostfundamental requirement. As otherwise correlating two distributed events or tuning up two remote eventswill be impossible.Time & frequency division in National Physical Laboratory (NPL) is responsible for the highest level oftime and frequency measurements in India and keeping them traceable to the International Bureau ofWeights and Measures (BIPM) using ultra-precise satellite links. These clocks are so accurate that theywould lose or gain one second in about three lakh years. The traceability of our time scale with BIPM isat the level of few nanoseconds.CSIR-NPL provides two types of dissemination techniques1. Teleclock Service- accuracy up to ± 1 sec.2. NTP Service- accuracy up to 2 ms.But there are some other key sectors where mere these two services are insufficient. Also some sectors likearmed forces or security services, other popular time synchronization techniques like Global PositioningSystem (GPS) can't be used. Hence to tackle such critical and extremely importance sectors, an extensivestudy has been conducted to get Indian Standard Time (IST) synchronization. Special solution has beenworked out to serve their needs.Few of them are named below.1. Controller of Certifying Authority(CCA) - E-Commerce and E- Governance by Digital Signature2. Institute for Development & Research in Banking Technology [IDRBT]- communication backbone
named as INFINET to connect all banks in the public sector, private sector, cooperative, etc., and thepremier financial institutions in the India
3. Department of Telecommunication (DoT)- Entire telecom network established by all the service providerswill come under a single synchronisation reference having the required accuracy.
4. National Knowledge Network (NKN) by National Informatics Center (NIC) - Aimed to connectinstitutions/organizations carrying out research and development, Higher Education and Governancewith speed of the order of multi Gigabits per second.
This paper discusses about the various IST Synchronization solutions presented to these critically importantapplications of these esteem organisations.Keywords: IST, Traceability, Digital Signatures etc.
9th International Conference on “Advances in Metrology - 2016”
171
P137
A New Wireless Printing Technology for UniversalTesting Machine based on Raspberry PI.
R.V. Tambad1, P.P. Sangle2 and K.A. Bohara2
1Sr. Engineer (Fie Research Institute, Ichalkaranji, India)2Scientific research assistant (Fie Research Institute, Ichalkaranji, India)
(*E-mail: [email protected])
Abstract
A motivation behind this work is to provide a wireless printing capability for universal testingmachines by means of raspberry pi. A universal testing machine is an amazing multi-purposesystem which can perform many standard tensile and compression tests on materials, components,and structures. However, most of the UTM manufacturers still rely on the computers to initiate theprinting of generated test data which makes whole system costly and bulky. An entirely differentapproach is introduced in this paper which will make effective use of latest technology , keepingthe whole system simple and uncomplicated. Proposed new generation technique is to empowerUTM with latest printing technology for test report documentation, being compatible with most ofthe contemporary printers (USB as well as wireless) in the market. Implementation of raspberry piover PC makes the system Compact, fast yet cost-effective. With this newly added feature, it is alsopossible to store test result data in USB mass storage device. In near future it is possible to replaceentire existing testing panel with this new system.
Keywords: Raspberry pi, UTM, Wireless printer.
9th International Conference on “Advances in Metrology - 2016”
172
P138
Calibration of Reference Standard of Accelerometer Calibratorusing Transfer Standard
Jitendra Chauhan*, V. Vijayalakshmi, B. Sridhar and V. Muralidharan
Calibration laboratory, Quality Assurance Group (Electricals & Electronics)Gas Turbine Research Establishment
Defence R&D Organisation, C.V. Raman Nagar, Bangalore-560093(*E-mail: [email protected])
Abstract
Calibration of Vibration sensors is very essential in the field of measurement and control.Accelerometers are used to test the aero engine on ground and to measure vibration levels of aeroengine to check its airworthiness. The performance of these sensors has to be verified at regularintervals. In Calibration Laboratory, the calibration of these sensors is done using comparisonmethod. The calibration setup consists of an electro-dynamic shaker which has an armature withan attached reference sensor. To maintain traceability, the reference sensor also needs to be calibratedat regular intervals. Due to technical limitations, the reference sensor could not be calibrated atnational laboratories. Efforts were made to calibrate reference sensor in-house. A transfer standardwith valid traceability to national labs was procured to calibrate the reference sensor. The aim wasto calibrate accelerometer calibration system using transfer standard to maintain traceability.