
Abstract Assistant Professor Grade III, Amity Professor Grade III, Amity University, Sector 125,...
6
iMedPub Journals ht tp://www.imedpub.com Translational Biomedicine ISSN 2172-0479 2015 Special Issue 1 © Copyright iMedPub Find this arcle in: www.transbiomedicine.com Ayush Goyal* and Vinayak Ray Amity University, Sector 125, Noida, U.P., India Corresponding author: Ayush Goyal [email protected] Assistant Professor Grade III, Amity University, Sector 125, Noida, Uar Pradesh 201313, INDIA Tel: +917838694470 Belongingness Clustering and Region Labeling Based Pixel Classificaon for Automac Leſt Ventricle Segmentaon in Cardiac MRI Images Abstract This paper presents a fully automac rapid method for delineaon of the leſt ventricle (LV) from MRI images of heart paents for the crical diagnosis of myocardial funcon as an evaluaon of heart disease. In this research, completely automated image segmentaon is performed using a belongingness clustering and region labeling based pixel classificaon approach. This new combined region labeling and belongingness clustering technique removes the need for manual inializaon, which is required in deformable methods. The leſt ventricle is segmented automacally in all slices in the mul-frame MRI data of the whole cardiac cycle rapidly in 0.67 seconds for a single frame on average. Manual segmentaon of the leſt ventricle in the mul-frame cardiac MRI image data by experts was used as a standard to test the accuracy of the automated leſt ventricle segmentaon method. Medical parameters like End Systolic Volume (ESV), End Diastolic Volume (EDV) and Ejecon Fracon (EF) were calculated both automacally and manually and compared for accuracy. Introducon Magnec resonance is a well-established modality in cardiac imaging used for measuring the cardiac funcon of a paent’s heart. Computed tomography (CT), single-photon emission computer tomography (SPECT), positron emission tomography (PET), and ultra-sound (US) are other common imaging modalies used by radiologists to examine cardiac dysfuncon. The advantage of MRI, along with being non-intrusive and radiaon- free, is that the scan is of good quality resoluon as compared to the other methods, which is important for accurate segmentaon of the leſt ventricle for diagnosing disease in a paent’s heart. A number of methods are convenonally used for leſt ventricle segmentaon in MRI images of the heart. Primarily, they can be categorized as edge detecon, region based segmentaon, and pixel classificaon. The edge detecon method is based on tracing edges or ridges in the images [1] and the region-based method is based on pixel similarity of image regions [2]. Edge-based or line- detecon technique delineates the edge of the leſt ventricle. The delineated or traced ridge or line segments the region of interest from its background and other noise elements. Region-based segmentaon starts with a region inialized at a seed point that grows to include neighborhood pixels unl the pixel similarity or pixel intensity changes drascally beyond a certain threshold [3]. The pixel classificaon method divides pixels into groups based on pixel similarity measures such as their intensity, texture, color, gray level, etc. K-means, fuzzy c-means clustering, and graph cut methods are different types of pixel classificaon methods [4]. Belongingness based clustering employed in this research relies on pixel intensity and locaon for dividing an image into two or more clusters [5-7]. In this paper, belongingness based clustering and region labeling pixel classificaon is used to segment the region of interest, i.e. the leſt ventricle. This method labels neighboring pixels that are connected aſter belongingness based clustering classifies pixels as foreground or background. Pixels in a group will be labeled with the same level and thus segregated into different regions. The region that corresponds to the leſt ventricle is chosen based on the heuriscs of pixel locaon (since the leſt ventricle will be in the center of the cardiac image) and region boundary eccentricity
Transcript of Abstract Assistant Professor Grade III, Amity Professor Grade III, Amity University, Sector 125,...

iMedPub Journalshttp://www.imedpub.com
Translational BiomedicineISSN 2172-0479
2015Special Issue
1© Copyright iMedPub Find this article in: www.transbiomedicine.com
Ayush Goyal* and Vinayak Ray Amity University, Sector 125, Noida, U.P.,
India
Corresponding author: Ayush Goyal
Assistant Professor Grade III, Amity University, Sector 125, Noida, Uttar Pradesh 201313, INDIA
Tel: +917838694470
Belongingness Clustering and Region Labeling Based Pixel Classification for Automatic
Left Ventricle Segmentation in Cardiac MRI Images
AbstractThis paper presents a fully automatic rapid method for delineation of the left ventricle (LV) from MRI images of heart patients for the critical diagnosis of myocardial function as an evaluation of heart disease. In this research, completely automated image segmentation is performed using a belongingness clustering and region labeling based pixel classification approach. This new combined region labeling and belongingness clustering technique removes the need for manual initialization, which is required in deformable methods. The left ventricle is segmented automatically in all slices in the multi-frame MRI data of the whole cardiac cycle rapidly in 0.67 seconds for a single frame on average. Manual segmentation of the left ventricle in the multi-frame cardiac MRI image data by experts was used as a standard to test the accuracy of the automated left ventricle segmentation method. Medical parameters like End Systolic Volume (ESV), End Diastolic Volume (EDV) and Ejection Fraction (EF) were calculated both automatically and manually and compared for accuracy.
Introduction Magnetic resonance is a well-established modality in cardiac imaging used for measuring the cardiac function of a patient’s heart. Computed tomography (CT), single-photon emission computer tomography (SPECT), positron emission tomography (PET), and ultra-sound (US) are other common imaging modalities used by radiologists to examine cardiac dysfunction. The advantage of MRI, along with being non-intrusive and radiation-free, is that the scan is of good quality resolution as compared to the other methods, which is important for accurate segmentation of the left ventricle for diagnosing disease in a patient’s heart.
A number of methods are conventionally used for left ventricle segmentation in MRI images of the heart. Primarily, they can be categorized as edge detection, region based segmentation, and pixel classification. The edge detection method is based on tracing edges or ridges in the images [1] and the region-based method is based on pixel similarity of image regions [2]. Edge-based or line-detection technique delineates the edge of the left ventricle. The delineated or traced ridge or line segments the region of interest
from its background and other noise elements. Region-based segmentation starts with a region initialized at a seed point that grows to include neighborhood pixels until the pixel similarity or pixel intensity changes drastically beyond a certain threshold [3]. The pixel classification method divides pixels into groups based on pixel similarity measures such as their intensity, texture, color, gray level, etc. K-means, fuzzy c-means clustering, and graph cut methods are different types of pixel classification methods [4]. Belongingness based clustering employed in this research relies on pixel intensity and location for dividing an image into two or more clusters [5-7].
In this paper, belongingness based clustering and region labeling pixel classification is used to segment the region of interest, i.e. the left ventricle. This method labels neighboring pixels that are connected after belongingness based clustering classifies pixels as foreground or background. Pixels in a group will be labeled with the same level and thus segregated into different regions. The region that corresponds to the left ventricle is chosen based on the heuristics of pixel location (since the left ventricle will be in the center of the cardiac image) and region boundary eccentricity
2© Copyright iMedPub Find this article in: www.transbiomedicine.com
ARCHIVOS DE MEDICINAISSN 1698-9465
2015Special Issue
Translational BiomedicineISSN 2172-0479
(since the left ventricle is circular). Hence, in this research, an innovative belongingness clustering cum region labeling pixel classification method is used to achieve sub-second fast fully automatic segmentation of the left ventricle in all frames in the complete cardiac cycle without any seed point initialization or user intervention.
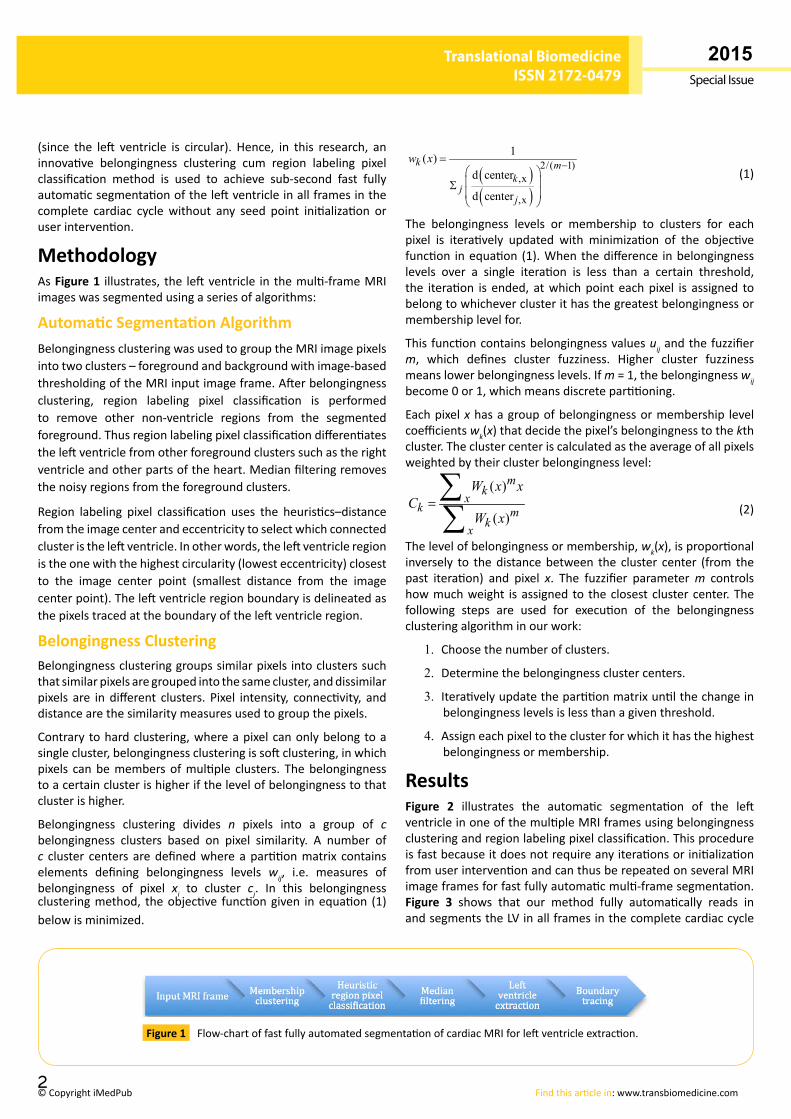
MethodologyAs Figure 1 illustrates, the left ventricle in the multi-frame MRI images was segmented using a series of algorithms:
Automatic Segmentation AlgorithmBelongingness clustering was used to group the MRI image pixels into two clusters – foreground and background with image-based thresholding of the MRI input image frame. After belongingness clustering, region labeling pixel classification is performed to remove other non-ventricle regions from the segmented foreground. Thus region labeling pixel classification differentiates the left ventricle from other foreground clusters such as the right ventricle and other parts of the heart. Median filtering removes the noisy regions from the foreground clusters.
Region labeling pixel classification uses the heuristics–distance from the image center and eccentricity to select which connected cluster is the left ventricle. In other words, the left ventricle region is the one with the highest circularity (lowest eccentricity) closest to the image center point (smallest distance from the image center point). The left ventricle region boundary is delineated as the pixels traced at the boundary of the left ventricle region.
Belongingness ClusteringBelongingness clustering groups similar pixels into clusters such that similar pixels are grouped into the same cluster, and dissimilar pixels are in different clusters. Pixel intensity, connectivity, and distance are the similarity measures used to group the pixels.
Contrary to hard clustering, where a pixel can only belong to a single cluster, belongingness clustering is soft clustering, in which pixels can be members of multiple clusters. The belongingness to a certain cluster is higher if the level of belongingness to that cluster is higher.
Belongingness clustering divides n pixels into a group of c belongingness clusters based on pixel similarity. A number of c cluster centers are defined where a partition matrix contains elements defining belongingness levels wij, i.e. measures of belongingness of pixel xi to cluster cj. In this belongingness clustering method, the objective function given in equation (1) below is minimized.
( )( )
2/( 1),x
,x
1( )d center
d center
k mk
jj
w x −= Σ
(1)
The belongingness levels or membership to clusters for each pixel is iteratively updated with minimization of the objective function in equation (1). When the difference in belongingness levels over a single iteration is less than a certain threshold, the iteration is ended, at which point each pixel is assigned to belong to whichever cluster it has the greatest belongingness or membership level for.
This function contains belongingness values uij and the fuzzifier m, which defines cluster fuzziness. Higher cluster fuzziness means lower belongingness levels. If m = 1, the belongingness wij become 0 or 1, which means discrete partitioning.
Each pixel x has a group of belongingness or membership level coefficients wk(x) that decide the pixel’s belongingness to the kth cluster. The cluster center is calculated as the average of all pixels weighted by their cluster belongingness level:
(2)
The level of belongingness or membership, wk(x), is proportional inversely to the distance between the cluster center (from the past iteration) and pixel x. The fuzzifier parameter m controls how much weight is assigned to the closest cluster center. The following steps are used for execution of the belongingness clustering algorithm in our work:
1. Choose the number of clusters.
2. Determine the belongingness cluster centers.
3. Iteratively update the partition matrix until the change in belongingness levels is less than a given threshold.
4. Assign each pixel to the cluster for which it has the highest belongingness or membership.
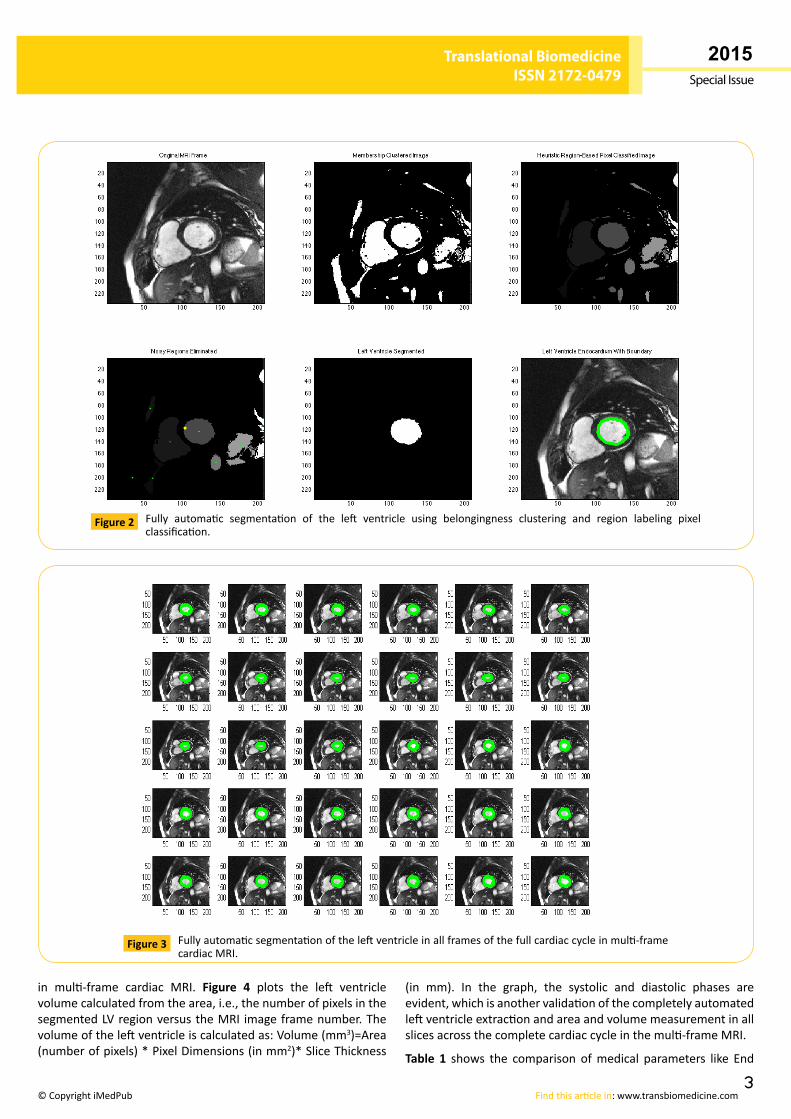
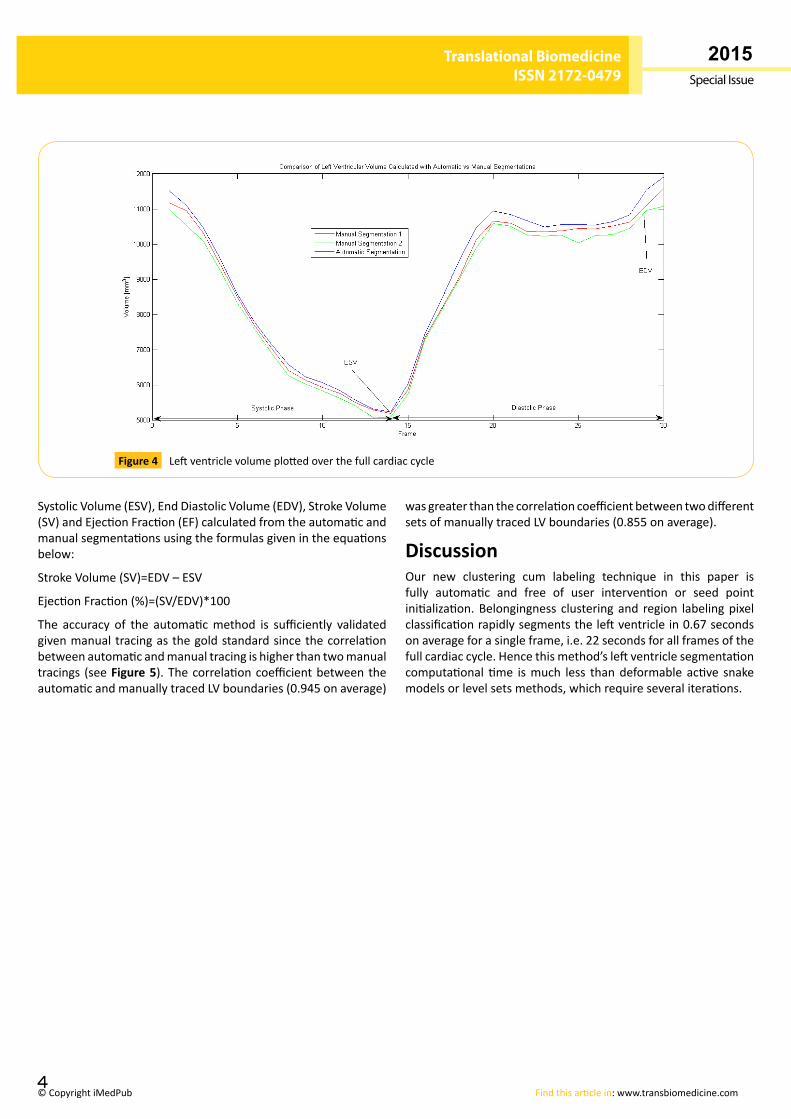
ResultsFigure 2 illustrates the automatic segmentation of the left ventricle in one of the multiple MRI frames using belongingness clustering and region labeling pixel classification. This procedure is fast because it does not require any iterations or initialization from user intervention and can thus be repeated on several MRI image frames for fast fully automatic multi-frame segmentation. Figure 3 shows that our method fully automatically reads in and segments the LV in all frames in the complete cardiac cycle
Flow-chart of fast fully automated segmentation of cardiac MRI for left ventricle extraction.Figure 1
( )
( )
mkx
k mkx
W x xC
W x=∑∑
3
ARCHIVOS DE MEDICINAISSN 1698-9465
2015Special Issue
Translational BiomedicineISSN 2172-0479
© Copyright iMedPub Find this article in: www.transbiomedicine.com
Fully automatic segmentation of the left ventricle using belongingness clustering and region labeling pixel classification.
Figure 2
Fully automatic segmentation of the left ventricle in all frames of the full cardiac cycle in multi-frame cardiac MRI.
Figure 3
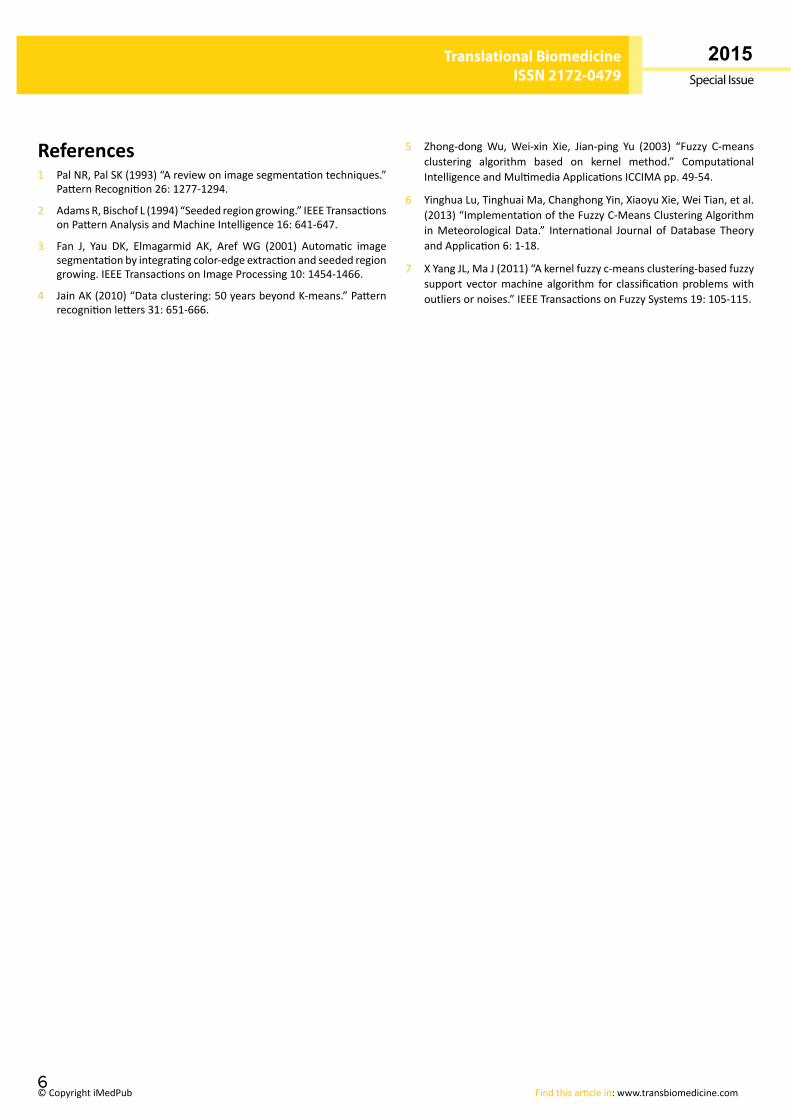
in multi-frame cardiac MRI. Figure 4 plots the left ventricle volume calculated from the area, i.e., the number of pixels in the segmented LV region versus the MRI image frame number. The volume of the left ventricle is calculated as: Volume (mm3)=Area (number of pixels) * Pixel Dimensions (in mm2)* Slice Thickness
(in mm). In the graph, the systolic and diastolic phases are evident, which is another validation of the completely automated left ventricle extraction and area and volume measurement in all slices across the complete cardiac cycle in the multi-frame MRI.
Table 1 shows the comparison of medical parameters like End
4© Copyright iMedPub Find this article in: www.transbiomedicine.com
ARCHIVOS DE MEDICINAISSN 1698-9465
2015Special Issue
Translational BiomedicineISSN 2172-0479
Left ventricle volume plotted over the full cardiac cycleFigure 4
Systolic Volume (ESV), End Diastolic Volume (EDV), Stroke Volume (SV) and Ejection Fraction (EF) calculated from the automatic and manual segmentations using the formulas given in the equations below:
Stroke Volume (SV)=EDV – ESV
Ejection Fraction (%)=(SV/EDV)*100
The accuracy of the automatic method is sufficiently validated given manual tracing as the gold standard since the correlation between automatic and manual tracing is higher than two manual tracings (see Figure 5). The correlation coefficient between the automatic and manually traced LV boundaries (0.945 on average)
was greater than the correlation coefficient between two different sets of manually traced LV boundaries (0.855 on average).
DiscussionOur new clustering cum labeling technique in this paper is fully automatic and free of user intervention or seed point initialization. Belongingness clustering and region labeling pixel classification rapidly segments the left ventricle in 0.67 seconds on average for a single frame, i.e. 22 seconds for all frames of the full cardiac cycle. Hence this method’s left ventricle segmentation computational time is much less than deformable active snake models or level sets methods, which require several iterations.

5
ARCHIVOS DE MEDICINAISSN 1698-9465
2015Special Issue
Translational BiomedicineISSN 2172-0479
© Copyright iMedPub Find this article in: www.transbiomedicine.com
Figure 5 Accuracy of LV segmentation validated with manual tracing.
6© Copyright iMedPub Find this article in: www.transbiomedicine.com
ARCHIVOS DE MEDICINAISSN 1698-9465
2015Special Issue
Translational BiomedicineISSN 2172-0479
References1 Pal NR, Pal SK (1993) “A review on image segmentation techniques.”
Pattern Recognition 26: 1277-1294.
2 Adams R, Bischof L (1994) “Seeded region growing.” IEEE Transactions on Pattern Analysis and Machine Intelligence 16: 641-647.
3 Fan J, Yau DK, Elmagarmid AK, Aref WG (2001) Automatic image segmentation by integrating color-edge extraction and seeded region growing. IEEE Transactions on Image Processing 10: 1454-1466.
4 Jain AK (2010) “Data clustering: 50 years beyond K-means.” Pattern recognition letters 31: 651-666.
5 Zhong-dong Wu, Wei-xin Xie, Jian-ping Yu (2003) “Fuzzy C-means clustering algorithm based on kernel method.” Computational Intelligence and Multimedia Applications ICCIMA pp. 49-54.
6 Yinghua Lu, Tinghuai Ma, Changhong Yin, Xiaoyu Xie, Wei Tian, et al. (2013) “Implementation of the Fuzzy C-Means Clustering Algorithm in Meteorological Data.” International Journal of Database Theory and Application 6: 1-18.
7 X Yang JL, Ma J (2011) “A kernel fuzzy c-means clustering-based fuzzy support vector machine algorithm for classification problems with outliers or noises.” IEEE Transactions on Fuzzy Systems 19: 105-115.