![Excretion [2015]](https://static.fdocuments.in/doc/165x107/55d39c87bb61eb05278b46dd/excretion-2015-55d47f0693bf7.jpg)
Absorption and excretion of cranberry-derived phenolics in humans
9
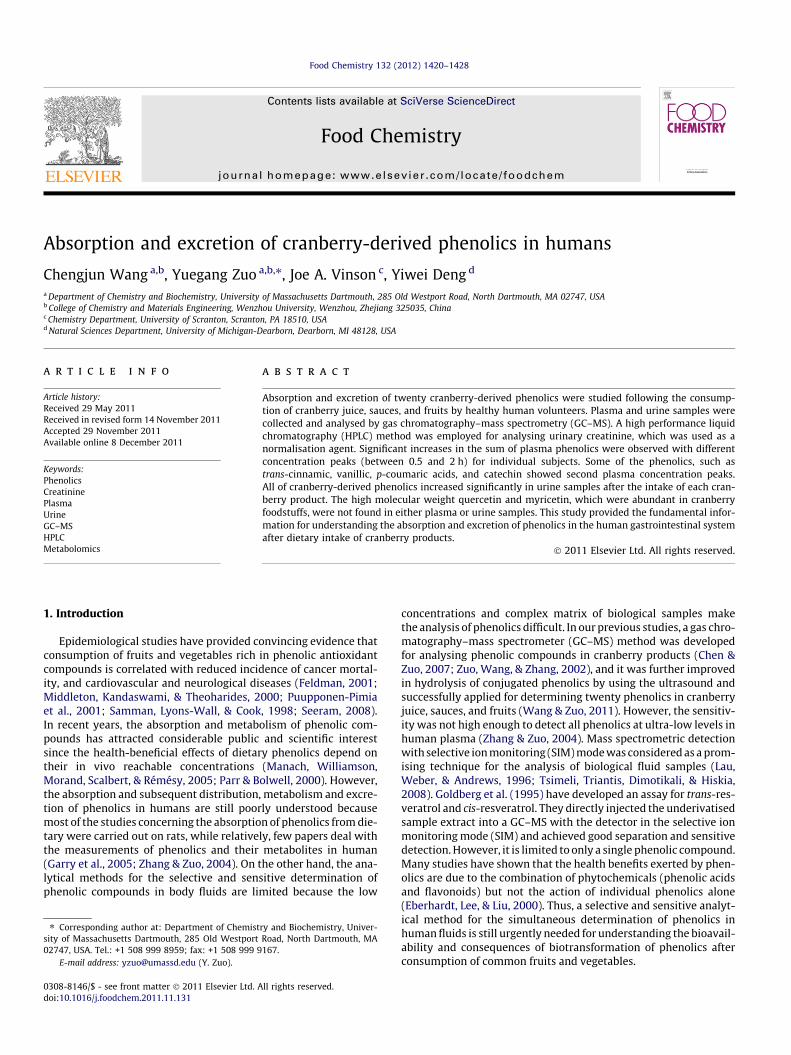
Absorption and excretion of cranberry-derived phenolics in humans Chengjun Wang a,b , Yuegang Zuo a,b,⇑ , Joe A. Vinson c , Yiwei Deng d a Department of Chemistry and Biochemistry, University of Massachusetts Dartmouth, 285 Old Westport Road, North Dartmouth, MA 02747, USA b College of Chemistry and Materials Engineering, Wenzhou University, Wenzhou, Zhejiang 325035, China c Chemistry Department, University of Scranton, Scranton, PA 18510, USA d Natural Sciences Department, University of Michigan-Dearborn, Dearborn, MI 48128, USA article info Article history: Received 29 May 2011 Received in revised form 14 November 2011 Accepted 29 November 2011 Available online 8 December 2011 Keywords: Phenolics Creatinine Plasma Urine GC–MS HPLC Metabolomics abstract Absorption and excretion of twenty cranberry-derived phenolics were studied following the consump- tion of cranberry juice, sauces, and fruits by healthy human volunteers. Plasma and urine samples were collected and analysed by gas chromatography–mass spectrometry (GC–MS). A high performance liquid chromatography (HPLC) method was employed for analysing urinary creatinine, which was used as a normalisation agent. Significant increases in the sum of plasma phenolics were observed with different concentration peaks (between 0.5 and 2 h) for individual subjects. Some of the phenolics, such as trans-cinnamic, vanillic, p-coumaric acids, and catechin showed second plasma concentration peaks. All of cranberry-derived phenolics increased significantly in urine samples after the intake of each cran- berry product. The high molecular weight quercetin and myricetin, which were abundant in cranberry foodstuffs, were not found in either plasma or urine samples. This study provided the fundamental infor- mation for understanding the absorption and excretion of phenolics in the human gastrointestinal system after dietary intake of cranberry products. Ó 2011 Elsevier Ltd. All rights reserved. 1. Introduction Epidemiological studies have provided convincing evidence that consumption of fruits and vegetables rich in phenolic antioxidant compounds is correlated with reduced incidence of cancer mortal- ity, and cardiovascular and neurological diseases (Feldman, 2001; Middleton, Kandaswami, & Theoharides, 2000; Puupponen-Pimia et al., 2001; Samman, Lyons-Wall, & Cook, 1998; Seeram, 2008). In recent years, the absorption and metabolism of phenolic com- pounds has attracted considerable public and scientific interest since the health-beneficial effects of dietary phenolics depend on their in vivo reachable concentrations (Manach, Williamson, Morand, Scalbert, & Rémésy, 2005; Parr & Bolwell, 2000). However, the absorption and subsequent distribution, metabolism and excre- tion of phenolics in humans are still poorly understood because most of the studies concerning the absorption of phenolics from die- tary were carried out on rats, while relatively, few papers deal with the measurements of phenolics and their metabolites in human (Garry et al., 2005; Zhang & Zuo, 2004). On the other hand, the ana- lytical methods for the selective and sensitive determination of phenolic compounds in body fluids are limited because the low concentrations and complex matrix of biological samples make the analysis of phenolics difficult. In our previous studies, a gas chro- matography–mass spectrometer (GC–MS) method was developed for analysing phenolic compounds in cranberry products (Chen & Zuo, 2007; Zuo, Wang, & Zhang, 2002), and it was further improved in hydrolysis of conjugated phenolics by using the ultrasound and successfully applied for determining twenty phenolics in cranberry juice, sauces, and fruits (Wang & Zuo, 2011). However, the sensitiv- ity was not high enough to detect all phenolics at ultra-low levels in human plasma (Zhang & Zuo, 2004). Mass spectrometric detection with selective ion monitoring (SIM) mode was considered as a prom- ising technique for the analysis of biological fluid samples (Lau, Weber, & Andrews, 1996; Tsimeli, Triantis, Dimotikali, & Hiskia, 2008). Goldberg et al. (1995) have developed an assay for trans-res- veratrol and cis-resveratrol. They directly injected the underivatised sample extract into a GC–MS with the detector in the selective ion monitoring mode (SIM) and achieved good separation and sensitive detection. However, it is limited to only a single phenolic compound. Many studies have shown that the health benefits exerted by phen- olics are due to the combination of phytochemicals (phenolic acids and flavonoids) but not the action of individual phenolics alone (Eberhardt, Lee, & Liu, 2000). Thus, a selective and sensitive analyt- ical method for the simultaneous determination of phenolics in human fluids is still urgently needed for understanding the bioavail- ability and consequences of biotransformation of phenolics after consumption of common fruits and vegetables. 0308-8146/$ - see front matter Ó 2011 Elsevier Ltd. All rights reserved. doi:10.1016/j.foodchem.2011.11.131 ⇑ Corresponding author at: Department of Chemistry and Biochemistry, Univer- sity of Massachusetts Dartmouth, 285 Old Westport Road, North Dartmouth, MA 02747, USA. Tel.: +1 508 999 8959; fax: +1 508 999 9167. E-mail address: [email protected] (Y. Zuo). Food Chemistry 132 (2012) 1420–1428 Contents lists available at SciVerse ScienceDirect Food Chemistry journal homepage: www.elsevier.com/locate/foodchem
-
Upload
chengjun-wang -
Category
Documents
-
view
213 -
download
0
Transcript of Absorption and excretion of cranberry-derived phenolics in humans
Food Chemistry 132 (2012) 1420–1428
Contents lists available at SciVerse ScienceDirect
Food Chemistry
journal homepage: www.elsevier .com/locate / foodchem
Absorption and excretion of cranberry-derived phenolics in humans
Chengjun Wang a,b, Yuegang Zuo a,b,⇑, Joe A. Vinson c, Yiwei Deng d
a Department of Chemistry and Biochemistry, University of Massachusetts Dartmouth, 285 Old Westport Road, North Dartmouth, MA 02747, USAb College of Chemistry and Materials Engineering, Wenzhou University, Wenzhou, Zhejiang 325035, Chinac Chemistry Department, University of Scranton, Scranton, PA 18510, USAd Natural Sciences Department, University of Michigan-Dearborn, Dearborn, MI 48128, USA
a r t i c l e i n f o
Article history:Received 29 May 2011Received in revised form 14 November 2011Accepted 29 November 2011Available online 8 December 2011
Keywords:PhenolicsCreatininePlasmaUrineGC–MSHPLCMetabolomics
0308-8146/$ - see front matter � 2011 Elsevier Ltd. Adoi:10.1016/j.foodchem.2011.11.131
⇑ Corresponding author at: Department of Chemistsity of Massachusetts Dartmouth, 285 Old Westport02747, USA. Tel.: +1 508 999 8959; fax: +1 508 999 9
E-mail address: [email protected] (Y. Zuo).
a b s t r a c t
Absorption and excretion of twenty cranberry-derived phenolics were studied following the consump-tion of cranberry juice, sauces, and fruits by healthy human volunteers. Plasma and urine samples werecollected and analysed by gas chromatography–mass spectrometry (GC–MS). A high performance liquidchromatography (HPLC) method was employed for analysing urinary creatinine, which was used as anormalisation agent. Significant increases in the sum of plasma phenolics were observed with differentconcentration peaks (between 0.5 and 2 h) for individual subjects. Some of the phenolics, such astrans-cinnamic, vanillic, p-coumaric acids, and catechin showed second plasma concentration peaks.All of cranberry-derived phenolics increased significantly in urine samples after the intake of each cran-berry product. The high molecular weight quercetin and myricetin, which were abundant in cranberryfoodstuffs, were not found in either plasma or urine samples. This study provided the fundamental infor-mation for understanding the absorption and excretion of phenolics in the human gastrointestinal systemafter dietary intake of cranberry products.
� 2011 Elsevier Ltd. All rights reserved.
1. Introduction
Epidemiological studies have provided convincing evidence thatconsumption of fruits and vegetables rich in phenolic antioxidantcompounds is correlated with reduced incidence of cancer mortal-ity, and cardiovascular and neurological diseases (Feldman, 2001;Middleton, Kandaswami, & Theoharides, 2000; Puupponen-Pimiaet al., 2001; Samman, Lyons-Wall, & Cook, 1998; Seeram, 2008).In recent years, the absorption and metabolism of phenolic com-pounds has attracted considerable public and scientific interestsince the health-beneficial effects of dietary phenolics depend ontheir in vivo reachable concentrations (Manach, Williamson,Morand, Scalbert, & Rémésy, 2005; Parr & Bolwell, 2000). However,the absorption and subsequent distribution, metabolism and excre-tion of phenolics in humans are still poorly understood becausemost of the studies concerning the absorption of phenolics from die-tary were carried out on rats, while relatively, few papers deal withthe measurements of phenolics and their metabolites in human(Garry et al., 2005; Zhang & Zuo, 2004). On the other hand, the ana-lytical methods for the selective and sensitive determination ofphenolic compounds in body fluids are limited because the low
ll rights reserved.
ry and Biochemistry, Univer-Road, North Dartmouth, MA167.
concentrations and complex matrix of biological samples makethe analysis of phenolics difficult. In our previous studies, a gas chro-matography–mass spectrometer (GC–MS) method was developedfor analysing phenolic compounds in cranberry products (Chen &Zuo, 2007; Zuo, Wang, & Zhang, 2002), and it was further improvedin hydrolysis of conjugated phenolics by using the ultrasound andsuccessfully applied for determining twenty phenolics in cranberryjuice, sauces, and fruits (Wang & Zuo, 2011). However, the sensitiv-ity was not high enough to detect all phenolics at ultra-low levels inhuman plasma (Zhang & Zuo, 2004). Mass spectrometric detectionwith selective ion monitoring (SIM) mode was considered as a prom-ising technique for the analysis of biological fluid samples (Lau,Weber, & Andrews, 1996; Tsimeli, Triantis, Dimotikali, & Hiskia,2008). Goldberg et al. (1995) have developed an assay for trans-res-veratrol and cis-resveratrol. They directly injected the underivatisedsample extract into a GC–MS with the detector in the selective ionmonitoring mode (SIM) and achieved good separation and sensitivedetection. However, it is limited to only a single phenolic compound.Many studies have shown that the health benefits exerted by phen-olics are due to the combination of phytochemicals (phenolic acidsand flavonoids) but not the action of individual phenolics alone(Eberhardt, Lee, & Liu, 2000). Thus, a selective and sensitive analyt-ical method for the simultaneous determination of phenolics inhuman fluids is still urgently needed for understanding the bioavail-ability and consequences of biotransformation of phenolics afterconsumption of common fruits and vegetables.
C. Wang et al. / Food Chemistry 132 (2012) 1420–1428 1421
The aims of the present study were to monitor the concentra-tions of phenolic compounds in human plasma and urine, and tounderstand the absorption and excretion of individual phenolics,after consumption of cranberry products at normal doses, i.e. aserving size. For these purposes, the sensitivity and selectivity ofour previously developed GC–MS method for simultaneouslydetermining cranberry-derived phenolics in biological samples(Zhang & Zuo, 2004) has been further improved and applied in thisstudy. Cranberry products chosen in this study were analysed andcontain abundant phenolic compounds (Wang & Zuo, 2011). Theurinary phenolic concentrations were normalised by urinary creat-inine, which was analysed by a previously developed HPLC method(Zuo, Wang, Zhou, Sachdeva, & Ruelos, 2008), and the ‘‘creatinineratio’’ was used as a diagnostic marker (Viau, Lafontaine, & Payan,2004; Warrack et al., 2009; Zuo, Yang, Zhu, He, & Aydin, 2011).
2. Materials and methods
2.1. Chemicals
Phenolic, cinnamic and benzoic acid standards of m-methylben-zoic acid (internal standard), benzoic, o-hydroxybenzoic,p-hydroxybenzoic, trans-cinnamic, m-hydroxybenzoic, p-hydroxy-benzoic, p-hydroxyphenylacetic, o-phthalic, 2,3-dihydroxybenzoic,vanillic, o-hydroxycinnamic, 2,4-dihydroxybenzoic, p-coumaric,ferulic, caffeic, and sinapic acids, trans-resveratrol, (�)-epicatechin,catechin, quercetin, myricetin, and standards of creatinine andhypoxanthine were purchased from Acros Organics (Springfield,NJ). Methanol, hexane, acetonitrile, and ethyl acetate wereobtained from Pharmco Products (Brookfield, NJ) and N,O-bis(tri-methylsilyl)trifluoroacetamide (BSTFA) + 1% trimethylchlorosilane(TMCS) reagent was purchased from Supelco (Supelco Park, PA).Sodium phosphate and phosphorous acid were obtained from Fish-er Scientific (Fair Lawn, NJ). Sodium hydroxide was obtained fromCMS, Inc. (Houston, TX).
2.2. Samples
There were eleven normal healthy subjects (6 females and 5males, age 21–33 years) recruited for this study. The subjects werenot taking prescription drugs or vitamin and mineral supplements.One day before each sampling the subjects were instructed to re-frain from vegetables, fruits, whole grain cereals, coffee, tea, fruitjuice, and chocolate. During a 3 week periods, after an overnightfast and between 8 and 9 AM, subjects were randomly adminis-trated three different cranberry products as following: 240 ml ofR.W. Knudsen-Family 100% cranberry concentrate juice from J.M.Smucker (Orrville, OH; 25 g of sugar was added and mixed with240 ml of fountain water); 55 g of Canned Cranberry Sauce fromWegmans (Rochester, NY; containing 25 g of fruit sugars fromthe cranberries); 40 g of Dried Cranberry Craisins� from OceanSpray (Middleboro, MA; containing 29 g of sugar). Since the totalphenolics in three cranberry products were 12.4 mg/g in fruits,9.1 mg/ml in juice, and 11.1 mg/g in sauces (Wang & Zuo, 2011),the consumed phenolics in fruits, juice, and sauces were 0.496,2.184, 0.611 g, respectively. A low-fat bagel and water were con-sumed for lunch and a non-polyphenol-containing frozen dinnerof macaroni and cheese for supper. Blood was collected into Vacu-tainer K2EDTA (potassium ethylenediaminetetraacetate) tubesafter 0, 0.5, 1, 2, 3, and 4 h of consuming the cranberry products.A zero hour sample was collected immediately after consumption.After centrifugation to sediment the cells, the clear platelet-poorplasma was collected and stored in �80 �C freezer. Urine sampleswere collected for each subjects before (morning wake up) and
6 h after consumption of cranberry products and stored in �20 �Cfreezer until analysis.
2.3. Standards preparation
Before preparing plasma and urine samples for analysing the to-tal phenolics by GC–MS, the working standard solutions containingtwenty standard compounds were prepared in methanol at concen-trations of 0.0, 1.0, 2.5, 5.0, 10, 25, and 50 lg/ml for each phenoliccompound by combining and diluting the individual stock standardsolutions (1000 lg/ml) and the m-methylbenzoic acid (internalstandard) stock solution (50 lg/ml). Each plasma and urine sample(500 ll) was pipetted into 2 ml centrifuge tube and hydrolysedunder ultrasonication for 90 min at 35 �C after adding 100 ll 6 MHCl. All samples after hydrolysis were extracted three times with0.5 ml of ethyl acetate by vortexing for 1 min and the mixture wasthen centrifuged for 15 min. One of the plasma samples withoutultrasonic-assisted hydrolysis was prepared for the analysis of freephenolic compounds in biological fluids. In a separate analysis, eachsample extract (ethyl acetate layer) solution and 100 ll of eachworking standard solution was pipetted into a 2-ml clean mini-vialand dried by a stream of nitrogen after adding 20 ll internal stan-dard stock solution. The standard and sample extracts were deriva-tised by the addition of 50 ll BSTFA + 1% TMCS reagents and 50 llpyridine with heating at 70 �C in sealed 2-ml vials for 4 h.
Prior to the analysis of creatinine in urine samples by HPLC, a ser-ies of 1.6 ml creatinine working standards containing 10 lg/mlinternal standard were prepared freshly by adding 100 ll stockinternal standard solution (160 lg/ml hypoxanthine) and appropri-ately diluting the individual creatinine stock standard solutions(200 lg/ml) to obtain concentrations in the range of 0–25 lg/ml.Urine samples were diluted 100-fold with distilled water and acidi-fied to pH value of 2.35 with phosphorous acid to precipitate proteinbefore centrifugation at 5000g for 15 min. The supernatants werefiltered through 0.45 lm membrane filters after adjusting the pHto 6.85. The 1.6 ml solutions containing samples pretreated andinternal standard (10 lg/ml) were prepared for HPLC analysis.
2.4. Analytical methods
GC–MS analysis was carried out on a Hewlett–Packard (HP)model GC 5890 Series II gas chromatograph equipped with an HP5971 series mass selective detector and an HP 7673 GC auto-sampler. The silylated phenolic compounds in standards and sam-ples were separated on a 30 m � 0.32 mm i.d., 0.25 lm film DB-5fused-silica capillary column (J&W Scientific, Folsom, CA, USA).The column temperature was initially held at 80 �C for 1 min, thenprogrammed to 220 �C at a rate of 10 �C per min, from 220 �C to310 �C at a rate of 20 �C per min, and with a final hold time of6 min. Helium was used as the carrier gas and the column headpressure maintained at 13 psi. The injector and detector tempera-ture were maintained at 280 �C, and 305 �C, respectively, and theinjection volume was 1 ll with splitless mode. Electron impactionisation energy was 70 eV. However, to minimise the interfer-ences from biological sample matrix and improve the detectionsensitivity, the detection was conducted by selective ion monitor-ing (SIM) mass spectrometric detection mode. Matching retentiontimes and selected characteristic ions with the calibration stan-dards was used to identify the phenolic compounds in the plasmaand urine samples. All quantitation was performed by the methodof internal standardisation using m-methylbenzoic acid as internalstandard at a concentration of 10 lg/ml. The quantitation of thesecompounds was based on the ratio of the peak area of the com-pound interested over the peak area of the internal standard.
The creatinine in urine samples was determined by using ourpreviously developed HPLC method (Zuo et al., 2008). Briefly, a
1422 C. Wang et al. / Food Chemistry 132 (2012) 1420–1428
Dionex HPLC system equipped with a P680 pump, an UVD-170Uspectrophotometer detector, a Gina 50 auto-sampler, and Chrome-leon 6.60 software was used. The uric acid, creatinine, andhypoxanthine internal standard were separated on a symmetry
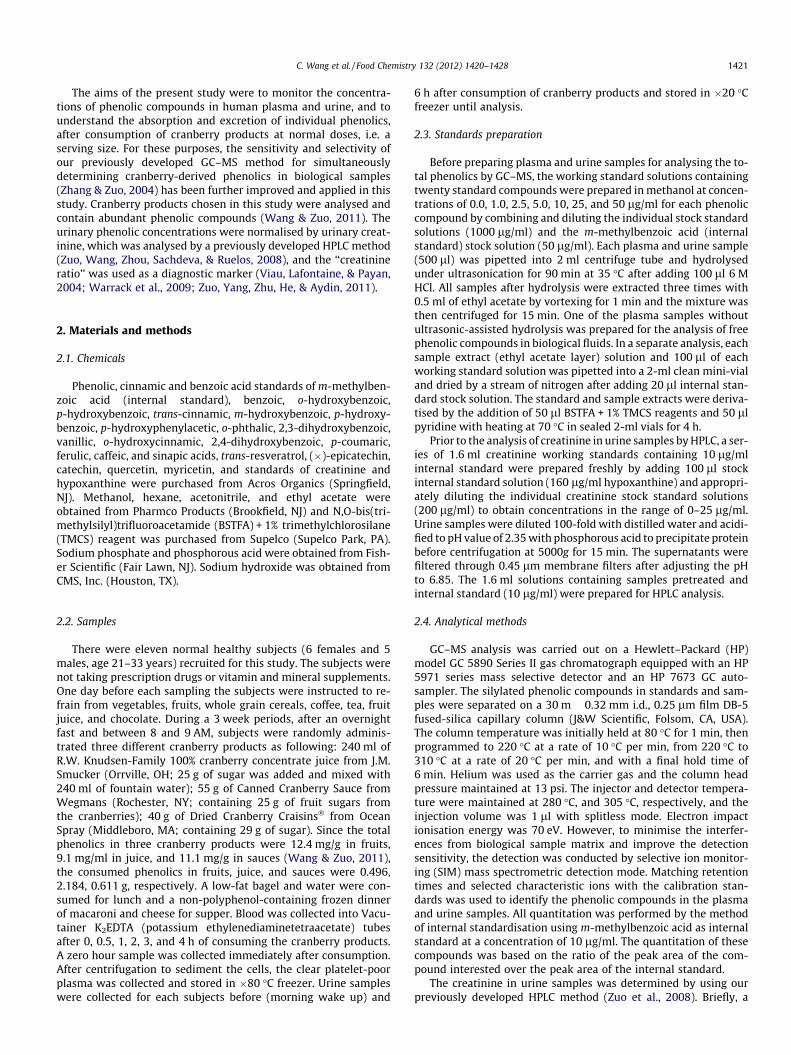
Fig. 1. GC–MS chromatograms of selected standards with internal standard (10 lg/ml) utrimethylsilyl (TMS) derivatives of standards. 1-benzoic acid; 2-o-hydroxybenzoic acidhydroxyphenylacetic acid; 7-o-phthalic acid; 8–2,3-dihydroxybenzoic acid; 9-vanillic aci13-ferulic acid; 14-caffeic acid; 15-sinapic acid; 16-trans-resveratrol; 17-(�)-epicatechi
Table 1Retention times and identified ions present in the mass spectra of silylated derivativesa o
Standards of phenolic compounds Retention time (min) Identified
Benzoic acid 6.95 194, 179o-Hydroxybenzoic acid 10.56 267, 209trans-Cinnamic acid 11.04 220, 205m-Hydroxybenzoic acid 11.28 282, 267p-Hydroxybenzoic acid 12.03 282, 267p-Hydroxyphenylacetic acid 12.19 296, 281o-Phthalic acid 12.70 310, 2952,3-Dihydroxybenzoic acid 13.24 355, 193Vanillic acid 13.57 312, 297o-Hydroxycinnamic acid 14.00 308, 2932,4-Dihydroxybenzoic acid 14.08 355, 281p-Coumaric acid 15.34 308, 293Ferulic acid 16.79 338, 323Caffeic acid 17.22 396, 381Sinapic acid 18.02 368, 353trans-Resveratrol 20.48 444,429(�)-Epicatechin 21.02 368, 355Catechin 21.12 368, 355Quercetin 22.22 647, 559Myricetin 22.42 647, 576m-Methylbenzoic acid (IS) 8.51 208, 193
a Identified as trimethylsilyl (TMS) derivative.b Characteristic peaks of TMS derivatives, which can be used as the identity of the coc y is the ratio of peak area of TMS derivatives of standards to that of internal standa
C18 reversed-phase column (150 � 3.00 mm i.d., 5 lm; Waters) fit-ted with a 10 mm C18 guard column and detected by direct UVabsorbance at 205 nm. Solvent gradients were formed by varyingthe proportion of (A) sodium phosphate buffer solutions (pH
sing TIC mode (25 lg/ml) and SIM mode (0.25 lg/ml). All peaks were identified as; 3-trans-cinnamic acid; 4-m-hydroxybenzoic acid; 5-p-hydroxybenzoic acid; 6-p-d; 10-o-hydroxycinnamic acid; 11–2,4-dihydroxybenzoic acid; 12-p-coumaric acid;n; 18-catechin; 19-quercetin; 20-myricetin.
f standards and samples by GC–MS-SIM.
ionsb (m/z) Calibration curve equationc Detection limits (lg/L)
y = 0.4354x + 0.0746 0.07y = 0.4694x + 0.1249 0.06y = 0.2750x + 0.0804 0.11y = 0.3760x + 0.0491 0.08y = 0.5651x + 0.1162 0.05y = 0.1204x + 0.0021 0.25y = 0.0714x � 0.0057 0.42y = 0.5662x + 0.1300 0.05y = 0.2065x + 0.0297 0.14y = 0.0910x + 0.0058 0.33y = 0.3390x � 0.0923 0.09y = 0.2136x + 0.0715 0.14y = 0.0865x + 0.0436 0.35y = 0.2850x + 0.1288 0.10y = 0.0798x + 0.0355 0.38y = 0.0843x + 0.0470 0.35y = 0.2980x + 0.0819 0.10y = 0.2784x + 0.0639 0.11y = 0.0062x + 0.0010 4.84y = 0.0043x + 0.0020 6.97
mpounds.rd; x is the concentration of standards.
C. Wang et al. / Food Chemistry 132 (2012) 1420–1428 1423
4.75) to (B) organic modifier acetonitrile as following: start with0.45 ml/min of 100% A solutions for 3.5 min, then changed to0.50 ml/min of 70% A and 30% B solutions from 3.5 to 5.0 min,and back to 0.50 ml/min of 100% A solutions until 10.0 min. Theidentification of creatinine in each urine sample was achieved bycomparing the HPLC chromatographic retention time and thequantification was carried out by relating the peak area of theidentified compound to that of the internal standard.
0
0.004
0.008
0.012
0.016
0.02
Post Post Post Post
Con
cent
ratio
n of
van
illic
acid
in p
lasm
a (u
g/m
L)
0
0.02
0.04
0.06
0.08
0 Post Post Post Post Post
Con
cent
ratio
n of
ben
zoic
acid
in p
lasm
a (u
g/m
L)
free total
0 Post0.5 h 1 h 2 h 3 h 4 h
0.5 h 1 h 2 h 3 h 4 h
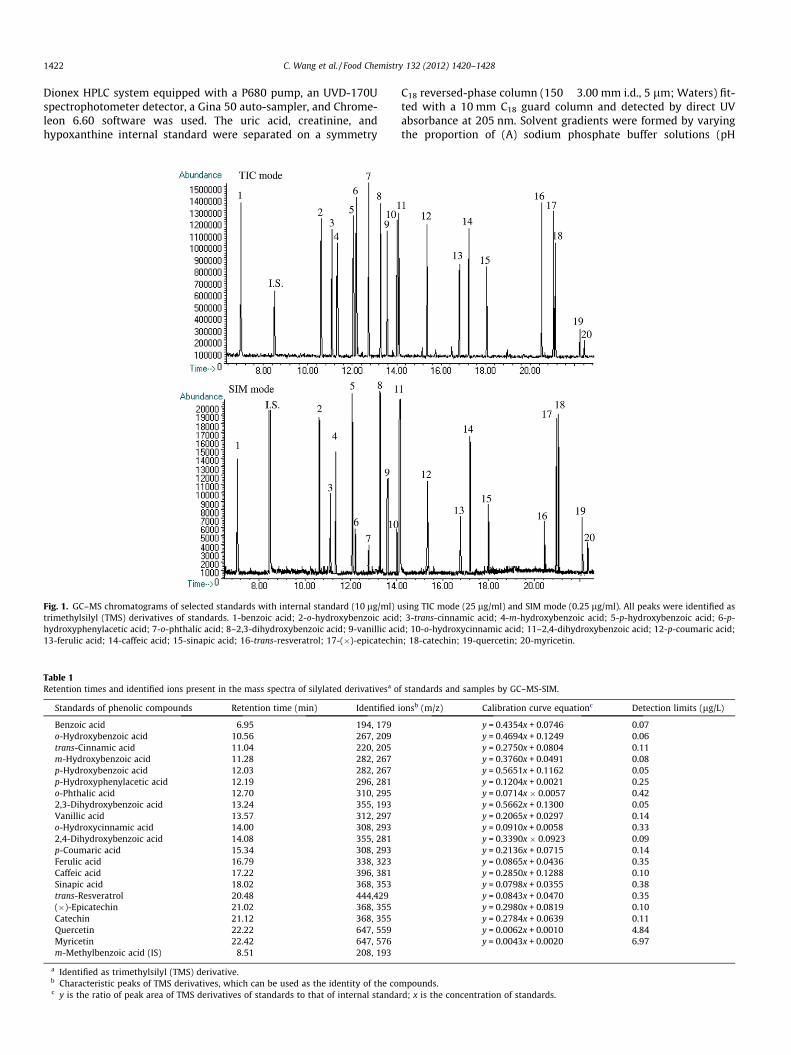
Fig. 2. Free and total (free + bound) of three individual phenolic acid compounds and b
0
0.02
0.04
0.06
0.08
0.1
0.12
0.14
1 2 3 4 5 6
Con
cent
ratio
n (u
g/m
L)
0 hour 0.5 hour 1
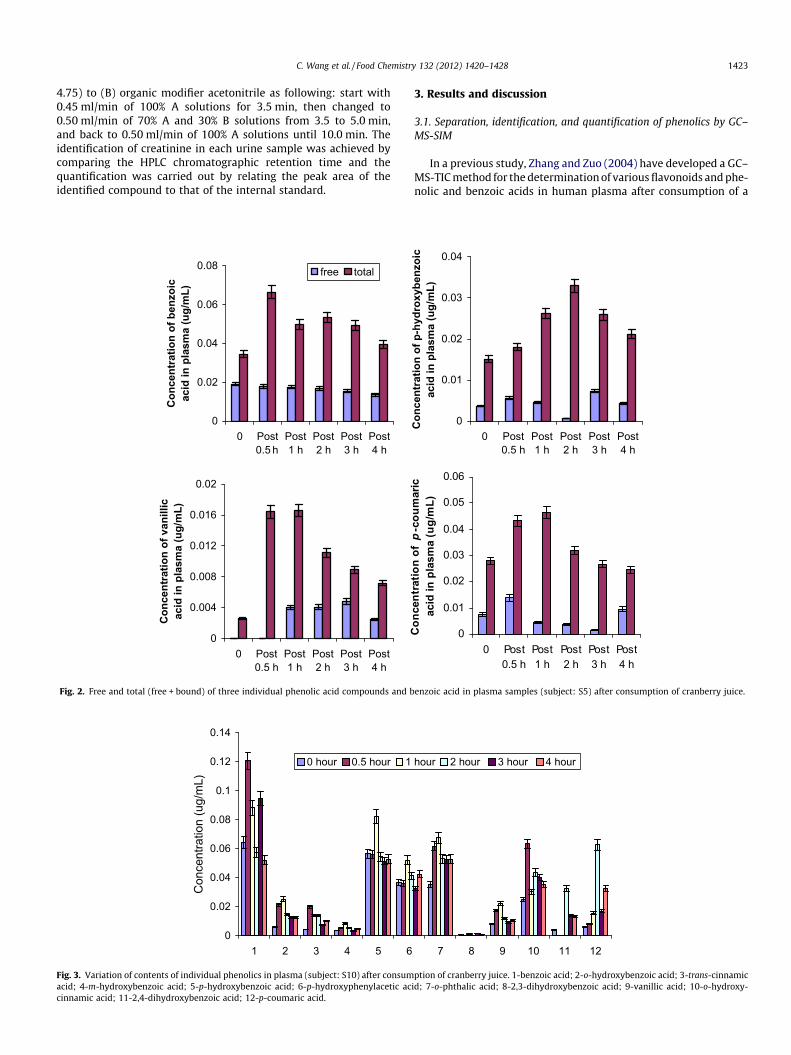
Fig. 3. Variation of contents of individual phenolics in plasma (subject: S10) after consumacid; 4-m-hydroxybenzoic acid; 5-p-hydroxybenzoic acid; 6-p-hydroxyphenylacetic accinnamic acid; 11-2,4-dihydroxybenzoic acid; 12-p-coumaric acid.
3. Results and discussion
3.1. Separation, identification, and quantification of phenolics by GC–MS-SIM
In a previous study, Zhang and Zuo (2004) have developed a GC–MS-TIC method for the determination of various flavonoids and phe-nolic and benzoic acids in human plasma after consumption of a
0
0.01
0.02
0.03
0.04
0.05
0.06
Post Post Post Post
Con
cent
ratio
n of
p-c
oum
aric
aci
d in
pla
sma
(ug/
mL)
0
0.01
0.02
0.03
0.04
Post Post Post Post
0 Post0.5 h 1 h 2 h 3 h 4 h
0 Post0.5 h 1 h 2 h 3 h 4 h
Con
cent
ratio
n of
p-h
ydro
xybe
nzoi
cac
id in
pla
sma
(ug/
mL)
enzoic acid in plasma samples (subject: S5) after consumption of cranberry juice.
7 8 9 10 11 12
hour 2 hour 3 hour 4 hour
ption of cranberry juice. 1-benzoic acid; 2-o-hydroxybenzoic acid; 3-trans-cinnamicid; 7-o-phthalic acid; 8-2,3-dihydroxybenzoic acid; 9-vanillic acid; 10-o-hydroxy-

1424 C. Wang et al. / Food Chemistry 132 (2012) 1420–1428
large dose of cranberry juice (1.8 L). In order to examine the concen-trations of phenolic compounds in human plasma and urine, andunderstand the absorption and excretion of individual phenolics,after consumption of cranberry products at normal doses, i.e. a serv-ing size, significant efforts have been made to improve the analyticalselectivity and sensitivity by using GC–MS-SIM mode. The standardphenolic compounds were chromatographed by GC–MS using TICmass spectrometric detection mode to locate the identificationparameters for each standard, including retention times and charac-teristic ions, which were used to set up the SIM detection mode inthis study. The scanning times and selected characteristic ions (m/z) of the GC–MS-SIM detection were 6.00–8.00 min (194, 179),8.00–10.00 min (208, 193), 10.00–10.80 min (267, 209),10.80–11.10 min (220, 205), 11.10–11.80 min (282, 267), 11.80–12.10 min (282, 267), 12.10–12.40 min (296, 281), 12.40–13.00 min (310, 295), 13.00–13.40 min (35, 193), 13.40–13.80 min(312, 297), 13.80–14.00 min (308, 293), 14.00–15.00 min (355,
0
0.3
0.6
0.9
1.2
1.5
1.8
S7 S10 S3 S5
Con
cent
ratio
n (u
g/m
L))
0 h 0.5
0
0.05
0.1
0.15
0.2
0.25
0.3
0.35
Con
cent
ratio
n (u
g/m
L)
0
0.05
0.1
0.15
0.2
0.25
0.3
0.35
S7 S3 S9
S7 S10 S2 S3
Con
cent
ratio
n (u
g/m
L)
(A)
(B)
(C)
Fig. 4. Total phenolic compounds concentration in plasma after c
281), 15.00–16.00 min (308, 293), 16.00–17.00 min (338, 323),17.00–17.80 min (396, 381), 17.80–20.00 min (368, 353), 20.00–20.60 min (444, 429), 20.60–22.00 min (368, 355), 22.00–22.30 min (647, 559), 22.30–24.00 min (647, 576). The SIM modeshows several advantages in comparison to the TIC mode for quan-tification of individual target compounds (Gelpi, 1982): (1) SIM onlyrecords a few selected m/z per scan, resulting in a much longer dwelltime for each monitored ion than in the TIC mode; (2) method detec-tion limits for target analytes with the SIM mode are generally lowerby almost an order of magnitude than those produced by the fullscan GC–MS; (3) the use of the SIM mode is often less noisy andthe linear quantification range is increased for trace analysis; (4)the selectivity is largely enhanced by eliminating matrix interfer-ences because unwanted ions are being filtered.
As shown in Fig. 1, a baseline separation of the twenty silylatedcompounds and the internal standard was achieved within 25 minusing the method described. The ratio of signal to noise was much
S9 S6 S4 S11
h 1 h 2 h 3h 4 h
S6 S4 S11
S9 S6 S4 S11
onsumption of cranberry (A) juice; (B) dried fruit; (C) sauce.
C. Wang et al. / Food Chemistry 132 (2012) 1420–1428 1425
higher using SIM mode than the TIC mode. The retention times, se-lected characteristic ions, calibration curve equations, and detec-tion limits for the identification and quantification of the silylatedcompounds by GC–MS-SIM are listed in Table 1. The detectionlimits of quercetin and myricetin were 4.84 lg/L and 6.97 lg/L,respectively. The detection limits of the remaining eighteen pheno-lic compounds were in the sub-ppb range of 0.05–0.42 lg/L. Therelative higher detection limits for quercetin and myricetin mightresult from their low derivatisation efficiency (Zhang & Zuo,2004). The relative standard deviation (RSD) was less than 4% basedon the 10 runs of 10 mg/L of standard mixtures using the developedGC–MS-SIM method.
3.2. Comparison of free and bound phenolics in biological samples
A set of the plasma samples (subject: S5; samples: after 0, 0.5, 1,2, 3, and 4 h of consumption of cranberry juices) without and withhydrolysis was analysed to compare free and bound compounds inbiological fluids. Only four benzoic and phenolic acids includingbenzoic, p-hydroxybenzoic, vanillic, and p-coumaric acids wereidentified in plasma samples without hydrolysis. Except for thesefour acids, six other compounds including o-hydroxybenzoic,trans-cinnamic, m-hydroxybenzoic, p-hydroxyphenylacetic, ando-phthalic acids and catechin were identified in the same plasmasamples after hydrolysis. Furthermore, the concentrations of fouridentified phenolic and benzoic acids in plasma samples withouthydrolysis were much lower than those in hydrolysed samples,as illustrated in Fig. 2. Apparently, the contents of bound phenoliccompounds were dominant in human plasma. Other studies(Manach et al., 1998; Natsume et al., 2003) have also shown thatphenolic compounds especially, when present in blood, becometightly bound to serum proteins and to the membranes of red
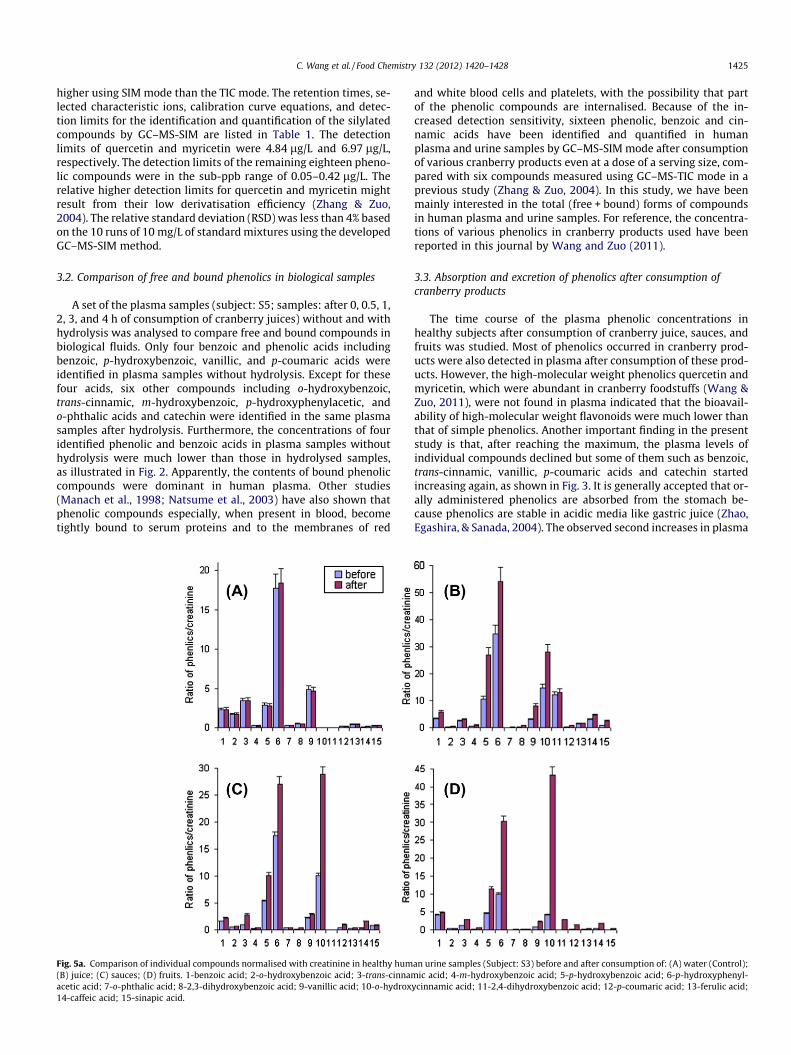
Fig. 5a. Comparison of individual compounds normalised with creatinine in healthy hum(B) juice; (C) sauces; (D) fruits. 1-benzoic acid; 2-o-hydroxybenzoic acid; 3-trans-cinnamacetic acid; 7-o-phthalic acid; 8-2,3-dihydroxybenzoic acid; 9-vanillic acid; 10-o-hydrox14-caffeic acid; 15-sinapic acid.
and white blood cells and platelets, with the possibility that partof the phenolic compounds are internalised. Because of the in-creased detection sensitivity, sixteen phenolic, benzoic and cin-namic acids have been identified and quantified in humanplasma and urine samples by GC–MS-SIM mode after consumptionof various cranberry products even at a dose of a serving size, com-pared with six compounds measured using GC–MS-TIC mode in aprevious study (Zhang & Zuo, 2004). In this study, we have beenmainly interested in the total (free + bound) forms of compoundsin human plasma and urine samples. For reference, the concentra-tions of various phenolics in cranberry products used have beenreported in this journal by Wang and Zuo (2011).
3.3. Absorption and excretion of phenolics after consumption ofcranberry products
The time course of the plasma phenolic concentrations inhealthy subjects after consumption of cranberry juice, sauces, andfruits was studied. Most of phenolics occurred in cranberry prod-ucts were also detected in plasma after consumption of these prod-ucts. However, the high-molecular weight phenolics quercetin andmyricetin, which were abundant in cranberry foodstuffs (Wang &Zuo, 2011), were not found in plasma indicated that the bioavail-ability of high-molecular weight flavonoids were much lower thanthat of simple phenolics. Another important finding in the presentstudy is that, after reaching the maximum, the plasma levels ofindividual compounds declined but some of them such as benzoic,trans-cinnamic, vanillic, p-coumaric acids and catechin startedincreasing again, as shown in Fig. 3. It is generally accepted that or-ally administered phenolics are absorbed from the stomach be-cause phenolics are stable in acidic media like gastric juice (Zhao,Egashira, & Sanada, 2004). The observed second increases in plasma
an urine samples (Subject: S3) before and after consumption of: (A) water (Control);ic acid; 4-m-hydroxybenzoic acid; 5-p-hydroxybenzoic acid; 6-p-hydroxyphenyl-
ycinnamic acid; 11-2,4-dihydroxybenzoic acid; 12-p-coumaric acid; 13-ferulic acid;
1426 C. Wang et al. / Food Chemistry 132 (2012) 1420–1428
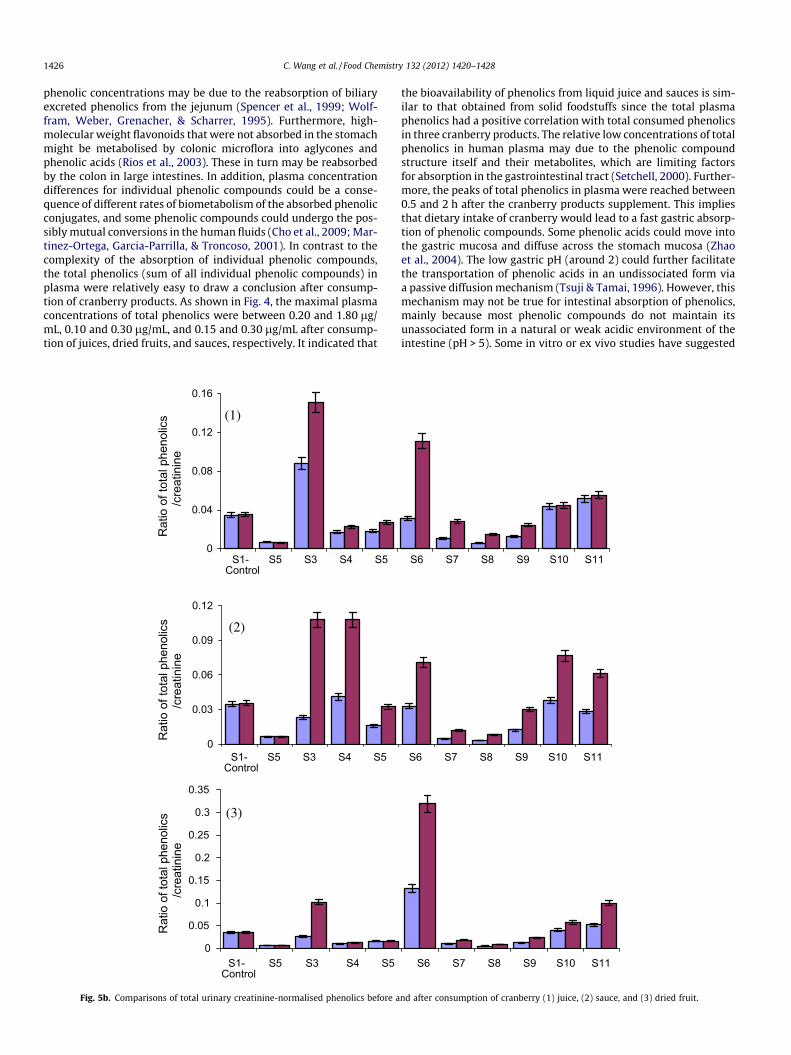
phenolic concentrations may be due to the reabsorption of biliaryexcreted phenolics from the jejunum (Spencer et al., 1999; Wolf-fram, Weber, Grenacher, & Scharrer, 1995). Furthermore, high-molecular weight flavonoids that were not absorbed in the stomachmight be metabolised by colonic microflora into aglycones andphenolic acids (Rios et al., 2003). These in turn may be reabsorbedby the colon in large intestines. In addition, plasma concentrationdifferences for individual phenolic compounds could be a conse-quence of different rates of biometabolism of the absorbed phenolicconjugates, and some phenolic compounds could undergo the pos-sibly mutual conversions in the human fluids (Cho et al., 2009; Mar-tinez-Ortega, Garcia-Parrilla, & Troncoso, 2001). In contrast to thecomplexity of the absorption of individual phenolic compounds,the total phenolics (sum of all individual phenolic compounds) inplasma were relatively easy to draw a conclusion after consump-tion of cranberry products. As shown in Fig. 4, the maximal plasmaconcentrations of total phenolics were between 0.20 and 1.80 lg/mL, 0.10 and 0.30 lg/mL, and 0.15 and 0.30 lg/mL after consump-tion of juices, dried fruits, and sauces, respectively. It indicated that
0
0.04
0.08
0.12
0.16
S1-Control
S5 S3 S4 S5
S1-Control
S5 S3 S4 S5
S1-Control
S5 S3 S4 S5
Rat
io o
f tot
al p
heno
lics (1)
0
0.03
0.06
0.09
0.12
Rat
io o
f tot
al p
heno
lics (2)
0
0.05
0.1
0.15
0.2
0.25
0.3
0.35
Rat
io o
f tot
al p
heno
lics (3)
/cre
atin
ine
/cre
atin
ine
/cre
atin
ine
Fig. 5b. Comparisons of total urinary creatinine-normalised phenolics before a
the bioavailability of phenolics from liquid juice and sauces is sim-ilar to that obtained from solid foodstuffs since the total plasmaphenolics had a positive correlation with total consumed phenolicsin three cranberry products. The relative low concentrations of totalphenolics in human plasma may due to the phenolic compoundstructure itself and their metabolites, which are limiting factorsfor absorption in the gastrointestinal tract (Setchell, 2000). Further-more, the peaks of total phenolics in plasma were reached between0.5 and 2 h after the cranberry products supplement. This impliesthat dietary intake of cranberry would lead to a fast gastric absorp-tion of phenolic compounds. Some phenolic acids could move intothe gastric mucosa and diffuse across the stomach mucosa (Zhaoet al., 2004). The low gastric pH (around 2) could further facilitatethe transportation of phenolic acids in an undissociated form viaa passive diffusion mechanism (Tsuji & Tamai, 1996). However, thismechanism may not be true for intestinal absorption of phenolics,mainly because most phenolic compounds do not maintain itsunassociated form in a natural or weak acidic environment of theintestine (pH > 5). Some in vitro or ex vivo studies have suggested
S6 S7 S8 S9 S10 S11
S6 S7 S8 S9 S10 S11
S6 S7 S8 S9 S10 S11
nd after consumption of cranberry (1) juice, (2) sauce, and (3) dried fruit.
C. Wang et al. / Food Chemistry 132 (2012) 1420–1428 1427
an H+-driven transport process in the uptake of cinnamic acid andstructurally related substances such as ferulic and p-coumaric acidsacross the brush border membrane of jejunum (Itagaki et al., 2005).However, such transporters have not been identified and furtherevidence is required to determine the possible role of this type oftransporters in phenolics uptake. Individual variations in times ofabsorption peaks and the extent of concentration changes of uptak-en phenolic compounds were obtained for different selected sub-jects. It is important to note that this variation in profile acrosssubjects might be due to the individual differences in human intes-tine physiology and absorbability, which affects the fate of dietaryphenolics in the gastrointestinal tract and their systemic concentra-tions. The cumulative urinary excretion of total phenolics may beused to estimate the absorbability of individual subjects, becauseabsorbed phenolics are excreted mainly through urine (Rondini,Peyrat-Maillard, Marsset-Baglieri, & Berset, 2002).
As well known, phenolic compounds and their conjugates arepolar, water-soluble compounds that are apparently readilyexcreted by mammals in the urine. The quantitative results in thisstudy suggested that urinary excretion of phenolic compounds wasmuch higher than those in plasma. This indicated that these phen-olics and their metabolites do not accumulate in specific organs ortissues during their absorption and metabolism in human body, andfurther suggested a rapid filtration of phenolics by the kidneys andthe possible accumulation of phenolics in urine. However, similar toplasma samples, the absolute concentrations of some high molecu-lar-weight phenolics in human urines were low and even not found,such as quercetin and myricetin, which are abundant in all cran-berry products. This could be explained by assuming that most ofthe high molecular-weight phenolics existed as conjugated deriva-tives with reduced antioxidant activities as observed by Manachet al. (1998), and precipitated with proteins during the samplepreparation. Some of these high molecular-weight phenolics weremetabolised and biodegraded within 6 h in stomach, intestine,and liver (Ward, Croft, Puddey, & Hodgson, 2004). Extensive degra-dation of flavonoids by the intestinal bacterial microflora into moreabsorbable low-molecular-weight phenolic acids has been reportedby Rios et al. (2003). As illustrated in Figs. 5a and 5b, all creatinine-normalised phenolic compounds increased significantly in urinesamples of all subjects after the intake of each cranberry product.However, the increased extents of total phenolic compounds variedwith individual subjects due to the different absorbability.
4. Conclusions
The GC–MS-SIM technique provides a sensitive and simulta-neous determination of phenolics in human fluids, and has beenemployed to examine the absorption and excretion of phenolicantioxidant compounds in the human body. Sixteen phenolic, ben-zoic, and cinnamic acids have been identified and quantified inhuman plasma and urine samples after consumption of variouscranberry products. The conjugated phenolics were dominant spe-cies in biological fluids. The dietary intake of cranberry led to a fastgastric absorption of low molecular weight phenolics. Some ofcompounds, such as trans-cinnamic, vanillic, and p-coumaric acids,and catechin showed the second plasma concentration peaks pos-sibly due to the re-absorption in large intestines. Cranberry-derived phenolics could undergo a rapid filtration by the kidneysand be accumulated in urine after the intake of each of three cran-berry products examined.
Acknowledgements
The authors would like to thank Dr. E. Ojadi for his contribu-tions to this work. Kunal N. Patel and Shachi C. Patel ably directed
the clinical study at the University of Scranton. This research waspartly supported by the Massachusetts Agriculture Research Fund.
References
Chen, H., & Zuo, Y. (2007). Identification of flavonol glycosides in Americancranberry fruit. Food Chemistry, 101, 1357–1364.
Cho, K. M., Hong, S. Y., Math, R. K., Lee, J. H., Kambiranda, D. M., Kim, J. M., et al.(2009). Biotransformation of phenolics (isoflavones, flavanols and phenolicacids) during the fermentation of cheonggukjang by Bacillus pumilus HY1. FoodChemistry, 114, 413–419.
Eberhardt, M. V., Lee, C. Y., & Liu, R. H. (2000). Antioxidant activity of fresh apples.Nature, 405, 903–904.
Feldman, E. B. (2001). Fruits and vegetable and the risk of stroke. Nutrition reviews,59, 24–27.
Garry, G. D., Jane, A. M. K., Alison, M. J., Susan, J. D., Gwen, J. B., & John, R. P. (2005).Increased salicylate concentrations in urine of human volunteers afterconsumption of cranberry juice. Journal of Agricultural and Food Chemistry, 53,2897–2900.
Gelpi, E. (1982). Gas chromatography–mass spectrometry and selected ionmonitoring of biogenic amines and related metabolites. In G. B. Baker & R. T.Coutts (Eds.). Evaluation of analytical methods in biological systems. Part A:Analysis of biogenic amines (Vol. 4, pp. 151–179). New York: Elsevier SciencePublishing Company Inc..
Goldberg, D. M., Karumanehiri, A., Ng, E., Yan, J., Diamandis, P., & Soleas, G. J. (1995).Direct gas chromatographic–mass spectrometric method to assay cis-resveratrol in wines: Preliminary survey of its concentration in commercialwines. Journal of Agricultural and Food Chemistry, 43, 1245–1250.
Itagaki, S., Kobayashi, Y., Otsuka, Y., Kubo, S., Kobayashi, M., & Hirano, T. (2005).Food–drug interaction between ferulic acid and nateglinide involving thefluorescein/H+-cotransport system. Journal of Agricultural and Food Chemistry,53, 2499–2502.
Lau, B., Weber, B., & Andrews, P. (1996). GC/MS analysis of toxaphene: Acomparative study of different mass spectrometric techniques. Chemosphere,32, 1021–1041.
Manach, C., Morand, C., Crespy, V., Demigne, C., Texier, O., Regerat, F., et al. (1998).Quercetin is recovered in human plasma as conjugated derivatives which retainantioxidant properties. FEBS Letter, 426, 331–336.
Manach, C., Williamson, G., Morand, C., Scalbert, A., & Rémésy, C. (2005).Bioavailability and bioefficiency of polyphenols in humans. I. Review of 97bioavailability studies. American journal of clinical nutrition, 81, 230–242.
Martinez-Ortega, M. V., Garcia-Parrilla, M. C., & Troncoso, A. M. (2001). Changes inphenolic composition of wines submitted to in vitro dissolution tests. FoodChemistry, 73, 11–16.
Middleton, E., Kandaswami, C., & Theoharides, T. C. (2000). The effects of plantflavonoids on mammalian cells: implications for inflammation, heart diseaseand cancer. Pharmacological Reviews, 52, 673–751.
Natsume, M., Osakabe, N., Oyama, M., Sasaki, M., Baba, S., Nakamura, Y., et al.(2003). Structures of (�)-epicatechin glucuronide identified from plasma andurine after oral ingestion of (�)-epicatechin: Differences between human andrat. Free Radical Biology and Medicine, 34, 840–849.
Parr, A. J., & Bolwell, G. P. (2000). Phenols in the plant and in man – Thepotential for possible nutritional enhancement of the diet by modifying thephenols content or profile. Journal of the Science of Food and Agriculture, 80,985–1012.
Puupponen-Pimia, R., Nohynek, L., Meier, C., Kahkonen, M., Heinonen, M., & Hopia,A. (2001). Antimicrobial properties of phenolic compounds from berries. Journalof applied Microbiology, 90, 494–507.
Rios, L. Y., Gonthier, M. P., Remesy, C., Mila, I., Lapierre, C., Lazarus, S. A., et al. (2003).Chocolate intake increases urinary excretion of polyphenol-derived phenolicacids in healthy human subjects. American journal of clinical nutrition, 77,912–918.
Rondini, L., Peyrat-Maillard, M. N., Marsset-Baglieri, A., & Berset, C. (2002). Sulfatedferulic acid is the main in vivo metabolite found after short-term ingestion offree ferulic acid in rats. Journal of Agricultural and Food Chemistry, 50,3037–3041.
Samman, S., Lyons-Wall, P. M., & Cook, N. C. (1998). Flavonoids and coronary heartdisease: Dietary perspectives. In C. A. Rice-Evans & L. Packer (Eds.), Flavonoids inhealth and disease (pp. 469–482). Marcel Dekker: New York.
Seeram, N. P. (2008). Berry fruits for cancer prevention: Current status and futureprospects. Journal of Agricultural and Food Chemistry, 56, 630–635.
Setchell, K. D. (2000). Absorption and metabolism of soy isoflavones from food todietary supplements and adults to infants. Journal of Nutrition, 130, 645–655.
Spencer, J. P., Chowrimootoo, G., Choudhury, R., Debnam, E. S., Srai, S. K., & Rice-Evans, C. (1999). The small intestine can both absorb and glucuronidate luminalflavonoids. FEBS Letter, 458, 224–230.
Tsimeli, K., Triantis, T. M., Dimotikali, D., & Hiskia, A. (2008). Developmentof a rapid and sensitive method for the simultaneous determinationof 1,2-dibromoethane, 1,4-dichlorobenzene and naphthalene residues inhoney using HS-SPME coupled with GC–MS. Analytica Chimica Acta, 617,64–71.
Tsuji, A., & Tamai, I. (1996). Carrier-mediated intestinal transport of drugs.Pharmacological Reviews, 13, 963–977.
1428 C. Wang et al. / Food Chemistry 132 (2012) 1420–1428
Viau, C., Lafontaine, M., & Payan, J. P. (2004). Creatinine normalization in biologicalmonitoring revisited: The case of 1-hydroxypyrene. International Archives ofOccupational and Environmental Health, 77, 177–185.
Wang, C., & Zuo, Y. (2011). Ultrasound-assisted hydrolysis and gaschromatography–mass spectrometric determination of phenolic compoundsin cranberry products. Food Chemistry, 128, 562–568.
Warrack, B. M., Hnatyshyn, S., Ott, K. H., Reily, M. D., Sanders, M., Zhang, H., et al.(2009). Normalization strategies for metabolic analysis of urine samples. Journalof Chromatography B, 877, 547–552.
Ward, N. C., Croft, K. D., Puddey, I. B., & Hodgson, J. M. (2004). Supplementationwith grape seed polyphenols results in increased urinary excretionof 3-hydroxyphenylpropionic acid, an important metabolite ofproanthocyanidins in humans. Journal of Agricultural and Food Chemistry, 52,5545–5549.
Wolffram, S., Weber, T., Grenacher, B., & Scharrer, E. (1995). A Na(+)-dependentmechanism is involved in mucosal uptake of cinnamic acid across the jejunalbrush border in rats. Journal of Nutrition, 125, 1300–1308.
Zhang, K., & Zuo, Y. (2004). GC–MS determination of flavonoids and phenolic andbenzoic acids in human plasma after consumption of cranberry juice. Journal ofAgricultural and Food Chemistry, 52, 222–227.
Zhao, Z., Egashira, Y., & Sanada, H. (2004). Ferulic acid is quickly absorbed from ratstomach as the free form and then conjugated mainly in liver. Journal ofNutrition, 34, 3083–3088.
Zuo, Y., Wang, C., & Zhang, J. (2002). Separation, characterization, and quantitationof benzoic and phenolic antioxidants in American cranberry fruit by GC–MS.Journal of Agricultural and Food Chemistry, 50, 3789–3794.
Zuo, Y., Wang, C., Zhou, J., Sachdeva, A., & Ruelos, V. C. (2008). Simultaneousdetermination of creatinine and uric acid in human urine by high performanceliquid chromatography. Analytical Science, 24, 1589–1592.
Zuo, Y., Yang, Y., Zhu, Z., He, W., & Aydin, Z. (2011). Determination of uric acid andcreatinine in human urine using hydrophilic interaction chromatography.Talanta, 83, 1707–1710.