Absorción y bioacumulación de Cadmio en tres cultivares de ...
75
Universidad de Concepción Dirección de Postgrado Facultad de Agronomía - Programa de Doctorado en Ciencias de la Agronomía Absorción y bioacumulación de Cadmio en tres cultivares de maíz (Zea mays L.) para diferentes medioambientes de Chile Cadmium absorption and bioaccumulation in three cultivars of maize (Zea mays L.) for different environments of Chile Tesis para optar al grado de Doctor en Ciencias de la Agronomía JORGE ANDRÉS RETAMAL SALGADO CHILLÁN-CHILE 2017 Profesor Guía: Dr. Juan Hirzel Campos Departamento de Recursos Naturales Instituto de Investigaciones Agropecuarias
Transcript of Absorción y bioacumulación de Cadmio en tres cultivares de ...
Universidad de Concepción
Dirección de Postgrado
Facultad de Agronomía - Programa de Doctorado en Ciencias de la Agronomía
Absorción y bioacumulación de Cadmio en tres cultivares de maíz
(Zea mays L.) para diferentes medioambientes de Chile
Cadmium absorption and bioaccumulation in three cultivars of
maize (Zea mays L.) for different environments of Chile
Tesis para optar al grado de Doctor en Ciencias de la Agronomía
JORGE ANDRÉS RETAMAL SALGADO
CHILLÁN-CHILE
2017
Profesor Guía: Dr. Juan Hirzel Campos
Departamento de Recursos Naturales
Instituto de Investigaciones Agropecuarias
ii
Absorción y bioacumulación de Cadmio en tres cultivares de maíz (Zea mayz L.) para
diferentes medioambientes de Chile
Aprobada por:
Juan Hirzel Campos ____________________
Ing. Agrónomo, Mg. Sc., Dr. Cs. Profesor Guía
Erick Zagal Venegas ____________________
Ing. Agrónomo, Mg. Sc., Ph. D. Profesor Co-Guía
Neal Stolpe Lau ____________________
Ing. Agrónomo, Mg. Sc., Ph. D. Evaluador interno
Gonzalo Silva Aguayo ____________________
Ing. Agrónomo, Mg. Cs., Dr. Cs. Director de Programa
iii
DEDICATORIA
Al amor de mi vida, Cecilia, quien me apoyo durante toda mi carrera, entregándome
preocupación, aliento, entusiasmo, energía y la confianza necesaria para poder concretar con
éxito esta meta. A mi hijo Camilo, mi nueva energía para seguir en este camino.
A mi mamá Dori y segunda madre Eliana que jamas olvidare, por sus apoyos incondicionales, sin
ellas jamás hubiese logrado concretar con éxito esta meta. A mi hermano Sebastian y mi sobrina
Paula, por su cariño y apoyo.
A todos ellos, gracias por su amor, tolerancia y respeto.
iv
AGRADECIMIENTOS
A mi profesor guía el Dr. Juan Hirzel Campos, por la entrega de conocimiento y exigencia
rigurosa en el proceso de formación académica y científica, además por su valiosos consejos y
sincera amistad. Por creer en mí y apoyar durante todo el proceso estudiantil.
A Fondecyt Chile por el apoyo financiero de la investigación, atraves del proyecto Nº 1120992.
v
TABLA DE CONTENIDOS
Página
INDICE DE TABLAS…..…………………………………………………... vii
INDICE DE FIGURAS….…………………….……………………………. viii
RESUMEN ix
ABSTRACT xii
I INTRODUCCIÓN GENERAL 1
II BIBLIOGRAFIA 7
III CAPITULO I: CADMIUM ABSORPTION AND
DISTRIBUTION OF THREE MAIZE HYBRIDS IN THREE
ENVIRONMENTS
12
3.1 Abstract………………………………………………………… 12
3.2 Introduction.……………………………………………………. 13
3.3 Materials and methods.………………………………………… 14
3.4 Results….……………………………………………………… 17
3.5 Discussion……………………………………………………. 20
3.6 Conclusions…………………………………………………… 23
3.7 References……………………………………………………… 24
3.8 Tables and figures……………………………………………… 29
vi
IV CAPITULO II: BIOABSORPTION AND BIOACCUMULATION
OF CADMIUM IN THE STRAW AND GRAIN OF MAIZE (ZEA
MAYS L.) IN GROWING SOILS CONTAMINATED WITH
CADMIUM IN DIFFERENT ENVIRONMENT
37
4.1 Abstract...……………………….……………………………… 37
4.2 Introduction ……………………………………………………. 38
4.3 Materials and methods ..……………………………………...... 39
4.4 Resultados……………………………………………………… 44
4.5 Discussion...……………………………………………………. 51
4.6 Conclusions…………………………………………………….. 55
4.7 References…..………………………………………………….. 56
V CONCLUSIONES GENERALES 61
vii
LISTADO DE TABLAS
Table 1 (Capitulo I) Climatic characteristics of each environment during the
2013 season……………………………………………... 29
Table 2 (Capitulo I) Soil physical and chemical properties (0 - 0.2 and 0.2 -
0.4 m depths)……………………………………………. 30
Table 3(Capitulo I) Significance levels of evaluated parameters for
experiments conducted with three maize hybrids
fertilized with three CdCl2 rates at three environments… 31
Table 1 (Capitulo II) Soil physical and chemical properties (0 to 0.2 and 0.2
to 0.4 m depth)……………………………………..…… 40
Table 2 (Capitulo II) Climatic characteristics of each environment during the
season 2013 – 2014……………………………………... 42
Table 3 (Capitulo II) Significance levels of the evaluated parameters for the
experiments maked in three corn cultivars fertilized with
three CdCl2 rates on three environments
…………………………………………………………... 45
Table 4 (Capitulo II) Dry matter production (Mg·ha-1
) according to maize
plant parts for a) different study environments, b) CdCl2
rates, and c) maize cultivars ……...…………………….. 45
Table 5 (Capitulo II) Cadmium extraction levels (g·ha-1
) for each maize plant
organ for a) different environments, b) CdCl2 rates, and
c) maize cultivars ……………………..………………... 46
Table 6 (Capitulo II) Values for cadmium bioaccumulation factor (BAF),
bioconcentration factor (BCF), translocation factor (TF),
and tolerance index (TI) for grain, straw, and root
according to different a) environments, b) CdCl2 rates,
and c) maize cultivars…………….…………………….. 49
viii
LISTADO DE FIGURAS
Figure 1 (Capitulo I) Maize grain yield at three environments as a mean of
different cultivars and Cd rates.………………………… 32
Figure 2 (Capitulo I) Cadmium content in the maize plant for a) different
environments, b) cadmium rates, and c) hybrids.……. 33
Figure 3 (Capitulo I) Soil total cadmium content in two soil depths at maize
crop harvest for different a) environments, b) cadmium
rates, and c) hybrids…...………………………………. 35
Figure 1 (Capitulo II) Cadmium distribution in the maize plant for different a)
environments, b) cadmium rates, and c) maize
cultivars……………………………………………….... 48
ix
RESUMEN
La contaminación del suelo con metales pesados antropogénicos liberados desde la industria o la
agricultura, ha recibido mucha atención en los últimos años. El Cadmio (Cd) es uno de los
metales pesados que suele estar presente en los suelos, siendo tóxico para los organismos vivos, y
es cancerígeno para los seres humanos. La Organización Mundial de la Salud (OMS) ha
considerado tóxico para los seres humanos una concentración de Cd correspondiente a una
ingesta diaria de 0.83 µg kg-1
de peso corporal o 70 µg Cd por persona. La severidad y el daño de
estos metales dependen del tiempo, nivel de exposición, susceptibilidad de la persona. A pesar
que el Cd no es un nutriente esencial para las plantas, este metal puede ser absorbido en mayor
cantidad que otros elementos, sin efectos adversos en el crecimiento. Las especies de cultivos y
cultivares difieren ampliamente en su capacidad de absorber, acumular y tolerar Cd. Dentro de
los alimentos mas utilizados en la dieta humana y que han presentado una concentración de Cd en
el grano por sobre los límites permitidos para la salud humana, destacan el trigo duro (Triticum
turgidum L. var. Durum), maíz (Zea mays L.), trigo (Triticum aestivum L. ), avena (Avena sativa
L.), entre otros. En cuanto a la concentración de Cd en el suelo considerados de riesgo, diversos
autores señalan que este valor corresponde a 0,8 – 1,0 mg kg-1
de C. La acidez o basicidad del
suelo (pH) también afecta a la disponibilidad de Cd en el suelo para el cultivo. El
enriquecimiento de los suelos pueden dar lugar a la transferencia involuntaria y acelerada de
elementos traza a través de la cadena alimentaria. En granos de cultivos para el consumo humano
se han mostrado diferentes concentraciones de Cd, con algunos de ellos sobre el límites para la
salud humana. Dentro de la disponibilidad de suelos se podría encontrar algunos con
concentraciones cercanas o mayores al nivel crítico de 1 mg kg-1
de Cd total, donde será
necesario disponer de especies y cultivares que presenten una menor acumulación y translocación
de este metal. En este trabajo se plantean las siguientes hipótesis: a) La absorción Cd por parte de
la planta de maíz es afectada por la concentración de este metal presente en el suelo. b) La
absorción y acumulación de Cd es diferencial según la estructura de la planta de maíz. c) La tasa
acumulación de Cd en la planta de maíz dependerá del cultivar y la interacción con el
medioambiente. Para dar respuesta a las hipótesis antes planteadas, se establecieron los siguientes
objetivos específicos: a) Identificar los suelos utilizados para la agricultura que presentan riesgo
de contaminación de Cd. b) Seleccionar híbridos de maíz que presentan menor riesgo tanto de
x
absorción y acumulación de Cd. c) Identificar cultivares de maíz de baja acumulación de Cd para
las distintas zonas agroclimáticas de Chile.
Durante la temporada 2013-15 se realizaron tres experiencias de campo en diferentes
medioambientes agrícolas de Chile. Los medioambientes fueron los siguientes; i) La Serena
(30º3’ S ; 71º14’ W), suelo de origen aluvial-coluvial (Typic Haplocambids); ii) Los Tilos
(33º34’ S; 70º37’ W), suelo de origen aluvial (Haploxeroll), de clima mediterráneo semiárido y
templado; iii) Chillán (36º31’ S; 71º54’ W), suelo de origen volcánico (Melanoxerand), de clima
mediterráneo templado. Para cada medioambiente se analizaron las propiedades físico-quimicas a
dos profundidades antes de implementar los experiemntos (0 – 0.2 y 0.2 – 0.4 m), estos análisis
se realizaron según la metodología indicada por Sadzawka et al. (2006). El Cd total del suelo y la
planta se determinó por espectrofotometría de absorción atómica electrotermica (Técnica de
horno de grafito) con el equipo Thermo elemental solar M5 acoplado a un horno de grafito
modelo GF95. Las muestras fueron digeridas en un horno de microondas (MARS-Xpress, CEM
Corporation, Matthews, Carolina del Norte, EE.UU.) antes de las lecturas por espectrofotometría.
Para cada muestra de suelo, se pesó 0.5 g y se añadió 10 mL (Acido nítrico 65%, Acido Nítrico
Suprapur, Merck Millipore, Darmstadt, Germany), en tanto, para las muestras de tejido vegetal,
que se colocó en un tubo de digestión 1 g DM de maíz, y se le añadió 10 mL Suprapur HNO3, + 1
mL al 30% de H2O2. El control de calidad para los análisis se basó en el material de referencia
certificado (ISE 979 para suelo y IPE 981 para tejido vegetal), comparación de las muestras entre
laboratorios, las muestras de control interno, y los duplicados (Trejo et al., 2016). El Cd fue
aplicado a la forma de CdCl2 (61.3% of Cd), cuya dosis de esta sal correspondió a 0, 1 y 2 mg kg-
1, ajustado para una profundidad de suelo de 0 a 0.2 m considerando la densidad aparente de cada
suelo. Se utilizaron tres cultivares para cada mediambiente (Singenta, Pionner, Delkab), que
poseen características genéticas diferentes, por lo cual se esperaría diferentes respuestas. Las
practicas de manejo agronómico se estandarizaron para todos los lugares. Cuando los granos
alcanzaron 15% de contenido de humedad, se realizó la cosecha del cultivo y se determinó la
materia seca (MS) del grano, en raíz y residuo (tallo + hoja), y siguiendo la misma segmentación
se determino el Cadmio total. Al final del experimento se colectaron 10 muestras de suelo de
cada parcela a dos profundidades (0 – 0.2 y 0.2 – 0.4 m), estas se secaron al aire, posteriormente
se molieron y se pasó por un tamiz de 2 mm, para determinar el Cd total.
Posteriormente con los resultados obtenidos, se realizaron correlaciones lineales simple y se
xi
calculó el coeficiente de correlación para evaluar la relación entre el contenido de cadmio en el
suelo y el desplazamiento relativo del cadmio desde las raíces a la parte aérea de la planta, para
cada una de las medioambientes. Además se calculó los siguientes factores: a) Factor
Bioconcentración y acumulación biológica. B) Factor translocación, c) Índice de tolerancia. El
diseño experimental fue una parcela sub sub dividida, donde la parcela principal era el
medioambiente (3), el de parcelas divididas fueron las dosis de Cd (3), y la parcela sub sub
dividida fueron los cultivares de maíz (3), con 3 repeticiones. Los resultados fuerón analizados
por ANOVA y la prueba de Tukey (P = 0.05) usando procedimiento de modelo general SAS
(SAS Institute, Cary, North Carolina, USA).
Dentro de los principales resultados destacan que la producción de Materia seca (MS) en el
residuo fue afectada significativamente por el medioambiente y la interacción de ésta con el
cultivar, fluctuando entre 7.0 y 14.7 Mg ha-1
. El consumo de Cd en planta entera sólo fue
afectado por la dosis de Cd. El mayor consumo de Cd en planta entera fue obtenido con el uso de
2 mg kg-1
de CdCl2 (34.4 g ha-1
) (P<0.05). La distribución de Cd entre las tres estructuras de la
planta de maíz, fue mayor en el residuo (P<0.05), independiente del medioambiente, dosis de Cd
y cultivar evaluado. Según los resultados obtenidos en este estudio, se puede concluir que la
producción de materia seca no varió según los distintos grados de contaminación de cadmio en el
suelo en los distintos medioambientes evaluados. En todos los tratamientos, los mayores niveles
de concentración y extracción de cadmio obtubierón en la parte aérea, principalmente en el
residuo (tallo y hojas). Entre los ambientes evaluados, la mayor concentración de Cd en el grano
se observó en La Serena, pero en ningún caso fue superior a los limites establecidos. Según los
valores obtenidos de TF (TF > 2) y BAF (BAF > 1) en el medioambiente de Los Tilos y Chillán,
estos medioambientes se clasificarían con alta capacidad de contaminación de la cadena
alimentaria para los cultivares evaluados y los distintos grados de contaminación de cadmio en el
suelo, por lo cual, en dichos medioambientes se debería realizar mayores estudios sobre la
absorción y la translocación de metales pesados a la parte aérea del cultivo, principalmente de
cultivares utilizados como fuente de alimentos para los animales destinados a consumo humano.
xii
ABSTRACT
Soil contamination with anthropogenic heavy metals released from industry or agriculture has
received much attention in recent years. Cadmium (Cd) is one of the heavy metals that is usually
present in soils, being toxic to living organisms, and is carcinogenic to humans. The World
Health Organization (WHO) has considered a concentration of Cd corresponding to a daily intake
of 0.83 μg kg-1
body weight or 70 μg Cd per person to be toxic to humans. The severity and
damage of these metals depends on the time, level of exposure, susceptibility of the person.
Although Cd is not an essential nutrient for plants, this metal can be absorbed in more amounts
than other elements, without adverse effects on growth. Crop species and cultivars differ widely
in their ability to absorb, accumulate and tolerate Cd. Among the foods most used in the human
diet and which have presented a concentration of Cd in the grain above the limits allowed for
human health, stand out durum wheat (Triticum turgidum L. var. Durum), maize (Zea mays L .),
Wheat (Triticum aestivum L.), oats (Avena sativa L.), among others. Concerning the
concentration of Cd in the soil considered of risk, several authors indicate that this value
corresponds to 0,8 - 1,0 mg kg-1 of Cd. The acidity or basicity of the soil (pH) also affects the
availability of Cd in the soil for the crop. The enrichment of soils can lead to the involuntary and
accelerated transfer of trace elements through the food chain. In grain crops for human
consumption different concentrations of Cd have been shown, with some of them on the limits of
human health. Within the availability of soils one could find some with concentrations close to or
greater than the critical level of 1 mg kg-1
of total Cd, where it will be necessary to have species
and cultivars that have a lower accumulation and translocation of this metal. Therefore, the
following hypotheses are considered: a) Cd absorption by the maize plant is affected by the
concentration of this metal presented by the soil. B) The absorption and accumulation of Cd is
differential according to the organ of the corn plant. C) The accumulation rate of Cd in the maize
plant will depend on the cultivar and the interaction with the environment. In order to respond to
the above hypotheses, the following specific objectives were established: a) Identify the soils
used for agriculture that present a risk of contamination of Cd. B) Select maize cultivars that
present a lower risk of both absorption and Accumulation of Cd. C) To identify cultivars of low
accumulation Cd maize for the different agroclimatic zones of Chile. During the 2013-15 season,
three field experiences were carried out in different agricultural environments in Chile. The
xiii
environment was as follows; I) La Serena (30º3 'S; 71º14' W), soil of alluvial-coluvial origin
(Typic Haplocambids); Ii) Tilos (33º34 'S; 70º37' W), soil of alluvial origin (Haploxeroll), with
semi-arid and temperate Mediterranean climate; Iii) Chillán (36º31 'S; 71º54' W), soil of volcanic
origin (Melanoxerand), temperate Mediterranean climate. For each environment the physico-
chemical properties were analyzed at two depths prior to the implementation of the experiments
(0 - 0.2 and 0.2 - 0.4 m), these analyzes were performed according to the methodology indicated
by Sadzawka et al. (2006). The total soil and plant Cd was determined by electrothermal atomic
absorption spectrophotometry (graphite furnace technique) with the thermo elemental solar M5
equipment coupled to a graphite furnace model GF95. The samples were digested in a microwave
oven (MARS-Xpress, CEM Corporation, Matthews, North Carolina, USA) prior to
spectrophotometric readings. For each soil sample, 0.5 g was weighed and 10 mL (65% nitric
acid, Suprapur Nitric Acid, Merck Millipore, Darmstadt, Germany) was added, whereas, for plant
tissue samples, it was placed in a digestion tube 1 g DM of corn, and 10 mL Suprapur HNO3, + 1
mL at 30% H2O2 was added. Quality control for the analyzes was based on the certified reference
material (ISE 979 for soil and IPE 981 for plant tissue), comparison of samples between
laboratories, internal control samples, and duplicates. The Cd was applied to the form of CdCl2
(61.3% of Cd), whose dose of this salt corresponded to 0, 1 and 2 mg kg-1
, adjusted for a soil
depth of 0 to 0.2 m considering the bulk density of each soil. Three cultivars were used for each
environment (Syngenta, Pioneer, Dekalb), which have different genetic characteristics, which
would allow different responses. Agronomic management practices were standardized for all
locations. When the grains reached 15% of moisture content, the crop was harvested and the dry
matter (DM) of the grain was determined in root and residue (stem + leaf), and following the
same segmentation the total cadmium was determined. At the end of the experiment 10 soil
samples from each plot were collected at two depths (0 - 0.2 and 0.2 - 0.4 m), dried in the air,
then ground and passed through a 2 mm sieve to determine the Cd total. Subsequently with the
results obtained, simple linear correlations were made and the correlation coefficient was
calculated to evaluate the relationship between the cadmium content in the soil and the relative
displacement of cadmium from the roots to the aerial part of the plant, for each one of the
environment. In addition, the following factors were calculated: a) Factor Bioconcentration and
biological accumulation. B) Translocation factor, c) Tolerance index. The experimental design
was a sub sub divided plot, where the main plot was the environment (3), the split plots were the
xiv
Cd (3) doses, and the sub sub split plot were maize cultivars (3), with 3 repetitions.
Results were analyzed by ANOVA and Tukey's test (P = 0.05) using SAS general model
procedure (SAS Institute, Cary, North Carolina, USA).
Among the main ones, the production of dry matter (DM) in the residue was significantly
affected by the environment and its interaction with the hybrid, fluctuating between 7.0 and 14.7
Mg ha-1
. Cd consumption in whole plant was only affected by the Cd dose. The highest Cd
consumption in whole plant was obtained with the use of 2 mg kg-1
of CdCl2 (34.4 g ha-1
) (P
<0.05). The distribution of Cd among the three structures of the maize plant, it was observed that,
in general, the residue concentrates the greatest accumulation of this metal (P <0.05),
independent of the environment, dose of Cd and hybrid evaluated. According to the results
obtained in this study, it can be concluded that dry matter production does not vary according to
the different levels of cadmium contamination in the soil in the different evaluated environments.
In all treatments, the highest levels of concentration and cadmium extraction were observed in the
aerial part, mainly in the residue (stem and leaves). Among the evaluated environments, the
highest concentration of Cd in the grain was observed in La Serena, but in no case was higher
than the established limits.
According to the values obtained from TF (TF> 2) and BAF (BAF> 1) in the environment of Los
Tilos and Chillán, these environments would be classified with high contamination capacity of
the food chain for the evaluated cultivars and the different degrees of contamination Of cadmium
in the soil. Therefore, in these environments, further studies should be carried out on the
absorption and translocation of heavy metals to the aerial part of the crop, mainly cultivars used
as a food source for animals for destination human consumption
.
1
I. INTRODUCCIÓN GENERAL
Existe una creciente preocupación respecto a la seguridad alimentaria debido a la contaminación
del medio ambiente, donde la contaminación del suelo con metales pesados antropogénicos
liberados desde la industria o la agricultura, tales como las industrias de fundición, residuos de
minas metalíferas, pesticidas, fertilizantes, abonos municipales, ha recibido mucha atención en
los últimos años (Wuana and Okieimen, 2011; McDowell et al., 2013; Siebers et al., 2014; Wang
et al., 2014). El Cadmio (Cd) es uno de los metales pesados que suele estar presente en los suelos
(McDowell et al., 2013). Es tóxico para los organismos vivos, y es cancerígeno para los seres
humanos (Fowler, 2009; Chang et al., 2012; McDowell et al., 2013; Liu et al., 2015a) e incluso
letal (Chang et al., 2012).
El cuerpo humano puede absorber el Cd en porciones menores a través de la ingesta de
alimentos, en especial las hojas y granos, el agua o el aire (Chang et al., 2012), donde se
acumulan y permanecen durante mucho tiempo, causando algunos problemas a la salud (Goyer,
1997; Grant et al., 1998; Wångstrand et al., 2007; Chang et al., 2012; Liu et al., 2015a). La
Organización Mundial de la Salud (OMS) ha considerado tóxico para los seres humanos una
concentración de Cd correspondiente a una ingesta diaria de 0.83 µg kg-1 de peso corporal o 70 µg
Cd por persona (OMS, 2010), y la Agencia para Sustancias Tóxicas y de Registro de
Enfermedades de los Estados Unidos (ATSDR), señala una dosis de Cd de referencia de 5x10⁻⁴
mg kg-1día-1 en el agua y 1x10⁻³
mg kg-1
día-1
en alimentos (ATSDR, 2012). El Cd se acumula en el
hígado y los riñones, y tiene una vida media biológica larga, 17-30 años en el hombre. La
toxicidad implica dos sistemas de órganos, renales y esqueléticas, y es en gran parte la
consecuencia de las interacciones entre el Cd y metales esenciales, en particular calcio (Goyer,
1997; Wångstrand et al., 2007; Chang et al., 2012). La severidad y el daño de estos metales
dependen del tiempo, nivel de exposición, susceptibilidad de la persona y además de la ruta por la
cual el metal sea absorbido (Chang et al., 2012).
A pesar que el Cd no es un nutriente esencial para las plantas, este metal puede ser
absorbido en mayor cantidad que otros elementos, sin efectos adversos en el crecimiento (Grant
et al. 1998; Wang et al., 2014), y puede interactuar con el metabolismo de tres metales esenciales
como el calcio, zinc y hierro (Goyer, 1997). Las concentraciones máximas Cd identificados por la
Unión Europea de algunos productos agrícolas fueron de 50, 100, 200 y 200 mg kg-1 para las
2
frutas, hortalizas de raíz, el trigo y la lechuga, respectivamente (Berg y Litcht, 2002). Las
especies de cultivos y cultivares difieren ampliamente en su capacidad de absorber, acumular y
tolerar Cd (Grant et al., 1998; Grant et al., 2008; Zhao et al., 2013; Yang et al., 2014). Entre los
cultivos agrícolas importantes en la dieta humana, las principales especies que absorben y
translocan Cd al grano son trigo duro (Triticum turgidum L. var. Durum), maíz (Zea mays L.),
trigo (Triticum aestivum L. ), avena (Avena sativa L.), cebada (Hordeum vulgare L.), arroz
(Oryza sativa L.) y arveja (Pisum sativum L.), estos han presentado una concentración de Cd
sobre los límites permitidos para la salud humana (Greger y Löfstedt, 2004; Cajuste et al., 2006;.
Tanaka et al., 2007;. Tsyganov et al., 2007; Wångstrand et al., 2007).
En el suelo la cantidad de Cd depende principalmente de las propiedades físicas del suelo y
las propiedades químicas, como el contenido de arcilla, acidez, salinidad, zinc (Zn) y materia
orgánica (MO); la fertilización con fósforo (P) y nitrógeno (N); aplicaciones de enmiendas
orgánicas; la exposición a fuentes de contaminación como la actividad industrial; la rotación de
cultivos y prácticas de manejo (Chaudri et al., 1995; McLaughlin et al., 1997; Grant et al., 1998;
Vásquez et al., 2006; Wångstrand et al., 2007; Chen et al., 2008; Grant et al., 2008; Bao et al.,
2011; McDowell et al., 2013; Zhao et al., 2013; Siebers et al., 2014). En cuanto a la
concentración de Cd en el suelo considerados de riesgo, diversos autores señalan que este valor
corresponde a 0.8 - 1.0 mg kg-1
de Cd (Lehoczky et al., 2006; Quezada-Hinojosa et al., 2015) y
no debe exceder 1.5 mg kg-1 de Cd total en los suelos (Liu et al., 2015b). Valor similar está
indicado para suelos chilenos por Villanueva (2003) y Segura et al. (2006).
Otro factor que afecta tanto a la disponibilidad y absorción de Cd por las plantas es la
exudación de la raíz de ácidos orgánicos tales como citrato y malato (Han et al., 2006; Grant et
al., 2008; Adeniji et al., 2010; Bao et al., 2011; Xu et al., 2015). Existen especies que se
caracterizan por su alta exudación de ácidos orgánicos, lo que puede aumentar la disponibilidad
de Cd en el suelo, pero este restringe el transporte de Cd de las raíces hacia los tallos y granos
(Page et al., 2006; Xu et al., 2015). Al respecto, Oliver et al. (1993), indican que la concentración
de Cd en el grano de trigo fue mayor cuando se cultivan en rotación después de Lupino blanco
(especie que se caracteriza por exudación de ácidos orgánicos) que después de cereales.
Dentro de los fertilizantes y enmiendas empleadas como fuentes de nutrientes a los
cultivos, y que a su vez contribuyen al ingreso de Cd al sistema suelo-planta, una de los
principales son los fertilizantes fosforados (Chaudri et al., 1995; Chen et al., 2008; Lehoczky et
3
al, 2006; Pál et al., 2005), como también lodos y biosólidos urbanos (Chaudri et al., 1995; Pál et
al., 2005; Walter et al., 2006).
El uso de fertilizantes nitrogenados con fuentes de amonio (reacción ácido), aumenta la
disponibilidad de Cd en el suelo para los cultivos (Wångstrand et al., 2007). Por el contrario, el
uso de fertilizantes con reacción básica como nitratos y sales de calcio contribuyen a reducir la
disponibilidad de este metal para los cultivos.
El Cd en el suelo se fija por óxidos e hidróxidos a arcilla y materia orgánica, y su
disponibilidad se puede cuantificar con extracciones utilizando HNO3-HCl (agua regia). La
fracción extraíble (Cd intercambiables, complejo de Cd con compuestos orgánicos y sales de
carbonato) se determina con el agente quelante ácido dietilentriaminapentacético (DTPA), que
representan la mayor fracción de la Cd disponible para la planta (Walter y Cuevas, 1999; Walter
et al, 2002; Walter et al., 2006). Otro complejo importante para estimar la biodisponibilidad de
Cd corresponde a la complejación-Cloro en la solución del suelo que podría conducir a aumentar
la captación de Cd por los cultivos ya sea a través de una mayor difusión de Cd a las raíces a
través del suelo (McLaughlin et al., 1997).
La acidez o basicidad del suelo (pH) también afecta a la disponibilidad de Cd en el suelo
para el cultivo (Larson Jönson y Asp, 2013). En suelos con pH básico, y con aplicaciones de
lodos compostados con alta concentración de Cd, como se ha señalado por Cuevas et al. (2003),
producen una reducción de la disponibilidad Cd.
El enriquecimiento de los suelos pueden dar lugar a la transferencia involuntaria y
acelerada de elementos traza a través de la cadena alimentaria (Chen et al., 2008). En granos de
cultivos para el consumo humano se han mostrado diferentes concentraciones de Cd, con algunos
de ellos sobre el límites para la salud humana (Greger y Löfstedt, 2004; Tanaka et al., 2007;
Tsyganov et al., 2007). Chaudri et al. (1995) indican que la concentración de Cd en varias
muestras de granos de trigo fluctuó entre 0,004 y 0,31 mg kg-1 con un valor medio de 0,03 mg
kg-1
, lo que resulta en una ingesta diaria de aproximadamente 8 g Cd por persona o sobre 11% del
límite indicado por la OMS.
Para los granos de trigo de invierno Wångstrand et al. (2007) han reportado
concentraciones de Cd entre 0,01 y 0,09 mg kg-1
, muy por debajo del límite de 0,2 mg kg-1
indicado por la Comunidad Europea. A la vez, este autor señala concentraciones de Cd de 0,005 a
0,1 mg kg-1
en grano de avena, y de 0,05 a 0,06 mg kg -1
en la cebada. Además, el aumento en la
4
aplicación de nitrógeno (N) al cultivo, generó un incremento en la concentración de Cd en los
granos de trigo. Al respecto, Wångstrand et al. (2007) informó de concentraciones de Cd en
granos de cereales que fluctuaron entre 0,01 y 0,09 mg kg-1
. Por otra parte, un experimento
llevado a cabo en Suecia demostró que existen diferencias entre cultivares en la capacidad de
acumular Cd en los granos (Greger y Löfstedt, 2004).
El grano de arroz tiene bajas concentraciones de zinc (Zn), hierro (Fe) y calcio (Ca) para la
dieta humana, pero promueve la acumulación de Cd en el grano ( Liu et al., 2015b).
En las plantas cultivadas, la absorción de Cd en altas concentraciones puede causar
problemas en el crecimiento y el desarrollo. En un experimento realizado en macetas con tres
tipos de suelo y plantas de maíz, la mayor concentración de Cd en el suelo, tanto fracciones
solubles en agua e intercambiables, generó una menor producción de materia seca total (Cajuste
et al., 2006). En cultivos de maravilla (Helianthus annus L), Cd en baja concentración inhibe el
crecimiento de raíces y tallos, afectando la absorción de agua y nutrientes, el proceso de
fotosíntesis y la actividad de varias enzimas, y también induce estrés oxidativo (Tsyganov et al.,
2007). Al mismo tiempo, reduce la concentración de calcio (Ca), fósforo (P), sodio (Na) y
manganeso (Mn) en las raíces. Por otro lado, se obtuvo aumento de la concentración de Cd en las
raíces de las plantas no tratadas con este elemento desde 1,2 - 1,7 mg g-1
(Cd), hasta 427 a 520
mg g-1
en las plantas tratadas. En los tallos, la concentración de Cd aumentó desde 0,07-0,1 mg g-
1 en planta sin tratar, hasta 21,4 a 51,9 mg g
-1 en las plantas tratadas. Esto evidencia que en
algunas especies existe menos translocación de Cd hacia las partes aéreas de la planta, ayudando
a reducir el riesgo de contaminación del producto consumido por los organismos superiores
(animales y humanos). Un efecto similar se observó en el maíz, que al aumentar la concentración
de Cd de la solución nutritiva, genera una mayor concentración de este metal en todos los tejidos
evaluados (Han et al., 2006).
En cultivos agrícolas la especie, variedad o cultivar también afecta a la absorción de Cd y la
tolerancia a este metal, como se ha demostrado para arveja (Pisum sativum L.) (Tsyganov et al.,
2007), maní (Arachis hypogea L.) (McLaughlin et al., 1997), tabaco (Nicotiana tabacum y
Nicotiana rustica), el maíz (Zea mays L.) (Hinesly et al., 1978), el arroz (Oryza sativa L.) y soja
(Glisine max L.) (Arao y Ishikawa, 2006), y el trigo duro (Grant et al., 2008; Stolt et al., 2006).
Además, en los estudios de cultivares de trigo duro (Triticum turgidum L. var durum) difieren en
la concentración de Cd absorbido, atribuible a diferencias en la translocación de la raíz a la parte
5
area de la planta, en lugar de las diferencias en la absorción de la raíz (Greger y Löfstedt, 2004;
Hirzel et al., 2016).
Una vez que el Cd es absorbido por la planta, la translocación puede ocurrir a través del
xilema y el floema. Distribución de Cd dentro de la planta se ve influenciada por el transporte de
las raíces a los brotes a través del xilema (Gallego et al., 2012). En este sentido, Tanaka et al.
(2007) indicaron que la translocación de Cd (Cd109) en plantas de arroz se produce principalmente
a través del floema (91-100%), y que está asociado con aumentos en la concentración de sacarosa
(azúcar transportado en el floema). A su vez, la capacidad de absorción de Cd desde el suelo y la
tasa de translocación desde el suelo a la raíz, y luego a las partes aéreas de las plantas es diferente
entre las especies (Lehoczky et al., 2006). Por ejemplo, la lechuga de cultivo (Lactuca sativa L.)
presenta una mayor proporción de transferencia (velocidad de absorción) de Cd y una mayor
concentración en los tejidos en comparación con las ballicas (Lollium perenne L.). Lupino blanco
cultivado presenta una mayor concentración de Cd en las raíces en comparación con los tallos,
aunque mostraron cuantitativamente una distribución similar, dado el aumento de la producción
de materia seca en los tallos (Vásquez et al., 2006). Además, lupino presenta restricciones de
transporte de Cd desde las raíces a los brotes, reduciendo la concentración de Cd en los granos,
como se indicó para lupino blanco por Page et al. (2006).
Se ha observado en plantas de maíz (Han et al., 2006), que la adición de Zn a la solución
disminuye la absorción de Cd. A su vez estos autores sugieren que hay sistemas similares de
transporte entre el Zn y Cd en las raíces del maíz cultivado. En este sentido, Pál et al. (2005)
señaló que el aumento las tasas de absorción de Cd en plantas de maíz, genera un estrés
oxidativo, con aumentos en el ácido salicílico (molécula de síntesis endógena debido al estrés
abiótico) y reducciones tanto en la eficiencia cuántica a nivel del fotosistema II, como en la
síntesis de clorofila.
Considerando que la población mundial y su demanda de alimentos son crecientes en el
tiempo (FAO, 2015), será necesario contar con mayor superficie de uso agrícola. Dentro de la
disponibilidad de suelos se podría encontrar algunos con concentraciones cercanas o mayores al
nivel crítico de 1 mg kg-1
de Cd total, donde será necesario disponer de especies y cultivares que
presenten una menor acumulación y translocación de este metal. El objetivo del presente estudio
será evaluar la respuesta de tres cultivares de maíz sembrados bajo diferentes dosis de Cd, en tres
medioambientes de Chile.
6
HIPOTESIS
1. La absorción Cd por parte de la planta de maíz es afectada por la concentración de este metal
presente en el suelo.
2. La absorción y acumulación de Cd es diferencial según la estructura de la planta de maíz.
3. La tasa acumulación de Cd en la planta de maíz dependerá del cultivar y la interacción con el
medioambiente.
OBJETIVOS ESPECIFICOS
1. Identificar el riesgo de contaminación de Cd en tres suelos de Chile usados para el cultivo de
maíz..
2. Seleccionar cultivares de maíz que presentan menor riesgo tanto de absorción y acumulación
de Cd.
3. Identificar cultivares de maíz de baja acumulación de Cd para las distintas zonas
agroclimáticas de Chile.
7
II. BIBLIOGRAFÍA
Adeniji, B. A., M. T. Budimir-Hussey and S. M. Macfie. 2010. Production of organic acids and
adsorption of Cd on roots of durum wheat (Triticum turgidum L. var. durum). Acta Physiol.
Plant. 32:1063 – 1072.
Agency for Toxic Substances and Disease Registry (ATSDR). 2012. Toxicological profile for
Cadmium. [en línea] <http://www.atsdr.cdc.gov/toxprofiles/tp5.pdf.>. Fecha consulta: 05
marzo 2015.
Arao, T., and S. Ishikawa. 2006. Genotypic differences in cadmium concentration and
distribution of soybeans and rice. JARQ Jpn Agric Res Q. 40:21-30.
Bao, T., L. Sun and T. Sun. 2011. The effects of Fe deficiency on low molecular weight organic
acid exudation and cadmium uptake by Solanum nigrum L., Acta Agriculturae Scandinavica
61(4):305 - 312.
Berg, T., and D. Licht. 2002. International legislation on trace elements as contaminant sin food:
A review. Food Add. Contamin. 10:916 - 927.
Cajuste, L.J., L. Cajuste Jr, C. García and J. Cruz. 2006. Distribution and availability of heavy
metals in raw and acidulated phosphate rock–amended soils. Communications in Soil Science
and Plant Analysis. 37:2541-2552.
CIREN. 2005. Ficha Agroclimática. Centro de Información de Recursos Naturales (CIREN),
Santiago, Chile. (En: http://www.ciren.cl/web/content.php?i=72. Accesado: 7/11/2014).
Chang Y., J. Wen, J. Cai, W. Xiao-Ying, L. Yang and Y. Guo. 2012. An investigation and
pathological analysis of two fatal cases of cadmium poisoning. Forensic Science International
220:e5–e8.
Chaudri, A.M., F.J. Zhao, S.P. McGrath and A.R. Crosland. 1995. The cadmium content of
british wheat Grain. Journal of Environmental Quality 24(5):850 - 855.
Chen, G. G. Zeng, L. Tang, Ch. Du, X. Jiang, G. Huang, H. Liu and G. Shen. 2008. Cadmium
removal from simulated wastewater to biomass byproduct of Lentinus edodes. Bioresource
Technology 99:7034 – 7040.
Cuevas, G., F. Martínez, and I. Walter. 2003. Field-grow maize (Zea mays L.) with composted
sewage sludge. Effects on soils and grain quality. Spanish Journal of Agricultural Research
1(3):111-119.
8
Fowler, B. A. 2009. Monitoring of human populations for early markers of cadmium toxicity: A
review. Toxicology and Applied Pharmacology. 238: 294–300.
Gallego, S.M., L.B. Pena,b, R.A. Barcia, C.E. Azpilicueta, M.F. Iannonea,, E.P. Rosales, M.S.
Zawoznik, M.D. Groppa and M.P. Benavides. 2012. Unravelling cadmium toxicity and
tolerance in plants: Insight into regulatory mechanisms. Environmental and Experimental
Botany 83: 33–46.
Goyer, R.A. 1997. Toxic and essential metal interactions. Annu. Rev. Nutr. 17:37 – 50.
Grant, C. A., Buckley, W.T., Bailey, L.D. and F. Selles. 1998. Cadmium accumulation in crops.
Can. J. Plant Sci. 78:1–17.
Grant, C.A., J.M. Clarke, S. Duguid and R.L. Chaney. 2008. Selection and breeding of plant
cultivars to minimize cadmium accumulation. Science of the Total Environment 390:301 –
310.
Greger M., and M. Löfstedt. 2004. Comparison of Uptake and Distribution of Cadmium in
Different Cultivars of Bread and Durum Wheat. Crops Science 44(2):501 - 507.
Han, F., X. Shan, S. Zhang, B. Wen, and G. Owens. 2006. Enhanced cadmium accumulation in
maize roots-the impact of organic acids. Plant Soil 289:355-368.
Hirzel, J., J. Retamal-Salgado, I. Walter, and I. Matus. 2016. Cadmium accumulation and
distribution in plants of three durum wheat cultivars under different agricultural environments
in Chile. Journal of Soil and Water Conservation. “Accepted Article”.
Hinesly, T.D., D.E. Alexander, E.L. Ziegler, and G.L. Barret. 1978. Zinc and Cd accumulation by
corn inbreds grown on sludge amended soil. Agron J. 70:425-428.
Kubo K., Y. Watanabe, A. Oyanagi, S. Kaneko, M. Chono, H. Matsu-Naka, M. Seki and M.
Fujita. 2008. Cadmium concentration in grains of Japanese wheat cultivars: Genotypic
difference and relationship with agronomic characteristics. Plant Production Science. 11:243 –
249.
Larson Jönson, E.H. and H. Asp, 2013. Effects of pH and nitrogen on cadmium uptake in potato.
Biologia Plantarum 57(4):788-792.
Lehoczky E., Z. Kiss and T. Németh. 2006. Study of the Transfer coefficient of cadmium and
lead in ryegrass and lettuce. Communications in Soil Science and Plant Analysis 37:2531–
2539.
Liu, Y., P. Hou, R. Xie, S. Li,H. Zhang, B. Ming, D. Ma, and S. Liang. 2013. Spatial
9
adaptabilities of spring maize to variation of climatic conditions. Crop Science 53:1693 -
1703.
Liu, Y., T. Xiao, P.C. Baveye, J. Zhu, Z. Ning and H. Li. 2015a. Potential health risk in areas
with high naturally-occurring cadmium background in southwestern China. Ecotoxicology and
Environmental Safety 112:122 – 131.
Liu, K. J. Lvn, W. He, H. Zhang, Y. Cao, and Y. Dai. 2015b. Major factors influencing cadmium
uptake from the soil into wheat plants. Ecotoxicology and Environmental Safety 113:207 –
213.
Lindsay W.L. and W.A. Norvell. 1978. Development of a DTPA soil test for zinc, iron,
manganese, and copper. Soil Science Society of America Journal 42(3):421 - 428.
McLaughlin, M.J., K.G. Tiller and M.K. Smart. 1997. Speciation of cadmium in soil solutions of
saline/sodic soils and relationship with cadmium concentrations in potato tubers (Solanum
tuberosum L.). Aust. J. Soil Res. 35:183 – 198.
McDowell, R.W., M.D. Taylor y B.A. Stevenson. 2013. Natural background and anthropogenic
contributions of cadmium to New Zealand soils. Agriculture, Ecosystems and Environment
165:80–87.
Oliver, D.P., J.E. Schultz, K.G. Tiller and R.H. Merry. 1993. The effect of crop rotations and
tillage practices on cadmium concentration in wheat grain. Australian Journal of Agricultural
Research. 44(6):1221 - 1234.
OMS. 2010. Exposure to cadmium: a major public health concern. World Health Organization
(WHO), Geneva, Switzerland. p. 1-4. Available at
http://www.who.int/ipcs/features/cadmium.pdf (Fecha consulta: 05 March 2015).
Organización de las Naciones Unidas para la Agricultura y la Alimentación (FAO). 2015.
Agricultura mundial: hacia los años 2015/2030. [enlínea] <http://www.fao.org.>. Fecha
consulta: 05 marzo 2015.
Page, V., R. Le Bayon and U. Feller. 2006. Partitioning of zinc, cadmium, manganese and cobalt
in wheat (Triticum aestivum) and lupin (Lupinus albus) and further release into the soil.
Environmental and Experimental Botany 58:269 – 278.
Pál, M., E. Horváth, T. Janda, E. Páldi, and G. Szalai. 2005. Cadmium stimulates the
accumulation of salicylic acid and its putative precursors in maize (Zea mays) plants.
Physiologia Plantarum 125:356- 364.
10
Quezada-Hinojosa R., K.B. Föllmi, F. Gillet and V. Matera. 2015. Cadmium accumulation in six
common plant species associated with soils containing high geogenic cadmium concentrations
at Le Gurnigel, Swiss Jura Mountains. Catena 124:85 – 96.
Red Agrometeorológica de INIA. 2013. Agromet: red agrometeorológica del INIA. (En:
www.agromet.inia.cl/estaciones.php. Fecha consulta: 05/03/2015).
Sadzawka, A., M.A. Carrasco, R. Grez, M. Mora, H. Flores and A. Neaman. 2006. Métodos de
análisis recomendados para los suelos de Chile. Serie Actas INIA Nº 34. 164 p. Instituto de
Investigaciones Agropecuarias, Santiago, Chile.
SAS Institute. 1989. Usage and Reference. Version 6. 501 p. SAS. Institute Inc., Cary, North
Carolina, USA.
Segura, R., V. Arancibia, M.C. Zuñiga and P. Pastén. 2006. Distribution of cooper, lead and
cadmium concentrations in stream sediments from the Mapocho River in Santiago, Chile.
Journal Geochemical Exploration. 91: 71-80.
Siebers, N., F. Godlinski, and P. Leinweber. 2014. Bone char as phosphorus fertilizer involved in
cadmium immobilization in lettuce, wheat, and potato cropping. J. Plant Nutr. Soil Sci. 177:75
– 83.
Stolt, P., H. Asp, and S. Hultin. 2006. Genetic variation in wheat cadmium accumulation on soils
with different cadmium concentrations. J. Agron. Crop Sci. 192:201-208.
Tanaka, K., S. Fujimaki, T. Fujiwara, T. Yoneyama and H. Hayashi. 2007. Quantitative
estimation of the contribution of the phloem in cadmium transport to grains in rice plants
(Oryza sativa L.). Soil Science and Plant Nutrition 53(1):72 - 77.
Tsyganov, V.E., A.A. Belimov, A.Y. Borisov, V.I. Safronova, M. Georgi, K. Dietz and I.A.
Tikhonovich. 2007. A chemically induced new pea (Pisum sativum) mutant SGECdt with
increased tolerance to, and accumulation of, cadmium. Annals of Botany 99:227 – 237.
Vásquez, S., R. Agha, A. Granado, M. Sarro, E. Esteban, J. Peñalosa, and R. Carpena. 2006. Use
of white lupin plant for phytostabilization of Cd and As polluted acid soil. Water, Air, and Soil
Pollution 177:349-365.
Villanueva, L.R. 2003. Evaluación del impacto de los fertilizantes fosfatados en la acumulación
de Cadmio en suelos cultivados con maíz (Zea mays L.). Tesis para optar al Grado de Magister en
Gestión y Planificación Ambiental, Universidad de Chile, Santiago, Chile.
Wang Q., J. Zhang, B. Zhao, X. Xin, C. Zhang and H. Zhang. 2014. The influence of long-term
11
fertilization on cadmium (Cd) accumulation in soil and its uptake by crops. Environ. Sci.
Pollut. Res. 1 - 9.
Wångstrand, H., J. Eriksson and I. Oborn. 2007. Cadmium concentration in winter wheat as
affected by nitrogen fertilization. Eur. J. Agronomy 26:209 – 214.
Walter, I, and G. Cuevas. 1999. Chemical fractionation of heavy metals in a soils amended with
repeated sewage sludge application. Sci. Total. Env. 226:113-119.
Walter, I., F. Martínez, L. Alonso, J. de Gracia, and G. Cuevas. 2002. Extractable soil heavy
metals following the cessation of biosolids application to agricultural soil. Environmental
Pollution 117:315-321.
Walter, I., F. Martínez, and V. Cala. 2006. Heavy metal speciation and phytotoxic effects of three
representative sewage sludges for agricultural uses. Environmental Pollution 139:507-514.
Wuana R.A. and Okieimen F.E. 2011. Heavy Metals in Contaminated Soils: A Review of
Sources, Chemistry, Risks and Best Available Strategies for Remediation. ISRN Ecology
2011:1 - 20.
Xu, W., G. Lu, R. Wang, Ch. Guo, Ch. Liao, X. Yi and Z. Dang. 2015. The effect of pollination
on Cd phytoextraction from soil by maize (Zea mays L.), International Journal of
Phytoremediation. “Accepted Article”. 1 - 27.
Yang, Y., Z. Nan, and Z. Zhao. 2014. Bioaccumulation and translocation of cadmium in wheat
(Triticum aestivum L.) and maize (Zea mays L.) from the polluted oasis soil of Northwestern
China Chemical Speciation and Bioavailability 26(1):43 - 51.
Zhao, X.L., T. Jiang, and B. Du. 2013. Effect of organic matter and calcium carbonate on
behaviors of cadmium adsorption–desorption on/from purple paddy soils. Chemosphere 1 - 8.
12
III. CAPITULO I
ABSORPTION AND DISTRIBUTION OF CADMIUM OF THREE MAIZE
HYBRIDS IN THREE ENVIRONMENTS
Jorge Retamal-Salgadoa, Ivan Matus
b, Ingrid Walter
c and Juan Hirzel
b*
aUniversidad de Concepción, Facultad de Agronomía, Avenida Vicente Méndez 595, Chillán,
Chile.
bInstituto de Investigaciones Agropecuarias, INIA Quilamapu, Avenida Vicente Méndez 515,
Chillán, Chile. *Corresponding author: [email protected]
cInstituto Nacional de Investigación y Tecnología Agraria y Alimentaria (INIA), Apdo. Correos
8111, 28080 Madrid, España.
Publicado en Journal of Soils Science and Plant Nutrition, 2017, Volumen 17, número 2,
pagínas 266-278.
ABSTRACT
Anthropogenic soil contamination with heavy metals has received much attention in recent years,
especially cadmium (Cd), which is a very toxic element for human health and is exposure is
mainly through contaminated food. Maize (Zea mays L.) is one of the most important cereals in
the human diet that is characterized as species whose cultivars differ in Cd accumulation.
Therefore, identifying and selecting low Cd-accumulating genetic material will contribute to
reducing its ingestion. Among the agricultural crops that are important for Cd in the human diet
is maize. Cadmium contents in three maize cultivars were grown under different environments
conditions in Chile where soils were enriched with increasing Cd rates, were evaluated. Grain
yield, Cd concentration in different plant tissues, and soil post-harvest, were evaluated. Results
showed that grain yield was not affected by soil Cd; however, plant tissues generally exhibited
differences in Cd concentration associated with the environment, La Serena showed the highest
13
grain Cd accumulation (30 µg kg-1
; P < 0.05). In addition, among cultivars, Pioneer showed the
highest grain Cd concentration (19.5 µg kg-1
; P < 0.05).. Grain Cd concentration of the three
maize cultivars were within the range cited in the bibliography as not toxic.
Key words: Cadmium, maize, Chilean soils, Zea mays.
1. INTRODUCTION
There is a growing concern regarding food security because of environmental pollution.
Anthropogenic soil contamination by heavy metals has been produced mainly by industry or
agriculture, e.g., foundries, metalliferous mine waste, pesticides, fertilizers, and municipal
organic waste (Siebers et al., 2014; Wang et al., 2014). Cadmium is one of the heavy metals that
is usually found in low concentrations in the soil (McDowell et al., 2013). It is toxic for living
organisms and carcinogenic for human beings (Chang et al., 2012; McDowell et al., 2013; Liu et
al., 2015a). Although it is not an essential plant nutrient, Cd can be absorbed in larger quantities
than other elements, such as cobalt and nickel, with no adverse effects on growth (Jayakumar and
Vijayarengan, 2014; Eshghi and Ranjbar, 2014). Cadmium also interacts with the metabolism of
three essential metals: Ca, Zn, and Fe, generating their low intake by means of substitution and
increase of competitive mobility with other elements (Goyer, 1997). The human body can absorb
Cd through food, especially leaves and grains, water, or air: it accumulates and persists for a long
time causing health problems (Chang et al., 2012; Liu et al., 2015a). The World Health
Organization (WHO) has considered a daily Cd intake of 0.83 μg kg-1
body weight or 58.1 μg Cd
per person as toxic for human beings (WHO, 2010). The Agency for Toxic Substances and
Disease Registry (ATSDR) of the United States establishes a Cd reference rate of 5x10⁻⁴
mg kg-1
d-1
in water and 1 10-3
mg kg-1
d-1
in food (ATSDR, 2012). Cadmium accumulates in the liver
and kidneys and has a long biological half-life of 17 to 30 y in humans. Its toxicity involves two
organ systems, kidney and skeleton, and is largely the result of interactions between Cd and
essential metals, particularly generating low Ca intake (Goyer, 1997; Chang et al., 2012). The
European Union has identified maximum Cd concentrations of some agricultural products as 50,
100, 200, and 200 μg kg-1
for fruit, root vegetables, wheat, and lettuce, respectively (Berg and
Litcht, 2002).
14
Crop and cultivar species differ widely in their ability to absorb, accumulate, and tolerate
Cd (Yang et al., 2014). Among the agricultural crops that are important for Cd in the human diet
are, durum wheat (Triticum turgidum L. var. durum), maize (Zea mays L.), wheat (Triticum
aestivum L.), oat (Avena sativa L.), barley (Hordeum vulgare L.), rice (Oryza sativa L.), and pea
(Pisum sativum L.); these have exhibited Cd concentrations over the limits permitted for human
health (Tanaka et al., 2007).
The amount of soil Cd mainly depends on its origin, and physical and chemical properties,
such as clay, acidity, salinity, Zn, and organic matter (OM) content. Phosphorus and N
fertilization, organic amendment applications, exposure to contamination sources, crop rotation,
and management practices are the main sources of increased soil Cd content (McDowell et al.,
2013; Siebers et al., 2014). As for the soil Cd concentration considered as a risk, various authors
point out that the value ranges from 0.8 to 1.0 mg Cd kg-1
(Clemens et al., 2013; Quezada-
Hinojosa et al., 2015) and should not exceed 1.5 mg kg-1
total soil Cd (Liu et al., 2015b). A
similar value is indicated by Segura et al. (2006) for soils in Chile.
Another factor affecting both Cd availability and uptake by plants is root exudation of
organic acids, such as citrate and malate (Adeniji et al., 2010). White lupin (Lupinus albus L.) is
defined as a species that exudes elevated levels of organic acids that can increase soil Cd
availability, but restricts Cd transport from the roots to the stems and grains (Tejo et al., 2016).
Oliver et al. (1993) indicate that Cd concentration in the wheat grain was higher (until 0.02 mg
kg-1
) when this crop followed white lupin in the rotation instead of cereals.
Given that the world population and its demand for food is increasing over time (Oxfam,
2013; FAO, 2015), a larger area is needed for agricultural use. Some of the available soils could
have total Cd concentrations close to or greater than the 1 mg kg-1
critical level; this will require
species and cultivars exhibiting lower Cd accumulation and translocation. To contribute in
providing maize cultivars that exhibit low Cd accumulation in both grain and straw, the objective
of the present study was to evaluate the response of three maize cultivars grown with increasing
Cd rates in three different agroclimatic zones of Chile.
2. MATERIALS AND METHODS
2.1. Climatic and soil characteristics of each environment
15
The environments in which the field experiments were conducted, located in three contrasting
agroclimatic zones: i) La Serena (30º3’ S, 71º14’ W), colluvial-alluvial soil (Typic
Haplocambids; USDA, 2014), arid climate with maritime influence, and 40 mm precipitation
concentrated in winter; ii) Los Tilos (33º34’ S, 70º37’ W), alluvial soil (Haploxeroll; USDA,
2014), semi-arid and temperate Mediterranean climate with hot and dry summer, cold winter, and
163 mm precipitation; and iii) Chillán (36º31’ S, 71º54’ W), volcanic soil (Melanoxerand;
USDA, 2014), temperate Mediterranean climate with hot and dry summer, cold and humid
winter, and 672 mm precipitation concentrated in winter and beginning of spring (Table 1) (Red
Agrometeorológica de INIA, 2013). The physico-chemical properties of each soil analyzed at the
start of the experiment are shown in Table 2. The samples were collected at two depths (0 - 0.2
and 0.2 - 0.4 m) and the physico-chemical analyses were performed according to the
methodology indicated by Sadzawka et al. (2006). Soil pH was measured in a 1:2.5 (soil/water)
ratio. Organic matter was estimated by the Walkley-Black wet digestion method. Soil available N
(NO3-N and NH4-N) was previously extracted with 1 M KCl and determined by colorimetry in a
Skalar Auto Analyzer (segmented flow spectrophotometer). Available P was extracted with 0.5
M NaHCO3 (Olsen-P) and determined by the ascorbic acid-molybdate method. Exchangeable Ca,
Mg, K, and Na were extracted with 1 M ammonium acetate and measured using flame emission
spectrometry (K and Na) and atomic absorption (Ca and Mg) spectrometry (AAS). The soil
exchangeable Al concentration was determined by extraction with 1 M KCl and AAS.
Concentrations of DTPA extractable Fe, Mn, Zn, and Cu were determined (Lindsay and Norvell,
1978) and by AAS. Boron was determined by colorimetry after acid digestion. Soil and plant Cd
was quantified by electrothermal atomic absorption spectrophotometry (graphite furnace
technique) with Thermo Elemental Solaar M5 equipment coupled to a Model GF95 graphite
furnace. Samples were digested in a microwave oven (MARS-Xpress, CEM Corporation,
Matthews, North Carolina, USA) before the spectrophotometry reading. For each soil sample, 0.5
g was weighed and 10 mL HNO3 (nitric acid 65%, Suprapur Nitric Acid, Merck Millipore,
Darmstadt, Germany) were added, whereas 1 g maize DM in digestion tubes was weighed and 10
mL Suprapur HNO3 + 1 mL 30% H2O2 were added. Quality control for the analysis was based on
certified reference material (ISE 979 for soil and IPE 981 for plant tissue), comparing samples
between laboratories, internal control samples, and duplicates of the analyses (Tejo et al., 2016).
16
2.2. Cadmium rates and maize cultivars
Cadmium was applied as CdCl2 (61.3% Cd) at rates of 0, 1, and 2 mg kg-1
adjusted for a 0 - 0.2 m
soil depth and considered the bulk density of each soil (Table 2). The equivalent amount of Cd
applied at the 1 and 2 mg kg-1
CdCl2 rates in each environment was: i) La Serena 2157.76 and
4315.52 g ha-1
, respectively; ii) Los Tilos 1593.8 and 3187.6 g ha-1
, respectively, and iii) Chillán
1226.0 and 2452.0 g ha-1
, respectively.
The maize cultivars used in the study were Syngenta NK 703 in La Serena and Los Tilos and
Syngenta NK Exp in Chillán; Pioneer P 32D12 in La Serena and Los Tilos and Pioneer P 37W05
in Chillán; Dekalb DK 627 in La Serena and Los Tilos and Dekalb DK 469 in Chillán. These
cultivars were selected because the Syngenta, Pioneer, and Dekalb genotypes exhibit different
genetic characteristics, and different responses would be expected.
2.3. Agronomic management of the experiment
Agronomic management practices were standardized for all the environments using Chilean
norms for this crop. The N, P, and K fertilization rates were 360, 120, and 120 kg ha-1
,
respectively, and fertilizer sources were urea, triple superphosphate, and potassium chloride.
Nitrogen was applied 30% and 70% at sowing and the sixth leaf stage, respectively. Both P and
K were applied 100% at sowing.
Each experimental unit consisted of five 3-m long rows with 0.6 m row spacing (9 m2). The
cultivated area at each environment was 223 m2 considering three Cd rates, three maize cultivars,
and three replicates for each experimental unit. Experiments were sown on 8, 17, and 24 October
in La Serena, Los Tilos, and Chillán, respectively. The sowing rate was 8 seeds m-1
at the three
environments. The seedbed was prepared by ploughing at a depth of 0.3 m followed by the
surface cultivator and two crosswise harrowings at 45º.
Six or seven irrigation events were applied after sowing up to the milk stage of kernel
development to complement precipitation accumulated between October and December 2013
(8.0, 0.1, 46.7 mm in La Serena, Los Tilos, and Chillán, respectively, Table 1). From 50 to 60
mm were applied during each irrigation event; this maintained adequate soil moisture to ensure
good crop development. The pre-emergent herbicide was a mixture of atrazine and s-metolachlor
17
(Primagran Gold 660 SC) that was applied at 6.0 L ha-1
at the post-emergence stage to control
dicotyledonous weeds. The chlorpyrifos insecticide (Pirinex 48 EC) was applied at 5.0 L ha-1
before sowing to control larvae in the soil. The incidence of diseases and insects was very low
and leaf fungicides and insecticides were not used.
Plots were harvested on 22, 24, and 29 April 2014 in La Serena, Los Tilos, and Chillán,
respectively.
2.4. Grain yield, and Cd analysis in soil and plant tissue
When grains reached 15% moisture content, the crop was harvested and GY determined. Samples
of plants with roots were collected from 1.0 m2 in each experimental plot; these were then
separated into grain, straw, and root. The separated samples were washed with distilled water and
oven-dried at 70 ºC for 72 h.
At the end of the experiment, 10 soil samples were collected from each plot at the 0 - 0.2 and
0.2 - 0.4 m depths; these were air-dried and passed through a 2 mm sieve to determine total Cd.
2.5. Statistical analysis
A split-split-plot experimental design was used where main plot was environment (3), split plots
were Cd rates (3), and split-split-plots were maize cultivars (3); each treatment was triplicated.
The results were analyzed by ANOVA. A mean separation test was then performed (Tukey, P
= 0.05) using the SAS general model procedure (SAS Institute, 1989).
3. RESULTS
Grain yield fluctuated between 5.5 and 15.5 Mg ha-1
; the highest value was obtained in La Serena
followed by Chillán and both had higher GY than Los Tilos. Grain yield was affected only by
environment (P < 0.05, Figure 1) and by the interaction between the Cd rate and maize cultivars
(P < 0.05, Table 3), while the Cd rate, cultivars, and resulting interactions with environments did
not affect this parameter (Table 3).
18
Grain Cd content was affected by the environment, Cd rate, and the Environment × Cd Rate
and Environment × Cultivar interactions (Table 3). For environment or environment, the highest
mean value for grain Cd content was obtained in La Serena (30.0 µg kg-1
) (P < 0.05), which was
greater than in Los Tilos (12.7 µg kg-1
) and Chillán (12.0 µg kg-1
), which were not different (P >
0.05) (Figure 2a). When comparing Cd rates (mean values of environments and cultivars), the
highest grain Cd content was obtained with 2 mg kg-1
CdCl2 (21.2 µg kg-1
) and 1 mg kg-1
CdCl2
(15.5 µg kg-1
) rates; there were nonsignificant differences one from the other (P > 0.05) and both
were higher than the control where Cd was not applied (4.3 µg kg-1
) (P < 0.05) (Figure 2b).
Regarding the cultivars (mean values of environments and Cd rates), it was observed that grain
Cd contents in Pioneer (14.6 µg kg-1
), Dekalb (13.1 µg kg-1
), and Syngenta (13.0 µg kg-1
) were
non-significantly different one from the other (p > 0.05) (Figure 2c). The interactions that
affected grain Cd content variability had a greater effect in La Serena (Figure 2).
Straw Cd content was affected by environment, Cd rate, and the Environment × Cd Rate
and Cd Rate × Cultivar interactions (Table 3). For agroclimatic zones (mean values of cultivars
and Cd rates), the highest straw Cd content was obtained in Los Tilos (3356.4 µg kg-1
) followed
by Chillán (2037.5 µg kg-1
) and there were non-significant differences between the two (p >
0.05); however, both were significantly higher than La Serena (1283.7 µg kg-1
) (p < 0.05) (Figure
2a). For the Cd rates (mean values of the environment and cultivars), the highest straw Cd
content was obtained with 2 mg kg-1
CdCl2 rate that was significantly higher than 1 mg kg-1
CdCl2 rate (p < 0.05); both were significantly higher than the control with no Cd (p < 0.05). For
the 2, 1, and 0 mg kg-1
CdCl2 rates, values were 3395.6, 1883.2, and 203.8 µg kg-1
, respectively
(Figure 2b). For cultivars (mean values of environments and Cd rates), values of straw Cd
content sorted in descending order were Dekalb (2017.4 µg kg-1
), Pioneer (1947.2 µg kg-1
), and
Syngenta (1618.0 µg kg-1
) and these were non-significantly different one from the other (p >
0.05) (Figure 2c). The interactions in straw Cd content indicated that the highest variability
associated with using different Cd rates was 5895.8 µg kg-1
of Cd in stem residue in Los Tilos
(data not shown).
Root Cd content was affected by environment, Cd rate, and the Environment × Cd Rate
interaction (Table 3). When considering the environment (mean values of cultivars and Cd rates),
the highest root Cd content was found in La Serena (2252.8 µg kg-1
) and it was significantly
different from the other two environments (p < 0.05); Chillán (439.8 µg kg-1
) and Los Tilos
19
(283.8 µg kg-1
) were non-significantly different one from the other (p > 0.05) (Figure 2a). For Cd
rates (mean values of environments and cultivars), the highest root Cd contents were obtained
with the 2 and 1 mg kg-1
CdCl2 rates; there were non-significant differences between the two (p >
0.05) with values of 1215.6 and 945.3 µg kg-1
, respectively, which significantly surpassed (p <
0.05) the control (273.0 µg kg-1
, Figure 2b). Regarding the cultivars (mean values of
environments and Cd rates), root Cd concentrations were 907.8 µg kg-1
in Dekalb, 816.9 µg kg-1
in Pioneer, and 709.3 µg kg-1
in Syngenta and there was non-significant difference among them
(p > 0.05) (Figure 2c). The interactions in the root Cd concentration exhibited higher variability
associated with the environment where the mean concentration found in La Serena was 5.1 and
7.9 times higher than in Chillán and Los Tilos, respectively (Figures 2a, 2b).
For differences in the tissues of a single plant, usually from the same agroclimatic zone, the
highest Cd concentration was in the straw, with the exception of La Serena where the root had the
highest Cd concentration; grain and root Cd concentrations were non significantly different (P >
0.05) among environments (Figure 2a). For the same Cd rate, the effect was similar to the
abovementioned observations (Figure 2b). Finally, the highest concentration for any one cultivar
was also in the straw, but the values were non-significantly different one from the other (Figure
2c).
Total soil Cd at harvest in both the first and second soil layers (0 - 0.2 and 0.2 - 0.4 m) was
affected by the environment, Cd rate, and Environment × Cd Rate interaction; only the first layer
was affected by the Environment × Cultivar interaction (Table 3). When comparing environments
for the first soil layer (0 - 0.2 m), the highest total Cd concentrations were obtained in Los Tilos
and La Serena and there were significant differences between the two (P > 0.05) with values of
1.97 and 1.95 mg kg-1
, respectively; these values were also significantly higher (p < 0.05) than in
Chillán where total Cd concentration was 0.81 mg kg-1
(Table 3 and Figure 3a). Different Cd
rates (Table 3 and Figure 3b) showed that total soil Cd concentration was significantly equal for
the two applied Cd rates (2 and 1 mg kg-1
CdCl2) (P > 0.05) whose values were 2.13 and 1.48 mg
kg-1
, respectively, while the control value (0.5 mg kg-1
Cd) was only significantly different at the
highest Cd rate (P < 0.05) (Figure 3b).
When comparing environments for the second soil layer (0.2 - 0.4 m), the highest total Cd
concentrations were obtained in La Serena (1.82 mg kg-1
) and Los Tilos (0.81 mg kg-1
); there
were non-significant differences between the two (p > 0.05). On the other hand, the value in
20
Chillán (0.45 mg kg-1
) was quite lower than the other environments, but only showed significant
differences with La Serena (p < 0.05) (Figure 3a).
Mean values obtained by applying the different Cd rates, 0, 1, and 2 mg kg-1
CdCl2 were
0.47, 0.97, and 1.27 mg kg-1
, respectively. The highest total Cd concentration in the second soil
layer occurred, as expected, when applying the 2 mg kg-1
CdCl2 rate, which only surpassed the
control value (p > 0.05); the value obtained with the 1 mg kg-1
rate showed nonsignificant
differences when compared to either the control or the highest applied CdCl2 rate (p > 0.05)
(Figure 3b).
The concentration in the second soil depth showed non-significant differences (P > 0.05)
among cultivars (Figure 3c); this is similar to the result obtained in the first soil layer (0 - 0.20
m).
4. DISCUSSION
Maize grain yields (GY) obtained in La Serena and Chillán (Figure 1) were similar to GY found
by other authors for this species under adequate agronomic management conditions. However,
GY obtained in Los Tilos was lower than the value recorded by these authors and lower than
expected in the study area (Liu et al., 2013). The limitations of GY for this environment are
mainly due to the lack of heat accumulation during the development period (Table 1); this
coincides with findings described by Liu et al. (2013) who observed a significant correlation
between GY and mean temperature and accumulation of degree-days.
Maize grain Cd concentration (Figures 2a, 2b, 2c) showed values within the range cited by
Yang et al. (2014) and Xu et al. (2015); this is the mean value of Cd found in the present study,
0.015 mg kg-1
(mean of 27 values that consider three environments, three Cd rates, and three
cultivars). Yang et al. (2014) obtained a mean grain Cd concentration of 0.03 mg kg-1
(mean of
nine Cd rates). Grain Cd concentration values for all the treatments in the present study did not
surpass the allowable limits of 0.2 mg kg-1
pointed out by several authors (Arduini et al., 2014;
Putwattana et al., 2015) or the limits allowed by the different health organizations, such as the
Ministry of Health of the People’s Republic of China (MSRPCH, 2012). Maize grain Cd
concentration values, obtained by averaging cultivars and environments, were lower in all cases
than those pointed out by Yang et al. (2014) and Xu et al. (2015) for different maize cultivars
21
(Figures 2a, 2b, 2c). Several authors have pointed out that maize grain Cd concentration is below
the detection limit of 0.002 mg kg-1
(Wahsha et al., 2014). Therefore, the low grain Cd
accumulation could be due to several factors: 1) uptake and translocation limitations generated in
the root (Adeniji et al., 2010; Yang et al., 2014), which suggests that maize plants appear to have
more efficient defence mechanisms than other crops to deal with Cd toxicity, including its
accumulation in the root (Adeniji et al., 2010); 2) soil available Zn concentration since Zn is an
antagonist to plant Cd uptake (Tanwir et al., 2015); and 3) low Cd concentration could be
attributable to the high agronomic efficiency of nutrient use (kg DM produced per kg of applied
nutrient) obtained in this experiment (data not shown) compared with other studies cited in the
literature, which implied an overall nutrient dilution effect (Fahad et al., 2015). However,
applying increasing Cd rates produced an increase of more than 100% in maize grain Cd
accumulation when compared with the control with no applied Cd (Arduini et al., 2014; Yang et
al., 2014; Xu et al., 2015). Although differences among environments were found in the controls,
this fact could be related to the initial total soil Cd concentration (Table 2); this has been reported
by numerous authors (Degryse et al., 2009; McDowell et al., 2013; Yang et al., 2014). On the
other hand, differences in grain Cd concentration detected among environments could be due to
higher mineral use efficiency (Arduini et al., 2014). When comparing cultivars, grain Cd
concentration in the controls, in addition to being low, was similar in the different evaluated
cultivars (Syngenta, Pioneer and Dekalb); this contributes in selecting genetic material with low
Cd accumulation for the agroclimatic conditions in Chile.
Regarding the straw Cd concentration, Wahsha et al. (2014) cite values of 0.021 and 0.058
mg kg-1
as the mean Cd concentration in stems and leaves, respectively. Mean straw Cd values
obtained in the present study in La Serena, Los Tilos, and Chillán were higher than those reported
by Wahsha et al. (2014), which was probably due to the initial soil Cd concentration as indicated
by Putwatana et al. (2015). Maize straw Cd concentration for the mean of cultivars was also
higher than those mentioned by Wahsha et al. (2014); however, Cd was applied in two of the
three treatments in the present study, which could have affected the abovementioned mean
concentration values (Putwatana et al., 2015; Yang et al., 2014; Xu et al., 2015).
The highest root Cd concentration (mean of environments) was obtained in La Serena
(Figure 2a), which can be associated with the initial soil Cd concentration (Table 2) (Degryse et
al., 2009; McDowell et al., 2013). Results at the other two environments (Los Tilos and Chillán)
22
did not coincide with those found by other authors, who indicate that roots always exhibit higher
Cd concentrations than other parts of the plant (Lysenko et al., 2014; Wahsha et al., 2014;
Putwatana et al., 2015; Tanwir et al., 2015); this suggests that Cd distribution in the plant could
be related to the cultivar (Yang et al., 2014). Likewise, root Cd concentration in Los Tilos would
have been expected to be higher than in Chillán (Figure 2a) because it was associated with higher
soil Cd concentration (Table 2). However, soluble Cd compounds could have been immobilized
by increases in pH (Degryse et al., 2009), especially in values higher than 8.2 such as those found
in Los Tilos (Table 2). It has also been observed that roots can exude compounds that increase
environment pH, decrease availability, and restrict Cd uptake (Tanwir et al., 2015). On the
contrary, another factor that would explain low Cd accumulation in Chillán for grain, stem, and
root could be due to greater competition between the H+ and Cd
+2 cations in the uptake sites on
the root surface (Larsson and Asp, 2013). A directly proportional response was found between
the applied Cd rate and root Cd concentration (Figure 2b); results were similar to those reported
by Liu et al. (2013) and Du et al. (2014), and values corresponded to an increase equivalent to
3.5 and 4.5 times compared with the control when applying 1 and 2 mg kg-1
CdCl2, respectively.
In general, the residue had higher Cd concentration compared to grain and root (Figure 2a, 2b,
and 2c). In this regard, similar results were observed in other crops as higher Cd concentrations in
stems of lettuce (Lactuca sativa L.) and amaranth (Amaranthus caudatus L.) by Egwu and
Agbenin (2013) and wheat (Triticum aestivum L.) by Siebers et al. (2014). Also, these results
were similar to those of Liang et al. (2005) and Stritsis et al. (2012), who found higher Cd
concentration in residue than in the rest of maize plants. This higher Cd concentration in residue
would indicate a higher Cd transference rate to the aerial part influenced by a decrease of sap
flow, which would generate an increase of Cd concentration in xylem by exposure of this crop to
high concentrations of this metal, as stated by Liang et al. (2005). These higher concentrations in
aerial parts expose animals and human beings to this heavy metal. So, these results would help us
to discriminate these cultivars for animal feeding decreasing the transference risk of this heavy
metal to human being. For cultivars, the lowest root Cd concentration was obtained in Syngenta;
Pioneer surpassed Syngenta and Dekalb by 15% and 11%, respectively (Figure 2c); however,
there was nonsignificant difference among cultivars (p < 0.05).
Total Cd concentrations in the first soil layer (0 - 0.2 m) of the present study were similar to
those cited by some authors for soils with different agricultural use (Rothbaum et al., 1986;
23
McDowell et al., 2013) (Figures 3a, 3b, 3c), and also similar to those cited by Segura et al.
(2006) for different soils in Chile. Values were lower at 1 mg kg-1
, which is identified as the
critical soil Cd level (Quezada-Hinojosa et al., 2015; Liu et al., 2015b). When comparing
environments, higher total Cd concentration was found in La Serena (Figure 3a), which could be
associated with its initial Cd content (Table 2) and available Zn concentration (Degryse et al.,
2009; Fahad et al., 2015). Even though initial soil total Cd concentration in La Serena was higher
than in Los Tilos and Chillán (Table 2), this order was not maintained when concentrations were
analyzed at the end of crop growth (Figure 3a). This situation could be explained by the
formation of complexes between the metal and OM (Degryse et al., 2009); taking into account
that Chillán had a higher OM concentration than the other environments, Cd availability is
reduced (Table 2). When comparing Los Tilos and La Serena, the former would also be
influenced by higher OM content than La Serena, which would reduce Cd availability (Degryse
et al., 2009). As expected, the Cd rate used was directly proportional to soil concentration (Figure
3b), which coincides with findings reported in the literature (Du et al., 2014); both applied CdCl2
rates were higher than the critical threshold of this element in soils (1 mg kg-1
). Regarding the
maize cultivars under study, no effect was recorded on soil total Cd concentration (Figure 3c).
In general, the second soil layer (0.2 - 0.4 m) exhibited a similar effect as the one found in the
first soil layer when comparing environments and Cd rates. However, concentrations and the
magnitude of the differences were lower (Figures 3a, 3b). This effect could be attributable to the
characteristics of this element in the soil, which is mainly located at the surface (Rothbaum et al.,
1986). When comparing the environments, the Cd concentration was higher in Los Tilos than
Chillán (Figure 3a), unlike the result in the first soil layer. This could be due to the higher salinity
found in Los Tilos (Table 2).
5. CONCLUSIONS
Results show that the presence of Cd in the soil (baseline and applied) did not affect maize yield.
In turn, the Cd concentration in both maize grain and straw was affected by crop environment and
applied soil Cd. The Cd concentration in the roots was affected by the environment and also by
applied soil Cd. In roots, Cd concentration was affected by environment and also by soil Cd
application. The cultivars evaluated in the present study showed no differences in Cd
24
concentration in none of the analyzed tissues, which does not allow the selection of a cultivar
with a lower Cd accumulation for contaminated environments or at risk of being contaminated
with this metal. The highest grain Cd concentration was found in La Serena environment (30 µg
kg-1
; P < 0.05) and in Pioneer cultivar (19.5 µg kg-1
; P < 0.05), but in no case corresponded to the
value considered as the limit (0.2 mg kg-1
). Finally, once the maize was harvested, soil total Cd
concentration depended on the environment and the Cd rate used, and higher accumulation
occurred in the first soil layer.
ACKNOWLEDGEMENTS
This study was funded by Chile FONDECYT Project 1120992.
REFERENCES
Adeniji, B.A., Budimir-Hussey, M.T., Macfie, S.M. 2010. Production of organic acids and
adsorption of Cd on roots of durum wheat (Triticum turgidum L. var. durum). Acta
Physiologiae Plantarum. 32, 1063-1072.
ATSDR. 2012. Toxicological profile for cadmium. Agency for Toxic Substances and Disease
Registry USA (ATSDR) Available at: http://www.atsdr.cdc.gov/toxprofiles/tp5.pdf.
Arduini, I., Masoni, A., Mariotti, M., Pampana, S., Ercoli, L. 2014. Cadmium uptake and
translocation in durum wheat varieties differing in grain-Cd accumulation. Plant Soil
Environment. 60, 43-49.
Berg, T., Licht, D. 2002. International legislation on trace elements as contaminants in food: A
review. Food Additives and Contaminants. 10, 916-927.
Clemens, S., Aarts, M., Thomine, S., Verbruggen, N. 2013. Plant science: the key to preventing
slow cadmium poisoning. Trends in Plant Science. 18, 92-99.
Chang, Y., Wen, J., Cai, J., Xiao-ying, W., Yang, L., Guo, Y. 2012. An investigation and
pathological analysis of two fatal cases of cadmium poisoning. Forensic Science International.
220, e5-e8.
25
Degryse, F., Smolders, E., Parker, D. R. 2009. Partitioning of metals (Cd, Co, Cu, Ni, Pb, Zn) in
soils: concepts, methodologies, prediction and applications – a review. European Journal of
Soil Science. 60, 590-612.
Du, Y.L., He, M.M., Xu, M., Yan, Z.G., Zhou, Y.Y., Guo, G.L., Nie, J., Wang, L.Q., Hou, H., Li,
F.S. 2014. Interactive effects between earthworms and maize plants on the accumulation and
toxicity of soil cadmium. Soil Biology and Biochemistry. 72, 193-202.
Egwu, G., Agbenin, J. 2013. Field assessment of cadmium, lead and zinc contamination of soils
and leaf vegetables under urban and peri-urban agriculture in northern Nigeria. Archives of
Agronomy and Soil Science. 59, 875-887.
Eshghi, S., Ranjbar, R. 2014. Vegetative growth, yield and leaf mineral composition in
strawberry (Fragaria ×ananassa Duch. cv. Pajaro) as influenced using nickel sulfate and urea
sprays. Journal of Plant Nutrition. doi:10.1080/01904167.2014.983121.
Fahad, S., Hussain, S., Saud, S., Hassan, S., Darakhshan, Y., Chen, N., Deng, F., Khan, Ch., Wu,
W., Wu, F., Shah, B., Ullah, M., Yousaf, S., Ali, S., Huang, J. 2015. Grain cadmium and zinc
concentrations in maize influenced by genotypic variations and zinc fertilization. Clean Soil
Air Water. 43, 1433-1440.
Goyer, R.A. 1997. Toxic and essential metal interactions. Annual Review of Nutrition. 17, 37-50.
Jayakumar, K., Vijayarengan, P. 2014. Cobalt induced changes in growth and biochemical
constituents in tomato (Lycopersicon esculantum Mill.) plants. International Journal of
Modern Plant and Animal Sciences. 2, 42-49.
Larsson, J. E., Asp, H. 2013. Effects of pH and nitrogen on cadmium uptake in potato. Biologia
Plantarum. 57, 788-792.
Liang, Y., Wong, J., Wei, L. 2005. Silicon-mediated enhancement of cadmium tolerance in maize
(Zea mays L.) grown in cadmium contaminated soil. Chemosphere. 58, 475-483.
Liu, Y., Hou, P., Xie, R., Li, S., Zhang, H., Ming, B., Ma, D., Liang, S. 2013. Spatial
Adaptabilities of Spring Maize to Variation of Climatic Conditions. Crop Science. 53, 1693-
1703.
Liu, Y., Xiao T., Baveye, P.C., Zhu, J., Ning, Z., Li, H. 2015a. Potential health risk in areas with
high naturally-occurring cadmium background in southwestern China. Ecotoxicology and
Environmental Safety. 112, 122-131.
26
Liu, K., Lvn, J., He, W., Zhang, H., Cao, Y., Dai, Y. 2015b. Major factors influencing cadmium
uptake from the soil into wheat plants. Ecotoxicology and Environmental Safety. 113, 207-
213.
Lindsay, W.L., Norvell, W.A. 1978. Development of a DTPA soil test for zinc, iron, manganese,
and copper. Soil Science Society of America Journal. 42, 421-428.
MSRPCH. 2012. Niveles máximos de contaminantes en alimentos, Norma Nacional de Inocuidad
Alimentaria. GB 2762-2012. Ministerio de Salud de la República Popular de China
(MSRPCH), Beijing, China.
McDowell, R.W., Taylor, M.D., Stevenson, B. A. 2013. Natural background and anthropogenic
contributions of cadmium to New Zealand soils. Agriculture Ecosystems and Environment.
165, 80-87.
Oliver, D.P., Schultz, J.E., Tiller, K.G., Merry, R.H. 1993. The effect of crop rotations and tillage
practices on cadmium concentration in wheat grain. Australian Journal of Agricultural
Research. 44, 1221-1234.
FAO. 2015. Agricultura mundial: hacia los años 2015/2030. [Online] Organización de las
Naciones Unidas para la Agricultura y la Alimentación (FAO), Roma, Italia. Available at:
http://www.fao.org.
OXFAM. 2013. Adversidad creciente: Cambio climático, alimentos y la lucha contra el hambre.
Available at: https://www.oxfam.org/sites/www.oxfam.org/files/adversidad-creciente-cambio-
climatico-alimentos-hambre-informe-es.pdf.
Putwattana, N., Kruatrachue, M., Kumsopa, A., Pokethitiyook, P. 2015. Evaluation of organic
and inorganic amendments on maize growth and uptake of Cd and Zn from contaminated
paddy soils. International Journal of Phytoremediation. 17, 165-174.
Quezada-Hinojosa, R., Föllmi, K. B., Gillet, F., Matera, V. 2015. Cadmium accumulation in six
common plant species associated with soils containing high geogenic cadmium concentrations
at Le Gurnigel, Swiss Jura Mountains. Catena. 124, 85-96.
Red Agrometeorológica de INIA. 2013. Agromet: red agrometeorológica del INIA. Available at:
http://agromet.inia.cl/estaciones.php#estaciones.
Rothbaum, H.P., Goguel, R.L., Johnston, A.E., Mattingly, G.E. 1986. Cadmium accumulation in
soils from long continued applications of superphosphate. Journal Soil Science. 37:99-107.
27
Sadzawka, A., Carrasco, M.A., Grez, R., Mora, M., Flores, H., Neaman, A. 2006. Métodos de
análisis recomendados para los suelos de Chile. Serie Actas INIA Nº34. 164 p. Instituto de
Investigaciones Agropecuarias (INIA), Santiago, Chile.
Segura, R., Arancibia, V., Zúñiga, M.C., Pastén, P. 2006. Distribution of copper, zinc, lead and
cadmium concentrations in stream sediments from the Mapocho River in Santiago, Chile.
Journal of Geochemical Exploration. 91, 71-80.
SAS Institute. 1989. Usage and Reference. Version 6. 501 p. SAS. Institute Inc., Cary, North
Carolina, USA.
Siebers, N., Godlinski, F., Leinweber, P. 2014. Bone char as phosphorus fertilizer involved in
cadmium immobilization in lettuce, wheat, and potato cropping. Journal Plant Nutrition and
Soil Science. 177, 75-83.
Stritsis, Ch., Steingrobe, B., Claassen, N. 2012. Shoot cadmium concentration of soil-grown
plants as related to their root properties. Journal Plant Nutrition and Soil Science. 175, 456-
465.
Tanaka, K., Fujimaki, S., Fujiwara, T., Yoneyama, T., Hayashi, H. 2007. Quantitative estimation
of the contribution of the phloem in cadmium transport to grains in rice plants (Oryza sativa
L.). Soil Science and Plant Nutrition. 53, 72-77.
Tanwir, K., Akram, M.S., Masood, S., Chaudhary, H.J., Lindberg, S., Javed, M.T. 2015.
Cadmium-induced rhizospheric pH dynamics modulated nutrient acquisition and physiological
attributes of maize (Zea mays L.) Environmental Science and Pollution Research. 22, 9193-
9203.
Trejo, N., Matus, I., del Pozo, A., Walter I., Hirzel, J. 2016. Cadmium phytoextraction capacity
of white lupine (Lupinus albus L.) and narrow-leafed lupine (Lupinus angustifolius L.) in three
contrasting agroclimatic conditions of Chile. Chilean Journal of Agricultural Research. 76(2),
228-235.
USDA. 2014. Keys to soil taxonomy. 12nd
ed. USDA-Natural Resources Conservation Service,
Washington, DC., USA, 360 p.
WHO. 2010. Exposure to cadmium: A major public health concern. Public Health and
Environment, World Health Organization (WHO), Geneva, Switzerland. p. 3-6. Available at:
http://www.who.int/ipcs/features/cadmium.pdf).
28
Wahsha, M., Fontana, S., Nadimi-Goki, M., Bini, C. 2014. Potentially toxic elements in food
crops (Triticum aestivum L., Zea mays L.) grown on contaminated soils. Journal of
Geochemical Exploration. 147, 189-199.
Wang Q., Zhang, J., Zhao, B., Xin, X., Zhang, C., Zhang, H. 2014. The influence of long-term
fertilization on cadmium (Cd) accumulation in soil and its uptake by crops. Environmental
Science and Pollution Research. 21, 10377-10385.
Xu, W., Lu, G., Wang, R., Guo, Ch., Liao, Ch., Yi, X., Dang, Z. 2015. The effect of pollination
on Cd phytoextraction from soil by maize (Zea mays L.). International Journal of
Phytoremediation. 17, 945-950.
Yang, Y., Nan, Z., Zhao, Z. 2014. Bioaccumulation and translocation of cadmium in wheat
(Triticum aestivum L.) and maize (Zea mays L.) from the polluted oasis soil of Northwestern
China. Chemical Speciation and Bioavailability. 26, 43-51.
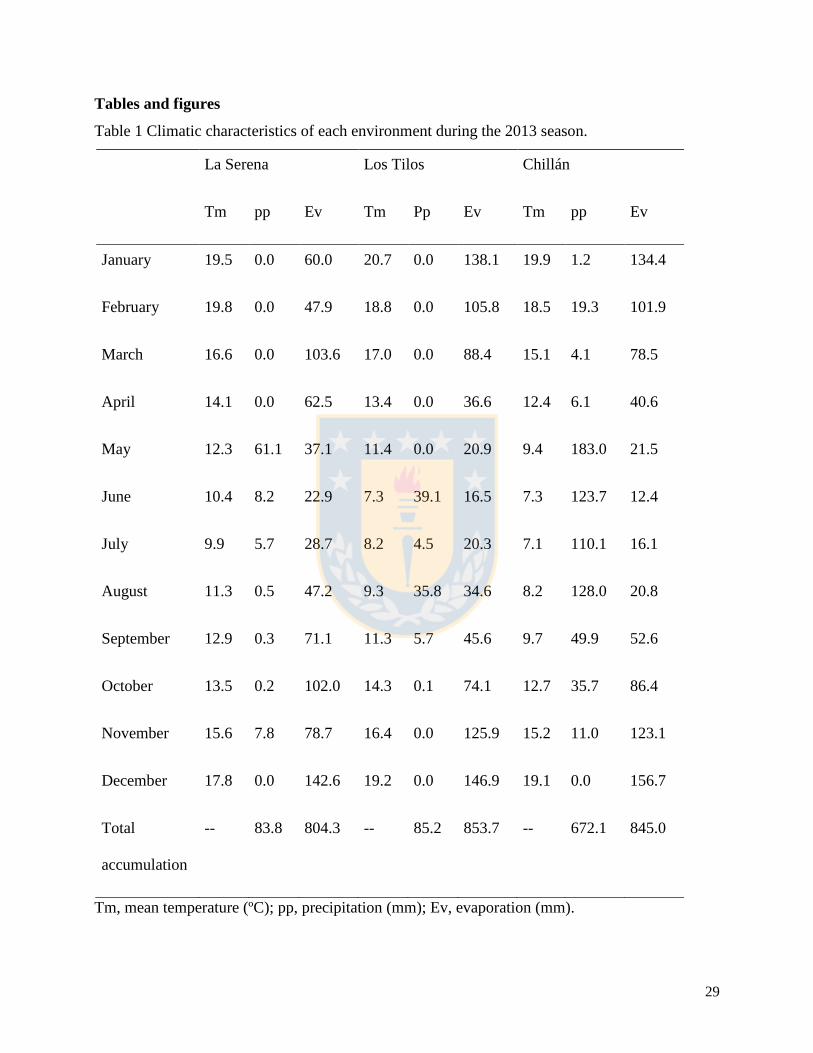
29
Tables and figures
Table 1 Climatic characteristics of each environment during the 2013 season.
La Serena Los Tilos Chillán
Tm pp Ev Tm Pp Ev Tm pp Ev
January 19.5 0.0 60.0 20.7 0.0 138.1 19.9 1.2 134.4
February 19.8 0.0 47.9 18.8 0.0 105.8 18.5 19.3 101.9
March 16.6 0.0 103.6 17.0 0.0 88.4 15.1 4.1 78.5
April 14.1 0.0 62.5 13.4 0.0 36.6 12.4 6.1 40.6
May 12.3 61.1 37.1 11.4 0.0 20.9 9.4 183.0 21.5
June 10.4 8.2 22.9 7.3 39.1 16.5 7.3 123.7 12.4
July 9.9 5.7 28.7 8.2 4.5 20.3 7.1 110.1 16.1
August 11.3 0.5 47.2 9.3 35.8 34.6 8.2 128.0 20.8
September 12.9 0.3 71.1 11.3 5.7 45.6 9.7 49.9 52.6
October 13.5 0.2 102.0 14.3 0.1 74.1 12.7 35.7 86.4
November 15.6 7.8 78.7 16.4 0.0 125.9 15.2 11.0 123.1
December 17.8 0.0 142.6 19.2 0.0 146.9 19.1 0.0 156.7
Total
accumulation
-- 83.8 804.3 -- 85.2 853.7 -- 672.1 845.0
Tm, mean temperature (ºC); pp, precipitation (mm); Ev, evaporation (mm).
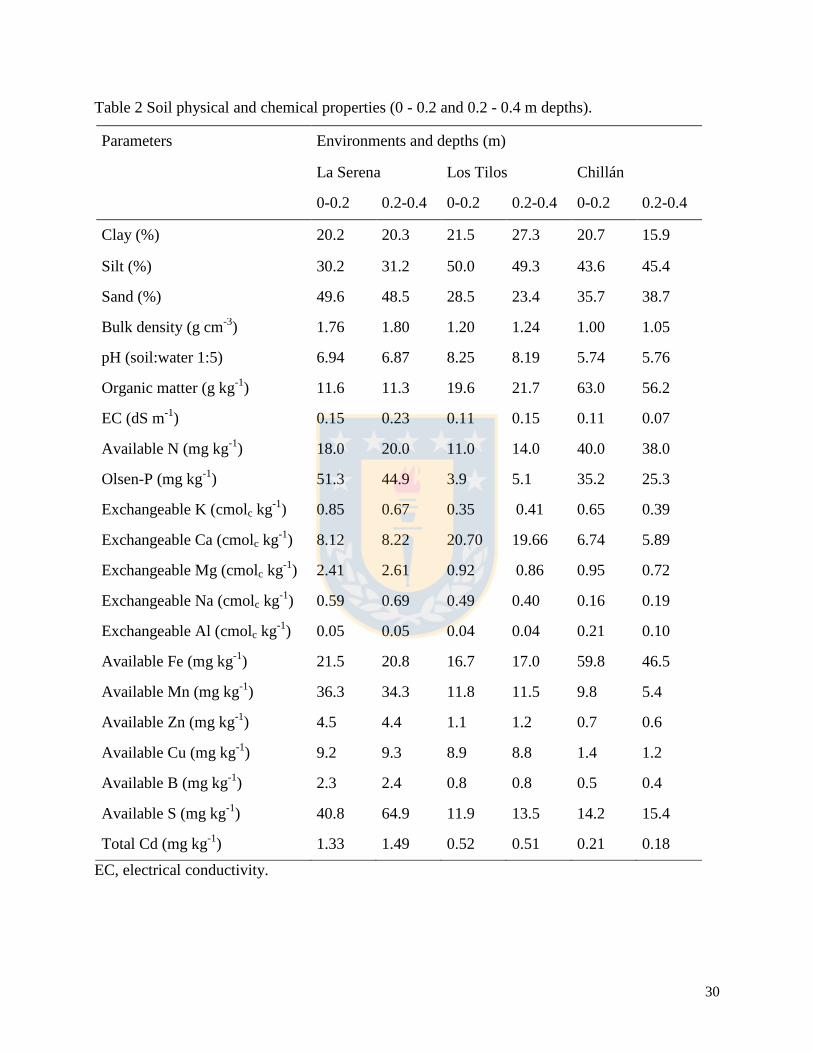
30
Table 2 Soil physical and chemical properties (0 - 0.2 and 0.2 - 0.4 m depths).
Parameters Environments and depths (m)
La Serena Los Tilos Chillán
0-0.2 0.2-0.4 0-0.2 0.2-0.4 0-0.2 0.2-0.4
Clay (%) 20.2 20.3 21.5 27.3 20.7 15.9
Silt (%) 30.2 31.2 50.0 49.3 43.6 45.4
Sand (%) 49.6 48.5 28.5 23.4 35.7 38.7
Bulk density (g cm-3
) 1.76 1.80 1.20 1.24 1.00 1.05
pH (soil:water 1:5) 6.94 6.87 8.25 8.19 5.74 5.76
Organic matter (g kg-1
) 11.6 11.3 19.6 21.7 63.0 56.2
EC (dS m-1
) 0.15 0.23 0.11 0.15 0.11 0.07
Available N (mg kg-1
) 18.0 20.0 11.0 14.0 40.0 38.0
Olsen-P (mg kg-1
) 51.3 44.9 3.9 5.1 35.2 25.3
Exchangeable K (cmolc kg-1
) 0.85 0.67 0.35 0.41 0.65 0.39
Exchangeable Ca (cmolc kg-1
) 8.12 8.22 20.70 19.66 6.74 5.89
Exchangeable Mg (cmolc kg-1
) 2.41 2.61 0.92 0.86 0.95 0.72
Exchangeable Na (cmolc kg-1
) 0.59 0.69 0.49 0.40 0.16 0.19
Exchangeable Al (cmolc kg-1
) 0.05 0.05 0.04 0.04 0.21 0.10
Available Fe (mg kg-1
) 21.5 20.8 16.7 17.0 59.8 46.5
Available Mn (mg kg-1
) 36.3 34.3 11.8 11.5 9.8 5.4
Available Zn (mg kg-1
) 4.5 4.4 1.1 1.2 0.7 0.6
Available Cu (mg kg-1
) 9.2 9.3 8.9 8.8 1.4 1.2
Available B (mg kg-1
) 2.3 2.4 0.8 0.8 0.5 0.4
Available S (mg kg-1
) 40.8 64.9 11.9 13.5 14.2 15.4
Total Cd (mg kg-1
) 1.33 1.49 0.52 0.51 0.21 0.18
EC, electrical conductivity.
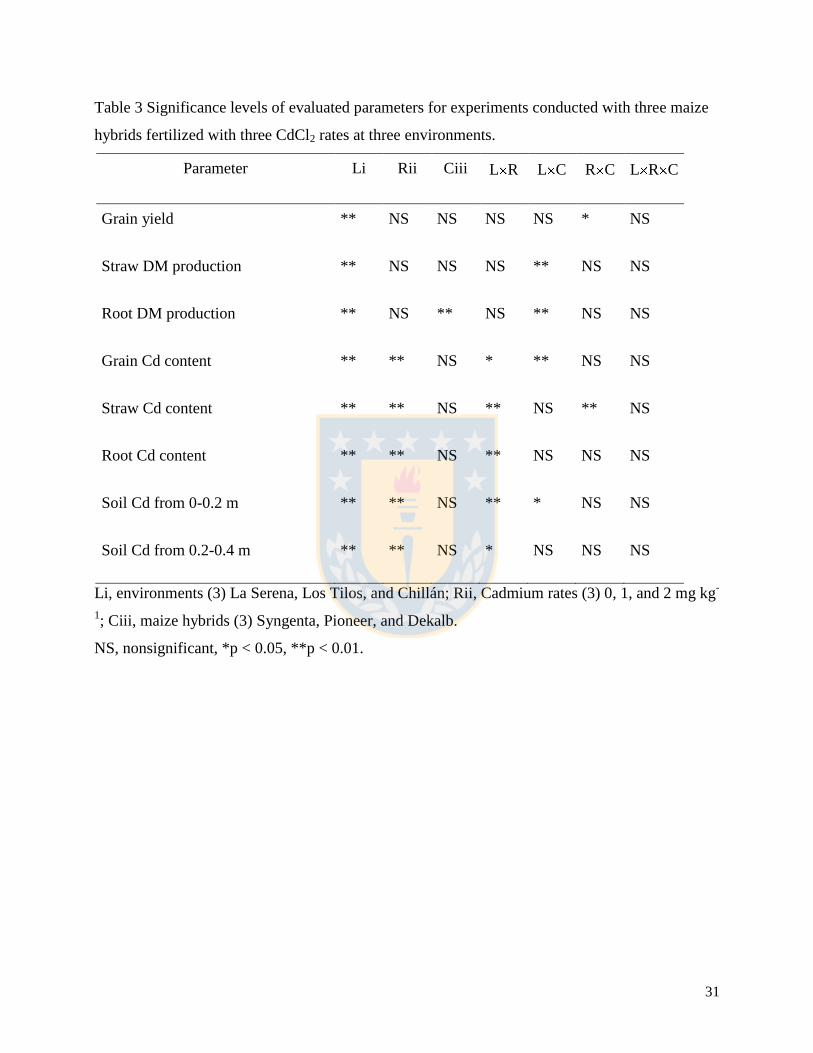
31
Table 3 Significance levels of evaluated parameters for experiments conducted with three maize
hybrids fertilized with three CdCl2 rates at three environments.
Parameter Li Rii Ciii L R L C R C L R C
Grain yield ** NS NS NS NS * NS
Straw DM production ** NS NS NS ** NS NS
Root DM production ** NS ** NS ** NS NS
Grain Cd content ** ** NS * ** NS NS
Straw Cd content ** ** NS ** NS ** NS
Root Cd content ** ** NS ** NS NS NS
Soil Cd from 0-0.2 m ** ** NS ** * NS NS
Soil Cd from 0.2-0.4 m ** ** NS * NS NS NS
Li, environments (3) La Serena, Los Tilos, and Chillán; Rii, Cadmium rates (3) 0, 1, and 2 mg kg-
1; Ciii, maize hybrids (3) Syngenta, Pioneer, and Dekalb.
NS, nonsignificant, *p < 0.05, **p < 0.01.
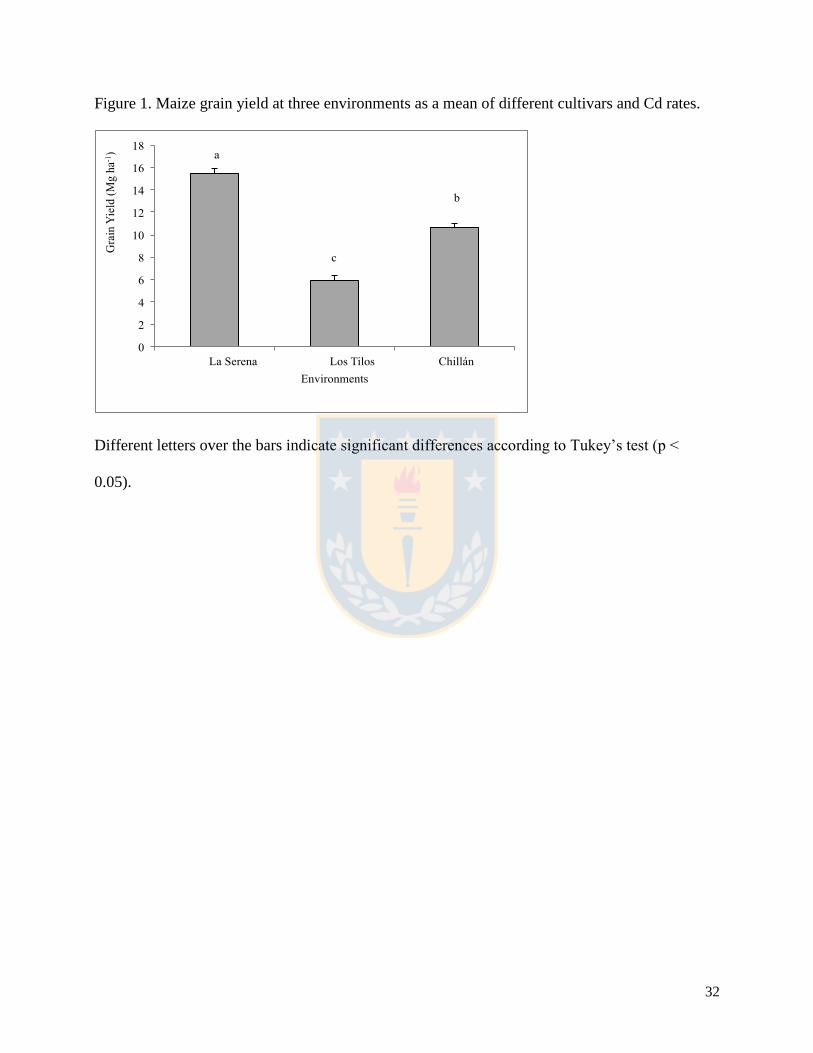
32
Figure 1. Maize grain yield at three environments as a mean of different cultivars and Cd rates.
Different letters over the bars indicate significant differences according to Tukey’s test (p <
0.05).
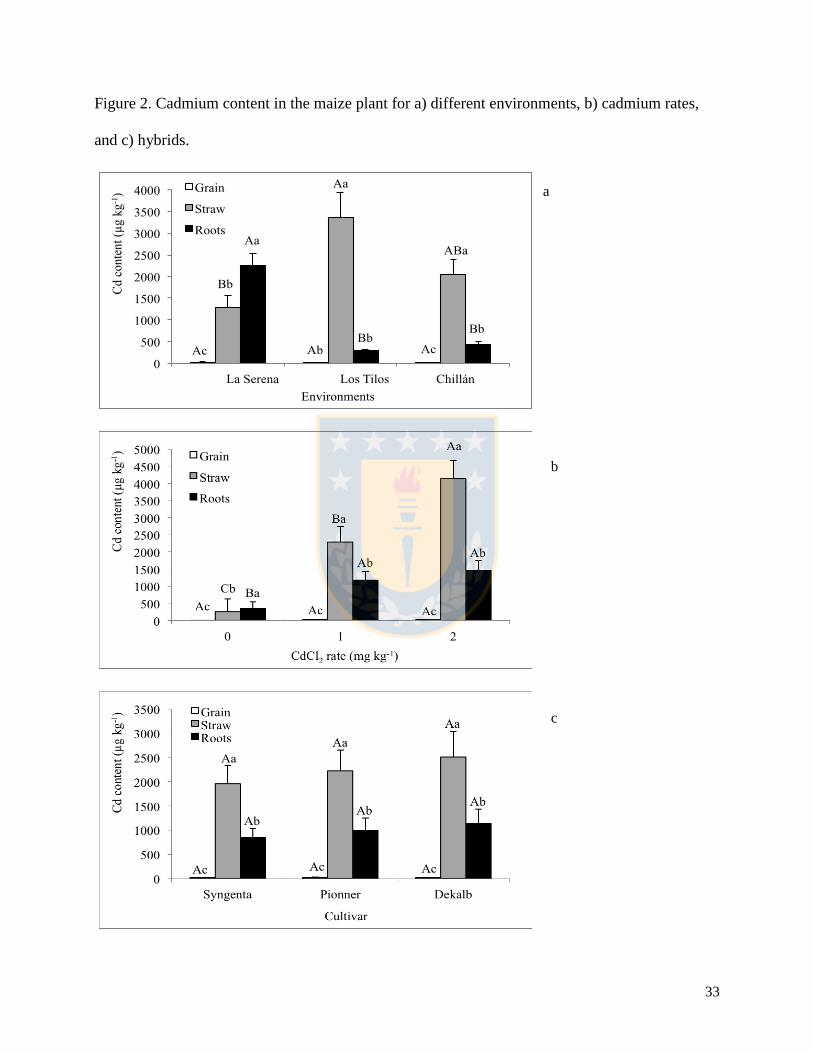
33
Figure 2. Cadmium content in the maize plant for a) different environments, b) cadmium rates,
and c) hybrids.
a
b
c
34
For each figure, different uppercase letters over the bars indicate significant differences in the
same plant structure (grain, straw, roots) compared for a) environments, b) cadmium rates, and c)
maize hybrids according to Tukey’s test (p < 0.05).
For each figure, different lower-case letters over the bars indicate significant differences in the
same plant structure (grain, straw, roots) for each a) environment, b) cadmium rates, and c) maize
hybrid according to Tukey’s test (p < 0.05).
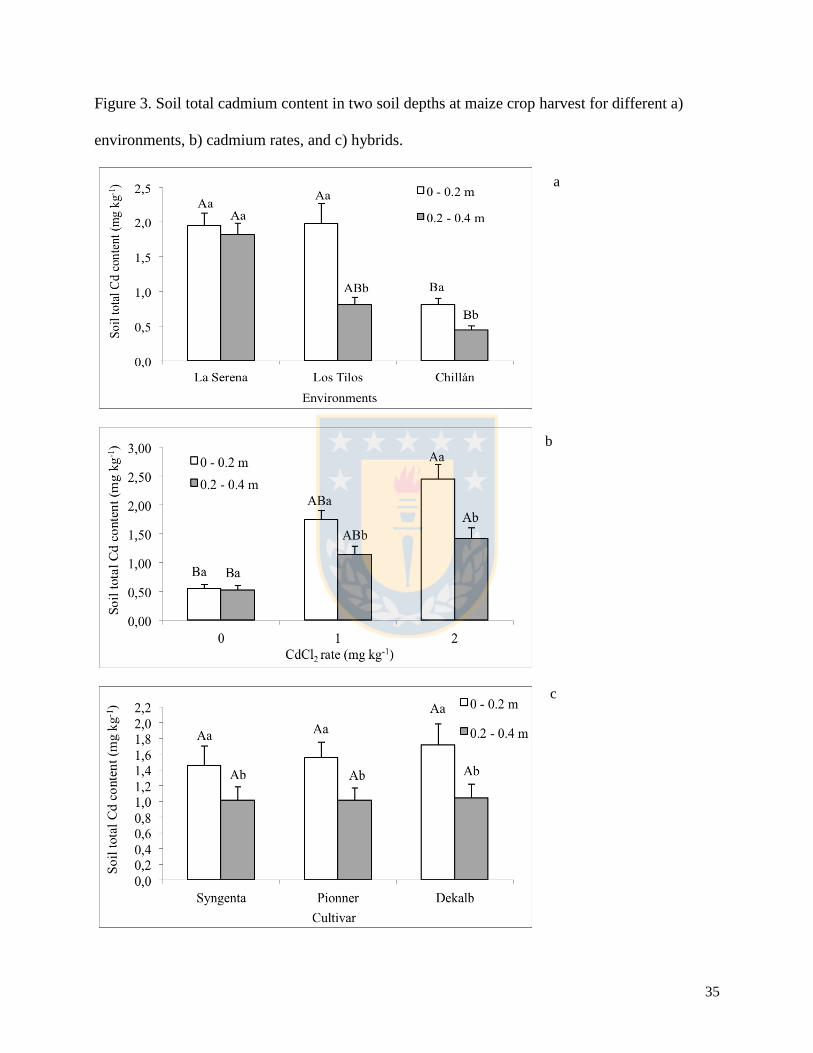
35
Figure 3. Soil total cadmium content in two soil depths at maize crop harvest for different a)
environments, b) cadmium rates, and c) hybrids.
a
b
c
36
For each figure, different uppercase letters over the bars indicate significant differences at the
same soil depth compared for a) environments, b) cadmium rates, and c) maize hybrids according
to Tukey’s test (p < 0.05).
For each figure, different lower-case letters over the bars indicate significant differences between
soil depths for each a) environment, b) cadmium rates, and c) maize hybrid according to Tukey’s
test (p < 0.05).
37
IV. CAPITULO II
BIOABSORPTION AND BIOACCUMULATION OF CADMIUM IN THE
STRAW AND GRAIN OF MAIZE (ZEA MAYS L.) IN GROWING SOILS
CONTAMINATED WITH CADMIUM IN DIFFERENT ENVIRONMENT
Jorge Retamal-Salgado 1,2,3
, Juan Hirzel 4,
*, Ingrid Walter 5 and Iván Matus
4
1 Faculty of Agronomy, Universidad de Concepción, Vicente Méndez 595, Casilla 537, Chillán
3812120, Chile; [email protected] 2 Doctoral Program in Agronomic Sciences, Faculty of Agronomy, Universidad de Concepción,
Vicente Méndez 595, Casilla 537, Chillán 3812120, Chile 3 Faculty of engineering and business, Universidad Adventista de Chile, km 12 camino a
Tanilvoro, Chillán 3780000, Chile 4 Instituto de Investigaciones Agropecuarias INIA, Avenida Vicente Méndez 515, Chillán
3800062, Chile; [email protected] 5 Instituto Nacional de Investigación y Tecnología Agraria y Alimentaria (INIA), Apdo.
Correos 8111, Madrid 28080, Spain; [email protected]
* Correspondence: [email protected]; Tel.: +56-42-220-9774
Publicado en International Journal of Environmental Research and Public Healt, 2017,
Volumen 14, Número 11, paginas 1-15.
Abstract: There is a worldwide increase of heavy metal contamination in agricultural soils
caused mainly by human and industrial action, which leads to food contamination, such as in
maize. Cadmium (Cd) is a heavy metal often found in soils and it is ingested through food. It is
necessary to determine the bioabsorption, distribution, and accumulation levels in maize to
reduce or prevent food chain contamination. Cadmium absorption and accumulation in three
maize cultivars were evaluated in three agricultural environments in Chile by increasing CdCl2
rates (0, 1, and 2 mg·kg-1
). Evaluation included Cd accumulation and distribution in different
plant tissues, bioaccumulation factor (BAF), bioconcentration factor (BCF), translocation factor
(TF), and tolerance index (TI). Cadmium whole-plant uptake was only affected by the CdCl2
rate; the highest uptake was obtained with 2 mg·kg-1
CdCl2 (34.4 g·ha-1
) (P < 0.05). Cadmium
distribution in the maize plant usually exhibited the highest accumulation in the straw (P <
0.05), independently of the environment, Cd rate, and evaluated cultivar. Given the results for
38
TF (TF > 2) and BAF (BAF > 1), the Los Tilos and Chillán environments were classified as
having a high capacity to contaminate the food chain for all evaluated cultivars.
Keywords: bioabsorption; heavy metals; translocation factor, tolerance index, food chain
contamination.
1. Introduction
There is a worldwide increase of heavy metal contamination in agricultural soils caused
mainly by human and industrial action, which has generated concern for food contamination by
these metals [1]. Heavy metals present in soils cannot be degraded; cadmium (Cd) is one of these
heavy metals that is usually found in different soil types [2]. Cadmium is not an essential plant
nutrient; however, this metal can be absorbed in greater amounts than other elements without any
adverse effects to growth [3]. It interacts with the metabolism of other essential metals, such as
calcium, zinc, and iron [4-6] and can be bioaccumulated and/or biotransformed by plants [3].
Cadmium intake through the food chain can become toxic for living organisms and is
carcinogenic for human beings [7]. Cadmium can be absorbed in human beings through food,
especially leaves and grains; it accumulates in the liver and kidneys for more than 30 years and
causes health problems [7,8]. Toxicity of this metal involves kidney and skeletal organs and is
largely the result of interactions between Cd and essential metals, such as calcium [8]). A daily
intake of 1 mg·kg-1
body weight is considered toxic for human beings [9]. On the other hand, the
soil Cd concentration considered to pose a risk is 1.0 mg·kg-1
[10,11].
Crops and cultivars usually differ in their capacity to absorb, accumulate, and tolerate Cd
[12,13]. Among the agricultural crops that are important in the human diet, the main species that
absorb and translocate Cd to the grain are hard wheat (Triticum turgidum L. var. durum), maize
(Zea mays L.), wheat (Triticum aestivum L.), oat (Avena sativa L.), and rice (Oryza sativa L.).
These have exhibited Cd concentrations over the maximum permitted for human health [14-17].
The amount of Cd in the soil depends mainly on physical and chemical properties, such as
fertilization with phosphorus (P) and nitrogen (N), organic amendment applications, and
exposure to sources of contamination [1,12,18,19].
39
Among the important agricultural crops, more specifically cereals, maize is pointed out as
the second most important as for cultivated area worldwide. Given an increasing demand for
food, a larger land area accessible for agricultural use will be necessary in which the total
available Cd concentration is not over the critical 1 mg·kg-1
level [20,21]. At the same time, a
tendency to high Cd concentrations in the grain has been observed in new cereal crop cultivars
worldwide. According to Cd distribution in the different plant organs, more than 40% of Cd is
absorbed and translocated to the aerial part of the plant (grain and straw), and it could be directly
(grains) or indirectly (animals) ingested and negatively affect humans [22-24]. Therefore, soils
with higher Cd concentrations associated with the cultivation of cultivars with higher Cd
accumulation capacity in the aerial part will generate higher risk of ingesting this metal. To
reduce food chain contamination, the present study evaluated plant Cd absorption, distribution or
translocation, and accumulation in different maize cultivars cultivated in different environments
and with increasing soil Cd rate treatments.
2. Materials and Methods
2.1. Climatic and soil characteristics of each environment
Three field experiments were conducted during the 2013-2014 season in different
agricultural environments in Chile. The three environments and their characteristics were as
follows: La Serena (30º3’ S; 71º14’ W) has soil of alluvial-colluvial origin (Typic Haplocambids)
[25], an arid climate with a maritime influence, and had 40 mm precipitation concentrated during
the winter. Los Tilos (33º34’ S; 70º37’ W) has soil of alluvial origin (Haploxeroll) [25], a semi-
arid and temperate Mediterranean climate with hot and dry summers and cold winters, and had
163 mm precipitation. Chillán (36º31’ S; 71º54’ W) has soil of volcanic origin (Melanoxerand)
[25], temperate Mediterranean climate with hot and dry summers and cold and humid winters and
reached 672 mm precipitation concentrated during the winter and beginning of spring [26].
The physical and chemical properties of each soil are shown in Table 1. Soil samples were
collected at two depths (0-0.2 and 0.2-0.4 m) and the physical and chemical properties of each
soil analyzed at the start of the experiment are displayed in Table 1; analyses were performed
according to the methodology indicated by Sadzawka et al. [27]. Soil pH was measured in a ratio
of 1:2.5 soil:water solution with a pH meter. Soil organic matter (OM) was measured by the
Walkley-Negro wet digestion method. Available soil N (NO3-N and NH4-N) was extracted with
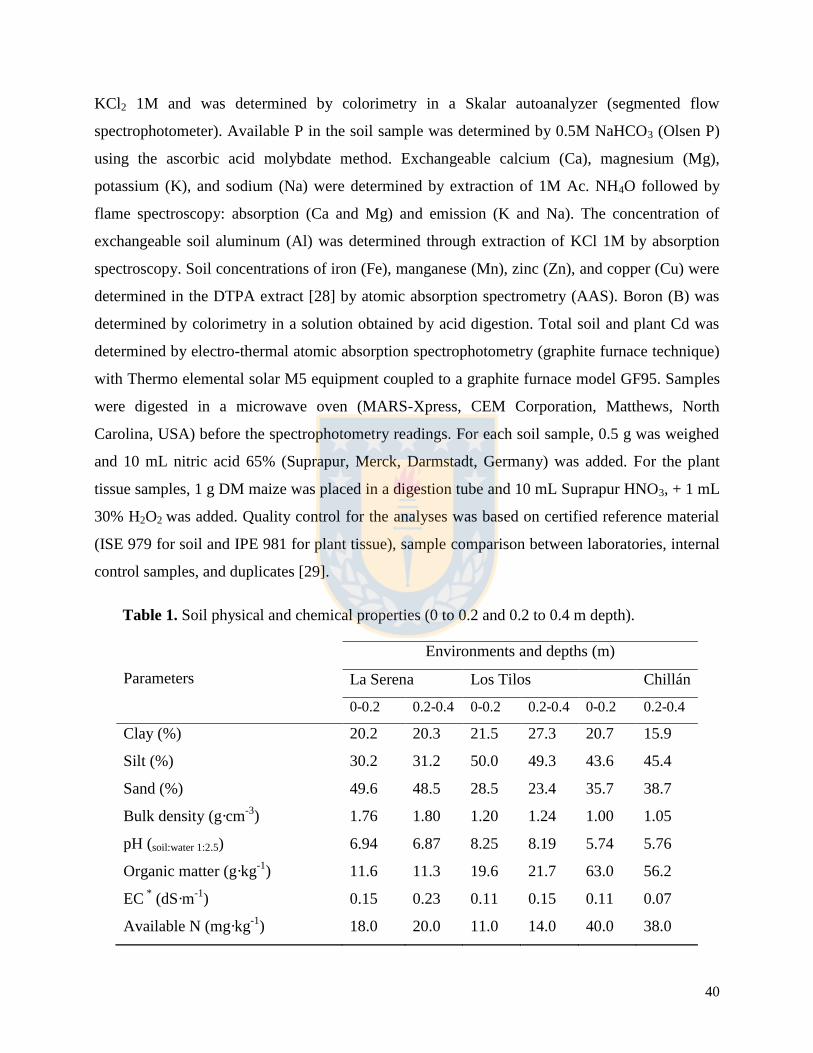
40
KCl2 1M and was determined by colorimetry in a Skalar autoanalyzer (segmented flow
spectrophotometer). Available P in the soil sample was determined by 0.5M NaHCO3 (Olsen P)
using the ascorbic acid molybdate method. Exchangeable calcium (Ca), magnesium (Mg),
potassium (K), and sodium (Na) were determined by extraction of 1M Ac. NH4O followed by
flame spectroscopy: absorption (Ca and Mg) and emission (K and Na). The concentration of
exchangeable soil aluminum (Al) was determined through extraction of KCl 1M by absorption
spectroscopy. Soil concentrations of iron (Fe), manganese (Mn), zinc (Zn), and copper (Cu) were
determined in the DTPA extract [28] by atomic absorption spectrometry (AAS). Boron (B) was
determined by colorimetry in a solution obtained by acid digestion. Total soil and plant Cd was
determined by electro-thermal atomic absorption spectrophotometry (graphite furnace technique)
with Thermo elemental solar M5 equipment coupled to a graphite furnace model GF95. Samples
were digested in a microwave oven (MARS-Xpress, CEM Corporation, Matthews, North
Carolina, USA) before the spectrophotometry readings. For each soil sample, 0.5 g was weighed
and 10 mL nitric acid 65% (Suprapur, Merck, Darmstadt, Germany) was added. For the plant
tissue samples, 1 g DM maize was placed in a digestion tube and 10 mL Suprapur HNO3, + 1 mL
30% H2O2 was added. Quality control for the analyses was based on certified reference material
(ISE 979 for soil and IPE 981 for plant tissue), sample comparison between laboratories, internal
control samples, and duplicates [29].
Table 1. Soil physical and chemical properties (0 to 0.2 and 0.2 to 0.4 m depth).
Parameters
Environments and depths (m)
La Serena Los Tilos Chillán
0-0.2 0.2-0.4 0-0.2 0.2-0.4 0-0.2 0.2-0.4
Clay (%) 20.2 20.3 21.5 27.3 20.7 15.9
Silt (%) 30.2 31.2 50.0 49.3 43.6 45.4
Sand (%) 49.6 48.5 28.5 23.4 35.7 38.7
Bulk density (g·cm-3
) 1.76 1.80 1.20 1.24 1.00 1.05
pH (soil:water 1:2.5) 6.94 6.87 8.25 8.19 5.74 5.76
Organic matter (g·kg-1
) 11.6 11.3 19.6 21.7 63.0 56.2
EC * (dS·m
-1) 0.15 0.23 0.11 0.15 0.11 0.07
Available N (mg·kg-1
) 18.0 20.0 11.0 14.0 40.0 38.0
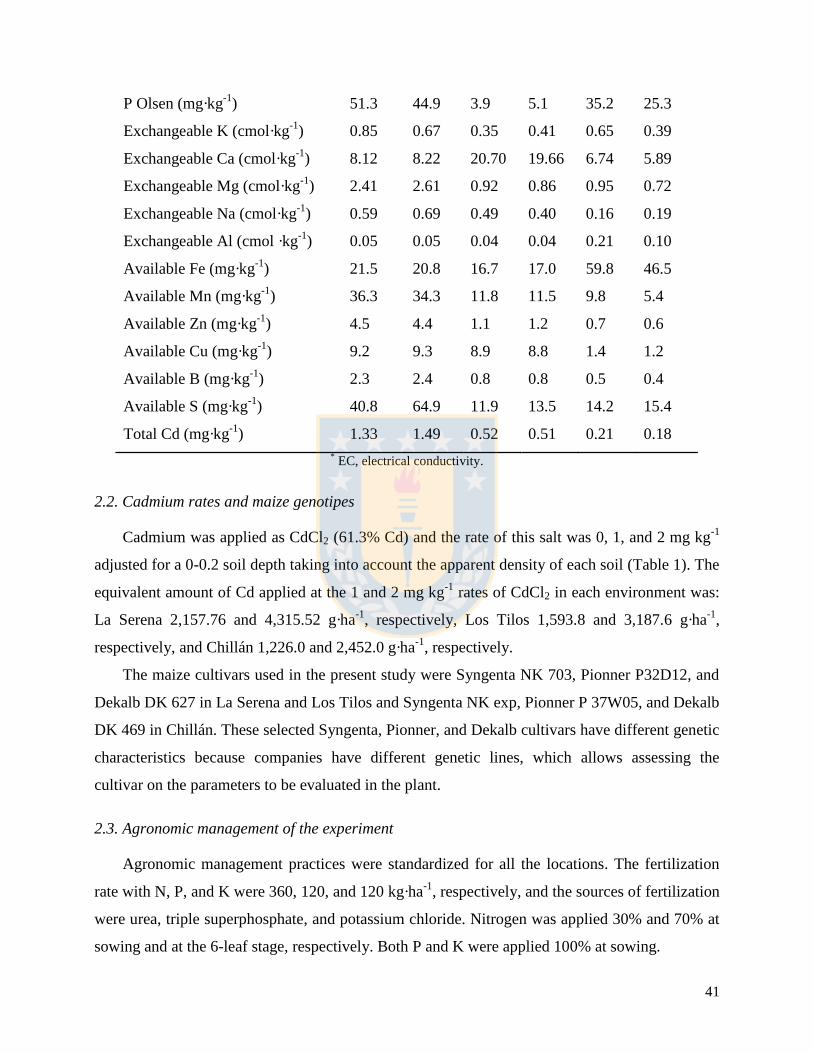
41
P Olsen (mg·kg-1
) 51.3 44.9 3.9 5.1 35.2 25.3
Exchangeable K (cmol·kg-1
) 0.85 0.67 0.35 0.41 0.65 0.39
Exchangeable Ca (cmol·kg-1
) 8.12 8.22 20.70 19.66 6.74 5.89
Exchangeable Mg (cmol·kg-1
) 2.41 2.61 0.92 0.86 0.95 0.72
Exchangeable Na (cmol·kg-1
) 0.59 0.69 0.49 0.40 0.16 0.19
Exchangeable Al (cmol ·kg-1
) 0.05 0.05 0.04 0.04 0.21 0.10
Available Fe (mg·kg-1
) 21.5 20.8 16.7 17.0 59.8 46.5
Available Mn (mg·kg-1
) 36.3 34.3 11.8 11.5 9.8 5.4
Available Zn (mg·kg-1
) 4.5 4.4 1.1 1.2 0.7 0.6
Available Cu (mg·kg-1
) 9.2 9.3 8.9 8.8 1.4 1.2
Available B (mg·kg-1
) 2.3 2.4 0.8 0.8 0.5 0.4
Available S (mg·kg-1
) 40.8 64.9 11.9 13.5 14.2 15.4
Total Cd (mg·kg-1
) 1.33 1.49 0.52 0.51 0.21 0.18
* EC, electrical conductivity.
2.2. Cadmium rates and maize genotipes
Cadmium was applied as CdCl2 (61.3% Cd) and the rate of this salt was 0, 1, and 2 mg kg-1
adjusted for a 0-0.2 soil depth taking into account the apparent density of each soil (Table 1). The
equivalent amount of Cd applied at the 1 and 2 mg kg-1
rates of CdCl2 in each environment was:
La Serena 2,157.76 and 4,315.52 g·ha-1
, respectively, Los Tilos 1,593.8 and 3,187.6 g·ha-1
,
respectively, and Chillán 1,226.0 and 2,452.0 g·ha-1
, respectively.
The maize cultivars used in the present study were Syngenta NK 703, Pionner P32D12, and
Dekalb DK 627 in La Serena and Los Tilos and Syngenta NK exp, Pionner P 37W05, and Dekalb
DK 469 in Chillán. These selected Syngenta, Pionner, and Dekalb cultivars have different genetic
characteristics because companies have different genetic lines, which allows assessing the
cultivar on the parameters to be evaluated in the plant.
2.3. Agronomic management of the experiment
Agronomic management practices were standardized for all the locations. The fertilization
rate with N, P, and K were 360, 120, and 120 kg·ha-1
, respectively, and the sources of fertilization
were urea, triple superphosphate, and potassium chloride. Nitrogen was applied 30% and 70% at
sowing and at the 6-leaf stage, respectively. Both P and K were applied 100% at sowing.
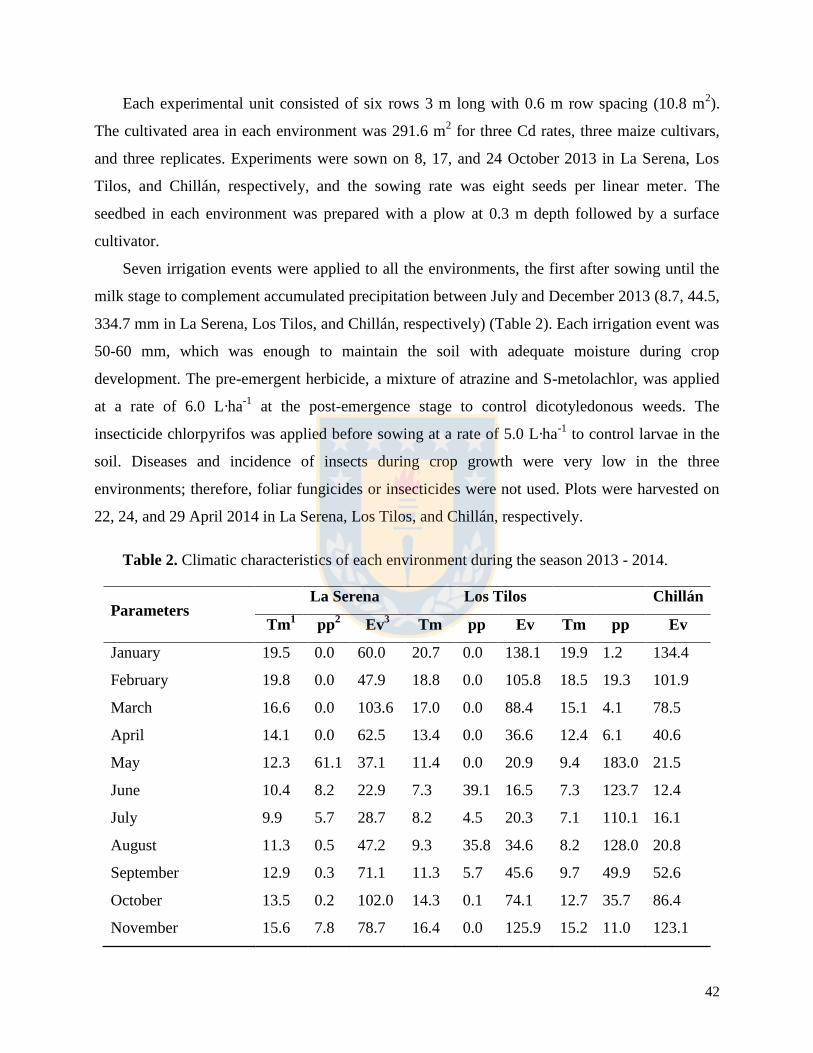
42
Each experimental unit consisted of six rows 3 m long with 0.6 m row spacing (10.8 m2).
The cultivated area in each environment was 291.6 m2 for three Cd rates, three maize cultivars,
and three replicates. Experiments were sown on 8, 17, and 24 October 2013 in La Serena, Los
Tilos, and Chillán, respectively, and the sowing rate was eight seeds per linear meter. The
seedbed in each environment was prepared with a plow at 0.3 m depth followed by a surface
cultivator.
Seven irrigation events were applied to all the environments, the first after sowing until the
milk stage to complement accumulated precipitation between July and December 2013 (8.7, 44.5,
334.7 mm in La Serena, Los Tilos, and Chillán, respectively) (Table 2). Each irrigation event was
50-60 mm, which was enough to maintain the soil with adequate moisture during crop
development. The pre-emergent herbicide, a mixture of atrazine and S-metolachlor, was applied
at a rate of 6.0 L·ha-1
at the post-emergence stage to control dicotyledonous weeds. The
insecticide chlorpyrifos was applied before sowing at a rate of 5.0 L·ha-1
to control larvae in the
soil. Diseases and incidence of insects during crop growth were very low in the three
environments; therefore, foliar fungicides or insecticides were not used. Plots were harvested on
22, 24, and 29 April 2014 in La Serena, Los Tilos, and Chillán, respectively.
Table 2. Climatic characteristics of each environment during the season 2013 - 2014.
Parameters La Serena Los Tilos Chillán
Tm1 pp
2 Ev
3 Tm pp Ev Tm pp Ev
January 19.5 0.0 60.0 20.7 0.0 138.1 19.9 1.2 134.4
February 19.8 0.0 47.9 18.8 0.0 105.8 18.5 19.3 101.9
March 16.6 0.0 103.6 17.0 0.0 88.4 15.1 4.1 78.5
April 14.1 0.0 62.5 13.4 0.0 36.6 12.4 6.1 40.6
May 12.3 61.1 37.1 11.4 0.0 20.9 9.4 183.0 21.5
June 10.4 8.2 22.9 7.3 39.1 16.5 7.3 123.7 12.4
July 9.9 5.7 28.7 8.2 4.5 20.3 7.1 110.1 16.1
August 11.3 0.5 47.2 9.3 35.8 34.6 8.2 128.0 20.8
September 12.9 0.3 71.1 11.3 5.7 45.6 9.7 49.9 52.6
October 13.5 0.2 102.0 14.3 0.1 74.1 12.7 35.7 86.4
November 15.6 7.8 78.7 16.4 0.0 125.9 15.2 11.0 123.1
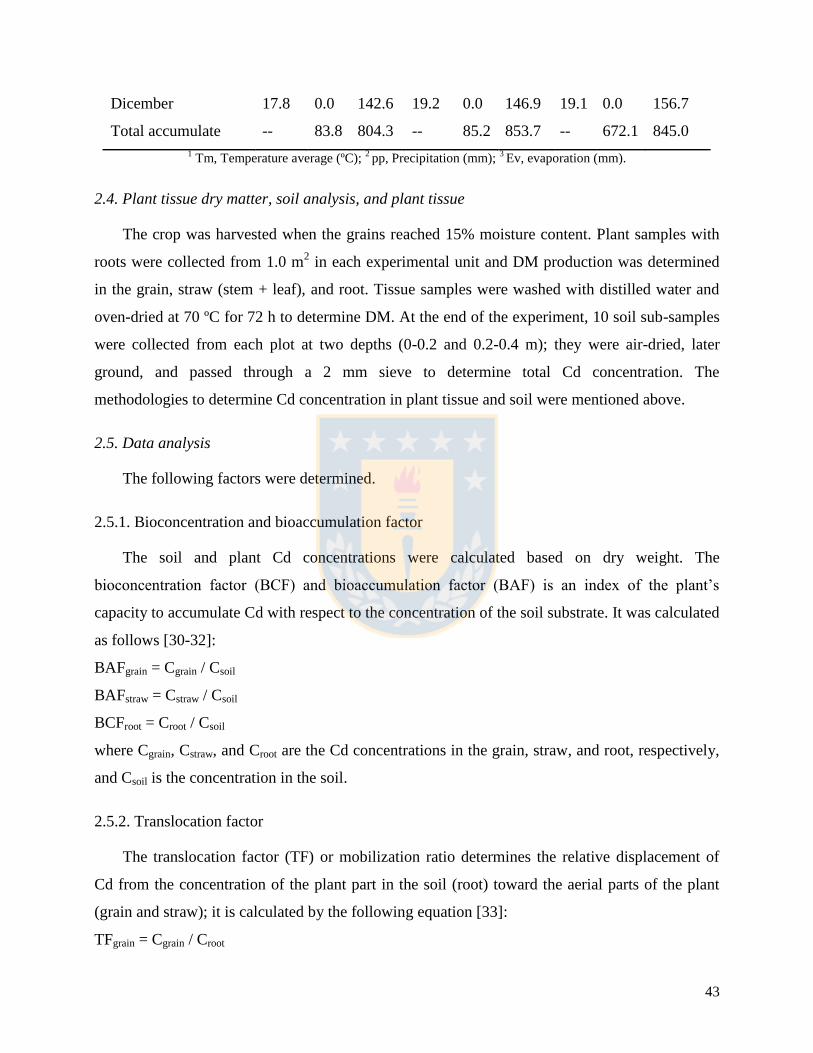
43
Dicember 17.8 0.0 142.6 19.2 0.0 146.9 19.1 0.0 156.7
Total accumulate -- 83.8 804.3 -- 85.2 853.7 -- 672.1 845.0
1 Tm, Temperature average (ºC);
2 pp, Precipitation (mm);
3 Ev, evaporation (mm).
2.4. Plant tissue dry matter, soil analysis, and plant tissue
The crop was harvested when the grains reached 15% moisture content. Plant samples with
roots were collected from 1.0 m2 in each experimental unit and DM production was determined
in the grain, straw (stem + leaf), and root. Tissue samples were washed with distilled water and
oven-dried at 70 ºC for 72 h to determine DM. At the end of the experiment, 10 soil sub-samples
were collected from each plot at two depths (0-0.2 and 0.2-0.4 m); they were air-dried, later
ground, and passed through a 2 mm sieve to determine total Cd concentration. The
methodologies to determine Cd concentration in plant tissue and soil were mentioned above.
2.5. Data analysis
The following factors were determined.
2.5.1. Bioconcentration and bioaccumulation factor
The soil and plant Cd concentrations were calculated based on dry weight. The
bioconcentration factor (BCF) and bioaccumulation factor (BAF) is an index of the plant’s
capacity to accumulate Cd with respect to the concentration of the soil substrate. It was calculated
as follows [30-32]:
BAFgrain = Cgrain / Csoil
BAFstraw = Cstraw / Csoil
BCFroot = Croot / Csoil
where Cgrain, Cstraw, and Croot are the Cd concentrations in the grain, straw, and root, respectively,
and Csoil is the concentration in the soil.
2.5.2. Translocation factor
The translocation factor (TF) or mobilization ratio determines the relative displacement of
Cd from the concentration of the plant part in the soil (root) toward the aerial parts of the plant
(grain and straw); it is calculated by the following equation [33]:
TFgrain = Cgrain / Croot
44
TFstraw = Cstraw / Croot
where Cgrain, Cstraw, and Croot are the Cd concentrations in the grain, straw, and root, respectively.
2.5.3. Tolerance index
The tolerance index (TI), or the tolerance of plants to Cd can be measured as the variation of
the biomass response of the plant part (grain, straw, or root) by the toxicity of Cd compared with
the biomass of the treatment with no added Cd. This index was determined by the following
equation [34]:
TI = MSCd treatment / MScontrol
where MSCd treatment and MScontrol are the DM of each treatment with added Cd and DM of control
treatment, respectively.
2.6. Experimental design and statistical analysis
The experimental design was a split sub-sub-plot where the main plot was the environment
(3), the split plots were the Cd rates (3), and the split sub-sub-plots were the maize cultivars (3)
with three replicates. Results were analyzed by ANOVA and Tukey’s test (P = 0.05) by the SAS
PROC MIXED Model procedure (SAS Institute, Cary, North Carolina, USA) and considering the
locations as random effects. For the significant interactions, contrast analysis was used to
compare the treatment effect separately.
3. Results
The environment and its interaction with the cultivar significantly affected DM production in
the straw (Table 3). Dry matter production in the straw fluctuated between 7.0 and 14.7 Mg·ha-1
(Table 4). The highest value in all the cultivars was attained in La Serena (P < 0.05) then Chillán
and Los Tilos; there were no significant differences between them (P > 0.05) and values were
14.7, 9.3, and 7.0 Mg·ha-1
, respectively (Table 4). Comparing DM production in the straw
between cultivars, and as a mean of the environments and Cd rates, higher production was
observed in Syngenta with 10.9 Mg·ha-1
, followed by Pioneer and Dekalb with values of 9.0 and
9.7 Mg·ha-1
, respectively, and no differences between them (P > 0.05) (Table 4).
Table 3. Significance levels of the evaluated parameters for the experiments maked in
three corn cultivars fertilized with three CdCl2 rates on three environments.
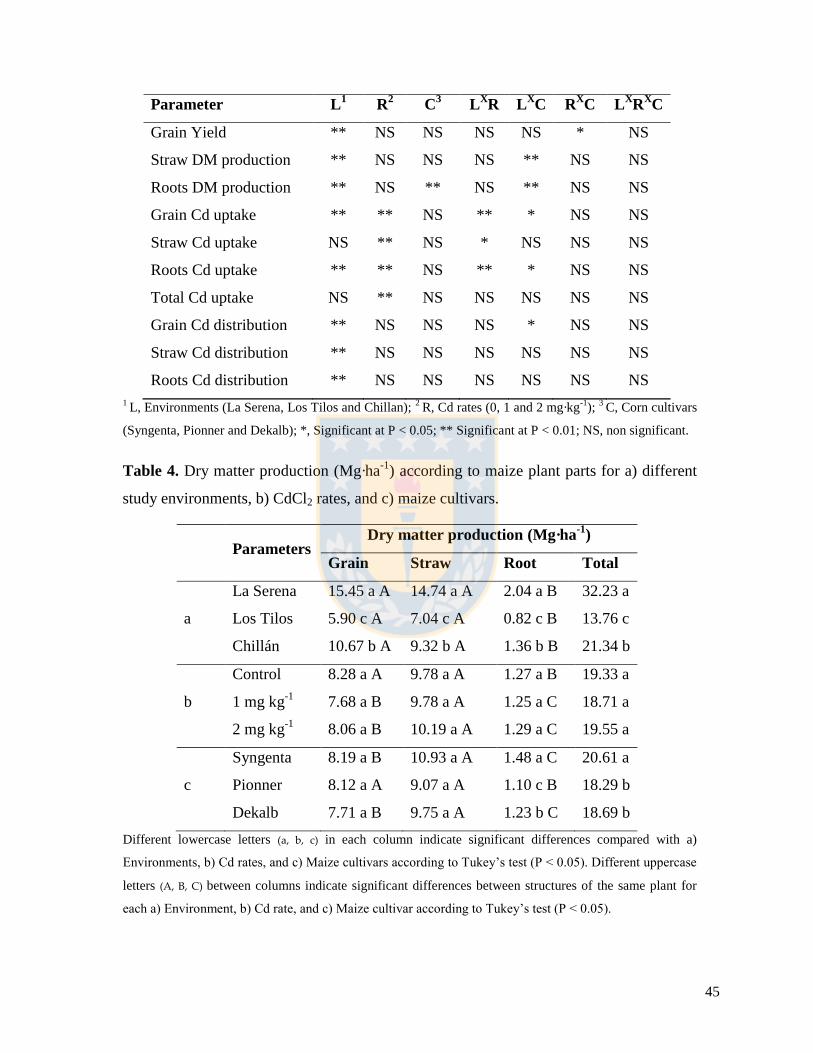
45
Parameter L1 R
2 C
3 L
XR L
XC R
XC L
XR
XC
Grain Yield ** NS NS NS NS * NS
Straw DM production ** NS NS NS ** NS NS
Roots DM production ** NS ** NS ** NS NS
Grain Cd uptake ** ** NS ** * NS NS
Straw Cd uptake NS ** NS * NS NS NS
Roots Cd uptake ** ** NS ** * NS NS
Total Cd uptake NS ** NS NS NS NS NS
Grain Cd distribution ** NS NS NS * NS NS
Straw Cd distribution ** NS NS NS NS NS NS
Roots Cd distribution ** NS NS NS NS NS NS
1 L, Environments (La Serena, Los Tilos and Chillan);
2 R, Cd rates (0, 1 and 2 mg·kg
-1);
3 C, Corn cultivars
(Syngenta, Pionner and Dekalb); *, Significant at P < 0.05; ** Significant at P < 0.01; NS, non significant.
Table 4. Dry matter production (Mg·ha-1
) according to maize plant parts for a) different
study environments, b) CdCl2 rates, and c) maize cultivars.
Parameters
Dry matter production (Mg·ha-1
)
Grain Straw Root Total
La Serena 15.45 a A 14.74 a A 2.04 a B 32.23 a
a Los Tilos 5.90 c A 7.04 c A 0.82 c B 13.76 c
Chillán 10.67 b A 9.32 b A 1.36 b B 21.34 b
Control 8.28 a A 9.78 a A 1.27 a B 19.33 a
b 1 mg kg-1
7.68 a B 9.78 a A 1.25 a C 18.71 a
2 mg kg-1
8.06 a B 10.19 a A 1.29 a C 19.55 a
Syngenta 8.19 a B 10.93 a A 1.48 a C 20.61 a
c Pionner 8.12 a A 9.07 a A 1.10 c B 18.29 b
Dekalb 7.71 a B 9.75 a A 1.23 b C 18.69 b
Different lowercase letters (a, b, c) in each column indicate significant differences compared with a)
Environments, b) Cd rates, and c) Maize cultivars according to Tukey’s test (P < 0.05). Different uppercase
letters (A, B, C) between columns indicate significant differences between structures of the same plant for
each a) Environment, b) Cd rate, and c) Maize cultivar according to Tukey’s test (P < 0.05).
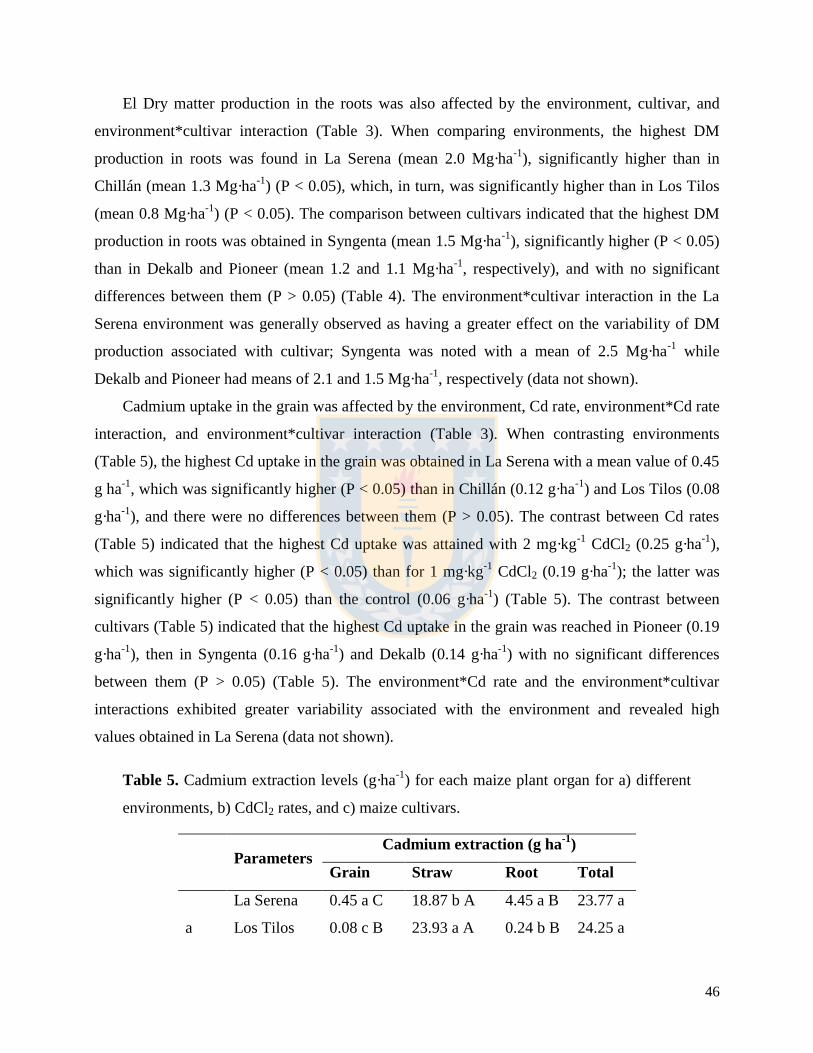
46
El Dry matter production in the roots was also affected by the environment, cultivar, and
environment*cultivar interaction (Table 3). When comparing environments, the highest DM
production in roots was found in La Serena (mean 2.0 Mg·ha-1
), significantly higher than in
Chillán (mean 1.3 Mg·ha-1
) (P < 0.05), which, in turn, was significantly higher than in Los Tilos
(mean 0.8 Mg·ha-1
) (P < 0.05). The comparison between cultivars indicated that the highest DM
production in roots was obtained in Syngenta (mean 1.5 Mg·ha-1
), significantly higher (P < 0.05)
than in Dekalb and Pioneer (mean 1.2 and 1.1 Mg·ha-1
, respectively), and with no significant
differences between them (P > 0.05) (Table 4). The environment*cultivar interaction in the La
Serena environment was generally observed as having a greater effect on the variability of DM
production associated with cultivar; Syngenta was noted with a mean of 2.5 Mg·ha-1
while
Dekalb and Pioneer had means of 2.1 and 1.5 Mg·ha-1
, respectively (data not shown).
Cadmium uptake in the grain was affected by the environment, Cd rate, environment*Cd rate
interaction, and environment*cultivar interaction (Table 3). When contrasting environments
(Table 5), the highest Cd uptake in the grain was obtained in La Serena with a mean value of 0.45
g ha-1
, which was significantly higher (P < 0.05) than in Chillán (0.12 g·ha-1
) and Los Tilos (0.08
g·ha-1
), and there were no differences between them (P > 0.05). The contrast between Cd rates
(Table 5) indicated that the highest Cd uptake was attained with 2 mg·kg-1
CdCl2 (0.25 g·ha-1
),
which was significantly higher (P < 0.05) than for 1 mg·kg-1
CdCl2 (0.19 g·ha-1
); the latter was
significantly higher (P < 0.05) than the control (0.06 g·ha-1
) (Table 5). The contrast between
cultivars (Table 5) indicated that the highest Cd uptake in the grain was reached in Pioneer (0.19
g·ha-1
), then in Syngenta (0.16 g·ha-1
) and Dekalb (0.14 g·ha-1
) with no significant differences
between them (P > 0.05) (Table 5). The environment*Cd rate and the environment*cultivar
interactions exhibited greater variability associated with the environment and revealed high
values obtained in La Serena (data not shown).
Table 5. Cadmium extraction levels (g·ha-1
) for each maize plant organ for a) different
environments, b) CdCl2 rates, and c) maize cultivars.
Parameters
Cadmium extraction (g ha-1
)
Grain Straw Root Total
La Serena 0.45 a C 18.87 b A 4.45 a B 23.77 a
a Los Tilos 0.08 c B 23.93 a A 0.24 b B 24.25 a
47
Chillán 0.12 bc B 18.54 b A 0.61 b B 19.27 b
Control 0.06 b C 2.24 c A 0.57 c B 2.87 c
b 1 mg kg-1
0.19 a C 16.01 b A 1.53 b B 17.72 b
2 mg kg-1
0.25 a C 32.14 a C 2.06 a B 34.44 a
Syngenta 0.16 a C 14.80 b A 1.43 a B 16.39 b
c Pionner 0.19 a C 15.89 b A 1.07 a B 17.15 b
Dekalb 0.14 a C 19.70 a A 1.66 a B 21.50 a
Different lowercase letters (a, b, c) in each column indicate significant differences compared with a)
Environments, b) Cd rates, and c) Maize cultivars according to Tukey’s test (P < 0.05). Different uppercase
letters (A, B, C) between columns indicate significant differences between structures of the same plant for
each a) Environment, b) Cd rate, and c) Maize cultivar according to Tukey’s test (P < 0.05).
Cadmium uptake in the straw was only affected by the Cd rate (Table 5). When contrasting
the CdCl2 rates (Table 5), the highest Cd uptake in the straw was attained in Los Tilos with a
mean of 23.9 g·ha-1
(P < 0.05), while La Serena and Chillán had 18.8 and 18.5 g·ha-1
,
respectively, and with no significant difference between them (P > 0.05).
As for Cd uptake in the roots, there was an effect of the environment and Cd rate with an
interaction between both sources of variation and between environment*cultivar (Table 5). The
contrast between environments (Table 5) indicated that the highest Cd uptake in the roots was
obtained in La Serena with a mean of 4.5 g·ha-1
, which was significantly higher than in Chillán
and Los Tilos where uptakes were 0.6 and 0.2 g·ha-1
, respectively; there was no significant
difference between them (P > 0.05). When contrasting the Cd rate (Table 5), higher Cd uptake in
the roots was observed when using 2 and 1 mg·kg-1
CdCl2; however, they were both similar (P >
0.05) and values were 2.1 and 1.5 g·ha-1
, respectively. They significantly surpassed the control (P
< 0.05), which had an uptake of 0.6 g·ha-1
.
Whole plant Cd uptake was only affected by the Cd rate (Table 3; Figures 1a, b, c). The
highest whole plant Cd uptake was attained with 2 mg·kg-1
CdCl2 (34.4 g·ha-1
), which was
significantly higher (P < 0.05) than with 1 mg·kg-1
CdCl2 (17.7 g·ha-1
); the latter was significantly
higher than in the control without Cd (2.9 g·ha-1
) (P < 0.05) (Figure 1b). Although the cultivars
did not show any differences in whole plant Cd extraction (Table 3, Figure 1c), these values were
21.5, 17.1, and 16.4 g·ha-1
in Dekalb, Pioneer, and Syngenta, respectively. Cadmium distribution
in the maize plant (Table 3; Figures 1a, b, c) revealed that the environment was affected by the
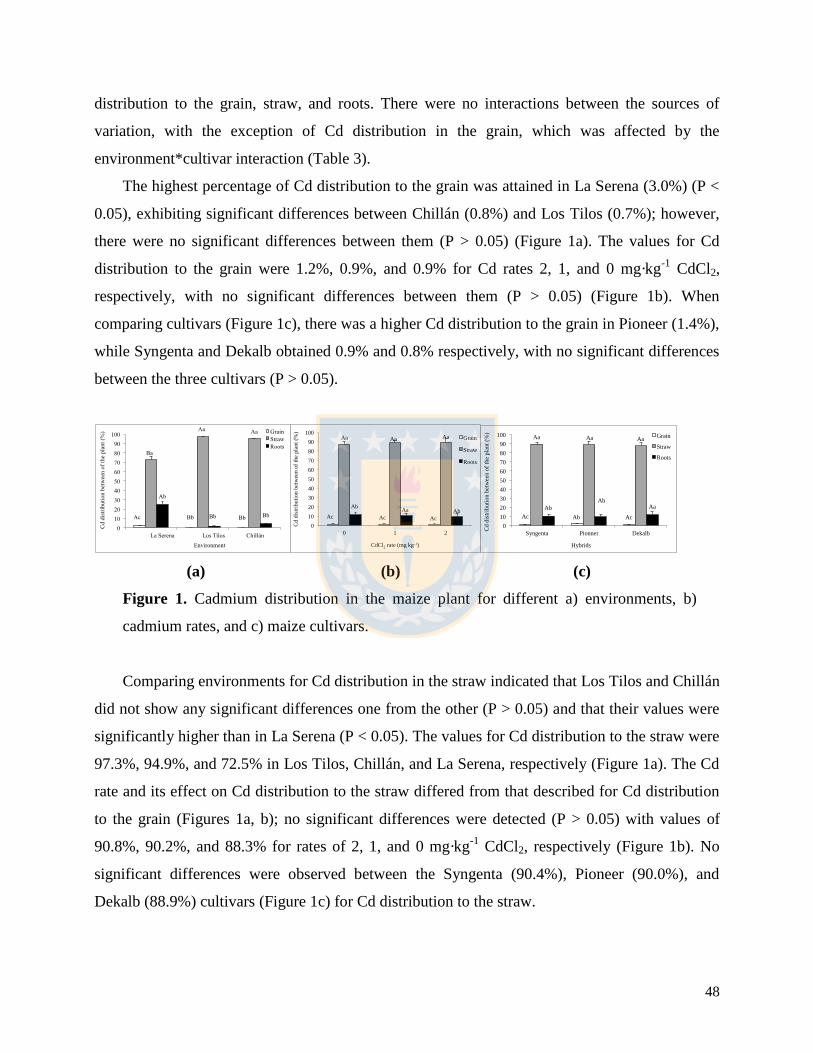
48
distribution to the grain, straw, and roots. There were no interactions between the sources of
variation, with the exception of Cd distribution in the grain, which was affected by the
environment*cultivar interaction (Table 3).
The highest percentage of Cd distribution to the grain was attained in La Serena (3.0%) (P <
0.05), exhibiting significant differences between Chillán (0.8%) and Los Tilos (0.7%); however,
there were no significant differences between them (P > 0.05) (Figure 1a). The values for Cd
distribution to the grain were 1.2%, 0.9%, and 0.9% for Cd rates 2, 1, and 0 mg·kg-1
CdCl2,
respectively, with no significant differences between them (P > 0.05) (Figure 1b). When
comparing cultivars (Figure 1c), there was a higher Cd distribution to the grain in Pioneer (1.4%),
while Syngenta and Dekalb obtained 0.9% and 0.8% respectively, with no significant differences
between the three cultivars (P > 0.05).
0
10
20
30
40
50
60
70
80
90
100
0 1 2
Cd
dis
trib
uti
on b
etw
een o
f th
e pla
nt
(%)
CdCl2 rate (mg kg-1)
Grain
Straw
Roots
Ac Ac Ac
Aa Aa Aa
Aa Ab Ab
0
10
20
30
40
50
60
70
80
90
100
Syngenta Pionner Dekalb
Cd d
istr
ibuti
on
bet
wee
n o
f th
e p
lan
t (%
)
Hybrids
Grain
Straw
Roots
Ac Ab Ac
Aa Aa Aa
Aa Ab
Ab
(a) (b) (c)
Figure 1. Cadmium distribution in the maize plant for different a) environments, b)
cadmium rates, and c) maize cultivars.
Comparing environments for Cd distribution in the straw indicated that Los Tilos and Chillán
did not show any significant differences one from the other (P > 0.05) and that their values were
significantly higher than in La Serena (P < 0.05). The values for Cd distribution to the straw were
97.3%, 94.9%, and 72.5% in Los Tilos, Chillán, and La Serena, respectively (Figure 1a). The Cd
rate and its effect on Cd distribution to the straw differed from that described for Cd distribution
to the grain (Figures 1a, b); no significant differences were detected (P > 0.05) with values of
90.8%, 90.2%, and 88.3% for rates of 2, 1, and 0 mg·kg-1
CdCl2, respectively (Figure 1b). No
significant differences were observed between the Syngenta (90.4%), Pioneer (90.0%), and
Dekalb (88.9%) cultivars (Figure 1c) for Cd distribution to the straw.
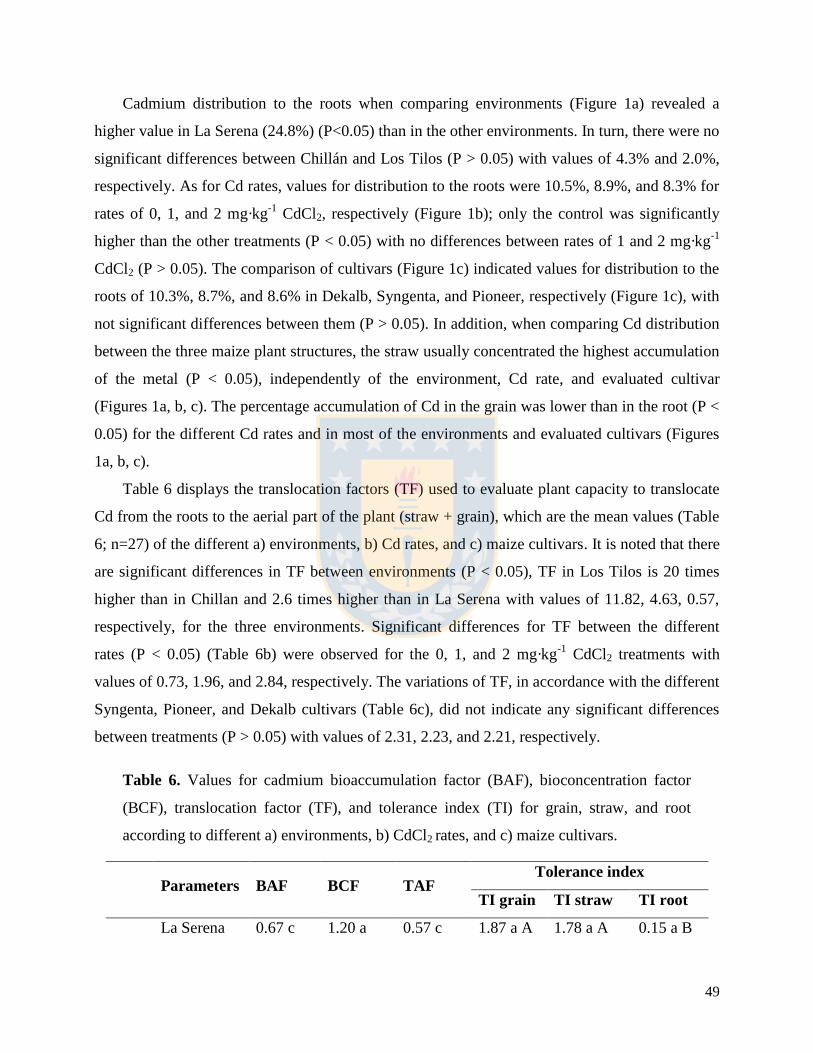
49
Cadmium distribution to the roots when comparing environments (Figure 1a) revealed a
higher value in La Serena (24.8%) (P<0.05) than in the other environments. In turn, there were no
significant differences between Chillán and Los Tilos (P > 0.05) with values of 4.3% and 2.0%,
respectively. As for Cd rates, values for distribution to the roots were 10.5%, 8.9%, and 8.3% for
rates of 0, 1, and 2 mg·kg-1
CdCl2, respectively (Figure 1b); only the control was significantly
higher than the other treatments (P < 0.05) with no differences between rates of 1 and 2 mg·kg-1
CdCl2 (P > 0.05). The comparison of cultivars (Figure 1c) indicated values for distribution to the
roots of 10.3%, 8.7%, and 8.6% in Dekalb, Syngenta, and Pioneer, respectively (Figure 1c), with
not significant differences between them (P > 0.05). In addition, when comparing Cd distribution
between the three maize plant structures, the straw usually concentrated the highest accumulation
of the metal (P < 0.05), independently of the environment, Cd rate, and evaluated cultivar
(Figures 1a, b, c). The percentage accumulation of Cd in the grain was lower than in the root (P <
0.05) for the different Cd rates and in most of the environments and evaluated cultivars (Figures
1a, b, c).
Table 6 displays the translocation factors (TF) used to evaluate plant capacity to translocate
Cd from the roots to the aerial part of the plant (straw + grain), which are the mean values (Table
6; n=27) of the different a) environments, b) Cd rates, and c) maize cultivars. It is noted that there
are significant differences in TF between environments (P < 0.05), TF in Los Tilos is 20 times
higher than in Chillan and 2.6 times higher than in La Serena with values of 11.82, 4.63, 0.57,
respectively, for the three environments. Significant differences for TF between the different
rates (P < 0.05) (Table 6b) were observed for the 0, 1, and 2 mg·kg-1
CdCl2 treatments with
values of 0.73, 1.96, and 2.84, respectively. The variations of TF, in accordance with the different
Syngenta, Pioneer, and Dekalb cultivars (Table 6c), did not indicate any significant differences
between treatments (P > 0.05) with values of 2.31, 2.23, and 2.21, respectively.
Table 6. Values for cadmium bioaccumulation factor (BAF), bioconcentration factor
(BCF), translocation factor (TF), and tolerance index (TI) for grain, straw, and root
according to different a) environments, b) CdCl2 rates, and c) maize cultivars.
Parameters BAF BCF TAF Tolerance index
TI grain TI straw TI root
La Serena 0.67 c 1.20 a 0.57 c 1.87 a A 1.78 a A 0.15 a B
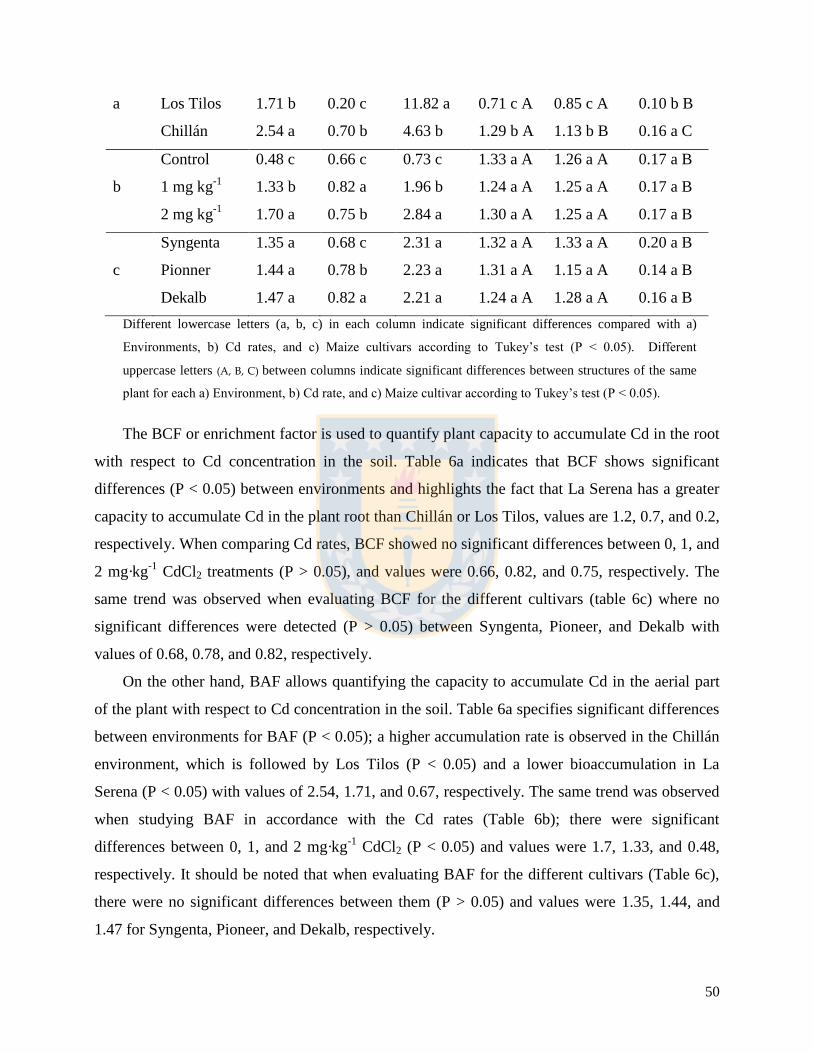
50
a Los Tilos 1.71 b 0.20 c 11.82 a 0.71 c A 0.85 c A 0.10 b B
Chillán 2.54 a 0.70 b 4.63 b 1.29 b A 1.13 b B 0.16 a C
Control 0.48 c 0.66 c 0.73 c 1.33 a A 1.26 a A 0.17 a B
b 1 mg kg-1
1.33 b 0.82 a 1.96 b 1.24 a A 1.25 a A 0.17 a B
2 mg kg-1
1.70 a 0.75 b 2.84 a 1.30 a A 1.25 a A 0.17 a B
Syngenta 1.35 a 0.68 c 2.31 a 1.32 a A 1.33 a A 0.20 a B
c Pionner 1.44 a 0.78 b 2.23 a 1.31 a A 1.15 a A 0.14 a B
Dekalb 1.47 a 0.82 a 2.21 a 1.24 a A 1.28 a A 0.16 a B
Different lowercase letters (a, b, c) in each column indicate significant differences compared with a)
Environments, b) Cd rates, and c) Maize cultivars according to Tukey’s test (P < 0.05). Different
uppercase letters (A, B, C) between columns indicate significant differences between structures of the same
plant for each a) Environment, b) Cd rate, and c) Maize cultivar according to Tukey’s test (P < 0.05).
The BCF or enrichment factor is used to quantify plant capacity to accumulate Cd in the root
with respect to Cd concentration in the soil. Table 6a indicates that BCF shows significant
differences (P < 0.05) between environments and highlights the fact that La Serena has a greater
capacity to accumulate Cd in the plant root than Chillán or Los Tilos, values are 1.2, 0.7, and 0.2,
respectively. When comparing Cd rates, BCF showed no significant differences between 0, 1, and
2 mg·kg-1
CdCl2 treatments (P > 0.05), and values were 0.66, 0.82, and 0.75, respectively. The
same trend was observed when evaluating BCF for the different cultivars (table 6c) where no
significant differences were detected (P > 0.05) between Syngenta, Pioneer, and Dekalb with
values of 0.68, 0.78, and 0.82, respectively.
On the other hand, BAF allows quantifying the capacity to accumulate Cd in the aerial part
of the plant with respect to Cd concentration in the soil. Table 6a specifies significant differences
between environments for BAF (P < 0.05); a higher accumulation rate is observed in the Chillán
environment, which is followed by Los Tilos (P < 0.05) and a lower bioaccumulation in La
Serena (P < 0.05) with values of 2.54, 1.71, and 0.67, respectively. The same trend was observed
when studying BAF in accordance with the Cd rates (Table 6b); there were significant
differences between 0, 1, and 2 mg·kg-1
CdCl2 (P < 0.05) and values were 1.7, 1.33, and 0.48,
respectively. It should be noted that when evaluating BAF for the different cultivars (Table 6c),
there were no significant differences between them (P > 0.05) and values were 1.35, 1.44, and
1.47 for Syngenta, Pioneer, and Dekalb, respectively.
51
Root TI (Table 6a) exhibited no significant differences between the environments in La
Serena, Los Tilos, and Chillán and TI values were 0.15, 0.10, and 0.16, respectively (Table 6a) (P
> 0.05). Differences were neither observed for the different CdCl2 rates and values were 0.17,
0.17, and 0.17 for 0, 1, and 2 g·kg-1
CdCl2, respectively (Table 6b) (P > 0.05), nor for the three
cultivars with values of 0.20, 0.14, and 0.16 in Syngenta, Pioneer, and Dekalb, respectively
(Table 6c) (P > 0.05). However, when evaluating TI in the grain, there were significant
differences for both the environments and Cd rates (P < 0.05). When observing the environments,
Los Tilos had the lowest value (P < 0.05) and was surpassed by Chillán, whereas La Serena had
the highest value (P < 0.05). Values were 0.71, 1.29, and 1.87 in Los Tilos, Chillán, and La
Serena, respectively (Table 6a). No significant differences were detected between TI at the
different Cd rates (P >0 .05) and values were 1.33, 1.24, and 1.30 for 0, 1, and 2 mg·kg-1
CdCl2,
respectively (Table 6b). The same trend was observed for TI in the grain for the different
cultivars, no significant differences were observed (P > 0.05), and values were 1.32, 1.31, and
1.24 for Syngenta, Pioneer, and Dekalb, respectively (Table 6c). Finally, TI of the straw
exhibited the same trend as in the grain (Table 6a) with significant differences only between
environments (P < 0.05) where values were 1.78, 1.13, and 0.85 for La Serena, Chillán, and Los
Tilos, respectively (Table 6a). For the different CdCl2 rates (0, 1, and 2 mg·kg-1
), TI values in the
straw were 1.26, 1.25, and 1.25, respectively, and with no significant differences (P > 0.05)
(Table 6b). The same statistical effect was obtained when comparing the different cultivars (P >
0.05) which had values of 1.33, 1.15, and 1.28 for Syngenta, Pioneer, and Dekalb, respectively
(Table 6c).
4. Discussion
The production of DM in the grain, straw, and root was not affected by the degree of
anthropogenic contamination of the soil with Cd (1 and 2 mg·kg-1
CdCl2) nor by the different
evaluated cultivars (Table 4); this is corroborated by TI (TI > 1) (Table 6) and concurs with
Zhang et al. [34]. Other authors point out that soils contaminated with Cd exhibit decreased crop
development that can fluctuate between 55% and 80% [35]; however, soil Cd contamination
levels in that study were higher than those generated in the present study. Given that our results
were similar to those obtained by other authors under similar Cd concentration conditions applied
to the soil [13,36], it can be suggested that Cd concentrations achieved in the soil by applying
52
CdCl2 are below the danger threshold of 3.5 mg·kg-1
[13]. However, the environment
significantly affected DM production in Los Tilos (Table 4) for DM in the straw, grain, and root
(Table 4). The lack of heat accumulation during the development stage and higher than optimal
soil pH could be limiting factors for DM production, which concurs with other authors who point
out a significant correlation between DM production and degree-day accumulation [36]. At the
same time, the environment*cultivar interaction was affected by DM production, which
corroborates what was previously mentioned and the fact that the response to the environmental
factor is differentiating in accordance with the thermal and soil requirements of each cultivar
[13,37].
Although initial total soil Cd was higher in La Serena compared with Los Tilos and Chillán
(Table 1), this order was not maintained at the end of crop development (Table 2); this was
probably generated by crop Cd absorption (Tables 1, 5) [29]. For total plant Cd extraction, no
significant differences were observed between environments (Table 5), which concurs with
Putwattana et al. [21]. However, mean total Cd extraction between different environments, Cd
rates, and maize cultivars (22.4, 22.4, and 22.4, respectively) (Table 5) is higher than the mean
among cultivars with phytoextraction potential reported by Slycken et al. [38] (18.5 g Cd·ha-1
).
These extraction levels demonstrate that the maize crop could be used for Cd phytoextraction
[20,38] given that Cd extractions up to 42 g·ha-1
were reported in our experiment. On the other
hand, Cd distribution in the different plant parts was affected by the environment with higher Cd
absorption in the grain in La Serena (Table 5); this was 200% more than in Los Tilos, which in
turn was 50% higher than in Chillán. This is mainly because DM production was higher in La
Serena, which was pointed out by Trejo et al. [29]. These results concur with those obtained by
Sarwar et al. [39], who also stated that high soil Zn concentrations, such as those found in the
present study (Table 1), form Zn-phytochelatin complexes in the cell cytoplasm to substitute the
Cd-phytochelatin complexes. This leaves Cd free inside the root cells and results in increased Cd
translocation in the different plant parts, which was observed in the present study. However, low
Cd extraction in the maize grain (Table 5) showed values within the range cited by several
authors [13,40] with a mean Cd value of 0.18 g·ha-1
(mean of 27 values that considered three
environments, three Cd rates, and three cultivars). This is an indicator of normal translocation for
this species. Wahsha et al. [41] point out that Cd concentration in the maize grain was lower than
the detection limit of 0.002 mg·kg-1
, leading to low extraction levels for the maize grain, such as
53
observed in the present study. This could be due to several factors, for example, absorption and
translocation limitations generated in the root [13], which suggests that maize plants have more
efficient defense mechanisms than other crops to regulate Cd toxicity, including the accumulation
of this metal at root level [22]. Secondly, the available soil Zn concentration acts as an antagonist
for plant Cd absorption [37]. Finally, the low Cd concentration could be attributable to high
agronomic efficiency of nutrient use (kg of DM produced per kg of applied nutrient) obtained in
the present experiment (Table 5), and which usually implies a Cd dilution effect [24].
It can also be observed in Table 5 that for the environment, Cd rate, and cultivar, total Cd
extraction in the straw is always significantly higher than in the roots or grain. These results
concur with those reported by Liang et al. [42] and Stritsis et al. [43], who point out that Cd
concentrations in maize straw are higher than in the rest of the plant. The same trend was
observed in other crops, such as lettuce (Lactuca sativa) [44] and bread wheat (Triticum aestivum
L.) straw [1]. Zhang et al. [45] explain these results by indicating that high S and Zn
concentrations in the soil profile, also observed in the present study (Table 1), facilitate Cd
translocation from the root to the aerial part of the plant. As previously mentioned, this higher Cd
concentration in the straw indicates a higher translocation rate of this metal to the aerial part.
Liang et al. [42] reported that it could be influenced by a decrease in sap flow that generates an
increase of Cd concentration in the xylem when the crop is exposed to high Cd concentrations. It
should be noted that the main factor for the higher translocation rate to the aerial part of the plant
in the Los Tilos environment could be the high Ca levels in the soil profile associated with basic
pH levels (Table 1). Sarwar et al. [39] pointed out that this generates increased Cd availability
because it was substituted by Ca in the soil particles, thus increasing absorption by the plant and
its translocation. Given the fact that high Cd extractions in the maize plant straw expose animals
to this heavy metal and ultimately contaminate the food chain, which contributes in evaluating
Cd levels in these maize cultivars destined for animal feed. Cadmium absorption by the maize
plant is associated with the abovementioned factors and is benefited by high organic matter (OM)
levels [12]; these levels were observed in the different evaluated environments in the present
study and reached values close to 63 g·kg-1
in Chillán.
As expected, the Cd concentration in the aerial part of the plant was proportional to the Cd
concentration in the soil (Figure 1) where significant differences were noted in Cd extraction by
the plant between the control and the 1 and 2 mg·kg-1
rates with more than 50% and 100% (Table
54
5), respectively. This concurs with the literature [46,47], which states that when the CdCl2 rate
applied to the soil is higher, absorption rates of this heavy metal are higher. The same trend is
observed when evaluating extraction levels in the same plant parts (grain, straw, and root) (Table
5). As regards the studied maize cultivars, no effect on plant total Cd extraction was recorded and
no differences existed between cultivars in the same plant part (Table 5); these results concur
with Slycken et al [38], who conducted a study with maize and point out that the different
evaluated cultivars did not show any significant differences in Cd absorption.
Plant capacity to absorb soil contaminants can be expressed as BCF, which indicates the
relationship between the metal content in the plant tissue (root) and the soil [30,32,48]. Most of
the BCF results in the present study fluctuated between 0.2 and 0.82, which concurs with results
obtained by Usman and Mohamed [31], who pointed out that BCF values fluctuated between
0.38 and 0.9. In the different environment treatments, Cd rates, and cultivars, only the
environment in La Serena reached values above the mentioned range (1.2) (Table 6a). Different
authors mention that BCF values > 1 are high; this indicates that maize in the La Serena
environment, independently of the cultivars and the degree of anthropogenic soil contamination,
behaves as a plant with high Cd bioaccumulation efficiency at root level [48]. On the other hand,
low root BCF generally found in the de Los Tilos and Chillán environments can be explained by
the maize plant’s capacity to prevent Cd absorption and probably for the low soil Cd
bioavailability in accordance with previously analyzed factors [22,37]. Furthermore, the different
evaluated maize cultivars can be classified as excluding Cd because all the BCF values are < 1
[31,48].
However, phytoextraction capacity has been expressed as TF and is defined as the
relationship between the Cd concentration in the aerial part and the Cd concentration in the roots
[36]. Results for TF obtained in the present study (Table 6) do not coincide with TF values
recorded by other authors, who reveal that TF for different fertilization treatments, rotations, and
degrees of Cd contamination were < 0.5 [21,36]. Mean TF in the present study (3.26) is higher
than the results reported by Liu et al. [36], which could be mainly influenced by soil pH in that
study (pH between 8.31 and 9.06) and generate decreased Cd availability to the soil solution; this
differs from the pH in the present study that fluctuated between 5.74 and 8.25 (Table 1). The
observed TF values in the present study (TF > 1) (Table 6) concur with results mentioned by
other authors, who indicate TF values of 2.6 [33]. These results could classify these cultivars as
55
plants with high Cd translocation efficiency from the roots to the aerial part [32]. The TF values
obtained in Los Tilos (TF = 11.82) and BAF > 1 (Table 6) classify this environment as having the
highest capacity to contaminate the food chain [7]. Therefore, more studies need to be conducted
about heavy metal absorption and translocation to the aerial part of the crop in this environment,
mainly cultivars used as a food source for animals destined for human consumption. According
to values reported by Usman et al. [32], translocation factors for cultivars, Cd rates, and
environments in the present study exceeded the efficient plant classification limit of Cd
translocation from the root to the aerial part, with the exception of the La Serena environment and
the 0 mg·kg-1
Cd treatment rate where TF < 1. The three maize cultivars (Syngenta, Pioneer, and
Dekalb) exhibited high risk of contaminating the food chain with Cd because of the high TF
value (TF > 2) [32]. Based on these results, new maize cultivars should be made available or
production management strategies be evaluated for this crop to reduce translocation rates of this
metal to the aerial part of the plant, as well as more research to decrease both Cd absorption and
accumulation in different maize plant tissues destined for animal consumption.
5. Conclusions
According to the results of the present study, it can be concluded that dry matter production
is not affected by different degrees of cadmium (Cd) contamination generated in the soil of the
different evaluated environments. The highest Cd concentration and extraction levels in the
different evaluated maize cultivars were obtained in the aerial straw (stem + leaves),
independently of the environment, Cd rates, and maize cultivars.
Among the evaluated environments, the highest Cd concentration in the grain was observed
in La Serena, but in no case was it higher than the established limits. According to the
translocation factor (TF) (TF > 2) and bioaccumulation factor (BAF) (BAF > 1) values, the
environments in Los Tilos and Chillán are classified as having a high capacity to contaminate the
food chain for the evaluated cultivars and taking into account the degrees of Cd contamination
generated in the soil.
Acknowledgments: The present work benefited from the FONDECYT Project No. 1120992
granted by the National Commission for Scientific and Technological Research of the Chilean
Government.
56
Author Contributions: Juan Hirzel, Ingrid Walter and Ivan Matus, conceived, designed and
performed the experiments; Jorge Retamal-Salgado and Juan Hirzel, analyzed the data; Juan
Hirzel and Ivan Matus, facilitated access to the experimental sites and soil samples. All authors
contributed with valuable discussions and scientific advices in order to improve the quality of the
work.
Conflicts of Interest: The authors declare no conflict of interest.
References
1. Siebers, N.; Godlinski, F.; Leinweber, P. Bone char as phosphorus fertilizer involved in
cadmium immobilization in lettuce, wheat, and potato cropping. J. Plant Nutr. Soil Sci. 2014,
177, 75-83.
2. Honma T.; Ohba, H.; Makino, T.; Ohyama, T. Relationship between Cadmium fractions
obtained by sequential extraction of soil and the soil properties in contaminated and
uncontaminated paddy soils. J. Chem. 2015, Article ID 714680, 1-10.
3. Wang, Q.; Zhang, J.; Zhao, B.; Xin, X.; Zhang, C.; Zhang, H. The influence of long-term
fertilization on cadmium (Cd) accumulation in soil and its uptake by crops. Environ. Sci.
Pollut. Res. 2014, 21(17), 10377-10385, 1 - 9.
4. He, S.; Hex, Z.; Yang, X.; Stoffellax, P.J.; Baligarjj, V.C. Soil Biogeochemistry, Plant
Physiology, and Phytoremediation of Cadmium- Contaminated Soils. Adv. Agron. 2015, 134,
135-225.
5. Sozubek, B.; Belliturk, K.; Saglam, M.T. Effect of Zinc Application on Cadmium Uptake of
Maize Grown in Alkaline Soil. Commun. Soil Sci. Plant Anal. 2015, 46(10), 1244-1248,
DOI: 10.1080/00103624.2015.1033534.
6. Zhou, D.; Liu, D.; Gao, F.; Li, M.; Luo, X. Effects of Biochar-Derived Sewage Sludge on
Heavy Metal Adsorption and Immobilization in Soils. Int. J. Environ. Res. Public Health.
2017, 14, 681; doi:10.3390/ijerph14070681.
7. Liu, Y.; Xiao, T.; Baveye, P.C.; Zhu, J.; Ning, Z.; Li, H. Potential health risk in areas with
high naturally-occurring cadmium background in southwestern China. Ecotoxicol. Environ.
Saf. 2015, 112, 122-131.
57
8. Chang, Y.; Wen, J.; Cai, J.; Xiao-ying, W.; Yang, L.; Guo, Y. An investigation and
pathological analysis of two fatal cases of cadmium poisoning. Forensic Sci. Int. 2012, 220,
e5–e8.
9. Walker, R.; Herman, J.L. 2000. Summary and conclusions of a joint FAO/WHO expert
committee on food additives. Report 55. World Health Organization: Geneva. En linea:
<http://www.who.int/pcs/jecfa/>. Fecha consulta: 25 marzo 2015.
10. Quezada-Hinojosa R.; Föllmi, K.B.; Gillet, F.; Matera, V. Cadmium accumulation in six
common plant species associated with soils containing high geogenic cadmium
concentrations at Le Gurnigel, Swiss Jura Mountains. Catena 2015, 124, 85-96.
11. Liu, K.; Lv, J.; He, W.; Zhang, H.; Cao, Y.; Dai, Y. Major factors influencing Cadmium
uptake from the soil into wheat plants. Ecotoxicol. Environ. Saf. 2015, 113, 207-213.
12. Zhao, X.L.; Jiang, T.; Du, B. Effect of organic matter and calcium carbonate on behaviors of
cadmium adsorption–desorption on/from purple paddy soils. Chemosphere 2013, 1-8.
13. Yang, Y.; Nan, Z.; Zhao, Z. Bioaccumulation and translocation of cadmium in wheat
(Triticum aestivum L.) and maize (Zea mays L.) from the polluted oasis soil of Northwestern
China. Chem. Spec. Bioavailab. 2014, 26(1), 43-51.
14. Cajuste, L.J.; Cajuste Jr, L.; García, C.; Cruz, J. Distribution and Availability of Heavy
Metals in Raw and Acidulated Phosphate Rock–Amended Soils. Commun. Soil Sci. Plant
Anal. 2006, 37, 2541-2552.
15. Tanaka, K.; Fujimaki, S.; Fujiwara, T.; Yoneyama, T.; Hayashi, H. Quantitative estimation
of the contribution of the phloem in cadmium transport to grains in rice plants (Oryza sativa
L.). Soil Sci. Plant Nutr. 2007, 53(1), 72 - 77.
16. Hirzel, J.; Retamal-Salgado, J.; Walter, I.; Matus, I. Cadmium accumulation and distribution
in plants of three durum wheat cultivars under different agricultural environments in Chile. J.
Soil Water Conserv. 2017, 72(1), 77-88. DOI:10.2489/jswc.72.1.77
17. Hirzel, J.; Retamal-Salgado, J.; Walter, I.; Matus, I. Effect of soil cadmium concentration on
three Chilean durum wheat cultivars in four environments. Arch. Agron. Soil Sci. 2017, 1-11,
DOI: 10.1080/03650340.2017.1337892
18. Bao, T.; Sun, L.; Sun, T. 2011. The effects of Fe deficiency on low molecular weight organic
acid exudation and cadmium uptake by Solanum nigrum L. Acta Agric. Scand. 61(4): 305 -
312.
58
19. McDowell, R.W.; Taylor, M.D.; Stevenson, B.A. Natural background and anthropogenic
contributions of cadmium to New Zealand soils. Agric. Ecosyst. Environ. 2013, 165, 80–87.
20. Hechmi, N.; Aissa, N.B.; Abdennaceur, H.; Jedidi, N. Phytoremediation potential of maize
(Zea mays L.) in co-contaminated soils with pentachlorophenol and Cadmium. Int. J.
Phytorem. 2013, 15, 703–713.
21. Putwattana, N.; Kruatrachue, M.; Kumsopa, A.; Pokethitiyook, P. Evaluation of Organic and
Inorganic Amendments on Maize Growth and Uptake of Cd and Zn from Contaminated
Paddy Soils. Int. J. Phytorem. 2015, 17(2), 165-174.
22. Adeniji, B.A.; Budimir-Hussey, M.T.; Macfie, S.M. Production of organic acids and
adsorption of Cd on roots of durum wheat (Triticum turgidum L. var. durum). Acta Physiol.
Plant. 2010, 32, 1063-1072.
23. Arduini, I.; Masoni, A.; Mariotti, M.; Pampana, S.; Ercoli, L. Cadmium uptake and
translocation in durum wheat varieties differing in grain-Cd accumulation. Plant Soil
Environ. 2014, 60(1), 43 – 49.
24. Fahad, S.; Hussain, S.; Saud, S.; Hassan, S.; Darakh, S.; Chen, Y.; Deng, N.; Khan, F.; Wu,
Ch.; Wu, W.; Shah, F.; Ullah, B.; Yousaf, M.; Ali, S.; Huang, J. Grain Cadmium and Zinc
Concentrations in Maize Influenced by Genotypic Variations and Zinc Fertilization. CLEAN
– Soil, Air, Water 2015, ’Accepted Article’, 1 - 9.
25. USDA. Keys to soil taxonomy. 12nd
ed. USDA-Natural Resources Conservation Service,
Washington, DC., USA, 2014, pp 1-360.
26. Red Agrometeorológica de INIA. 2013. Agromet: red agrometeorológica del INIA. [enlínea]
<http://www.agromet.inia.cl/estaciones.php.>. Fecha consulta: 07 abril 2017.
27. Sadzawka, A.; Carrasco, M.A.; Grez, R.; Mora, M.; Flores, H.; Neaman, A. Métodos de
análisis recomendados para los suelos de Chile. Instituto de Investigaciones Agropecuarias,
Santiago, Chile, 2006, pp. 1-164. Serie Actas INIA Nº 34.
28. Lindsay W.L.; Norvell, W.A. Development of a DTPA Soil Test for Zinc, Iron, Manganese,
and Copper. Soil Science Society of America Journal 1978, 42(3), 421 - 428.
29. Trejo, N.; Matus, I.; del Pozo, A.; Walter I.; Hirzel, J. Cadmium phytoextraction capacity of
white lupine (Lupinus albus L.) and narrow-leafed lupine (Lupinus angustifolius L.) in three
contrasting agroclimatic conditions of Chile. Chil. J. Agric. Res. 2016, 76(2), 228-235.
59
30. Galal, T.M.; Shehatab, H.S. Bioaccumulation and translocation of heavy metals by Plantago
major L. grown in contaminated soils under the effect of traffic pollution. Ecol. Indic. 2015,
48, 244–251.
31. Usman, A.R.A.; Mohamed, H.M. Effect of microbial inoculation and EDTA on the uptake
and translocation of heavy metal by corn and sunflower. Chemosphere 2009, 76, 893–899.
32. Usman A.R.A.; Alkreda, R.S.; Al-Wabel, M.I. Heavy metal contamination in sediments and
mangroves from the coast of Red Sea: Avicennia marina as potential metal bioaccumulator.
Ecotoxicol. Environ. Saf. 2013, 97, 263–270.
33. Azzia, V.; Kansoa, A.; Kazparda, V.; Kobeissid, A.; Lartigesb, B.; Samrania, A.E. Lactuca
sativa growth in compacted and non-compacted semi-arid alkaline soil under phosphate
fertilizer treatment and cadmium contamination. Soil Tillaje Res. 2017, 165, 1-10.
34. Zhang Z.; Liu, C.; Wang, X.; Shi, G. Cadmium-induced alterations in morpho-physiology of
two peanut cultivars differing in cadmium accumulation. Acta Physiol. Plant 2013, 35,
2105–2112.
35. Klaus, A.A.; Lysenko, E.A.; Kholodova, V.P. Maize plant growth and accumulation of
photosynthetic pigmentsat short- and long- term exposure to cadmium. Rus. J. Plant Physiol.
2013, 60(2), 250–259.
36. Liu, Y.; Hou, P.; Xie, R.; Li, S.; Zhang, H.; Ming, B.; Ma, D.; Liang, S. Spatial
Adaptabilities of Spring Maize to Variation of Climatic Conditions. Crop Science 2013, 53,
1693 - 1703.
37. Tanwir, K.; Akram, M.S.; Masood, S.; Chaudhary, H.J.; Lindberg, S.; Javed, M.T.
Cadmium-induced rhizospheric pH dynamics modulated nutrient acquisition and
physiological attributes of maize (Zea mays L.). Environ. Sci. Pollut. Res. 2015, “Accepted
Article”, 1 - 11.
38. Slycken, S.V.; Witters, N.; Meers, E.; Peene, A.; Michels, E.; Adriaensen, K.; Ruttens, A.;
Vangronsveld, J.; Du Laing, G.; Wierinck, I.; Van Dael, M.; Van Passel, S.; Tack, F.M.G.
Safe use of metal-contaminated agricultural land by cultivation of energy maize (Zea mays).
Environ. Pollut. 2013, 178, 375-380.
39. Sarwar, N.; Malhi, S.S.; Zia, M.H.; Naeem, A.; Bibia, S.; Farida, G. Role of mineral nutrition
in minimizing cadmium accumulation by plants. Journal Science Food Agricultural 2010,
90, 925-937.
60
40. Xu, W.; Lu, G.; Wang, R.; Guo, Ch.; Liao, Ch.; Yi, X.; Dang, Z. The Effect of Pollination on
Cd Phytoextraction from Soil by Maize (Zea mays L.). Int. J. Phytorem. 2015, “Accepted
Article”, 1 - 27.
41. Wahsha M.; S.Fontana, M.; Nadimi-Goki; Bini, C. Potentially toxic elements in foodcrops
(Triticum aestivum L., Zea mays L.) grown on contaminated soils. J. Geochem. Explor. 2014,
147, 189 – 199.
42. Liang, Y.; Wong, J.; Wei, L. Silicon-mediated enhancement of cadmium tolerance in maize
(Zea mays L.) grown in cadmium contaminated soil. Chemosphere 2005, 58, 475-483.
43. Stritsis, Ch.; Steingrobe, B.; Claassen, N. Shoot cadmium concentration of soil-grown plants
as related to their root properties. J. Plant Nutr. Soil Sci. 2012, 175, 456-465.
44. Egwu, G.; Agbenin, J. Field assessment of cadmium, lead and zinc contamination of soils
and leaf vegetables under urban and peri-urban agriculture in northern Nigeria. Arch. Agron.
Soil Sci. 2013, 59, 875-887.
45. Zhang, Y., Tai, C.; Li, P.; Liu, W.; Yin, W.; Zao, Q.; Dong, D. Cadmium accumulation of
Tagetes erecta L. affected by plant growth inhibitors and glutathione. J. Plant Nutr. 2012,
35, 1053–1064.
46. Chen, G.; Zeng, G.; Tang, L.; Du, Ch.; Jiang, X.; Huang, G.; Liu, H.; Shen, G. Cadmium
removal from simulated wastewater to biomass byproduct of Lentinus edodes. Bioresour.
Technol. 2008, 99, 7034 – 7040.
47. Du, Y.L.; He, M.M.; Xu, M.; Yan, Z.G.; Zhou, Y.Y.; Guo, G.L.; Nie, J.; Wang, L.Q.; Hou,
H.; Li, F.S. Interactive effects between earthworms and maize plants on the accumulation
and toxicity of soil cadmium. Soil Biol. Biochem. 2014, 72, 193-202.
48. Singh, M.; Srivastavaa, R.K. Feasibility of using tuberose (P. tuberosa L.) in horizontal
subsurface flow constructed wetland for heavy metal removal from domestic wastewater.
Environ. Prog. Sustainable Energy 2016, 35(1), 125-132.
61
IV. CONCLUSIONES GENERALES
Los resultados obtenidos en este estudio evidencian que la presencia de Cd en el suelo (línea base
y la aplicada), no afectó el rendimiento de grano del maíz. Sin embargo, la MS del grano fue
superior en el medioambiente La Serena, dado las condiciones climaticas favorables para el
desarrollo del cultivo. Conjuntamente, la producción total de materia seca del residuo no se vio
afectada por los distintos medioambientes, dosis de Cd y cultivares. Por su parte, la
concentración de Cd tanto en el grano como en residuo del maíz fue afectada tanto por el
ambiente de cultivo, por la aplicación de Cd al suelo, y por el cultivar. En las raíces, la
concentración de Cd sólo fue afectada por el medioambiente y por la aplicación de este metal en
el suelo.
Los cultivares evaluados en este estudio, no presentaron diferencias en la concentración de Cd, en
niguno de los tejidos analizados, lo que sugiere que incrementos en la concentración de Cd en el
suelo no afectan la respuesta de acumulación de Cd entre cultivares. Entre los ambientes
evaluados la mayor concentración de Cd obtenida en el grano correspondió a La Serena, pero en
ningún caso correspondió al valor considerado como limite (0.2 mg kg-1
).
Por otra parte, la concentración total de Cd en el suelo, una vez terminada la cosecha de maíz,
fue dependiente del medioambiente y de la dosis empleada para este metal, con una mayor
acumulación en la primera capa de suelo.
Los mayores niveles de concentración y extracción de cadmio en los diferentes cultivares de maíz
evaluados se obtuvieron en el residuo (tallo + hojas), independiente del medioambiente, dosis de
Cd y cultivares de maíz.
Entre los ambientes evaluados, la mayor concentración de Cd en el grano se observó en La
Serena, pero en ningún caso fue superior a los límites establecidos.
Según los valores obtenidos de TF (TF > 2) y BAF (BAF > 1) los medioambientes Los Tilos y
Chillán se clasificarían de alta capacidad de contaminación de la cadena alimentaria para los
cultivares evaluados y considerando los grados de contaminación de cadmio generados en el
suelo. Donde la mayor correlacion de transferencia de cadmio a la parte aérea es según la
concentración de este metal en el suelo.