Absolute Quantification of Aldehyde Oxidase Protein in Human Liver Using Liquid...
8
Absolute Quantification of Aldehyde Oxidase Protein in Human Liver Using Liquid Chromatography-Tandem Mass Spectrometry John T. Barr, † Jeffrey P. Jones,* ,† Carolyn A. Joswig-Jones, † and Dan A. Rock ‡ † Department of Chemistry, Washington State University, P.O. Box 644630, Pullman, Washington 99164-4630, United States ‡ Department of Pharmacokinetics and Drug Metabolism, Amgen Inc., 1201 Amgen Court West, Seattle, Washington 98119, United States ABSTRACT: The function of the enzyme human aldehyde oxidase (AOX1) is uncertain; however, recent studies have implicated significant biochemical involvement in humans. AOX1 has also rapidly become an important drug-metaboliz- ing enzyme. Until now, quantitation of AOX1 in complex matrices such as tissue has not been achieved. Herein, we developed and employed a trypsin digest and subsequent liquid chromatography-tandem mass spectrometry analysis to determine absolute amounts of AOX1 in human liver. E. coli expressed human purified AOX1 was used to validate the linearity, sensitivity, and selectivity of the method. Overall, the method is highly efficient and sensitive for determination of AOX1 in cytosolic liver fractions. Using this method, we observed substantial batch-to-batch variation in AOX1 content (21-40 pmol AOX1/mg total protein) between various pooled human liver cytosol preparations. We also observed interbatch variation in V max (3.3-4.9 nmol min -1 mg -1 ) and a modest correlation between enzyme concentration and activity. In addition, we measured a large difference in k cat /K m , between purified (k cat /K m of 1.4) and human liver cytosol (k cat /K m of 15-20) indicating cytosol to be 11-14 times more efficient in the turnover of DACA than the E. coli expressed purified enzyme. Finally, we discussed the future impact of this method for the development of drug metabolism models and understanding the biochemical role of this enzyme. KEYWORDS: aldehyde oxidase, AO, AOX1, protein quantification, drug metabolism, kinetics, mass spectrometry H umans express a single aldehyde oxidase enzyme known as AOX1 (EC1.2.3.1) that, like xanthine oxidase, is a member of the molybdo-flavoenzyme family. 1 The AO holoenzyme is a cytosolic homodimer, and each 150 kDa monomer is characterized by three separate domains: the 20 kDa N-terminal domain that has two distinct [2Fe-2S] clusters, the 40 kDa central domain that has FAD, and the 80 kDa C-terminal domain that binds molybdenum cofactor (MoCo) with an equatorial sulfur ligand that is essential for enzyme activity. Although the exact physiological function of AOX1 in human remains unclear, a number of studies have reported findings that implicate significant biological importance for this enzyme in humans. There is evidence for the involvement of AOX on lipid disposition 2-4 as well metabolism of other endogenous substrates such as retinaldehyde 5 and pyridoxal. 6 While the native substrate remains uncertain, the terminal electron acceptor is oxygen, leading to the production of reactive oxygen species (ROS) such as superoxide radical anion or hydrogen peroxide. ROS generated by AOX1 may be important in cellular redox stresses, toxicities, and various human disease states. 7 One such hypothesized toxicity is the correlation of AOX1 activity with the neurodegenerative disease amyotrophic lateral sclerosis. 8 Generation of excess ROS by AOX1 may also contribute to alcohol-induced liver injury. 9 Finally, a recent study has also determined that AOX1 contributes to hepatic injury by chloroform, carbon tetrachloride, and thioacetamide, compounds known to generate ROS. 10 While historically AOX1 has played a minor role in drug metabolism, recently a number of drugs have failed in clinical trials as a result of AOX1 metabolism. 11-13 The major reason for the failures is poor allometric scaling from preclinical species to humans. 14 This is exacerbated by the use of human microsomal fractions for in vitro screening, since AOX1 is a cytosolic enzyme. Furthermore, when human cytosol is used, it seems to give variable results from different preparations. The origins of the variations are not known, but the phenotypic variation from common SNPs is not large, 15 and this should be overcome by the use of pooled cytosolic preparations. Hepatocytes also appear to be an alternative to human liver cytosol 16 but are cost-prohibitive for high throughput screening and appear to have variable activity. Finally, expression and purification of AOX1 has been accomplished, but the overall Received: May 21, 2013 Revised: July 22, 2013 Accepted: September 5, 2013 Article pubs.acs.org/molecularpharmaceutics © XXXX American Chemical Society A dx.doi.org/10.1021/mp4003046 | Mol. Pharmaceutics XXXX, XXX, XXX-XXX
Transcript of Absolute Quantification of Aldehyde Oxidase Protein in Human Liver Using Liquid...

Absolute Quantification of Aldehyde Oxidase Protein in Human LiverUsing Liquid Chromatography−Tandem Mass SpectrometryJohn T. Barr,† Jeffrey P. Jones,*,† Carolyn A. Joswig-Jones,† and Dan A. Rock‡
†Department of Chemistry, Washington State University, P.O. Box 644630, Pullman, Washington 99164-4630, United States‡Department of Pharmacokinetics and Drug Metabolism, Amgen Inc., 1201 Amgen Court West, Seattle, Washington 98119, UnitedStates
ABSTRACT: The function of the enzyme human aldehydeoxidase (AOX1) is uncertain; however, recent studies haveimplicated significant biochemical involvement in humans.AOX1 has also rapidly become an important drug-metaboliz-ing enzyme. Until now, quantitation of AOX1 in complexmatrices such as tissue has not been achieved. Herein, wedeveloped and employed a trypsin digest and subsequentliquid chromatography−tandem mass spectrometry analysis todetermine absolute amounts of AOX1 in human liver. E. coliexpressed human purified AOX1 was used to validate thelinearity, sensitivity, and selectivity of the method. Overall, themethod is highly efficient and sensitive for determination ofAOX1 in cytosolic liver fractions. Using this method, weobserved substantial batch-to-batch variation in AOX1 content (21−40 pmol AOX1/mg total protein) between various pooledhuman liver cytosol preparations. We also observed interbatch variation in Vmax (3.3−4.9 nmol min−1 mg−1) and a modestcorrelation between enzyme concentration and activity. In addition, we measured a large difference in kcat/Km, between purified(kcat/Km of 1.4) and human liver cytosol (kcat/Km of 15−20) indicating cytosol to be 11−14 times more efficient in the turnoverof DACA than the E. coli expressed purified enzyme. Finally, we discussed the future impact of this method for the developmentof drug metabolism models and understanding the biochemical role of this enzyme.
KEYWORDS: aldehyde oxidase, AO, AOX1, protein quantification, drug metabolism, kinetics, mass spectrometry
Humans express a single aldehyde oxidase enzyme knownas AOX1 (EC1.2.3.1) that, like xanthine oxidase, is a
member of the molybdo-flavoenzyme family.1 The AOholoenzyme is a cytosolic homodimer, and each 150 kDamonomer is characterized by three separate domains: the 20kDa N-terminal domain that has two distinct [2Fe−2S]clusters, the 40 kDa central domain that has FAD, and the80 kDa C-terminal domain that binds molybdenum cofactor(MoCo) with an equatorial sulfur ligand that is essential forenzyme activity.Although the exact physiological function of AOX1 in human
remains unclear, a number of studies have reported findingsthat implicate significant biological importance for this enzymein humans. There is evidence for the involvement of AOX onlipid disposition2−4 as well metabolism of other endogenoussubstrates such as retinaldehyde5 and pyridoxal.6 While thenative substrate remains uncertain, the terminal electronacceptor is oxygen, leading to the production of reactiveoxygen species (ROS) such as superoxide radical anion orhydrogen peroxide. ROS generated by AOX1 may be importantin cellular redox stresses, toxicities, and various human diseasestates.7 One such hypothesized toxicity is the correlation ofAOX1 activity with the neurodegenerative disease amyotrophiclateral sclerosis.8 Generation of excess ROS by AOX1 may also
contribute to alcohol-induced liver injury.9 Finally, a recentstudy has also determined that AOX1 contributes to hepaticinjury by chloroform, carbon tetrachloride, and thioacetamide,compounds known to generate ROS.10
While historically AOX1 has played a minor role in drugmetabolism, recently a number of drugs have failed in clinicaltrials as a result of AOX1 metabolism.11−13 The major reasonfor the failures is poor allometric scaling from preclinical speciesto humans.14 This is exacerbated by the use of humanmicrosomal fractions for in vitro screening, since AOX1 is acytosolic enzyme. Furthermore, when human cytosol is used, itseems to give variable results from different preparations. Theorigins of the variations are not known, but the phenotypicvariation from common SNPs is not large,15 and this should beovercome by the use of pooled cytosolic preparations.Hepatocytes also appear to be an alternative to human livercytosol16 but are cost-prohibitive for high throughput screeningand appear to have variable activity. Finally, expression andpurification of AOX1 has been accomplished, but the overall
Received: May 21, 2013Revised: July 22, 2013Accepted: September 5, 2013
Article
pubs.acs.org/molecularpharmaceutics
© XXXX American Chemical Society A dx.doi.org/10.1021/mp4003046 | Mol. Pharmaceutics XXXX, XXX, XXX−XXX
yield is modest,15,17 and cofactor incorporation is incomplete.15
Thus at this time human cytosol is the most attractive source ofenzyme. However, since the amount of AOX1 in humancytosol is not known, a rapid method for protein quantificationwould be valuable for standardization of each AOX1 lot.To aid in AOX1-related studies in drug metabolism,
biochemistry, and disease states, we have developed a rapidmass spectrometry (MS) method for the quantification ofhuman aldehyde oxidase. Unique peptide fragments from thetrypsin digest of AOX1 are identified, and a synthetic peptidestandard is used to determine the amount of AOX1 in humancytosol from different human liver samples. Herein, we alsoapply this approach to investigate batch-to-batch variationbetween commercial HLC as well as the efficiency differencesbetween recombinant purified enzyme and that from a nativesource.
■ EXPERIMENTAL PROCEDURESMaterials. Human liver cytosol (pooled from individual
donors of mixed gender) was purchased from BD Biosciences(Franklin Lakes, NJ). Guinea pig liver cytosol was purchasedfrom Xenotech LLC (Lenexa, KS). Sequence grade trypsin wasacquired from Promega (Madison, WI). The synthetic peptidestandard (H-Met-Tyr-Lys-Glu-Ile*-Asp-Gln-Thr-Pro-Tyr-Lys-Gln-Glu-NH2) with heavy isotope labeling (Ile* = U-13C6)was obtained from Anaspec (Fremont, CA). 2-Methyl-4(3H)-quinazolinone (internal standard used in kinetics assays) waspurchased from Sigma-Aldrich (St. Louis, MO). N-[(2-Dimethylamino)ethyl]acridine-4-carboxamide (DACA) wassynthesized according to previously published methods.18
DACA-9(10H)-acridone was kindly provided by Dr. WilliamA. Denny from University of Auckland (Auckland, NewZealand). All other reagents used were analytical grade orbetter.Cytosol Digestion Procedure. In order to determine the
human AOX1 levels, an efficient, simple digestion method wasdeveloped. Human liver cytosol (25 μL of 20 mg/mL stock)was mixed with a denaturing solution containing 8 M urea and2 mM DTT (25 μL, 4 M urea, 1 mM DTT final concentration)and incubated at 60 °C for 60 min. The mixture wassubsequently diluted with 25 mM sodium bicarbonate buffercontaining 100 nM peptide internal standard (pH 8.4, final 250μL). Sequence grade trypsin (20 μL of a 0.5 μg/μL solution)was added (1:50 protein to protein ratio of trypsin to cytosol)and incubated overnight at 37 °C. Aliquots of the digestedpeptide solution were terminated by adding an appropriateamount of 50% v/v trifluoroacetic acid (TFA) in water suchthat the final concentration was 10% TFA v/v. Samples weresubsequently vortexed and centrifuged (1460g for 10 min)prior to LC−MS/MS analysis.Determination and Selection of AOX1 Peptide
Candidates. Samples were immediately analyzed by LC−MS/MS. An Accela 1250 HPLC system coupled to an HTSPAL autosampler (LEAP Technologies, Carrboro, NC)interfaced with an LTQ-Orbitrap Velos mass spectrometer(Thermo Fisher Scientific, Bremen, Germany) was used fortryptic peptide analysis. Peptide samples were injected onto aPhenomenex Jupiter C18 column (3 μm, 2.1 × 150 mm;Torrance, CA) using a flow rate of 0.2 mL/min, with a portionof the column eluate (20%) diverted to the mass spectrometer.Mobile phase consisted of 0.05% formic acid in water (A) and0.05% formic acid in acetonitrile (B). Initial conditions were98% A, with a linear gradient: 2% B for 2 min, 2−95% B over
35 min, and 95% B for 5 min. Ions were detected in positivemode; peptide masses and fragments were acquired in SRM onthe FT-Orbitrap. Fragment ion spectra acquired from collision-induced dissociation (CID) were produced using 35% collisionenergy and a 1.0 Da isolation window. Peptides of interest wereextracted and analyzed with Quant Browser (Thermo Scientific,San Jose, CA).
HPLC−ESI-MS/MS Quantitation Assay. Digested sampleswere analyzed using an 1100 series high performance liquidchromatography system (Agilent Technologies, Santa Clara,CA) coupled to an API 4000 tandem mass spectrometry systemmanufactured by Applied Biosystems/MDS Sciex (Foster City,CA) with a turbospray ESI source operating in positive ionmode. A sample volume of 5 μL was injected onto the column,and chromatography was performed on a HALO C18 column(2.1 mm × 150 mm, 2.7 μm; Advanced Materials Technology,Wilmington, DE).Mobile phases comprised 0.05% formic acid and 0.2% acetic
acid in water (A) and 90% acetonitrile, 9.9% water, and 0.1%formic acid (B). Using a flow rate of 200 μL/min, the columnwas equilibrated at initial conditions of 98% mobile phase A for2 min. Chromatographic separation was performed using alinear gradient over the next 35 min to 5% mobile phase A andwas held at 5% A for 5 min. Mobile phase A was thenimmediately ramped back to 98% and held constant for anequilibration time of 5 min. The total chromatographic assaytime was 47 min per sample, and the retention times forinternal standard (IS) and analyte peaks were 10.2 min.Three MRM transitions were selected for both the IS and
native peptide. Compound parameters were optimized asfollows: declustering potential, 70; entrance potential, 10;collision energy, 30; collision cell exit potential, 15. Sourceparameters used were as follows: collision gas, 4; curtain gas,15; ion source gas 1, 50; ion source gas 2, 5; ion source voltage,4000; source temperature, 400. Since the native and IS peptidesbehave identically in MS conditions (i.e., in terms of signalresponse and fragmentation), the native peptide wasquantitated by simply comparing the native peak area to theIS peak area of known concentration.
Preparation of Purified AOX1. AOX1 was preparedaccording to the methods described previously.17 Briefly,human AOX1 was overexpressed as a N-terminal hexa-Histagged in TP-100019 E. coli cells (a gift from John Enemark’slaboratory, University of Arizona). Cells were lysed andpartially purified using a 1-mL HiTrap Chelating HP column(GE Healthcare, Little Chalfont, Buckinghamshire, U.K.).Upon purification, the protein was dialyzed into 100 mMpotassium phosphate buffer, pH 7.4 and stored at −80 °C priorto use.
Quantitation of Purified AO by UV Assay. UV spectra ofair-oxidized purified AO samples were taken using an Agilent8453 UV−vis spectrometer (Agilent Technologies, Santa Clara,CA). The AO concentration was calculated using theabsorbance at 450 nm and an extinction coefficient of 34.7cm−1 mM−1.20
Determination of Method Detection Limit (MDL) forMS Quantitation. For calculating MDL, a repeat injectionapproach was used as described previously.21 In short, a dilutedsample of purified AO was digested, and the peak area wasmeasured multiple times. MDL was calculated using thefollowing formula:
= α̅S TMDL x
Molecular Pharmaceutics Article
dx.doi.org/10.1021/mp4003046 | Mol. Pharmaceutics XXXX, XXX, XXX−XXXB

where Sx ̅ is equal to the standard deviation of the mean for peakarea, and Tα is the value chosen from a t-table for n = 5 at a99% confidence interval.Enzyme Kinetics. Saturation kinetics assays were per-
formed using DACA as a probe substrate. All incubations wereperformed in 25 mM potassium phosphate buffer (pH 7.4)with 7 different substrate concentrations spanning 2−200 μM.Substrate stock solutions were made up in dimethyl sulfoxideand added to the incubation such that the total concentrationof DMSO was 0.5% (v/v) for all samples.Incubations were performed at 37 °C in a shaking water bath
incubator. For assays involving HLC, 0.04 mg of total proteinwas used. For purified enzyme assays, 13 pmol of AO was usedin each reaction. The reaction was initiated by addition ofprewarmed enzyme, run for a period of 5 min, and thenquenched with 200 μL of 1 M formic acid containing a knownconcentration of the IS. Product formation was observed to belinear with respect to time for the reaction period of 5 min. Thequenched samples were centrifuged for 10 min at 5000 rpmusing an Eppendorf centrifuge 5415D, and the supernatant wascollected for analysis.Formation of the metabolite, DACA-9(10H)-acridone, was
monitored by HPLC−MS/MS as previously described.18 Inbrief, chromatographic separation was achieved using a SynergiPolar reverse-phase column (30 mm × 3.0 mm, 4 μm;Phenomenex, Torrance, CA) on an 1100 series HPLC (AgilentTechnologies, Santa Clara, CA). The metabolite (DACAacridone) and the IS were detected on an API4000 triplequadrupole mass spectrometer (Applied Biosystems/MDSSciex, Foster City, CA) using multiple reaction monitoringmode by monitoring the m/z transition from 310 to 265 and161 to 120, respectively. Quantitation of product wasaccomplished by extrapolating from a standard curve rangingfrom 2 to 1000 nM of authentic DACA metabolite.Enzyme kinetic parameters (Vmax, Km, and Ki) were
determined by a nonlinear regression fit using the followingsubstrate inhibition equation:
= + +v V K K( [S])/( [S](1 [S]/ ))max m i
where v is the reaction velocity, Vmax is maximal reactionvelocity, [S] is the substrate concentration, Km is theMichaelis−Menten constant, and Ki is the inhibition constantfor the substrate.Statistical Analysis and Curve Fitting. Substrate
saturation and peptide standard curves were plotted andanalyzed using GraphPad Prism (version 4.03; GraphPadSoftware Inc., San Diego, CA). The substrate inhibition modelwas chosen as the best kinetic model according to the Akaikeinformation criterion test that is built into Graphpad Prism.Other figures were generated using OriginPro (version 8.5.1;OriginLab Corp., Northampton, MA).
■ RESULTSSelection of Candidate Peptide. Digestion and subse-
quent MS analysis gave a sequence coverage of approximately66% for human AOX1. From the numerous observed peptides,candidate peptides were selected on the basis of three criteria.First, they must be unique for AOX1 when compared to thehuman protein database. Second, the peptides must be eithersingly or doubly charged. Last, the peptides must have arelatively high signal intensity. Ultimately, the peptide selectedfor this study was found to behave optimally in HLC withminimal signal interference and high sensitivity.
LC−MS/MS Quantitation Method. Figure 1 shows thestructure of the peptide used for AO quantitation. A Q1 scan of
the digested IS and native peptides showed an m/z of 500.1and 497.1, respectively, corresponding to (M + 2H)2+. Production scans were taken for a digested sample containing both ISand native peptides. Spectra for product ion scan (MS2) areshown in Figure 2. Fragments were selected on the basis of two
criteria. First, the fragment monitored must contain theisotope-labeled carbons, and second, relative peak intensity.The first criterion was imposed as to limit the amount ofinterference between labeled and unlabeled peaks.Three analogous MRM transitions were selected to monitor
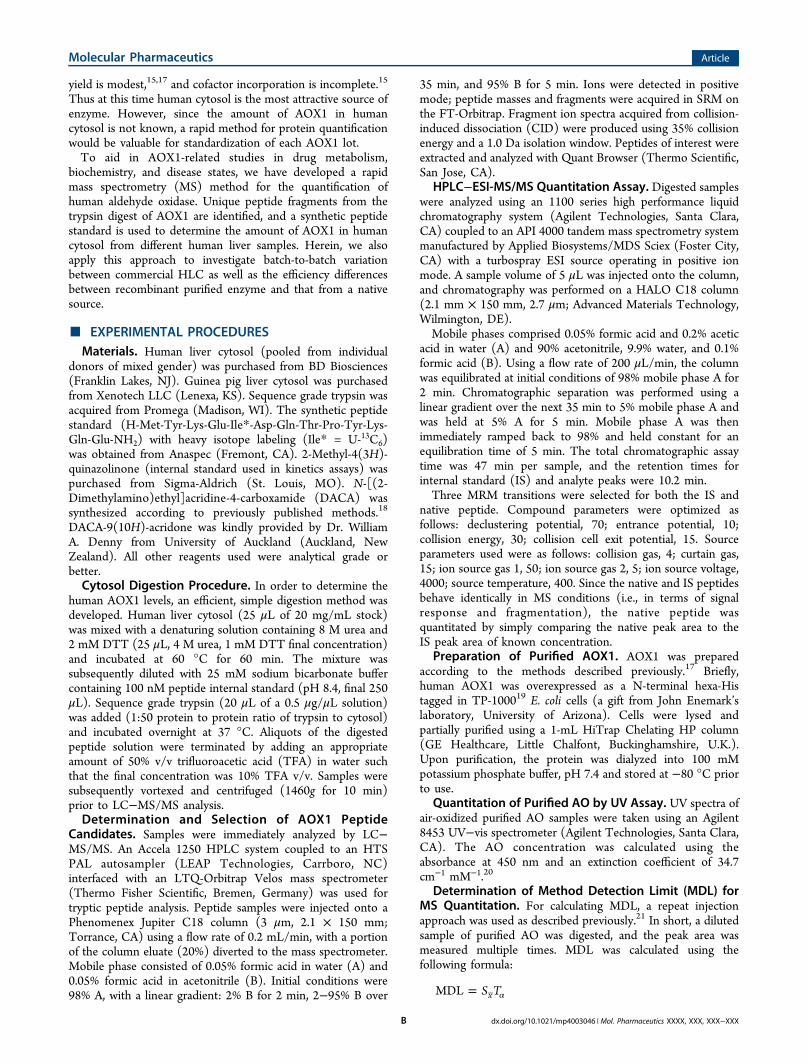
for both IS and native peptides. LC conditions were optimizedto allow adequate separation of the peptide of interest awayfrom contaminate peaks. Figure 3 shows a typical MRMchromatogram using digested purified AO containing IS.Despite the high selectively of MRM, contaminate peaks wereobserved due to the high complexity of the samples. Inparticular, one predominant contaminate peak was observed inthe IS2MRM channel. This was easily resolved, however, due tothe retention time of all peaks of interest being exactly the same(10.2 min).
Trypsin Digest of AO. A simple trypsin digest wasdeveloped and optimized for both digestion time andtrypsin/protein ratios. The trypsin/protein ratio found to be
Figure 1. Chemical structure of the digested peptide used for AOX1quantitation. Asterisks indicate the 13C-labeled carbons in the internalstandard peptide. IS and native peptides showed an m/z of 500.1 and497.1, respectively, corresponding to (M + 2H) 2+.
Figure 2. Product ion (MS2) spectra displaying the fragmentationpattern for internal standard (left) and native (right) peptides.
Molecular Pharmaceutics Article
dx.doi.org/10.1021/mp4003046 | Mol. Pharmaceutics XXXX, XXX, XXX−XXXC
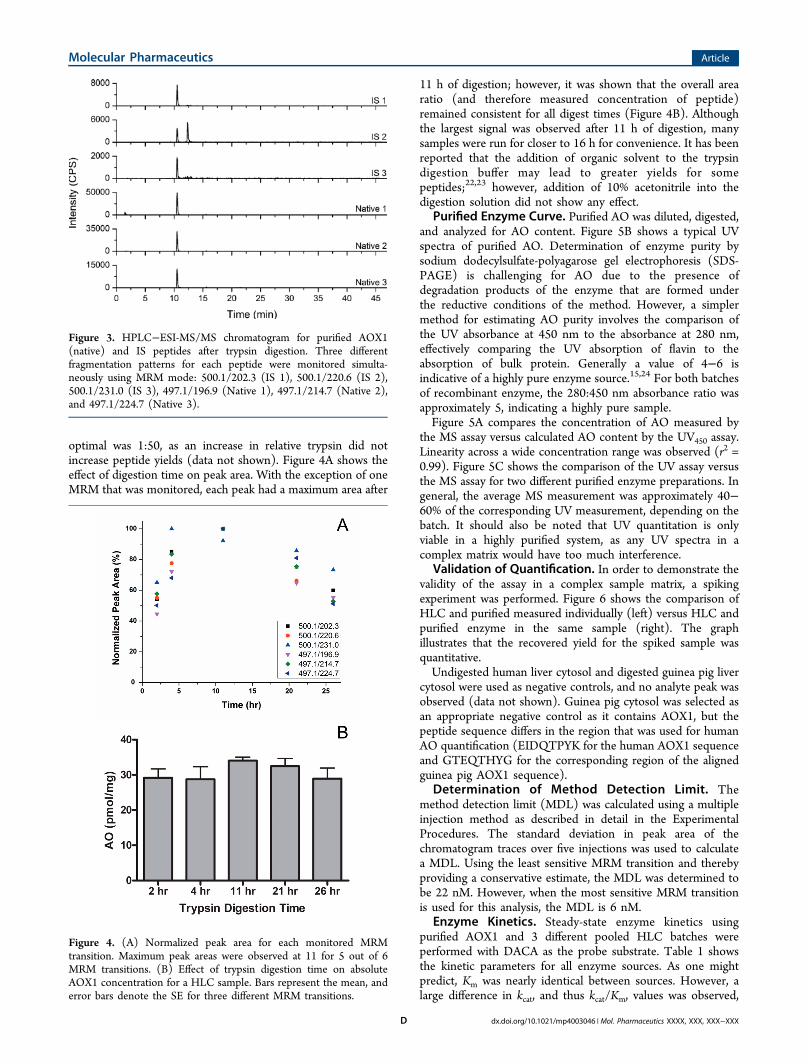
optimal was 1:50, as an increase in relative trypsin did notincrease peptide yields (data not shown). Figure 4A shows theeffect of digestion time on peak area. With the exception of oneMRM that was monitored, each peak had a maximum area after
11 h of digestion; however, it was shown that the overall arearatio (and therefore measured concentration of peptide)remained consistent for all digest times (Figure 4B). Althoughthe largest signal was observed after 11 h of digestion, manysamples were run for closer to 16 h for convenience. It has beenreported that the addition of organic solvent to the trypsindigestion buffer may lead to greater yields for somepeptides;22,23 however, addition of 10% acetonitrile into thedigestion solution did not show any effect.
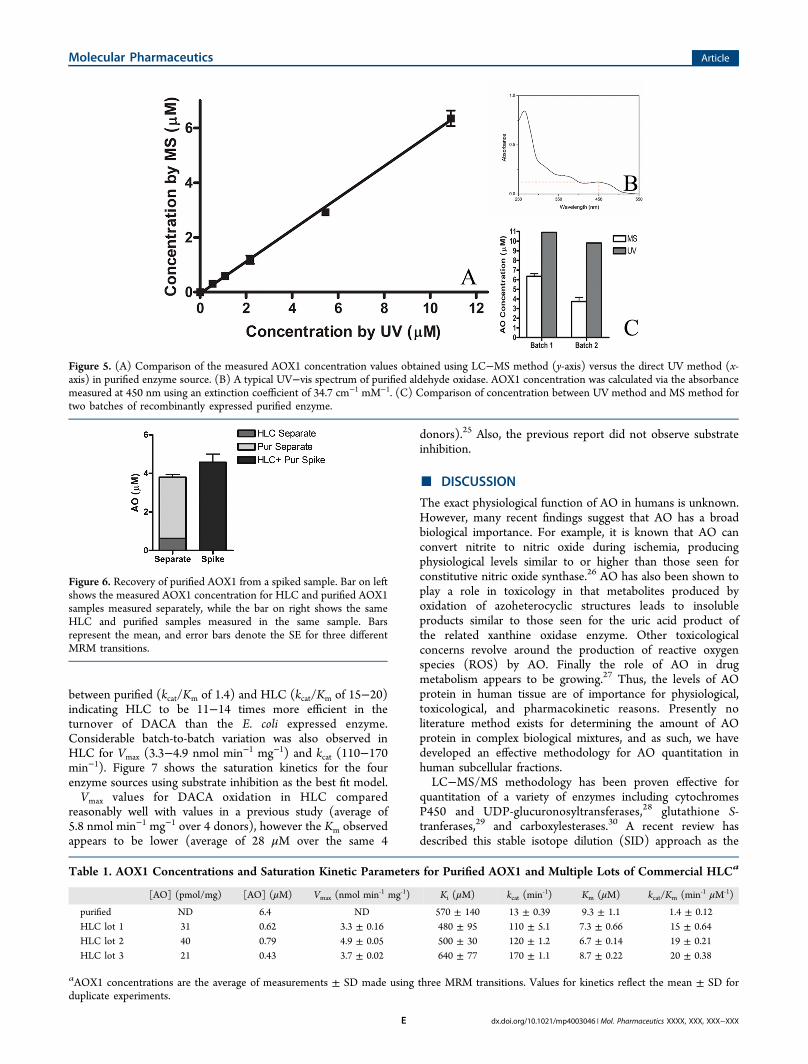
Purified Enzyme Curve. Purified AO was diluted, digested,and analyzed for AO content. Figure 5B shows a typical UVspectra of purified AO. Determination of enzyme purity bysodium dodecylsulfate-polyagarose gel electrophoresis (SDS-PAGE) is challenging for AO due to the presence ofdegradation products of the enzyme that are formed underthe reductive conditions of the method. However, a simplermethod for estimating AO purity involves the comparison ofthe UV absorbance at 450 nm to the absorbance at 280 nm,effectively comparing the UV absorption of flavin to theabsorption of bulk protein. Generally a value of 4−6 isindicative of a highly pure enzyme source.15,24 For both batchesof recombinant enzyme, the 280:450 nm absorbance ratio wasapproximately 5, indicating a highly pure sample.Figure 5A compares the concentration of AO measured by
the MS assay versus calculated AO content by the UV450 assay.Linearity across a wide concentration range was observed (r2 =0.99). Figure 5C shows the comparison of the UV assay versusthe MS assay for two different purified enzyme preparations. Ingeneral, the average MS measurement was approximately 40−60% of the corresponding UV measurement, depending on thebatch. It should also be noted that UV quantitation is onlyviable in a highly purified system, as any UV spectra in acomplex matrix would have too much interference.
Validation of Quantification. In order to demonstrate thevalidity of the assay in a complex sample matrix, a spikingexperiment was performed. Figure 6 shows the comparison ofHLC and purified measured individually (left) versus HLC andpurified enzyme in the same sample (right). The graphillustrates that the recovered yield for the spiked sample wasquantitative.Undigested human liver cytosol and digested guinea pig liver
cytosol were used as negative controls, and no analyte peak wasobserved (data not shown). Guinea pig cytosol was selected asan appropriate negative control as it contains AOX1, but thepeptide sequence differs in the region that was used for humanAO quantification (EIDQTPYK for the human AOX1 sequenceand GTEQTHYG for the corresponding region of the alignedguinea pig AOX1 sequence).
Determination of Method Detection Limit. Themethod detection limit (MDL) was calculated using a multipleinjection method as described in detail in the ExperimentalProcedures. The standard deviation in peak area of thechromatogram traces over five injections was used to calculatea MDL. Using the least sensitive MRM transition and therebyproviding a conservative estimate, the MDL was determined tobe 22 nM. However, when the most sensitive MRM transitionis used for this analysis, the MDL is 6 nM.
Enzyme Kinetics. Steady-state enzyme kinetics usingpurified AOX1 and 3 different pooled HLC batches wereperformed with DACA as the probe substrate. Table 1 showsthe kinetic parameters for all enzyme sources. As one mightpredict, Km was nearly identical between sources. However, alarge difference in kcat, and thus kcat/Km, values was observed,
Figure 3. HPLC−ESI-MS/MS chromatogram for purified AOX1(native) and IS peptides after trypsin digestion. Three differentfragmentation patterns for each peptide were monitored simulta-neously using MRM mode: 500.1/202.3 (IS 1), 500.1/220.6 (IS 2),500.1/231.0 (IS 3), 497.1/196.9 (Native 1), 497.1/214.7 (Native 2),and 497.1/224.7 (Native 3).
Figure 4. (A) Normalized peak area for each monitored MRMtransition. Maximum peak areas were observed at 11 for 5 out of 6MRM transitions. (B) Effect of trypsin digestion time on absoluteAOX1 concentration for a HLC sample. Bars represent the mean, anderror bars denote the SE for three different MRM transitions.
Molecular Pharmaceutics Article
dx.doi.org/10.1021/mp4003046 | Mol. Pharmaceutics XXXX, XXX, XXX−XXXD
between purified (kcat/Km of 1.4) and HLC (kcat/Km of 15−20)indicating HLC to be 11−14 times more efficient in theturnover of DACA than the E. coli expressed enzyme.Considerable batch-to-batch variation was also observed inHLC for Vmax (3.3−4.9 nmol min−1 mg−1) and kcat (110−170min−1). Figure 7 shows the saturation kinetics for the fourenzyme sources using substrate inhibition as the best fit model.Vmax values for DACA oxidation in HLC compared
reasonably well with values in a previous study (average of5.8 nmol min−1 mg−1 over 4 donors), however the Km observedappears to be lower (average of 28 μM over the same 4
donors).25 Also, the previous report did not observe substrateinhibition.
■ DISCUSSION
The exact physiological function of AO in humans is unknown.However, many recent findings suggest that AO has a broadbiological importance. For example, it is known that AO canconvert nitrite to nitric oxide during ischemia, producingphysiological levels similar to or higher than those seen forconstitutive nitric oxide synthase.26 AO has also been shown toplay a role in toxicology in that metabolites produced byoxidation of azoheterocyclic structures leads to insolubleproducts similar to those seen for the uric acid product ofthe related xanthine oxidase enzyme. Other toxicologicalconcerns revolve around the production of reactive oxygenspecies (ROS) by AO. Finally the role of AO in drugmetabolism appears to be growing.27 Thus, the levels of AOprotein in human tissue are of importance for physiological,toxicological, and pharmacokinetic reasons. Presently noliterature method exists for determining the amount of AOprotein in complex biological mixtures, and as such, we havedeveloped an effective methodology for AO quantitation inhuman subcellular fractions.LC−MS/MS methodology has been proven effective for
quantitation of a variety of enzymes including cytochromesP450 and UDP-glucuronosyltransferases,28 glutathione S-tranferases,29 and carboxylesterases.30 A recent review hasdescribed this stable isotope dilution (SID) approach as the
Figure 5. (A) Comparison of the measured AOX1 concentration values obtained using LC−MS method (y-axis) versus the direct UV method (x-axis) in purified enzyme source. (B) A typical UV−vis spectrum of purified aldehyde oxidase. AOX1 concentration was calculated via the absorbancemeasured at 450 nm using an extinction coefficient of 34.7 cm−1 mM−1. (C) Comparison of concentration between UV method and MS method fortwo batches of recombinantly expressed purified enzyme.
Figure 6. Recovery of purified AOX1 from a spiked sample. Bar on leftshows the measured AOX1 concentration for HLC and purified AOX1samples measured separately, while the bar on right shows the sameHLC and purified samples measured in the same sample. Barsrepresent the mean, and error bars denote the SE for three differentMRM transitions.
Table 1. AOX1 Concentrations and Saturation Kinetic Parameters for Purified AOX1 and Multiple Lots of Commercial HLCa
[AO] (pmol/mg) [AO] (μM) Vmax (nmol min‑1 mg‑1) Ki (μM) kcat (min‑1) Km (μM) kcat/Km (min‑1 μM‑1)
purified ND 6.4 ND 570 ± 140 13 ± 0.39 9.3 ± 1.1 1.4 ± 0.12HLC lot 1 31 0.62 3.3 ± 0.16 480 ± 95 110 ± 5.1 7.3 ± 0.66 15 ± 0.64HLC lot 2 40 0.79 4.9 ± 0.05 500 ± 30 120 ± 1.2 6.7 ± 0.14 19 ± 0.21HLC lot 3 21 0.43 3.7 ± 0.02 640 ± 77 170 ± 1.1 8.7 ± 0.22 20 ± 0.38
aAOX1 concentrations are the average of measurements ± SD made using three MRM transitions. Values for kinetics reflect the mean ± SD forduplicate experiments.
Molecular Pharmaceutics Article
dx.doi.org/10.1021/mp4003046 | Mol. Pharmaceutics XXXX, XXX, XXX−XXXE

gold standard in quantitation of proteins by MS.31 Herein, wehave applied this technique to develop a rapid, selective, androbust method achieving absolute AO quantitation. Themethod exhibits a linear signal response over a wide range ofanalyte concentration, as well as being highly specific for thepeptides of interest in a complex sample matrix. Of the threebatches tested, the lowest observed AOX1 concentration inHLC was 430 nM, which was approximately 20 times themethod detection limit (6−22 nM). Given the low MDL,researchers should be able to adapt this method in other tissueswith lower levels of AO than human liver cytosol.One important distinction in the approach within this paper
compared to other literature methods is that the IS peptide isadded to the solution and digested alongside the native proteinsrather than being added post digestion. Figure 4a shows thatdigestion with trypsin releases free peptides in a time-dependent way, and after a certain point, degradation of thesample begins. However, the curve also shows that trypsindigests both IS and native peptides without bias. In otherwords, trypsin cleaves (and other processes degrade) thesmaller IS peptide at the same rate as the native peptide iscleaved from AO protein. As a result, the error in absolutequantitation due to incomplete digestion or overdigestion islargely mitigated in this study.As a way to verify our method, we quantified purified
recombinant AO using both the MS assay and the UV450detection assay. Figure 5a shows a linear relationship (r2 =0.99) between methods across a wide concentration range.However, it was found that the UV results were 1.7−2.5-foldhigher than the results of the MS method. The exact reason forthe discrepancy is unclear; however, it may be due to thepresence of background absorbance in the UV assay causing ahigh reading. Given the relative imprecision of UV in general,
an agreement within 2-fold provided us with confidence in ourmethod.Measuring the absolute AO concentration in HLC has
allowed a kcat value to be calculated for the first time using anunpurified native enzyme source. These kcat values allow for adirect comparison between enzyme sources such as E. coliexpressed enzymes or AO produced by cell culture with thenative enzyme and native liver enzyme. This is important sinceAO has 4 different cofactors and depends on a number ofenzymes to produce an active enzyme,15 and it is expected thatoverexpression might lead to lower levels of active enzymerelative to total protein. The kcat values for DACA in purifiedAO are 13 min−1, while those for the native enzyme are 170min−1. Thus while the Km values are the same, the relative kcat/Km values indicate that the efficiency of AO in HLC isapproximately 15 times greater than that of purified. This islikely explained by incomplete MoCo incorporation, sulfuriza-tion, iron incorporation, and dimerization of the protein as it isexpressed in E. coli cells. One enzyme in particular, MoCosulfurase, plays a crucial role in modifying AO into its fullyactive form in humans. This enzyme incorporates a terminalsulfido ligand to the MoCo of both XO and AO, allowing for afunctional enzyme. Clearly, some native sulfurase is present inthe E. coli (TP-1000 cells), but the extent of sulfurincorporation is around a modest 30%.15 Attempts byHartmann and co-workers were made to increase overallenzyme activity by coexpressing human MoCo sulfurase alongwith AO but have proved unsuccessful. Although recentprogress has been made, it seems there still exists anopportunity for further optimization of the heterologousexpression of AO.It is widely understood that some HLC preparations and
hepatocytes show differing levels of enzyme activity. The originof this difference is not understood and could be related todifferent preparation methods, enzyme denaturation, ordesulfurization of the MoCo. Thus, a method to normalizeprotein levels will answer some of these questions and lead tomore consistent comparisons of AO activities between differentlaboratories. Furthermore, it is not known if AO protein levelsare under any translational regulatory control in humans,although adiponectin levels may play a role.3 This methodologywill allow for the determination of absolute AO levels acrosspopulations and may lead to an understanding of theimportance of translational control on the protein levels ofAO. As a proof of concept the difference in AO protein levelsbetween various batches of human liver cytosol weredetermined. To that end, three different cytosol batches wereanalyzed for AO content (Table 1), and the variation betweenbatches was found to be 21−40 pmol AOX1/mg total protein.Linear regression analysis for this small data set (n = 3) showeda slight correlation between AOX1 levels and Vmax (r
2 = 0.48).It is possible that a contributing factor to variation in HLCbatches may be differences in preparation, storage, andhandling. One study suggests that AOX1 activity may declinerapidly with storage or in post-mortem tissues.32 Also, theeffects of buffer components, homogenization techniques, etc.in the preparation of liver cytosol may have some effect onactivity. However, since the cytosol batches used in the currentstudy came from the same vendor, most of these effects shouldbe small. Further controlled studies may be beneficial tounderstand these effects, as the stability of the enzyme incytosol under various conditions has not been explored.
Figure 7. Kinetic plots for multiple enzyme sources. Saturation plotsfor DACA oxidation in purified enzyme (top) and three batches ofhuman liver cytosol (bottom) are shown. Such that all enzymes couldbe compared, kcat versus substrate concentration is shown. Substrateinhibition was found to be the best fit model of the data. Pointsrepresent the mean, and error bars show the SE for duplicatemeasurements.
Molecular Pharmaceutics Article
dx.doi.org/10.1021/mp4003046 | Mol. Pharmaceutics XXXX, XXX, XXX−XXXF

Quantitation of AO protein should enable the advancementof AO research on multiple fronts. To date the tissuedistribution of AO has not been determined at the proteinlevel, and what is known depends solely on mRNA levels indifferent tissues.14 Identifying the AO tissue distribution mayprovide insight leading toward the understanding of thephysiological role of AO in humans. Additionally, quantifyingprotein levels in extrahepatic tissues may lead to betterphysiologically based pharmacokinetic (PBPK) models forAO, as it has been suggested that extrahepatic AO metabolismmay explain extremely high clearance values (ie. exceedinghepatic blood flow) for some compounds found in theliterature.16,33,34 Understanding the extrapolation of one invitro AO source to another (e.g., recombinant AOX1 tocytosol) may also aid in pharmacokinetic model development.Finally, this MS approach may also be extended to quantitationof AO in other species. The particular peptide used in this studyshares 100% sequence identity with a number of differentspecies including cow, horse, and various types of monkeys.This may contribute to the further understanding ofinterspecies differences in AO function and activity.In conclusion, we have developed a highly selective, robust
method for the quantification of AOX1 in HLC using a trypsindigest followed by LC−MS/MS analysis. The equipmentneeded is readily available in most laboratories and does notrequire access to purified enzyme. Knowing the absolute AOconcentration, we were able to measure kcat in HLC, which isapproximately 15 times greater than E. coli expressed purifiedenzyme. Different commercial HLC lots prepared from thesame vendor show variations in AO content by as much as 2fold, and a modest correlation between AO concentration andVmax was observed. This method may help explain donor todonor variation in AO activity, as well as provide a means toscale between different in vitro enzyme sources (e.g.,recombinant AOX1 to cytosol). In addition, this approachmay be extended to other species and tissue types, leading tothe development of physiologically based pharmacokineticmodels and further investigation of the biochemical functionsof this enzyme.
■ AUTHOR INFORMATION
Corresponding Author*Phone: 509 592-8790. E-mail: [email protected].
NotesThe authors declare no competing financial interest.
■ ACKNOWLEDGMENTS
This work was supported by the National Institutes of HealthNational Institute of General Medical Sciences grantGM100874.
■ ABBREVIATIONS
AO, aldehyde oxidase; AOX1, human aldehyde oxidased;MoCo, molybdenum cofactor; ROS, reactive oxygen species;DACA, N-[(2-dimethylamino)ethyl]acridine-4-carboxamide;HPLC, high performance liquid chromatography; MS, massspectrometry; ESI, electrospray ionization; IS, internal stand-ard; MDL, method detection limit; PBPK, physiologically basedpharmacokinetic; SDS-PAGE, sodium dodecylsulfate-polyagar-ose gel electrophoresis
■ REFERENCES(1) Garattini, E.; Mendel, R.; Romao, M. J.; Wright, R.; Terao, M.Mammalian molybdo-flavoenzymes, an expanding family of proteins:structure, genetics, regulation, function and pathophysiology. Biochem.J. 2003, 372 (Pt 1), 15−32.(2) Weigert, J.; Neumeier, M.; Bauer, S.; Mages, W.; Schnitzbauer, A.A.; Obed, A.; Groschl, B.; Hartmann, A.; Schaffler, A.; Aslanidis, C.;Scholmerich, J.; Buechler, C. Small-interference RNA-mediated knock-down of aldehyde oxidase 1 in 3T3-L1 cells impairs adipogenesis andadiponectin release. FEBS Lett. 2008, 582 (19), 2965−72.(3) Neumeier, M.; Weigert, J.; Schaffler, A.; Weiss, T. S.; Schmidl, C.;Buttner, R.; Bollheimer, C.; Aslanidis, C.; Scholmerich, J.; Buechler, C.Aldehyde oxidase 1 is highly abundant in hepatic steatosis and isdownregulated by adiponectin and fenofibric acid in hepatocytes invitro. Biochem. Biophys. Res. Commun. 2006, 350 (3), 731−5.(4) Polyzos, S. A.; Kountouras, J.; Zavos, C. The multi-hit processand the antagonistic roles of tumor necrosis factor-alpha andadiponectin in non alcoholic fatty liver disease. Hippokratia 2009, 13(2), 127 and author reply 128.(5) Ambroziak, W.; Izaguirre, G.; Pietruszko, R. Metabolism ofretinaldehyde and other aldehydes in soluble extracts of human liverand kidney. J. Biol. Chem. 1999, 274 (47), 33366−73.(6) Schwartz, R.; Kjeldgaard, N. O. The enzymic oxidation ofpyridoxal by liver aldehyde oxidase. Biochem. J. 1951, 48 (3), 333−7.(7) Kundu, T. K.; Velayutham, M.; Zweier, J. L. Aldehyde oxidasefunctions as a superoxide generating NADH oxidase: an importantredox regulated pathway of cellular oxygen radical formation.Biochemistry 2012, 51 (13), 2930−9.(8) Berger, R.; Mezey, E.; Clancy, K. P.; Harta, G.; Wright, R. M.;Repine, J. E.; Brown, R. H.; Brownstein, M.; Patterson, D. Analysis ofaldehyde oxidase and xanthine dehydrogenase/oxidase as possiblecandidate genes for autosomal recessive familial amyotrophic lateralsclerosis. Somatic Cell Mol. Genet. 1995, 21 (2), 121−31.(9) Shaw, S.; Jayatilleke, E. Ethanol-induced iron mobilization: role ofacetaldehyde-aldehyde oxidase generated superoxide. Free RadicalsBiol. Med 1990, 9 (1), 11−7.(10) Ali, S.; Pawa, S.; Naime, M.; Prasad, R.; Ahmad, T.; Farooqui,H.; Zafar, H. Role of mammalian cytosolic molybdenum Fe-S flavinhydroxylases in hepatic injury. Life Sci. 2008, 82 (13−14), 780−8.(11) Akabane, T.; Tanaka, K.; Irie, M.; Terashita, S.; Teramura, T.Case report of extensive metabolism by aldehyde oxidase in humans:pharmacokinetics and metabolite profile of FK3453 in rats, dogs, andhumans. Xenobiotica 2011, 41 (5), 372−84.(12) Diamond, S.; Boer, J.; Maduskuie, T. P., Jr.; Falahatpisheh, N.;Li, Y.; Yeleswaram, S. Species-specific metabolism of SGX523 byaldehyde oxidase and the toxicological implications. Drug Metab.Dispos. 2010, 38 (8), 1277−85.(13) Zhang, X.; Liu, H. H.; Weller, P.; Zheng, M.; Tao, W.; Wang, J.;Liao, G.; Monshouwer, M.; Peltz, G. In silico and in vitropharmacogenetics: aldehyde oxidase rapidly metabolizes a p38 kinaseinhibitor. Pharmacogenomics J. 2011, 11 (1), 15−24.(14) Garattini, E.; Terao, M. Increasing recognition of theimportance of aldehyde oxidase in drug development and discovery.Drug Metab. Rev. 2011, 43 (3), 374−86.(15) Hartmann, T.; Terao, M.; Garattini, E.; Teutloff, C.; Alfaro, J. F.;Jones, J. P.; Leimkuhler, S. The impact of single nucleotidepolymorphisms on human aldehyde oxidase. Drug Metab. Dispos.2012, 40 (5), 856−64.(16) Hutzler, J. M.; Yang, Y. S.; Albaugh, D.; Fullenwider, C. L.;Schmenk, J.; Fisher, M. B. Characterization of aldehyde oxidaseenzyme activity in cryopreserved human hepatocytes. Drug Metab.Dispos. 2012, 40 (2), 267−75.(17) Alfaro, J. F.; Joswig-Jones, C. A.; Ouyang, W.; Nichols, J.;Crouch, G. J.; Jones, J. P. Purification and mechanism of humanaldehyde oxidase expressed in Escherichia coli. Drug Metab. Dispos.2009, 37 (12), 2393−8.(18) Barr, J. T.; Jones, J. P. Evidence for substrate-dependentinhibition profiles for human liver aldehyde oxidase. Drug Metab.Dispos. 2013, 41 (1), 24−9.
Molecular Pharmaceutics Article
dx.doi.org/10.1021/mp4003046 | Mol. Pharmaceutics XXXX, XXX, XXX−XXXG
(19) Palmer, T.; Santini, C. L.; Iobbi-Nivol, C.; Eaves, D. J.; Boxer, D.H.; Giordano, G. Involvement of the narJ and mob gene products indistinct steps in the biosynthesis of the molybdoenzyme nitratereductase in Escherichia coli. Mol. Microbiol. 1996, 20 (4), 875−84.(20) Branzoli, U.; Massey, V. Preparation of aldehyde oxidase in itsnative and deflavo forms. Comparison of spectroscopic and catalyticproperties. J. Biol. Chem. 1974, 249 (14), 4339−45.(21) Wells, G.; Prest, H.; Russ, C. W. Signal, Noise, and DetectionLimits in Mass Spectrometry; Agilent Technologies: Wilmington, DE,2011; Technical Note, Publication 5990-7651EN.(22) Miliotis, T.; Ali, L.; Palm, J. E.; Lundqvist, A. J.; Ahnoff, M.;Andersson, T. B.; Hilgendorf, C. Development of a highly sensitivemethod using liquid chromatography-multiple reaction monitoring toquantify membrane P-glycoprotein in biological matrices and relation-ship to transport function. Drug Metab. Dispos. 2011, 39 (12), 2440−9.(23) Strader, M. B.; Tabb, D. L.; Hervey, W. J.; Pan, C.; Hurst, G. B.Efficient and specific trypsin digestion of microgram to nanogramquantities of proteins in organic-aqueous solvent systems. Anal. Chem.2006, 78 (1), 125−34.(24) Stell, J. G.; Warne, A. J.; Lee-Woolley, C. Purification of rabbitliver aldehyde oxidase by affinity chromatography on benzamidinesepharose 6B. J. Chromatogr. 1989, 475, 363−72.(25) Schofield, P. C.; Robertson, I. G.; Paxton, J. W. Inter-speciesvariation in the metabolism and inhibition of N-[(2′-dimethylamino)-ethyl]acridine-4-carboxamide (DACA) by aldehyde oxidase. Biochem.Pharmacol. 2000, 59 (2), 161−5.(26) Li, H.; Kundu, T. K.; Zweier, J. L. Characterization of themagnitude and mechanism of aldehyde oxidase-mediated nitric oxideproduction from nitrite. J. Biol. Chem. 2009, 284 (49), 33850−8.(27) Pryde, D. C.; Dalvie, D.; Hu, Q.; Jones, P.; Obach, R. S.; Tran,T. D. Aldehyde oxidase: an enzyme of emerging importance in drugdiscovery. J. Med. Chem. 2010, 53 (24), 8441−60.(28) Ohtsuki, S.; Schaefer, O.; Kawakami, H.; Inoue, T.; Liehner, S.;Saito, A.; Ishiguro, N.; Kishimoto, W.; Ludwig-Schwellinger, E.; Ebner,T.; Terasaki, T. Simultaneous absolute protein quantification oftransporters, cytochromes P450, and UDP-glucuronosyltransferases asa novel approach for the characterization of individual human liver:comparison with mRNA levels and activities. Drug Metab. Dispos.2012, 40 (1), 83−92.(29) Zhang, F.; Bartels, M. J.; Stott, W. T. Quantitation of humanglutathione S-transferases in complex matrices by liquid chromatog-raphy/tandem mass spectrometry with signature peptides. RapidCommun. Mass Spectrom. 2004, 18 (4), 491−8.(30) Sato, Y.; Miyashita, A.; Iwatsubo, T.; Usui, T. Simultaneousabsolute protein quantification of carboxylesterases 1 and 2 in humanliver tissue fractions using liquid chromatography-tandem massspectrometry. Drug Metab. Dispos. 2012, 40 (7), 1389−96.(31) Liebler, D. C.; Zimmerman, L. J. Targeted quantitation ofproteins by mass spectrometry. Biochemistry 2013, 52 (22), 3797−806.(32) Duley, J. A.; Harris, O.; Holmes, R. S. Analysis of humanalcohol- and aldehyde-metabolizing isozymes by electrophoresis andisoelectric focusing. Alcohol.: Clin. Exp. Res. 1985, 9 (3), 263−71.(33) Zientek, M.; Jiang, Y.; Youdim, K.; Obach, R. S. In vitro-in vivocorrelation for intrinsic clearance for drugs metabolized by humanaldehyde oxidase. Drug Metab. Dispos. 2010, 38 (8), 1322−7.(34) Jones, J. P.; Korzekwa, K. R. Predicting intrinsic clearance fordrugs and drug candidates metabolized by aldehyde oxidase. Mol.Pharm. 2013, 10 (4), 1262−8.
Molecular Pharmaceutics Article
dx.doi.org/10.1021/mp4003046 | Mol. Pharmaceutics XXXX, XXX, XXX−XXXH