Absolute isotopic abundance ratios of common, equal … · whi-ch cover the usual range of natural...
7
JOURNAL OF RESEARCH of the National Bureau of Standards-A. Physics and Chemistry Vol. 72A, No.3, May- June 1968 Absolute Isotopic Abundance Ratios of Common, Equal-Atom, and Radiogenic Lead Isotopic Standards E. J. Catanzaro, T. J. Murphy, W. R. Shields, and E. L. Garner > Institute for Materials Research, National Bureau of Standards, Washington, D.C. 20234 (February 28, 1968) \ . Abso lute valu es have been obtained the iSQ, top ic a bundan ce ratios of common, eq ual·atom , and rad,oge lll c lea d ,so tOP' C s tandard s usmg sohd·sample mass spectrometry. Samp les of known 2°' Pbj206Pb ra tI o, prepared from near ly pure se parat ed 206P b and 208P b solutions, were used to calibrate th e mass spec trometers. Key Words: Absolute ratios, abundance , isotopic s tandard s, lead. 1. Introduction Th e NBS is co ndu c ting a long·t erm program of absolute isoto pi c ab und ance ratio and physical atomic • we ig ht dete rmination s, using solid· sa mple ma ss spec trom e try. Previous eleme nt s s tudi ed includ e silver [Il,' c hlorin e [2J , copp er [3], bromine [4l, c hromium [5J , and ma gn es ium [6J. Th e prese nt work extends the s tud y to l ea d. Th e ex tr eme isotopic variability of natural lea d is 'we ll authenticated. It r es ults from th e fa c t that 20H Pb , 207 Pb , and 20sPb ar e continually being form ed by the d ecay of2 3S U, 235U, and 232 Th , r es pec tively. 204P b is non ra di oge ni c and is use d as a fidu c iar y mark for th e of the "co mmon" and "radiogenic" portions of natural l ea d samp les. A full discussion of natural lea d isotope abundance variations is given by Russell and Farquhar [71. Th e purpose of th e pr ese nt s tudy was to establish the absolute isotop ic co m po s iti ons of thr ee le ad standards whi-ch cover the usual ran ge of natural isotopic valu es, so that a ll futur e lea d isotope measurements could be put on an abso lut e sca le. Previous meas ur eme nts , by num e rous l aboratories throu ghout the world, could only be co nsider ed relative b eca use there has b ee n no ... systema ti c atte mpt to calibr ate ins trum e nt s and t ec hniqu es. In addition , the BS s tandard sa mpl es, whi c h are di s tribut e cl for a relatively nominal fee (see append ix), are very hi gh purity lea d me tal and ma y also be use d as gravi metric sta ndard s. .A prelim in ary study, which was con ce rned only . wllh the det er mination of the ab solute i sotop ic co m- I Figure s in br ackets indicate the lit era tur e rde rences at the end of this pape r. positions of three common lea d s ampl es used as re fer en ces by geochem ist s, ha s alr ea dy b ee n published [8]. Th e ma ss spec trom eters use d in thi s s tudy were ca librat ed for bia s by th e u se of sa mpl es of known 2os Pbpo6 Pb ratio pr e pared from n ea rly pur e sepa rat ed 206 Pb a nd 20sPb solutions. Th e coll ec tor and r eco rd er sys te ms u se d in this lab oratory have b ee n d es igned so that a ny bia ses th ey mi ght co ntribut e are cons tant. Th e only " random" bias a ssoc iated with the isotopic ratio meas ur ements is du e to th e ma ss -d epende nt fractionation of the iso top es durin g ionization, and this bias is indep ende nt of the isotopic composition of the sa mpl es . Thu s, for each ins trum e ntal sys tem used in this study, a single e xperim entally dete rmined cor- rection factor is valid over the ent ire range of isotopic co mpositions measured. The fact that each mass spectrometer us ed in thi s study requires only a single correc tion factor for source disc rimination ha s been proven by numerous systems calibration s performed mainly with a series of uranium- iso tope standards (see app endix) , with 235Uj238U ratios ranging from 1/20 to 20/1. A "sys tem s" ca libration , as opposed to a "poin t" c alibration in which only one isotopic ratio s tandard is used, is alway s necess ary for an ins trum e nt which is to be used on an element with more than one isotopic ratio . In this laboratory a uranium-isotope systems ca libration is performed on each ins trum e nt as soon as it is co mplet e d, or modi- fi ed, and before it is ever use d in a research project. In add iti on, whenever feasible , a partial systems calibration is also perform ed with widely differing isoto pi c s tandard s of the ele ment under study. For e xampl e, partial systems c alibrations have been pe rform ed with copper [31 and magnesium [6]. In the 261
Transcript of Absolute isotopic abundance ratios of common, equal … · whi-ch cover the usual range of natural...
JOURNAL OF RESEARCH of the National Bureau of Standards-A. Physics and Chemistry
Vol. 72A, No.3, May- June 1968
Absolute Isotopic Abundance Ratios of Common, Equal-Atom,
and Radiogenic Lead Isotopic Standards
E. J. Catanzaro, T. J. Murphy, W. R. Shields, and E. L. Garner
> Institute for Materials Research, National Bureau of Standards, Washington, D.C. 20234
(February 28, 1968)
\
. Abso lute values have been obtaine d fo~ the iSQ,topic abundance ratios of common , eq ual·atom , and rad,oge lllc lead ,sotOP'C s tandards usmg sohd·sample mass spectrometry. Samples of known 2°'Pbj206Pb ratIo, prepared from nearly pure separated 206Pb and 208Pb so lutions , were used to calibrate the mass s pectromete rs.
Key Words: Absolute ratios, abundance, isotopic standards, lead.
1. Introduction
Th e NBS is co nducting a long·te rm program of absolute iso topi c ab undance ratio a nd physical atomic
• we ight de termination s, us ing solid·sample mass spectrome try. Pre vious ele ments studied include s ilver [Il,' c hlorin e [2J , co pper [3], bromin e [4l, chromium [5J , and magnesium [6J. The prese nt work ex te nds the stud y to lead.
The ex tre me isotopi c variability of natural lead is 'well authenticated. It res ults from th e fac t that
~ 20HPb , 207 Pb , and 20sPb are continuall y bein g formed by the decay of23SU, 235U, and 232 Th , res pectively. 204Pb is non ra dioge nic and is used as a fiduciary mark for the s~parati o n of the "common" and "radiogenic" portions of natural lead samples. A full discussion of natural lead isotope abundance variations is given by Russell and Farquhar [71.
Th e purpose of the present s tudy was to establish the absolute iso topic co m positions of three lead standards whi-c h cover the usual range of natural isotopi c values, so that a ll future lead isotope meas ure me nts could be put on an absolute scale. Pre vious measure ments , by nume rous laboratories throu ghout the world , could only be co nsidered relative because there has bee n no
... syste mati c attempt to calibrate ins trume nts and techniques.
In addition , th e BS standard sa mples, whi ch are di s tributecl for a relatively nominal fee (see appendix), are very high purity lea d metal and may also be used as gravi metri c sta ndards .
.A prelim in ary s tud y, whi c h was concerned only . wllh the de termination of the absolute isotopic co m-
I Figures in brackets indi cate the lit era ture rderences a t the end of thi s paper.
positions of three common lead s amples used as refere nces by geochemis ts, has already been published [8].
The mass s pectrometers used in thi s s tudy we re calibrated for bias by the use of samples of known 2osPbpo6Pb ratio pre pared from nearly pure separated 206Pb a nd 20sPb solutions. The collector and recorder syste ms used in thi s laboratory have been des igned so that a ny biases they mi ght co ntribute are constant. The only " random" bias associated with the isotopic ratio measure me nts is due to th e mass -de pe nd e nt fractionation of the isotopes during ionization , and this bias is indepe ndent of the isotopic co mposition of the samples. Thu s, for each in s trume ntal system used in this study, a single experimentally de termined correction factor is valid over the entire range of isotopic co mpositions measured.
The fact that each mass spectrometer used in thi s study requires only a single correction factor for source discrimination has been proven by numerous systems calibrations performed mainly with a series of uraniumisotope standards (see appendix) , with 235Uj238U ratios ranging from 1/20 to 20/1. A "systems" calibration , as opposed to a "point" calibration in whic h only one iso topi c ratio s tandard is used, is always necessary for an ins trume nt which is to be used on an element with more than one isotopic ratio. In thi s laboratory a uranium-iso tope systems calibration is performed on each ins trume nt as soon as it is co mpleted, or modifi ed , and before it is ever used in a research project. In addition, whenever feasible , a partial systems calibration is also performed with widely differing iso topi c s tandards of the ele ment under study. For example, partial systems calibrations have been performed with copper [31 and magnesium [6]. In the
261

present study the systems calibration was rechecked and verified by comparing the results for calibration mixes with 2osPb/206Pb = 1.0 and 208PbposPb = 2.1. It is not practicable to prepare standards of more than two isotopes, because the propagation of isotopic composition uncertainty involved in mixing more than two isotope solutions would greatly decrease the accuracy of the calculated ratios.
2. Experimental Procedure
2.1. Mass Spectrometry
Isotopic measurements of the calibration mixes and standard samples were made with three different single-stage solid-sample mass spectrometers. Two instruments (#1 and #3), used by operator I, are identical in all aspects and the third (#2), used by operator II, differed only in that it has an in-line beam valve on the tube. All three instruments have a 12-in radius of curvature 68° ar • .llyzer tube and 60° sector magnet, and all three have Z-lenses in the source assembly [9J. Triple-filament sources were us~d; with rheniumribbon (1 X 30 mil) sample filaments and a platinumribbon (1 X.30 mil) ionizing filament [10].
The samples were prepared to a concentration of 25 mg of Pb per milliliter of 2 percent HN03 , and were mounted on the sample filaments by mixing, on the filaments, one drop each of the sample solution ( ~ 250 j.Lg Pb) and of a 10 percent NH40H solution. The precipitated Pb(OH)2 was dried with a heat lamp and a 1.2 A current (5 min). The mass spectrometric analysis was begun when the tube pressure was < 1 X 10- 7 torr. An accelerating voltage of 10 k V was used and no memory or background signals were ever noted. Source assemblies were dismantled and cleaned between the analyses of the different groups of samples with widely differing isotopic compositions. A detailed description of the mass spectrometric procedure is given by Catanzaro [8].
A small amount of isotopic fractionation generally occurs during an analy~s; the 2osPb/206Pb ratio generally increases by about 0.03 percent during the datataking period of an analysis (24 min). To minimize the effect of this fractionation, all analyses were made in an identical mann~r; data were always taken during the sar:1e time interval , and the total lead ion signal was always kept within strict limits (3 to 5 X 10- 11 A).
2.2. Preparation of the Separated Lead Isotope Solutions
Approximately 2 g each of electromagnetically separated lead isotopes, 206 Pb and 2osPb , in the form of lead nitrate, Pb(N03)z, were obtained from the Isotopes Division, Oak Ridge National Laboratory of the Union Carbide Nuclear Company. The 20SPb(N03h was designated series JV, sample 11 86(,z); and the 20SPb(N03)z was designated series MA, sample 1456(a). The certificate of analysis accompanying each sam;Jle indicated a high degree of chemical purity. These samples were further analyzed by the Spectrochemical Analysis Section at the National Bureau of Standards
by quantltlatlve emISSIOn spectrography. The results of the analyses are shown in table 1. Since the lead concentrations of solutions of the lead isotopes were to ~ be determined by a method based on the precipitation of lead chromate (PbCr04) only those elements forming relatively insoluble chromates would cause errors in the determinations. These were the elements for which quantitative values or limits of detection were established. It was estimated that the maximum possible contamination of the lead isotope samples ,I would be 0.002 percent for the 20sPb isotope and 0.004 percent for the 20sPb isotope based on the sum of amounts of the detected elements and limits of detection for the others. These concentrations were too low to cause significant error in the lead determinations so it was not necessary to further purify the isotope samples. -<.
TABLE 1. Results of spectrochemical analy· sis of lead isotope samples
Quantitative (with standards) determinations of concentrations
Estimated Element ,o8Pb limits of
detection
ppm ppm Ag... ... .... < 1 15 Ha ..................................... . Hi .. . ................................... . Cu.......... < 1 < 1 Hg ..... ....... ...... ... ......... . ... ... . Tl... ............ ................ .... ... . Zn ................... ........... ....... .
ppm < 0.1
1 1
< 0.1 < 10
5 1
NOTES: ... , not detected ; < , less than.
Solutions of each separated lead isotope were pre- Y
pared as follows: the lead isotope as lead nitrate (about 3.1 g) was dissolved in about 20 ml of water and 1 ml of ultrapure grade nitric acid was added to this solution. The resulting solution was filtered and the filtrate was transferred to a 100 ml volumetric flask whose neck had been cut off so that only about 1 cm remained. Enough water was added to bring the final volume to J
about 65 m!. The solution was thoroughly mixed by swirling for several minutes and the flask was sealed with a rubber serum septum. (The total weight of the flask , solution , and septum was kept below 100 g so that a semimicro balance could be used for weighings.)
The two solutions prepared in this manner were designated " Pb 206" solution and "Pb 208" solution, 'f
respectively.
2.3. Lead Concentration of the Separated Isotope Solutions
A search of the chemical literature has shown that there is a need for a high precision - high accuracy .. method for the determination of lead. A method has
262
been de veloped which is based on the precIpitation of lead chromate with a small excess of potassium
) dichromate and spectrophotometric determination of the excess chromate. This method takes advantage of the precise analysis of NBS Standard Refe re nce Material 139b, potassium dichromate, which has been shown to be 99.977 ± 0.003 percent [Ill
The flasks containing the solutions of the separated isotopes and a tare flask were placed in the case of a
• semi micro balance and allowed to stand overnight to insure thermal equilibrium. The fla s ks and co nten ts were the n weighed on the balance to ± 0.02 mg. Samples we re withdrawn from each fl as k by inse rting a platinum needle attached to a glass hypodermic syringe through the rubber septum and withdrawing the desired amount of solution. A second needle which
> just punctured the septum served as a vent. The syringe and needle were then washed with distilled water and the washings were combined with the withdrawn sample. The weight of the sample withdrawn was determined from the weight of the flask before and after withdrawal of solution.
Four samples of from 7.8 to 8.4 g eac h we re withdrawn from each solution by thi s method for the purpose of determining the lead concentrations of the "Pb 206" solution and the "Pb 208" solution. Each sam ple was treated as follows: two millilite rs of perchloric acid was added and the solution was evaporated to dryness at low heat on a hot plate. The residue was di sso lved in a small amount of water and the resulting solution was again evaporated to dryness at low heat on a hot plate. This procedure completely freed the salt
~ .. from nitrate ion which was found to interfere with the method by forming a lead-potassium-nitrate complex [12] which caused low results. The repeated evaporation also freed the salt from excess perchloric acid.
A 100 to 400 I-tg excess of potassium dichromate, K2Cr207, over the amount needed to stoichiometrically precipitate lead chromate, PbCr04 , was accurately
-( weighed on a microbalan ce. The potassium dichromate used was NBS Standard Reference Material 139b which has been shown to have an assay value of 99.977 ± 0.003 perce nt [11]. ThiS weight was corrected for assay of the K 2Cr2 07 and for the bouyancy effect of air.
The potassium dichromate was transferred to a 100 ml beaker and dissolved in about 30 ml of water. This solution was titrated with dilute ammonium hydroxide (l + 99) to convert dichromate ion, Cr207- - , to chromate ion, Cr04 -- . The end point of this titration was noted by comparing the color to the yellow color of a potassium chromate solution of the same concentration. A Teflon enclosed magnetic stirring bar was
..... added and the solution was stirred magnetically. The solution co ntainin g the isotopic lead sample was
slowly added to the chromate solution and th e beaker was thoroughly washed into thi s solution. The pH of thi s solution was adjusted to 2.5 with (1 + 9) NH40H and finally to be tween 4.5 and 6.5 with (1 + 99) NH40H. the pH was monitored with a pH meter usin g a glass-
r calomel electrode sys tem . The precipitate and solution was allowed to s tand for 1 hI' and then filtered through
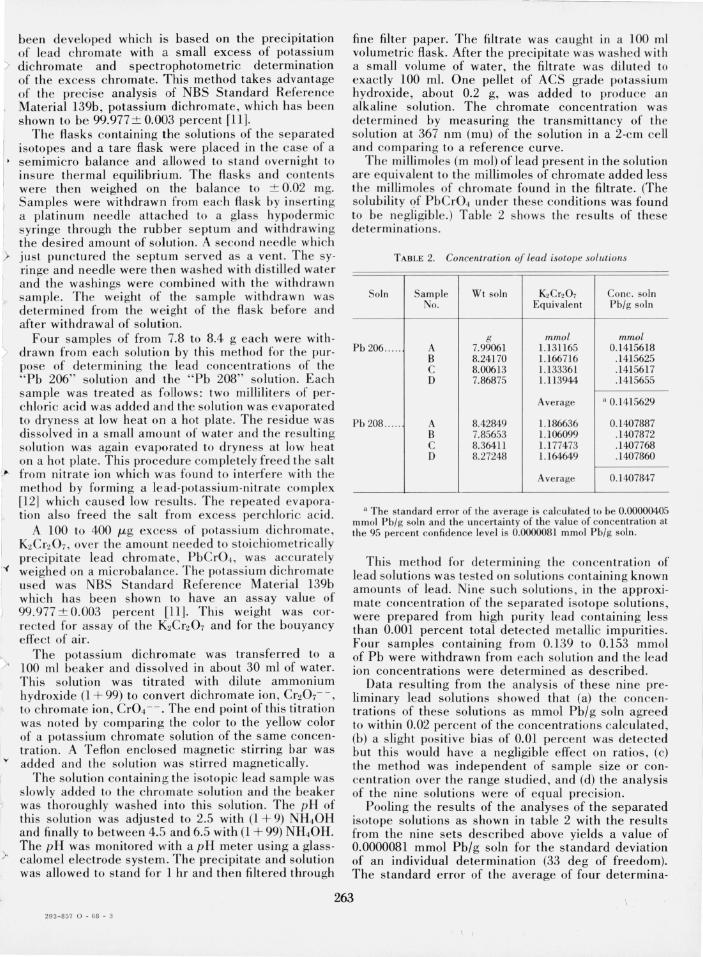
fine filter paper. The filtrate was caught in a 100 ml volumetric flask. After the precipitate was washed with a s mall volume of water, the filtrat e was diluted to exactly 100 m!. One pellet of ACS grade potassium hydroxide, about 0.2 g, was added to produce an alkaline solution. The chromate concentration was determined by measuring the transmittancy of the so lution at 367 nm (mu) of the solution in a 2-cm ceU a nd co mparing to a reference c urve.
The milljmoles (m mol) oflead present in the solution a re eq uivale nt to the milljmoles of chromate added less the milljmoles of chromate found in the filtrate. (The solubility of PbCr04 under these conditions was found to be negiigible.) Table 2 s hows the results of these determinations.
TABLE 2. Concentration of lead isotope solutions
Soln Sample Wt soln KzCrzO, Cone. so ln No. Equivalent Pb/g so ln
g mmol mmol Pb 206 .. ... A 7.99061 1.131165 0.1415618
B 8.24170 l.l 6671 6 .1415625 C 8.00613 1.133361 .1415617 0 7.86875 1.113944 .1415655
Average a 0.1415629
Pb 208 ..... A 8.42849 1.186636 0.1407887 B 7.85653 1.l06099 .1407872 C 8.36411 1.177473 .1407768 0 8.27248 1.164649 .1407860
Average 0.1407847
a The standard error of the average is calcufated to be 0.00000405 mmol Pb/g soln and the uncertainty of the value of concentration at the 95 percent confidence level is 0.0000081 mmol Pb/g so ln .
This method for determining the concentration of lead solutions was tested on solutions containing known amounts of lead. Nine s uch so lutions, in the approximate concentration of the separated isotope solutions, were prepared from high purity lead containing less than 0.001 percent total de tected me tallic impurities. Four samples containing from 0.139 to 0.153 mmol of Pb were withdrawn from each solution and the lead ion concentrations were determined as described.
Data resulting from the analysis of these nine preliminary lead solutions showed that (a) the concentration s of these solutions as mmol Pb/g soln agreed to within 0.02 percent of the concentrations calculated , (b) a slight positive bias of 0.01 percent was detected but thi s would have a negligible effec t on ratios, (c) the method was indepe ndent of sample size or concen tration over the range studied, and (d) the analysis of the nine solutions were of equal precision.
Pooling the results of the analyses of the separated isotope solutions as shown in table 2 with the results from the nine sets described above yields a value of 0.0000081 mmol Pb/g soln for the standard deviation of an individual determination (33 deg of freedom). The standard error of the average of four determina-
263 293-857 0 - 68 - 3

0.0000081 tions is therefore 2 or 0.00000405 mmol Pb/g
soln. At the 95 percent confidence level this is equal to 2.04 X 0.00000405 or 0.000008 mmol Pb/g soln.
2.4. Isotopic Analysis of the Separated Isotope Solutions
The separated isotope solutions were analyzed four times each on two mass spectrometers (#2 and #3). The averaged results are give n in table 3. In all of the analyses the amount of 204Pb could only be estimated because the signal was very small and could not be separated from possible baseline fluctuations with any degree of certainty. The isotopic compositions reported by ORNL are: "Pb 206", < 0.01 atom percent 204Pb, 99.8 ± 0.02 atom percent 206Pb , 0.2 ± 0.02 atom percent 207Pb , and < 0.03 atom percent 2os~b ; "Pb 208", < 0.05 atom perce nt 204Pb, 0.19 ± 0.05 atom percent 206Pb, 0.52 ± 0.05 atom percent 207Pb, and 99.3 ± 0.05 atom percent 2osPb. The ORNL limits quoted express the precision of the measurements. From known sources of syste mati c error, the absolute error is estimated by ORNL to be less than 1 percent.
TABLE 3. Isotopic composition of separated lead isotopes used in calibration samples
Separated isotope
"Pb 206" 2°'Pb 2""Pb 2°'Pb 20apb
" Pb 208" 204Pb 2""Pb 2°'Pb 20apb
Isotopic com position (atom percent)
0.0010 99.7403 ± 0.0040 a
0.2299 .0288
0.0010 .1930 .5057
99.3003 ± 0.0040
a The uncertainties are based on a minimum error of 0.00002 for the ratio determinations. The calculated 95 percent confidence limits are well below this value.
2.5. Preparation of the Calibration Samples
Six calibration samples were prepared by mixing weighed portions of the "Pb 206" solution and the " Pb 208" solution to approximate the compositions of the three reference materials. The target 208/206 ratios were 2.16, 1.00, and 0.014. Two calibration samples were prepared for each target- However, since the errors associated with the preparation of mixes 7 and 8 (208/206= 0.014) were large, they were not used for calibration purposes. Each calibration sample was thoroughly mixed by stirring and evaporated to dryness. The J sulting Pb(NOa) was taken into solution with sufficient 2 percent HN03 so that the lead concentration was 25 mg/m!' The compositions of these calibration samples are given in table 4.
TABLE 4. Composition of lead calibration samples
Sample Isotope Wt soln Cone. soln Pb Pb/g soln
g m mol m mol 3 206 2.02622 0.1415629 0.2868376
208 2.08562 .1407847 .2936234
4 206 1.94738 0.1415629 0.2756768 208 1.97846 .1407847 .2785369
5 206 0.97453 0.1415629 0.1379573 208 2.10062 .1407847 .2957352
6 206 0.93376 0.1415629 0.1321858 208 2.04303 .1407847 .2876274
I 7 206 4.12812 0.1415629 0.5843886 -(
208 0.05691 .1407847 .0080121 I
8 206 4.19283 0.1415629 0.5935492 208 0.06345 .1407847 .0089328
1
" 2.6. Isotopic Analyses of the Calibration Mixes and
Standard Samples "-
Two complete sets of analyses of the calibration mixes and standard samples were made; one by operator I using instruments #1 and #3, and one by operator II using instrument #2. In the case of the common lead and equal atom standards, each set consisted of a total' of eight analyses of the standard and four analyses each of the two appropriate calibration mixes (mixes 3 and 4 for the common lead, ~ and mixes 5 and 6 for the equal atom lead), run in a I simple alternating pattern. In the case of the radiogenic standard each set also consisted of a total of eight analyses of the standard and four analyses each of two calibration mixes (mixes 7 and 8). However, subsequent statistical evaluation of the data showed that both the chemical error in the preparation of these )'1 very low 2osPb/206Pb mixes and the error in the measurements (minimum error on a ratio= 0.00002) of these extreme ratios were too large, so that these mixes were essentially useless for calibration purposes. The principal source of the chemistry portion of the error was in the weighing and transferring of the srr.all amounts of "Pb 208" solution ( ~ 60 mg). The results for these calibration mixes were therefore discarded " and the final bias correction factor was calculated only on the basis of the four calibration mixes which had approximately the same 2osPb/206Pb values of either the common lead or equal atom standards.
In each standard sample analysis eight values each were obtained for the 204Pb/206Pb, 207Pb/206Pb, and 2osPbpo6Pb ratios in the order: four values of 2osPb/ 206Pb, four values of 207Pb/206Pb, eight values of 204Pb/206Pb, four values of 207Pbpo6Pb, and four values of 2osPbpo6Pb. This pattern was followed so that the data was symmetrical to any fractionation effect-In the analyses of the calibration mixes, twenty-four I measurements of the 2osPbj206Pb ratio were taken -< over the normal data-taking time interval of a standard sample analysis_
264

I In all analyses, base-line readings were taken im-mediately before and after the data_ The peak-top
;> data were taken by step-wise changes in the magnet t current and each peak-top was monitored for 30 sec_
1/2 of the measured bias, and 204Pb/206Pb is corrected by the inverse of the measured bias. Table 7 gives the
TABLE 5. Determination of mass spectrometric bias
3. Results and Discussion Calibra- Isotopic ratio, 20BPb/2<16Pb Correction factor
Table 5 summarizes the results for the four calibration mixes_ There is no statistically significant difference between any of the values. The seemingly large difference between operator II's values for mixes 5 and 6 and mixes 3 and 4 is probably the result of either an operator bias in base-line readings or an at,tenuator error.
Table 6 gives the observed and corrected ratios for the two sets of data. 207Pb/206Pb is corrected by
tion sample
No. Calcu- Operator Operator lated I II
3 1.017415 1.01677 1.01685 4 1.004243 1.00378 1.00379 5 2.125686 2.12462 2.12593 6 2.117538 2.15718 2,1 5798
Mean values of correction factors " .. , ... ". ,
Operator I
1.000634 1.000461 1.000502 1.000166
1.000441
TABLE 6. Observed and corrected isotopic ratios for the standard samples
Observed ratios Corrected ratios Sample Operator
204Pb/206Pb 2°'Pb/206Pb 20BPb/'06Pb 204 Pbl'06Pb 207Pb/206Pb 2osPbl'°SPb
Common I 0.059067 0.91437 2.1669 0.059041 0.91457 2.1678 SRM 981 II .059053 .91465 2.1680 .059043 .91472 2.1684
Equal-Atom I 0.027223 0.46679 0.99964 0.027211 0.46689 1.00009 SRM 982 II .027232 .46721 1.00007 .027227 .46725 1.00024
Radiogenic I 0.0003723 0.071178 0.013611 0.0003721 0.071194 0.013617 SRM 983 II .0003693 .071202 .013619 .0003692 .071208 .013621
TABLE 7. Absolute isotopic ratios for the three standard samples
Common Lead (SRM 981) ............ ............ ............. . Overall limit of error a ................................... ...... . Uncertainty Components: 95% confidence limits on ratio determination (min-
imum = 0.00002),., ............. . ... , .... , . .. , ........ , ... ,." .. Bounds due to possible systematic error in chemical
analyses ........................................................ , Bounds due to possible systematic error in correc
tion factor (including errors in separated isotopes),.
Equal-Atom Lead (SRM 982) .................................. , Overall limit of error ........................................... .. Uncertainty Components: 95% confidence limits on ratio determination (mini-
mum= 0.00002) ...... , ,. , ........ , ............. , .. , .. ,. " ..... . Bounds due to possible sys tematic error in chemical
analyses, ................... " ' . ............ , .................. .. Bounds due to possible systematic error in correc·
tion factor (including errors in separated isotopes),.
Radiogenic Lead (SRM 983) ..... , ............ .... ... ".,," , .. , Overall limit of error"" .. " .... " .................... "." .... .. Uncertainty Components: 95% confidence limits on ratio determination (mini-
mum = 0.00002) ........... ,', ... , ........ , .......... "." .. , .. , Bounds due to possible systematic error in chemi-
cal analyses ...... , ......... , ... " ......... , .......... "." .. ,'" Bounds due to possible systematic error In correc
tion factor (including errors in separated isotopes), ... ,
204Pbl'°6Pb
0,059042 ± 0,000037
± 0.000020
±0.000005
±0.000012
0.027219 ±0.000027
±0.000020
±0.000002
± 0,000005
0.000371 ± 0.000020
± 0.OOO020
± O.OOOOOO
± O.OOOOOO
2°' Pb/'06Pb 2osPbp06Pb
0.91464 2,1681 ± 0.00033 ± 0.0008
± 0,00007 ± 0.0002
± 0.00007 ± 0,0002
±0.00019 ± 0,0004
0.46707 1.00016 ±0.00020 ± 0.00036
± 0.00006 ± 0.00007
± 0,00004 ± 0.00008
± O.OOOIO ±0.00021
0.071201 0.013619 ± 0.000040 ±0,OOOO24
± 0.000020 ± 0.000020
±0.000006 ± O.OOOOOI
±0.000014 ± 0,OOOO03
a The overall limit of error is the sum of the 95 percent confidence limits for the ratio determinations and the terms covering effects of known sources of possible systematic error.
265 293 - 857 0 - 68 - 4
Operator II
1.000556 1.000451 0.999885
.999795
1.000172
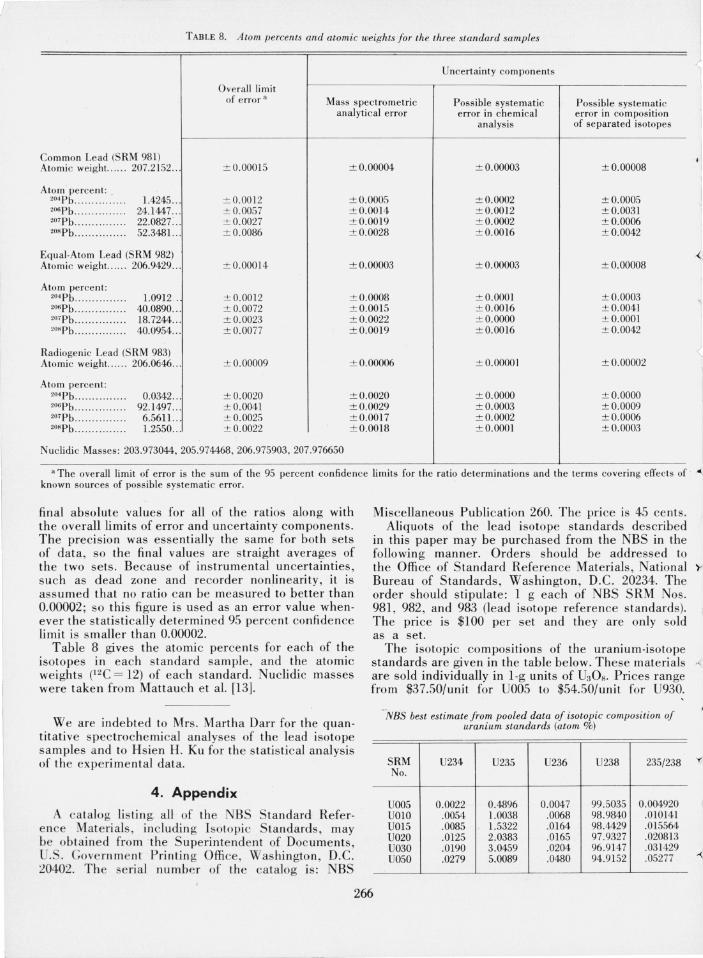
TABLE 8. Atom percents and atomic weights Jor the three standard samples
Uncertainty components
Overall lim it of error a Mass spectrometric Possible systematic Possible systematic
analytical error error in chemical error in composition analysis of separated isotopes
Common Lead (SRM 981) Atomic weight.. ... . 207.2152 ... ± 0.00015 ± 0.00004 ± 0.00003 ± 0.00008
,I Atom' percent : ..
2°· Pb . .. . .......... . 1.4245 ... ± 0.0012 ± 0.0005 ± 0.0002 ± 0.0005 2ospb .......... . .... 24. 1447 ... ± 0.0057 ± 0.0014 ± 0.0012 ±0.0031 207Pb .... . . ....... . . 22.0827:.. ± 0.0027 ± 0.0019 ± 0.0002 ± 0.0006 208Pb ............... 52.3481... ± 0.0086 ± 0.0028 ± 0.0016 ± 0.0042
Equal-Atom Lead (SRM 982) Atomic weight.. ... . 206.9429 ... ± 0.00014 ± 0.00003 ± 0.00003 ± 0.00008
Atom percent: 2°' Pb .. ....... . ..... 1.0912 . ± 0.0012 ± 0.0008 ± O.OOOI ± 0.0003 2ospb ........... ... . 40.0890 ... ± 0.0072 ± 0.0015 ± 0.0016 ± 0.0041 2°'Pb .. .. ... .... . . . . 18.7244 ... ± 0.0023 ± 0.0022 ± O.OOOO ± O.OOOI 208 Pb ...... .. ..... . . 40.0954 ... ± 0.0077 ± 0.0019 ± 0.0016 ± 0.0042
Radiogenic Lead (S RM 983) Atomic weight.. .... 206.0646 ... ± 0.00009 ± 0.00006 ± O.OOOOI ± 0.00002
Atom percent: 2°·Pb ............... 0.0342 .. . ± 0.0020 ± 0.0020 ± O.OOOO ± O.OOOO 2ospb ............... 92.1497 . .. ± 0.0041 ± 0.0029 ± 0.0003 ± 0.0009 207Pb ..... . ....... . . 6.5611.. . ± 0.0025 ± 0.0017 ± 0.0002 ± 0.0006 2°"Pb ............. . . 1.2550 . . . ± 0.0022 ± 0.0018 ± 0.000l ± 0.0003
Nucl idi c Masses: 203.973044,205.974468,206.975903,207.976650
a The overall limit of error is the sum of the 95 percent confidence limits for the ratio determinations and the terms covering effects of ~ known sources of possible sys tematic error. I
final absolute values for all of the ratios along with the overall limits of error and uncertainty components. The precision was essentially the same for both sets of data , so the final values are straight averages of the two sets. Because of instrumental uncertainties , stIch as dead zone and recorder nonlinearity, it is assumed that no ratio can be measured to better than 0.00002; so this figure is used as an error value whenever the statistically determined 95 percent confidence limit is s maller than 0.00002.
Table 8 gives the atomic percents for each of the isotopes in each standard sample, and the atomic weights (l2C = 12) of each standard. Nuclidic masses were taken from Mattauch et a1. [13].
We are indebted to Mrs. Martha Darr for the quantitati ve spectrochemical analyses of the lead isotope samples and to Hsien H. Ku for the stati stical analysis of the experimental data.
4. Appendix
A ca talog li s ting all of the NBS Standard Refere nce Materials, includin g Isotopi c Standards, may be obtained from the Superintendent of Doc ume nts , U.S. Governme nt Printing Office, Washington, D.C. 20402. The serial number of the catalog is: NBS
Miscellaneous Publication 260. The price is 45 cents. Aliquots of the lead isotope standards described I
in this paper may be purchased from the NBS in the following manner. Orders should be addressed to the Office of Standard Referen ce Materials, National ')Bureau of Standards, Washington, D.C. 20234. The I order should stipulate: 1 g each of NBS SRM Nos. 981 , 982, and 983 (lead isotope reference standards). The price is $100 per set and they are only sold as a set.
The isotopic compositions of the uranium·isotope 1
standards are given in the table below. These materials '(1 are sold individually in l·g units of U30 M• Prices range from $37.50/unit for U005 to $54.50/unit for U930.
-NBS best estimate Jrom pooled data oj isotopic composition oj uranium standards (atom %)
SRM U234 U235 U236 U238 235/238 No.
UOO5 0.0022 0.4896 0.0047 99 .5035 0.004920 UOIO .0054 1.0038 .0068 98.9840 .010141 U015 .0085 1.5322 .0164 98 .4429 .015564 U020 .0125 2.0383 .0165 97.9327 .020813 U030 .0190 3.0459 .0204 96.9147 .031429 U050 .0279 5.0089 .0480 94.9152 .05277
YI I
266
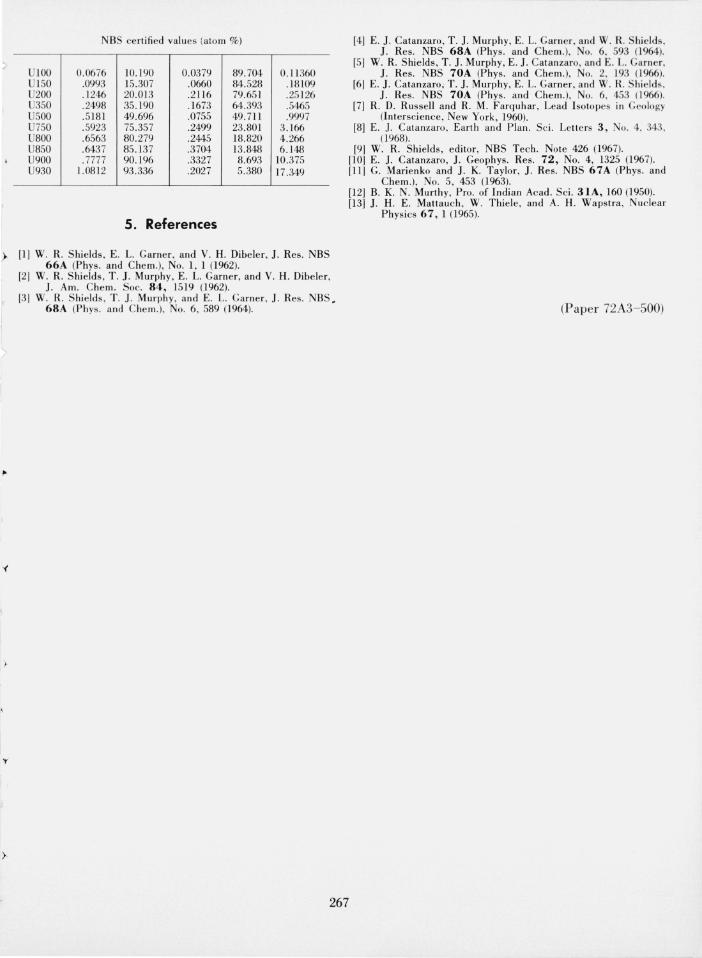
NBS certified values (atom %)
> U100 0.0676 10.190 0.0379 89.704 0.11360 U150 .0993 15.307 .0660 84.528 .18109 U200 .1246 20.013 . 2ll6 79.651 .25 126 U350 .2498 35.190 .1673 64.393 .5465 U500 .5181 49.696 .0755 49.711 .9997 U750 .5923 75.357 .2499 23.801 3.166 U800 .6563 80.279 .2445 18.820 4.266 U850 .6437 85.137 .3704 13.848 6.148 U900 .7777 90.196 .3327 8.693 10.375 U930 1.0812 93.336 .2027 5.380 17.349
5. References
} [IJ W. R. Shields, E. L. Garner, and V. H. Dibeler, J. Res. NBS 66A (phys. and Chem.), No.1, 1 (1962).
I"
I,
[21 W. R. Shields, T . J. Murphy, E. L. Garner, and V. H. Dibeler, 1. Am. Chem. Soc. 84, 1519 (1962).
[3J W. R. Shields, T. J. Murphy, and E. L. Garner, J. Res. NBS. 68A (phys. and Che m. ), No.6, 589 (1964).
267
------- --.
[41 E. J. Catanzaro, T. J. Murphy, E. L. Garner, and W. R. Shields, J. Res. NBS 68A (phys. and Chem.), No.6, 593 (1964).
[5J W. R. Shields, T. J. Murphy, E. J. Catanzaro, and E. L. Garner, 1. Res. NBS 70A (phys. and Chem.), No.2, 193 (1966).
[6J E. J. Catanzaro; T. 1. Murphy, E. L. Garner, and W. R. S hields, 1. Res. NBS 70A (phys. and Chem.), No. 6, 453 (1966) .
[7] R. D. Russell and R. M. Farquhar, Lead Isotopes in Geology (Interscience, New York, 1960).
[8] E. J. Catanzaro, Earth and Plan. Sci. Letters 3, No.4. 343, (1968).
[9] W. R. Shields, editor, NBS Tech. Note 426 (1967). [101 E. 1. Catanzaro, 1. Geophys. Res. 72, No.4, 1325 (1967). [11] G. Marienko and J. K. Taylor, 1. Res. NBS 67 A (phys. and
Chem.), No. 5, 453 (1963). [12] B. K. N. Murthy, Pro. of Indian Acad. Sci. 31A, 160 (1950). [13] J. H. E. Mattauch, W. Thiele, and A. H. Wapstra , Nuclear
Physics 67 , 1 (1965).
(Paper 72A3- S00)