ABS Hydraulic
17
400 Commonwealth Drive, Warrendale, PA 15096-0001 U.S.A. Tel: (724) 776-4841 Fax: (724) 776-5760 Web: www.sae.org 2005-01-1061 Anti-Lock Braking Performance and Hydraulic Brake Pressure Estimation Kevin O'Dea Delphi Corporation Reprinted From: Virtual Engineering and Development, Digital Modeling, and Rapid Prototyping (SP-1917) 2005 SAE World Congress Detroit, Michigan April 11-14, 2005 SAE TECHNICAL PAPER SERIES
-
Upload
amudha-sivakumar -
Category
Documents
-
view
38 -
download
6
Transcript of ABS Hydraulic
400 Commonwealth Drive, Warrendale, PA 15096-0001 U.S.A. Tel: (724) 776-4841 Fax: (724) 776-5760 Web: www.sae.org
2005-01-1061
Anti-Lock Braking Performance and HydraulicBrake Pressure Estimation
Kevin O'DeaDelphi Corporation
Reprinted From: Virtual Engineering and Development, Digital Modeling,and Rapid Prototyping
(SP-1917)
2005 SAE World CongressDetroit, MichiganApril 11-14, 2005
SAE TECHNICALPAPER SERIES
The Engineering Meetings Board has approved this paper for publication. It has successfully completedSAE’s peer review process under the supervision of the session organizer. This process requires aminimum of three (3) reviews by industry experts.
All rights reserved. No part of this publication may be reproduced, stored in a retrieval system, ortransmitted, in any form or by any means, electronic, mechanical, photocopying, recording, or otherwise,without the prior written permission of SAE.
For permission and licensing requests contact:
SAE Permissions400 Commonwealth DriveWarrendale, PA 15096-0001-USAEmail: [email protected]: 724-772-4028Fax: 724-772-4891
For multiple print copies contact:
SAE Customer ServiceTel: 877-606-7323 (inside USA and Canada)Tel: 724-776-4970 (outside USA)Fax: 724-776-1615Email: [email protected]
ISSN 0148-7191Copyright © 2005 SAE International
Positions and opinions advanced in this paper are those of the author(s) and not necessarily those of SAE.The author is solely responsible for the content of the paper. A process is available by which discussionswill be printed with the paper if it is published in SAE Transactions.
Persons wishing to submit papers to be considered for presentation or publication by SAE should send themanuscript or a 300 word abstract to Secretary, Engineering Meetings Board, SAE.
Printed in USA
2005-01-1061
Anti-Lock Braking Performance and Hydraulic Brake Pressure Estimation
Kevin O’Dea Delphi Corporation
Copyright © 2005 SAE International
ABSTRACT
Anti-Lock Brake Systems use hydraulic valves to control brake pressure and ultimately, wheel slip. The difference in pressure across these hydraulic valves affects their performance. The control of these valves can be improved if the pressure difference is known and the valve control altered accordingly. In practice, the delta-pressure is estimated. Estimating the wheel brake pressure introduces an error into the control structure of the system, i.e. the difference between the actual wheel brake pressure and the estimated wheel brake pressure. The effect of this error was investigated at the vehicle level via simulation, using stopping distance and vehicle yaw rate as evaluation criteria. Even with large errors in the brake pressure estimate, it was found that the vehicle performance was largely unaffected. INTRODUCTION
The goal of Anti-Lock Braking Systems (ABS) is to control the tire forces in an effort to optimize vehicle performance, especially with regard to stopping distance and vehicle stability, during panic braking. Because the tire forces are so critical to ABS, it obviously would be an advantage to know these forces directly. Unfortunately, there is currently no easy and cost effective method for measuring tire forces. As a secondary solution, the brake pressures could be measured, and the measurement could be used in the ABS control strategy. This is already done for EHB systems and could be done for more conventional systems, but this is expensive. Instead, the brake pressure can be estimated using a master cylinder pressure sensor and the characteristics of the hydraulic modulator, which is used to perform the ABS brake pressure regulation.
There are two primary methods for estimating the brake pressure in an ABS system. Each of these methods is linked to a specific type of ABS system.
The first type of ABS system uses a motor/ball screw assembly to drive a piston, which is used to modulate
brake pressure and perform the ABS function. Such a system is the Delco ABSVI system. In this system, the motor current is measured and the brake pressure is estimated from the measured motor current. Since such systems essentially measure the brake pressure there is little error in the estimation. These types of systems will not be covered within this paper.
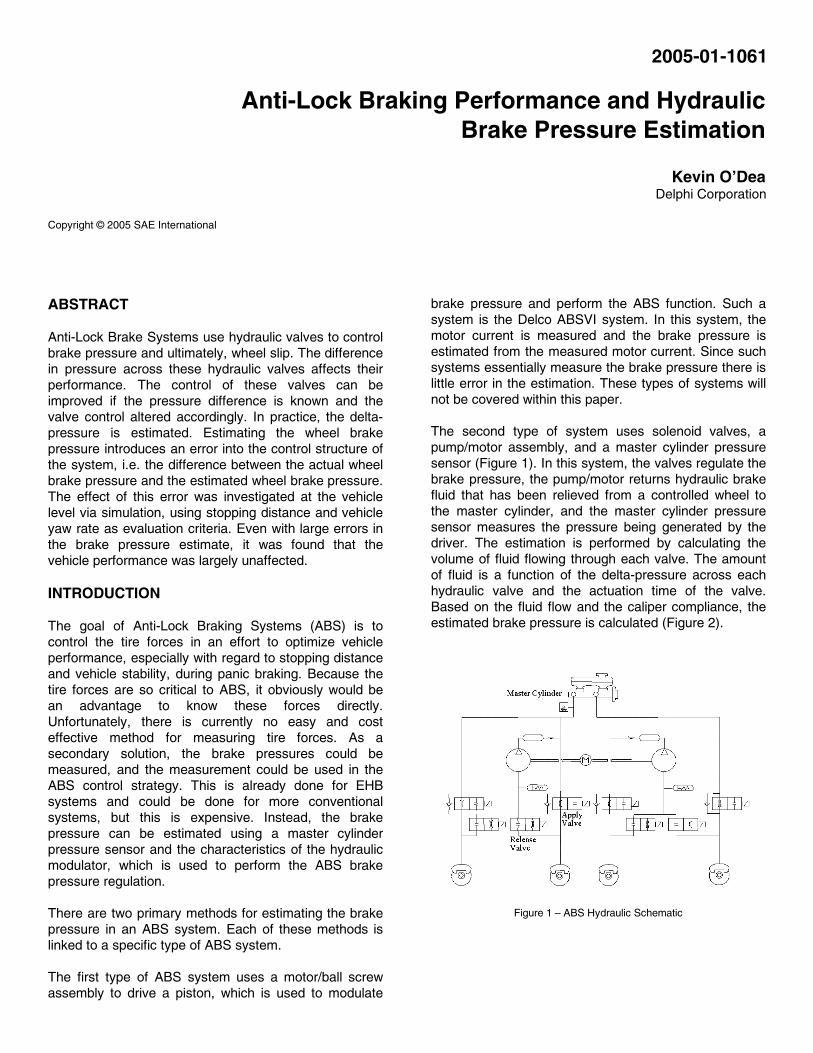
The second type of system uses solenoid valves, a pump/motor assembly, and a master cylinder pressure sensor (Figure 1). In this system, the valves regulate the brake pressure, the pump/motor returns hydraulic brake fluid that has been relieved from a controlled wheel to the master cylinder, and the master cylinder pressure sensor measures the pressure being generated by the driver. The estimation is performed by calculating the volume of fluid flowing through each valve. The amount of fluid is a function of the delta-pressure across each hydraulic valve and the actuation time of the valve. Based on the fluid flow and the caliper compliance, the estimated brake pressure is calculated (Figure 2).
Figure 1 – ABS Hydraulic Schematic
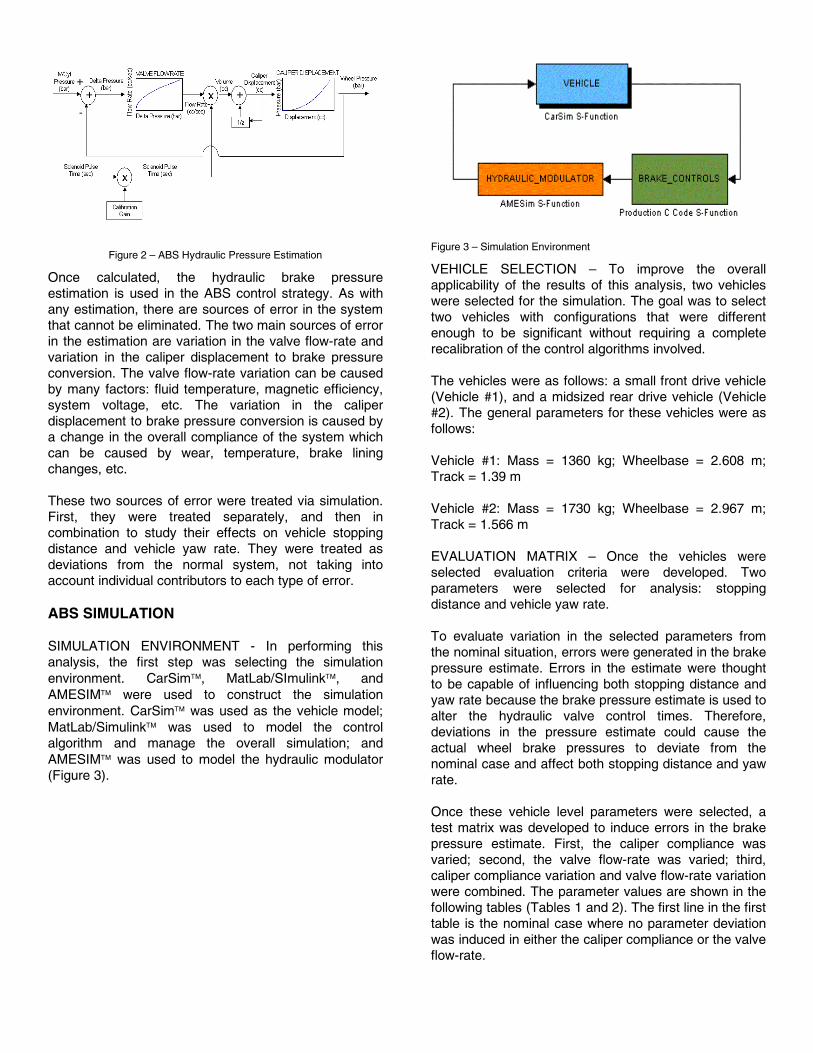
Figure 2 – ABS Hydraulic Pressure Estimation
Once calculated, the hydraulic brake pressure estimation is used in the ABS control strategy. As with any estimation, there are sources of error in the system that cannot be eliminated. The two main sources of error in the estimation are variation in the valve flow-rate and variation in the caliper displacement to brake pressure conversion. The valve flow-rate variation can be caused by many factors: fluid temperature, magnetic efficiency, system voltage, etc. The variation in the caliper displacement to brake pressure conversion is caused by a change in the overall compliance of the system which can be caused by wear, temperature, brake lining changes, etc.
These two sources of error were treated via simulation. First, they were treated separately, and then in combination to study their effects on vehicle stopping distance and vehicle yaw rate. They were treated as deviations from the normal system, not taking into account individual contributors to each type of error.
ABS SIMULATION
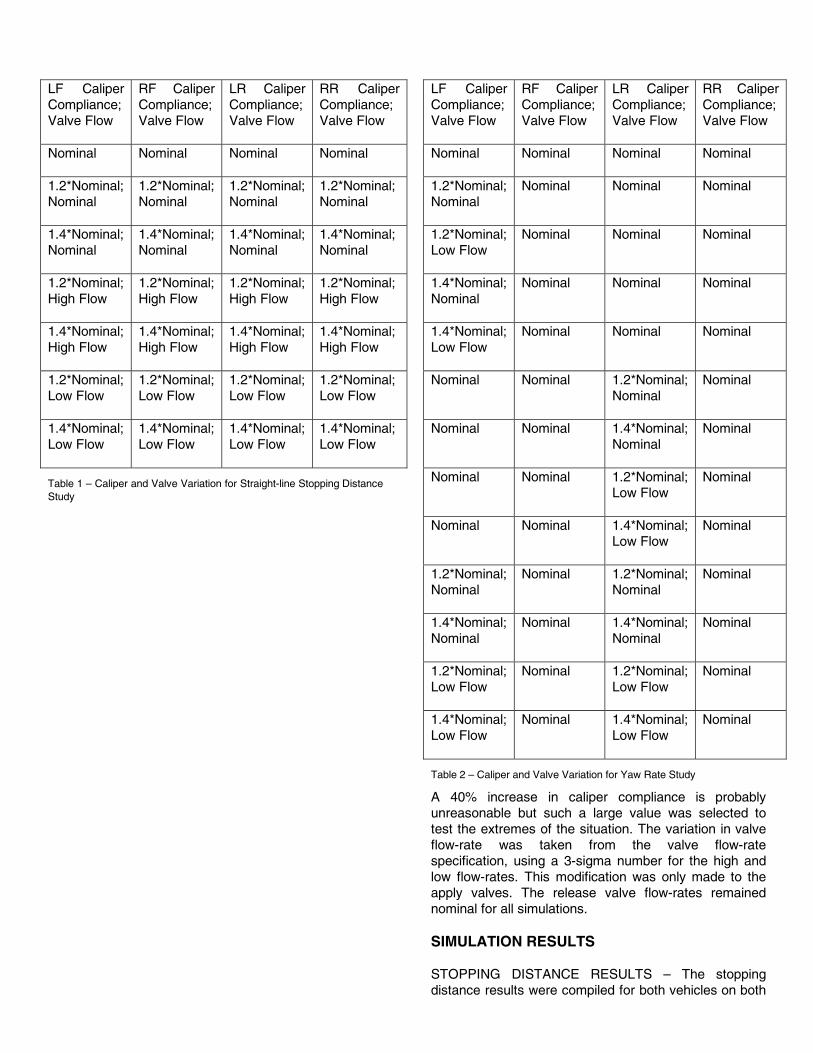
SIMULATION ENVIRONMENT - In performing this analysis, the first step was selecting the simulation environment. CarSim, MatLab/SImulink, and AMESIM were used to construct the simulation environment. CarSim was used as the vehicle model; MatLab/Simulink was used to model the control algorithm and manage the overall simulation; and AMESIM was used to model the hydraulic modulator (Figure 3).
Figure 3 – Simulation Environment
VEHICLE SELECTION – To improve the overall applicability of the results of this analysis, two vehicles were selected for the simulation. The goal was to select two vehicles with configurations that were different enough to be significant without requiring a complete recalibration of the control algorithms involved.
The vehicles were as follows: a small front drive vehicle (Vehicle #1), and a midsized rear drive vehicle (Vehicle #2). The general parameters for these vehicles were as follows:
Vehicle #1: Mass = 1360 kg; Wheelbase = 2.608 m; Track = 1.39 m
Vehicle #2: Mass = 1730 kg; Wheelbase = 2.967 m; Track = 1.566 m
EVALUATION MATRIX – Once the vehicles were selected evaluation criteria were developed. Two parameters were selected for analysis: stopping distance and vehicle yaw rate.
To evaluate variation in the selected parameters from the nominal situation, errors were generated in the brake pressure estimate. Errors in the estimate were thought to be capable of influencing both stopping distance and yaw rate because the brake pressure estimate is used to alter the hydraulic valve control times. Therefore, deviations in the pressure estimate could cause the actual wheel brake pressures to deviate from the nominal case and affect both stopping distance and yaw rate.
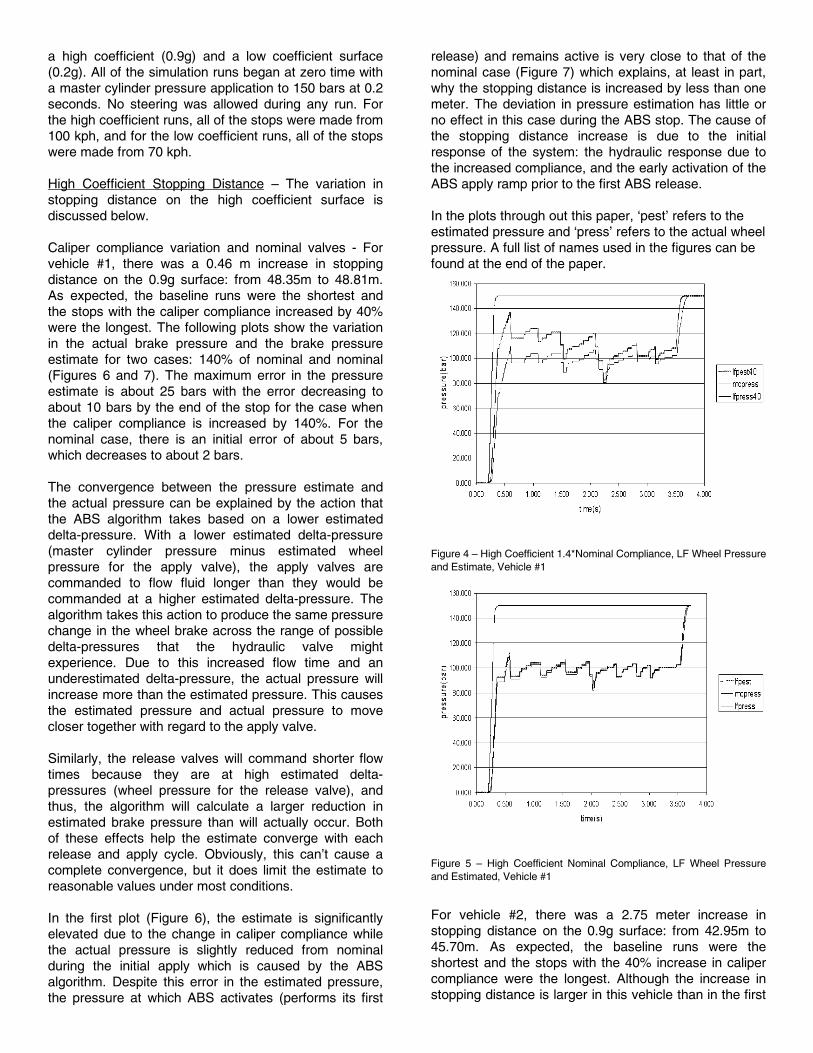
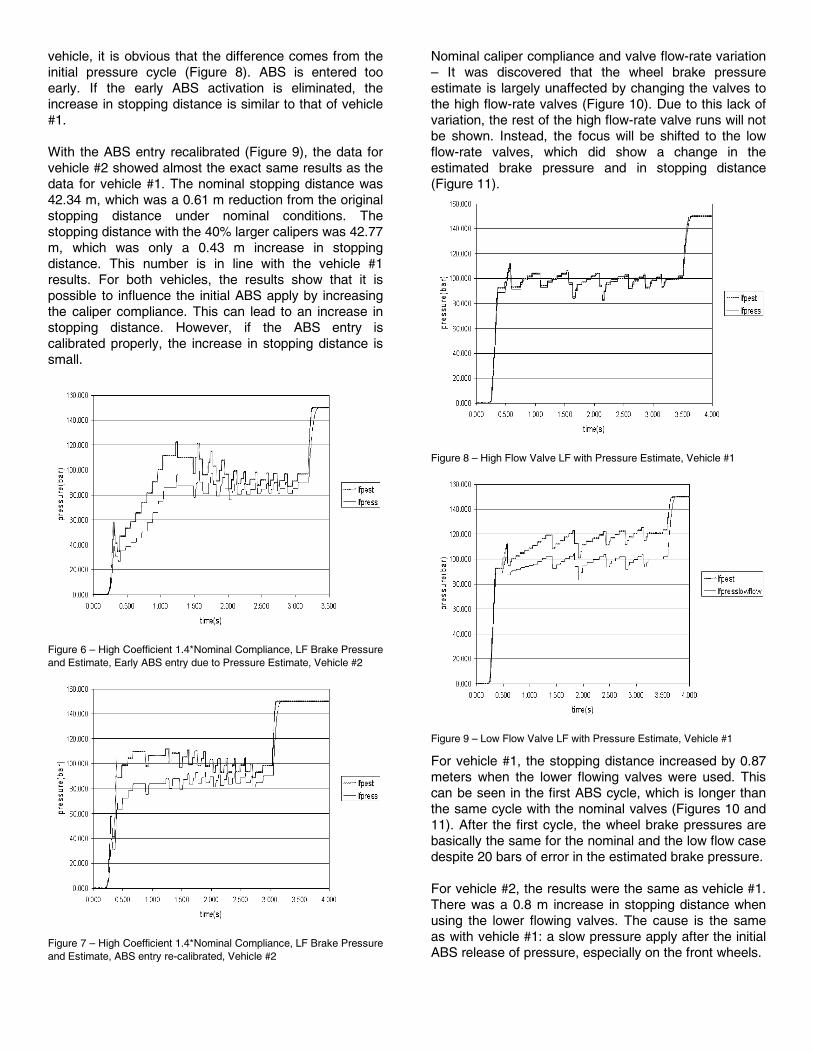
Once these vehicle level parameters were selected, a test matrix was developed to induce errors in the brake pressure estimate. First, the caliper compliance was varied; second, the valve flow-rate was varied; third, caliper compliance variation and valve flow-rate variation were combined. The parameter values are shown in the following tables (Tables 1 and 2). The first line in the first table is the nominal case where no parameter deviation was induced in either the caliper compliance or the valve flow-rate.
LF Caliper Compliance; Valve Flow
RF Caliper Compliance; Valve Flow
LR Caliper Compliance; Valve Flow
RR Caliper Compliance; Valve Flow
Nominal Nominal Nominal Nominal
1.2*Nominal; Nominal
1.2*Nominal; Nominal
1.2*Nominal; Nominal
1.2*Nominal; Nominal
1.4*Nominal; Nominal
1.4*Nominal; Nominal
1.4*Nominal; Nominal
1.4*Nominal; Nominal
1.2*Nominal; High Flow
1.2*Nominal; High Flow
1.2*Nominal; High Flow
1.2*Nominal; High Flow
1.4*Nominal; High Flow
1.4*Nominal; High Flow
1.4*Nominal; High Flow
1.4*Nominal; High Flow
1.2*Nominal; Low Flow
1.2*Nominal; Low Flow
1.2*Nominal; Low Flow
1.2*Nominal; Low Flow
1.4*Nominal; Low Flow
1.4*Nominal; Low Flow
1.4*Nominal; Low Flow
1.4*Nominal; Low Flow
Table 1 – Caliper and Valve Variation for Straight-line Stopping Distance Study
LF Caliper Compliance; Valve Flow
RF Caliper Compliance; Valve Flow
LR Caliper Compliance; Valve Flow
RR Caliper Compliance; Valve Flow
Nominal Nominal Nominal Nominal
1.2*Nominal; Nominal
Nominal Nominal Nominal
1.2*Nominal; Low Flow
Nominal Nominal Nominal
1.4*Nominal; Nominal
Nominal Nominal Nominal
1.4*Nominal; Low Flow
Nominal Nominal Nominal
Nominal Nominal 1.2*Nominal; Nominal
Nominal
Nominal Nominal 1.4*Nominal; Nominal
Nominal
Nominal Nominal 1.2*Nominal; Low Flow
Nominal
Nominal Nominal 1.4*Nominal; Low Flow
Nominal
1.2*Nominal; Nominal
Nominal 1.2*Nominal; Nominal
Nominal
1.4*Nominal; Nominal
Nominal 1.4*Nominal; Nominal
Nominal
1.2*Nominal; Low Flow
Nominal 1.2*Nominal; Low Flow
Nominal
1.4*Nominal; Low Flow
Nominal 1.4*Nominal; Low Flow
Nominal
Table 2 – Caliper and Valve Variation for Yaw Rate Study
A 40% increase in caliper compliance is probably unreasonable but such a large value was selected to test the extremes of the situation. The variation in valve flow-rate was taken from the valve flow-rate specification, using a 3-sigma number for the high and low flow-rates. This modification was only made to the apply valves. The release valve flow-rates remained nominal for all simulations. SIMULATION RESULTS
STOPPING DISTANCE RESULTS – The stopping distance results were compiled for both vehicles on both
a high coefficient (0.9g) and a low coefficient surface (0.2g). All of the simulation runs began at zero time with a master cylinder pressure application to 150 bars at 0.2 seconds. No steering was allowed during any run. For the high coefficient runs, all of the stops were made from 100 kph, and for the low coefficient runs, all of the stops were made from 70 kph.
High Coefficient Stopping Distance – The variation in stopping distance on the high coefficient surface is discussed below.
Caliper compliance variation and nominal valves - For vehicle #1, there was a 0.46 m increase in stopping distance on the 0.9g surface: from 48.35m to 48.81m. As expected, the baseline runs were the shortest and the stops with the caliper compliance increased by 40% were the longest. The following plots show the variation in the actual brake pressure and the brake pressure estimate for two cases: 140% of nominal and nominal (Figures 6 and 7). The maximum error in the pressure estimate is about 25 bars with the error decreasing to about 10 bars by the end of the stop for the case when the caliper compliance is increased by 140%. For the nominal case, there is an initial error of about 5 bars, which decreases to about 2 bars.
The convergence between the pressure estimate and the actual pressure can be explained by the action that the ABS algorithm takes based on a lower estimated delta-pressure. With a lower estimated delta-pressure (master cylinder pressure minus estimated wheel pressure for the apply valve), the apply valves are commanded to flow fluid longer than they would be commanded at a higher estimated delta-pressure. The algorithm takes this action to produce the same pressure change in the wheel brake across the range of possible delta-pressures that the hydraulic valve might experience. Due to this increased flow time and an underestimated delta-pressure, the actual pressure will increase more than the estimated pressure. This causes the estimated pressure and actual pressure to move closer together with regard to the apply valve.
Similarly, the release valves will command shorter flow times because they are at high estimated delta-pressures (wheel pressure for the release valve), and thus, the algorithm will calculate a larger reduction in estimated brake pressure than will actually occur. Both of these effects help the estimate converge with each release and apply cycle. Obviously, this can’t cause a complete convergence, but it does limit the estimate to reasonable values under most conditions.
In the first plot (Figure 6), the estimate is significantly elevated due to the change in caliper compliance while the actual pressure is slightly reduced from nominal during the initial apply which is caused by the ABS algorithm. Despite this error in the estimated pressure, the pressure at which ABS activates (performs its first
release) and remains active is very close to that of the nominal case (Figure 7) which explains, at least in part, why the stopping distance is increased by less than one meter. The deviation in pressure estimation has little or no effect in this case during the ABS stop. The cause of the stopping distance increase is due to the initial response of the system: the hydraulic response due to the increased compliance, and the early activation of the ABS apply ramp prior to the first ABS release.
In the plots through out this paper, ‘pest’ refers to the estimated pressure and ‘press’ refers to the actual wheel pressure. A full list of names used in the figures can be found at the end of the paper.
Figure 4 – High Coefficient 1.4*Nominal Compliance, LF Wheel Pressure and Estimate, Vehicle #1
Figure 5 – High Coefficient Nominal Compliance, LF Wheel Pressure and Estimated, Vehicle #1
For vehicle #2, there was a 2.75 meter increase in stopping distance on the 0.9g surface: from 42.95m to 45.70m. As expected, the baseline runs were the shortest and the stops with the 40% increase in caliper compliance were the longest. Although the increase in stopping distance is larger in this vehicle than in the first
vehicle, it is obvious that the difference comes from the initial pressure cycle (Figure 8). ABS is entered too early. If the early ABS activation is eliminated, the increase in stopping distance is similar to that of vehicle #1.
With the ABS entry recalibrated (Figure 9), the data for vehicle #2 showed almost the exact same results as the data for vehicle #1. The nominal stopping distance was 42.34 m, which was a 0.61 m reduction from the original stopping distance under nominal conditions. The stopping distance with the 40% larger calipers was 42.77 m, which was only a 0.43 m increase in stopping distance. This number is in line with the vehicle #1 results. For both vehicles, the results show that it is possible to influence the initial ABS apply by increasing the caliper compliance. This can lead to an increase in stopping distance. However, if the ABS entry is calibrated properly, the increase in stopping distance is small.
Figure 6 – High Coefficient 1.4*Nominal Compliance, LF Brake Pressure and Estimate, Early ABS entry due to Pressure Estimate, Vehicle #2
Figure 7 – High Coefficient 1.4*Nominal Compliance, LF Brake Pressure and Estimate, ABS entry re-calibrated, Vehicle #2
Nominal caliper compliance and valve flow-rate variation – It was discovered that the wheel brake pressure estimate is largely unaffected by changing the valves to the high flow-rate valves (Figure 10). Due to this lack of variation, the rest of the high flow-rate valve runs will not be shown. Instead, the focus will be shifted to the low flow-rate valves, which did show a change in the estimated brake pressure and in stopping distance (Figure 11).
Figure 8 – High Flow Valve LF with Pressure Estimate, Vehicle #1
Figure 9 – Low Flow Valve LF with Pressure Estimate, Vehicle #1
For vehicle #1, the stopping distance increased by 0.87 meters when the lower flowing valves were used. This can be seen in the first ABS cycle, which is longer than the same cycle with the nominal valves (Figures 10 and 11). After the first cycle, the wheel brake pressures are basically the same for the nominal and the low flow case despite 20 bars of error in the estimated brake pressure.
For vehicle #2, the results were the same as vehicle #1. There was a 0.8 m increase in stopping distance when using the lower flowing valves. The cause is the same as with vehicle #1: a slow pressure apply after the initial ABS release of pressure, especially on the front wheels.
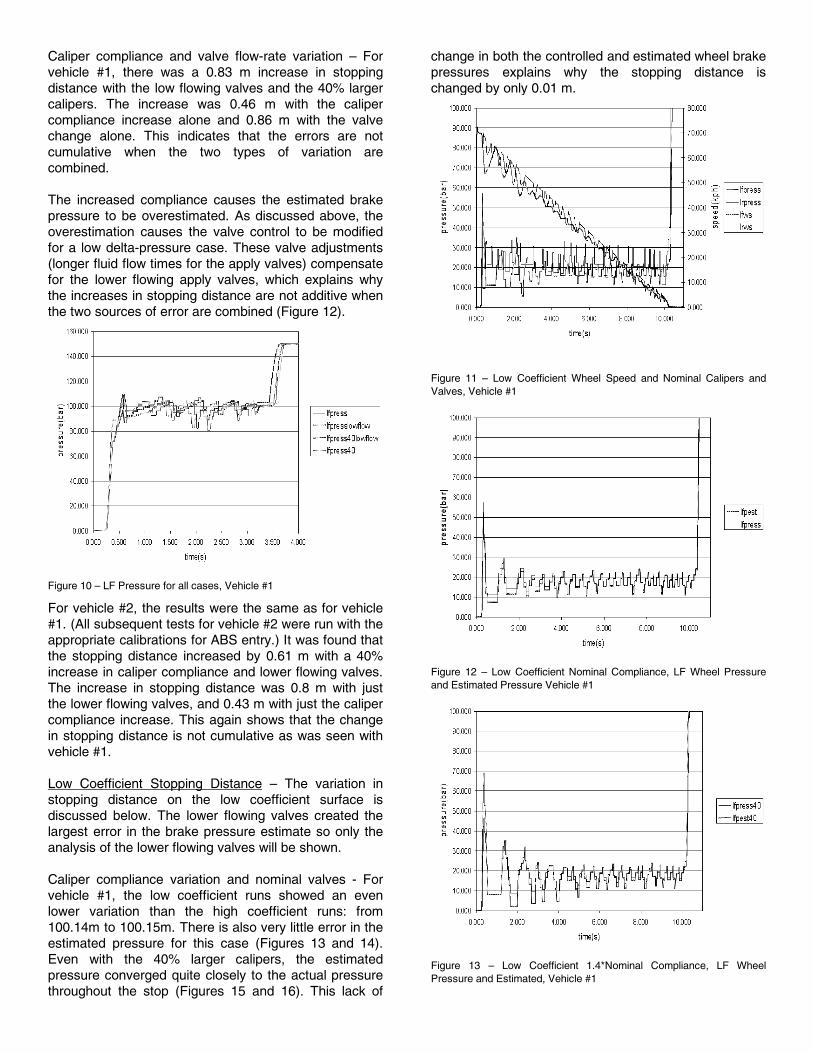
Caliper compliance and valve flow-rate variation – For vehicle #1, there was a 0.83 m increase in stopping distance with the low flowing valves and the 40% larger calipers. The increase was 0.46 m with the caliper compliance increase alone and 0.86 m with the valve change alone. This indicates that the errors are not cumulative when the two types of variation are combined.
The increased compliance causes the estimated brake pressure to be overestimated. As discussed above, the overestimation causes the valve control to be modified for a low delta-pressure case. These valve adjustments (longer fluid flow times for the apply valves) compensate for the lower flowing apply valves, which explains why the increases in stopping distance are not additive when the two sources of error are combined (Figure 12).
Figure 10 – LF Pressure for all cases, Vehicle #1
For vehicle #2, the results were the same as for vehicle #1. (All subsequent tests for vehicle #2 were run with the appropriate calibrations for ABS entry.) It was found that the stopping distance increased by 0.61 m with a 40% increase in caliper compliance and lower flowing valves. The increase in stopping distance was 0.8 m with just the lower flowing valves, and 0.43 m with just the caliper compliance increase. This again shows that the change in stopping distance is not cumulative as was seen with vehicle #1.
Low Coefficient Stopping Distance – The variation in stopping distance on the low coefficient surface is discussed below. The lower flowing valves created the largest error in the brake pressure estimate so only the analysis of the lower flowing valves will be shown.
Caliper compliance variation and nominal valves - For vehicle #1, the low coefficient runs showed an even lower variation than the high coefficient runs: from 100.14m to 100.15m. There is also very little error in the estimated pressure for this case (Figures 13 and 14). Even with the 40% larger calipers, the estimated pressure converged quite closely to the actual pressure throughout the stop (Figures 15 and 16). This lack of
change in both the controlled and estimated wheel brake pressures explains why the stopping distance is changed by only 0.01 m.
Figure 11 – Low Coefficient Wheel Speed and Nominal Calipers and Valves, Vehicle #1
Figure 12 – Low Coefficient Nominal Compliance, LF Wheel Pressure and Estimated Pressure Vehicle #1
Figure 13 – Low Coefficient 1.4*Nominal Compliance, LF Wheel Pressure and Estimated, Vehicle #1
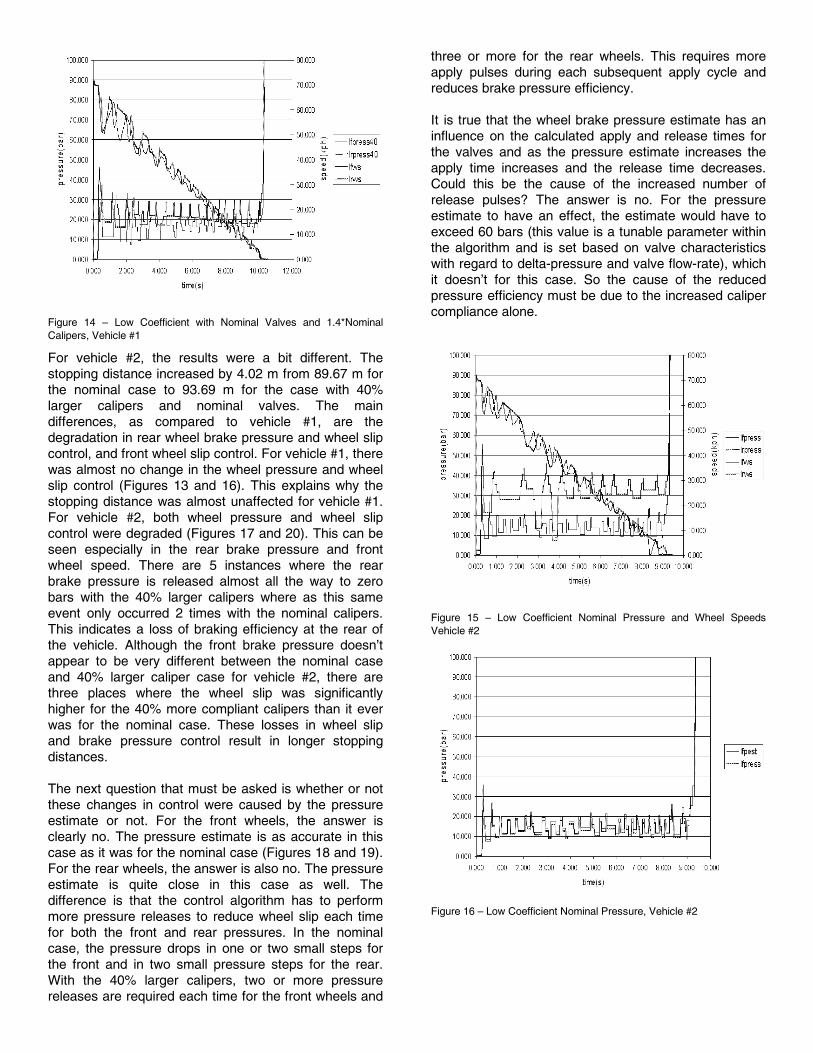
Figure 14 – Low Coefficient with Nominal Valves and 1.4*Nominal Calipers, Vehicle #1
For vehicle #2, the results were a bit different. The stopping distance increased by 4.02 m from 89.67 m for the nominal case to 93.69 m for the case with 40% larger calipers and nominal valves. The main differences, as compared to vehicle #1, are the degradation in rear wheel brake pressure and wheel slip control, and front wheel slip control. For vehicle #1, there was almost no change in the wheel pressure and wheel slip control (Figures 13 and 16). This explains why the stopping distance was almost unaffected for vehicle #1. For vehicle #2, both wheel pressure and wheel slip control were degraded (Figures 17 and 20). This can be seen especially in the rear brake pressure and front wheel speed. There are 5 instances where the rear brake pressure is released almost all the way to zero bars with the 40% larger calipers where as this same event only occurred 2 times with the nominal calipers. This indicates a loss of braking efficiency at the rear of the vehicle. Although the front brake pressure doesn’t appear to be very different between the nominal case and 40% larger caliper case for vehicle #2, there are three places where the wheel slip was significantly higher for the 40% more compliant calipers than it ever was for the nominal case. These losses in wheel slip and brake pressure control result in longer stopping distances.
The next question that must be asked is whether or not these changes in control were caused by the pressure estimate or not. For the front wheels, the answer is clearly no. The pressure estimate is as accurate in this case as it was for the nominal case (Figures 18 and 19). For the rear wheels, the answer is also no. The pressure estimate is quite close in this case as well. The difference is that the control algorithm has to perform more pressure releases to reduce wheel slip each time for both the front and rear pressures. In the nominal case, the pressure drops in one or two small steps for the front and in two small pressure steps for the rear. With the 40% larger calipers, two or more pressure releases are required each time for the front wheels and
three or more for the rear wheels. This requires more apply pulses during each subsequent apply cycle and reduces brake pressure efficiency.
It is true that the wheel brake pressure estimate has an influence on the calculated apply and release times for the valves and as the pressure estimate increases the apply time increases and the release time decreases. Could this be the cause of the increased number of release pulses? The answer is no. For the pressure estimate to have an effect, the estimate would have to exceed 60 bars (this value is a tunable parameter within the algorithm and is set based on valve characteristics with regard to delta-pressure and valve flow-rate), which it doesn’t for this case. So the cause of the reduced pressure efficiency must be due to the increased caliper compliance alone.
Figure 15 – Low Coefficient Nominal Pressure and Wheel Speeds Vehicle #2
Figure 16 – Low Coefficient Nominal Pressure, Vehicle #2
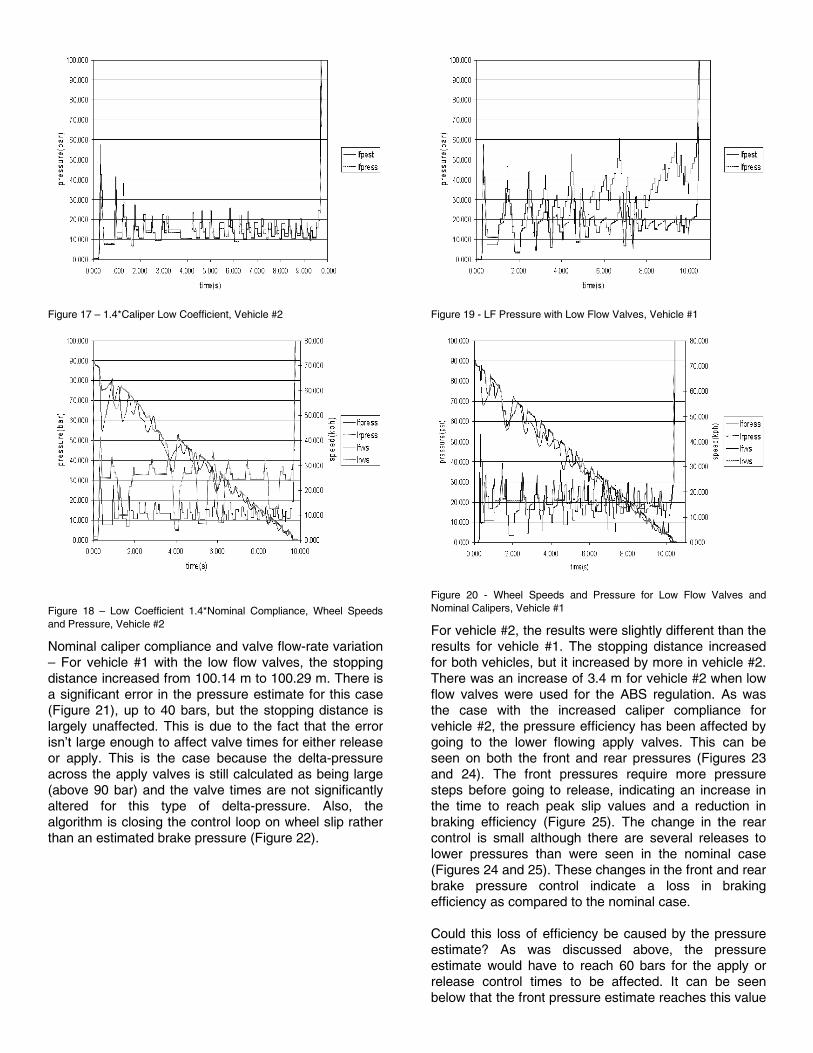
Figure 17 – 1.4*Caliper Low Coefficient, Vehicle #2
Figure 18 – Low Coefficient 1.4*Nominal Compliance, Wheel Speeds and Pressure, Vehicle #2
Nominal caliper compliance and valve flow-rate variation – For vehicle #1 with the low flow valves, the stopping distance increased from 100.14 m to 100.29 m. There is a significant error in the pressure estimate for this case (Figure 21), up to 40 bars, but the stopping distance is largely unaffected. This is due to the fact that the error isn’t large enough to affect valve times for either release or apply. This is the case because the delta-pressure across the apply valves is still calculated as being large (above 90 bar) and the valve times are not significantly altered for this type of delta-pressure. Also, the algorithm is closing the control loop on wheel slip rather than an estimated brake pressure (Figure 22).
Figure 19 - LF Pressure with Low Flow Valves, Vehicle #1
Figure 20 - Wheel Speeds and Pressure for Low Flow Valves and Nominal Calipers, Vehicle #1
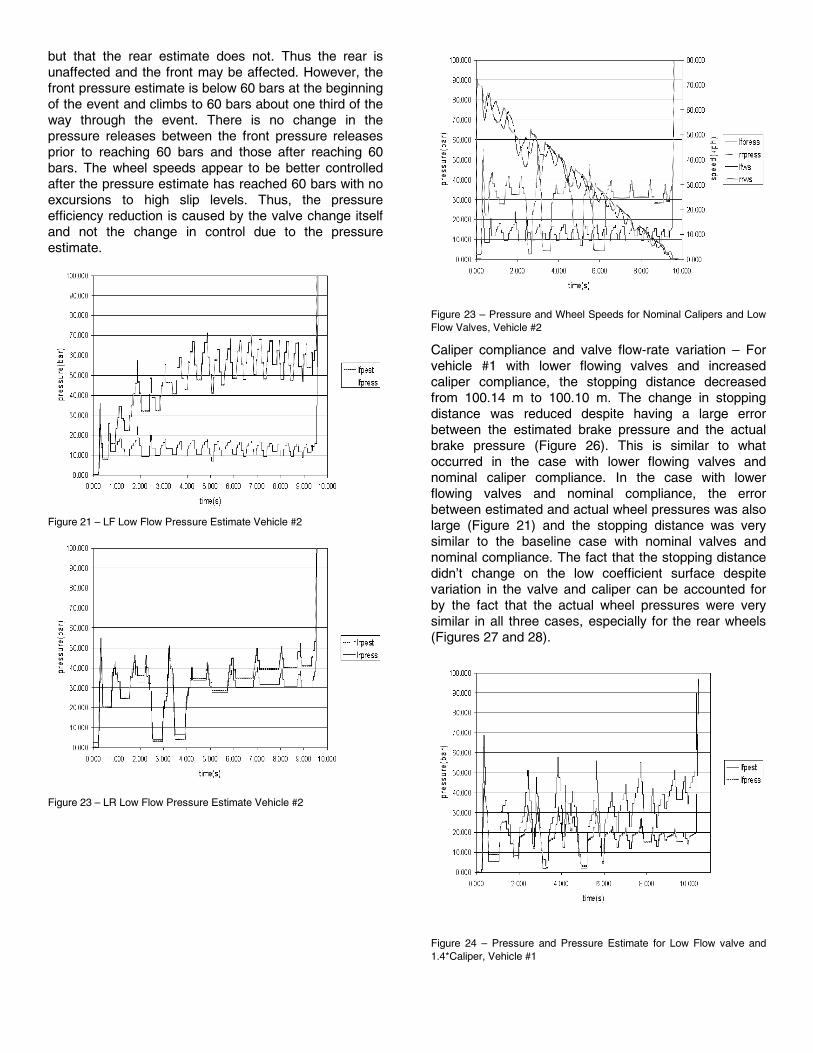
For vehicle #2, the results were slightly different than the results for vehicle #1. The stopping distance increased for both vehicles, but it increased by more in vehicle #2. There was an increase of 3.4 m for vehicle #2 when low flow valves were used for the ABS regulation. As was the case with the increased caliper compliance for vehicle #2, the pressure efficiency has been affected by going to the lower flowing apply valves. This can be seen on both the front and rear pressures (Figures 23 and 24). The front pressures require more pressure steps before going to release, indicating an increase in the time to reach peak slip values and a reduction in braking efficiency (Figure 25). The change in the rear control is small although there are several releases to lower pressures than were seen in the nominal case (Figures 24 and 25). These changes in the front and rear brake pressure control indicate a loss in braking efficiency as compared to the nominal case.
Could this loss of efficiency be caused by the pressure estimate? As was discussed above, the pressure estimate would have to reach 60 bars for the apply or release control times to be affected. It can be seen below that the front pressure estimate reaches this value
but that the rear estimate does not. Thus the rear is unaffected and the front may be affected. However, the front pressure estimate is below 60 bars at the beginning of the event and climbs to 60 bars about one third of the way through the event. There is no change in the pressure releases between the front pressure releases prior to reaching 60 bars and those after reaching 60 bars. The wheel speeds appear to be better controlled after the pressure estimate has reached 60 bars with no excursions to high slip levels. Thus, the pressure efficiency reduction is caused by the valve change itself and not the change in control due to the pressure estimate.
Figure 21 – LF Low Flow Pressure Estimate Vehicle #2
Figure 23 – LR Low Flow Pressure Estimate Vehicle #2
Figure 23 – Pressure and Wheel Speeds for Nominal Calipers and Low Flow Valves, Vehicle #2
Caliper compliance and valve flow-rate variation – For vehicle #1 with lower flowing valves and increased caliper compliance, the stopping distance decreased from 100.14 m to 100.10 m. The change in stopping distance was reduced despite having a large error between the estimated brake pressure and the actual brake pressure (Figure 26). This is similar to what occurred in the case with lower flowing valves and nominal caliper compliance. In the case with lower flowing valves and nominal compliance, the error between estimated and actual wheel pressures was also large (Figure 21) and the stopping distance was very similar to the baseline case with nominal valves and nominal compliance. The fact that the stopping distance didn’t change on the low coefficient surface despite variation in the valve and caliper can be accounted for by the fact that the actual wheel pressures were very similar in all three cases, especially for the rear wheels (Figures 27 and 28).
Figure 24 – Pressure and Pressure Estimate for Low Flow valve and 1.4*Caliper, Vehicle #1
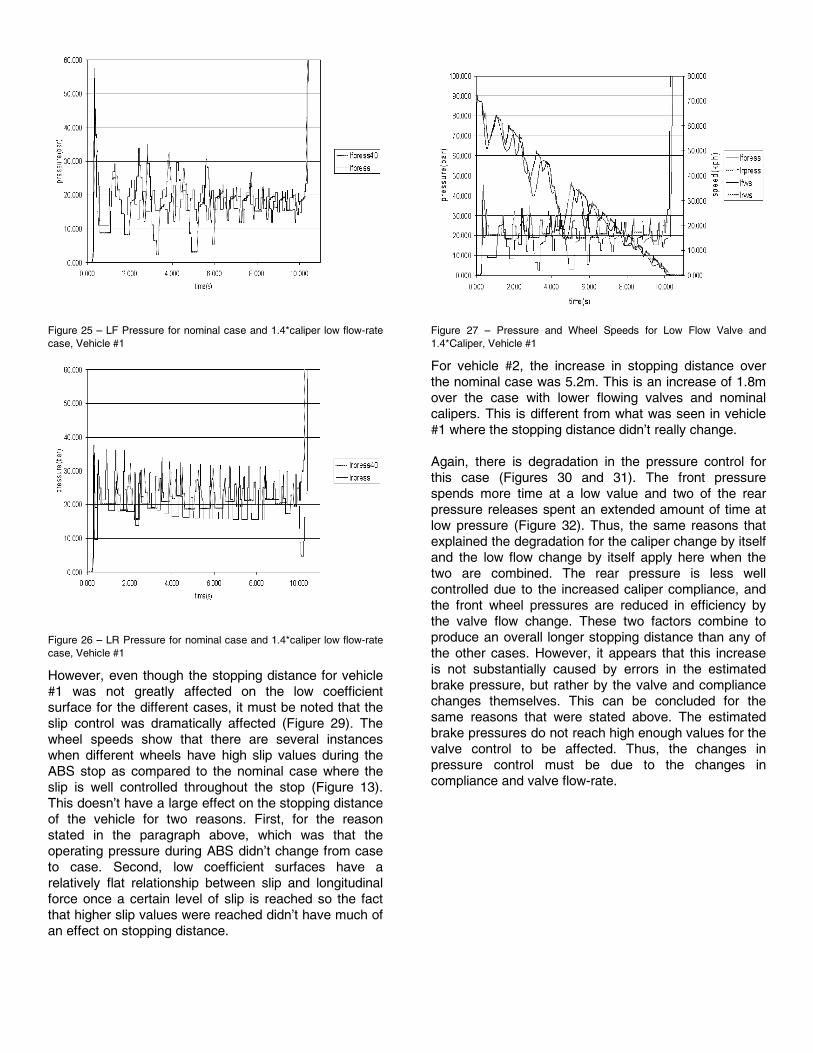
Figure 25 – LF Pressure for nominal case and 1.4*caliper low flow-rate case, Vehicle #1
Figure 26 – LR Pressure for nominal case and 1.4*caliper low flow-rate case, Vehicle #1
However, even though the stopping distance for vehicle #1 was not greatly affected on the low coefficient surface for the different cases, it must be noted that the slip control was dramatically affected (Figure 29). The wheel speeds show that there are several instances when different wheels have high slip values during the ABS stop as compared to the nominal case where the slip is well controlled throughout the stop (Figure 13). This doesn’t have a large effect on the stopping distance of the vehicle for two reasons. First, for the reason stated in the paragraph above, which was that the operating pressure during ABS didn’t change from case to case. Second, low coefficient surfaces have a relatively flat relationship between slip and longitudinal force once a certain level of slip is reached so the fact that higher slip values were reached didn’t have much of an effect on stopping distance.
Figure 27 – Pressure and Wheel Speeds for Low Flow Valve and 1.4*Caliper, Vehicle #1
For vehicle #2, the increase in stopping distance over the nominal case was 5.2m. This is an increase of 1.8m over the case with lower flowing valves and nominal calipers. This is different from what was seen in vehicle #1 where the stopping distance didn’t really change.
Again, there is degradation in the pressure control for this case (Figures 30 and 31). The front pressure spends more time at a low value and two of the rear pressure releases spent an extended amount of time at low pressure (Figure 32). Thus, the same reasons that explained the degradation for the caliper change by itself and the low flow change by itself apply here when the two are combined. The rear pressure is less well controlled due to the increased caliper compliance, and the front wheel pressures are reduced in efficiency by the valve flow change. These two factors combine to produce an overall longer stopping distance than any of the other cases. However, it appears that this increase is not substantially caused by errors in the estimated brake pressure, but rather by the valve and compliance changes themselves. This can be concluded for the same reasons that were stated above. The estimated brake pressures do not reach high enough values for the valve control to be affected. Thus, the changes in pressure control must be due to the changes in compliance and valve flow-rate.
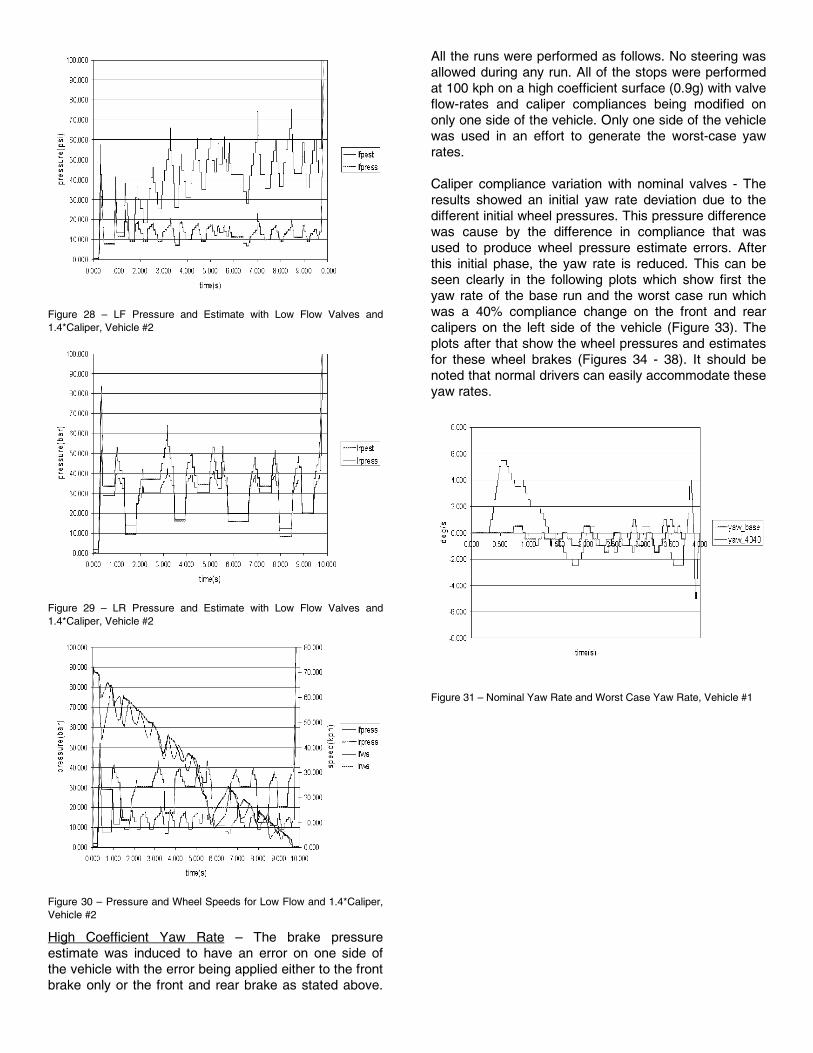
Figure 28 – LF Pressure and Estimate with Low Flow Valves and 1.4*Caliper, Vehicle #2
Figure 29 – LR Pressure and Estimate with Low Flow Valves and 1.4*Caliper, Vehicle #2
Figure 30 – Pressure and Wheel Speeds for Low Flow and 1.4*Caliper, Vehicle #2
High Coefficient Yaw Rate – The brake pressure estimate was induced to have an error on one side of the vehicle with the error being applied either to the front brake only or the front and rear brake as stated above.
All the runs were performed as follows. No steering was allowed during any run. All of the stops were performed at 100 kph on a high coefficient surface (0.9g) with valve flow-rates and caliper compliances being modified on only one side of the vehicle. Only one side of the vehicle was used in an effort to generate the worst-case yaw rates.
Caliper compliance variation with nominal valves - The results showed an initial yaw rate deviation due to the different initial wheel pressures. This pressure difference was cause by the difference in compliance that was used to produce wheel pressure estimate errors. After this initial phase, the yaw rate is reduced. This can be seen clearly in the following plots which show first the yaw rate of the base run and the worst case run which was a 40% compliance change on the front and rear calipers on the left side of the vehicle (Figure 33). The plots after that show the wheel pressures and estimates for these wheel brakes (Figures 34 - 38). It should be noted that normal drivers can easily accommodate these yaw rates.
Figure 31 – Nominal Yaw Rate and Worst Case Yaw Rate, Vehicle #1
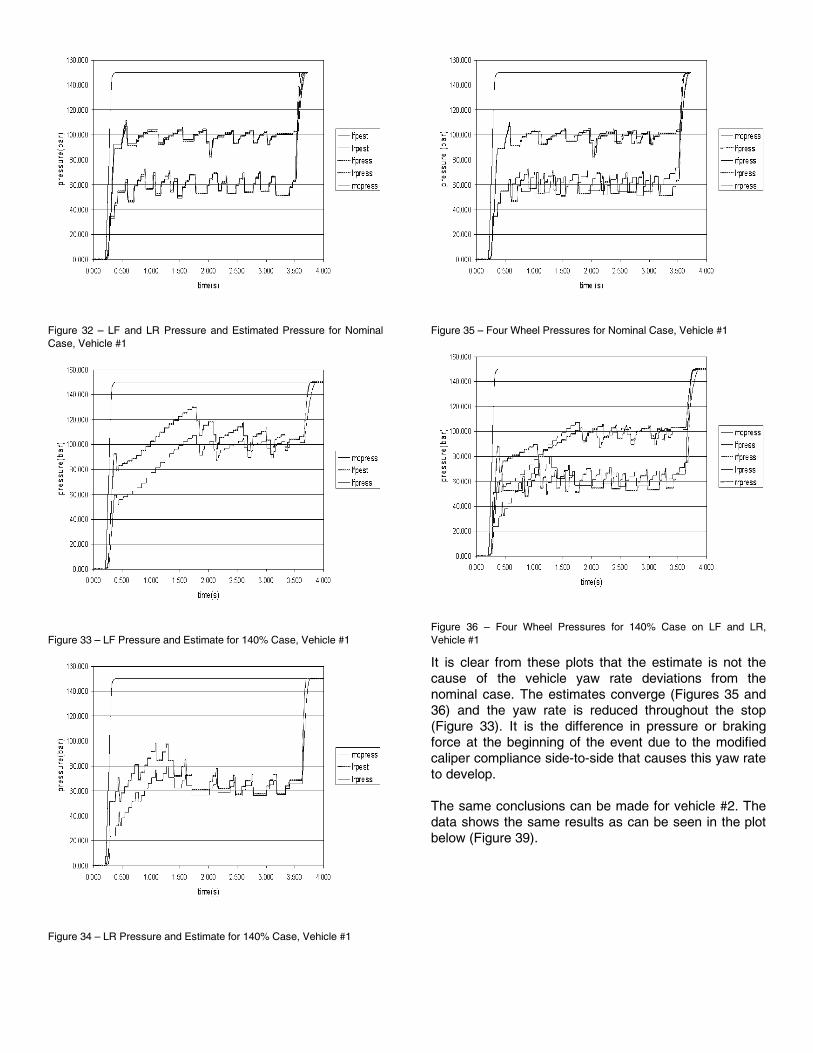
Figure 32 – LF and LR Pressure and Estimated Pressure for Nominal Case, Vehicle #1
Figure 33 – LF Pressure and Estimate for 140% Case, Vehicle #1
Figure 34 – LR Pressure and Estimate for 140% Case, Vehicle #1
Figure 35 – Four Wheel Pressures for Nominal Case, Vehicle #1
Figure 36 – Four Wheel Pressures for 140% Case on LF and LR, Vehicle #1
It is clear from these plots that the estimate is not the cause of the vehicle yaw rate deviations from the nominal case. The estimates converge (Figures 35 and 36) and the yaw rate is reduced throughout the stop (Figure 33). It is the difference in pressure or braking force at the beginning of the event due to the modified caliper compliance side-to-side that causes this yaw rate to develop. The same conclusions can be made for vehicle #2. The data shows the same results as can be seen in the plot below (Figure 39).
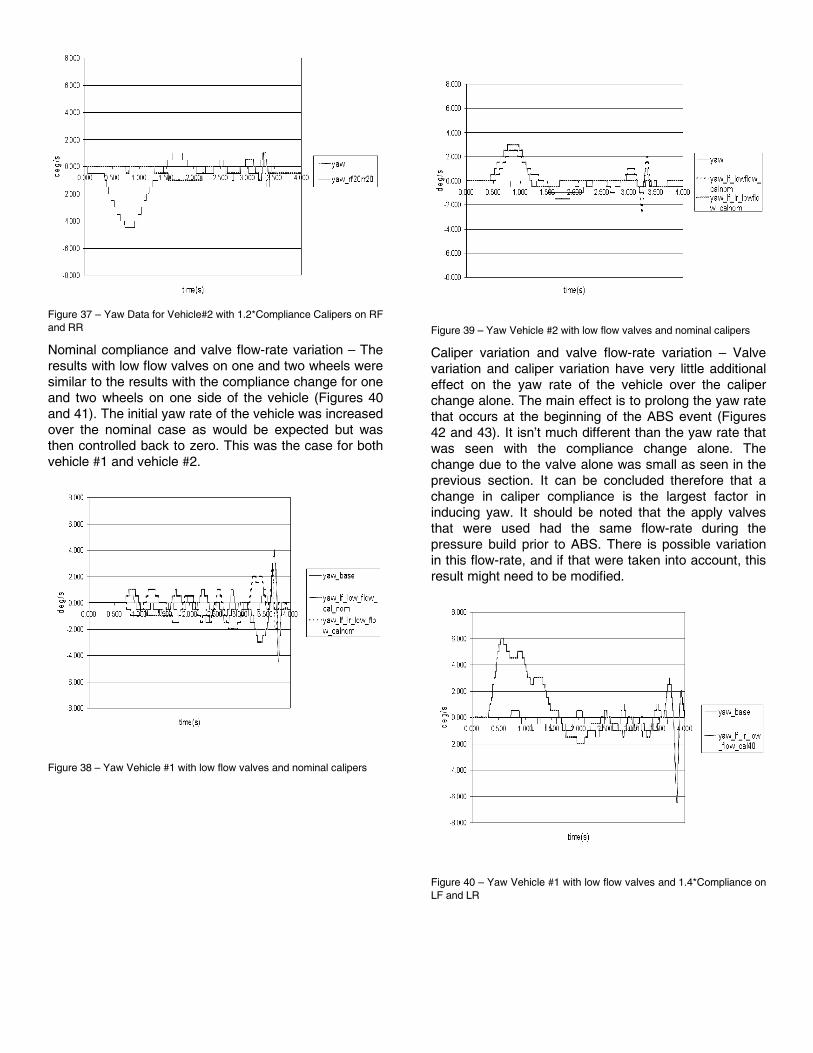
Figure 37 – Yaw Data for Vehicle#2 with 1.2*Compliance Calipers on RF and RR
Nominal compliance and valve flow-rate variation – The results with low flow valves on one and two wheels were similar to the results with the compliance change for one and two wheels on one side of the vehicle (Figures 40 and 41). The initial yaw rate of the vehicle was increased over the nominal case as would be expected but was then controlled back to zero. This was the case for both vehicle #1 and vehicle #2.
Figure 38 – Yaw Vehicle #1 with low flow valves and nominal calipers
Figure 39 – Yaw Vehicle #2 with low flow valves and nominal calipers
Caliper variation and valve flow-rate variation – Valve variation and caliper variation have very little additional effect on the yaw rate of the vehicle over the caliper change alone. The main effect is to prolong the yaw rate that occurs at the beginning of the ABS event (Figures 42 and 43). It isn’t much different than the yaw rate that was seen with the compliance change alone. The change due to the valve alone was small as seen in the previous section. It can be concluded therefore that a change in caliper compliance is the largest factor in inducing yaw. It should be noted that the apply valves that were used had the same flow-rate during the pressure build prior to ABS. There is possible variation in this flow-rate, and if that were taken into account, this result might need to be modified.
Figure 40 – Yaw Vehicle #1 with low flow valves and 1.4*Compliance on LF and LR
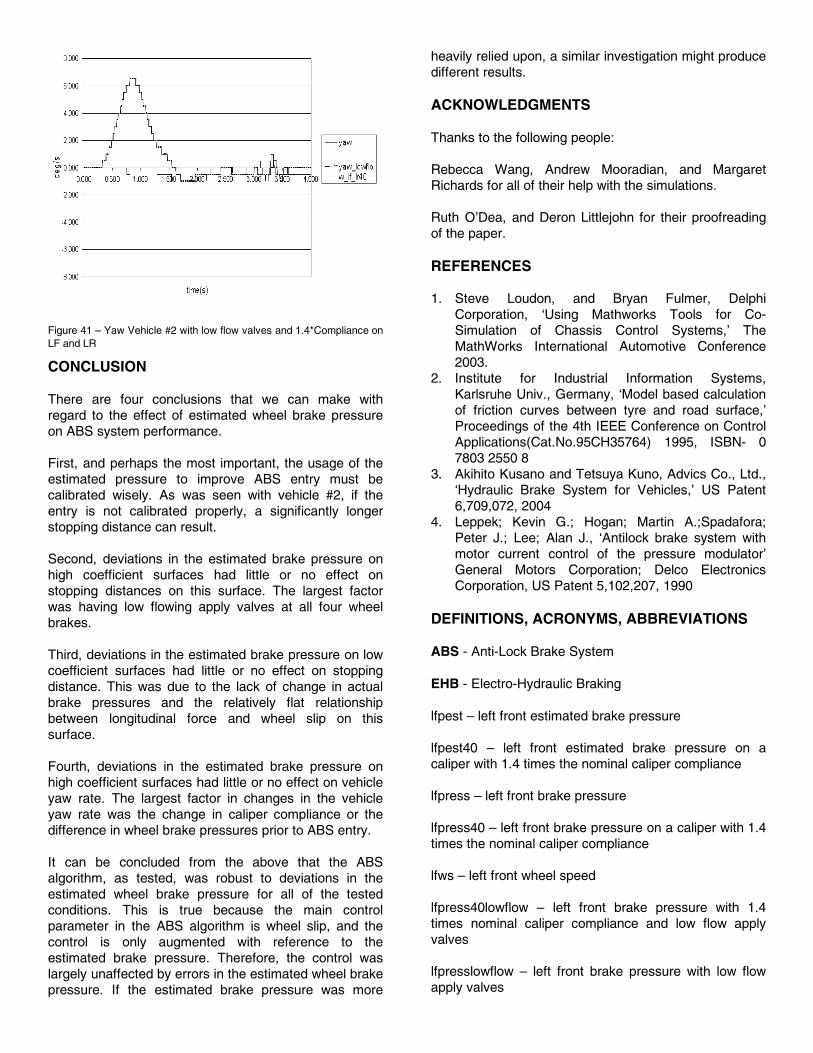
Figure 41 – Yaw Vehicle #2 with low flow valves and 1.4*Compliance on LF and LR
CONCLUSION
There are four conclusions that we can make with regard to the effect of estimated wheel brake pressure on ABS system performance.
First, and perhaps the most important, the usage of the estimated pressure to improve ABS entry must be calibrated wisely. As was seen with vehicle #2, if the entry is not calibrated properly, a significantly longer stopping distance can result.
Second, deviations in the estimated brake pressure on high coefficient surfaces had little or no effect on stopping distances on this surface. The largest factor was having low flowing apply valves at all four wheel brakes.
Third, deviations in the estimated brake pressure on low coefficient surfaces had little or no effect on stopping distance. This was due to the lack of change in actual brake pressures and the relatively flat relationship between longitudinal force and wheel slip on this surface.
Fourth, deviations in the estimated brake pressure on high coefficient surfaces had little or no effect on vehicle yaw rate. The largest factor in changes in the vehicle yaw rate was the change in caliper compliance or the difference in wheel brake pressures prior to ABS entry.
It can be concluded from the above that the ABS algorithm, as tested, was robust to deviations in the estimated wheel brake pressure for all of the tested conditions. This is true because the main control parameter in the ABS algorithm is wheel slip, and the control is only augmented with reference to the estimated brake pressure. Therefore, the control was largely unaffected by errors in the estimated wheel brake pressure. If the estimated brake pressure was more
heavily relied upon, a similar investigation might produce different results.
ACKNOWLEDGMENTS
Thanks to the following people:
Rebecca Wang, Andrew Mooradian, and Margaret Richards for all of their help with the simulations.
Ruth O’Dea, and Deron Littlejohn for their proofreading of the paper.
REFERENCES
1. Steve Loudon, and Bryan Fulmer, Delphi Corporation, ‘Using Mathworks Tools for Co-Simulation of Chassis Control Systems,’ The MathWorks International Automotive Conference 2003.
2. Institute for Industrial Information Systems, Karlsruhe Univ., Germany, ‘Model based calculation of friction curves between tyre and road surface,’ Proceedings of the 4th IEEE Conference on Control Applications(Cat.No.95CH35764) 1995, ISBN- 0 7803 2550 8
3. Akihito Kusano and Tetsuya Kuno, Advics Co., Ltd., ‘Hydraulic Brake System for Vehicles,’ US Patent 6,709,072, 2004
4. Leppek; Kevin G.; Hogan; Martin A.;Spadafora; Peter J.; Lee; Alan J., ‘Antilock brake system with motor current control of the pressure modulator’ General Motors Corporation; Delco Electronics Corporation, US Patent 5,102,207, 1990
DEFINITIONS, ACRONYMS, ABBREVIATIONS
ABS - Anti-Lock Brake System
EHB - Electro-Hydraulic Braking
lfpest – left front estimated brake pressure
lfpest40 – left front estimated brake pressure on a caliper with 1.4 times the nominal caliper compliance
lfpress – left front brake pressure
lfpress40 – left front brake pressure on a caliper with 1.4 times the nominal caliper compliance
lfws – left front wheel speed
lfpress40lowflow – left front brake pressure with 1.4 times nominal caliper compliance and low flow apply valves
lfpresslowflow – left front brake pressure with low flow apply valves
lrpest – left rear estimated brake pressure
lrpress – left rear brake pressure
lrpress40 – left rear brake pressure on a caliper with 1.4 times the nominal caliper compliance
lrws – left rear wheel speed
mcpress – master cylinder pressure
rfpest – right front brake pressure estimate
rfpress – right front brake pressure
rfws – right front wheel speed
rrpest – right rear brake pressure estimate
rrpress – right rear brake pressure
rrws – right rear wheel speed
yaw_base – vehicle yaw rate for the nominal vehicle setup
yaw_lf_low_flow_cal_nom – vehicle yaw rate with a low flow apply valve at the left front wheel and all calipers nominal
yaw_lowflow_lf_cal40 – vehicle yaw rate with a low flow apply valve at the left front wheel and a 1.4 times nominal caliper at the left front brake
yaw_lf_lr_low_flow_cal_nom – vehicle yaw rate with a low flow apply valve at the left front and left rear wheel and all calipers nominal
yaw_lf_lr_low_flow_cal40 – vehicle yaw rate with a low flow apply valve at the left front and left rear wheel and 1.4 times nominal calipers at the left front and left rear brakes
yaw_rf20rr2040 – vehicle yaw rate with 1.2 times nominal caliper compliance on the right front and right rear calipers of the vehicle
yaw_4040 – vehicle yaw rate with 1.4 times nominal caliper compliance on both calipers on one side of the vehicle