ABR Engineering: Roles and Guidelines for Setting ABR Parameters
34
Transcript of ABR Engineering: Roles and Guidelines for Setting ABR Parameters

Raj Jain
jain@cse thin horizontal


2 ABR Parameters
At the time of connection setup, ABR sources negotiate several parameters with the network. A
complete list of parameters used in the ABR mechanism is presented in table 1. The relevant
parameters are further explained as they occur in the ensuing discussion.
3 Rate Upper and Lower Bounds: PCR and MCR
3.1 Role
The peak cell rate (PCR) and the minimum cell rate (MCR) are used in source rule 1. The rule
states that source should always transmit at a rate equal to or below its computed ACR, which
cannot exceed PCR and need not go below MCR, i.e.,
MCR � ACR � PCR
Source Rate � ACR
PCR is the maximum value at which a source can transmit. It must be negotiated down and has
no default value. MCR is the minimum value that a source need not reduce its rate beyond. It is
negotiated down to the minimum acceptable MCR, MCRmin, only if MCRmin is signaled.
3.2 Values
The sources can initially set PCR to the maximum possible value if they are willing to pay for
it (for example, they can set it according to the capacity of the application or host, or the link
bandwidth of the link from the host to the next node). Of course, billing and pricing considerations
play an important role here, and sources may select a lower PCR value if they are not willing to
pay for a large one.
MCR can be set according to the user requirements (e.g., video applications require some minimum
rate guarantee), and the billing and pricing policy as well. Unless the tra�c is high priority, MCR
can be set to zero, to make the service a best e�ort one. Most applications, especially TCP/IP
applications, however, work better with an MCR greater than zero, to prevent timeouts.
3

Table 1: List of ABR Parameters
Label Expansion Units and Range Default Value Signaled?
PCR Peak Cell Rate cells/second from 0 to16M
� down
MCR Minimum Cell Rate cells/second from 0 to16M
0 down to MCRmin
ACR Allowed Cell Rate cells/second from 0 to16M
� no
ICR Initial Cell Rate cells/second from 0 to16M
PCR down
TCR Tagged Cell Rate constant 10 cells/s no
Nrm Number of cells be-tween FRM cells
power of 2 from 2 to256
32 optional
Mrm Controls bandwidthallocation
constant 2 no
between FRM, BRMand data cells
Trm Upper Bound on Inter-FRM Time
milliseconds, 100 �
power of 2 from �7 to0
100 ms optional
RIF Rate Increase Factor power of 2 from1/32768 to 1
1 down
RDF Rate Decrease Factor power of 2 from1/32768 to 1
1/32768 up, or down by �RIF decrease fac-tor
ADTF ACR Decrease TimeFactor
seconds, from 0.01 to10.23 seconds in stepsof 10 ms
0.5 s optionally down
TBE Transient Bu�er Expo-sure
cells from 0 to16,777,215
16,777,215 down
CRM Missing RM-cell Count integer of unspeci�edsize
dTBENrme computed
CDF Cuto� Decrease Factor zero or a power of 2from 1/64 to 1
1/16 optionally up
FRTT Fixed Round-TripTime
microseconds from 0 to16.7 seconds
� accumulated
4

Observe that charging considerations may limit PCR to be a multiple of MCR, i.e.,
PCR = k �MCR
where:
2 � k � 10
This makes it easier for tra�c to be shaped.
The switches can reduce the PCR and MCR according the connection admission control (CAC)
algorithm. One possible simple policy is to ensure that the following is satis�ed:
�PCRCBR +�SCRV BR +�MCRABR(including the new connection) � link bandwidth
Hence, the MCR of the new connection can be computed as:
MCRi � min(User-requested:MCRi; link bandwidth��PCRCBR��SCRVBR��j 6=iMCRABRj)
If the signaled MCR is less than the minimum acceptable MCR, i.e., MCRi < MCRmini, the
connection is rejected.
As for the PCR of the ABR connection, it is only limited by the bandwidth of the links on the
path from the source to the destination.
PCRi = min(PCRi;8j; j 2 links on path from source to destination, minimum (link bandwidth)j)
Thus, PCR and MCR are dependent on the bottleneck link bandwidth, but not on the round trip
time (RTT) of the connection.
Parameter Speed? RTT? Source initializes
according to
Switch/Dest.
modi�es accord-
ing to
PCR increases no e�ect link bandwidth orhost/application ca-pacity and pricing
bottleneck link band-width
MCR increases no e�ect application require-ments (e.g, video)and pricing
connection admissioncontrol (available re-sources)
5

4 Control of Frequency of RM Cells: Nrm, Mrm and Trm
4.1 Role
The three parameters Nrm, Mrm and Trm control the frequency of generation of resource man-
agement cells at the source. They are used in source rule 3. At any instant, sources have three
kinds of cells to send: data cells, forward RM cells, and backward RM cells (corresponding to the
reverse ow). The relative priority of these three kinds of cells is di�erent at di�erent transmission
opportunities.
The sources are required to send an FRM after every Nrm cells. But if the source rate is low,
the time between RM cells will be large and network feedback will be delayed. To overcome this
problem, a source should send an FRM cell if more than Trm milliseconds have elapsed since the
last FRM was sent. This introduces another problem for low rate sources. In some cases, at every
transmission opportunity, the source may �nd that it has exceeded Trm and needs to send an
FRM cell. In this case, no data cells will be transmitted. To overcome this problem, an additional
condition was added that there must be at least two (Mrm) other cells between FRMs.
A waiting BRM has priority over waiting data, given that no BRM has been sent since the last
FRM. Of course, if there are no data cells to send, waiting BRMs may be sent. The second and
third part of source rule 3 ensure that BRMs are not unnecessarily delayed and that all available
bandwidth is not used up by the RM cells. Figure 2 illustrates the scheduling of FRMs, BRMs and
data cells.
Figure 2: Scheduling of forward RM, backward RM, and data cells
4.2 Values
Mrm is constant at 2, and is not negotiated at connection setup. We next discuss the setting of
Nrm and Trm.
6

4.2.1 Nrm
The speci�cations [5] select a default value of 32 for Nrm to ensure that the control overhead
does not exceed approximately 6% (the value with window-based ow control). During normal
operation, 1
32
ndor 3% of all cells are FRM cells. Another 3% of cells are BRM cells resulting in a
total overhead of 6% [7]. Nrm is independent of link speed and round trip time, since it is simply
a ratio.
In practice, the choice of Nrm a�ects the responsiveness of the control and the computational
overhead at the end systems and switches. For a connection running at 155 Mbps, the inter-RM
cell time is 86.4 �s while it is 8.60 ms for the same connection running at 1.55 Mbps. The inter-RM
interval determines the responsiveness of the system. Sources, destinations, and switches may wish
to increase Nrm if their processing power is limited, or if they wish to minimize the rate variations
of the ABR connection, or increase the data cell frequency. They may wish to decrease Nrm if fast
rate changes are desirable, and responsiveness to network feedback is advantageous.
At high data rates, a small RM cell interval can result in high frequency rate variations caused
by the ABR feedback. If tra�c such as video is being transported over ABR, the rate variations
must be minimized to reduce variations in the quality of service. Users require a constant quality
of service in a real-time application such as real-time video. One way of reducing the ABR rate
changes is to send RM cells less frequently, i.e., set Nrm to a large value, instead of 32. Sending
RM cells at end of each video frame is one possible option.
In the experiments shown next, we vary Nrm and examine the allowed cell rates at the sources, as
well as the queue lengths at the switches, the link utilizations and the throughput at the destina-
tions. Since the Nrm value must be a power of two that is allowed to range between 2 and 256
(according to the current speci�cations [5]), we have conducted experiments with all the allowed
Nrm values (2, 4, 8, 16, 32, 64, 128 and 256). However, we only show the simulation results for
Nrm = 8, 32 and 256 here. The reason why we have selected these values is that values smaller
than 8 incur a very high control cell overhead and are not very realistic. 32 is the default value,
and 256 is the maximum allowed value. In our simulations, all links are 155.52 Mbps links. The
initial cell rate (ICR) of all sources is set to 150 Mbps, while the remaining ABR parameters are
set to their default values as speci�ed in the speci�cations. In particular, note that the value of the
7

rate increase factor (RIF) parameter is set to 1/16. The ERICA [13] scheme is used in this study,
with switch averaging interval set to a �xed time of 5 ms, and target utilization set to 90% of the
link capacity. The con�guration simulated consists of two ABR sources: source 1 sends data at its
ACR throughout the simulation, while source 2 is a transient source that comes on at 100 ms and
sends data for about 100 ms. All link lengths are 1000 km. The main aim of this con�guration is to
test how the responsiveness of the system is a�ected by the Nrm value, both during rate increases
and rate decreases.
ABR performance for the two source transient con�guration is shown in �gures 3 through 5 for Nrm
= 8, 32, and 256 respectively. The �gures show the ACRs of the two sources, the queue length for
switch 1, and the link utilization at the bottleneck link. In all cases, source 1 ACR quickly comes
down to its target value of about 140 Mbps. When source 2 starts to send data, the ACRs of both
sources are brought down to 70 Mbps. When source 2 stops sending data, the ACR for source 1
comes back up to 140 Mbps. There is a di�erence in the rate of increase of ACR for the three Nrm
values. Since RIF is set to 1/16, the ACR comes up in steps on the receipt of every BRM cell. With
Nrm = 8, the source receives BRMs more frequently than with Nrm = 256. As a result, the ACR
for source 1 �rst reaches 140 Mbps faster for Nrm = 8. The overhead with small Nrm values is
quite high, however. This can be clearly observed by measuring the throughput at the application
layer at the destinations (these plots are not shown here). Another interesting observation is that
for smaller Nrm values, source 1 does not start rising as fast as with larger Nrm values because the
high RM cell overhead causes the data of the second source to take a longer time to be transmitted,
and hence the two sources must share the bottleneck link for a longer time.
Table 2 shows the variation of inter-RM cell time with link speed, and with Nrm value. The source
is assumed to be sending at link rate for the values shown in the table. A general heuristic is to
use Nrm of 32 at speeds below OC-3 and to use Nrm of 256 for OC-3 and higher speeds.
Parameter Speed? RTT? Source initializes
according to
Switch/Dest.
modi�es accord-
ing to
Nrm maybe shouldincrease withspeed
no e�ect processing speedand application type(real-time shouldincrease it)
switch scheme andswitch speed
8

Table 2: Inter-RM cell time for di�erent speeds and Nrm
Total DS0 T1 OC-3 OC-24ABR Capacity 64 kbps 1.5 Mbps 155 Mbps 1.2 Gbps
Nrm = 8 0.5 s 24 ms 24 �s 3 �sNrm = 32 2.3 s 96 ms 96 �s 12 �sNrm = 256 18.4 s 768 ms 768 �s 96 �s
4.2.2 Trm
The Trm parameter is used with low rate sources, when Trm milliseconds are compared to the time
elapsed since the last in-rate FRM cell was sent. Sources may get a low ACR due to high amplitude
VBR tra�c sharing the same resources as the ABR connection, a large number of ABR sources, or
low bottleneck link speeds (T1 links). Trm allows low rate sources to sense the network state more
frequently than normal. When more bandwidth suddenly becomes available, the network may not
be able to allocate the source more bandwidth until it sees an RM cell from the source.
Smaller Trm values result in shorter time between RM cells, leading to faster transient response
(rise from low rate to high rate). Small Trm values, however, cause high overhead with low rate
sources. The choice of Trm depends on the link speed. For example, at a rate of 155 Mbps, the
inter-cell time is 2.7 �s, while at a rate of 1.5 Mbps, the inter-cell time is 270 �s, and at a rate of
2.4 Gbps, the inter-cell time is 0.42 ns. Thus, a Trm value of 100 ms seems more appropriate for
1.5�155 Mbps than with higher (2.4 Gbps+) speeds, where a Trm of 100 ms is too long to wait
before sending an FRM cell to sense the state of the network. Trm should be reduced in such cases.
The switches or destination can compare Trm to the inter cell time calculated as the reciprocal of
the negotiated PCR (which may indicate the bottleneck link bandwidth). A good value for Trm
(based on heuristics) would be:
Trm =1
PCR� c
One choice of c can be 1;000;00027
. This is based upon the intuition that 100 ms was observed to be
suitable for OC-3 links (2.7 microsecond = 0.0027 millisecond inter-cell time).
Trm is independent of the round trip time, i.e., whether the connection is local to a LAN, crosses
a WAN, or traverses a satellite link of hundreds of milliseconds delay. This is because Trm is
compared to the time since the last in-rate FRM cell was sent, so it is independent of the time the
9

ICR:149.76 149.76 149.76 149.76 / XRM:1024.00 1024.00 1024.00 1024.00 / Graph: 0
abrtrans_2.snapfile/case=Nrm/option=6209/optionb=295/dist=1000/dum1=8192/dum2=0/exp_avg
_N=0.9/t0v=1500/swdum3=1/swdum11=1/f_r=500/nrm=8/air=0.0625/icr=149.76/ / Date:08/17/98
0
20
40
60
80
100
120
140
160
0 50 100 150 200 250 300
AC
R (
Mbp
s)
Time in milliseconds
Transient: ACR for ABR sources
ACR of abr[1] ACR of abr[2]
(a) Allowed Cell Rate
ICR:149.76 149.76 149.76 149.76 / XRM:1024.00 1024.00 1024.00 1024.00 / Graph: 0
abrtrans_2.snapfile/case=Nrm/option=6209/optionb=295/dist=1000/dum1=8192/dum2=0/exp_avg
_N=0.9/t0v=1500/swdum3=1/swdum11=1/f_r=500/nrm=8/air=0.0625/icr=149.76/ / Date:08/17/98
0
1000
2000
3000
4000
5000
6000
7000
0 50 100 150 200 250 300 350
Que
ue le
ngth
(ce
lls)
Time in milliseconds
Transient: Bottleneck Queues
ABR Queue
(b) Queue Length
ICR:149.76 149.76 149.76 149.76 / XRM:1024.00 1024.00 1024.00 1024.00 / Graph: 0
abrtrans_2.snapfile/case=Nrm/option=6209/optionb=295/dist=1000/dum1=8192/dum2=0/exp_avg
_N=0.9/t0v=1500/swdum3=1/swdum11=1/f_r=500/nrm=8/air=0.0625/icr=149.76/ / Date:08/17/98
0
20
40
60
80
100
0 50 100 150 200 250 300
Lin
k U
tiliz
atio
n
Time in milliseconds
Transient: Bottleneck Link Utilization
Link utilization to sw[1]
(c) Link Utilization
Figure 3: Results for a WAN transient con�guration, Nrm = 8
10

ICR:149.76 149.76 149.76 149.76 / XRM:256.00 256.00 256.00 256.00 / Graph: 1
abrtrans_2.snapfile/case=Nrm/option=6209/optionb=295/dist=1000/dum1=8192/dum2=0/exp_avg_
N=0.9/t0v=1500/swdum3=1/swdum11=1/f_r=500/nrm=32/air=0.0625/icr=149.76/ / Date:08/17/98
0
20
40
60
80
100
120
140
160
0 50 100 150 200 250 300
AC
R (
Mbp
s)
Time in milliseconds
Transient: ACR for ABR sources
ACR of abr[1] ACR of abr[2]
(a) Allowed Cell Rate
ICR:149.76 149.76 149.76 149.76 / XRM:256.00 256.00 256.00 256.00 / Graph: 1
abrtrans_2.snapfile/case=Nrm/option=6209/optionb=295/dist=1000/dum1=8192/dum2=0/exp_avg_
N=0.9/t0v=1500/swdum3=1/swdum11=1/f_r=500/nrm=32/air=0.0625/icr=149.76/ / Date:08/17/98
0
1000
2000
3000
4000
5000
6000
7000
0 50 100 150 200 250 300
Que
ue le
ngth
(ce
lls)
Time in milliseconds
Transient: Bottleneck Queues
ABR Queue
(b) Queue Length
ICR:149.76 149.76 149.76 149.76 / XRM:256.00 256.00 256.00 256.00 / Graph: 1
abrtrans_2.snapfile/case=Nrm/option=6209/optionb=295/dist=1000/dum1=8192/dum2=0/exp_avg_
N=0.9/t0v=1500/swdum3=1/swdum11=1/f_r=500/nrm=32/air=0.0625/icr=149.76/ / Date:08/17/98
0
20
40
60
80
100
0 50 100 150 200 250 300
Lin
k U
tiliz
atio
n
Time in milliseconds
Transient: Bottleneck Link Utilization
Link utilization to sw[1]
(c) Link Utilization
Figure 4: Results for a WAN transient con�guration, Nrm = 32
11

ICR:149.76 149.76 149.76 149.76 / XRM:32.00 32.00 32.00 32.00 / Graph: 2
abrtrans_2.snapfile/case=Nrm/option=6209/optionb=295/dist=1000/dum1=8192/dum2=0/exp_avg_
N=0.9/t0v=1500/swdum3=1/swdum11=1/f_r=500/nrm=256/air=0.0625/icr=149.76/ / Date:08/17/98
0
20
40
60
80
100
120
140
160
0 50 100 150 200 250 300
AC
R (
Mbp
s)
Time in milliseconds
Transient: ACR for ABR sources
ACR of abr[1] ACR of abr[2]
(a) Allowed Cell Rate
ICR:149.76 149.76 149.76 149.76 / XRM:32.00 32.00 32.00 32.00 / Graph: 2
abrtrans_2.snapfile/case=Nrm/option=6209/optionb=295/dist=1000/dum1=8192/dum2=0/exp_avg_
N=0.9/t0v=1500/swdum3=1/swdum11=1/f_r=500/nrm=256/air=0.0625/icr=149.76/ / Date:08/17/98
0
1000
2000
3000
4000
5000
6000
7000
0 50 100 150 200 250 300
Que
ue le
ngth
(ce
lls)
Time in milliseconds
Transient: Bottleneck Queues
ABR Queue
(b) Queue Length
ICR:149.76 149.76 149.76 149.76 / XRM:32.00 32.00 32.00 32.00 / Graph: 2
abrtrans_2.snapfile/case=Nrm/option=6209/optionb=295/dist=1000/dum1=8192/dum2=0/exp_avg_
N=0.9/t0v=1500/swdum3=1/swdum11=1/f_r=500/nrm=256/air=0.0625/icr=149.76/ / Date:08/17/98
0
20
40
60
80
100
0 50 100 150 200 250 300
Lin
k U
tiliz
atio
n
Time in milliseconds
Transient: Bottleneck Link Utilization
Link utilization to sw[1]
(c) Link Utilization
Figure 5: Results for a WAN transient con�guration, Nrm = 256
12

RM cell reached the destination, or the time the RM cells returns back to the source.
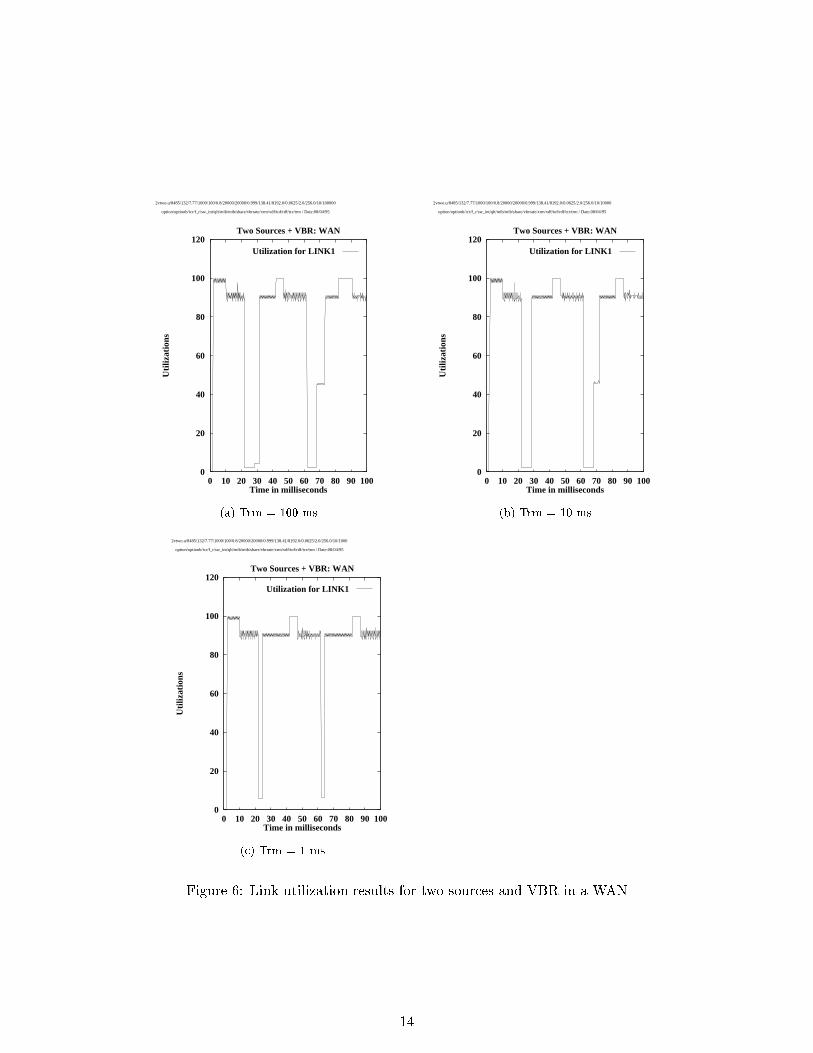
We have performed an experiment with various Trm values (1, 10 and 100 ms). We assume VBR
background tra�c always has a higher priority. We also assume a simple on/o� VBR model where
VBR is on for 20 ms and o� for 20 ms. When VBR is on, it sends at a rate of 138 Mbps. Simulation
results (see �gure 6) show that in this case, capacity may be unused for a long time for large Trm
values (100 ms), when VBR goes away and capacity for ABR becomes available. Lower Trm (1 ms
and 10 ms) results in more frequent RM cells, and hence a faster response [10]. This is especially
important for small or zero minimum cell rate.
Parameter Speed? RTT? Source initializes
according to
Switch/Dest.
modi�es accord-
ing to
Trm decreases no e�ect processing speed andapplication type
switches can reduceTrm for a high PCR,or increase it for lowswitch speed
5 Rate Increase and Decrease Factors: RIF and RDF
5.1 Role
The rate increase factor (RIF) and rate decrease factor (RDF) are used in source rules 8 and 9.
Source rules 8 and 9 describe how the source reacts to network feedback. The feedback consists of
the explicit rate (ER), congestion indication bit (CI), and no increase bit (NI). A source does not
simply change its ACR to the new ER due to the following reasons:
1. If the new ER is very high compared to current ACR, switching to the new ER may cause
sudden overload in the network. Therefore, the amount of increase is limited. The rate
increase factor (RIF) parameter determines the maximum allowed increase in any one step.
The source cannot increase its ACR by more than RIF � PCR.
2. If there are any EFCI or relative rate marking (RRM) switches in the path, they do not
change the ER �eld. Instead, they set EFCI bits in the cell headers, or CI and NI bits in
RM cells. The destination monitors EFCI bits in data cells, and returns the last seen EFCI
13
2vtwo.u/8485/132/7.77/1000/100/0.8/20000/20000/0.999/138.41/8192.0/0.0625/2.0/256.0/10/100000
option/optionb/icr/f_r/sw_int/qlt/mib/mib/share/vbrrate/xrm/xdf/tof/rdf/tcr/trm / Date:08/04/95
0
20
40
60
80
100
120
0 10 20 30 40 50 60 70 80 90 100
Uti
lizat
ions
Time in milliseconds
Two Sources + VBR: WAN
Utilization for LINK1
(a) Trm = 100 ms
2vtwo.u/8485/132/7.77/1000/100/0.8/20000/20000/0.999/138.41/8192.0/0.0625/2.0/256.0/10/10000
option/optionb/icr/f_r/sw_int/qlt/mib/mib/share/vbrrate/xrm/xdf/tof/rdf/tcr/trm / Date:08/04/95
0
20
40
60
80
100
120
0 10 20 30 40 50 60 70 80 90 100
Uti
lizat
ions
Time in milliseconds
Two Sources + VBR: WAN
Utilization for LINK1
(b) Trm = 10 ms
2vtwo.u/8485/132/7.77/1000/100/0.8/20000/20000/0.999/138.41/8192.0/0.0625/2.0/256.0/10/1000
option/optionb/icr/f_r/sw_int/qlt/mib/mib/share/vbrrate/xrm/xdf/tof/rdf/tcr/trm / Date:08/04/95
0
20
40
60
80
100
120
0 10 20 30 40 50 60 70 80 90 100
Uti
lizat
ions
Time in milliseconds
Two Sources + VBR: WAN
Utilization for LINK1
(c) Trm = 1 ms
Figure 6: Link utilization results for two sources and VBR in a WAN
14
bit in the CI �eld of a BRM. A CI of 1 means that the network is congested and that the
source should reduce its rate. The decrease is determined by the rate decrease factor (RDF)
parameter. Unlike the increase, which is additive, the decrease is multiplicative in the sense
that:
ACR ACR� (1�RDF)
3. The no-increase (NI) bit handles mild congestion by allowing a switch to specify an ER, but
instruct the source not to increase its rate if ACR is already below the speci�ed ER.
The actions corresponding to the various values of CI and NI bits are as follows:
NI CI Action
0 0 ACR min (ER, ACR + RIF � PCR, PCR)
0 1 ACR min (ER, ACR � ACR � RDF)
1 0 ACR min (ER, ACR)
1 1 ACR min (ER, ACR � ACR � RDF)
Once the ACR is updated, the subsequent cells sent from the source conform to the new ACR
value. However, if the earlier ACR was very low, it is possible that the very next cell is scheduled
a long time in the future. In such a situation, it is advantageous to \reschedule" the next cell, so
that the source can take advantage of the high ACR allocation immediately [10].
5.2 Values
RIF and RDF play an important role when the connection passes through EFCI or RRM switches.
In addition, some ER schemes work better with conservative RIF values, while others, such as
ERICA [13] are insensitive to the RIF value, and work well with an RIF of 1.
5.2.1 RIF
The rate increase factor determines the maximum increase when a BRM cell indicating underload
is received. If the RIF is set to a fraction less than one, the maximum increase at each step is
limited to RIF � the peak cell rate for the VC. Setting RIF to small values is a more conservative
strategy that controls queue growth and oscillations, especially during transient periods. It, how-
ever, may slow down the response of the system when capacity suddenly becomes available, leading
to underutilization.
15

If there are no EFCI switches in a network, setting RIF to 1 allows ACRs to increase as fast as the
network directs it (through the ER �eld). This allows the available bandwidth to be used quickly.
For EFCI networks, or a combination of ER and EFCI networks, RIF should be set conservatively
to avoid unnecessary oscillations [14]. Thus, sources can initially set RIF to large values, even 1,
according to the application requirements. During connection setup, any switch which does not
implement an explicit rate scheme or implements a scheme which requires a conservative RIF (such
as EPRCA) must reduce RIF to a conservative value such as 1/16 or less. RIF can be set to more
conservative (smaller) values for high speeds (as indicated by PCR) and long round trip times (long
delay links) to avoid congestion loss. The �xed part of the round-trip time (FRTT) is accumulated
during connection setup. This is the minimum delay along the path and does not include any
queueing delay [11].
Figures 7 and 8 compare the performance of a transient con�guration (same as the con�guration
used in the Nrm experiments) with RIF set to 1/16 (the default value) and RIF set to 1. The
basic ERICA scheme [13] is used in these simulations. Nrm is set to 256 to slow down the feedback
rate, in order to emphasize the e�ect of RIF. All other parameters are the same as with the Nrm
experiments. It is clear from �gure 7 that an RIF value of 1/16 results in a step increase of the
rate of the non-transient source when the transient source stops transmission. With RIF set to 1
(�gure 8), the rate of the non-transient source increases to the full rate as soon as the inactivity of
the transient source is detected.
Parameter Speed? RTT? Source initializes
according to
Switch/Dest.
modi�es accord-
ing to
RIF no, but may bedecreased
no, but may bedecreased
application require-ments
EFCI and RRMswitches, and ERswitches sensitive toRIF should reduce itdepending on FRTT,PCR and scheme
5.2.2 RDF
When the network is congested (the CI bit is set), the source reduces its rate as follows:
ACR ACR� (1�RDF)
16

ICR:149.76 149.76 149.76 149.76 / XRM:32.00 32.00 32.00 32.00 / Graph: 2
abrtrans_2.snapfile/case=Nrm/option=6209/optionb=295/dist=1000/dum1=8192/dum2=0/exp_avg_
N=0.9/t0v=1500/swdum3=1/swdum11=1/f_r=500/nrm=256/air=0.0625/icr=149.76/ / Date:08/17/98
0
20
40
60
80
100
120
140
160
0 50 100 150 200 250 300
AC
R (
Mbp
s)
Time in milliseconds
Transient: ACR for ABR sources
ACR of abr[1] ACR of abr[2]
(a) Allowed Cell Rate
ICR:149.76 149.76 149.76 149.76 / XRM:32.00 32.00 32.00 32.00 / Graph: 2
abrtrans_2.snapfile/case=Nrm/option=6209/optionb=295/dist=1000/dum1=8192/dum2=0/exp_avg_
N=0.9/t0v=1500/swdum3=1/swdum11=1/f_r=500/nrm=256/air=0.0625/icr=149.76/ / Date:08/17/98
0
1000
2000
3000
4000
5000
6000
7000
0 50 100 150 200 250 300
Que
ue le
ngth
(ce
lls)
Time in milliseconds
Transient: Bottleneck Queues
ABR Queue
(b) Queue Length
ICR:149.76 149.76 149.76 149.76 / XRM:32.00 32.00 32.00 32.00 / Graph: 2
abrtrans_2.snapfile/case=Nrm/option=6209/optionb=295/dist=1000/dum1=8192/dum2=0/exp_avg_
N=0.9/t0v=1500/swdum3=1/swdum11=1/f_r=500/nrm=256/air=0.0625/icr=149.76/ / Date:08/17/98
0
20
40
60
80
100
0 50 100 150 200 250 300
Lin
k U
tiliz
atio
n
Time in milliseconds
Transient: Bottleneck Link Utilization
Link utilization to sw[1]
(c) Link Utilization
Figure 7: Results for a WAN transient con�guration (Nrm = 256) RIF = 1/16
17

ICR:149.76 149.76 149.76 149.76 / XRM:32.00 32.00 32.00 32.00 / Graph: 5
abrtrans_2.snapfile/case=Nrm/option=6209/optionb=295/dist=1000/dum1=8192/dum2=0/exp_av
g_N=0.9/t0v=1500/swdum3=1/swdum11=1/f_r=500/nrm=256/air=1/icr=149.76/ / Date:08/17/98
0
20
40
60
80
100
120
140
160
0 50 100 150 200 250 300
AC
R (
Mbp
s)
Time in milliseconds
Transient: ACR for ABR sources
ACR of abr[1] ACR of abr[2]
(a) Allowed Cell Rate
ICR:149.76 149.76 149.76 149.76 / XRM:32.00 32.00 32.00 32.00 / Graph: 5
abrtrans_2.snapfile/case=Nrm/option=6209/optionb=295/dist=1000/dum1=8192/dum2=0/exp_av
g_N=0.9/t0v=1500/swdum3=1/swdum11=1/f_r=500/nrm=256/air=1/icr=149.76/ / Date:08/17/98
0
1000
2000
3000
4000
5000
6000
7000
0 50 100 150 200 250 300
Que
ue le
ngth
(ce
lls)
Time in milliseconds
Transient: Bottleneck Queues
ABR Queue
(b) Queue Length
ICR:149.76 149.76 149.76 149.76 / XRM:32.00 32.00 32.00 32.00 / Graph: 5
abrtrans_2.snapfile/case=Nrm/option=6209/optionb=295/dist=1000/dum1=8192/dum2=0/exp_av
g_N=0.9/t0v=1500/swdum3=1/swdum11=1/f_r=500/nrm=256/air=1/icr=149.76/ / Date:08/17/98
0
20
40
60
80
100
0 50 100 150 200 250 300
Lin
k U
tiliz
atio
n
Time in milliseconds
Transient: Bottleneck Link Utilization
Link utilization to sw[1]
(c) Link Utilization
Figure 8: Results for a WAN transient con�guration (Nrm = 256) RIF = 1
18

Thus the RDF parameter determines how fast the rate is reduced in case of congestion. This
multiplicative decrease only occurs if the CI bit is set, either by the switches, or by the destination
when the EFCI bits of data cells are set.
The source should initially set RDF to a moderate value. Switches should reduce RDF dependent
on the schemes they use for setting EFCI bits or CI bits. Explicit rate switches need not modify
RDF. The RDF parameter should be set more conservatively (to smaller values) for higher speeds
and longer round trip times to avoid a large amount of cell loss during congestion. Switches can
examine the round trip time (in the FRTT �eld) and bottleneck link speed (as indicated by the
PCR), and reduce RDF accordingly. If the switch or destination detects a large FRTT or large
PCR (indicating a high bottleneck link speed), then RDF should be reduced.
Parameter Speed? RTT? Source initializes
according to
Switch/Dest.
modi�es accord-
ing to
RDF no, but may bedecreased
no, but may bedecreased
application require-ments
EFCI and RRMswitches should re-duce dependent onFRTT, PCR andscheme
6 Rate Reduction under Abnormal Conditions and Startup after
Idle Periods: TBE, CRM, CDF, ICR and ADTF
Since CRM and CDF are used with source rule 6, they are both discussed together. Both CRM
and ICR are computed using the TBE parameter, so TBE and ICR are also discussed here, as well
as ADTF that is used in conjunction with ICR.
6.1 Role
We �rst discuss the rule 6 parameters, and then we discuss the rule 2 and 5 ones.
6.1.1 TBE, CRM and CDF
The three parameters transient bu�er exposure (TBE), missing RM cell count (CRM), and cuto�
decrease factor (CDF) are used in source rule 6. This rule deals with the following scenario: if a
19

network link fails, or becomes highly congested, RM cells are blocked and the source does not receive
feedback. To protect the network from continuous in- ow of tra�c under such circumstances, the
sources are required to reduce their rate if the network feedback is not received in a timely manner.
In steady state, a source should receive one BRM for every FRM sent. The sources keep a count of
the RM cells sent, and if no backward RM cells are received for a long time, the sources reduce their
rate by a factor of \Cuto� Decrease Factor (CDF)." The \long time" is de�ned as the time to send
CRM forward RM cells at the current rate. When rule 6 triggers once, the condition is satis�ed
for all successive FRM cells until a BRM is received. Thus, this rule results in a fast exponential
decrease of ACR.
CRM is computed from another parameter called transient bu�er exposure (TBE) which is ne-
gotiated at connection setup. TBE determines the maximum number of cells that may suddenly
appear at the switch during the �rst round trip before the closed-loop phase of the control takes
e�ect. During this time, the source will have sent TBE/Nrm RM cells. Hence,
CRM = dTBE
Nrme
6.1.2 ICR and ADTF
At the beginning of a connection, sources start at the initial cell rate (ICR) as speci�ed in source
rule 2. During the �rst round trip, a source may send as many as ICR � FRTT cells into the
network. Since this number is negotiated separately as TBE, the following relationship exists
between ICR and TBE:
ICR� FRTT � TBE
or:
ICR �TBE
FRTT
The sources are required to use the ICR value computed above if it is less than the ICR negotiated
with the network:
ICR used by the source = min(ICR negotiated with the network;TBE
FRTT)
According to source rule 5, the rate allowed to a source is valid only for approximately ADTF
seconds. If a source does not transmit any RM cells for this duration, it cannot use its previously
20

allocated ACR, particularly if the ACR is high. The source should re-sense the network state by
sending an RM cell and decreasing its rate to the initial cell rate (ICR) negotiated at connection
setup. If the source ACR is already below ICR, it should not increase to ICR. The timeout interval
is set to the ACR Decrease Time Factor (ADTF) parameter, whose default value is 500 ms.
Rule 5 is intended to solve the problem of ACR retention, when a source retains a rate allocated
to it under light loads, and uses it when the network is highly loaded, causing congestion. Several
solutions to this problem (called use it or lose it (UILI) solutions) were proposed [19, 12]. The
ATM Forum standardized a policy that reduces ACR to ICR when the timeout ADTF expires.
Vendors are free to implement additional proprietary restraints at the source or at the switch.
6.2 Values
We �rst discuss the value of TBE and the two parameters which depend on it (CRM and ICR).
Then, we discuss CDF, and �nally ADTF.
6.2.1 TBE, CRM, and ICR
As previously mentioned, TBE determines the exposure of the switch to sudden tra�c transients.
It determines the the number of cells that may be received at the switch during initial start up (or
after any long idle period of time). TBE is speci�ed in cells while CRM is speci�ed in RM cells.
Since there is one RM cell per Nrm cells, the relationship between CRM and TBE is as follows:
CRM dTBE=Nrme
In negotiating TBE, the switches have to consider their bu�er availability. As the name indicates,
the switch may be suddenly exposed to TBE cells during the �rst round trip (and also after long
idle periods). For small bu�ers, TBE should be small and vice versa. On the other hand, TBE
should also be large enough to prevent unnecessary triggering of rule 6 on long delay paths or with
very high speeds. Thus TBE is highly a�ected by speed and round trip time (the delay bandwidth
product of the connection).
TBE can thus be set to:
PCR� FRTT +�i; i 2 fswitches on pathg;bu�er sizes
21

to account for the speed, link delays, and bu�er sizes.
E�ect of speed and round trip time on TBE and CRM:
For long-delay links, such as satellite links, our simulation results revealed that source rule 6 can
unnecessarily trigger and cause oscillations during start up and after idle periods, unless TBE is
large enough. This can degrade the throughput considerably. Figure 9 shows the con�guration
used to illustrate the problem. All the links are OC-3 links operating at a rate of 155.52 Mbps.
The link connecting the two switches is a satellite link, while the links connecting the switches to
the end systems are each 1 km long. The one-way propagation delay of the satellite link is 275 ms,
while the propagation delay of each LAN link is 5 microseconds. The tra�c is bidirectional, and the
sources are persistent. The ERICA [13] algorithm is used with target utilization 90%. The ABR
source parameter values are as follows: PCR = 155.52 Mbps, MCR = 0 Mbps, ICR = 0.9�PCR
= 140 Mbps, Nrm = 32, RIF = 1, CDF = 1/16, and CRM = 32, 256, 1024, 4096, 6144, 8192.
Figure 9: One source con�guration
Figure 10 illustrates the performance of the system with CRM set to 32 (the default value before
August 1995). Figure 10(a) shows the allowed cell rate of the source over 1200 ms, and �gure 10(b)
shows the number of cells received at the destination during the same period of time [3]. As seen
in �gure 10(a), the initial rate is 140 Mbps (90% of 155 Mbps). After sending 32 RM cells (or
CRM�Nrm = 32�32 = 1024 cells), rule 6 triggers and the rate rapidly drops. The �rst feedback
is received from the network after around 550 ms (275 ms�2), because the one-way delay of the
satellite link is 275 ms. The network asks the source to go up to 140 Mbps. The source increases its
rate but rule 6 triggers again. The rule triggers again because the time between returning RM cells
is large (they were sent at a low rate). This phenomenon of increase and decrease repeats resulting
in high-frequency oscillations between very low rates and very high rates. The rapid rate drops
occur due to the triggering of source rule 6, while the rate increases occur because the network
feedback is consistently at 140 Mbps (90% of 155 Mbps).
22

0
20
40
60
80
100
120
140
160
180
0 200 400 600 800 1000 1200
Rat
es
Time in milliseconds
One Source: Satellite
Rate for S1
(a) Allowed Cell Rate (ACR)
0
5000
10000
15000
20000
25000
30000
35000
40000
45000
0 200 400 600 800 1000 1200
Cel
ls R
ecei
ved
Time in milliseconds
One Source: Satellite
Cells Received at dS1
(b) Cells Received at Destination
Figure 10: Simulation results for a one source con�guration. CRM = 32.
Figure 10(b) shows the number of cells received at the destination. From this �gure, it is possible
to compute instantaneous throughput by computing the slope of the curve. It is also possible to
compute average throughput over any interval by dividing the cells received (increase in the y-value)
during that interval by the period of time (x-value) of the interval. The average throughput during
the interval from 275 ms to 825 ms is 32 Mbps and that during the interval from 825 ms to 1200 ms
is 45 Mbps. During the �rst 550 ms, the source is mostly sending at a very low rate until the �rst
feedback is received after about 550 ms. The e�ect of the receipt of feedback can be observed at
the destination after 550+275=825 ms. After the �rst feedback is received, the rate oscillations
result in reduced throughput. The results do not signi�cantly vary for di�erent values of CDF. The
low throughput values in �gure 10(b) are a result of the unnecessary triggering of source rule 6 for
small CRM values. Rule 6 limits the number of cells that can be in ight during start up periods.
For full throughput, we need to set the value of TBE such that the number of cells in ight can be
as large as those required to �ll the path both ways. This number is equal to the round trip time
(FRTT) multiplied PCR. Hence, the number of RM cells in ight (CRM) should be (1/Nrm)th of
this value:
CRM �FRTT� PCR
Nrm
23

For 155 Mbps links, CRM should be greater than or equal to 6144 (550 ms�365 cells per ms/32
cells). For 622 Mbps links, CRM should be greater than or equal to 24576 (6144�4). For two
622 Mbps satellite hops, CRM should be greater than or equal to 49152 (24576�2). For n 622 Mbps
satellite hops, CRM should be greater than or equal to 24576�n. Since the size of the TBE
parameter is 24 bits and Nrm is normally 32, a 24-bit TBE allows a 19-bit CRM, which is su�cient
for most situations (long delay links and high speeds).
E�ect of TBE on queue sizes:
It has been incorrectly believed that cell loss could be avoided by simply negotiating a TBE value
below the number of available bu�ers in the switches. We show in [8] that it is possible to construct
workloads where queue sizes could be unreasonably high even when TBE is very small. TBE limits
the queue length only during initial startup and after idle periods when there are no previous cells
in the network from the same VC. In this case, the queue length can be given by the following
equation:
Queue length = (number of sources� 1)�min(TBE;burst size)
TBE cannot be relied upon during the closed-loop operation phase of a connection. During this
latter phase, the contribution of a VC to the queue at a switch can be more than its TBE. The
bu�er usage at a switch can be more than the sum of TBEs allocated to active VCs. In steady
state, rule 6 rarely triggers and is overridden by subsequent explicit feedbacks. Since the reverse
ow is not stopped completely, the forward ow continues and keeps �lling the queues. TBE does
not signi�cantly a�ect the maximum queue length.
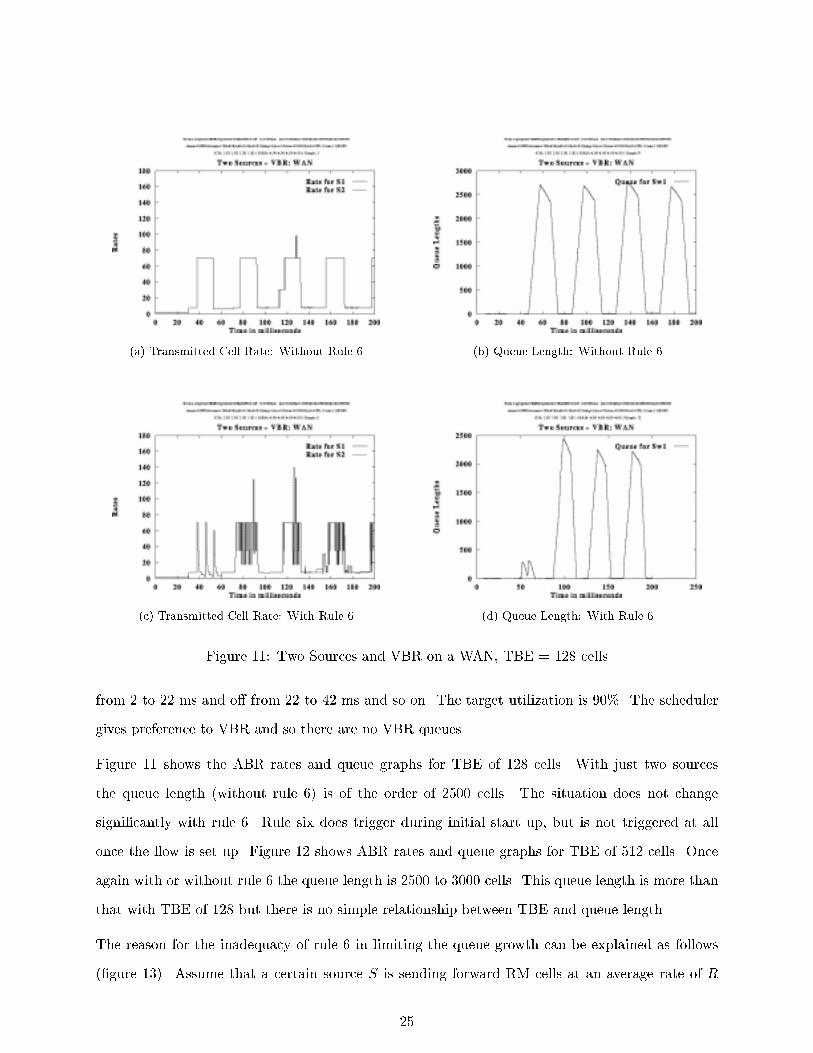
Figures 11 and 12 show ACR and queue lengths for a network consisting of two ABR and one
VBR sources going through two switches to corresponding destination. All simulation results use
ERICA switch algorithm [13]. All links are 155 Mbps and 1000 km long. All VCs are bidirectional,
that is, D1, D2, VD1 are also sending tra�c to S1, S2 and VS1. The following parameter values
are used: PCR = 155.52 Mbps, MCR = 0 Mbps, ICR = min155.52, TBE/FRTT, RIF = 1, Nrm =
32, RDF = 1/512, CRM = TBE/Nrm, Trm = 100 ms, FRTT = 30 ms, TBE = f128, 512, 1024g
(three values), CDF = f0, 0.5g = fWithout rule 6, With Rule 6g. The VBR source generates a
square waveform of 20 ms on and 20 ms o�. During on period, its amplitude is 80% of the link
rate. During o� period, the amplitude is zero. The �rst VBR pulse starts at t=2 ms. Thus, it is on
24
(a) Transmitted Cell Rate: Without Rule 6
(b) Queue Length: Without Rule 6
(c) Transmitted Cell Rate: With Rule 6
(d) Queue Length: With Rule 6
Figure 11: Two Sources and VBR on a WAN, TBE = 128 cells
from 2 to 22 ms and o� from 22 to 42 ms and so on. The target utilization is 90%. The scheduler
gives preference to VBR and so there are no VBR queues.
Figure 11 shows the ABR rates and queue graphs for TBE of 128 cells. With just two sources
the queue length (without rule 6) is of the order of 2500 cells. The situation does not change
signi�cantly with rule 6. Rule six does trigger during initial start up, but is not triggered at all
once the ow is set up. Figure 12 shows ABR rates and queue graphs for TBE of 512 cells. Once
again with or without rule 6 the queue length is 2500 to 3000 cells. This queue length is more than
that with TBE of 128 but there is no simple relationship between TBE and queue length.
The reason for the inadequacy of rule 6 in limiting the queue growth can be explained as follows
(�gure 13). Assume that a certain source S is sending forward RM cells at an average rate of R
25

(a) Transmitted Cell Rate: Without Rule 6
(b) Queue Length: Without Rule 6
(c) Transmitted Cell Rate: With Rule 6
(d) Queue Length: With Rule 6
Figure 12: Two Sources and VBR on a WAN, TBE = 512 cells
26

Figure 13: Source rule 6 does not trigger if BRM ow is maintained
cells per second (cps). The RM cells are turned around by the destination and the backward RM
cells are received by S at a di�erent rate r cps. In this case, the inter-forward-RM cell time at the
source is 1=R while the inter-backward-RM cell time at the source is 1=r. Source end system Rule
6 will trigger at S if the inter-backward-RM time is much larger (more than CRM times larger)
than the inter-forward-RM time [8]. That is, if:
1=r � CRM� (1=R)
or:
R � CRM� r
In the case of initial startup, r is zero and so after TBE cells, rule 6 triggers and protects the
sources. Similarly, in the case of a bursty source, r is zero and rule 6 triggers after TBE cells.
However, if the BRM ow is not totally stopped and R < CRM � r, then the cells can accumulate
in the network at the rate of (R � r)�Nrm and not trigger rule 6. In such cases, the queues can
grow substantially. The maximum queue length is a function of PCR, the target utilization, and
the VBR amplitude, multiplied by the feedback delay [8].
Parameter Speed? RTT? Source initializes
according to
Switch/Dest.
modi�es accord-
ing to
TBE increases increases application type,pricing and hostcapacity
bu�ering and re-sources, and PCRand FRTT
ICR:
ICR should be set by the source as desired according to pricing and the application type. For
TCP/IP applications and lower link speeds, ICR should be close to the peak cell rate (PCR).
Switches should reduce their ICR to re ect their availability of bu�ers, as well as the bandwidth
available for the connection. ICR is related to the availability of resources as computed during
27

connection setup, and should correspond to the anticipated ACR for the connection at that time.
Finally, the source takes the minimum of that ICR and TBEFRTT
to correspond to the rate at which
the source should initially send for the �rst round trip or after idle periods, before feedback is
received. ICR depends on the bottleneck link speed and the round trip time.
Parameter Speed? RTT? Source initializes
according to
Switch/Dest.
modi�es accord-
ing to
ICR increases source takesminimum ofsignaled ICRand TBE
FRTT
pricing, host capacityand application
bu�ering and re-sources, PCR andFRTT
6.2.2 CDF
When source rule 6 is triggered, the source reduces its rate by a factor of CDF, but not below the
minimum cell rate. That is,
ACR max(MCR;ACR�ACR� CDF)
where the value of CDF can be zero (for no rate decrease), or it can be a power of two that ranges
from 1/64 to 1.
This means that after CRM RM cells are sent (or CRM�Nrm total cells are sent), and no backward
RM cell is received:
ACR = ACRinitial � (1� CDF)
Note that if rule 6 is triggered once, it usually triggers on sending successive forward RM cells (as
long as no backward RM cells are being received).
Thus, after CRM+1 RM cells (or (CRM+1)�Nrm cells) are sent:
ACR = ACRinitial � (1� CDF)2
After CRM+k RM cells (or (CRM+k)�Nrm cells) are sent:
ACR = ACRinitial � (1� CDF)k+1
Such repeated rate reductions result in an exponential rate drop when source rule 6 triggers, as
long as no feedback is being received as shown in �gure 14.
28

Figure 14: Rule 6 results in a sudden drop of rate
The smaller CDF value, the more rapid the rate decrease when rule 6 is triggered. It is possible
to disable source rule 6, by setting CDF to zero. This may be desirable if TBE cannot be set to a
reasonable value, or if TBE must be set to a low value to decrease ICR, but rule 6 should not be
triggered unnecessarily. However, disabling rule 6 in this manner risks a large amount of cell loss
in case of link failures or congestion collapse. CDF may be set to smaller values for high speeds
and long RTTs to avoid big losses. It is set according to the application type, con�dence in TBE
value, con�dence in links, and availability of resources.
Parameter Speed? RTT? Source initializes
according to
Switch/Dest.
modi�es accord-
ing to
CDF may be smallerfor high speeds
may be smallerfor long RTTs
application type,con�dence in TBEvalue
con�dence in TBEvalue, con�dence inlinks, availability ofresources
6.2.3 ADTF
As previously mentioned, the purpose of the ADTF timeout is to avoid the ACR retention problem
that may cause congestion. ACR retention can cause sudden queue growth of:
(ACR� source rate)� feedback delay� (number of sources� 1)
VCs that disable rule 5 (e.g., by setting ICR=PCR) can be vulnerable to sudden arrivals. The
default value of 500 ms was selected to correspond to the timer granularity used with most TCP/IP
implementations using slow start.
ADTF especially a�ects bursty tra�c. ADTF is independent of the bottleneck link speed of the
connection since tra�c is smoothed in the ATM network. ADTF should be larger than the round
29

trip time:
ADTF > RTT
to prevent unnecessary rate reductions for long round trip times. Sources can set ADTF according
to the application tra�c characteristics (the expected burstiness of the tra�c). Switches can reduce
ADTF if they have little available resources.
Parameter Speed? RTT? Source initializes
according to
Switch/Dest.
modi�es accord-
ing to
ADTF no e�ect no e�ect (mayincrease)
application tra�ccharacteristics
if little availableresources, reduceADTF
7 Upper Bound on Out of Rate RM Cells: TCR
Although the tagged cell rate (TCR) is not signaled, we include a brief discussion here on its role,
and the signi�cance of the value chosen for it.
7.1 Role
As stated in source rule 11, the out-of-rate FRM cells generated by sources are limited to to a
rate below the tagged cell rate (TCR) parameter, which has a default value of 10 cells per second.
7.2 Values
Although higher TCR values improve transient response with zero or very low ACRs, since feedback
is more frequent, increased TCR does increase the RM cell overhead in such cases. Rescheduling
becomes important in cases where ACR is very low and the new ACR will allow cells to be scheduled
earlier than their previously scheduled time [10]. There are currently no guidelines on how to space
out-of-rate RM cells.
It seems like TCR should depend on the bottleneck link speed, and perhaps a ratio, such as Nrm,
should be used. 10 cells per second may be too low for very high speeds, e.g., 2.4 Gbps+. Perhaps it
would be better to state, for example, that no more thanx%, say 2:7�10�5% of the link bandwidth
should be used for out-of-rate RM cells. The value 2:7 � 10�5% is based on the intuition that 10
30

cells per second seems to be a good value for OC-3 links (10 cells per second out of 365 cells per
millisecond).
8 Summary
Table 3 summarizes the discussion in this paper (the conclusions from individual sections are just
repeated for faster reference). For each of the parameters, the table indicates what the value the
source end system sets for the parameter, how switches and destinations negotiate the parameter,
how the parameter is a�ected by link speeds, and how it is a�ected by the round trip time of the
connection.
References
[1] Flavio Bonomi and Kerry W. Fendick. Rate-based ow control framework for the available bit
rate ATM service. IEEE Network Magazine, 9(2):25{39, March/April 1995.
[2] Thomas M. Chen, Steve S. Liu, and Vijay K. Samalam. The available bit rate service for data
in ATM networks. IEEE Communications Magazine, 34(5):12, May 1996.
[3] Sonia Fahmy, Raj Jain, Shivkumar Kalyanaraman, Rohit Goyal, and Fang Lu. On source rules
for ABR service on ATM networks with satellite links. In Proceedings of the First International
Workshop on Satellite-based Information Systems, pages 108{115, Rye, New York, November
1996.
[4] Kerry W. Fendick. Evolution of controls for the available bit rate service. IEEE Communica-
tions Magazine, 34(11):35{39, November 1996.
[5] The ATM Forum. The ATM forum tra�c management speci�cation version 4.0.
ftp://ftp.atmforum.com/pub/approved-specs/af-tm-0056.000.ps, April 1996.
[6] G. Hasegawa, H. Ohsaki, M. Murata, and H. Miyahara. Performance evalulation and parameter
tuning of TCP over ABR service in ATM networks. IEICE transactions on communications,
E79-B(5):668{683, May 1996.
31

Table 3: Summary of Parameter Value Recommendations
Parameter Speed? RTT? Source initializes
according to
Switch/Dest.
modi�es accord-
ing to
PCR increases no e�ect link bandwidth orhost/application ca-pacity and pricing
bottleneck link band-width
MCR increases no e�ect application require-ments (e.g, video)and pricing
connection admissioncontrol (available re-sources)
ICR increases source takesminimum ofsignaled ICRand TBE
FRTT
pricing, host capacityand application
bu�ering and re-sources, PCR andFRTT
Nrm maybe shouldincrease withspeed
no e�ect processing speedand application type(real-time shouldincrease it)
switch scheme andswitch speed
Trm decreases no e�ect processing speed andapplication type
switches can reduceTrm for a high PCR,or increase it for lowswitch speed
RIF no, but may bedecreased
no, but may bedecreased
application require-ments
EFCI and RRMswitches and ERswitches sensitive toRIF should reduce itdepending on FRTT,PCR and scheme
RDF no, but may bedecreased
no, but may bedecreased
application require-ments
EFCI and RRMswitches should re-duce dependent onFRTT, PCR andscheme
ADTF no e�ect no e�ect (mayincrease)
application tra�ccharacteristics
if little availableresources, reduceADTF
TBE increases increases application type,pricing and hostcapacity
bu�ering and re-sources, and PCRand FRTT
CDF may be smallerfor high speeds
may be smallerfor long RTTs
application type,con�dence in TBEvalue
con�dence in TBEvalue, con�dence inlinks, availability ofresources
32

[7] R. Jain. Congestion control and tra�c management in ATM networks: Recent advances and
a survey. Computer Networks and ISDN Systems, 28(13):1723{1738, November 1996.
[8] Raj Jain, Sonia Fahmy, Shivkumar Kalyanaraman, Rohit Goyal, Fang Lu, and Saragur
Srinidhi. More strawvote comments: TBE vs queue sizes. ATM Forum/95-1661, December
1995.
[9] Raj Jain, Shivkumar Kalyanaraman, Sonia Fahmy, Rohit Goyal, and S. Kim. Source behav-
ior for ATM ABR tra�c management: An explanation. IEEE Communications Magazine,
34(11):50{57, November 1996.
[10] Raj Jain, Shivkumar Kalyanaraman, Sonia Fahmy, and Fang Lu. Out-of-rate RM cell issues
and e�ect of Trm, TOF, and TCR. ATM Forum/95-0973R1, August 1995.
[11] Raj Jain, Shivkumar Kalyanaraman, Sonia Fahmy, and Fang Lu. Straw-vote comments on
TM 4.0 R8. ATM Forum/95-1343, October 1995.
[12] Raj Jain, Shivkumar Kalyanaraman, Rohit Goyal, Sonia Fahmy, and Fang Lu. A �x for source
end system rule 5. ATM Forum/95-1660, December 1995.
[13] Raj Jain, Shivkumar Kalyanaraman, Rohit Goyal, Sonia Fahmy, and Ram Viswanathan. ER-
ICA switch algorithm: A complete description. ATM Forum/96-1172, August 1996.
[14] A. Koike, H. Kitazume, H. Saito, and M. Ishizuka. On end system behavior for explicit
forward congestion indication of ABR service and its performance. IEICE transactions on
communications, E79-B(4):605{610, April 1996.
[15] Ram Krishnan. Rate based control schemes for ABR tra�c - design principles and performance
comparison. In Proceedings of the IEEE global telecommunications conference (GLOBECOM),
volume 2, pages 1231{1235, November 1996.
[16] D. Lee, K. K. Ramakrishnan, W. M. Moh, and A. U. Shankar. Protocol speci�cation using
parameterized communicating extended �nite state machines- a case study of the ATM ABR
rate control scheme. In Proceedings of ICNP, pages 208{217, October 1996.
33

[17] D. Lee, K. K. Ramakrishnan, W. M. Moh, and A. U. Shankar. Performance and correctness of
the ATM ABR rate control scheme. In Proceedings of the IEEE INFOCOM, volume 2, pages
785{794, March 1997.
[18] H. Ohsaki, M. Murata, and H. Miyahara. Robustness of rate-based congestion control algo-
rithm for ABR service class in ATM networks. In Proceedings of the IEEE global telecommu-
nications conference (GLOBECOM), volume 2, pages 1097{1101, November 1996.
[19] K. K. Ramakrishnan, P. P. Mishra, and K. W. Fendick. Examination of alternative mechanisms
for use-it-or-lose-it. ATM Forum/95-1599, December 1995.
[20] H. Saito, K. Kawashima, H. Kitazume, A. Koike, M. Ishizuka, and A. Abe. Performance issues
in public ABR service. IEEE Communications Magazine, 34(11):40{48, November 1996.
[21] Nanying Yin. Analysis of a rate-based tra�c management mechanism for ABR service. In
Proceedings of the IEEE global telecommunications conference (GLOBECOM), volume 2, pages
1076{1082, November 1995.
AUTHOR'S NOTE:
Some of the graphs have some text in a very small font on top. This is just used to mark the
parameter values used in the simlation, and will not appear in the �nal version of the paper.
34