about US oil spill trends - EPA Archives · Oil Spills in EPA Jurisdiction Oil Spills in EPA...
21
Transcript of about US oil spill trends - EPA Archives · Oil Spills in EPA Jurisdiction Oil Spills in EPA...

Dagmar Schmidt Etkin, PhDDagmar Schmidt Etkin, PhD
Freshwater Spills Symposium 2004Freshwater Spills Symposium 2004
TwentyTwenty--Year Trend Analysis of Year Trend Analysis of Oil Spills in EPA JurisdictionOil Spills in EPA Jurisdiction
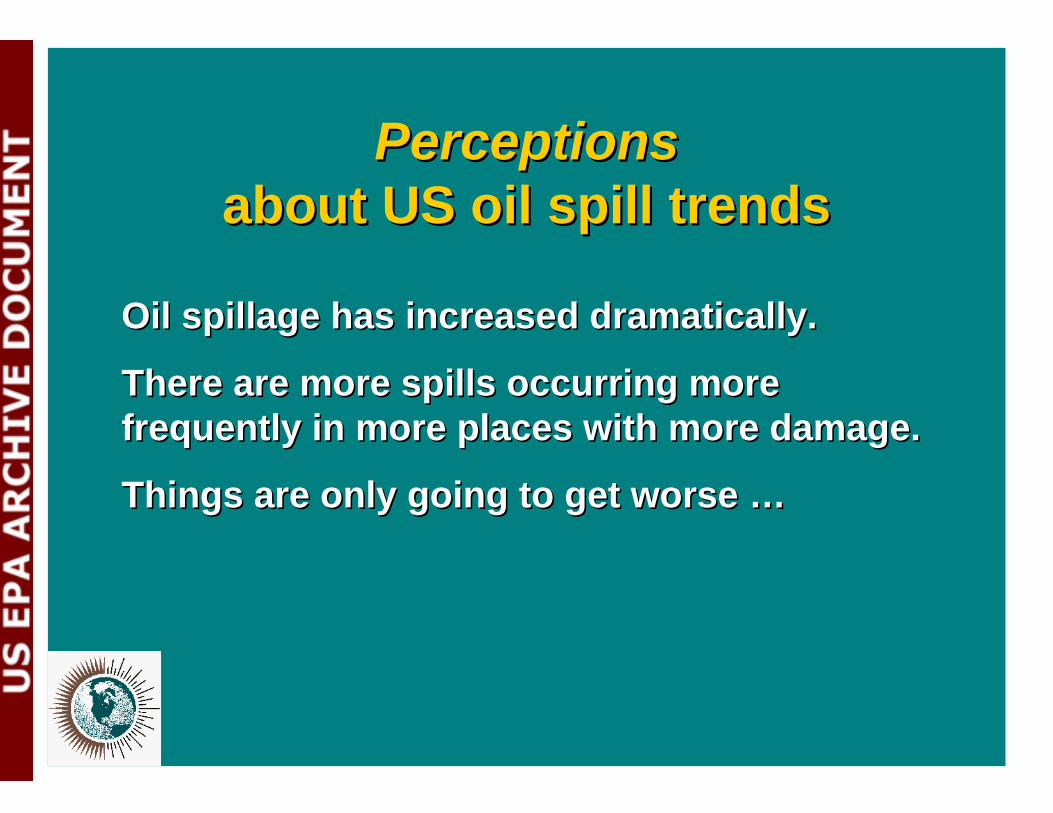
PerceptionsPerceptions about US oil spill trendsabout US oil spill trends
Oil spillage has increased dramatically.Oil spillage has increased dramatically.
There are more spills occurring more There are more spills occurring more frequently in more places with more damage.frequently in more places with more damage.
Things are only going to get worse …Things are only going to get worse …
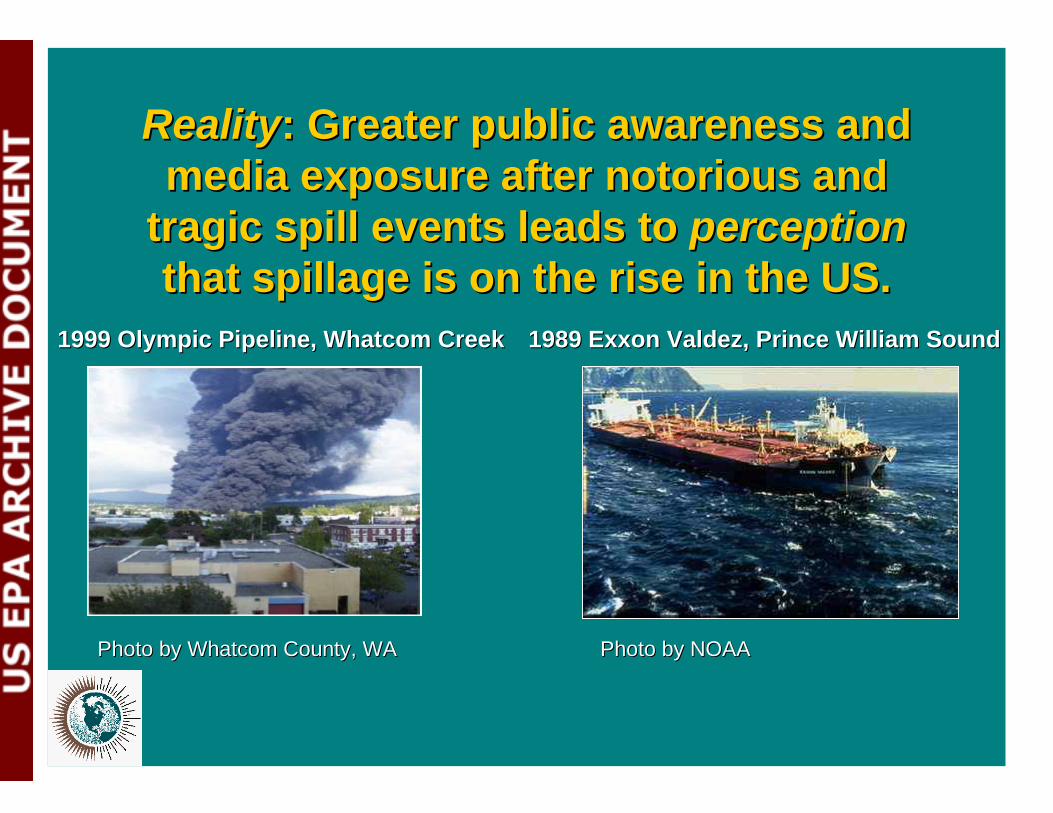
RealityReality: Greater public awareness and : Greater public awareness and media exposure after notorious and media exposure after notorious and
tragic spill events leads to tragic spill events leads to perceptionperception that spillage is on the rise in the US.that spillage is on the rise in the US.
Photo by NOAAPhoto by NOAAPhoto by Photo by Whatcom Whatcom County, WACounty, WA
1999 Olympic Pipeline,1999 Olympic Pipeline, WhatcomWhatcom CreekCreek 1989 Exxon Valdez, Prince William Sound1989 Exxon Valdez, Prince William Sound
Reality:Reality: Greater public awareness Greater public awareness and enforcement by EPA and and enforcement by EPA and
state officials has lead tostate officials has lead to greater compliance ingreater compliance in
reportingreporting of smaller spills.of smaller spills.
EPA Oil Spill Jurisdiction Oil Spill EPA Oil Spill Jurisdiction Oil Spill Database developed to analyze trends Database developed to analyze trends
over last 20+ yearsover last 20+ years •• EPA Jurisdiction Oil Spill Database includes EPA Jurisdiction Oil Spill Database includes
spills of spills of at least 50 gallonsat least 50 gallons into into nonnon--marine marine navigable watersnavigable waters (and adjoining shorelines) in (and adjoining shorelines) inEPA spill response jurisdiction that occurred EPA spill response jurisdiction that occurredsince 1980. (Great Lakes not included since 1980. (Great Lakes not included –– USCG USCG jurisdiction)jurisdiction)
•• Total of Total of 42,860 incidents42,860 incidents representing over representing over 304 304 million gallonsmillion gallons
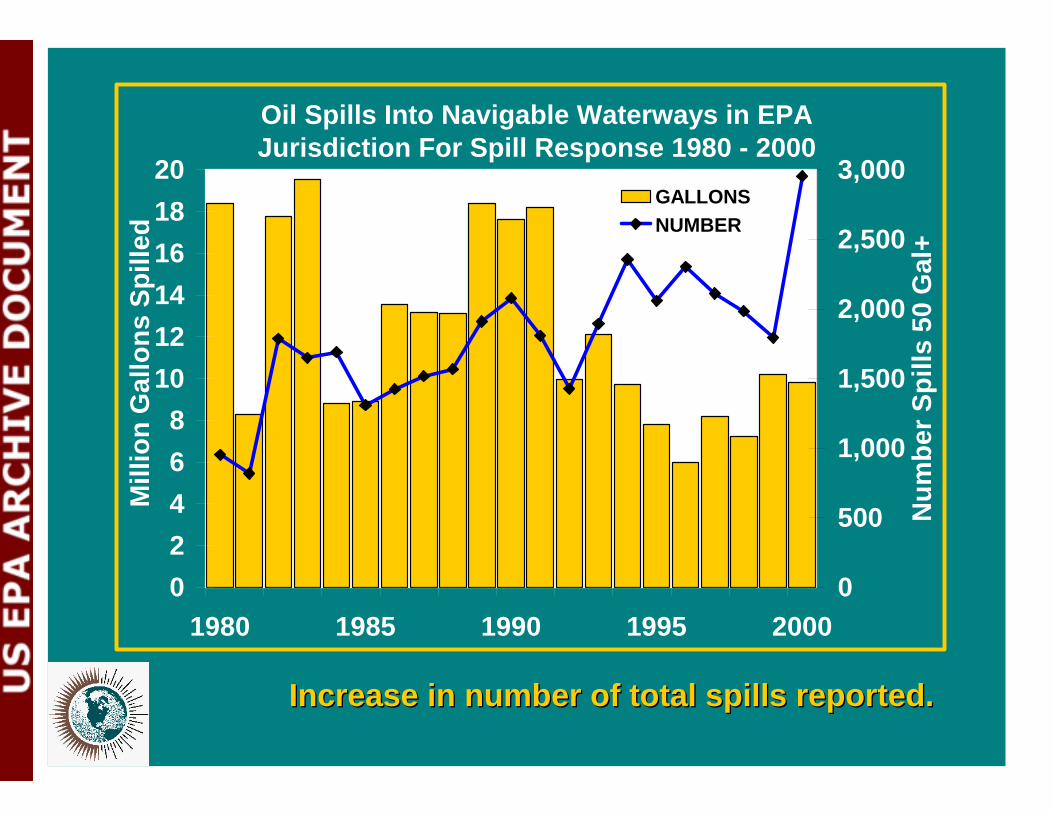
Oil Spills Into Navigable Waterways in EPA Jurisdiction For Spill Response 1980 - 2000
0 2 4 6 8
10 12 14 16 18 20
1980 1985 1990 1995 2000
Mill
ion
Gal
lons
Spi
lled
0
500
1,000
1,500
2,000
2,500
3,000
Num
ber S
pills
50
Gal
+
GALLONS NUMBER
Increase in number of total spills reported.Increase in number of total spills reported.
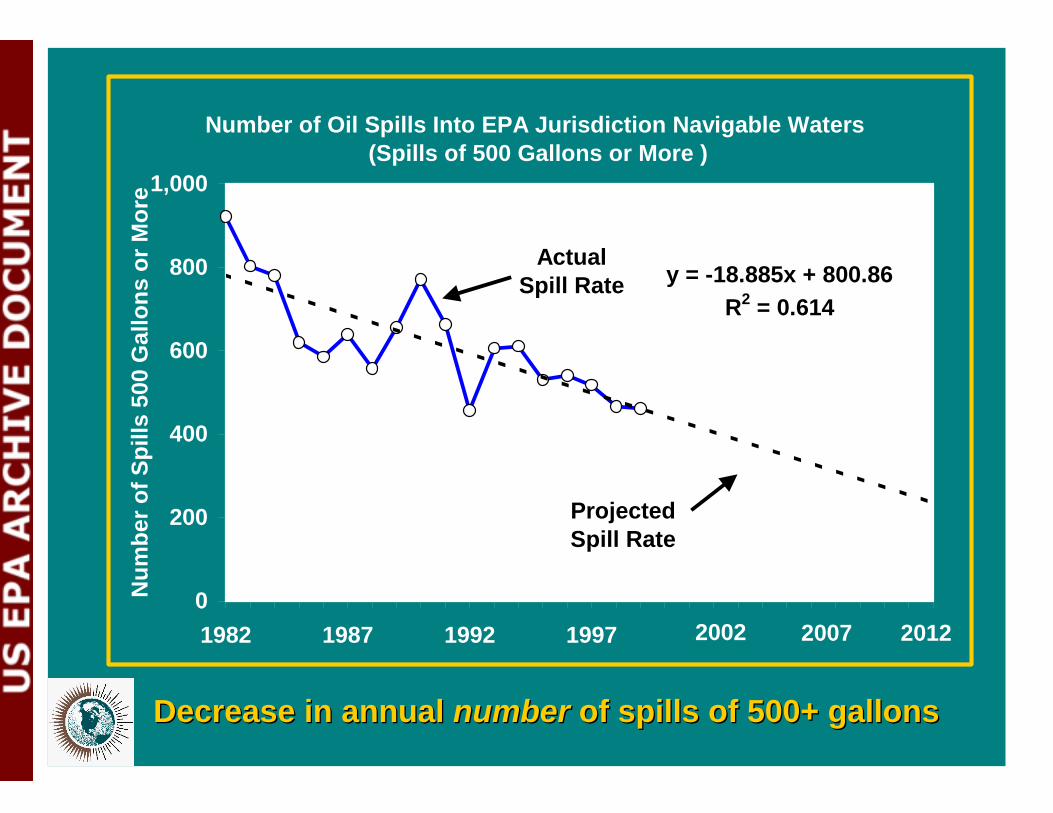
Number of Oil Spills Into EPA Jurisdiction Navigable Waters (Spills of 500 Gallons or More )
y = -18.885x + 800.86 R2 = 0.614
0
200
400
600
800
1,000
1982 1987 1992 1997
Num
ber o
f Spi
lls 5
00 G
allo
ns o
r Mor
e
Projected Spill Rate
2002 20122007
Actual Spill Rate
Decrease in annual Decrease in annual numbernumber of spills of 500+ gallonsof spills of 500+ gallons
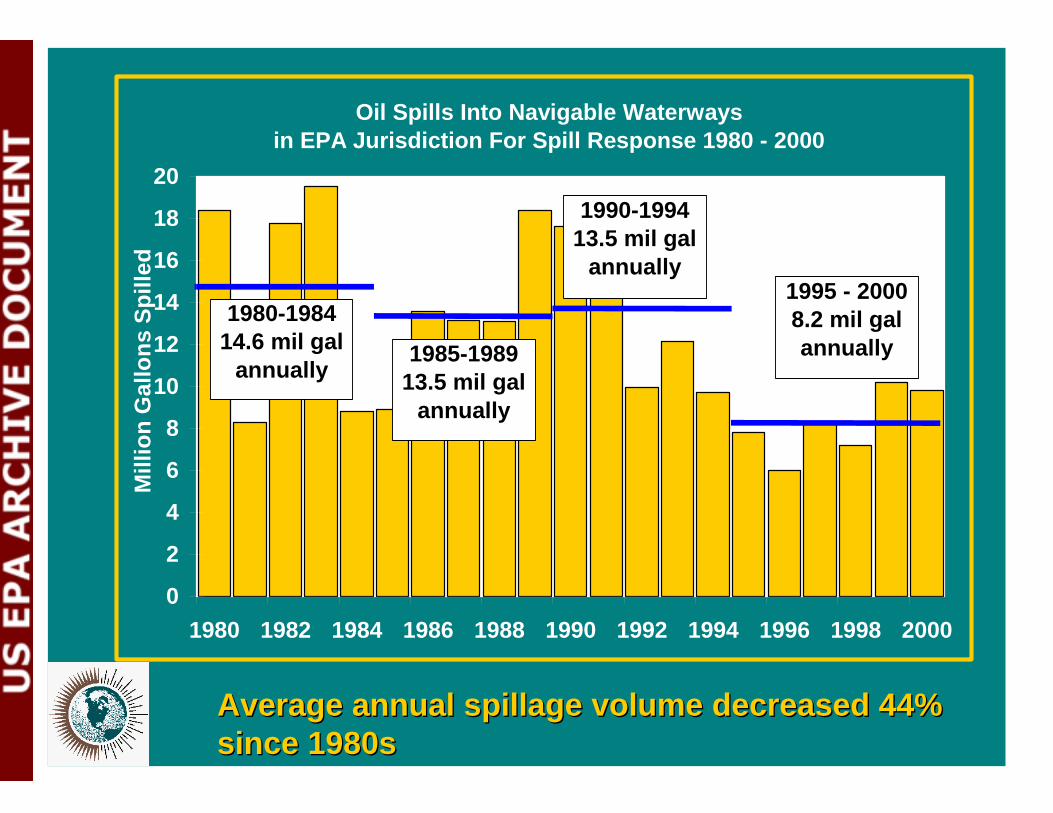
Oil Spills Into Navigable Waterways in EPA Jurisdiction For Spill Response 1980 - 2000
0
2
4
6
8
10
12
14
16
18
20
1980 1982 1984 1986 1988 1990 1992 1994 1996 1998 2000
Mill
ion
Gal
lons
Spi
lled
1980-1984 14.6 mil gal
annually 1985-1989
13.5 mil gal annually
1990-1994 13.5 mil gal
annually 1995 - 2000 8.2 mil gal annually
Average annual spillage volume decreased 44% Average annual spillage volume decreased 44% since 1980ssince 1980s
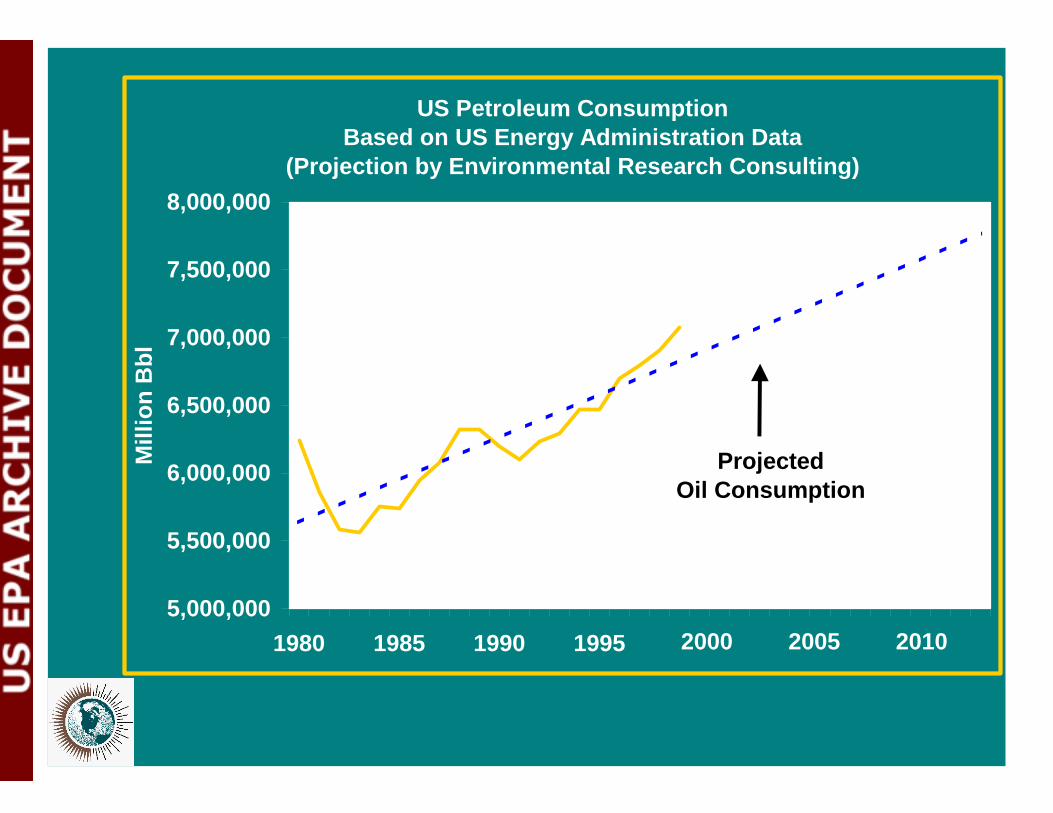
US Petroleum Consumption Based on US Energy Administration Data
(Projection by Environmental Research Consulting)
y = 62736x + 6E+06 R2 = 0.7604
5,000,000
5,500,000
6,000,000
6,500,000
7,000,000
7,500,000
8,000,000
1980 1985 1990 1995
Mill
ion
Bbl
Projected Oil Consumption
2000 2005 2010
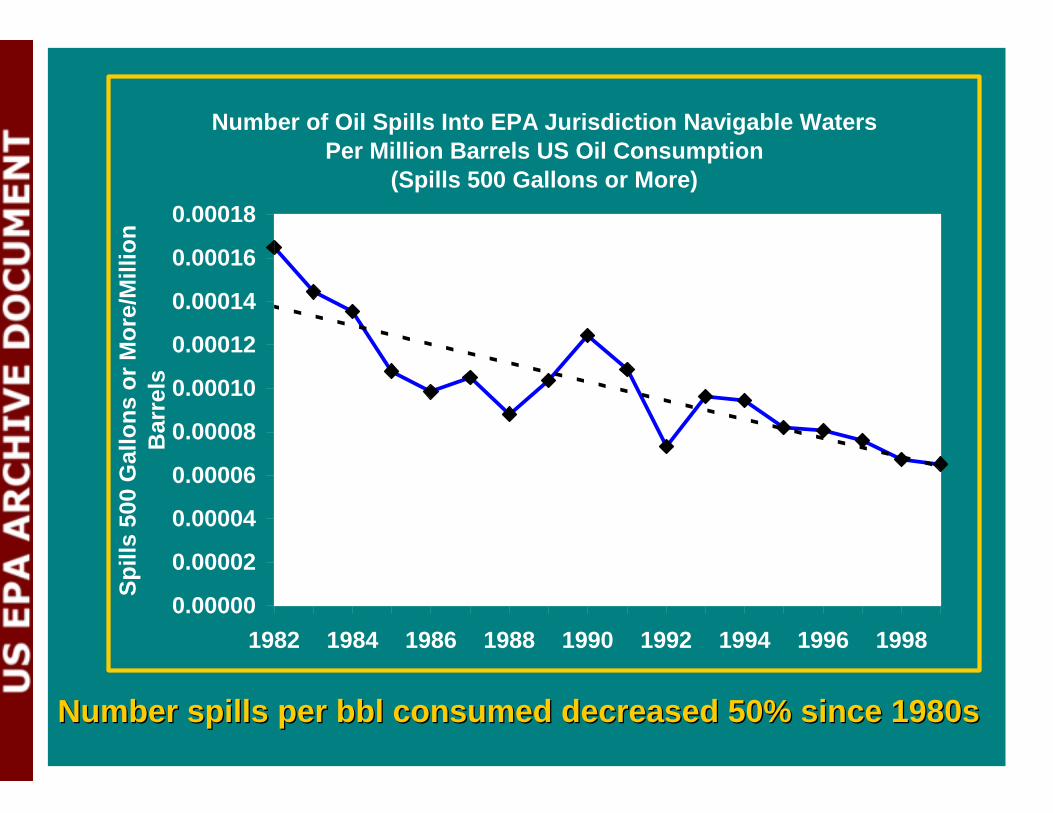
Number of Oil Spills Into EPA Jurisdiction Navigable Waters Per Million Barrels US Oil Consumption
(Spills 500 Gallons or More)
y = -4E-06x + 0.0001 R2 = 0.7236
0.00000
0.00002
0.00004
0.00006
0.00008
0.00010
0.00012
0.00014
0.00016
0.00018
1982 1984 1986 1988 1990 1992 1994 1996 1998
Spill
s 50
0 G
allo
ns o
r Mor
e/M
illio
n B
arre
ls
Number spills per bbl consumed decreased 50% since 1980sNumber spills per bbl consumed decreased 50% since 1980s
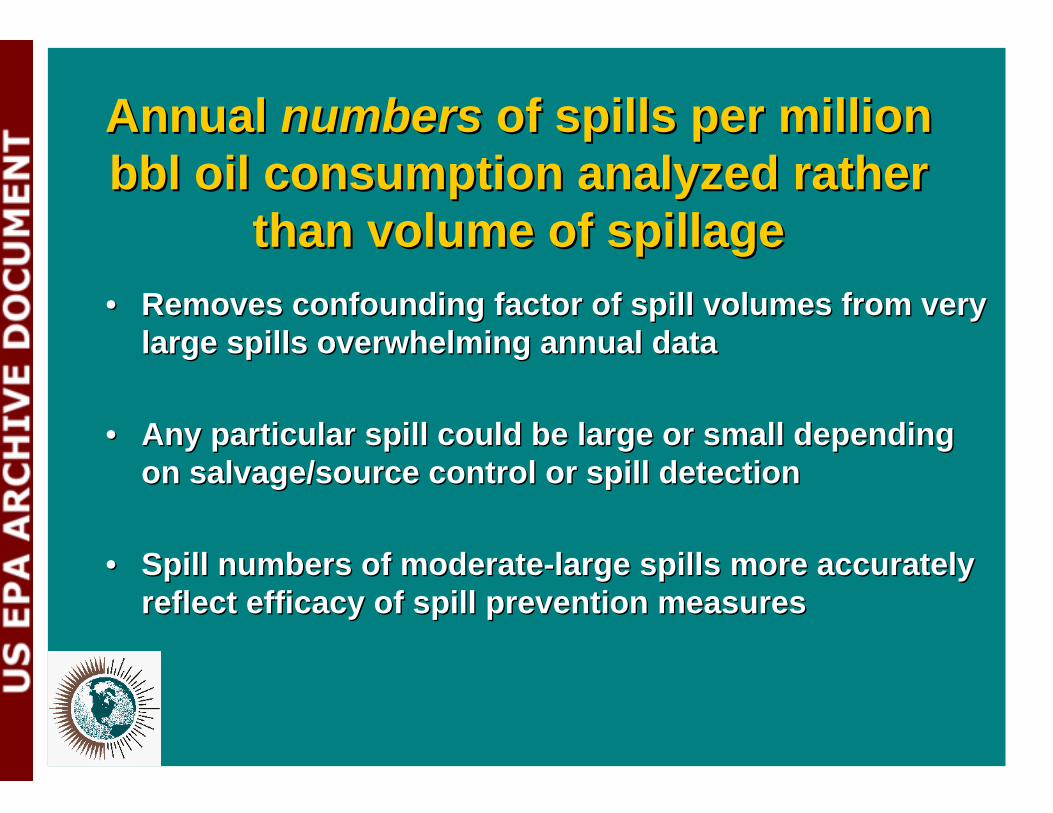
Annual Annual numbersnumbers of spills per million of spills per million bbl oil consumption analyzed rather bbl oil consumption analyzed rather
than volume of spillagethan volume of spillage •• Removes confounding factor of spill volumes from very Removes confounding factor of spill volumes from very
large spills overwhelming annual datalarge spills overwhelming annual data
•• Any particular spill could be large or small depending Any particular spill could be large or small depending on salvage/source control or spill detectionon salvage/source control or spill detection
•• Spill numbers of moderateSpill numbers of moderate--large spills more accurately large spills more accurately reflect efficacy of spill prevention measuresreflect efficacy of spill prevention measures
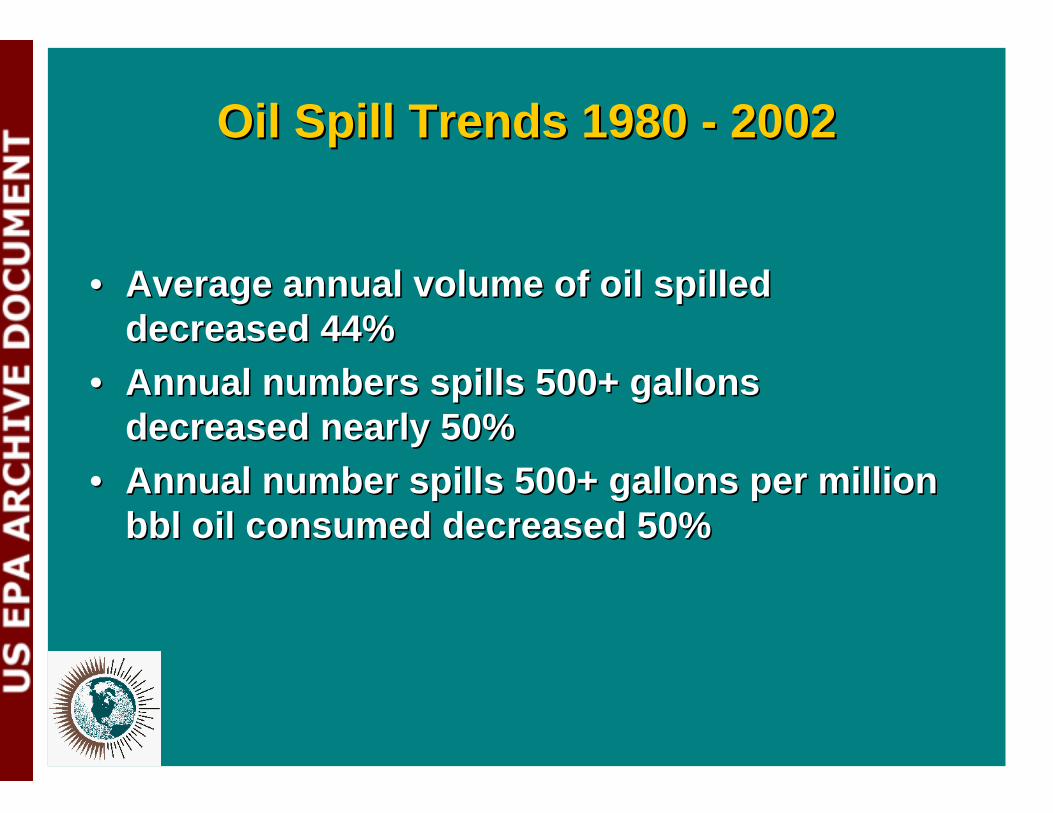
Oil Spill Trends 1980 Oil Spill Trends 1980 -- 20022002
•• Average annual volume of oil spilled Average annual volume of oil spilled decreased 44%decreased 44%
•• Annual numbers spills 500+ gallons Annual numbers spills 500+ gallons decreased nearly 50%decreased nearly 50%
•• Annual number spills 500+ gallons per million Annual number spills 500+ gallons per million bbl oil consumed decreased 50%bbl oil consumed decreased 50%
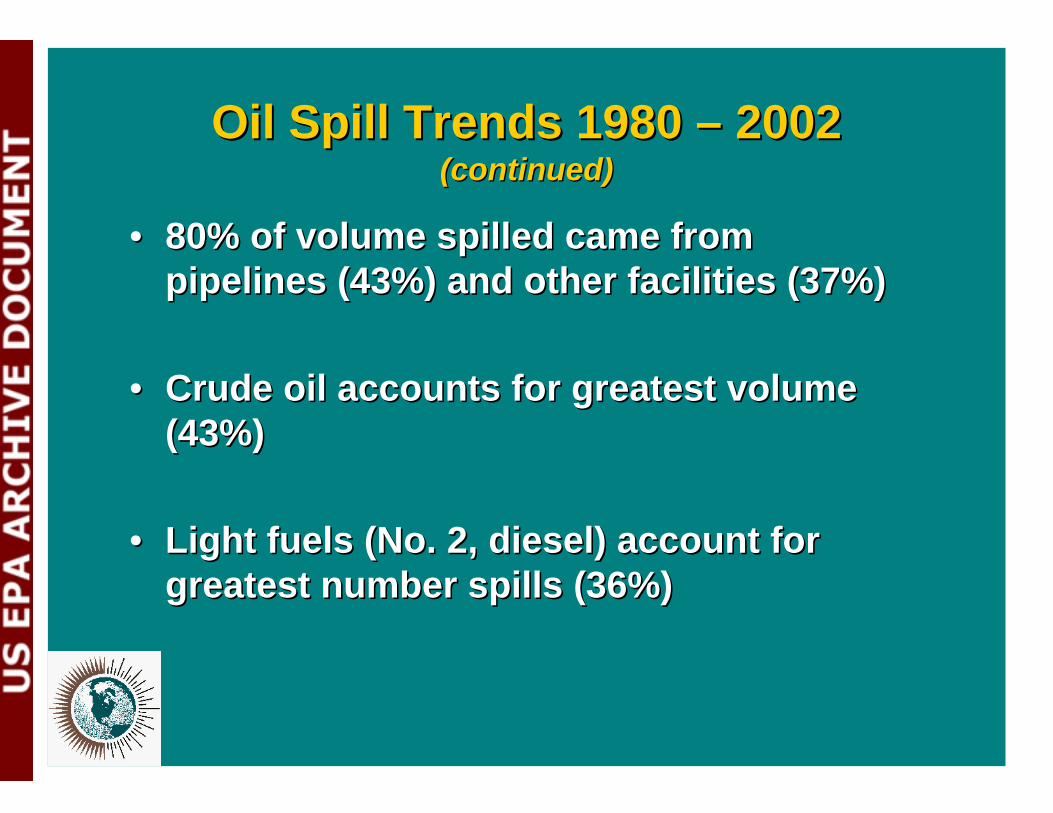
Oil Spill Trends 1980 Oil Spill Trends 1980 –– 20022002 (continued)(continued)
•• 80% of volume spilled came from 80% of volume spilled came from pipelines (43%) and other facilities (37%)pipelines (43%) and other facilities (37%)
•• Crude oil accounts for greatest volume Crude oil accounts for greatest volume (43%)(43%)
•• Light fuels (No. 2, diesel) account for Light fuels (No. 2, diesel) account for greatest number spills (36%)greatest number spills (36%)
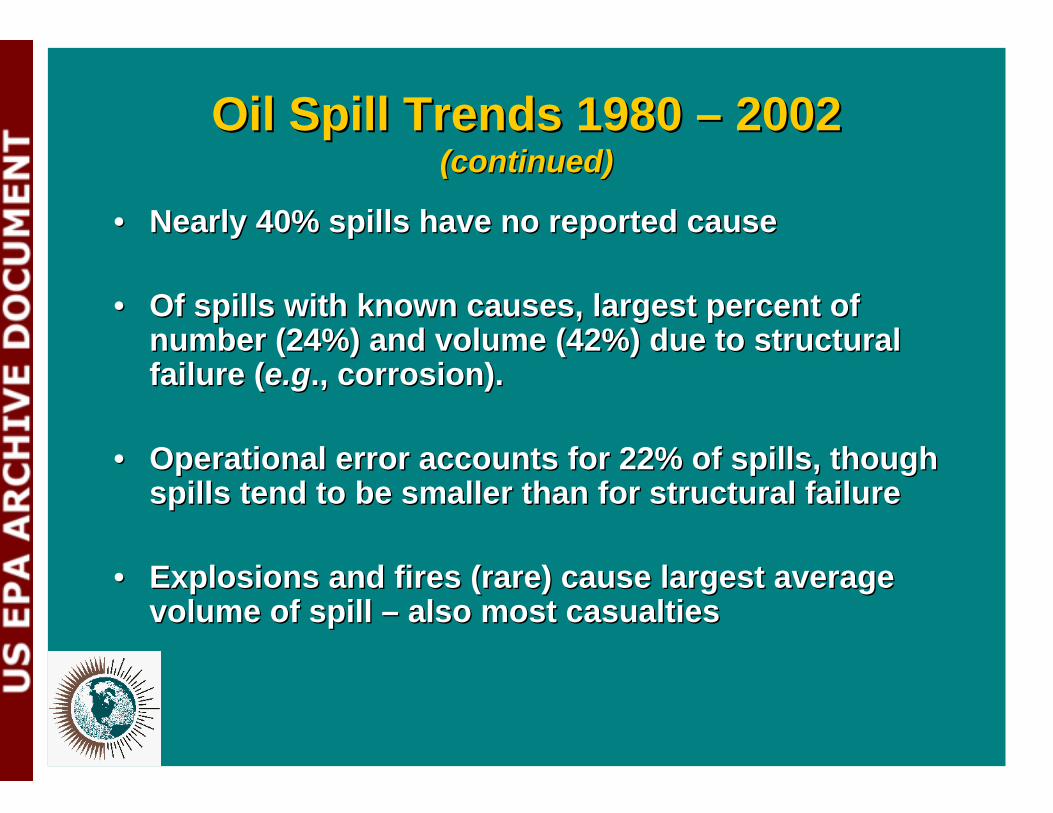
•• Nearly 40% spills have no reported causeNearly 40% spills have no reported cause
•• Of spills with known causes, largest percent of Of spills with known causes, largest percent ofnumber (24%) and volume (42%) due to structural number (24%) and volume (42%) due to structuralfailure (failure (e.ge.g., corrosion).., corrosion).
•• Operational error accounts for 22% of spills, though Operational error accounts for 22% of spills, thoughspills tend to be smaller than for structural failurespills tend to be smaller than for structural failure
•• Explosions and fires (rare) cause largest average Explosions and fires (rare) cause largest averagevolume of spill volume of spill –– also most casualtiesalso most casualties
Oil Spill Trends 1980 Oil Spill Trends 1980 –– 20022002 (continued)(continued)
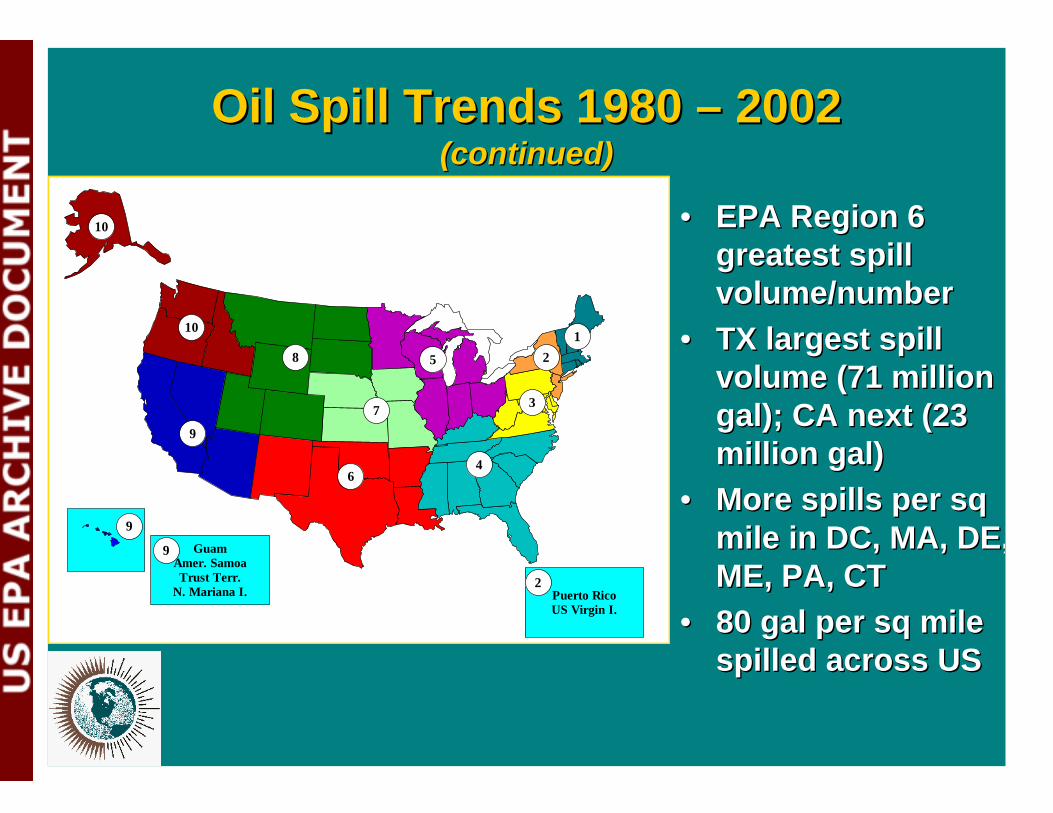
•• EPA Region 6 EPA Region 6 greatest spill greatest spill volume/numbervolume/number
•• TX largest spill TX largest spill volume (71 million volume (71 million gal); CA next (23 gal); CA next (23 million gal)million gal)
•• More spills per sqMore spills per sq mile in DC, MA, DE,mile in DC, MA, DE, ME, PA, CTME, PA, CT
•• 80 gal per sq mile 80 gal per sq mile spilled across USspilled across US
Oil Spill Trends 1980 Oil Spill Trends 1980 –– 20022002 (continued)(continued)
Puerto Rico US Virgin I.
1 2
4
5
7
8
10
10
3
6
9
9
2
Guam Amer. Samoa Trust Terr.
N. Mariana I.
9
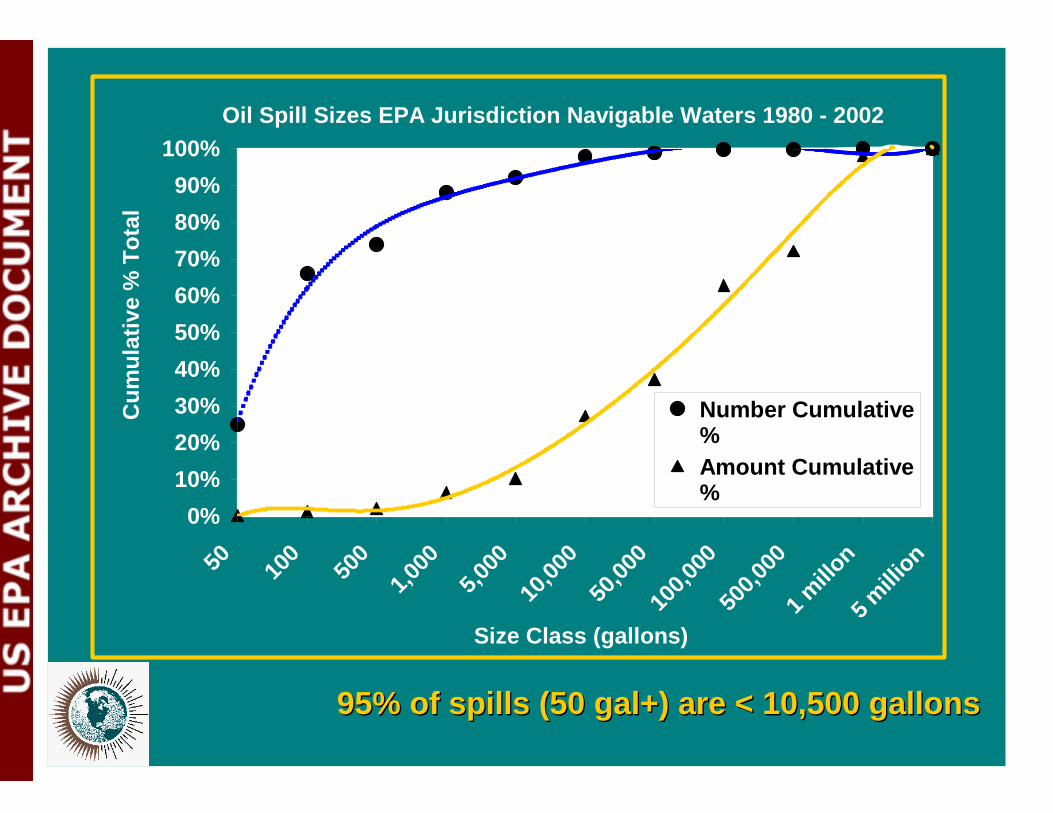
Oil Spill Sizes EPA Jurisdiction Navigable Waters 1980 - 2002
0% 10% 20% 30% 40% 50% 60% 70% 80% 90%
100%
50
100
500
1,000
5,0
0010
,000
50,00
0 10
0,000
500,0
001 m
illon
5 million
Size Class (gallons)
Cum
ulat
ive
% T
otal
Number Cumulative % Amount Cumulative %
95% of spills (50 gal+) are < 10,500 gallons95% of spills (50 gal+) are < 10,500 gallons
•• Analysis only includes spills of 50 gallons or more.Analysis only includes spills of 50 gallons or more.
•• There are many spills smaller than this that occur There are many spills smaller than this that occur on a frequent basis.on a frequent basis.
•• A study conducted by ERC on vessel spills is US A study conducted by ERC on vessel spills is US marine waters showed that 99% of spills are less marine waters showed that 99% of spills are less than 50 gallons but these spills add up to only 20% than 50 gallons but these spills add up to only 20% of the total volume spilled.of the total volume spilled.
•• Extrapolating to EPA jurisdiction spills, there would Extrapolating to EPA jurisdiction spills, there would be about be about 4.3 million spills4.3 million spills since 1980.since 1980.
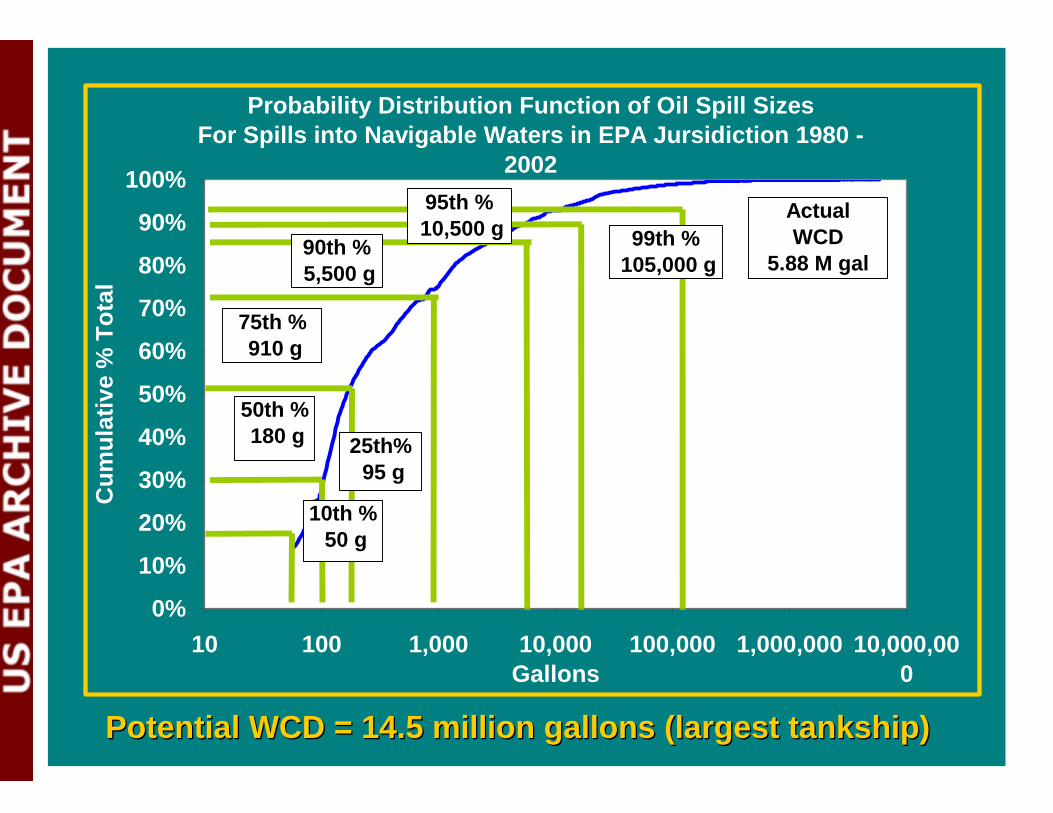
Probability Distribution Function of Oil Spill Sizes For Spills into Navigable Waters in EPA Jursidiction 1980 -
2002
0%
10%
20%
30%
40%
50%
60%
70%
80%
90%
100%
10 100 1,000 10,000 100,000 1,000,000 10,000,00 0Gallons
Cum
ulat
ive
% T
otal
Actual WCD
5.88 M gal
25th% 95 g
50th % 180 g
95th % 10,500 g 99th %
105,000 g
75th % 910 g
90th % 5,500 g
10th % 50 g
Potential WCD = 14.5 million gallons (largest Potential WCD = 14.5 million gallons (largest tankshiptankship))
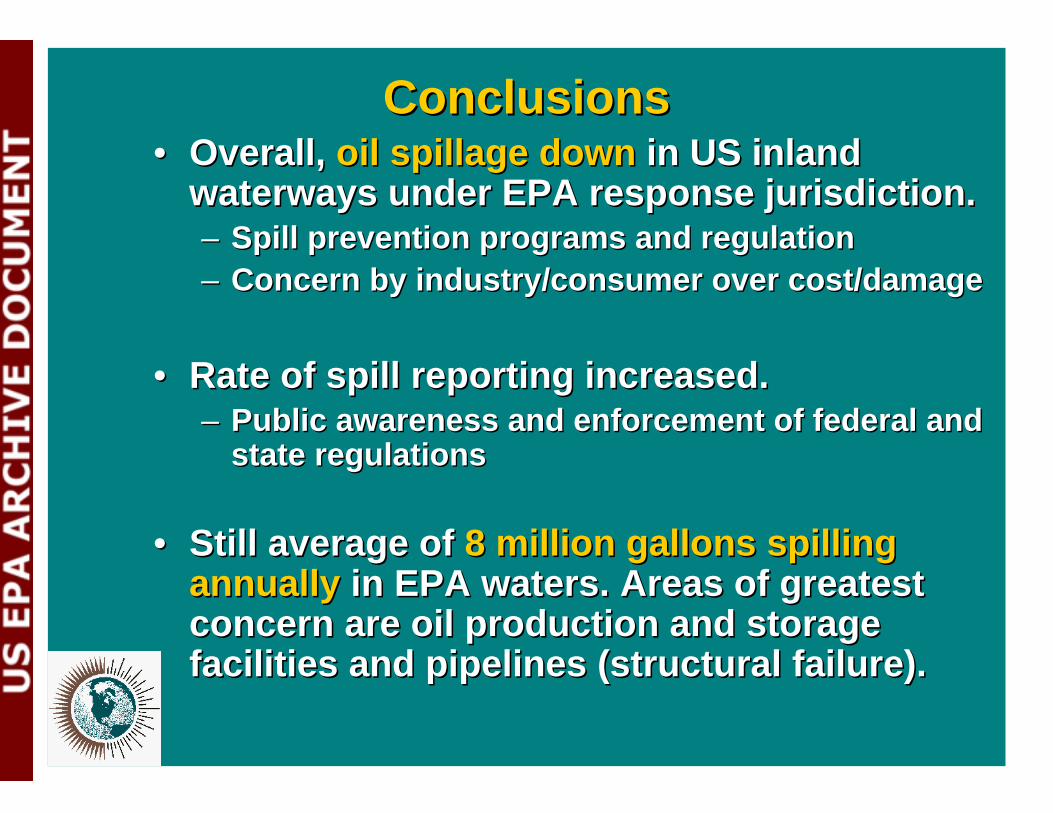
ConclusionsConclusions •• Overall, Overall, oil spillage downoil spillage down in US inland in US inland
waterways under EPA response jurisdiction.waterways under EPA response jurisdiction. –– Spill prevention programs and regulationSpill prevention programs and regulation –– Concern by industry/consumer over cost/damageConcern by industry/consumer over cost/damage
•• Rate of spill reporting increased.Rate of spill reporting increased. –– Public awareness and enforcement of federal and Public awareness and enforcement of federal and
state regulationsstate regulations
•• Still average of Still average of 8 million gallons spilling 8 million gallons spillingannuallyannually in EPA waters. Areas of greatest in EPA waters. Areas of greatestconcern are oil production and storage concern are oil production and storagefacilities and pipelines (structural failure).facilities and pipelines (structural failure).
This project by Environmental This project by Environmental Research Consulting was Research Consulting was
funded in part byfunded in part by the US EPA Oil Programthe US EPA Oil Program
under subcontract under subcontract to to Abt Abt Associates, Inc.’s Associates, Inc.’s
EPA Contract No. 68EPA Contract No. 68--WW--0101--039039
The EPA Jurisdiction Oil Spill The EPA Jurisdiction Oil Spill Database and the EPA Facility Database and the EPA Facility
Oil Spill Database were Oil Spill Database were developed from Environmental developed from Environmental
Research Research Consulting’s Consulting’s proprietary databases for us by proprietary databases for us by the EPA Oil Program Center and the EPA Oil Program Center and
EPA Regional Offices.EPA Regional Offices.