About Us - Insurance Ireland · • Gross insurance premium income for domestic life and non-life...
27
Fact File
Transcript of About Us - Insurance Ireland · • Gross insurance premium income for domestic life and non-life...

Fact
Fi
le

Insurance makes a major contribution to Ireland’s economic growth and development and is a cornerstone of modern life. One of the most important aspects of insurance is to pay claims to customers at times when they need it most. Each year the insurance industry pays out more than €10bn in claims to Irish customers. As the voice of insurance companies in Ireland, Insurance Ireland’s key functions include:
• Representing its members’ interests to Government, state agencies, regulatory bodies, public representatives, other national interest groups, the media and the general public.
• Representing the position of members at a European level, particularly via Insurance Europe, the European Association for national insurance company representative bodies, and at a global level via the Global Federation of Insurance Associations (GFIA).
• Keeping members abreast of relevant policy and regulatory developments and providing a forum for member debates on such issues.
• Providing information to Government, the wider policy-making community and the public about insurance.
• Insurance Ireland – The Voice of Insurance
About Us
As the voice of insurance actively promoting the highest standards, Insurance Ireland represents 95% of the domestic market and 70% of Ireland’s International life insurance market. This business generates €25bn in premium income (domestic and overseas), directly and indirectly employs 27,000 people, with thousands more in ancillary services and contributes over €1.6bn in tax to the Irish exchequer.
1
INSURANCE IRELAND

YEARS
2
Factfile | 2013
Factfile 2013 is part of a series published by Insurance Ireland annually, providing the key facts and figures on the industry in Ireland. This is the twenty-first year of publication and the Factfile is now a well-established primary source of information on the domestic and international business of insurers based in Ireland.
The data is derived from data collected from members of Insurance Ireland unless otherwise indicated.
AXA Ireland are included in the 2009 - 2011 Insurance Ireland non-life market figures, not included in 2012 and are included in 2013.
About UsAbout Factfile
IN PRODUCTION

Contents
Executive Summary
The Irish Insurance Market—A Comparative Overview
Life Assurance and Pensions Market 2009-2013
Non-Life Insurance Market 2009-2013
International Market 2009-2013
0405091622
3
INSURANCE IRELAND

4
Factfile | 2013
The Irish Insurance Market - A Comparative Overview • Gross insurance premium income for domestic life and
non-life insurance combined was €11,313m in 2013, compared to €10,584m in 2012 – an increase of 6.9%.
• Premium income as a percentage of GDP was 7%, up from 6.5%. Premiums per capita increased by 4.5% from €2,352 in 2012 to €2,459 in 2013.
• The capital values of assets in many investment areas increased in 2013. Assets comprising domestic life policyholders’ funds and non-life technical reserves increased by 4.6% to €89bn at the end of the year.
• The insurance sector is a major employer in the Irish economy. Insurance Ireland member companies employed over 14,334 people in Ireland as of the end of December 2013.
Life Assurance and Pensions Market • Insurance Ireland’s life assurance members’ aggregate
domestic premium income was €8,739m for 2013, which is an increase of 7% on the previous year (€8,150m).
• New annual premium (AP) business was €426m, down 2% from €434m in 2012.
• An increase of 17% was recorded for new single premium (SP) business in 2013 (€5,805m).
• New business Annual Premium Equivalent (AP sales + 10% of SP sales) rose 8% to €1,006m compared with €931m in 2012.
• €8,922.5m in benefits and claims was paid by domestic life assurance companies during 2013, a decrease of 1% on 2012.
• The total value of life assurance protection in force at the end of 2013 was estimated at €371bn, compared to €395bn at the end of 2012, which is a decrease of 6%.
• The aggregate value of policyholders’ funds managed by Insurance Ireland life members increased by 4% to €82,309m in 2013. The value of equity investments increased 12.2% from €37,665m in 2012, to €42,273 in 2013. Equities represented 51.4% of total policyholders’ funds at 31/12/13, compared to 47.6% at the end of 2012.
• The value of life assurance funds invested in gilts decreased by 10% to €23,359m in 2013, and now represents 28.4% of life assurance investments.
• Cash holdings increased from 11.2% of the total value of policyholders’ funds in 2012 to 11.8% (€9,704m) in 2013.
• Property assets fell 8% to €2,758m in 2013 from €2,999m in 2012 and now represent 3.4% of total investments.
Non-Life Insurance Market • Insurance Ireland’s 20 domestic non-life members write
in excess of 95% of Irish non-life insurance business in the established market. Combined, Insurance Ireland members wrote gross premiums of €2,574m in 2013.
• Motor insurance remains the largest class of non-life insurance at €1,113m (43% of all non-life business). Property is the second largest class of non-life business (33%).
• Net written premiums (i.e. total premiums after reinsurance costs have been deducted) were €2,149m. Net earned premiums were €2,196m in 2013.
• The number of new claims notified to Insurance Ireland members in 2013 was 441,214. 53% of new claims were motor claims, while 23% were made on property insurance policies (household and commercial property).
• Net incurred claims costs amounted to €1,693m leading to a net underwriting loss in 2013 of €211m. After investment income is added, the market made an operating loss of €81m.
International Life Assurance Market • The vast majority of international premium income is new
single premium income. In 2013, the figure for Insurance Ireland’s International life members was €12,131m, up 82% on 2012 (€6,657). Annual premium income more than tripled from €101.7m in 2012 to €412m in 2013, an increase of 305%.
• Some of this increase is accounted for by the higher number of companies participating in this statistical exercise, reflecting the increased number of Insurance Ireland international members.
• Over the 5-year period, 2009 to 2013, single premium business has grown by 26% p.a. on average (from €4,790m in 2009 to €12,131m in 2013) whilst annual premium income increased by 50% p.a. (from €81.7m in 2009 to €412m in 2013).
• The top 2 countries for single premium business were Italy and the UK, followed by Sweden, Finland and Spain. EU countries made up 98.5% of total single premium and 99.8% of total regular premium.
• The vast majority of international single premium income (96%) is represented by unit linked single premium business (Class III).
Health Insurance Market • Insurance Ireland’s four health insurance members
write approximately 96% of health insurance in the Irish domestic market. Combined, Insurance Ireland members wrote gross premiums of €2,274m in 2013.
• Gross incurred claims in 2013 amounted to €1,956m, while the number of new claims notified to Insurance Ireland health insurance members in 2013 was 1,453,357.
Executive Summary

The Irish Insurance Market—A Comparative Overview
This chapter provides an overview of trends in the Irish insurance market, both from a recent historical perspective (2009-2013) and in an international context. In addition, data is provided which sets the insurance sector in the context of the wider economy in terms of Gross Domestic Product (GDP), premiums per head of population and employment. The insurance data presented in this chapter is provided by Insurance Ireland domestic insurance members and does not represent international or health insurance members.
The Insurance Market in the Economy
2013 Premium Income – Life and Non-Life
Year Life Non-Life Total
Gross Premium Income (€m) 8739.0 2573.6 11312.6
Premium Income: GDP (%) 5.38 1.59 6.97
Premiums per capita (€) 1900 559 2459
Investments* (€m) 82309 6462 88771
* Policyholders’ funds (life assurance) and Technical Reserves (non-life) at 31st December 2013.
Gross insurance premium income for life and non-life insurance combined was €11,313m in 2013, compared to €10,584m in 2012 – an increase of 6.9%. Premium income as a percentage of GDP was 7%. Premiums per capita increased by 4.5%, from €2,352 in 2012 to €2,459 in 2013.
The capital values of assets in many investment areas increased in 2013. Assets comprising life policyholders’ funds and non-life technical reserves increased by 4.6% to €89bn at the end of the year.
Insurance Ireland Members’ Gross Premium Income 2009-2013
Year Life €m Non-Life €m Total €m
2009 9346.4 3123.2 12469.6
2010 9687.6 3035.2 12722.8
2011 8485.6 2893.7 11379.3
2012 8150.2 2433.8 10584.0
2013 8739.0 2573.6 11312.6
Life gross premium income increased from €9,346m in 2009 to €9,688m in 2010, before falling consecutively for 2 years to €8,150m in 2012 and then increased back to €8,739m in 2013. Non-life gross written premium declined each year from €3,123m in 2009 to €2,434m in 2012 and increased this year to €2,574m.
5
INSURANCE IRELAND

6
Factfile | 2013
Gross Premium Income and Domestic Product 2009-2013
Year Gross Insurance Premium Income €m
GDP€m Premium Income:GDP %
2009 12469.6 160858 7.8%
2010 12722.8 159148 8.0%
2011 11379.3 162600 7.0%
2012 10584.0 162855 6.5%
2013 11312.6 162302 7.0%
Market combined life and non-life premium income declined each year from €12,470m in 2009 to €10,584m in 2012 and increased this year to €11,313m. Premium income as a percentage of GDP fluctuated over the 5 years from 2009 to 2013, reaching 7% in 2013.
Life & Non-Life premiums as a Percentage of GDP for Ireland 2009-2013
Year Life Premium as % of GDP
Non-Life Premium as % of GDP
Total %
2009 5.8 1.9 7.8
2010 6.1 1.9 8.0
2011 5.2 1.8 7.0
2012 5.0 1.5 6.5
2013 5.4 1.6 7.0
Life premiums as a percentage of GDP rose to 6.1% in 2010, before falling to 5% in 2012 and increased again in 2013 to 5.4%. Non-life premiums as a percentage of GDP remained static at 1.9% from 2009 to 2010, before falling to 1.5% in 2012 and increased to 1.6% in 2013.
Year-End Value of Investments
2009 €bn 2010 €bn 2011 €bn 2012 €bn 2013 €bn % Change p.a.
Life 70.015 73.430 71.838 79.208 82.309 4.1
Non-life 8.742 8.142 7.761 5.696 6.462 -7.3
Total 78.757 81.572 79.599 84.904 88.771 3.0
The value of life policyholders’ funds increased from €70bn in 2009 to €82.3bn in 2013, an average growth rate of 4.1% over the period. Non-life technical reserves fell to €5.7bn in 2012, but rose in 2013 to €6.5bn with an average growth rate of -7.3% over the five years.
The total value of life and non-life assets was €88.8bn in 2013.

7
INSURANCE IRELAND
Life Assurance Benefits and Claims Paid 2009-2013
Year Amount €m
2009 8576
2010 8222
2011 8736
2012 8996
2013 8923
€8,923m was paid out by life assurance companies in benefits and claims in 2013. These payments and benefits cover a wide range of areas, including:
• Income and payouts on investment policies for policyholders. • Payment of death benefits which protect family income. • Payment of annuity income to pension policy holders. • Repayment of mortgages in the event of death of a policyholder. • Lump sum payouts to policyholders with serious illness cover.
Non-Life Insurance Premiums and Claims 2009-2013
Year Gross Earned Premium €m
Gross Incurred Claims €m
2009 3208 2750
2010 3107 2516
2011 2996 1791
2012 2485 1585
2013 2630 1818
The downward trend in gross earned premium for non-life insurance reversed in 2013 and stood at €2,630m
Gross incurred claims followed a similar downward trend from 2009 onwards but increased in 2013 to reach €1,818m.
Employment in Insurance Companies in Ireland
Employment in Insurance Companies in Ireland as at 31st December 2013
Life 5437
Non-Life 8897
Total 14334
The insurance sector is a major employer in the Irish economy. Insurance Ireland life and non-life member companies employed over 14,334 people in Ireland as of the end of December 2013. In addition, significant numbers are employed in the wider insurance industry e.g. broking, loss adjusting and assessing, and in outsourced service providers.
8,923 MILLIONEURO PAID OUT BY LIFE ASSURANCE COMPANIES IN BENEFITS AND CLAIMS

8
Factfile | 2013
Irish Insurance Market in an International Context
The Irish Insurance Market in the World 2013
Global Share %Population GDP Life Gross
PremiumsNon-Life
Gross Premiums
Total Gross
Premiums
Total Gross
Premiums as % of
GDP
Total Gross
Premiums Per Capita
USD
Ireland 0.06 0.30 1.80 0.44 1.20 8.00 3,783
EU 7.13 23.55 34.16 29.68 32.20 7.82 2,680
OECD 17.70 63.84 80.94 82.43 81.60 7.74 2,898
Europe 11.43 29.61 36.30 33.70 35.16 6.82 1,834
America* 13.53 33.04 25.52 44.41 33.79 6.42 1,627
Asia 59.19 32.22 34.45 18.71 27.55 5.37 303
Oceania 0.52 2.34 1.82 2.08 1.93 5.19 2,429
Africa 15.32 2.80 1.91 1.11 1.56 3.50 66
World 100.00 100.00 100.00 100.00 100.00 6.28 652
Figures are rounded USD Sources: Swiss Re Sigma No 3/2014; CSO; CIA’s - The World Factbook and Insurance Ireland
*Includes Latin America and Caribbean
Insurance density: Premiums per capita 2013
Country Premium Per Capita 2013 (USD)
Switzerland 7701
Netherlands 6012
Denmark 5780
Finland 5073
Luxembourg 5003
Hong Kong 5002
United Kingdom 4561
Norway 4452
Sweden 4320
Japan 4207
United States 3979
Taiwan 3886
Ireland 3783
France 3736
Canada 3563
Australia 3528
Singapore 3251
Belgium 3235
Germany 2977
South Korea 2895
Italy 2645
Austria 2604
New Zealand 2423
Source: Swiss Re Sigma No 3/2014
The 2013 Irish insurance market is set in both a European and a global context in this table. As with Ireland’s GDP (0.3%), its global share of total gross insurance premiums (1.2%) is high relative to the country’s population (0.06%). This reflects the developed market in Ireland for insurance and the relatively high levels of coverage in major classes of business (motor, property, liability, pensions and mortgage protection) compared to other countries, particularly in less economically developed areas.
The premium spent per capita for 2013 in Ireland is compared to some other advanced industrialised countries in this table. The figure for Ireland of US$3,783 is higher than some other European countries such as Italy and Germany but is also lower than others, such as the United Kingdom and Sweden. A factor which needs to be noted, particularly when making comparisons with other European states, is that countries such as Germany and Sweden have higher taxation rates and more developed social insurance systems. Therefore, a greater proportion of the costs associated with accidents are catered for through the social insurance system. This has an impact on the level of compensation awarded for insurance claims made against insurance companies and ultimately on premium rates and volumes.
GLOSSARY OF LIFE ASSURANCE TERMS
Annual/Regular Premium PolicyA policy under which the policyholder makes annual/regular payments of premium to finance life assurance protection cover, or to build up an investment or retirement fund.
Annual Premium Equivalent (APE)An industry standard formula for calculating levels of new life and pensions business over a period of time, to smooth out the effect of large, one-off payments. It’s the total of new annual premiums plus 10% of single premiums.
Critical Illness InsuranceCritical illness insurance pays the policyholder an agreed sum if he/she contracts one of the serious illnesses specified in the policy documentation. Typical illnesses covered include cancer, stroke, heart attack, multiple sclerosis and kidney failure.
Industrial Branch BusinessThis refers to regular premium protection business where the life assurance company representative collects premiums, usually on a weekly basis. The importance of this type of business has declined over the years.
IntermediaryAn intermediary is a broker or agent who advises clients about their insurance needs, helps them to select the most appropriate policy and provides an ongoing service in all subsequent matters relating to the policy.
Maturity ValueThis is the final value of a savings policy if it is allowed to run for the full term specified in the contract.
Pensions/AnnuitiesFor many people, the income they receive from the State on retirement will not be sufficient to support them. For this reason, increasing numbers of people have chosen to provide for their retirements by taking out pensions with a life assurance company. This is usually done by way of a contract where, in return for a lump sum or a series of regular payments to the life assurance company, the policyholder will receive a regular income at retirement. This regular income during retirement is called an “annuity.”
Income Protection InsuranceIncome Protection Insurance (also known as Permanent Health Insurance) is a protection policy that provides an income if the policyholder is unable to work because of sickness or disability. Each policy includes a “deferred period”. The individual must be off work because of illness for longer than the deferred period before an income is payable under the policy. The deferred period is usually 13, 26 or 52 weeks. Cover is available on an individual or group basis (e.g. where an employer establishes a scheme for employees).
Personal Retirement Savings AccountsPersonal Retirement Savings Accounts were introduced as new easy access, low cost, and flexible personal pensions, to encourage individuals who have not already done so to make a provision for retirement. PRSAs pensions products were launched on the market in early 2003.
Single PremiumA lump sum life investment or pension policy under which the policyholder makes a one-off payment to the life office. The life office uses the money to provide life assurance protection or invests it on the policyholder’s behalf for repayment, with investment gains, at the end of the policy term (or in the case of a pension, purchases retirement benefits for the policyholder at retirement).
Life Assurance and Pensions Market 2009-2013
9
INSURANCE IRELAND

LIFE ASSURANCE
GROSS PREMIUM INCOME
2013
LIFE ASSURANCE
BENEFITS AND CLAIMS PAID
2013
Individual Assurances & Annuities
Pension Scheme Business
Self–Employed Pensions & Associated Business (Incl. PRSAs)
Permanent Health Insurance (PHI)
Industrial Branch (IB) Business
Individual Assurances & Annuities
Pension Scheme Business
Self–Employed Pensions & Associated Business (Incl. PRSAs)
Permanent Health Insurance (PHI)
Industrial Branch (IB) Business
Critical Illness
1A
1B
10
Factfile | 2013
2013 Key Life and Pensions Statistics
Insurance Ireland’s life assurance members’ aggregate domestic premium income was €8,739m for 2013, which is an increase of 7% on the previous year (€8,150m).
New annual premium (AP) business was €426m, down 2% from €434m in 2012.
An increase of 17% was recorded for new single premium (SP) business in 2013 (€5,805m).
New business Annual Premium Equivalent (AP sales + 10% of SP sales) rose 8% to €1,006m compared with €931m in 2012.
Life Assurance Gross Premium Income 2013 (by type of Policy) - see graph 1A
• Individual Assurances & Annuities €3,323.8m (38%) • Pension Scheme Business €3,611.3m (41.3%) • Self–Employed Pensions & Associated Business (Incl. PRSAs) €1,629.2m
(18.6%) • Permanent Health Insurance (PHI) €169m (1.9%) • Industrial Branch (IB) Business €5.7m (0.1%)
Pension scheme business (41.3%) and individual assurances and annuities (38%) continue to be the two main segments of life assurance gross premium income.
The self-employed pensions & associated business (including PRSAs) segment decreased from 20.2% in 2012 to 18.6% in 2013.
Premium income from permanent health insurance (PHI) as a percentage of life assurance gross premium income decreased from 2.1% to 1.9%, back to its 2011 level. Industrial branch business in 2013 remained the same as 2012 and 2011 at 0.1%.
Life Assurance Benefits and Claims Paid 2013 (by type of policy) - see graph 1B
• Individual Assurances & Annuities €3,698.4m (41.5%) • Pension Scheme Business €3,470m (38.9%) • Self–Employed Pensions & Associated Business (Incl. PRSAs) €1,539.1m (17.2%) • Permanent Health Insurance (PHI) €126.7m (1.4%) • Industrial Branch (IB) Business €28.8m (0.3%) • Critical Illness €59.5m (0.7%)
AnnualPremium
(1)
SinglePremium
(2)
A.P.E.(1)+10%
of (2)
AnnualPremium
€m (3)
Business€m
(2)+(3)
Individual Assurances and Annuities
123.3 2116.5 335.0 1207.3 3323.8
Pension Scheme Business
228.4 2430.8 471.5 1180.5 3611.3
Self–employed Pensions (Incl.PRSAs)
57.6 1259.0 183.5 370.2 1629.2
Permanent Health Insurance
16.3 -1.6 16.1 170.6 169.0
Industrial Branch Business
0.0 0.0 0.0 5.7 5.7
Total 425.6 5804.7 1006.1 2934.3 8739.0
New Business (€m) Total All

11
INSURANCE IRELAND
8923 MILLIONEURO PAID IN BENEFITS AND CLAIMS BY DOMESTIC LIFE ASSURANCE COMPANIES
€8,922.5m in benefits and claims was paid by domestic life assurance companies during 2013, a decrease of 1% on 2012. These payments and benefits cover a wide range of products which take a number of forms, for example: one-off lump sum payments to policyholders in the event of serious illness; or, in the case of pensions, the payment of regular incomes to policyholders/beneficiaries.
The majority of claims were paid under individual assurance/annuity contracts (41.5%, up from 40.8% in 2012) and pension schemes (38.9%, a decrease from 39.3% in 2012), followed by self-employed pensions and associated business (17.2%, the same as in 2012 and 2011). Claims under individual assurance/annuity contracts increased 1% to €3,698 in 2013. Claims under self-employed pensions and associated business also decreased 1% from €1,548m in 2012 to €1,539m in 2013, and pension scheme business decreased by 2% from €3,539m to €3,470m. There was also a 23% decrease in critical illness payouts (to €59.5m) following a 17% rise in 2012.
The total value of life assurance protection in force at the end of 2013 was estimated at €371bn, compared to €395bn at the end of 2012, which is a decrease of 6%.
.
Benefits and Claims
Benefits and Claims By Type (€m) €m
Surrenders and Maturities 7581.6
Death / Critical Illness Claims 784.8
Annuities 556.1
Total 8922.5
The chart provides a breakdown of benefits and claims by type:
• The largest category is benefits paid on policy surrenders and maturities, with €7,581m paid in 2013, (a decrease of 1% on 2012). This category represents 85% of total payments made last year;
• Death and critical illness claims under protection contracts amounted to €785m, down 5% on 2012; and
• Annuity payments totalled €556m in 2013, up 6.5% on 2012.
Sources of Life Assurance Business
Brokers % Agents% Tied Agents %
Employee & Company Represent-
atives %
Direct %
‘11 ‘12 ‘13 ‘11 ‘12 ‘13 ‘11 ‘12 ‘13 ‘11 ‘12 ‘13 ‘11 ‘12 ‘13
Life 16 13 12 2 1 1 7 11 10 6 5 6 1 1 0
Pensions 51 50 50 1 1 1 6 7 6 8 9 10 3 3 4
Total 67 63 62 3 2 2 13 18 16 14 14 16 4 4 4
Life 6 4 4 1 0 0 5 4 3 5 1 3 23 31 41
Pensions 39 35 30 1 1 1 3 3 2 3 2 2 15 19 13
Total 45 39 34 2 1 1 8 7 5 8 3 5 38 50 54
Ann
ual
Pre
miu
mS
ingl
e P
rem
ium
The chart above provides a breakdown of the proportion of new business written through the various sales channels. In 2013, brokers’ new business market share

LIFE ASSURANCE
INVESTMENTS 2013
Equities €42,273m (51.4%)
Gilts €23,359m (28.4%)
Property €2,758m (3.4%)
Cash €9,704m (11.8%)
Other €4,215m (5.1%)
1C
12
Factfile | 2013
Irish €m Foreign €m Total €m
Equities1 6985 35288 42273
Gilts2 3227 20132 23359
Property3 1860 898 2758
Cash 3771 5933 9704
Other 3244 971 4215
Total 19087 63222 82309
decreased by 1 percentage point to 62% (having decreased by 4% in 2012 to 63%) for annual premium (AP) business, and by 5 percentage points for single premium (SP) business to 34%.
Brokers’ AP pensions business decreased by 1% on 2011 to 50% in 2013. SP pensions business decreased by 9 percentage points for the same period. AP for life business dropped 4% below 2011 levels in 2013 (to 12%) and SP life business decreased from 6% to 4% over the same period.
Life office employees and company representatives (direct sales forces) saw their share of AP increase by 2% over the period (to 16%), with their share of SP business dropping from 8% in 2011 to 5% in 2013.
Direct sales other than through employed salespeople (e.g. telephone, internet and direct response sales) remained broadly static for AP, whilst SP direct sales increased by 16 percentage points from 38% to 54%.
Independent agents’ AP business decreased by 1 percentage point from 3% in 2011 to 2% in 2013, while their SP business decreased by the same to reach 1%.
The percentage of AP business written through tied agents increased from 13% to 16%, while SP business written via tied agents decreased from 8% in 2011 to 5% in 2013.
Life Assurance Investments 2013 (Policyholders’ Funds) - see graph 1C
• Equities €42,273m (51.4%) • Gilts €23,359m (28.4%) • Property €2,758m (3.4%) • Cash €9,704m (11.8%) • Other €4,215m (5.1%)
The aggregate value of policyholders’ funds managed by Insurance Ireland life members increased by 4% to €82,309m in 2013. The value of equity investments increased 12.2% from €37,665m in 2012 to €42,273m in 2013. Equities represented 51.4% of total policyholders’ funds at 31/12/13, compared to 47.6% at the end of 2012.
The value of life assurance funds invested in gilts decreased by 10% to €23,359m in 2013, and now represents 28.4% of life assurance investments.
Cash holdings increased from 11.2% of the total value of policyholders’ funds in 2012 to 11.8% (€9,704m) in 2013.
Property assets fell 8% to €2,758m in 2013 from €2,999m in 2012 and now represent 3.4% of total investments.
Investments (Policyholders’ funds) By Type & Location 2013
1 Inc. preference, guaranteed and ordinary stocks and unit trusts2 Inc. Government, local & public authority securities3 Inc. own use buildings, office, residential, commercial and individual investment properties and debenture stocks.
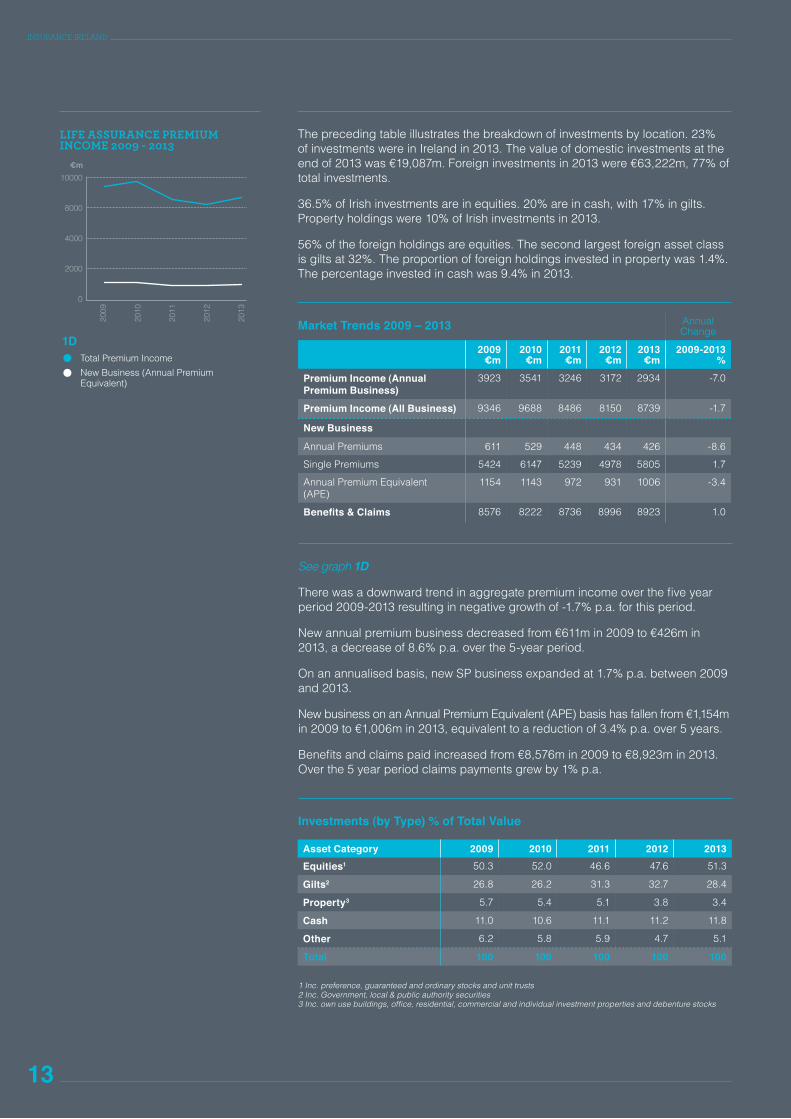
LIFE ASSURANCE PREMIUM INCOME 2009 - 2013
Total Premium Income
New Business (Annual Premium Equivalent)
10000
8000
4000
2000
0
2009
2010
2011
2012
2013
€m
1D
The preceding table illustrates the breakdown of investments by location. 23% of investments were in Ireland in 2013. The value of domestic investments at the end of 2013 was €19,087m. Foreign investments in 2013 were €63,222m, 77% of total investments.
36.5% of Irish investments are in equities. 20% are in cash, with 17% in gilts. Property holdings were 10% of Irish investments in 2013.
56% of the foreign holdings are equities. The second largest foreign asset class is gilts at 32%. The proportion of foreign holdings invested in property was 1.4%. The percentage invested in cash was 9.4% in 2013.
Market Trends 2009 – 2013 Annual Change
2009 €m
2010 €m
2011 €m
2012 €m
2013 €m
2009-2013 %
Premium Income (Annual Premium Business)
3923 3541 3246 3172 2934 -7.0
Premium Income (All Business) 9346 9688 8486 8150 8739 -1.7
New Business 1860
Annual Premiums 611 529 448 434 426 -8.6
Single Premiums 5424 6147 5239 4978 5805 1.7
Annual Premium Equivalent (APE)
1154 1143 972 931 1006 -3.4
Benefits & Claims 8576 8222 8736 8996 8923 1.0
See graph 1D
There was a downward trend in aggregate premium income over the five year period 2009-2013 resulting in negative growth of -1.7% p.a. for this period.
New annual premium business decreased from €611m in 2009 to €426m in 2013, a decrease of 8.6% p.a. over the 5-year period.
On an annualised basis, new SP business expanded at 1.7% p.a. between 2009 and 2013.
New business on an Annual Premium Equivalent (APE) basis has fallen from €1,154m in 2009 to €1,006m in 2013, equivalent to a reduction of 3.4% p.a. over 5 years.
Benefits and claims paid increased from €8,576m in 2009 to €8,923m in 2013. Over the 5 year period claims payments grew by 1% p.a.
Investments (by Type) % of Total Value
Asset Category 2009 2010 2011 2012 2013Equities1 50.3 52.0 46.6 47.6 51.3
Gilts2 26.8 26.2 31.3 32.7 28.4
Property3 5.7 5.4 5.1 3.8 3.4
Cash 11.0 10.6 11.1 11.2 11.8
Other 6.2 5.8 5.9 4.7 5.1
Total 100 100 100 100 100
1 Inc. preference, guaranteed and ordinary stocks and unit trusts2 Inc. Government, local & public authority securities3 Inc. own use buildings, office, residential, commercial and individual investment properties and debenture stocks
13
INSURANCE IRELAND

14
Factfile | 2013
Investment in equities as a proportion of total policyholders’ funds increased between 2009 and 2010, fell from 52% in 2010 to 46.6% in 2011 and then increased again to reach 51.3% in 2013. Gilts dropped from 26.8% of total investments in 2009, to 26.2% in 2010, increased to 32.7% in 2012 and then fell to 28.4% in 2013. Property assets, which stood at 5.7% in 2009, declined over the period to 3.4% in 2013. Cash holdings increased slightly over the period (11% in 2009 to 11.8% in 2013).
Investment Trends (by Location) 2009-2013
% of total value 2009 2010 2011 2012 2013
In Ireland 36.3 33.2 39.2 55.9 23.2
Outside Ireland 63.7 66.8 60.8 44.1 76.8
Policyholders’ funds invested in Ireland decreased from 36% in 2009 to 23% in 2013. Approximately 77% of assets by value are foreign.

15
INSURANCE IRELAND
Insurance Ireland Life Members’ Gross Premium Income 2013
Life Business Pensions Business
Companies
AnnualPremiums
€’000
SinglePremiums
€’000
IndustrialBranch
€’000
AnnualPremiums
€’000
SinglePremiums
€’000
Total
€’000
Acorn Life 42112 10809 0 11215 11943 76079
Ark Life 106011 15 0 51741 7577 165344
Aviva Life & Pensions 95332 56515 0 118412 364656 634915
Caledonian Life 43846 1063 0 1427 0 46336
Canada Life 68905 27526 0 62071 195480 353982
Friends First Life 102008 41430 0 70780 202081 416299
Genworth Financial 241 0 0 0 0 241
Irish Life 459060 735455 0 546441 837631 2578587
London General Life 0 -1693 0 0 0 -1693
New Ireland 245076 616883 294 420435 427097 1709785
Phoenix Ireland 5081 15937 0 5040 8 26066
Royal London 17529 1685 5427 0 0 24641
Standard Life 12651 215446 0 42454 871105 1141656
Zurich Life 179966 324165 0 220738 841866 1566735
Total 1377818 2045236 5721 1550754 3759444 8738973

16
Factfile | 2013
GLOSSARY OF NON-LIFE INSURANCE TERMS
CommissionThe money paid out to an insurance intermediary in recognition of the business written by the insurer through the agency of the intermediary.
Cost of Claims IncurredThe total amount paid out in claims during a given period, plus the movement in technical reserves during that period. For example, if an insurer pays out €10m in claims during 2013, and technical reserves stood at €50m at the beginning of the year and increase to €55m by the end of the year, then the insurer’s claims incurred cost for 2013 would be €15m (€10m + €(55m-50m)).
Investment IncomeIncome received on investments PLUS gains/losses realised on disposal of investments PLUS unrealised gains/losses over the period in question on investments held throughout the period.
Management ExpensesThe internal expenses of an insurer incurred in acquiring and servicing insurance business.
Operating ResultA non-life insurer’s profit or loss after its investment income has been added to its underwriting result.
Gross and Net PremiumGross premium is the total amount of premium income of an insurer. Net premium is the premium retained by the insurer after it pays for its reinsurance protection. Similarly, gross claims costs are the total claims costs for which the insurer is liable under the policies it issues. Net claims costs take account of reinsurance claims recoveries due to the insurer from its reinsurers.
Written and Earned PremiumWritten premium is the actual premium paid by a policyholder for an insurance policy. Earned premium is the premium allocated to the actual exposure to risk arising during a particular period. For example, if an insurance company issues a 12-month policy for a premium of €500 on 1st January 2013, the written premium for 2013 will be €500, and so will the earned premium. But if the same policy is issued on 1st July 2013, the written premium will be €500, but the earned premium will only be €250; the other half of the premium will be allocated to an unearned premium reserve which will be credited to 2014 earned premium. This is because half of the premium is in respect of the exposure to loss during the first half of 2014.
ReinsuranceInsurance protection bought by an insurer to limit its own exposure. The availability of reinsurance protection allows an insurer to expand its own capacity to take on risk. Without a reinsurance facility, each insurer would be able to accept less business.
Technical ReservesThe amounts insurers hold against future payment of claims. There is supervisory control by the Financial Regulator of the proper estimation of outstanding claims and the nature and spread of assets which can be used to cover technical reserves.
Underwriting ResultA non-life insurer’s underwriting result is the profit or loss left after the cost of incurred claims, management expenses, commissions and other costs are deducted from earned premium income.
Non-Life Insurance Market 2009-2013

17
INSURANCE IRELAND
Overview of Non-Life Results for 2013Insurance Ireland’s 20 domestic non-life members write in excess of 95% of Irish non-life insurance business in the established market. Combined, Insurance Ireland members wrote gross premiums of €2,574m in 2013.
Motor insurance remains the largest class of non-life insurance at €1,113m (43% of all non-life business). Property is the second largest class of non-life business (33%).
Net written premiums (i.e. total premiums after reinsurance costs have been deducted) were €2,149m. Net earned premiums were €2,196m in 2013.
The number of new claims notified to Insurance Ireland members was 441,214. 53% of new claims were motor claims, while 23% were made on property insurance policies (household and commercial property).
Net incurred claims costs amounted to €1,693m leading to a net underwriting loss in 2013 of €211m. After investment income is added, the market made an operating loss of €81m.
Motor InsuranceGross written premium for motor insurance was €1,113m in 2013. 75% of motor insurance gross written premium is accounted for by private motor business with the remaining 25% derived from commercial motor business. Net earned motor premiums amounted to €1,013m in 2013.
The number of new motor claims notified during 2013 was 235,322.
The motor net underwriting loss was €254m in 2013.
Property InsuranceThe property insurance class is the second largest sector in the Irish non-life market after motor insurance. The property insurance market is split between household (57% of premium income) and commercial property (43%). Insurance Ireland members wrote gross property insurance premiums of €837m in 2013. The property insurance market recorded a net underwriting profit of €55m in 2013.
Non-Life Key Statistics 2013
Class
Premiums Claims
Net Under-writing Result
€m
Estimated Investment Income €m
Estimated Net Operating Result €m
Written Earned
Net Incurred €m
No of New Claims No-
tifiedGross €mNet €m
Net €m
Private Motor 836.8 768.5 757.2 777.9 183759 -234.5 43.7 -190.8
Comm. Motor 275.8 250.3 256.1 207.8 51563 -19.1 18.2 -0.9
All Motor 1112.6 1018.8 1013.3 985.7 235322 -253.6 61.9 -191.7
Household 480.3 396.2 434.0 209.8 55105 53.9 6.9 60.8
Comm. Property 357.2 223.3 232.7 135.8 45319 0.7 9.8 10.4
All Property 837.5 619.5 666.7 345.6 100424 54.6 16.7 71.2
Employers’ Liability 160.2 132.9 134.1 93.3 6148 -7.8 12.1 4.3
Public Liability 301.9 246.8 240.9 209.5 14455 -38.5 37.3 -1.2
All Liability 462.1 379.7 375.0 302.8 20603 -46.3 49.4 3.1
PA/Travel 81.0 65.2 67.4 37.8 30674 13.0 1.0 14.0
Other Business 80.4 65.7 73.1 20.4 54191 21.1 1.5 22.5
TOTAL 2573.6 2148.9 2195.5 1692.3 441214 -211.2 130.5 -80.9

Other
PA/Travel
Property
Liability
Motor
Total
0 50 100 150 200 250
110.3%124.9%
111.9%
94.9%81.5%
76.1%
NON-LIFE INSURANCE OPERATING RATIOS 2013
Claims Ratio %
Commission Ratio %
Management Expenses %
Combined Operating Ratio %
2A
18
Factfile | 2013
Liability InsuranceInsurance Ireland members wrote gross liability premiums of €462m in 2013. Net earned premium was €375m.
Net incurred claims amounted to €303m in 2013. Liability insurers made a net underwriting loss of €46m in 2013.
Other Non-Life LinesInsurance Ireland members wrote €81m of personal accident and travel insurance in 2013. This class of business generated a net underwriting profit of €13m in 2013.
Other classes of non-life business, including marine, aviation and transit (MAT), credit and suretyship, other financial loss covers and legal expenses insurance accounted for €80m in gross written premium in 2013. These classes of business produced a net underwriting profit of €21m in 2013.
Investing Non-Life Premium IncomeNon-life insurers’ technical reserves are mainly invested in cash and gilts, with only approximately 17% invested in equities. This is because of the need for security balanced by liquidity in order to meet claims and other short-term liabilities. This investment approach is in contrast to the investment portfolios of life and pensions companies, which are principally invested in assets that historically give a better long-term return, in particular equities.
Insurance Operating Ratios - see graph 2AA number of key ratios are used to assess the cost of claims, and the efficiency and profitability of non-life insurance business.
• The claims ratio measures the cost of claims incurred as a proportion of premiums earned. In 2013 the Insurance Ireland non-life market produced a net claims ratio of 77%. In other words, claims cost 77 cent out of every €1 earned in premium. The claims ratio varied between sectors: in motor insurance it was 97% while in liability and property the claims ratio was 81% and 52% respectively.
• The management expenses and commission ratios are calculated by comparing the internal management expenses of insurance companies and commissions paid to intermediaries with premiums. In 2013 the net commission ratio was 11% and the net management expenses ratio was 22%.
• The net combined or operating ratio combines the claims, commissions and management expenses ratios. The operating ratio for the non-life market was 110% in 2013. In other words, this meant that the non-life market made a loss of 10 cents on underwriting insurance for every €1 of premium in 2013.
Non-Life Insurance Market Results 2009-2013
Gross Written Pre-
mium €m
Net Un-derwriting Result €m
Investment Income
€m
Operating Result
€m
Profit: Premium %
€m
2009 3752 -124 317 193 5.14%
2010 3702 -103 169 66 1.78%
2011 3554 213 191 404 11.37%
2012 3331 -87 278 191 5.73%
2013 2574 -211 130 -81 -3.15%
5 Years 16913 -312 1085 773 4.57%
The data for 2009-2013 is taken from the Central Bank’s Insurance Statistical Review (2009) and Insurance Statistics (2010 -2012). These publications contain returns for all insurers. The data for 2013 is based on data supplied by Insurance Ireland members. As the ISR and IS publications do not provide a breakdown for every class of business, the data in the seven subsequent charts has been created from data supplied by Insurance Ireland members for all years. This explains the discrepancies between the first and the seven subsequent charts.

PRIVATE MOTOR 2009 - 2013
COMMERCIAL MOTOR 2009 - 2013
HOUSEHOLD 2009 - 2013
COMMERCIAL PROPERTY 2009 - 2013
EMPLOYER’S LIABILITY 2009 - 2013
Net Earned Premium
Net Incurred Claims Costs
Net Underwriting Result
Net Earned Premium
Net Incurred Claims Costs
Net Underwriting Result
Net Earned Premium
Net Incurred Claims Costs
Net Underwriting Result
Net Earned Premium
Net Incurred Claims Costs
Net Underwriting Result
Net Earned Premium
Net Incurred Claims Costs
Net Underwriting Result
1000
800
600
400
200
0
-200
2009
2010
2011
2012
2013
€m
400
300
200
100
0
-100
2009
2010
2011
2012
2013
€m
600
500
400
300
200
100
0
-100
-200
2009
2010
2011
2012
2013
€m
350
300
250
200
150
100
50
0
-5020
09
2010
2011
2012
2013
€m
250
200
150
100
50
0
2009
2010
2011
2012
2013
€m
2B
2C
2D
2E
2F
19
INSURANCE IRELAND
The chart illustrates the net underwriting result, investment income attributable to the underwriting account and the operating result for the non-life business market for the years 2009 to 2013. After investment income is taken into account, the 20 non-life insurers made a net combined operating loss of €81m in 2013.
Private Motor 2009 — 2013 - see graph 2BNet Earned Premium (NEP) in the private motor market was €757m in 2013. Claims costs fluctuated between the years 2009-2013, peaking at €911m in 2009 before falling in subsequent years and rising again to €778m in 2013.
Commercial Motor 2009 – 2013 - see graph 2CNet earned premium in the commercial motor insurance market was €256m in 2013. Net incurred claims costs have fluctuated during this period, amounting to €208m in 2013.
Household 2009 – 2013 - see graph 2DNet earned premium for household insurance peaked at €510m in 2010 and was €434m in 2013. Net incurred claims costs peaked at €508m in 2009 and fell back to €210m in 2013.
Commercial Property 2009 – 2013 - see graph 2E The underwriting result for insurers of commercial property deteriorated to a net underwriting profit of €1m in 2013 following a net underwriting profit of €8m in 2012. Net incurred claims costs increased to €136m from €115m in 2012.
Employers’ Liability 2009 – 2013 - see graph 2F Net earned premium increased to €134m in 2013 from €130m in 2012. The underwriting result improved to a net underwriting loss of €8m from a net underwriting loss of €13m in 2012.

PUBLIC LIABILITY 2009 - 2013
OTHER CLASSES 2009 - 2013
Net Earned Premium
Net Incurred Claims Costs
Net Underwriting Result
Net Earned Premium
Net Incurred Claims Costs
Net Underwriting Result
250
200
150
100
50
0
2009
2010
2011
2012
2013
€m
350300250200150100500
-50-100-150
2009
2010
2011
2012
2013
€m
2G
2H
20
Factfile | 2013
Public Liability 2009 – 2013 - see graph 2GNet earned premium increased to €241m in 2013 from €204m in 2012. In 2013 a net underwriting loss of €38m was recorded.
Other Classes 2009 – 2013 - see graph 2HOther classes of insurance include personal accident, travel, and financial loss insurances. Net earned premiums fluctuated during this five-year period and reached a low of €141m in 2013. The net underwriting profit increased to €34m in 2013, from €19m in 2012.

21
INSURANCE IRELAND
Insurance Ireland Non-life Members’ Gross Written Premium 2013* (€’000)
Company Motor Property Liability PA/Travel Other Classes Total
ACE 393 17025 16871 29737 9892 73918
AIG 47616 30970 77749 10872 1063 168270
Allianz 91823 144972 62526 4410 11707 315438
Amtrust 0 29 6164 0 133 6326
Aviva 160069 132524 43706 4525 1579 342402
AXA 243119 61022 2619 1934 0 308694
DAS 0 0 0 0 7540 7540
DeCare 0 0 0 9213 0 9213
Ecclesiastical 1 6719 4100 23 531 11374
Euro Insurances 5320 0 0 0 0 5320
FBD 157422 122305 65660 5808 0 351195
Genworth Financial 0 0 0 0 19633 19633
Irish Public Bodies 6022 23873 55545 929 2175 88544
Liberty Insurance 110243 33993 29739 0 0 173975
London General 0 307 0 0 11150 11457
MAPFRE 0 0 0 6682 5021 11703
New Technology 0 3590 0 0 0 3590
RSA 173169 143356 40213 6143 2127 365008
Travelers 6621 10811 13835 0 0 31267
Zurich 110768 106000 43406 738 7836 268748
Total 1112586 837496 462133 81014 80387 2573615
*Excludes Health Insurance

Annual Premium
Single Premium
12,000
10,000
8,000
6,000
4,000
2,000
0
2009
2010
2011
2012
2013
Premium (€m)
MARKET TRENDS 2009 - 2013
3A
22
Factfile | 2013
2013 Key International Life Statistics (€m)
Single Premium (1)
Annual Premium (2)
A.P.E. (2)+10% of (1)
EU 11952 411 1606
Non-EU 179 0.7 19
Total 12131 412 1625
The vast majority of international premium income is new single premium income. In 2013, the figure for Insurance Ireland’s International life members was €12,131m, up 82% on 2012 (€6,657m). Annual premium income more than tripled from €101.7m in 2012 to €412m in 2013 (an increase of 305%).
Some of this increase is accounted for by the higher number of companies participating in this statistical exercise, reflecting the increased number of Insurance Ireland international members.
Market Trends (2009 – 2013) - see graph 3AOver the 5-year period 2009 to 2013, single premium business has grown by 26% p.a. on average (from €4,790m in 2009 to €12,131m in 2013), whilst annual premium income increased by 50% p.a. (from €81.7m in 2009 to €412m in 2013).
International Market 2009-2013
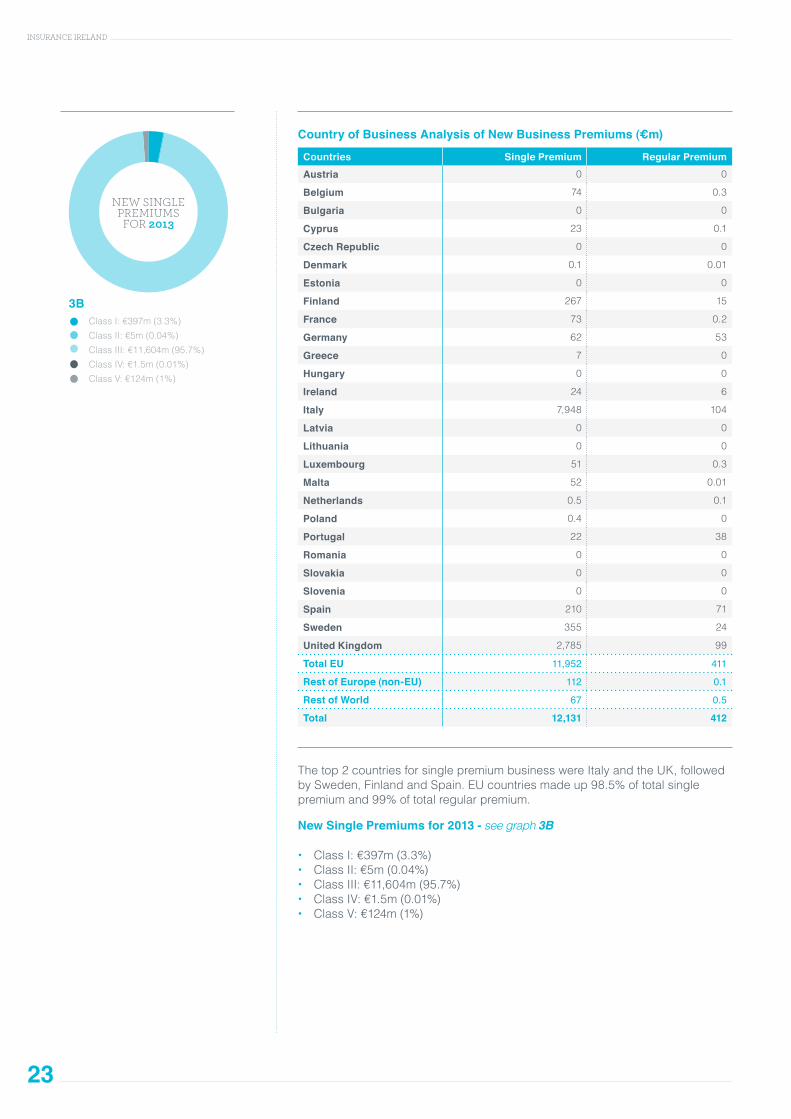
NEW SINGLE PREMIUMS
FOR 2013
Class I: €397m (3.3%)
Class II: €5m (0.04%)
Class III: €11,604m (95.7%)
Class IV: €1.5m (0.01%)
Class V: €124m (1%)
3B
23
INSURANCE IRELAND
Country of Business Analysis of New Business Premiums (€m)
Countries Single Premium Regular PremiumAustria 0 0
Belgium 74 0.3
Bulgaria 0 0
Cyprus 23 0.1
Czech Republic 0 0
Denmark 0.1 0.01
Estonia 0 0
Finland 267 15
France 73 0.2
Germany 62 53
Greece 7 0
Hungary 0 0
Ireland 24 6
Italy 7,948 104
Latvia 0 0
Lithuania 0 0
Luxembourg 51 0.3
Malta 52 0.01
Netherlands 0.5 0.1
Poland 0.4 0
Portugal 22 38
Romania 0 0
Slovakia 0 0
Slovenia 0 0
Spain 210 71
Sweden 355 24
United Kingdom 2,785 99
Total EU 11,952 411
Rest of Europe (non-EU) 112 0.1
Rest of World 67 0.5
Total 12,131 412
The top 2 countries for single premium business were Italy and the UK, followed by Sweden, Finland and Spain. EU countries made up 98.5% of total single premium and 99% of total regular premium.
New Single Premiums for 2013 - see graph 3B
• Class I: €397m (3.3%) • Class II: €5m (0.04%) • Class III: €11,604m (95.7%) • Class IV: €1.5m (0.01%) • Class V: €124m (1%)
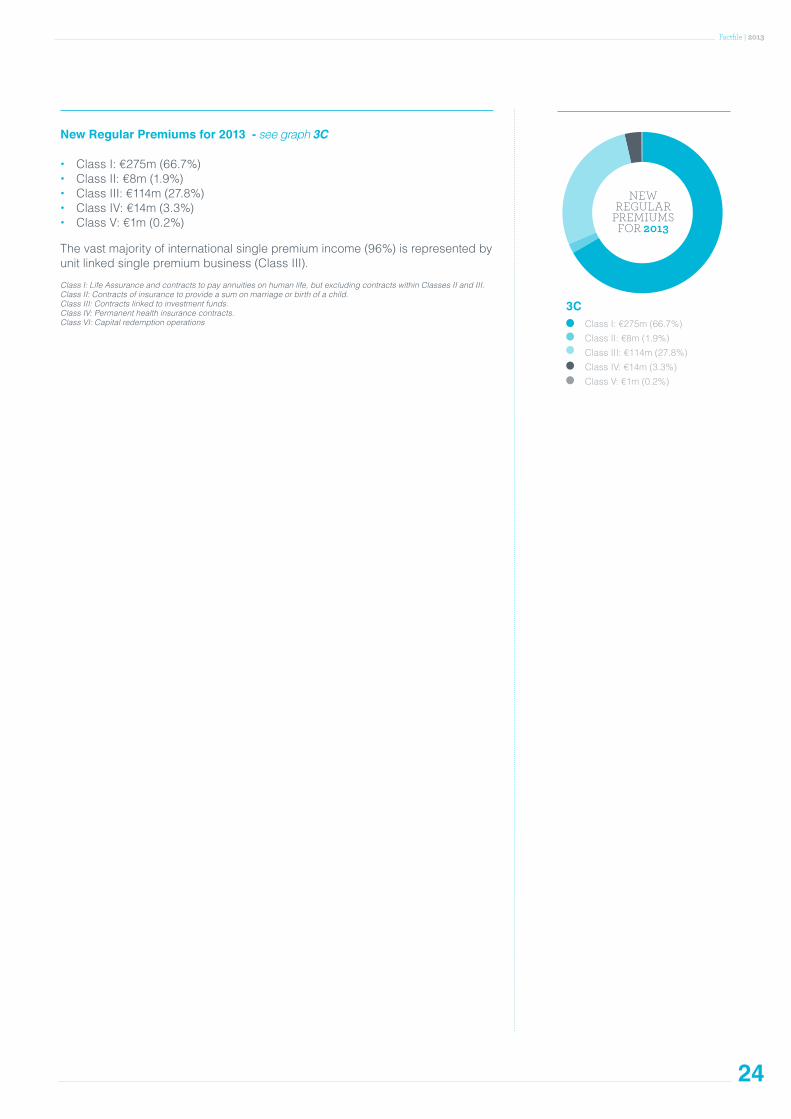
NEW REGULAR
PREMIUMS FOR 2013
Class I: €275m (66.7%)
Class II: €8m (1.9%)
Class III: €114m (27.8%)
Class IV: €14m (3.3%)
Class V: €1m (0.2%)
3C
24
Factfile | 2013
New Regular Premiums for 2013 - see graph 3C
• Class I: €275m (66.7%) • Class II: €8m (1.9%) • Class III: €114m (27.8%) • Class IV: €14m (3.3%) • Class V: €1m (0.2%)
The vast majority of international single premium income (96%) is represented by unit linked single premium business (Class III).
Class I: Life Assurance and contracts to pay annuities on human life, but excluding contracts within Classes II and III.Class II: Contracts of insurance to provide a sum on marriage or birth of a child.Class III: Contracts linked to investment funds.Class IV: Permanent health insurance contracts. Class VI: Capital redemption operations

25
INSURANCE IRELAND
Insurance Ireland International Life Members’ New Business Figures 2013 (€m)
Annual Premiums
Single Premiums Total
Aegon Ireland 0 433 433
Augura Life Ireland 0 8 8
AXA Life Europe Ltd 0 301 301
Canada Life Assurance Europe 44 61 105
Darta Saving Life Assurance 12 2494 2506
Generali PanEurope 42 982 1024
Hansard Europe* 0.4 5 6
HSBC Life Europe# 2 20 21
Intesa Sanpaolo Life 0 2423 2423
MetLife Europe 271 1216 1487
Prudential International Assurance (Ireland) 3 512 515
SEB Life International 5 937 943
St. James’s Place International 21 560 581
Skandia Life Ireland 0 97 97
The Lawrence Life Assurance 0 951 951
Zurich Life International Assurance 11 1132 1143
Total 412 12,131 12,543
* closed to new business from 30 June 2013# closed to new business

Published: SEPTEMBER 2014
Material from Factfile may be reproduced provided the source is fully acknowledged.
T: (01) 676 19 14 Insurance Information Service (consumer information)
Insurance Ireland, Insurance House, 39 Molesworth St.,Dublin 2
T: (01) 676 18 20
E: [email protected]: www.insuranceireland.eu
T: 1890 333 333 – Insurance Confidential LoCall (to report suspected fraud)
Disclaimer
The data published in this report has been compiled from information supplied by Insurance Ireland member companies unless otherwise indicated. While every effort has been made to ensure the accuracy of the collated information, Insurance Ireland does not accept responsibility for errors or omissions.