ABOUT THE URBAN INSTITUTEThe Urban Institute’s Kids’ Share report tracks government spending on...
60
Transcript of ABOUT THE URBAN INSTITUTEThe Urban Institute’s Kids’ Share report tracks government spending on...


ABOUT THE URBAN INSTITUTE
The nonprofit Urban Institute is dedicated to elevating the debate on social and economic policy. For nearly five decades, Urban scholars have conducted
research and offered evidence-based solutions that improve lives and strengthen communities across a rapidly urbanizing world. Their objective
research helps expand opportunities for all, reduce hardship among the most vulnerable, and strengthen the effectiveness of the public sector.
Copyright © October 2017. Urban Institute. Permission is granted for reproduction of this file, with attribution to the Urban Institute.

34 A CLOSER LOOK AT FEDERAL EXPENDITURES ON CHILDREN
36 How have federal expenditures on children changed since 1960?
38 Over time, has cash assistance to families increased or decreased?
40 How have individual categories and programs grown over time?
42 How targeted are expenditures to children in low-income families, and
how has this changed over time?
44 Which types of expenditures (i.e., mandatory, discretionary) on children
are projected to decline over the next decade?
46 Which categories of spending on children (i.e., health, education) are projected
to decline over the next decade?
48 APPENDIX: METHODS
52 REFERENCES
54 NOTES
55 ABOUT THE AUTHORS
56 STATEMENT OF INDEPENDENCE
02 ACKNOWLEDGMENTS
03 EXECUTIVE SUMMARY
04 INTRODUCTION
06 RECENT EXPENDITURES ON CHILDREN
08 How much does the federal government spend on children,
and how does current spending compare with recent years?
10 Which federal spending and tax programs provide the most
support to children?
12 Where are expenditures directed (i.e., health, education, tax provisions)?
14 What do the child-related tax provisions pay for?
16 How have federal expenditures on children changed between 2015 and 2016?
18 How has the Budget Control Act of 2011 affected spending on children?
20 How much do state and local governments contribute to spending on children?
22 BROAD TRENDS IN FEDERAL SPENDING 24 What share of the federal budget is spent on children?
26 How has spending on children and other federal budget
priorities changed over time?
28 How has the children’s share of the federal budget changed over time?
30 How much of the projected growth in the federal budget is
expected to go to children?
32 How does spending on children compare with spending on the elderly?
R E P O R T O N F E D E R A L E X P E N D I T U R E S O N C H I L D R E N T H R O U G H 2016 A N D F U T U R E P R O J E C T I O N S 01

ACKNOWLEDGMENTS The authors are grateful to the Annie E. Casey Foundation and the Peter G. Peterson Foundation
for sponsoring this research and to the authors of previous reports on children’s budgets for laying
the groundwork for this series. We also express appreciation to Margaret Simms for her insightful
comments, to Brittney Spinner for graphic design, and to Fiona Blackshaw for editorial assistance.
All photos via Shutterstock.
02 KIDS ’ SHARE 2017

EXECUTIVE
SUMMARY
Public spending on children by federal, state, and local
governments is an investment in the nation’s future.
Public spending supports the healthy development of
children, helping them fulfill their human potential. To
help interested stakeholders assess the government’s
investment in children, this 11th edition of the annual
Kids’ Share report provides an updated analysis of federal
expenditures on children from 1960 through 2016. It also
projects federal expenditures on children through 2027
to give a sense of how budget priorities may unfold absent
changes to current law.
A few highlights of the chartbook:
■ In 2016, 10 percent of the federal budget (or $377
billion of $3.9 trillion in outlays) was spent on
children (page 8).
■ An additional $108 billion in tax reductions was
targeted to families with children. Combining outlays
and tax reductions, federal expenditures on children
totaled $486 billion (page 8).
■ Half of all federal expenditures on children comes
from four spending and tax programs: Medicaid, the
earned income tax credit, the child tax credit, and the
dependent exemption (page 10).
■ The share of federal expenditures for children that
is targeted to low-income families has grown over
time, reaching 65 percent in 2016 (page 42).
■ Children’s programs are projected to receive just
one cent of every dollar of the projected $1.5
trillion increase in federal spending over the next
decade (page 30).
■ Under current law the children’s share of the budget
is projected to drop from 9.8 percent to 7.5 percent
over the next decade, as spending on Social Security,
Medicare, Medicaid, and interest payments on the
debt consume a growing share of the budget (page 28).
■ By 2020, the federal government will be spending
more on interest payments on the debt than on
children (page 26).
■ Over the next decade, every major category of spending
on children (health, education, income security, and so
on) is projected to decline relative to GDP (page 46).
R E P O R T O N F E D E R A L E X P E N D I T U R E S O N C H I L D R E N T H R O U G H 2016 A N D F U T U R E P R O J E C T I O N S 03

INTRODUCTION Public expenditures targeted to children can help ensure
that children receive what they need to reach their full
potential. Though parents and families provide most of
children’s basic needs, broader society also plays a role
in supporting children’s healthy development. Nutrition
benefits, housing assistance, and health insurance
programs help ensure children are well fed, housed, and
healthy, while investments in early education and public
schools promote learning and equality of opportunity.
These supports provide children with the resources to
develop into tomorrow’s productive workforce.
Increased understanding of how childhood circumstances
affect lifelong outcomes has led to more public support
for investment in children. Even so, spending on children
is not always prioritized relative to other categories
of the federal budget. The Urban Institute’s Kids’ Share
report tracks government spending on children each
year.1 We track how investments in children change over
time, both in quantity and by priority. Our annual reports
provide a comprehensive picture of federal, state, and
local expenditures. They also provide long-term trends in
federal spending, including historical spending to 1960
and projected spending 10 years into the future, assuming
no changes to current law. These reports have been the
foundation for additional analyses, including spending on
children by age group (Hahn et al., forthcoming), spending
differences across states (Isaacs 2017), spending on low-
income children (Vericker et al. 2012), and the Children’s
Budget series of reports produced by First Focus.2
This report, the 11th in the annual series, quantifies
federal spending in fiscal year 2016. Child poverty rates,
which rose during the Great Recession, have finally
returned to the levels of 2007, the year before the
recession. Even so, the child poverty rate (18.0 percent
in 2016) is much higher than the poverty rates for adults
ages 18 to 64 (11.6 percent) and seniors ages 65 and older
(9.3 percent). Family incomes are unequally distributed,
and many children live in families with low incomes. Among
29 developed countries, the United States has the second-
highest child poverty rate. Setting aside the legitimate
debates over how well poverty is measured, the United
States also ranks poorly on measures of birth weight
(23rd); preschool enrollment rates (26th); the share of 15-
to 19-year-olds participating in education, employment,
or training (23rd); and a composite measure of child well-
being (26th of 29, in the company of Lithuania, Latvia,
and Romania).3
The challenges facing American children provide context
for this Kids’ Share report. The report first considers
expenditures on children in 2016 and in recent years,
answering such questions as, “How much does the federal
government spend on children?” and “How much do
state and local governments contribute to spending on
children?” A second section examines broad trends in
0 4 KIDS ’ SHARE 2017

the federal budget from 1960 to 2027, comparing
spending on children with spending on other
priorities. It addresses such questions as, “What
share of the federal budget is spent on children?” and
“How much of the projected growth in the federal
budget is expected to go to children?”
A third section delves more deeply into the
composition of federal expenditures on children,
looking back to 1960 and projecting forward to
2027. It addresses such questions as, “How targeted
are expenditures to children in low-income families,
and how has this changed over time?” and “Which
categories of spending on children (i.e., health,
education) are projected to decline over time?”
Finally, a short methods appendix describes our
methodology for developing our estimates; we
provide additional detail in the Data Appendix to Kids’
Share 2017: Report on Federal Expenditures on Children
through 2016 and Future Projections and Spending on
Children Ages 8 and Younger (Ovalle et al. 2017). To
facilitate comparisons over time, all past and future
expenditures are reported in real dollars (inflation
adjusted to 2016 levels), as a percentage of the
economy (percentage of GDP), or as a percentage of
the federal budget.
The Kids’ Share series does not judge whether current
expenditures meet children’s needs, nor does it
measure or incorporate private spending on children.
The report does not prescribe an optimal division of
public dollars or resources. Instead, Kids’
Share provides a detailed budgetary analysis of
government support for children and its change
over time. This annual accounting of spending
on children is important as Congress considers
legislation introducing or amending individual
children’s programs or tax provisions, sets funding
levels in annual appropriation bills, and debates
broad tax and budgetary reform packages that may
shift the level and composition of public resources
invested in children.
GLOSSARYChildren: People from birth through age 18.
Expenditures on children: Expenditures from
programs and tax provisions that (1) benefit only
children or deliver a portion of benefits directly
to children, (2) increase benefit levels with
increases in family size, or (3) require that families
have a child to qualify.
Outlays: Direct spending from federal programs as
well as the portions of refundable tax credits that
exceed tax liability and are paid out to families.
Tax reductions: Reductions in families’ tax liabilities
(and revenues losses to the federal government)
resulting from tax exclusions, deductions, and credits
that benefit specific activities or groups of taxpayers.
These provisions include the portions of tax credits
not paid out to families as tax refunds.
Mandatory spending: Spending governed
by programmatic rules, not constrained by
annual appropriations acts; includes spending
on entitlement programs and other programs
designated as mandatory spending, as well as the
refundable portion of tax credits.
Discretionary spending: Spending set by annual
appropriations acts; policymakers decide each year
how much money to provide.
Real or 2016 dollars: Expenditures that have been
adjusted for inflation.
1 The earlier Kids’ Share reports are Clark et al. (2000); Carasso, Steuerle, and
Reynolds (2007); Carasso et al. (2008); Isaacs et al. (2009, 2010, 2011, 2012,
2013, and 2015); Hahn et al. (2014); and Edelstein et al. (2016).
2 Additional reports that build on the Kids’ Share database include analyses
of spending on children by age of child (Kent et al. 2010; Macomber et al.
2009, 2010; Vericker et al. 2010; Edelstein et al. 2012). The First Focus
Children’s Budget series, including Children’s Budget 2016 (First Focus 2016),
provides detailed, program-by-program information on appropriations for
children’s programs from 2011 through 2016, as well as the president’s
proposed funding for 2017.
3 See UNICEF Office of Research (2013). In that study, child poverty is
measured as the percentage of children living in households below 50
percent of the national median income, which is higher in the United States
than in many other countries.
R E P O R T O N F E D E R A L E X P E N D I T U R E S O N C H I L D R E N T H R O U G H 2016 A N D F U T U R E P R O J E C T I O N S 05

RECENT EXPENDITURES ON CHILDREN
In this section, we describe federal expenditures on
children for fiscal year 2016, the most recent year for
which complete federal spending data are available,
and changes in expenditures in recent years. We first
present federal expenditures on children, addressing
the following questions:
■ How much does the federal government spend on children,
and how does current spending compare with recent years?
■ Which federal spending and tax programs provide the most
support to children?
■ Where are expenditures directed (i.e., health, education,
tax provisions)?
■ What do the child-related tax provisions pay for?
■ How have federal expenditures on children changed between
2015 and 2016?
■ How has the Budget Control Act (BCA) of 2011 affected
spending on children?
This discussion is followed by a more comprehensive examination that
brings in state and local spending in recent years, to answer the question:
■ How much do state and local governments contribute to spending
on children?
06 KIDS ’ SHARE 2017

R E P O R T O N F E D E R A L E X P E N D I T U R E S O N C H I L D R E N T H R O U G H 2016 A N D F U T U R E P R O J E C T I O N S 07
Summing outlays and tax reductions, federal expenditures on children totaled $486 billion.
In 2016, 10 percent of the federal budget
(or $377 billion of $3.9 trillion in outlays)
was spent on children, through federal
programs and refundable tax credits.
An additional $108 billion in tax
reductions was targeted to families
with children. Summing outlays and
tax reductions, federal expenditures on
children totaled $486 billion.
Federal investments in children increased modestly
over the past year, after adjusting for inflation,
continuing the trend of the past five years. Spending
remains lower than in 2010 and 2011, in part because
of recovery from the recession but also because
budgetary pressures have squeezed the share of
resources devoted to children.
Looking back over the past decade, federal expenditures
have been shaped primarily by the Great Recession:
■ In 2009 through 2011, spending on entitlement
programs such as Medicaid and the Supplemental
Nutrition Assistance Program (SNAP, formerly food
stamps) automatically increased because more
children were living in poverty.
■ The American Recovery and Reinvestment Act of
2009 (ARRA) also temporarily boosted spending
on children. Almost one-quarter of ARRA funds
benefited children.4 ARRA provided federal stimulus
funds (e.g., expansions in nutrition assistance benefits
and the child tax credit); relief to states and localities
(through the State Fiscal Stabilization Fund, which
was targeted toward education, and a temporary
increase in the federal share of spending on Medicaid
and child welfare); and increased funding for several
federal education and care programs.
■ Much of the decline in dollars spent on children
after 2011 has resulted from the recovery from the
recession and depletion of ARRA funds. In addition,
the Budget Control Act and larger budgetary
pressures have constrained certain types of spending
on children.
4 See Kids’ Share 2012 (Isaacs et al. 2012). An estimated 24 percent
of ARRA outlays were targeted toward children from 2009 to 2019.
How much does the federal government spend on children, and how does current spending compare with recent years?
08 KIDS ’ SHARE 2017

Federal Expenditures on Children by Expenditure Type, 2007–16
Billions of 2016 dollars
Source: Authors’ estimates based on the Urban-Brookings Tax Policy Center microsimulation model and Office of Management and Budget, Budget of the United States Government, Fiscal Year 2018 (Washington, DC: US Government Printing Office, 2017) and past years.
Note: Numbers may not sum to totals because of rounding.
294322
352
405 400363 363 365 371 377
10399
102
108 109
107 108 108 111 108398
421
454
513 509
470 471 473 482 486
2007 2008 2009 2010 2011 2012 2013 2014 2015 2016
OutlaysTax reductions
R E P O R T O N F E D E R A L E X P E N D I T U R E S O N C H I L D R E N T H R O U G H 2016 A N D F U T U R E P R O J E C T I O N S 09

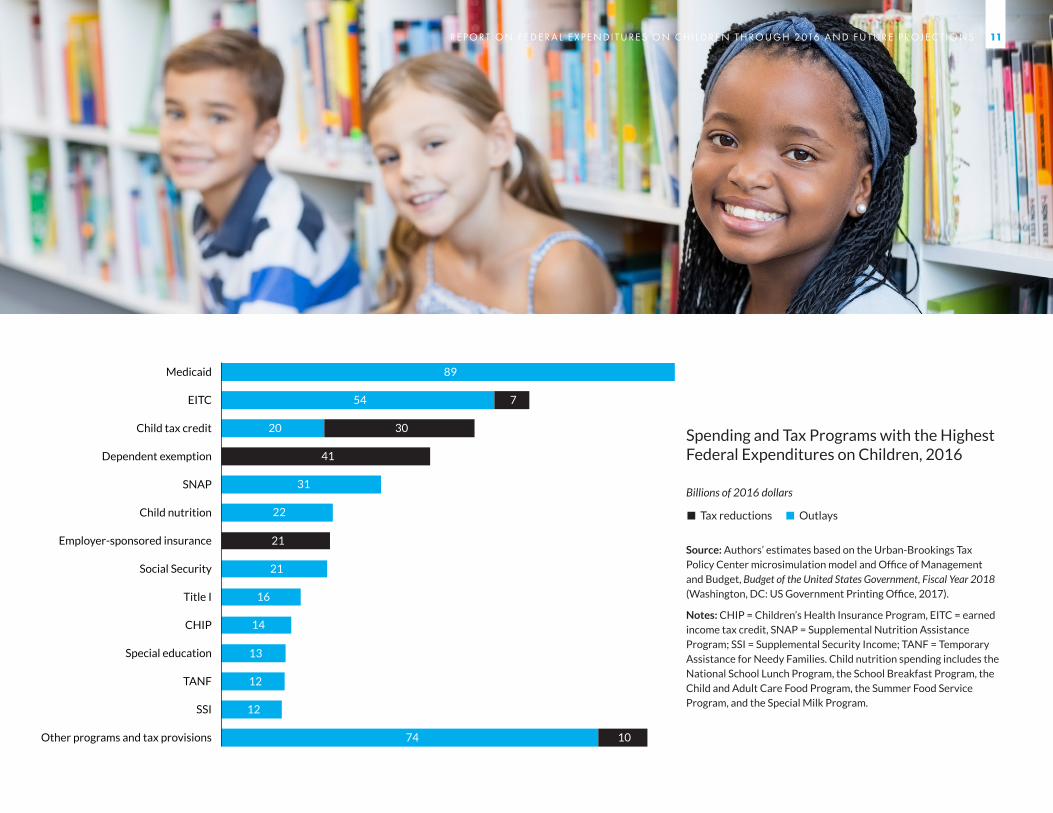
Medicaid is the largest source of spending on children.
Half of all federal expenditures on
children comes from four spending and
tax programs: Medicaid, the earned
income tax credit (EITC), the child tax
credit, and the dependent exemption.
■ Medicaid is the largest source of spending on
children. We estimate that $89 billion, or about one-
fourth of all Medicaid funds, was spent on children
in 2016. This estimate includes spending on people
under the age of 19 with disabilities.
■ Three child-related tax provisions make up the next-
largest programs. Most of the EITC’s expenditures and
two-fifths of the child tax credit’s expenditures are
in the form of tax refunds (cash outlays) to families;
the rest are provided in the form of reductions in tax
liabilities to those otherwise owing individual income
tax. The dependent exemption provided families with
children a tax break of $41 billion in 2016.
■ SNAP is the fifth-largest source of expenditures
on children, providing $31 billion in benefits to
children in 2016.
■ Three other programs provide more than $20
billion in benefits or tax reductions: Child nutrition
programs, including the school lunch and breakfast
programs; Social Security survivors’ and dependents’
benefits directed toward people younger than 18; and
employer-sponsored health insurance, calculated as
the reduction in tax revenue from excluding its value
from taxable income (the estimated cost of premiums
for dependent children).
■ Five other programs spent $10 billion or more on
children in 2016: Title I funding for education, the
Children’s Health Insurance Program (CHIP),
spending on special education and related services as
covered by the Individuals with Disabilities Education
Act, the children’s share of Temporary Assistance for
Needy Families (TANF), and Supplemental Security
Income (SSI) spending on children with disabilities.
■ Dozens of smaller programs also provide support to
children, as will be detailed later.
Which federal spending and tax programs provide the most support to children?
10 KIDS ’ SHARE 2017
OutlaysTax reductions
Spending and Tax Programs with the Highest Federal Expenditures on Children, 2016
Billions of 2016 dollars
Source: Authors’ estimates based on the Urban-Brookings Tax Policy Center microsimulation model and Office of Management and Budget, Budget of the United States Government, Fiscal Year 2018 (Washington, DC: US Government Printing Office, 2017).
Notes: CHIP = Children’s Health Insurance Program, EITC = earned income tax credit, SNAP = Supplemental Nutrition Assistance Program; SSI = Supplemental Security Income; TANF = Temporary Assistance for Needy Families. Child nutrition spending includes the National School Lunch Program, the School Breakfast Program, the Child and Adult Care Food Program, the Summer Food Service Program, and the Special Milk Program.
12
74 10
12
13
14
16
21
22
31
89
21
41
20 30
54 7
Other programs and tax provisions
SSI
TANF
Special education
CHIP
Title I
Social Security
Employer-sponsored insurance
Child nutrition
SNAP
Dependent exemption
Child tax credit
EITC
Medicaid
R E P O R T O N F E D E R A L E X P E N D I T U R E S O N C H I L D R E N T H R O U G H 2016 A N D F U T U R E P R O J E C T I O N S 11

Tax provisions are the largest source of support for children.
Sixty percent of expenditures is
directed toward tax provisions and
health; less than 10 percent is spent on
early education and care, social services,
housing, and training.
■ When the 19 major tax provisions benefiting children
are counted together, they far exceed any other major
budget category of spending. Expenditures on tax
provisions totaled $184 billion, or 38 percent of total
2016 expenditures on children. Here we include both
the refundable portions counted in the budget as
outlays as well as the tax reductions.
■ Health was the next-largest category ($110 billion),
representing 23 percent of total expenditures
on children.
■ The next-largest categories of spending were income
security (e.g., Social Security benefits to survivors
and dependents and TANF), at $59 billion; nutrition
(e.g., the children’s share of SNAP benefits and
child nutrition programs), also at $59 billion; and
education, at $41 billion.
■ The other categories are much smaller: early
education and care (which includes Head Start and
child care assistance but excludes preschool spending
within Title I, special education, and other broad
education programs; $14 billion), child welfare and
other social services ($10 billion), housing assistance
benefiting children ($9 billion), and the youth
components of job training programs ($1 billion).
Where are expenditures directed (i.e., health, education, tax provisions)?
12 KIDS ’ SHARE 2017

OutlaysTax reductions
Federal Expenditures on Children by Category, 2016
Billions of 2016 dollars
Source: Authors’ estimates based on the Urban-Brookings Tax Policy Center microsimulation model and Office of Management and Budget, Budget of the United States Government, Fiscal Year 2018 (Washington, DC: US Government Printing Office, 2017).
110
59 59 41
14 10 9 1
75
108
184
Tax provisions Health Income security Nutrition Education Social servicesEarly educationand care
Housing Training
R E P O R T O N F E D E R A L E X P E N D I T U R E S O N C H I L D R E N T H R O U G H 2016 A N D F U T U R E P R O J E C T I O N S 13

After income security, health is the largest category of child-related tax provisions.
Tax provisions primarily support
income security, followed by health
and child care.
■ The EITC, child tax credit, and dependent exemption
account for most expenditures from tax provisions.
Through cash refunds and reductions in tax liabilities,
these credits increase the income of families with
children relative to families without children,
providing a form of income support. In addition,
provisions excluding various forms of cash assistance
from taxable income (e.g., Social Security survivors’
benefits, veterans benefits, and public assistance)
provide some additional income support to families
with children.
■ After income security, the largest category of child-
related tax provisions is health. Two health-related
tax provisions benefit children: the tax exclusion
for employer-sponsored health insurance and the
much smaller outlays and tax reductions associated
with the premium tax credit under the Affordable
Care Act. Relatively small shares of these provisions
benefit children, including less than $1 billion for the
premium tax credit.
■ Other relatively small tax provisions support child
care (i.e., the dependent care tax credit and two
employer tax credits related to child care), education
(quality zone academy bonds), and social services
(adoption tax credits and the exclusion of foster care
and adoption assistance from taxable income).
What do the child-related tax provisions pay for?
14 KIDS ’ SHARE 2017

54
7
20
30
41
5 2
EITC CTC Dependent exemption
Health Child care Exclude cash assistance
Education bonds Social services
21
1 1
1 1
OutlaysTax reductions
Federal Expenditures on Child-Related Tax Provisions, 2016
Billions of 2016 dollars
Source: Authors’ estimates based on the Urban-Brookings Tax Policy Center microsimulation model and Office of Management and Budget, Budget of the United States Government, Fiscal Year 2018 (Washington, DC: US Government Printing Office, 2017).
Note: CTC = child tax credit; EITC = earned income tax credit.
R E P O R T O N F E D E R A L E X P E N D I T U R E S O N C H I L D R E N T H R O U G H 2016 A N D F U T U R E P R O J E C T I O N S 15

Spending on children’s health grew $7.5 billion between 2015 and 2016, driven primarily by increases in CHIP and Medicaid.
Some of the more than 80 programs
and tax provisions included in our
analysis have increased while others
have decreased. The net effect is an
increase of $3.7 billion (less than 1
percent), less than the rate of growth
of the economy. Excluding health care,
real spending on children declined.
Estimates by program are presented for all spending
and tax programs with expenditures of $1 billion or
more; expenditures on smaller programs are not shown
separately but are included in the 10 budget category
subtotals shown in the table on page 13.
■ Spending on children’s health grew $7.5 billion
between 2015 and 2016, driven primarily by
increases in CHIP and Medicaid. The federal match
rate for CHIP was increased under the Affordable
Care Act, effective 2016, leading to a substantial
increase in CHIP outlays between 2015 and 2016.
■ Income security spending also increased (driven
by increases in dependent benefits related to
veterans disability compensation), and smaller
increases occurred in early education and care,
housing, and social services.
■ Spending on children’s nutrition fell $1.3 billion,
with declines in SNAP partially offset by increases
in child nutrition. SNAP caseloads and expenditures
have dropped from peak levels during the recession;
even so, one in four children in the United States were
in families receiving SNAP benefits in an average
month of 2016.
■ Support for children through tax reductions declined
$2.8 billion, driven by a decline in the children’s
share of the exclusion of employer-sponsored health
insurance. Spending on refundable tax credits also
declined, but trivially.
■ Finally, education spending decreased. The decrease
shown in “other education” reflects the depletion
of the State Fiscal Stabilization Fund, which was
authorized under ARRA and had $0.9 billion in outlays
in 2015 and no outlays in 2016.
See page 54 for table sources and notes.
How have federal expenditures on children changed between 2015 and 2016?
16 KIDS ’ SHARE 2017

2016 Change from 2015
1. Health 109.5 7.5
Medicaid 89.2 2.0
CHIP 13.6 4.8
Vaccines for children 4.4 0.5
Other health 2.3 0.1
2. Nutrition 58.6 -1.3
SNAP (food stamps) 31.5 -1.7
Child nutrition 21.8 0.7
Special Supplemental food (WIC) 5.3 -0.4
3. Income Security 58.6 0.7
Social Security 20.8 -0.4
Temporary Assistance for Needy Families 12.4 -0.4
Supplemental Security Income 11.8 0.4
Veterans compensation (disability compensation) 8.7 1.0
Child support enforcement 4.0 *
Other income security 0.9 0.1
4. Education 40.5 -0.6
Education for the Disadvantaged (Title I, Part A) 15.6 0.2
Special education/IDEA 12.6 0.2
School improvement 4.4 *
Indian education 1.8 0.1
Innovation and improvement 1.5 *
Impact Aid 1.3 -0.2
Dependents' schools abroad 1.1 *
Other education 3.2 -1.0
Federal Expenditures by Category and Program, 2016Billions of 2016 dollars
2016 Change from 2015
5. Early Education and Care 14.0 0.4
Head Start (including Early Head Start) 8.7 0.3
Child Care and Development Fund 5.3 0.1
6. Social Services 10.2 0.3
Foster care 4.8 0.2
Adoption assistance 2.6 0.1
Other social services 2.8 *
7. Housing 9.4 0.18
Section 8 low-income housing assistance 7.6 0.2
Low-rent public housing 1.1 *
Other housing 0.8 *
8. Training 1.2 *
9. Refundable Portions of Tax Credits 75.4 -0.6
Earned income tax credit 53.6 -0.2
Child tax credit 20.2 -0.6
Premium tax credit 0.8 0.4
Other refundable tax credits 0.7 -0.1
10. Tax Reductions 108.4 -2.8
Dependent exemption 41.0 0.6
Exclusion for employer-sponsored health insurance 21.4 -3.1
Child tax credit (nonrefundable portion) 29.6 -0.4
Earned income tax credit (nonrefundable portion) 6.9 0.2
Dependent care credit 4.4 *
Other tax reductions 5.1 *
TOTAL EXPENDITURES ON CHILDREN 485.9 3.7
OUTLAYS SUBTOTAL (1–9) 377.5 6.5
R E P O R T O N F E D E R A L E X P E N D I T U R E S O N C H I L D R E N T H R O U G H 2016 A N D F U T U R E P R O J E C T I O N S 17

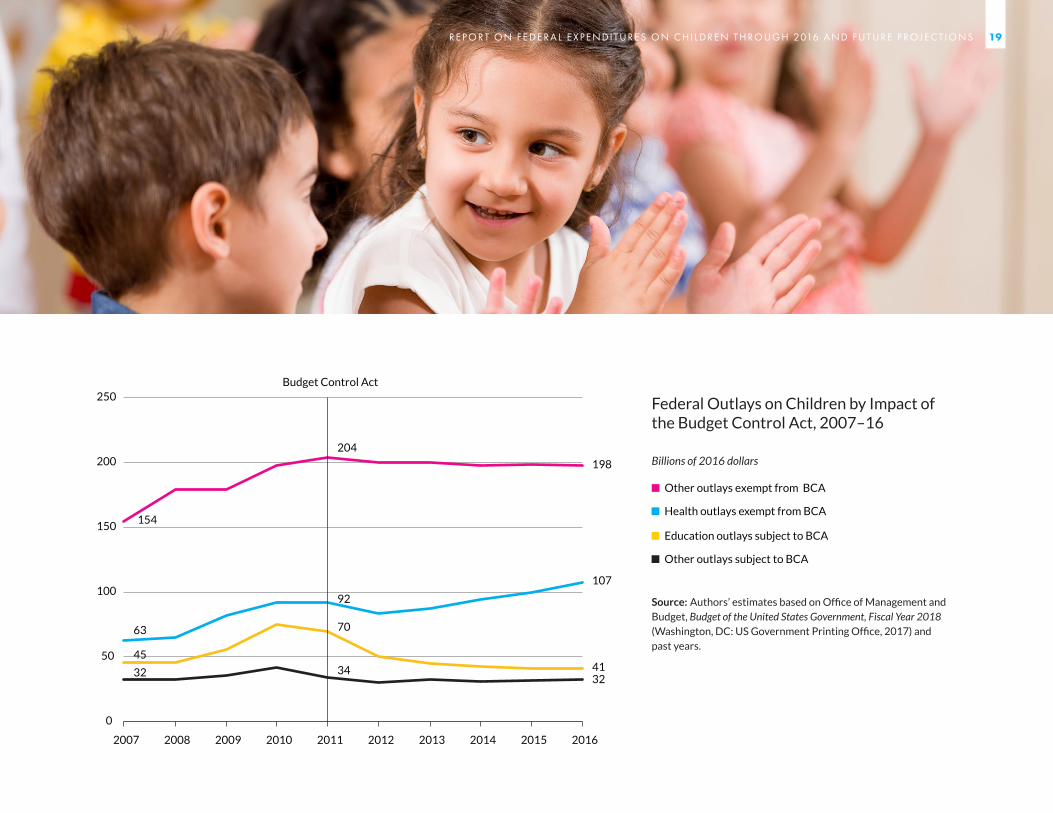
A majority of children’s outlays is exempt from the BCA.
While the BCA has contributed to
declines in certain areas of children’s
spending (e.g., education), it has had
minimal impact on total expenditures
on children because of its exemptions.
Designed to curb total federal spending, the Budget
Control Act primarily constrains discretionary
spending, with both defense and nondefense
spending caps in place through 2021. Tax credits and
most mandatory programs are largely exempt from the
BCA’s spending restrictions.
A majority of children’s outlays—81 percent in 2016—is
exempt from the BCA.
■ Mandatory health spending exempt from
the BCA (including Medicaid and CHIP) grew
considerably over most of the past decade
(see glossary for definitions of “mandatory”
and “discretionary” spending).
■ Other spending exempt from the BCA, including
refundable tax credits, Social Security, and many
mandatory programs serving low-income people (e.g.,
SNAP, TANF) grew between 2007 and 2011. Slight
declines in such spending since then stems from
recovery from the recession, not the BCA.
The roughly 20 percent of children’s spending that
is subject to BCA caps or sequestration has declined
in total over the past decade. This decline—which was
temporarily offset by spending increases under ARRA—
precedes the Budget Control Act and is partly
driven by pressures on domestic spending subject
to appropriations.
■ Federal spending on education was 11 percent lower
in 2016 than in 2007.
■ Other spending subject to the BCA has not declined
as sharply; it is 1 percent lower in 2016 than in 2007.
This category is largely discretionary spending, but it
includes three mandatory programs that were subject
to automatic spending reductions in 2013–16: the
Social Services Block Grant, the Promoting Safe and
Stable Families program, and the Maternal, Infant
and Early Childhood Home Visiting program. Popular
support for programs such as WIC, Head Start, and
child care assistance may have helped maintain
spending even when these programs were competing
with all other discretionary programs.
How has the Budget Control Act of 2011 affected spending on children?
18 KIDS ’ SHARE 2017
Education outlays subject to BCA
Other outlays subject to BCA
Other outlays exempt from BCA
Health outlays exempt from BCA
45
70
41 32 34 32
63
92
107
154
204
198
0
50
100
150
200
250
2007 2008 2009 2010 2011 2012 2013 2014 2015 2016
Budget Control Act
Federal Outlays on Children by Impact of the Budget Control Act, 2007–16
Billions of 2016 dollars
Source: Authors’ estimates based on Office of Management and Budget, Budget of the United States Government, Fiscal Year 2018 (Washington, DC: US Government Printing Office, 2017) and past years.
R E P O R T O N F E D E R A L E X P E N D I T U R E S O N C H I L D R E N T H R O U G H 2016 A N D F U T U R E P R O J E C T I O N S 19

State and local governments contribute 64 percent of total public spending on children.
State and local spending on children
exceeds federal spending, providing
64 percent of total public spending in
2014 (the last year for which we have
complete data).5
■ During the recession, state and local governments
cut funding on education and other children’s
programs. Over the same period, the federal
government increased spending as SNAP, Medicaid,
and other federal entitlement programs adjusted
automatically to meet increased need, and as
ARRA provided funds to support state and local
governments, help families facing unemployment, and
stimulate the economy. The federal increases were
large enough to boost total spending per child during
the recession, when needs and poverty rates rose.
■ In 2012, as the recession ended, federal funding
dropped sharply and was only partly offset by a small
increase in state and local spending. Since then, state
and local spending has risen gradually; as of 2014,
spending levels are still lower than in 2008.
■ State and local spending is dominated by spending
on public education, the largest form of public
investment in children. The federal government
contributes only 7 cents of each education dollar.
■ State and local governments also contribute
significantly to health spending on children,
though not as much as the federal government.
■ States and localities spend little on nutrition,
housing, or training. Their contributions to income
security, tax credits, child care, foster care, and
social services, while important, are small relative
to federal spending.
5 To improve the comparability of our federal estimates to our estimates of
state and local spending, we exclude the value of the dependent exemption
and other tax reductions. That is, the federal estimates are restricted to
outlays, including the refundable portions of the EITC and child tax credit.
The state and local estimates include one tax provision: the value of the state
earned income tax credit in states that have such a credit.
How much do state and local governments contribute to spending on children?
20 KIDS ’ SHARE 2017

0
2,000
4,000
6,000
8,000
10,000
12,000
14,000
20
07
20
08
20
09
20
10
20
11
20
12
20
13
20
14
20
07
20
08
20
09
20
10
20
11
20
12
20
13
20
14
20
07
20
08
20
09
20
10
20
11
20
12
20
13
20
14
20
07
20
08
20
09
20
10
20
11
20
12
20
13
20
14
Education Health Other Total
State and localFederal
Federal, State, and Local Spending per Child on Education, Health, and Other Categories, 2007–14
2016 dollars
Source: Authors’ estimates based on Office of Management and Budget, Budget of the United States Government, Fiscal Year 2016 (Washington, DC: US Government Printing Office, 2015) and past years, the Rockefeller Institute of Government’s State Funding for Children Database, and various sources.
Note: These estimates do not include tax reductions.
R E P O R T O N F E D E R A L E X P E N D I T U R E S O N C H I L D R E N T H R O U G H 2016 A N D F U T U R E P R O J E C T I O N S 21

BROAD TRENDS IN FEDERAL SPENDING
Following on the examination of current expenditures,
this section analyzes broad trends in spending on
children—both past and future—in the context of the
entire federal budget. Our future projections follow
the assumptions of the Congressional Budget Office’s
baseline projections, supplemented by other sources,
and our own assumptions about the shares of individual
programs allocated to children (see appendix). In this
section, we primarily focus on federal outlays, setting
aside tax reductions. The first four figures address the
following questions:
■ What share of the federal budget is spent on children?
■ How has spending on children and other federal budget priorities
changed over time?
■ How has the children’s share of the federal budget changed over time?
■ How much of the projected growth in the federal budget is expected
to go to children?
Two later figures compare children under 19 to people 65 and older,
to answer this question:
■ How does spending on children compare with spending on the elderly?
Most children and elderly adults are outside the working-age population
and thus more likely to rely on public or private support.
22 KIDS ’ SHARE 2017

R E P O R T O N F E D E R A L E X P E N D I T U R E S O N C H I L D R E N T H R O U G H 2016 A N D F U T U R E P R O J E C T I O N S 23

10 percent of the federal budget was spent on children.
In 2016, 10 percent of the federal budget
(or $377 billion of $3.9 trillion in outlays)
was spent on children.
■ The remaining 90 percent of the budget was spent as
follows: 46 percent on adults through Social Security,
Medicare, and Medicaid; 15 percent on defense;
6 percent on interest payments on the debt; and
23 percent on a residual category, which includes
all other federal spending priorities, ranging from
agriculture subsidies and highway construction to
unemployment compensation, veterans benefits,
higher education, and environmental protection.
■ The share of the federal budget spent on children
has been flat—at about 10 percent—for the past
several years.
■ Child-related tax expenditures (totaling $108 billion
in 2016) represent less than 8 percent of the $1.5
trillion in individual and corporate tax expenditures
identified by the Office of Management and Budget.6
This share has been declining in recent years, from 11
percent in 2008 to 9 percent in 2012 and 8 percent in
2013 and 2014.
6 To calculate the total tax-expenditure budget, we sum Office of
Management and Budget (OMB) estimates of tax provisions for individuals
and corporations, although such provisions are not strictly additive because
of interaction effects. To this we add the dependent exemption, which OMB
views as part of the overall tax structure rather than a special tax provision
resulting in a tax expenditure. We include the dependent exemption in our
analyses of expenditures on children.
What share of the federal budget is spent on children?
24 KIDS ’ SHARE 2017

Adult portion of Social Security, Medicare, and Medicaid
46%
Children
10%
Defense
15%
All other outlays
23%
Interest on the debt
6%
Share of Federal Budget Outlays Spent on Children and Other Items, 2016
Source: Authors’ estimates based on Office of Management and Budget, Budget of the United States Government, Fiscal Year 2018 (Washington, DC: US Government Printing Office, 2017).
R E P O R T O N F E D E R A L E X P E N D I T U R E S O N C H I L D R E N T H R O U G H 2016 A N D F U T U R E P R O J E C T I O N S 25
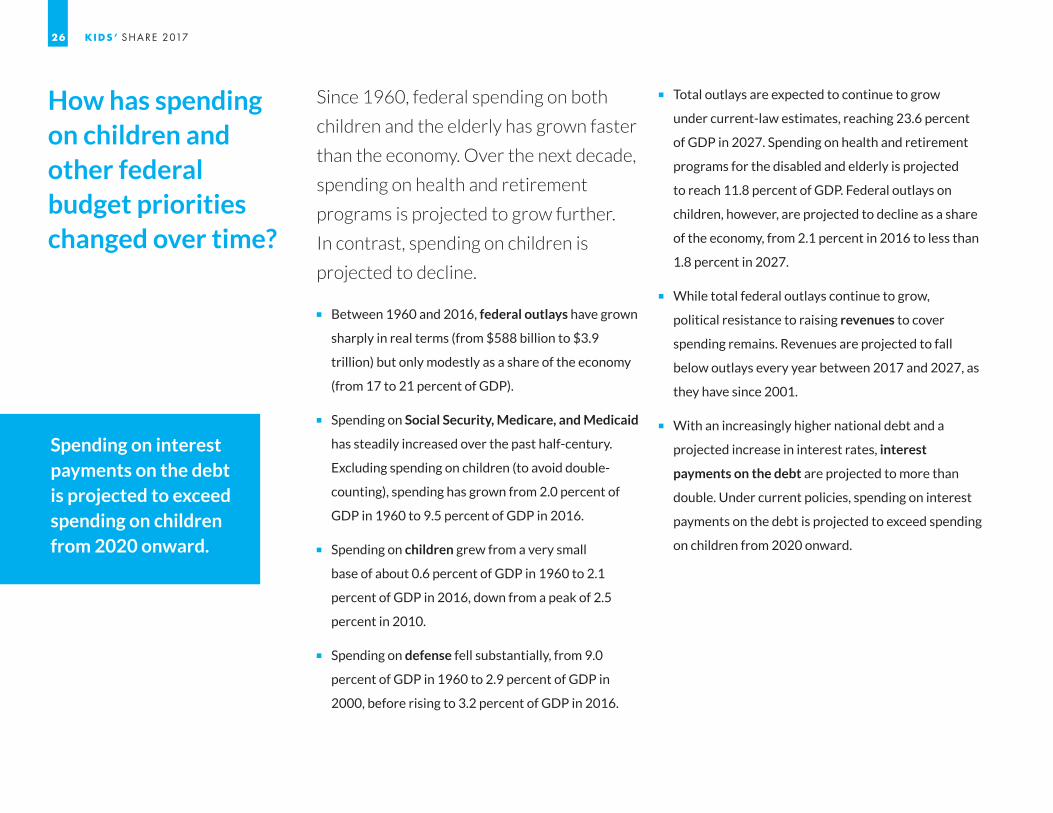
Spending on interest payments on the debt is projected to exceed spending on children from 2020 onward.
Since 1960, federal spending on both
children and the elderly has grown faster
than the economy. Over the next decade,
spending on health and retirement
programs is projected to grow further.
In contrast, spending on children is
projected to decline.
■ Between 1960 and 2016, federal outlays have grown
sharply in real terms (from $588 billion to $3.9
trillion) but only modestly as a share of the economy
(from 17 to 21 percent of GDP).
■ Spending on Social Security, Medicare, and Medicaid
has steadily increased over the past half-century.
Excluding spending on children (to avoid double-
counting), spending has grown from 2.0 percent of
GDP in 1960 to 9.5 percent of GDP in 2016.
■ Spending on children grew from a very small
base of about 0.6 percent of GDP in 1960 to 2.1
percent of GDP in 2016, down from a peak of 2.5
percent in 2010.
■ Spending on defense fell substantially, from 9.0
percent of GDP in 1960 to 2.9 percent of GDP in
2000, before rising to 3.2 percent of GDP in 2016.
■ Total outlays are expected to continue to grow
under current-law estimates, reaching 23.6 percent
of GDP in 2027. Spending on health and retirement
programs for the disabled and elderly is projected
to reach 11.8 percent of GDP. Federal outlays on
children, however, are projected to decline as a share
of the economy, from 2.1 percent in 2016 to less than
1.8 percent in 2027.
■ While total federal outlays continue to grow,
political resistance to raising revenues to cover
spending remains. Revenues are projected to fall
below outlays every year between 2017 and 2027, as
they have since 2001.
■ With an increasingly higher national debt and a
projected increase in interest rates, interest
payments on the debt are projected to more than
double. Under current policies, spending on interest
payments on the debt is projected to exceed spending
on children from 2020 onward.
How has spending on children and other federal budget priorities changed over time?
26 KIDS ’ SHARE 2017

Children
0
5
10
15
20
25Projections><Actuals
1.4%
1980
1.0%
1970
0.6%
1960
1.1%
1990
1.5%
2000
2.5%
2010
2.1%
2016
1.8%
2027
Defense
Adult portion of Social Security, Medicare, and Medicaid
Children
All outlays not categorized below
Revenues
Interest on the debt
Federal Outlays and Revenues as a Share of GDP, 1960–2027
Source: Authors’ estimates based on Congressional Budget Office, An Update to the Budget and Economic Outlook: 2017 to 2027 (Washington, DC: Congressional Budget Office, 2017), and Office of Management and Budget, Budget of the United States Government, Fiscal Year 2018 (Washington, DC: US Government Printing Office, 2017) and past years.
Note: Totals shown along the horizontal axis are percentage of GDP spent on children.
R E P O R T O N F E D E R A L E X P E N D I T U R E S O N C H I L D R E N T H R O U G H 2016 A N D F U T U R E P R O J E C T I O N S 27

The children’s share of the budget is projected to drop from 9.8 percent to 7.5 percent over the next decade.
The share of the federal budget
allocated to children grew between
1960 and 2010. It has fallen since then,
and budget projections suggest that it
will decline further.
■ Back in 1960, only 3.2 percent of federal outlays
were spent on children. The children’s share of the
budget grew in fits and starts, reaching a peak of
10.7 percent in 2010. It fell to 9.8 percent in 2016
and is projected to decline by nearly a quarter, to 7.5
percent, by 2027. At the same time, the share of the
population under age 19 will contract slightly, from
24 percent to 23 percent.
■ As the baby boomers reach retirement age, Social
Security, Medicare, and Medicaid spending on adults
has increased as a share of total federal spending and
is expected to continue to do so. By 2027, half the
federal budget (50 percent) will be spent on the adult
portions of Social Security, Medicare, and Medicaid.
This growth stems from an increase in the share of
the population ages 65 and older (from 15 percent in
2016 to 20 percent in 2027) and projected growth
in real health and Social Security benefits per person
under current law.
■ The share of the budget spent on defense fell
dramatically between 1960 and 2000, essentially
financing the expansion of domestic programs
without any significant increase in average tax
rates. Under the BCA’s caps, defense spending is
projected to shrink further from 15 percent of
federal outlays in 2016 to a post–World War II low
of 12 percent in 2027.
■ Interest payments on the debt fluctuated over the
past half-century. They are projected to grow as a
share of the budget from 6 percent in 2016 to 12
percent by 2027, reflecting higher national debt and
projected rising interest rates.
■ Spending on all other governmental functions
is projected to shrink to 19 percent of the budget
by 2027.
How has the children’s share of the federal budget changed over time?
28 KIDS ’ SHARE 2017

3.2% 5.4% 6.6% 5.4% 8.5% 10.7% 9.8% 7.5%
11%
18%
26% 29%
38%38%
46% 50%52%
42% 23%24%
16%20%
15% 12%
8% 7%
9%
15% 9%6% 6% 12%
26% 27%36%
27% 28% 25% 23%19%
0
25
50
75
100
1960
$.59 $5.3$.97
1970
$1.5
1980
$2.1
1990
$2.4
2000
$3.8
2010
$3.9
2016 Projected 2027
Total spending (trillions of 2016 dollars)
Defense
Adult portion of Social Security, Medicare, and Medicaid
Children
All outlays not categorized below
Interest on the debt
Share of Federal Budget Outlays Spent on Children and Other Items, Selected Years, 1960–2027
Source: Authors’ estimates based on Congressional Budget Office, An Update to the Budget and Economic Outlook: 2017 to 2027 (Washington, DC: Congressional Budget Office, 2017), and Office of Management and Budget, Budget of the United States Government, Fiscal Year 2018 (Washington, DC: US Government Printing Office, 2017) and past years.
R E P O R T O N F E D E R A L E X P E N D I T U R E S O N C H I L D R E N T H R O U G H 2016 A N D F U T U R E P R O J E C T I O N S 29

Social Security, Medicare, Medicaid, and interest on the debt garner almost all the expected growth in spending over the next decade.
Children’s programs are projected
to receive just one cent of every
dollar of the projected increase in
federal spending over the next decade.
■ Federal spending is projected to increase by nearly
$1.5 trillion over the next 10 years, reaching $5.3
trillion in 2027.
■ Together, Social Security, Medicare, Medicaid, and
interest on the debt garner almost all (90 percent)
of the expected growth in spending over the next
decade. As noted earlier, growth in Social Security,
Medicare and Medicaid is driven by a growth in the
elderly population and real benefits per person. In the
absence of legislative action to increase revenues, as
these programs continue to grow, so will the national
debt and interest payments on the debt.
■ With so much built-in growth in these spending
programs under current law, spending on other
priorities—including defense, children, and all
other governmental spending—are under severe
budgetary pressures.
■ Children’s programs are projected to increase by an
estimated $20 billion, or one cent of every dollar of
the projected increase in federal outlays. However,
growth in health care spending alone pushes children
into positive territory; nonhealth spending on
children actually decreases.
■ Spending on defense and all other functions is
similarly projected to increase very little.
■ These budget projections assume that all nondefense
discretionary spending programs are affected equally
by the BCA spending caps. Also, these projections
show where current law trends lead, absent changes
in policy. Laws and policies do not stay constant. Still,
existing policies have never preordained so much
future spending.
How much of the projected growth in the federal budget is expected to go to children?
30 KIDS ’ SHARE 2017
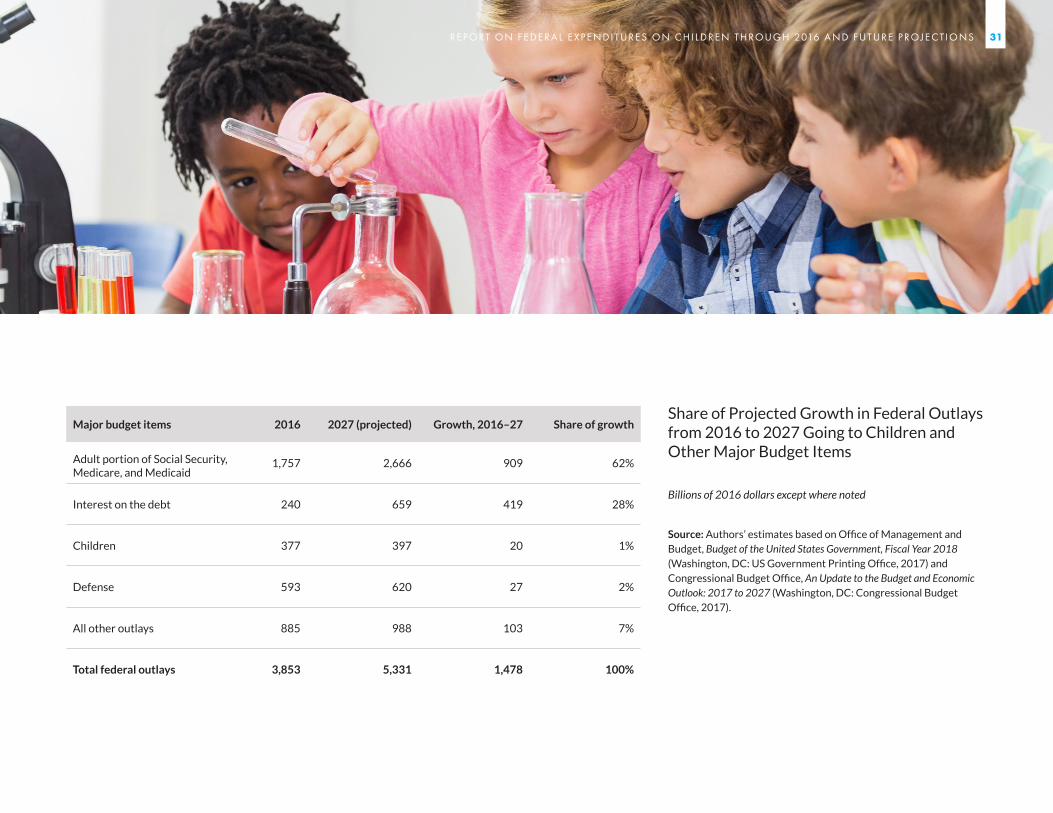
Major budget items 2016 2027 (projected) Growth, 2016–27 Share of growth
Adult portion of Social Security, Medicare, and Medicaid
1,757 2,666 909 62%
Interest on the debt 240 659 419 28%
Children 377 397 20 1%
Defense 593 620 27 2%
All other outlays 885 988 103 7%
Total federal outlays 3,853 5,331 1,478 100%
Share of Projected Growth in Federal Outlays from 2016 to 2027 Going to Children and Other Major Budget Items
Billions of 2016 dollars except where noted
Source: Authors’ estimates based on Office of Management and Budget, Budget of the United States Government, Fiscal Year 2018 (Washington, DC: US Government Printing Office, 2017) and Congressional Budget Office, An Update to the Budget and Economic Outlook: 2017 to 2027 (Washington, DC: Congressional Budget Office, 2017).
R E P O R T O N F E D E R A L E X P E N D I T U R E S O N C H I L D R E N T H R O U G H 2016 A N D F U T U R E P R O J E C T I O N S 31

State and localFederal
Per Capita Federal, State, and Local Spending on Children and the Elderly, 2014
2016 dollars
Source: Authors’ estimates based on Office of Management and Budget, Budget of the United States Government, Fiscal Year 2016 (Washington, DC: US Government Printing Office, 2015) and various sources.
Note: These estimates do not include tax reductions.
4,684
28,725
8,469
940
13,153
29,665
Children (< 19) Elderly ( 65)
The federal government spent $6 on the elderly for every $1 spent on children.
Federal per capita spending on the
elderly is much higher than per capita
spending on children—by a 6:1 ratio in
recent years.
■ The federal government spent $6 on the elderly for
every $1 spent on children, in both 2016 (the latest
year for federal data) and 2014 (the latest year for
state and local data).
■ States and localities spend considerably more on
children than the elderly, especially through spending
on public schools. The combined spending of federal,
state, and local governments on the elderly was 2.3
times their combined spending on children in 2014.
■ Health care expenses are a significant portion of
public expenditures on the elderly. Yet even when
excluding health spending, per capita spending on the
elderly remains considerably higher than per capita
spending on children.
How does spending on children compare with spending on the elderly?
32 KIDS ’ SHARE 2017

Per Capita Federal Spending on Children and the Elderly, 1960–2016
2016 dollars
Source: Authors’ estimates based on Office of Management and Budget, Budget of the United States Government, Fiscal Year 2018 (Washington, DC: US Government Printing Office, 2017) and past years.
Note: These estimates do not include tax reductions.
ChildrenElderly
$0
$5,000
$10,000
$15,000
$20,000
$25,000
$30,000
$35,000
1960 1965 1970 1975 1980 1985 1990 1995 2000 2005 2010 2015
■ Federal spending on the elderly between 1960
and 2016 has increased by about $26,000
per capita, from about $4,000 to more than
$30,000, in inflation-adjusted (2016) dollars. The
establishment of Medicare and Medicaid and
enactment of the Older Americans Act in 1965,
legislative increases in Social Security benefits,
real growth in wages (on which initial Social
Security benefits are based), and real increases in
health care costs contribute to these increases.
■ Over this same period, federal spending on
children has risen by about $4,600 per capita,
from about $300 to $4,900.
■ Looking forward, we project that spending
per child will increase modestly, by 3 percent
between 2016 and 2027, or about 0.25 percent
annually. In comparison, per capita spending on
all Americans is projected to increase 27 percent
over the same period. (Projections of per capita
spending on elderly are not available.)
R E P O R T O N F E D E R A L E X P E N D I T U R E S O N C H I L D R E N T H R O U G H 2016 A N D F U T U R E P R O J E C T I O N S 33
A CLOSER LOOK AT FEDERAL EXPENDITURES ON CHILDREN
This final section looks closely at trends in federal
expenditures on children, including federal outlays
and tax reductions. Three figures and one table look
at historical trends (1960–2016), addressing
these questions:
■ How have federal expenditures on children changed since 1960?
■ Over time, has cash assistance to families increased or decreased?
■ How have individual categories and programs grown over time?
■ How targeted are expenditures to children in low-income families,
and how has this changed over time?
Three final figures and one table look in more detail at future spending
on children. Our projections follow the Congressional Budget Office’s
assumptions in constructing a baseline budget, supplemented by
tax projections from the Urban-Brookings Tax Policy Center and other
sources, and our own assumptions about the shares of individual
programs allocated to children (see appendix). The projections address
these questions:
■ Which types of expenditures on children (i.e., mandatory, discretionary)
are projected to decline over time?
■ Which categories of spending on children (i.e., health, education)
are projected to decline over time?
34 KIDS ’ SHARE 2017

R E P O R T O N F E D E R A L E X P E N D I T U R E S O N C H I L D R E N T H R O U G H 2016 A N D F U T U R E P R O J E C T I O N S 35

With the notable exception of the
dependent exemption, spending on
children has generally increased since
1960. Most of the growth resulted from
the introduction of new programs and tax
provisions, not from automatic indexing
of children’s programs.
■ Spending on discretionary programs increased in
the 1960s and 1970s with the introduction of new
programs (e.g., Head Start, Title I, Section 8 housing
assistance). Discretionary spending has remained
relatively flat as a share of GDP since 1975, except for
a temporary increase in 2009–11 under ARRA.
■ With the adoption of food stamps, Medicaid, and
SSI, spending on entitlements and other mandatory
programs rose during the 1960s and 1970s. After
periods of contractions and expansions, mandatory
spending on children has trended upward during the
past decade, largely driven by increases in children’s
health spending, particularly in Medicaid and CHIP.
■ Since the late 1980s, tax credits have played a
growing role in providing federal support for children.
Both the EITC and the child tax credit have gone
through several legislative expansions over the past
decades, resulting in increases in both the refundable
portion of tax credits and tax reductions (other than
the dependent exemption).
■ The dependent exemption has declined in value—
dramatically between 1960 and 1985, and steadily
since then. In part, this reflects the eroding value
of the exemption amount, which was not indexed
to inflation until after 1984. The value of the
dependent exemption also depends on tax rates;
therefore, its value dropped when tax rates were
reduced across the board.
How have federal expenditures on children changed since 1960?
Since the late 1980s, tax credits have played a growing role in providing federal support for children.
36 KIDS ’ SHARE 2017

Refundable portion of tax credits
Mandatory spending programs
Discretionary spending programs
Dependent exemption
Tax reductions
Components of Federal Expenditures on Children, 1960–2016
Percentage of GDP
Source: Authors’ estimates based on the Urban-Brookings Tax Policy Center microsimulation model and Office of Management and Budget, Budget of the United States Government, Fiscal Year 2018 (Washington, DC: US Government Printing Office, 2017) and past years.
Note: ARRA = American Recovery and Reinvestment Act; CCDBG = Child Care and Development Block Grant; EITC = earned income tax credit; SCHIP= State Children’s Health Insurance Program; SSI = Supplemental Security Income.
0
0.5
1.0
1.5
2.0
2.5
3.0
3.5
1960 1965 1970 1975 1980 1985 1990 1995 2000 2005 2010 2015
Head Start
Child Care Entitlement to States
Special Education; EITC
Child Tax Credit
Section 8 Low-Income Housing Assistance
SSI
CCDBG
Food stamps
Medicaid; Title I Education for the Disadvantaged
ARRA
SCHIP
R E P O R T O N F E D E R A L E X P E N D I T U R E S O N C H I L D R E N T H R O U G H 2016 A N D F U T U R E P R O J E C T I O N S 37

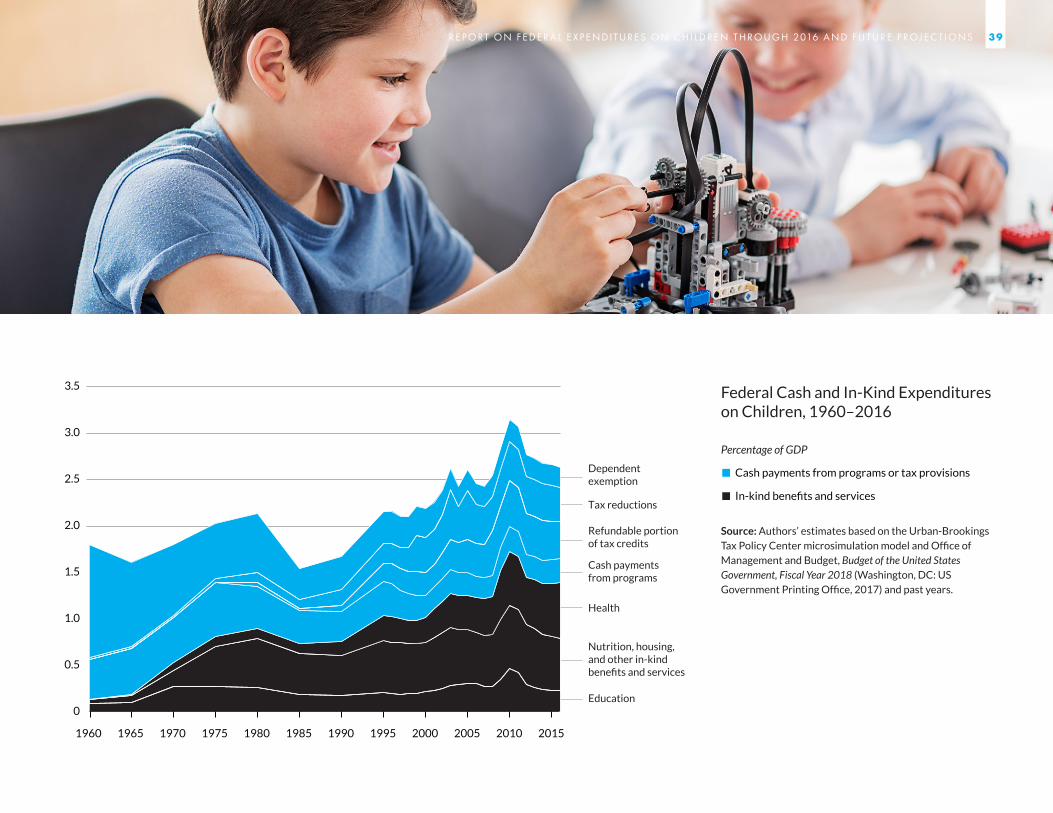
Cash assistance to families has declined
over time, as a share of federal support
for children or as a share of GDP, while
in-kind benefits and services have grown.
■ The most common ways government supported
children in the 1960s were through cash payments to
parents on behalf of their children and the dependent
exemption. Very few benefits were provided through
in-kind supports.
■ As new programs providing education, health,
nutrition and other in-kind benefits and services
were introduced, noncash benefits became an
increasingly important share of the supports
provided to children. By the mid-1990s, in-kind
benefits and services accounted for roughly half of
all expenditures on children.
■ This trend accelerated during the Great Recession,
as recession-related participation in programs like
Medicaid (providing health services) and SNAP
(providing food) sharply increased spending for
children through in-kind supports. In-kind supports
have fallen from their 2010 peak but still accounted
for over half of total expenditures on children in 2016.
■ Almost all tax code benefits for children come in
the form of cash—either direct payments or tax
reductions. The combined value of all tax provisions—
refundable tax credits, tax reductions, and the
dependent exemption—as a share of GDP was lower
in 2016 than it was in 1960 (1.0 percent compared
with 1.2 percent). Cash assistance to families through
programs such as TANF, SSI, and Social Security also
was lower in 2016 than in 1960 as a share of GDP
(0.26 percent compared with 0.42 percent).
Over time, has cash assistance to families increased or decreased?
In-kind supports accounted for over half of total expenditures on children in 2016.
38 KIDS ’ SHARE 2017
In-kind benefits and services
Cash payments from programs or tax provisions
Federal Cash and In-Kind Expenditures on Children, 1960–2016
Percentage of GDP
Source: Authors’ estimates based on the Urban-Brookings Tax Policy Center microsimulation model and Office of Management and Budget, Budget of the United States Government, Fiscal Year 2018 (Washington, DC: US Government Printing Office, 2017) and past years.
110
0
0.5
1.0
1.5
2.0
2.5
3.0
3.5
1960 1965 1970 1975 1980 1985 1990 1995 2000 2005 2010 2015
Education
Health
Cash payments from programs
Refundable portion of tax credits
Tax reductions
Dependent exemption
Nutrition, housing, and other in-kind benefits and services
R E P O R T O N F E D E R A L E X P E N D I T U R E S O N C H I L D R E N T H R O U G H 2016 A N D F U T U R E P R O J E C T I O N S 39
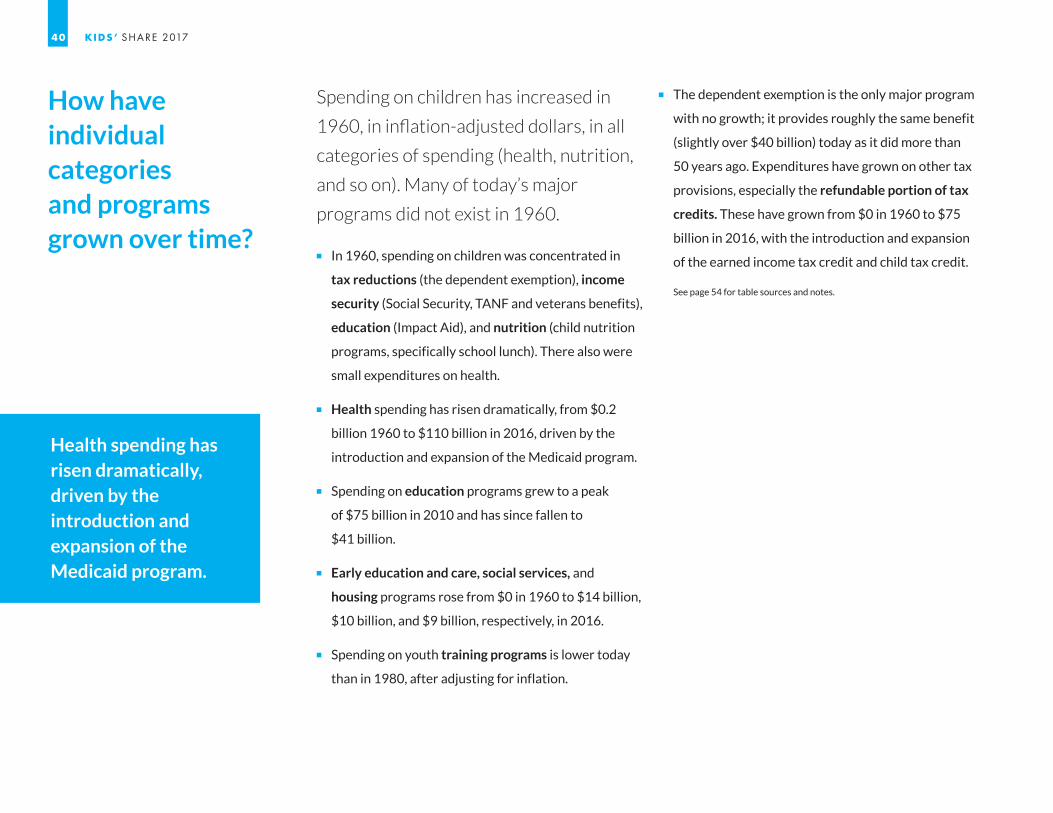
Spending on children has increased in
1960, in inflation-adjusted dollars, in all
categories of spending (health, nutrition,
and so on). Many of today’s major
programs did not exist in 1960.
■ In 1960, spending on children was concentrated in
tax reductions (the dependent exemption), income
security (Social Security, TANF and veterans benefits),
education (Impact Aid), and nutrition (child nutrition
programs, specifically school lunch). There also were
small expenditures on health.
■ Health spending has risen dramatically, from $0.2
billion 1960 to $110 billion in 2016, driven by the
introduction and expansion of the Medicaid program.
■ Spending on education programs grew to a peak
of $75 billion in 2010 and has since fallen to
$41 billion.
■ Early education and care, social services, and
housing programs rose from $0 in 1960 to $14 billion,
$10 billion, and $9 billion, respectively, in 2016.
■ Spending on youth training programs is lower today
than in 1980, after adjusting for inflation.
■ The dependent exemption is the only major program
with no growth; it provides roughly the same benefit
(slightly over $40 billion) today as it did more than
50 years ago. Expenditures have grown on other tax
provisions, especially the refundable portion of tax
credits. These have grown from $0 in 1960 to $75
billion in 2016, with the introduction and expansion
of the earned income tax credit and child tax credit.
See page 54 for table sources and notes.
How have individual categories and programs grown over time?
Health spending has risen dramatically, driven by the introduction and expansion of the Medicaid program.
40 KIDS ’ SHARE 2017

1960 1980 2000 2010 2016
1. Health 0.2 7.5 36.2 93.9 109.5
Medicaid -- 6.7 32.3 79.4 89.2
CHIP -- -- 1.7 8.4 13.6
Vaccines for children -- -- 0.7 3.9 4.4
Other health 0.2 0.7 1.6 2.3 2.3
2. Nutrition 1.5 22.1 30.4 59.8 58.6
SNAP (food stamps) -- 11.5 13.2 35.5 31.5
Child nutrition 1.5 9.0 12.5 18.0 21.8
Special Supplemental food (WIC) -- 1.5 4.7 6.3 5.3
3. Income Security 14.3 33.1 45.6 57.0 58.6
Social Security 6.9 17.4 18.3 22.0 20.8
Temporary Assistance for Needy Families 4.7 10.8 15.7 16.9 12.4
Supplemental Security Income -- 0.9 6.6 10.8 11.8
Veterans compensation (disability compensation)
1.0 1.4 1.6 2.8 8.7
Child support enforcement -- 0.9 4.3 4.8 4.0
Other income security 1.8 1.7 -0.8 -0.3 0.9
4. Education 3.0 18.3 29.8 75.0 40.5
Education for the Disadvantaged (Title I, Part A)
-- 8.2 11.6 21.5 15.6
Special education/IDEA -- 2.1 6.7 19.0 12.6
School improvement -- 2.0 3.4 5.9 4.4
Innovation and improvement -- -- -- 1.1 1.5
Impact Aid 1.6 1.8 1.2 1.3 1.3
Dependents' schools abroad 0.2 0.9 1.2 1.3 1.1
Other education 0.1 2.5 3.8 24.9 4.2
Federal Expenditures on Children by Program, Selected Years, 1960–2016Billions of 2016 dollars
1960 1980 2000 2010 2016
5. Early Education and Care -- 2.1 10.6 15.3 14.0
Head Start (including Early Head Start) -- 2.1 6.1 8.8 8.7
Child Care and Development Fund -- -- 4.5 6.4 5.3
6. Social Services -- 4.5 10.5 11.0 10.2
Foster care -- 0.7 5.9 4.9 4.8
Adoption assistance -- -- 0.2 2.6 2.6
Other social services -- 3.8 4.4 3.5 2.8
7. Housing -- 2.7 8.2 10.6 9.4
Section 8 low-income housing assistance -- 1.4 6.4 7.9 7.6
Low-rent public housing -- 0.5 1.1 1.3 1.1
Other housing -- 0.8 0.7 1.4 0.8
8. Training -- 6.3 1.4 2.2 1.2
9. Refundable Portions of Tax Credits -- 3.1 33.9 80.4 75.4
Earned income tax credit -- 3.1 32.8 53.9 53.6
Child tax credit -- -- 1.1 24.9 20.2
Premium tax credit -- -- -- -- 0.8
Other refundable tax credits -- -- -- 1.6 0.7
10. Tax Reductions 42.3 52.5 95.2 107.6 108.4
Dependent exemption 41.7 44.9 42.6 39.4 41.0
Exclusion for employer-sponsored health insurance
NA 4.0 13.7 21.3 21.4
Child tax credit (nonrefundable portion) -- -- 26.3 32.9 29.6
Earned income tax credit (nonrefundable portion)
-- 1.7 5.8 5.2 6.9
Dependent care credit -- -- 3.2 3.7 4.4
Other tax reductions 0.7 1.9 3.6 5.0 5.1
TOTAL EXPENDITURES ON CHILDREN 61.3 152.2 301.8 512.6 485.9
OUTLAYS SUBTOTAL (1–9) 19.0 99.7 206.6 405.1 377.5
R E P O R T O N F E D E R A L E X P E N D I T U R E S O N C H I L D R E N T H R O U G H 2016 A N D F U T U R E P R O J E C T I O N S 41

The share of federal expenditures
for children targeted to low-income
families has grown over time, reaching
65 percent in 2016.
■ In 1960, most children’s expenditures were
distributed through Social Security, the dependent
exemption, and other benefits generally available to
all children regardless of income—that is, programs
and tax provisions without means tests.
■ The focus of children’s spending changed as new
programs such as food stamps, Medicaid, and SSI
were introduced to serve low-income populations. By
1980, half (49 percent) of total federal expenditures
on children were on programs and tax provisions that
were means tested—that is, available only to families
below certain financial means.
■ The share of expenditures that is means tested
has continued to rise. In 2016, 65 percent of total
expenditures on children were made through
means-tested spending programs (53 percent) and
means-tested tax provisions (13 percent).7
■ Children in low-income families generally receive
resources from universal programs, and children from
higher-income families sometimes receive services
from means-tested programs. An earlier report found
that 70 percent of 2009 federal expenditures on
children served the 42 percent of children in families
with incomes below 200 percent of the federal
poverty level (Vericker et al. 2012).
7 The growth in spending on means-tested programs may be partly explained
by the expansion of Medicaid and CHIP eligibility to higher-income
populations. For example, the median upper eligibility limit for children
increased from 200 percent of the federal poverty level in 2006 to 255
percent of the federal poverty level in 2016. Programs with higher income
limitations are hard to classify. Our analysis treats the premium tax credit
as means tested and the child tax credit as not means tested; further
information on how we classified each program is provided in Data Appendix
to Kids’ Share 2017 (Ovalle et al. 2017).
How targeted are expenditures to children in low-income families, and how has this changed over time?
In 1960, most children’s programs were generally available to all children regardless of income.
42 KIDS ’ SHARE 2017

Other tax provisions without means test (e.g., CTC)
Means-tested tax provisions (e.g., EITC)
Means-tested programs
Programs without means test
Dependent exemption
Means Testing of Federal Children’s Programs and Tax Provisions, 1960–2016
Percentage of expenditures on children
Source: Authors’ estimates based on the Urban-Brookings Tax Policy Center microsimulation model and Office of Management and Budget, Budget of the United States Government, Fiscal Year 2018 (Washington, DC: US Government Printing Office, 2017) and past years.
13%
41%45%
50%46%
50% 53%
3%
6% 13%12%
13%
1%4%
8%
16%17%
17%
68%
42%29%
22%
14% 8%8%
18% 16% 18%14% 12% 13% 10%
0
25
50
75
100
1960 1970 1980 1990 2000 2010 2016
13% 41% 49% 56% 59% 62% 65%Total means-tested (programs and EITC):
1%
R E P O R T O N F E D E R A L E X P E N D I T U R E S O N C H I L D R E N T H R O U G H 2016 A N D F U T U R E P R O J E C T I O N S 43

Federal Expenditures on Children as a Share of GDP by Spending Type, 2007–27
Source: Authors’ estimates based on Congressional Budget Office, An Update to the Budget and Economic Outlook: 2017 to 2027 (Washington, DC: Congressional Budget Office, 2017), Office of Management and Budget, Budget of the United States Government, Fiscal Year 2018 (Washington, DC: US Government Printing Office, 2017) and past years, and the Urban-Brookings Tax Policy Center microsimulation model.
Discretionary spending
Mandatory spending
Tax provisions
1.0%
1.3%
1.1%1.0%
1.0%
0.8%
0.5%
0.4%
0.3%
0
0.2
0.4
0.6
0.8
1.0
1.2
1.4Projections><Actuals
2007 2009 2011 2013 2015 2017 2019 2021 2023 2025 2027
All three types of federal expenditures
on children—discretionary spending,
mandatory spending, and tax provisions—
are projected to decline as a share of the
economy through at least 2027.
■ Total expenditures on children, including tax
reductions, are projected under current law to fall
relative to the size of the economy, from 2.6 percent
of GDP in 2016 to 2.3 percent of GDP in 2027. This is
below the pre-recession level of 2.4 percent in 2007.
■ The sharpest projected decline, particularly relative
to GDP, in expenditures on children is in discretionary
spending programs, which compete annually for
funding and are constrained by caps set in the BCA.
These programs include federal K–12 education
programs, Head Start and other early education and
care, Job Corps and other training programs, the
Which types of expenditures (i.e., mandatory, discretionary) on children are projected to decline over the next decade?
Federal Expenditures on Children as a Share of GDP by Spending Type, 2007–27
Source: Authors’ estimates based on Congressional Budget Office, An Update to the Budget and Economic Outlook: 2017 to 2027 (Washington, DC: Congressional Budget Office, 2017), Office of Management and Budget, Budget of the United States Government, Fiscal Year 2018 (Washington, DC: US Government Printing Office, 2017) and past years, and the Urban-Brookings Tax Policy Center microsimulation model.
Mandatory spending
Tax provisions
Discretionary spending
The sharpest projected decline is in discretionary spending programs, which compete annually for funding and are constrained by BCA spending caps.
4 4 KIDS ’ SHARE 2017

Mandatory (nonhealth)
Mandatory (health)
Federal Health and Nonhealth Mandatory Expenditures on Children as a Share of GDP, 2007–27
Source: Authors’ estimates based on Congressional Budget Office, An Update to the Budget and Economic Outlook: 2017 to 2027 (Washington, DC: Congressional Budget Office, 2017), and Office of Management and Budget, Budget of the United States Government, Fiscal Year 2018 (Washington, DC: US Government Printing Office, 2017) and past years.
0.38%
0.56%0.58%
0.57%0.59%
0.78%
0.67%
0.56%
0
0.10
0.20
0.30
0.40
0.50
0.60
0.70
0.80
0.90
2007 2009 2011 2013 2015 2017 2019 2021 2023 2025 2027
<Actuals Projections>
children’s share of housing benefits, WIC, and
child abuse prevention and other social service
programs. The downward trend, apparent since at
least 2007, was temporarily hidden by increased
funding under ARRA.
■ Child-related tax credits are exempt from the
BCA. Even so, spending on tax provisions related
to children (including outlays and tax reductions)
is projected to decline as a share of the economy
from 2015 to 2027. Much of this projected
decline stems from the child tax credit, which is
not automatically adjusted for inflation and thus
loses value over time.
■ Mandatory spending on children increased
substantially during the recession and has
declined only somewhat since then. Most of the
projected decline is in mandatory nonhealth
programs. Mandatory health spending is
projected to remain essentially flat relative
to GDP and is the only type of spending on
children that is projected to be a higher
percentage of GDP in 2027 than it was in
2007, before the recession.
R E P O R T O N F E D E R A L E X P E N D I T U R E S O N C H I L D R E N T H R O U G H 2016 A N D F U T U R E P R O J E C T I O N S 45

20272016
Federal Expenditures on Children as a Share of GDP, by Category, 2016 and 2027
Source: Authors’ estimates based on Congressional Budget Office, An Update to the Budget and Economic Outlook: 2017 to 2027 (Washington, DC: Congressional Budget Office, 2017), Office of Management and Budget, Budget of the United States Government, Fiscal Year 2018 (Washington, DC: US Government Printing Office, 2017) and the Urban-Brookings Tax Policy Center microsimulation model.
0
0.2
0.4
0.6
0.8
1.0
1.2
Tax provisions Health Nutrition Income security Education Early education and care
Social services and training
Housing
All categories of spending on children
are projected to decline relative to GDP.
Most categories also see declines in
real dollars.
■ Children’s health spending is projected to rise
modestly in real dollars but fall slightly as a
percentage of GDP. Anticipated growth in Medicaid
spending slightly offsets the decline in CHIP funding
when its authorization expires.8 Medicaid growth is
driven by economywide increases in health care costs
and modest growth in child enrollment.
■ Spending on income security and nutrition is
expected to rise slightly in real dollars but fall as
percentage of GDP. These programs decline less than
others because some income security and nutrition
benefits are automatically adjusted for inflation (i.e.,
Which categories of spending on children (i.e., health, education) are projected to decline over the next decade?
Some health, income security, and nutrition benefits are automatically adjusted for inflation, and so these categories decline less than others.
20272016
Federal Expenditures on Children as a Share of GDP, by Category, 2016 and 2027
Source: Authors’ estimates based on Congressional Budget Office, An Update to the Budget and Economic Outlook: 2017 to 2027 (Washington, DC: Congressional Budget Office, 2017), Office of Management and Budget, Budget of the United States Government, Fiscal Year 2018 (Washington, DC: US Government Printing Office, 2017) and the Urban-Brookings Tax Policy Center microsimulation model.
0
0.2
0.4
0.6
0.8
1.0
1.2
Tax provisions Health Nutrition Income security Education Early education and care
Social services and training
Housing
46 KIDS ’ SHARE 2017
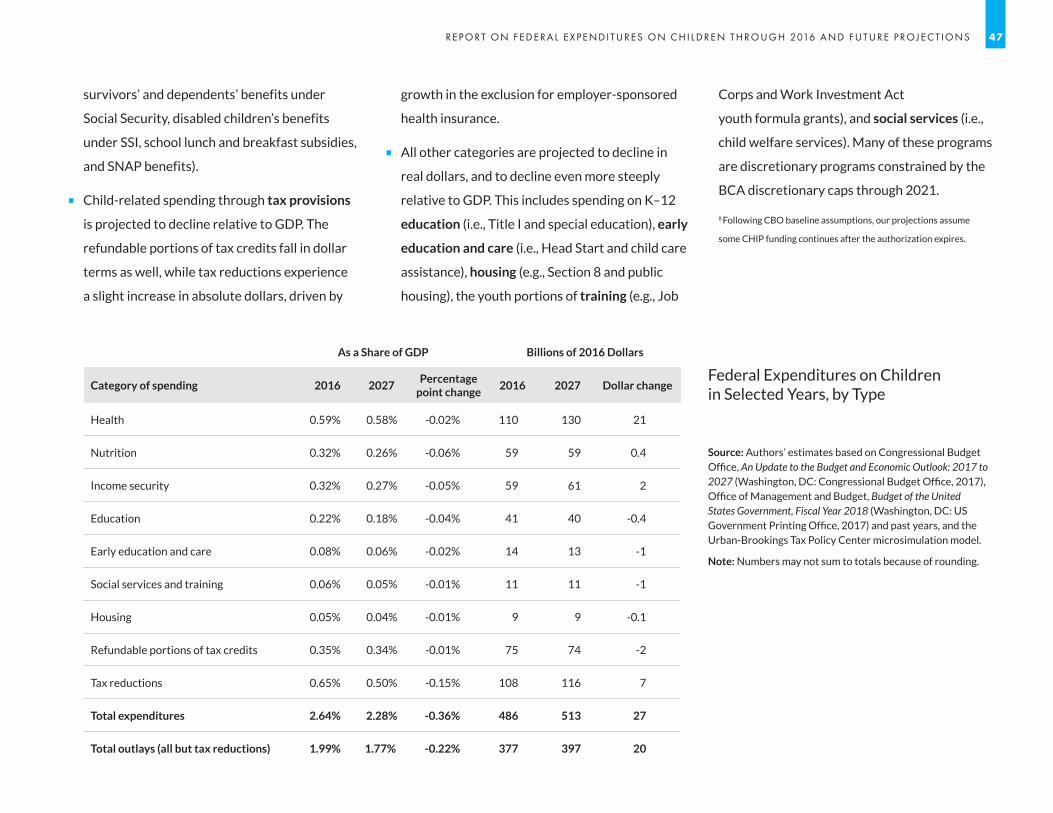
As a Share of GDP Billions of 2016 Dollars
Category of spending 2016 2027 Percentage
point change2016 2027 Dollar change
Health 0.59% 0.58% -0.02% 110 130 21
Nutrition 0.32% 0.26% -0.06% 59 59 0.4
Income security 0.32% 0.27% -0.05% 59 61 2
Education 0.22% 0.18% -0.04% 41 40 -0.4
Early education and care 0.08% 0.06% -0.02% 14 13 -1
Social services and training 0.06% 0.05% -0.01% 11 11 -1
Housing 0.05% 0.04% -0.01% 9 9 -0.1
Refundable portions of tax credits 0.35% 0.34% -0.01% 75 74 -2
Tax reductions 0.65% 0.50% -0.15% 108 116 7
Total expenditures 2.64% 2.28% -0.36% 486 513 27
Total outlays (all but tax reductions) 1.99% 1.77% -0.22% 377 397 20
Federal Expenditures on Children in Selected Years, by Type
Source: Authors’ estimates based on Congressional Budget Office, An Update to the Budget and Economic Outlook: 2017 to 2027 (Washington, DC: Congressional Budget Office, 2017), Office of Management and Budget, Budget of the United States Government, Fiscal Year 2018 (Washington, DC: US Government Printing Office, 2017) and past years, and the Urban-Brookings Tax Policy Center microsimulation model.
Note: Numbers may not sum to totals because of rounding.
survivors’ and dependents’ benefits under
Social Security, disabled children’s benefits
under SSI, school lunch and breakfast subsidies,
and SNAP benefits).
■ Child-related spending through tax provisions
is projected to decline relative to GDP. The
refundable portions of tax credits fall in dollar
terms as well, while tax reductions experience
a slight increase in absolute dollars, driven by
growth in the exclusion for employer-sponsored
health insurance.
■ All other categories are projected to decline in
real dollars, and to decline even more steeply
relative to GDP. This includes spending on K–12
education (i.e., Title I and special education), early
education and care (i.e., Head Start and child care
assistance), housing (e.g., Section 8 and public
housing), the youth portions of training (e.g., Job
Corps and Work Investment Act
youth formula grants), and social services (i.e.,
child welfare services). Many of these programs
are discretionary programs constrained by the
BCA discretionary caps through 2021.
8 Following CBO baseline assumptions, our projections assume
some CHIP funding continues after the authorization expires.
R E P O R T O N F E D E R A L E X P E N D I T U R E S O N C H I L D R E N T H R O U G H 2016 A N D F U T U R E P R O J E C T I O N S 47
APPENDIX: METHODS
Estimating the portion of government spending on
children requires making assumptions and decisions
about how to classify and allocate federal, state, and
local spending and tax data. First, we identify programs
that directly benefit children or households with
children. Second, we collect expenditure data from
federal sources, particularly the Office of Management
and Budget’s Budget of the United States Government for
fiscal year 2018 (OMB 2017) and prior years, drawing
on its Appendix volume for information on spending and
the Analytical Perspectives volume for tax expenditures.
Finally, we estimate the share of each program’s spending
that directly benefits children. These methodological
steps are described below, followed by a discussion of
methods for estimating spending on the elderly, state and
local estimates, future projections, and methodological
changes made in this year’s report. Further details
regarding methods are available in Data Appendix to Kids’
Share 2017: Report on Federal Expenditures on Children
through 2016 and Future Projections and Spending on
Children Ages 8 and Younger (Ovalle et al. 2017).
DEFINING AND IDENTIFYING PROGRAMS BENEFITING CHILDREN
Like all budget exercises that allocate spending to
categories, defining spending that goes to children is a
complex task that could be calculated using different
methodologies. Each dollar spent on a particular program
must be determined to go to a particular recipient.
This task is relatively straightforward for programs
that spend directly on children—elementary education
is a simple example. But for programs that serve both
children and adults, discerning who benefits from
spending is more difficult. For example, how should one
determine the amount of refundable tax credits, such as
the EITC, distributed to adults rather than to children?
Calculating spending on children and comparing data
over time requires a concrete and consistent set of rules
and assumptions.
To be included in this analysis, a program (as a whole or in
part) must meet at least one of the following criteria:
■ benefits or services are provided entirely to children
(e.g., K–12 education programs, Head Start) or serve
all age groups but deliver portion of benefits directly
to children (e.g., SSI payments for children with
disabilities, Medicaid services for children);
■ family benefit levels increase with family size (e.g.,
SNAP, low-rent public housing); or
■ children are necessary for a family to qualify for any
benefits (e.g., TANF and the child tax credit).
Therefore, some services that may benefit children are
excluded from our calculations because they do not
48 KIDS ’ SHARE 2017

directly rely on the presence of a child. For example,
unemployment insurance and some tax benefits for
homeownership may benefit children, but because
being a child or having a child are not prerequisites
for these services, and because having a child does
not result in any additional direct monetary benefit,
they do not meet the criteria for inclusion in our
analysis. Additionally, we do not include programs
generally classified as public goods that provide
benefits to the general population, such as roads,
communications, national parks, defense, and
environmental protection.
In reporting federal expenditures on children,
our most comprehensive measure includes tax
reductions (e.g., reduced tax liabilities as a result of
the child tax credit, the dependent exemption, or
other provisions in the tax code) as well as direct
program outlays from programs such as Medicaid,
child nutrition programs, and education programs.
In other places, we focus solely on federal outlays
for children, such as when we report the share of
total federal outlays spent on children. Some tax
provisions are included in our estimates as outlays:
the portions of the EITC and the child tax credit
paid out to families as a tax refund (and treated by
the Treasury Department as outlays rather than as
reductions in tax liabilities), as well as the outlay
portions of smaller tax provisions (e.g., outlays
associated with Qualified Zone Academy Bonds).
The division of tax subsidies between outlays
(for the refundable portion of credits) and tax
reductions (for the nonrefundable portion) adheres
to standard budget accounting practices used by the
Office of Management and Budget, Department of
the Treasury, and Joint Committee on Taxation.
COLLECTING EXPENDITURE DATA
Expenditure data on program outlays largely come
from the Appendix, Budget of the United States
Government, Fiscal Year 2018 (and prior years).
The Analytical Perspectives volume of the budget
provides tax expenditure data. For programs not
included in the Appendix, we obtain expenditure data
from the relevant agencies’ budgetary documents
or their representatives. In this report, all budget
numbers represent fiscal years, and we express them
in 2016 dollars unless otherwise noted.
CALCULATING THE SHARE OF PROGRAM SPENDING ON CHILDREN
Some programs exclusively spend on children, while
others benefit the general population regardless of
age. We calculate each program’s share of spending
going to children in one of the following ways:
■ For programs that serve children only, we assume
100 percent of program expenditures (including
benefits and associated administrative costs)
go to children.
■ For programs that directly serve people of
different ages (e.g., Medicaid, SSI), we determine
the percentage of program expenditures that
goes to children.
■ For programs that provide benefits only to
households with children, with the amount of
benefits determined by the number of children
(e.g., child tax credit, dependent exemption), we
consider 100 percent of program expenditures as
going to children.
■ For other programs that provide families benefits
without any delineation of parents’ and children’s
shares, we generally estimate a children’s share
based on the number of children and adults in the
family, assuming equal benefits per capita within
the family (e.g., TANF and SNAP).
For large programs, such as SNAP, Medicaid, and SSI,
we put significant effort into correctly estimating
R E P O R T O N F E D E R A L E X P E N D I T U R E S O N C H I L D R E N T H R O U G H 2016 A N D F U T U R E P R O J E C T I O N S 49

the share of spending that goes to children. In some
cases, programs publicly release administrative data
on spending on children, but we must occasionally
contact federal agency staff directly to obtain
participation data. Using the best data available,
we then calculate spending on children. When
program data are unavailable, other Urban Institute
researchers provide carefully crafted estimates
using, for example, the Urban Institute’s Transfer
Income Model. In some cases, we scour government
websites or contact federal agency staff directly to
obtain program participation information.
METHODS FOR SPENDING ON THE ELDERLY
While Kids’ Share focuses on federal expenditures on
children, we also have developed rough estimates
of spending on the elderly, namely, spending in 16
programs: Social Security, Medicare, Medicaid,
SSI, SNAP, veterans benefits, Railroad Retirement,
unemployment compensation, Federal Civilian
Retirement, Military Retirement, Special Benefits
for Coal Miners, Veterans Medical Care, annuitants’
health benefits, housing, the Administration for
Community Living (previously the Administration
of Aging), and the Low Income Home Energy
Assistance Program. As with the methodology
for children, we estimate the share of the program
that goes to the elderly population; for example,
we subtract spending on children and 18- to 64-
year-old disabled adults to estimate the elderly’s
share of spending for Social Security, Medicare,
and Medicaid.
METHODS FOR STATE AND LOCAL ESTIMATES
Although this report focuses on federal
expenditures on children, it also estimates state
and local spending on children for 1998 to 2014.
Estimates for 1998 to 2008 are drawn from the
Rockefeller Institute of Government’s State Funding
for Children Database, as described by Billen and
colleagues (2007); estimates for 2009 to 2014 are
by the Kids’ Share authors. Both sets of estimates
focus on state and local expenditures for K–12
education, state earned income tax credits, and
several joint federal-state programs (Medicaid,
CHIP, Maternal and Child Health Block Grants,
TANF, child support enforcement, child care, and
several child welfare programs). State programs
that are not jointly funded by federal and state
governments are included to the extent that they
are reported in federal reporting requirements.
Specifically, TANF separate state programs are
included; state spending on prekindergarten is
included when it is reported by state education
agencies as part of state and local education; and
state health, child care, and child welfare spending
is included when it is claimed as maintenance of
effort or matching under federal health, TANF, or
child care programs. Spending in territories was not
counted in the state and local estimates. Note that
the annual reporting period for these estimates
varies, from a school year (July 2013–June 2014)
for education programs to the federal fiscal year
(October 2013–September 2014) for major federal
programs to the calendar year for the earned
income tax credits.
Most of these programs were assumed to spend 100
percent on children; the exceptions are Medicaid,
TANF, and CHIP. The “kids’ share” of these programs
wa generally estimated state by state but was
estimated in aggregate (i.e., one estimate for the
entire nation) in 2009 for Medicaid, 2009–12 for
TANF, and in 2009–12 and 2014 for CHIP.
Data sources for the 2009–14 estimates are as
follows. State and local spending on K–12 education
is based on the US Census Bureau’s Annual Survey
50 KIDS ’ SHARE 2017

of School System Finances. Medicaid spending on
children is estimated from unpublished tabulations
of Medicaid claims (MSIS data), by state and age,
generated by the Urban Institute’s Health Policy
Center for this project. State spending on other
major federal programs is drawn from the websites
and reports of various federal agencies. State
spending on state earned income tax credits is
based on information from the IRS compiled by the
Urban-Brookings Tax Policy Center.
METHODS FOR PROJECTIONS
To estimate future spending trends for children,
we primarily use the Congressional Budget Office’s
Updated Budget Projections: 2017 to 2027. For
projecting expenditures under tax provisions, we
turn to the Urban-Brookings Tax Policy Center
microsimulation model for major tax provisions and
the Office of Management and Budget’s projections
in Analytical Perspectives for smaller tax provisions.
The projection methodology differs depending on
whether a program is mandatory (with spending
governed by programmatic rules, such as Medicaid
or Social Security), discretionary (with spending
set by appropriations action annually and subject
to the BCA spending caps), or a tax expenditure.
In the mandatory spending area, the CBO baseline
projections assume a continuation of current law,
except that certain expiring programs that have
been continually reauthorized in the past are also
assumed to continue.
For discretionary spending, the CBO traditionally
uses a baseline assumption that spending is kept
constant in real terms—that is, spending is adjusted
for inflation. However, for 2016 through 2021, the
CBO baseline is adjusted downward to reflect caps
on defense and nondefense spending as established
by the BCA and subsequent amendments.
The Urban-Brookings Tax Policy Center
microsimulation model provides 10-year
projections for the four largest tax provisions:
the dependent exemption, the child tax credit,
the EITC, and the child and dependent care credit.
These projections are made assuming continuation
of current law. For all other, smaller tax provisions,
we use the five-year projections from Analytical
Perspectives and then apply the projections’ average
growth rate to the following five years.
In general, for programs serving both children
and adults, we assume that the share of spending
directed to children for each program will remain
constant from 2017 to 2027. The exception is that
we use the CBO’s detailed projections by age group
for Medicaid, Social Security, and SSI, and we adjust
the projected share of children’s spending for the
premium tax credit to take into account lower
spending for CHIP under CBO baseline projections.
We do not publish program-specific projections
because they are somewhat tentative, but we are
able to provide broad statements about future
spending on children’s as a whole and in broad
budget categories, such as health and education.
R E P O R T O N F E D E R A L E X P E N D I T U R E S O N C H I L D R E N T H R O U G H 2016 A N D F U T U R E P R O J E C T I O N S 51

Billen, Patricia L., Donald Boyd, Lucy Dadayan,
and Thomas Gais. 2007. State Funding for Children:
Spending in 2004 and How It Changed from Earlier
Years. Albany, NY: Nelson A. Rockefeller Institute
of Government.
Carasso, Adam, C. Eugene Steuerle, and Gillian Reynolds.
2007. Kids’ Share 2007: How Children Fare in the Federal
Budget. Washington, DC: Urban Institute.
Carasso, Adam, C. Eugene Steuerle, Gillian Reynolds,
Tracy Vericker, and Jennifer Macomber. 2008. Kids’
Share 2008: How Children Fare in the Federal Budget.
Washington, DC: Urban Institute.
CBO (Congressional Budget Office). 2000. Federal
Spending on the Elderly and Children. Washington,
DC: CBO.
———. 2011. Estimated Impact of Automatic Budget
Enforcement Procedures of the Budget Control Act.
Washington, DC: CBO.
———. 2017a. The Budget and Economic Outlook: 2017
to 2027. Washington, DC: CBO.
———. 2017b. An Update to the Budget and Economic
Outlook: 2017 to 2027. Washington, DC: CBO.
Clark, Rebecca L., Rosalind Berkowitz King, Christopher
Spiro, and C. Eugene Steuerle. 2000. Federal Expenditures
on Children: 1960–1997. Assessing the New Federalism
Occasional Paper 45. Washington, DC: Urban Institute.
Edelstein, Sara, Julia Isaacs, Heather Hahn, and
Katherine Toran. 2012. How Do Public Investments
in Children Vary with Age? A Kids’ Share Analysis of
Expenditures in 2008 and 2011 by Age Group.
Washington, DC: Urban Institute.
Edelstein, Sara, Heather Hahn, Julia Isaacs, Ellen Steele,
and C. Eugene Steuerle. 2016. Kids’ Share 2016: Federal
Expenditures on Children through 2015 and Future
Projections. Washington, DC: Urban Institute.
First Focus. 2016. Children’s Budget 2016. Washington,
DC: First Focus.
Hahn, Heather, Genevieve Kenney, Christine Conyer, and
Katherine Toran. 2012. Federal Health Expenditures on
Children on the Eve of Health Reform: A Benchmark for the
Future. Washington, DC: Urban Institute.
Hahn, Heather, Julia Isaacs, Sara Edelstein, Ellen
Steele, and C. Eugene Steuerle. 2014. Kids’ Share 2014:
Report on Federal Expenditures on Children through 2013.
Washington, DC: Urban Institute.
Hahn, Heather, Cary Lou, Julia B. Isaacs,
and Joycelyn Ovalle. Forthcoming. Spending on Children
Ages 8 and Younger. Washington, DC:
Urban Institute.
Isaacs, Julia. 2017. Unequal Playing Field? State Differences
in Spending on Children in 2013. Washington, DC: Urban
Institute.
Isaacs, Julia, C. Eugene Steuerle, Stephanie
Rennane, and Jennifer Macomber. 2010. Kids’ Share
REFERENCES
52 KIDS ’ SHARE 2017
2010: Report on Federal Expenditures on Children
through 2009. Washington, DC: Urban Institute and
Brookings Institution.
Isaacs, Julia, Tracy Vericker, Jennifer Macomber, and
Adam Kent. 2009. Kids’ Share: An Analysis of Federal
Expenditures on Children through 2008. Washington,
DC: Urban Institute.
Isaacs, Julia, Sara Edelstein, Heather Hahn, Ellen
Steele, and C. Eugene Steuerle. 2015. Kids’ Share
2015: Report on Federal Expenditures on Children
through 2014. Washington, DC: Urban Institute.
Isaacs, Julia, Sara Edelstein, Heather Hahn,
Katherine Toran, and C. Eugene Steuerle. 2013.
Kids’ Share 2013: Report on Federal Expenditures
on Children through 2013. Washington, DC:
Urban Institute.
Isaacs, Julia, Heather Hahn, C. Eugene Steuerle,
Stephanie Rennane, and Tracy Vericker. 2011.
Kids’ Share 2011: Report on Federal Expenditures on
Children through 2009. Washington, DC: Urban
Institute and Brookings Institution.
Isaacs, Julia, Katherine Toran, Heather Hahn, Karina
Fortuny, and C. Eugene Steuerle. 2012. Kids’ Share
2012: Report on Federal Expenditures on Children
through 2011. Washington, DC: Urban Institute.
Kent, Adam, Jennifer Ehrle Macomber, Julia Isaacs,
Tracy Vericker, and Elizabeth H. Bringewatt. 2010.
Federal Expenditures on Pre-Kindergartners and
Kindergartners in 2008 (Ages 3 through 5).
Washington, DC: Urban Institute.
Macomber, Jennifer, Julia Isaacs, Tracy Vericker,
and Adam Kent. 2010. Public Investment in Children’s
Early and Elementary Years (Birth to Age 11).
Washington, DC: Urban Institute.
Macomber, Jennifer, Julia Isaacs, Tracy Vericker,
Adam Kent, and Paul Johnson. 2009. Federal
Expenditures on Infants and Toddlers in 2007.
Washington, DC: Urban Institute.
OMB (Office of Management and Budget). 2017a.
Budget of the United States Government, Fiscal Year
2018. Washington, DC: US Government
Printing Office.
———. 2017b. Analytical Perspectives, Budget of
the United States Government, Fiscal Year 2018.
Washington, DC: US Government Printing Office.
———. 2017c. Appendix, Budget of the United States
Government, Fiscal Year 2018. Washington, DC: US
Government Printing Office.
———. 2017d. Historical Tables, Budget of the United
States Government, Fiscal Year 2018. Washington,
DC: US Government Printing Office.
Ovalle, Joycelyn, Cary Lou, Julia Isaacs, Heather
Hahn, and C. Eugene Steuerle. 2017. Data Appendix
to Kids’ Share 2017: Report on Federal Expenditures
on Children through 2016 and Future Projections and
Spending on Children Ages 8 and Younger. Washington,
DC: Urban Institute.
Steuerle, C. Eugene. 2014. Dead Men Ruling: How to
Restore Fiscal Freedom and Rescue Our Future. New
York: Century Foundation Press.
UNICEF Office of Research. 2013. Child Well-Being
in Rich Countries: A Comparative Overview. Innocenti
Report Card 11. Florence, ITA: UNICEF Office
of Research.
Vericker, Tracy, Julia Isaacs, Heather Hahn,
Katherine Toran, and Stephanie Rennane. 2012.
How Targeted Are Federal Expenditures on Children? A
Kids’ Share Analysis of Expenditures by Income in 2009.
Washington, DC: Urban Institute and
Brookings Institution.
Vericker, Tracy, Jennifer Macomber, Julia Isaacs,
Adam Kent, and Elizabeth H. Bringewatt. 2010.
Federal Expenditures on Elementary-Age Children in
2008 (Ages 6 through 11). Washington, DC:
Urban Institute.
R E P O R T O N F E D E R A L E X P E N D I T U R E S O N C H I L D R E N T H R O U G H 2016 A N D F U T U R E P R O J E C T I O N S 53
NOTES Notes for Federal Expenditures by Category
and Program, 2016 (page 17) and Federal
Expenditures on Children by Program, Selected
Years, 1960–2016 (page 41)
Source: Authors’ estimates based on Office of Management and Budget, Budget of the United States Government, Fiscal Year 2018 (Washington, DC: US Government Printing Office, 2017) and past years, as well as the Urban-Brookings Tax Policy Center microsimulation model.
Notes: Because this analysis shows outlays, rather than appropriated or authorized levels, and because the dollars are adjusted for inflation, these estimates may differ from other published estimates. Individual programs are shown only when expenditures on children are $1 billion or greater in 2016 or 2017.
Other health covers immunizations, the Maternal and Child Health block grant, children’s graduate medical education, lead hazard reduction, children’s mental health services, birth defects/developmental disabilities, Healthy Start, emergency medical services for children, universal newborn hearing, home visiting, and school-based health care.
Child nutrition includes the National School Lunch Program, the School Breakfast Program, the Child and Adult Care Food Program, the Summer Food Service Program, and Special Milk.
Other income security includes Railroad Retirement, survivors’ compensation, veterans compensation, survivors’ pensions, veterans pensions, and the savings associated with the federal share of child support collections.
Other education includes Indian education, English language acquisition, domestic schools, the Institute of Education Sciences, safe schools and citizenship education, Junior ROTC, Safe Routes to Schools, vocational (and adult) education, and the State Fiscal Stabilization Fund.
Other social services include the Social Services Block Grant, the Community Services Block Grant, child welfare services and training, Safe and Stable Families, juvenile justice, guardianship, independent living, missing children, children’s research and technical assistance, PREP and abstinence education, and certain child and family services programs.
Other housing includes rental housing assistance and low-income home energy assistance.
Training includes WIA Youth Formula Grants, Job Corps, Youth Offender Grants, and YouthBuild Grants.
Other refundable tax credits include outlays from Qualified Zone Academy Bonds and Qualified School Construction Bonds.
Other tax reductions include exclusion of employer-provided child care, the employer-provided child care credit, exclusion of certain foster care payments, adoption credit and exclusion, assistance for adopted foster children, exclusion for Social Security retirement and dependents’ & survivors’ benefits, exclusion for Social Security disability benefits, exclusion for public assistance benefits, exclusion for veterans death benefits and disability compensation, and the nonrefundable portion of Qualified Zone Academy Bonds, Qualified School Construction Bonds, and the premium tax credit.
* Less than $50 million.
NA = estimate not available.
-- program did not exist.
54 KIDS ’ SHARE 2017

JULIA B. ISAACSJulia B. Isaacs, a senior fellow in the Center on Labor,
Human Services, and Population at the Urban Institute,
is an expert in child and family policy with wide-ranging
knowledge of government programs and budgets.
She directs research on early childhood education, is
coprincipal investigator for Urban’s Kids’ Share analyses
of public spending on children, and codirects the
Institute’s Kids in Context initiative.
CARY LOU Cary Lou is a research associate in the Center on Labor,
Human Services, and Population, focusing on policies
related to poverty and opportunity. Before joining Urban,
Lou worked on state higher education and workforce
issues at the Georgetown University Center on
Education and the Workforce.
HEATHER HAHN Heather Hahn is a senior fellow in the Center on Labor,
Human Services, and Population. Throughout her career,
Hahn has conducted nonpartisan research on the wide
range of issues related to the well-being of children and
families, including cash assistance, nutrition assistance,
and other supports for low-income families. She is
coprincipal investigator for Urban’s Kids’ Share analyses
of public spending on children.
JOYCELYN OVALLE Joycelyn Ovalle is a research associate in the Center
for Nonprofits and Philanthropy at the Urban Institute.
She works in multiple subject areas, including tax
policy, social finance innovation, and the annual Kids’
Share publication.
C. EUGENE STEUERLEC. Eugene Steuerle, Institute fellow and the Richard B.
Fisher chair at the Urban Institute, is the originator of
Urban’s Kids’ Share analyses of public spending on
children. He has held numerous leadership positions
within and outside government related to tax analysis
and other economic policies. Steuerle is the author,
coauthor, or coeditor of 18 books, including Dead
Men Ruling, Nonprofits and Government (3rd edition),
Contemporary US Tax Policy (2nd edition), and Advancing
the Power of Economic Evidence to Inform Investments in
Children, Youth, and Families.
ABOUT THE AUTHORS
R E P O R T O N F E D E R A L E X P E N D I T U R E S O N C H I L D R E N T H R O U G H 2016 A N D F U T U R E P R O J E C T I O N S 55
STATEMENT OF INDEPENDENCE
The Urban Institute strives to meet the highest standards of integrity and quality in its research and analyses and in the evidence-based
policy recommendations offered by its researchers and experts. We believe that operating consistent with the values of independence,
rigor, and transparency is essential to maintaining those standards. As an organization, the Urban Institute does not take positions on
issues, but it does empower and support its experts in sharing their own evidence-based views and policy recommendations that have
been shaped by scholarship. Funders do not determine our research findings or the insights and recommendations of our experts. Urban
scholars and experts are expected to be objective and follow the evidence wherever it may lead.
56 KIDS ’ SHARE 2017

R E P O R T O N F E D E R A L E X P E N D I T U R E S O N C H I L D R E N T H R O U G H 2016 A N D F U T U R E P R O J E C T I O N S 57

2100 M Street NW Washington, DC 20037 www.urban.org