About the Canadian Computer and Video Game...
20
2011 ESSENTIAL FACTS About the Canadian Computer and Video Game Industry
Transcript of About the Canadian Computer and Video Game...

2011ESSENTIAL FACTS
About the Canadian Computer and Video Game Industry

2

3
WHAT’S INSIDE?
All data in this document is from Secor Consulting Group’s Canada’s Entertainment Software Industry in 2011 unless otherwise noted. This report was commissioned by the Entertainment Software Association of Canada (ESAC) and gathered quantitative and qualitative data from computer and video game companies across Canada, including developers, publishers, and other key industry players. Saskatchewan does not appear in this report because although a few companies from the province were identified as industry participants, no responses to the survey were received. Accordingly, those companies, and the province were removed from the data analysis to avoid giving analytical results without any actual data.
SECOR is Canada’s leading independent strategy and organizational consulting firm. For the last 35 years, SECOR has helped senior executives to develop and implement their organizational strategies. SECOR has offices in Montréal, New York, Paris, Québec, Toronto and Vancouver. For more information visit www.secorgroup.com
This document also contains data from NPD Group’s 2010 Understanding the Canadian Gamer. The survey was commissioned by ESAC and gathered data from 2,579 Canadian adults, 398 Canadian teens (13-17) and 547 kids (6-12). The margin of error associ-ated with he total samples is +/- 1.6, 19 times out of 20.
The NPD Group is the leading provider of reliable and comprehensive consumer and retail information for a wide range of indus-tries. Today, more than 1,700 manufacturers, retailers, and service companies rely on NPD to help them drive critical business decisions at the global, national, and local market levels. NPD helps our clients to identify new business opportunities and guide product development, marketing, sales, merchandising, and other functions. Information is available for the following industry sectors: automotive, beauty, commercial technology, consumer technology, entertainment, fashion, food and beverage, foodservice, home, office supplies, software, sports, toys, and wireless. For more information, please visit: www.npd.com
Did you know? 4
What are some of the drivers of Canada’s success? 5
Industry structure and size 6
Industry structure by platform 7
Selected provincial profiles 8-9
The industry in Canada 10-11
Industry impact 12
Who is playing computer and video games? 13-14
How often do Canadians play? 15
On what platform do gamers play most frequently? 15
The bottom line 16
Top selling computer and video games 17
What are ESRB Ratings? 18
Who we are 19

?4
DID YOU KNOW?
3rd
Canada’s video game industry’s ranking in the
world based on number of employees
348Number of
companies operating in Canada
11% Industry growth
over the past two years
17% Projected growth over
the next two years
16,000Approximate number of
people directly employed in the Canadian video game
industry Compared to approximately
32,000 employees in the United States
$1.7 billion
estimated direct economic impact on the
Canadian economy by the Canadian video game
industry

5
60%
of Canadian gaming companies areexpecting to hire new
graduates in 2011
77%
expect to hire new grads by 2013
A MADE-IN-CANADA INDUSTRYThe Canadian video game industry is responsible for creating some of the most recogniz-able game franchises in the world. Many of the most successful video games and video game companies were started in Canada by Canadians.
LIVEABILITY OF CANADIAN CITIESOperating costs in Canada’s major development clusters are significantly lower than the US, Europe and Japan. Canada’s major cities offer desirable places for talent to live with culturally diverse populations, thriving downtowns, and generally affordable condomini-um and rental markets.
GOVERNMENT POLICIES AT BOTH THE FEDERAL AND PROVINCIAL LEVELSCanada offers generally competitive corporate tax rates, and many provinces have in-troduced refundable tax credits for production of interactive digital media to encourage growth of the sector. Scientific Research and Experimental Development (SR&ED) tax credits also play a critical role in fostering technology-based innovation and advance-ments in the video game industry. Federal and provincial funding programs for digital media offer support for projects that might not otherwise obtain funding.
CANADA IS KNOWN INTERNATIONALLY FOR ITS STRONG BASE OF DIVERSE, CREATIVE AND WELL-TRAINED TALENT
As a multicultural country, there are significant language and cultural overlaps with the United States, Europe, and Asia, which enables the Canadian develop-ers to produce content for the global market.Canadian educational programs, particularly at the college and university levels, produce well-trained graduates. However, as our industry grows, we face an increasing shortage of experi-enced talent across all job cat-egories.
WHAT ARE SOME OF THE DRIVERS OF CANADA’S SUCCESS?

6
INDUSTRY STRUCTURE AND SIZE » Canada’s video game industry is comprised of a healthy mix of companies of dif-ferent sizes and with differing concentrations on particular platforms including tra-ditional console games and newer platforms such as social games or games for mobile devices
» Most employees in Canada’s video game industry work at large companies (more than 150 employees), but there’s many small and medium companies as well, with 148 of them averaging only 16 employees each
CANADIAN QUICK FACTS BY COMPANY SIZE
59%
12%
29%
Micro (1-5)
Percent of total companies
16%
43%
Percent of total employment
24%
15%
2%
Large (151+)
Medium (51-150)
Small (6-50)
AverageNo. ofEmployees
TotalEmployees
Total No. ofCompanies
Percent ofTotal Employment
Percentof Total Companies
Micro 3 292 101 1.9% 28.8%
Small 16 2312 149 14.7% 42.7%
Medium 67 3842 57 24.4% 16.4%
Large 221 9272 41 59.0% 12.1%
TOTAL 15,718 348

7
INDUSTRY STRUCTURE BY PLATFORM
AVERAGE COST AND TIME OF DEVELOPMENT BY PLATFORM
» The Canadian industry remains concentrated around tra-ditional console game development and publishing with 68% of all employees work on games for this platform. This, however, is changing rapidly
» The share of overall resources dedicated to traditional console have been declining in response to rapid growth in resources dedicated to other platform types. Currently 2% of resources are dedicated to social gaming , 2% are dedicated to casual gaming, and 7% of resources are dedicated to mobile gaming
» The continuing dominance of traditional console games in comparison with other platforms, is the result of the very high amount of resources dedicated to this plat-form by a comparatively small number of companies
» The largest category is comprised of firms that focus on a number of platforms simultaneously—a fact that seems reflective of a time of industry evolution
Mobile 166,000
Social 238,000
Handheld 398,000
Casual 462,000
Downloadableconsole
604,000
PC 1,070,000
MMO 1,125,000
Traditionalconsole 10,083,000
Thousands of CDN$
3,200,000
1,400,000
2,300,000
8,000,000
3,000,000
15,000,000
3,000,000
30,000,000
Maximum
2,000
6,000
32,000
2,000
20,000
15,000
50,000
150,000
Minimum
33
17
12
22
17
23
4*
15
96
197
151
152
368
438
380
261
Cost range
N Days
Time
*Note small sample size, results should be interpreted with caution

8
SELECTED PROVINCIAL PROFILES QUEBEC
» The province of Quebec has grown to be the dominant player in the Canadian video game industry
» Almost one quarter of video game companies in Canada call Que-bec home
» Almost 70% of large video game companies in Canada are located in Quebec
» Over half of the industry’s jobs are located there, as is over half of estimated industry spending
» The average number of employees per company is twice that of the Canadian average, reflecting the predominance of large companies in the province
» Quebec’s industry growth rate is 13% per annum, slightly above the Canadian industry’s average
» Quebec’s video game industry is primarily concentrated around traditional console games, which are the focus of an estimated 72% of the resources in the local industry. This percentage share, however, is dropping rapidly
ONTARIO » The structure of the industry in Ontario is a stark contrast to that of Quebec with significantly smaller employee numbers and eco-nomic activity
Quebec in 2011
Total Employees 8,236
Estimate spending in Quebec $733m
Total Number of companies 86
Average number of employees / company 95
Historical growth 13%
Expected growth 16%
Ontario in 2011
Total Employees 2,600
Estimate spending in Ontario $238m
Total Number of companies 96
Average number of employees / company 27
Historical growth 20%
Expected growth 21%

9
SELECTED PROVINCIAL PROFILES
BRITISH COLUMBIA » In British Columbia, the number of employees and estimated
spending are closer to those in Ontario than in Quebec
» There is a strong compliment of small and medium-sized companies, with a few large companies as well
» Average employees per company are also mid-range
» BC’s recent industry growth has been flat, although BC video game companies have some expectation of growth in the next couple of years (when compared with expectations for the broader economy)
» Expectations of better days ahead seem to be underlined by the fact that many skilled former studio em-ployees have elected to start game companies of their own
British Columbia in 2011
Total Employees 3,882
Estimate spending in BC $393m
Total Number of companies 83
Average number of employees / company
47
Historical growth 0%
Expected growth 10%
ONTARIO (CONT’D) » Ontario is home to the greatest number of micro and small companies, housing approximately 30% of all companies in each category. Shares of total industry re-sources are going to games on mobile, social, and casual platforms more rapidly than in Quebec
» Ontario has more companies than Quebec and is seeing more rapid growth rates. This is likely a function of the smaller average size of Ontario video game companies, as entrepreneurial companies tend to exhibit faster growth than more established companies
» Ontario’s industry is less centred on traditional console games, though they still command a slight majority share of the resources

10
THE INDUSTRY IN CANADA
Ontario Quebec BC Alberta Manitoba Nova Scotia PEI NL NB TotalMicro 34 9 14 14 8 6 10 6 0 101
Small 45 30 42 10 11 6 0 2 3 149
Medium 14 22 18 3 0 0 0 0 0 57
Large 3 26 9 3 0 0 0 0 0 41
TOTAL 96 87 83 30 19 12 10 8 3 348
COMPANIES BY SIZE AND PROVINCE

11
THE INDUSTRY IN CANADA
Ontario Quebec BC Alberta Manitoba Nova Scotia PEI NL NB TotalMicro 34 9 14 14 8 6 10 6 0 101
Small 45 30 42 10 11 6 0 2 3 149
Medium 14 22 18 3 0 0 0 0 0 57
Large 3 26 9 3 0 0 0 0 0 41
TOTAL 96 87 83 30 19 12 10 8 3 348
COMPANIES BY SIZE AND PROVINCE

12
INDUSTRY IMPACT The unique nature of video games as creative-technical productions means the industry cultivates and develops a wide range of skills in technology, creative arts, and man-agement which have applications in architecture, medicine, and simulation subsequently driving ancillary economic activity
$62,000 vs. $29,000
Average annual salary for employees at Canadian video game companies versusthe average salary of workers in the broader economy
arts and animation specialists
Programmers
quality assurance personnel
game production experts
audio specialists
game designers
motion-capture technicians
legal staff members
business and marketing personnel
GAME TESTER
Lead Programmer
Engine/Tools ProgrammerJunior Programmer
Lead Tester
Sound Engineer/Designer
Composer
Audio Programmer/Engineer
Fiction Writer or Screenwriter
GAME DESIGNER
Lead Designer
Level Designer
Producer
Graphics/Special Effects Programmer
Artificial Intelligence ProgrammerMULTIPLAYER NETWORKING PROGRAMMER
3D Model Builder (objects)
2D Conceptual Artist
2D Texture Artist
Intern Artist
Audio Programmer/Engineer
Project Manager
Associate Producer
Associate Producer
Art Technician
3D Cutscene Artist
3D CHARACTER BUILDER
Level Builder
3D Character Animator
Art Director
Careers in Canada’s video game industry include:

13
WHO IS PLAYING COMPUTER AND VIDEO GAMES?
gamer: a person who has played computer or video games in the past four weeks
59%
33YEARS OLD
of Canadiansare gamers
Average age of a Canadian gamer
CANADIANS, BY AGE, WHO HAVE PLAYED A VIDEO GAME IN THE PAST 4 WEEKS
35-5455+
18-3413-17
6-12
90%
80%
67%
48%
34%
AGES
20%
40%
60%
80%
100%
20%
40%
60%
80%
100%
35-54 55+18-3413-176-12AGES
Source: NPD Group’s 2010 Understanding the Canadian Gamer

14
WHO IS PLAYING COMPUTER AND VIDEO GAMES?
What types of games do adults (18+ years) like to play?
Men Women39% card, puzzle, arcade or word games 57% card, puzzle, arcade or word games
37% shooter games 41% games that challenge mental abilities
35% action/adventure 22% family oriented
30% sports games 18% strategy or role-playing games
What types of games do teenagers (13-17 years) like to play?
Teen Boys Teen Girls59% shooter games 43% music-based games
50% action/adventure 35% strategy or role-playing games
43% sports games 30% card, puzzle, arcade or word games
38% fighting 26% racing games
What types of games do children (6-12 years) like to play?
Boys Girls53% racing games 58% kid-oriented online role-playing games
41% action adventure games 34% games that challenge your mental abilities
34% sports games 29% racing games
30% strategy or role playing games 27% music-based games
Source: NPD Group’s 2010 Understanding the Canadian Gamer
Female38%
Male62%
15
ON WHAT PLATFORM DO GAMERS PLAY MOST FREQUENTLY?
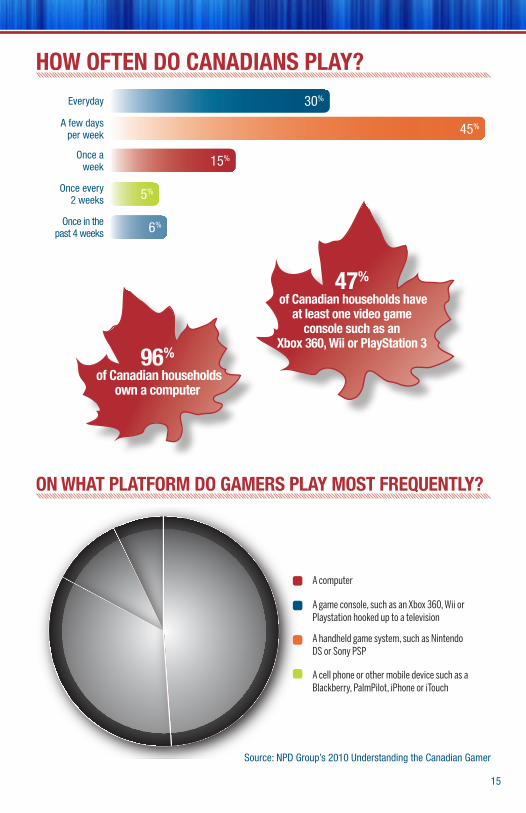
HOW OFTEN DO CANADIANS PLAY?
96%
of Canadian households own a computer
47%
of Canadian households have at least one video game
console such as an Xbox 360, Wii or PlayStation 3
34%
49%
10%
7%
A computer
A game console, such as an Xbox 360, Wii orPlaystation hooked up to a television
A handheld game system, such as NintendoDS or Sony PSP
A cell phone or other mobile device such as aBlackberry, PalmPilot, iPhone or iTouch
30%
45%
15%
5%
6%
Everyday
A few daysper week
Once aweek
Once every2 weeks
Once in thepast 4 weeks
Source: NPD Group’s 2010 Understanding the Canadian Gamer

16
THE BOTTOM LINE 1.7 billion1 - Canadian retail sales of entertainment software and hardware in 2010
$886 million1 - console/handheld games
$79 million1 – PC games
$513 million1 – hardware
$279 million1 – Peripherals
DIGITAL SALES » The video game industry has developed online networks accessible through con-soles (Xbox LIVE, Sony PSN) and PCs (Steam, Origin) which provide gamers with the ability to directly purchase and download stand-alone games as well as other add-on downloadable content, bypassing physical retailers. Games can also be accessed through web-based portals and social networking sites, and new “cloud gaming” services that “stream” gameplay through the Internet are emerging. Digital sales can include game subscriptions, mobile apps, social network games and full games available for download
» Digital sales comprise an increasing proportion of the revenues of game publishers
Digital
1 Source: NPD Group’s Monthly Games Report2 Source: NPD Group’s Video Game Aquisition in Canada
*Between September 2010 and February 2011
Retail - console/handheld games
Retail - PC games
Digital downloads
Purchased at physical retailoutlet
$578 million1
Canadian Sales ofentertainment software*
Aquisition ofgames*
$84Million2
$41Million2
65%2
35%2

17
Made in Canada titles
TOP SELLING COMPUTER AND VIDEO GAMESFROM JULY 2010 – JUNE 2011
RANK TITLE PLATFORM ESRB RATING
1 CALL OF DUTY: BLACK OPS 360 MATURE
2 CALL OF DUTY: BLACK OPS PS3 MATURE
3 HALO: REACH 360 MATURE
4 STARCRAFT II: WINGS OF LIBERTY PC TEEN
5 JUST DANCE 2 WII EVERYONE 10+
6 DONKEY KONG COUNTRY RETURNS WII EVERYONE
7 GRAN TURISMO 5 PS3 EVERYONE
8 NHL 11 360 EVERYONE 10+
9 NHL 11 PS3 EVERYONE 10+
10 POKEMON WHITE VERSION NDS EVERYONE
11 ASSASSIN’S CREED: BROTHERHOOD 360 MATURE
12 FIT PLUS W/BALANCE BOARD WII EVERYONE
13 NHL SLAPSHOT W/ HOCKEY STICK WII EVERYONE
14 POKEMON BLACK VERSION NDS EVERYONE
15 NEW SUPER MARIO BROS. WII WII EVERYONE
16 WORLD OF WARCRAFT: CATACLYSM EXPANSION PACK PC TEEN
17 NEW SUPER MARIO BROS. DS NDS EVERYONE
18 KINECT SPORTS 360 EVERYONE 10+
19 ASSASSIN’S CREED: BROTHERHOOD PS3 MATURE
20 SUPER MARIO GALAXY 2 WII EVERYONE

18
55% Everyone
18%
Everyone 10+
21% Teen
1% EarlyChildhood
Note: The ESRB assigned 1,638 ratings in 2010. These figures include instances where a publisherrevised and resubmitted a game with the intention of receiving a different rating.
5% Mature
WHAT ARE ESRB RATINGS? The Entertainment Software Rating Board (ESRB) is a non-profit, self-regulatory body that assigns computer and video game content ratings. The ESRB ratings are designed to provide consumers, especially parents, with concise, impartial guidance about the age-appropriateness and content of computer and video games so that they can make informed purchasing decisions about the games they deem suitable for their children and families.
HOW MANY ESRB RATINGS WERE ASSIGNED IN 2010?
For more information visit the ESRB website at www.esrb.org
83%
of parent gamers sometimes or always check the ESRB rating symbol on the game box when purchasing or renting video games for their children
88%
of parent gamers sometimes or always use the content descriptors when purchasing games for their child
93%
of adult gamers agree that the ESRB rating system is very useful to help parents buy and rent age-appropriate games for their children

19
WHO WE ARE
A FremantleMedia Company
The Entertainment Software Association of Canada (ESAC) is the voice of the Canadian computer and video game industry that employs approximately 16,000 people at nearly 350 companies across the country. By contributing $1.7 billion in economic activity and cultivating workers with a combination of creative, technological and management skills, the video game industry is supporting Canada’s position in the changing global economy. This dynamic and growing industry is currently the world’s third largest and holds first place on a per capita basis based on employment levels in other countries. ESAC works on behalf of its members to ensure the legal and regulatory environment is favourable for the long-term development of Canada’s video game industry.
ESAC MEMBERS

www.theesa.caTwitter: @ESACanada