About the authors - epi.org.uk · schools: insights from TALIS. Acknowledgements The authors would...
51
1
Transcript of About the authors - epi.org.uk · schools: insights from TALIS. Acknowledgements The authors would...
1
1
About the authors
Natalie Perera is Executive Director and Head of Research at the Education Policy Institute. Natalie
worked in the Department for Education from 2002 to 2014, where she led on a number of reforms
including childcare and early years provision and the design of a new national funding formula for
schools. Between 2014 and 2015, Natalie worked in the Deputy Prime Minister’s Office. Natalie is
the principal author of the EPI’s Annual Report on Education in England.
Jon Andrews is Director for School System and Performance and Deputy Head of Research at the
Education Policy Institute. Prior to this, Jon worked in the Department for Education from 2003 to
2016, most recently leading on statistics and analysis for the national funding formula for schools
and the education White Paper, ‘Educational Excellence Everywhere’. Jon is the principal author of
EPI’s ‘The Performance of Local Authorities and Multi Academy Trusts’ report and a series of
publications on the performance of grammar and faith schools.
Peter Sellen is the Education Policy Institute’s Chief Economist. Peter worked as a Government
Economist between 2006 and 2016, including time in the Department for Education as Head of
Teachers and Teaching Analysis and Head of Economics, Evaluation & Appraisal. He has previously
worked as an economic adviser on Infrastructure and Growth Strategy at HM Treasury and as Head
of Affordable Housing Economics at the Department for Communities and Local Government. Peter
is principal author of ‘Teacher workload and professional development in England’s secondary
schools: insights from TALIS’.
Acknowledgements
The authors would like to thank Susan Fielden, Sam Ellis and David Laws for their editorial advice.
We are grateful to the Department for Education for the supply of additional data including
underlying pupil counts by pupil characteristics at school level and calculations relating to the 3 per
cent floor. Any inferences or conclusions derived from this and other data included in this
publication are the responsibility of the Education Policy Institute and not the Department for
Education.
All maps in this publication contain National Statistics data © Crown copyright and database right
2016. Contains OS data © Crown copyright and database right 2016.
2
About the Education Policy Institute
The Education Policy Institute is an independent, impartial and evidence-based research institute
that aims to promote high quality education outcomes, regardless of social background.
Education can have a transformational effect on the lives of young people. Through our research, we
provide insights, commentary and critiques about education policy in England - shedding light on
what is working and where further progress needs to be made. Our research and analysis spans a
young person's journey from the early years through to higher education and entry to the labour
market. Because good mental health is vital to learning, we also have a dedicated mental health
team which consider the challenges, interventions and opportunities for supporting young people's
wellbeing.
Our core research areas include:
Accountability and Inspection
Benchmarking English Education
Curriculum and Qualifications
Disadvantaged, SEND, and Vulnerable Children
Early Years Development
School Funding
School Performance and Leadership
Teacher Supply and Quality
Children and Young People's Mental Health
Education for Offenders
Our experienced and dedicated team works closely with academics, think tanks, and other research
foundations and charities to shape the policy agenda.
3
Contents
Foreword ................................................................................................................................................. 4
Executive summary ................................................................................................................................. 5
Chapter 1: The policy context ................................................................................................................. 8
Chapter 2: The journey towards a new national funding formula ....................................................... 10
Chapter 3: Why has it taken so long for the government to implement a national funding formula? 13
Chapter 4: The proposed national funding formula ............................................................................. 15
Chapter 5: The impact of the proposed national funding formula ....................................................... 25
Chapter 6: What happens when you remove the protections and add the cost pressures? ............... 40
Conclusions and challenges for government ........................................................................................ 45
Technical Annex .................................................................................................................................... 46
Method for estimating the proposed national funding formula ...................................................... 46
Method for estimating the 2019-20 cost pressures ......................................................................... 47
4
Foreword
The Education Policy Institute is an independent, impartial and evidence-based research institute
which aims to promote high quality education outcomes, regardless of social background.
For many years now, there has been pressure to reform school funding in England to make it
"fairer". Of course, the notion of "fairness" means something different to different people. It could
mean providing the same funding level for every school pupil. Or it could mean providing higher
funding for children with the highest needs or lowest attainment. What there probably is a
consensus in relation to is that fair funding means that pupils with the same characteristics are
funded at a similar level, no matter which school they attend.
Delivering a national funding formula is, then, difficult both in terms of assessing what fairness is,
and delivering a redistribution of funding, which inevitably involves "winners" and "losers". This is
why previous governments have talked about introducing a national funding formula but have failed
to do so.
In the current environment of austerity for most public sector spending areas, it is challenging to
introduce a new spending formula, in which some schools will not merely be relative losers, but will
lose cash in absolute terms. However, it could be argued that given emerging funding pressures, it is
even more important that schools which are being "under-funded" receive a fairer settlement.
On balance, therefore, the case for proceeding with some type of fairer funding mechanism or
formula seems strong. This report looks in detail at the new formula proposed by the government. It
seeks to assess the impacts of the new formula, and considers whether or not these achieve sensible
objectives for reform. This report looks at what might happen to school budgets beyond the period
where the government is offering some protections from larger budget changes driven by the new
formula, and we also set the national funding formula impacts in the context of the wider pressures
on education funding.
We hope that this analysis will help to inform the current debate and it will be submitted as a
contribution to the government's formal consultation on funding reform.
Rt. Hon. David Laws
Executive Chairman,
Education Policy Institute.
5
Executive summary
The existing school funding system allocates money inconsistently across English schools. There is a
strong case for introducing a new national funding formula and, although this is currently politically
challenging given public sector austerity, the Department for Education has good cause to press
ahead with change – more consistent funding is arguably even more important when budgets are
under pressure.
In December 2016 the Department published detailed plans relating to the construction of a national
funding formula, and in designing this new formula it has made a series of decisions based on a
combination of policy intentions and current practice.
The Department has acknowledged that the national funding formula could result in some schools
losing significant amounts of money and so it has built into the formula a 3 per cent ‘cash floor’. This
means that no school loses more than 3 per cent per pupil as a result of the formula, at least until
2019-20. In turn, schools that are due to receive more funding will receive up to a maximum of 5.5
per cent by 2019-20.
We first explore the implications of these decisions on different areas, types of schools and pupils in
England before then considering the overall effect of the proposed formula alongside wider funding
pressures which are estimated to emerge over the course of this spending period (up to 2019-20).
Funding for disadvantaged pupils
The Department has maintained a significant quantum of funding (just under £3bn each year) to
provide additional resource to disadvantaged pupils, over and above the existing Pupil Premium
(which totals £2.5bn each year). This is welcome in light of the large and persistent gaps between
disadvantaged pupils and their peers.
This does, however, result in moving less money out of London and other urban areas than some of
the lower funded local authorities would have preferred. While the variation in funding between
local authorities has narrowed, the relatively higher levels of funding for pupils with additional needs
has meant that many lower funded authorities are not likely to see the level of gains they hoped for.
However, as we find in this report, the redistribution of the basic per pupil amounts, the use of
wider area-based measures of deprivation and the increased quantum of funding for pupils with low
prior attainment means that funding actually shifts from the most disadvantaged pupils and
schools towards the so called ‘just about managing’ group.
As a result of the proposed formula:
Primary and secondary schools with less than 30 per cent of pupils on free school meals are
expected to gain, on average, around 1.0 per cent and 0.9 per cent respectively – totalling
around an additional £275m for these schools, many of which have low proportions of
disadvantaged pupils.
However, disadvantaged primary schools (those with over 30 per cent of pupils eligible for
free school meals) are expected to gain only around 0.4 per cent on average while
disadvantaged secondary schools are set to lose around 0.3 per cent, on average. This
6
equates to a net increase of around £5.6m for the most disadvantaged primary and
secondary schools many of which will actually see reductions to their budgets.
The most disadvantaged primary and secondary schools in London are expected to see an
overall loss of around £16.1m by 2019-20
In addition, the distribution of funding based on area deprivation (IDACI) shows that pupils
who live in the least deprived areas experience the highest relative gains.
The additional funding for low prior attainment means that the lowest performing schools
in the country are set to gain £78.5m more than the top performing schools. This is
particularly acute in London, where we find a net loss to the highest performing primary
schools of around £16.6m.
Small primary schools are due to experience an average gain of 3.5 per cent (or £22.7m
overall). Small secondary schools, however, are not likely to see any changes to their
budgets, on average.
Overall, however, there is no clear trend to the pattern of gaining or losing areas under the planned
formula. We find that there is significant variation of losing and gaining schools within local
authorities and there are not any local authorities in which no schools lose.
Challenges in the Department’s approach
We have identified a number of areas in which the Department’s proposals need to be clarified and,
in some cases, improved.
First, the Department’s overall approach to funding for disadvantaged pupils seems to be
inconsistent. The Pupil Premium allocates almost one and a half times as much money to
primary pupils than it does to secondary pupils, reflecting a policy decision to prioritise early
intervention. However, in the proposed national funding formula, the Department proposes
to allocate a greater weighting to disadvantaged secondary pupils compared to primary
pupils. The Department needs to develop a clearer, evidence-based, understanding of how
funding for disadvantaged pupils should be balanced between the two phases in order to
inform policy decisions.
The proposed increase to low prior attainment funding (from £1.4bn to £2.4bn), combined
with plans to use the Early Years Foundation Stage as a measure of whether a child is at risk
of falling behind, heightens the current incentive for teachers to depress pupils results at the
end of the Reception year in order to attract more funding to the school.
The Department is also proposing to spend £167m per year for schools that experience in
year growth in pupil numbers and a further £23m on large volumes of pupils leaving or
joining a school. However, the Department does not collect national data on these
movements of pupils and so it proposes to spend the total of £190m based on how much
local authorities currently allocate to certain schools. This means that, where new pressures
7
emerge in these areas, those costs would not be recognised in the new funding formula. This
needs addressing in order to ensure that growing schools do not lose out.
The overall funding context for schools
Without additional funding beyond 2020, there is a risk of further significant losses for many schools,
including around 880 schools that will lose more than 10 per cent of their budget if the Department
decides to remove the -3 per cent per pupil protection.
But even within the current spending period, when we take into account inflationary pressures and
the removal of the Education Services Grant, alongside the national funding formula changes, we
estimate that between 2016-17 and 2019-20:
there are unlikely to be any schools in England which avoid real per pupil cuts in funding
around half of primary and secondary schools will be faced with large, real cuts in funding
per pupil of between 6 and 11 per cent by 2019-20
these estimated funding pressures amount to an average real terms loss of £74,000 per
primary school and £291,000 per secondary school. This equates to almost 2 teachers in an
average primary school and 6 teachers in an average secondary school.
schools which will need to make the largest proportionate savings do not tend to have more
generous staff to pupil ratios, so it does not look likely that if any savings are made through
reducing staff numbers, these changes will cause a substantial narrowing of staffing ratios in
the short term. However, Inner London schools – which face the largest real terms cuts on
average – are more generously staffed than other regions.
Conclusion
We consider that the Department is right to proceed with a new schools funding formula and that it
has resisted pressure to skew funding significantly towards the lowest funded areas, which might
have been politically convenient but which would have shifted significant amounts of money away
from disadvantaged areas, where attainment gaps are large. In spite of these changes, the
Department is unlikely to find that schools - even in the areas that gain from the new formula – will
see the benefits of increased resources.
We estimate that once inflation and other pressures are taken into account, all schools in England
are likely to see real terms cuts in funding per pupil over the next 3 years.
In addition, many schools (around 5000) may see further budget cuts after 2019-20 if the
government fails to allocate more money to schools in the next spending review period and
continues to converge schools towards the national funding formula. The Department needs to give
as much notice to schools of its plans beyond 2020 as possible.
8
Chapter 1: The policy context
Until 2003, education funding for each local authority area was determined by the government,
alongside other local public services such as social services and road maintenance. In setting
education budgets, the Government took into account issues including salary costs and the level of
social need in local areas. This meant that relatively more funding was allocated to London and other
urban areas (such as Birmingham and Manchester) which had high levels of deprivation and more
pupils from Black and Minority Ethnic backgrounds and, in the case of London, faced higher staffing
costs.
Funding for all of these public services was then pooled together into a single allocation for each
local authority, and local authorities were then free to spend their total grant in accordance with
their own priorities. There was, at this point, no ‘ring-fenced’ money for schools or education
services and so local authorities could decide to spend either less or more money on schools than
had been included in the government’s allocation.
In 2003, a combination of factors led to what was widely perceived as a ‘school funding crisis’. The
‘crisis’ was driven by an overall reduction in money allocated to local authorities in many parts of the
country (which created an overall pressure on their budgets) and the decision to move part of the
Standards Fund grant into the local government settlement.1 Many local authorities then reduced
their allocations to schools, creating an overall pressure on the schools budget, which came at the
same time as a significant increase in teacher pension costs.
In response to this, in the summer of 2003, the then Secretary of State for Education and Skills,
Charles Clarke, announced a series of changes to the calculation and administration of school
budgets.2 The primary change was that, for each of 2004-05 and 2005-06, schools would receive at
least a minimum increase in their funding per pupil (based on the average cost pressures in each of
those years).
In order to provide further certainty for schools, the Department for Education and Skills (now, the
Department for Education) introduced the Dedicated Schools Grant in 2006, which provided a ring-
fenced education budget for all local authorities in England. However, in seeking to provide stability
to local areas, the Department made a commitment that ‘no authority [will receive] less funding per
pupil for schools than its current level of spending plus an annual increase which takes account of
pupil numbers’.3 It was this commitment that meant the historical spending decisions of different
local authorities across the country were ‘locked in’ through the introduction of the Dedicated
Schools Grant.
The Standards Fund was then rationalised in 2007, ‘mainstreaming’ many of the specific grants
under a single School Standards Grant. Finally, in 2011, the Coalition government ‘mainstreamed’
1 The Standards Fund was introduced in 1998 as an umbrella structure encompassing a range of funding
streams linked to government’s educational objectives. It reached a peak of over 30 separate grants totalling around £1.6 billion per year.
2 https://www.publications.parliament.uk/pa/cm200203/cmhansrd/vo030717/debtext/30717-10.htm#30717-10_spnew14
3 Department for Education and Skills, ‘Consultation on New School Funding Arrangements from 2006-07’, 2005
9
the Standards Fund fully into the Dedicated Schools Grant. Because many of the original Standards
Fund grants were targeted to deprived areas and those with large proportions of BAME and pupils
with English as an Additional Language, the per pupil funding in areas such as London, Birmingham
and Manchester was significantly higher than the rest of the country.
The consolidation of the Standards Fund, which was intended to simplify the school funding
arrangements therefore resulted in a widening of the per-pupil variations between local authorities
as extra funding was being layered on top of an already unequal system. At the time of the
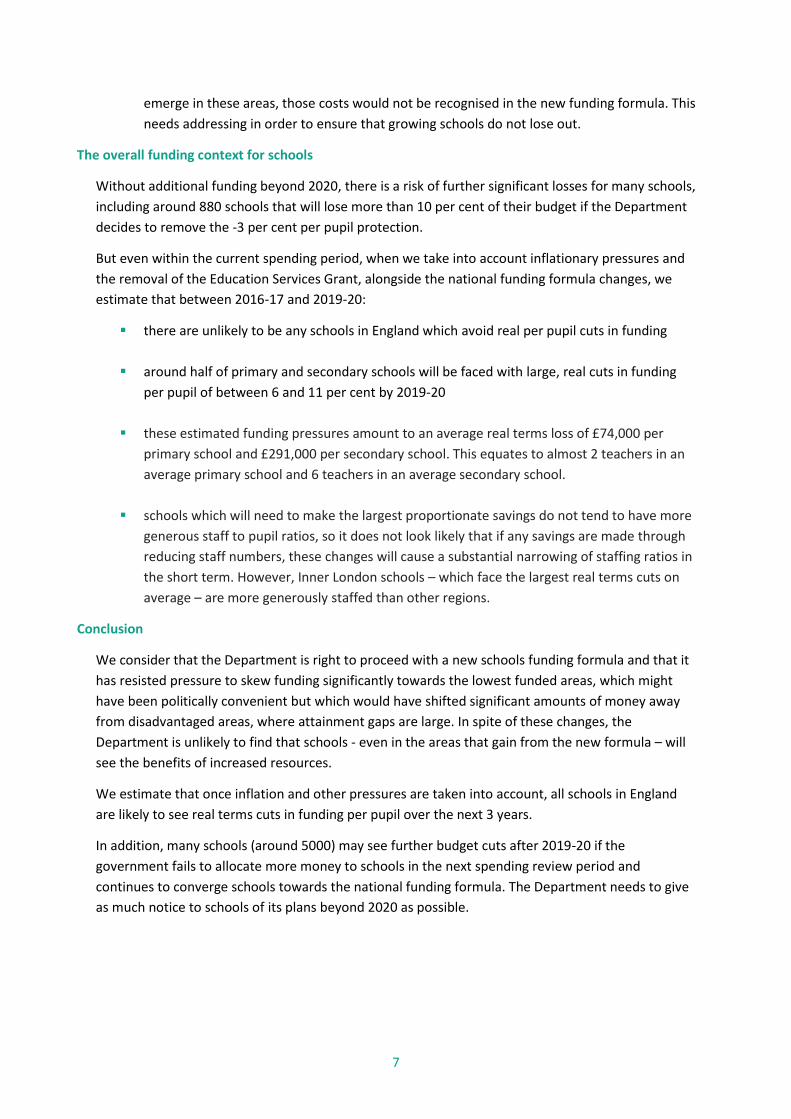
Dedicated Schools Grant allocations in 2011-12, the difference in funding between the highest
funded local authority (Tower Hamlets) and the lowest funded local authority (Leicestershire) was
£3623 per pupil. The variation between local authorities at that point, is shown below.4
Figure 1.1: The distribution of local authority per-pupil allocations in 2011/12 (this includes funding for High
Needs and Early Years)5
Since 2010-11, the Dedicated Schools Grant allocation to local authorities has been maintained at
flat cash per pupil (meaning that the per-pupil amount is maintained in cash terms and does not rise
with inflation), with additional funding allocated through the ring-fenced Pupil Premium Grant. The
geographic variation in the funding system, combined with having to meet real-terms pressures, has
meant that both the Coalition government of 2010 – 15 and the current Conservative government
faced mounting pressure from the lower funded local authorities and schools to introduce a new,
fairer, funding system.
4 The City of London is excluded. 5 http://webarchive.nationalarchives.gov.uk/20110712195148/https:/consumption.education.gov.uk/
schools/adminandfinance/financialmanagement/schoolsrevenuefunding/schoolsettlement08-11/a0064860/final-allocation-of-dedicated-schools-grant-2010-11
10
Chapter 2: The journey towards a new national funding formula
The pressure to reform the school funding system stemmed not only from the inconsistency of the
funding allocated to each local authority, but also, increasingly, from the growing number of
academies.
Academies were, and still are, primarily funded on the basis of what they would receive if they were
a local authority maintained school.6 Local authorities, through their Schools Forum, set budgets for
all state-funded schools (including academies) in their area, using a locally designed formula. In a
context in which academies were promised freedom from local authorities, having their core funding
set through a series of decisions taken by local authorities was seen by the academies sector as a
significant compromise on its freedom and autonomy.7 So, as the Coalition government rolled out its
flagship academies programme, the issue of inconsistent funding arrangements became increasingly
prominent.
In 2011, the Coalition government stated its intention to reform the school funding system and
published two consultation documents: the first on the rationale and principles for a new national
funding formula;8 and the second on the formula factors and transitional arrangements.9
In 2012, the Department for Education (DfE) confirmed that a new national funding formula would
not be introduced during that spending period, but it consulted on a number of measures that it
considered would improve the consistency of the school funding system.10 The two main reforms it
proposed and then introduced were:
Dividing the Dedicated Schools Grant into three distinct ‘blocks’ of schools, high needs and
early years; and
Restricting the number of factors which local authorities were permitted to use in their
funding formulae from 37 to 10 (although this was later amended to 12 following the
consultation process).
The decision to rationalise the number of formula factors that a local authority could use in its
formula reflected the DfE’s aim of gradually converging towards more consistent, pupil-led, school
funding arrangements. The DfE proceeded to implement these reforms from 2013-14 (albeit with a
few small amendments following the consultation process) and a Minimum Funding Guarantee of
minus 1.5 per cent per pupil was continued with the aim of protecting schools from experiencing
sharp declines to their budgets.
In the meantime, there was an optimistic expectation from campaigners for reform, that a new
national formula would be introduced from 2015-16. However, in March 2014, the Coalition
government announced that it would not introduce a national funding formula in 2015-16, citing its
6 There are some exceptions to this, including start-up funding and the Education Services Grant (formerly
the Local Authority Central Spend Equivalent Grant) 7 Department for Education, ‘A Consultation on School Funding Reform: Proposals for a Fairer System
Analysis of responses to the consultation document’, 2012 8 Department for Education, ‘A consultation on school funding reform: rationale and principles’, 2011 9 Department for Education, ‘A consultation on school funding reform: proposals for a fairer system’, 2011 10 Department for Education, ‘School funding reform: next steps towards a fairer system’, 2012
11
inability to set multi-year budgets beyond the last year of the spending period and claiming that a
new formula in that year would create high levels of uncertainty for schools.
In an attempt to address some of the variation in local funding levels and to address the
disappointment from those who were campaigning for a new formula, the DfE increased the
Dedicated Schools Grant by an additional £390m in 2015-16. This was allocated using ‘Minimum
Funding Levels’ which meant that a minimum cash value was identified across a range of pupil and
school characteristics.11 If a local authority’s Schools Block per pupil allocation fell below the
Minimum Funding Level, then it would be topped up to that amount. This resulted in an additional
69 local authorities receiving varying levels of additional funding in 2015-16.
Since then, the per-pupil units of funding for local authorities have been maintained at flat-cash per
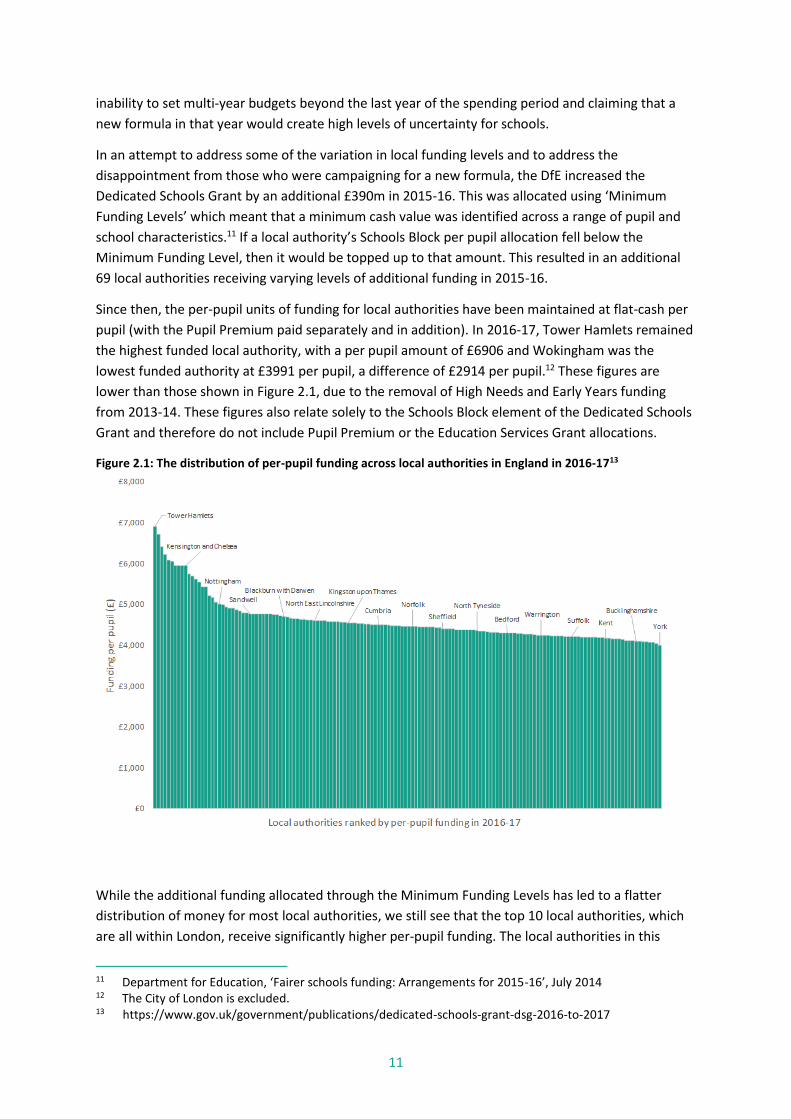
pupil (with the Pupil Premium paid separately and in addition). In 2016-17, Tower Hamlets remained
the highest funded local authority, with a per pupil amount of £6906 and Wokingham was the
lowest funded authority at £3991 per pupil, a difference of £2914 per pupil.12 These figures are
lower than those shown in Figure 2.1, due to the removal of High Needs and Early Years funding
from 2013-14. These figures also relate solely to the Schools Block element of the Dedicated Schools
Grant and therefore do not include Pupil Premium or the Education Services Grant allocations.
Figure 2.1: The distribution of per-pupil funding across local authorities in England in 2016-1713
While the additional funding allocated through the Minimum Funding Levels has led to a flatter
distribution of money for most local authorities, we still see that the top 10 local authorities, which
are all within London, receive significantly higher per-pupil funding. The local authorities in this
11 Department for Education, ‘Fairer schools funding: Arrangements for 2015-16’, July 2014 12 The City of London is excluded. 13 https://www.gov.uk/government/publications/dedicated-schools-grant-dsg-2016-to-2017
12
group receive an average of £6,277 compared to an average of £4,458 in all other authorities. Given
differences in teacher pay scales, which reflect the higher costs of living in and around London, we
would expect London to be funded at a higher rate than the rest of the country.
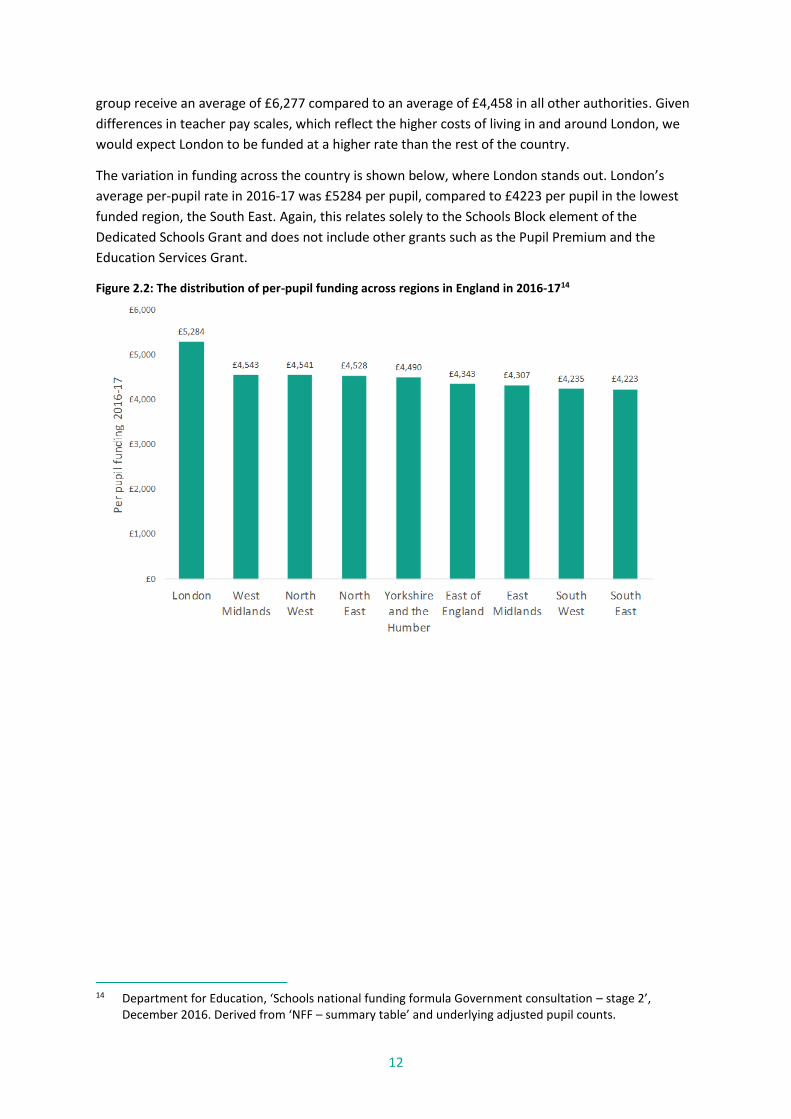
The variation in funding across the country is shown below, where London stands out. London’s
average per-pupil rate in 2016-17 was £5284 per pupil, compared to £4223 per pupil in the lowest
funded region, the South East. Again, this relates solely to the Schools Block element of the
Dedicated Schools Grant and does not include other grants such as the Pupil Premium and the
Education Services Grant.
Figure 2.2: The distribution of per-pupil funding across regions in England in 2016-1714
14 Department for Education, ‘Schools national funding formula Government consultation – stage 2’,
December 2016. Derived from ‘NFF – summary table’ and underlying adjusted pupil counts.
13
Chapter 3: Why has it taken so long for the government to
implement a national funding formula?
In theory, creating a formula and then allocating funding to schools based on that formula is not
difficult. But there are a range of both political and practical factors which, together, make this a
particularly complex reform process.
The formula is based on how to share the existing pot, not about how much it costs to deliver
education
There is no clear and uncontested evidence about the cost of running a school. There are models
which help to plan budgets depending on class sizes and teaching hours, but these are based on top-
down approaches and do not consider the cost of teaching differentiation for pupils. All schools are
different, and so there is not a single model of what works. While organisations including the
Education Endowment Foundation publish evidence of effective interventions for disadvantaged
pupils, this does not, yet, give us the full picture of how much money a school should be spending on
these pupils (or indeed pupils with other types of characteristics or needs) to bring their attainment
up to that of other pupils.15
Crucially, a bottom-up costing might not be consistent with a politically realistic quantum of funding.
Formula factors can only ever be ‘proxies’ for additional needs
There are many factors and characteristics which could have an impact on the level of support
required by an individual child or indeed an entire school. The formula factors which the Department
for Education has proposed to include in the new national funding formula represent a combination
of evidence (for example, the link between economic deprivation and attainment) and historic
spending patterns.
Even where there is compelling evidence of the need for additional support, defining a consistent
and available measure to identify children with greater needs presents further difficulties. For
example, research published by the DfE found that parental occupation, parental education and
other household indicators were slightly better predictors of pupil achievement than eligibility for
Free School Meals (FSM), but that FSM measures (including the ‘Ever-6 Measure’) provided a more
practical, cost-effective method of predicting pupil attainment than introducing new data
collections, given that data quality risks might easily undermine the intended improvements.16
However the DfE constructs the new formula, it will only ever represent an approximation of the
need of pupils in a particular school.
The challenge of maintaining a dynamic school sector and protecting small schools
The DfE has been clear, since 2010, that the majority of funding should be based on pupil numbers
and need and not on the physical characteristics of individual schools. This is consistent with the aim
of having a dynamic schools system which enables successful schools to grow (in theory) and
15 https://educationendowmentfoundation.org.uk/ 16 Sutherland, A., Ilie, S., and Vignoles, A., ‘Factors associated with achievement: key stages 2 and 4’,
November 2015
14
unpopular schools to shrink and, in some cases, to close. It also supports efficiency in the school
system, where there are potentially savings to be made through greater economies of scale.
However, this has always been a difficult issue for both the DfE and the sector. A system that is
predominantly based on pupil numbers and need, and intentionally drives efficiency in the school
market, poses a risk to the viability of small schools. The DfE has sought to address this through its
proposals for both a sparsity factor and a lump sum but, while the rationalisation of local schools
may be an ‘efficient’ solution and deliver value for money, the closure of small schools will tend to
be an unattractive consequence for ministers and local politicians.
It is not only the size of the school that matters. Infant, junior, middle and upper schools have
expressed concerns that recent reforms to local funding arrangements have not reflected the unique
circumstances these schools face, particularly in relation to curriculum and fixed costs.
How quickly should schools transition to a new formula?
There is a distinct political gain for any government in increasing the education budgets of lower
funded schools and local area. But, when there is a fixed pot of money to redistribute, ministers
need to make a careful judgement about how quickly gainers should gain and how slowly losers
should lose.
This is not just about politics. Schools set to lose funding will need time to make savings, which could
include: narrowing the curriculum; renegotiating contracts and, where necessary, reducing the
workforce and, ultimately, making teachers redundant. Some phasing therefore makes sense, but
the crucial question is; over what time period such phasing should take place.
Fairness is subjective
The issue of school funding is often associated with ‘fairness’. Head teachers and local authorities,
for example, talk about getting a ‘fair’ allocation of the pot. Journalists often ask whether the
reforms proposed by the government are ‘fair’.
But fairness is neither binary nor objective. ‘Fairness’ depends both on values and on an assessment
of how different levels of resourcing affect pupils’ outcomes. Both of these are subject to multiple
and different opinions. For some people, fairness means the same funding for every pupil. For
others, it might mean the levels of funding needed for every pupil to reach a particular goal. These
are very different notions of fairness.
15
Chapter 4: The proposed national funding formula
In March 2016, the DfE, under the tenure of Nicky Morgan, published a consultation document on
the principles of a national funding formula.17 The March document was detailed in its approach to
the construction and implementation of a new funding formula, setting out proposals relating to the
formula factors, transitional arrangements and the move to a ‘hard’ national funding formula within
two years. It did not, however, publish illustrative allocations at either local authority or school level.
These were set to follow later in the summer of 2016. The March consultation document did,
however, commit to introducing the new national funding formula in April 2017.
The DfE might have stayed on track to deliver the national funding formula in April 2017 had it not
been for the EU Referendum on the 23rd June 2016 and the ministerial changes that took place
shortly afterwards. But the change of Prime Minister and the appointment of Justine Greening as
Secretary of State for Education meant that, in July 2016, the Department announced that the
implementation of the national funding formula would be delayed by a further year, to April 2018.
In December 2016, the Department published its response to the March consultation document,
which set out detailed proposals for implementing the national funding formula in 2018.18 This time,
it has included indicative allocations for both local authorities and schools.
A summary of the government’s proposals
This section provides a summary of the main proposals relating to the Schools Block element of the
Dedicated Schools Grant and highlights some of the challenges and implications that arise from the
DfE’s proposals. It covers the formula factors, weightings, transitional protections and the role of
local authorities, as proposed in the government’s December 2016 consultation. The analysis
covered in this report does not include proposed reforms to either the High Needs, Early Years or
the new Central Schools Block of the Dedicated Schools Grant.
How the formula will work
The DfE proposes to calculate school budgets based on the national funding formula from 2018-19.
For that year, the DfE will aggregate each school’s budget within a local authority, and allow local
authorities to set their own local formula, as they do at present.
From 2019-20, however, the DfE will require local authorities to pass on a school’s budget (as
determined by the national funding formula) directly, and without any local adjustments. The DfE
has said that it will consider a new mechanism which would allow schools to pool some of their
funding together to create a pot which could then be allocated to support certain schools which
require additional support for pupils with Special Educational Needs or disabilities. The DfE has
committed to consulting, in due course, on how this approach might work.
The move to what is commonly described as a ‘hard’ national funding formula (one in which the vast
majority of funding is determined directly by the DfE for each school), reflects the DfE’s aim to
17 Department for Education, ‘Schools national funding formula Government consultation – stage one’,
March 2016 18 Department for Education, ‘Schools national funding formula Government consultation – stage 2’,
December 2016
16
improve consistency in school funding allocations and to address the issue that academy budgets are
still, in practice, determined by local authorities. This does, however, pose some challenges (not
least that this proposal requires a change to primary legislation). There are likely to be some
exceptional circumstances which are difficult to identify and address through a national formula.
These include (but are not limited to) premises related factors and in year growth in pupil numbers.
The DfE is proposing a short-term ‘fix’ for some of these issues (as explained in the formula factors
section below), but there is, at present, a lack of any longer term solution.
17
The formula factors
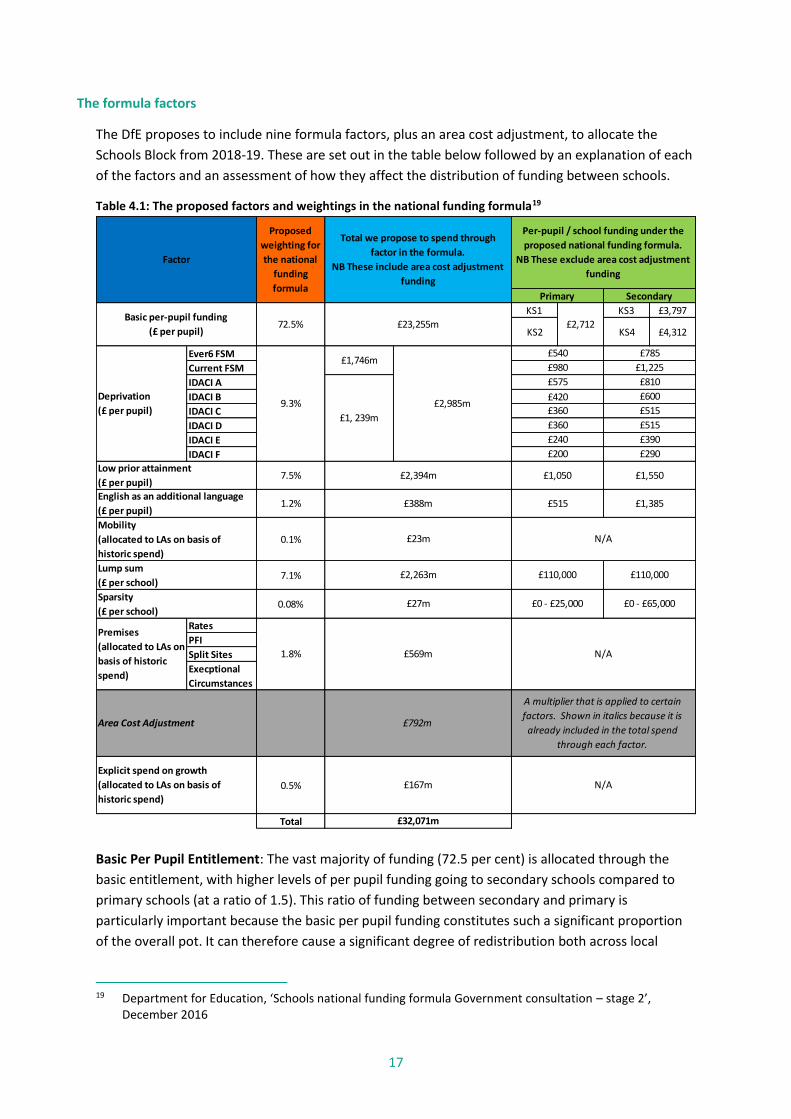
The DfE proposes to include nine formula factors, plus an area cost adjustment, to allocate the
Schools Block from 2018-19. These are set out in the table below followed by an explanation of each
of the factors and an assessment of how they affect the distribution of funding between schools.
Table 4.1: The proposed factors and weightings in the national funding formula19
Basic Per Pupil Entitlement: The vast majority of funding (72.5 per cent) is allocated through the
basic entitlement, with higher levels of per pupil funding going to secondary schools compared to
primary schools (at a ratio of 1.5). This ratio of funding between secondary and primary is
particularly important because the basic per pupil funding constitutes such a significant proportion
of the overall pot. It can therefore cause a significant degree of redistribution both across local
19 Department for Education, ‘Schools national funding formula Government consultation – stage 2’,
December 2016
KS1 KS3 £3,797
KS2 KS4 £4,312
Ever6 FSM
Current FSM
IDACI A
IDACI B
IDACI C
IDACI D
IDACI E
IDACI F
7.5%
1.2%
0.1%
7.1%
0.08%
Rates
PFI
Split Sites
Execptional
Circumstances
0.5%
Total
Premises
(allocated to LAs on
basis of historic
spend)
Area Cost Adjustment
Explicit spend on growth
(allocated to LAs on basis of
historic spend)
Factor
Proposed
weighting for
the national
funding
formula
9.3%
English as an additional language
(£ per pupil)
1.8%
Sparsity
(£ per school)
Deprivation
(£ per pupil)
Low prior attainment
(£ per pupil)
Mobility
(allocated to LAs on basis of
historic spend)
Basic per-pupil funding
(£ per pupil)72.5% £23,255m £2,712
Lump sum
(£ per school)
£420
£360
£360
£240
Total we propose to spend through
factor in the formula.
NB These include area cost adjustment
funding
Per-pupil / school funding under the
proposed national funding formula.
NB These exclude area cost adjustment
funding
Primary Secondary
£792m
£200
£785
£1,225
£810
£600
£515
£515
£390
£290
£1,746m
£1, 239m
£2,985m
£540
£980
£575
£167m
£32,071m
£1,050 £1,550
£515 £1,385
N/A
£110,000 £110,000
£27m
£2,394m
£388m
£23m
£2,263m
£569m
£0 - £25,000 £0 - £65,000
N/A
A multiplier that is applied to certain
factors. Shown in italics because it is
already included in the total spend
through each factor.
N/A
18
authorities and within local authorities. For example, in Chapter 5, we examine how the ratio of
funding between primary and secondary schools has a particular impact on London authorities,
which tend to have a ratio that is more generous to primaries than that proposed under the new
national funding formula.
Deprivation: Deprivation funding is allocated in three ways through the proposed formula (the first
two of which are mutually exclusive): i) an amount for each pupil who is currently eligible for Free
School Meals (FSM); ii) an amount for each pupil that has been eligible for Free School Meals at any
point in the last six years (Ever-6); and iii) an amount per-pupil for those living in economically
deprived areas, as measured by the Income Deprivation Affecting Children Index (IDACI).
The DfE has taken a deliberate policy decision to increase the overall quantum of funding spent on
deprivation. In 2016-17, local authorities allocated a total of £2.4bn through the deprivation factors
(FSM, Ever 6 and IDACI). However local authorities with both relatively high levels of funding and
high proportions of disadvantaged pupils have, historically, tended to allocate less funding through
an explicit deprivation factor, on the basis that targeting is less necessary when there is a significant
proportion of disadvantaged pupils in the area. This means that, while the DfE can see that there is
£2.4bn going to schools explicitly through local authorities deprivation factors, it cannot see the
funding that is being targeted implicitly through the basic entitlement.
In recognition of this, the DfE proposes to increase the amount spent on deprivation by around half
a billion pounds, to just under £3bn. This has the effect of keeping relatively more money in
London and other urban areas than if the explicit deprivation quantum remained at the same
levels as in 2016-17. This also explains why some local authorities which had expected to gain more
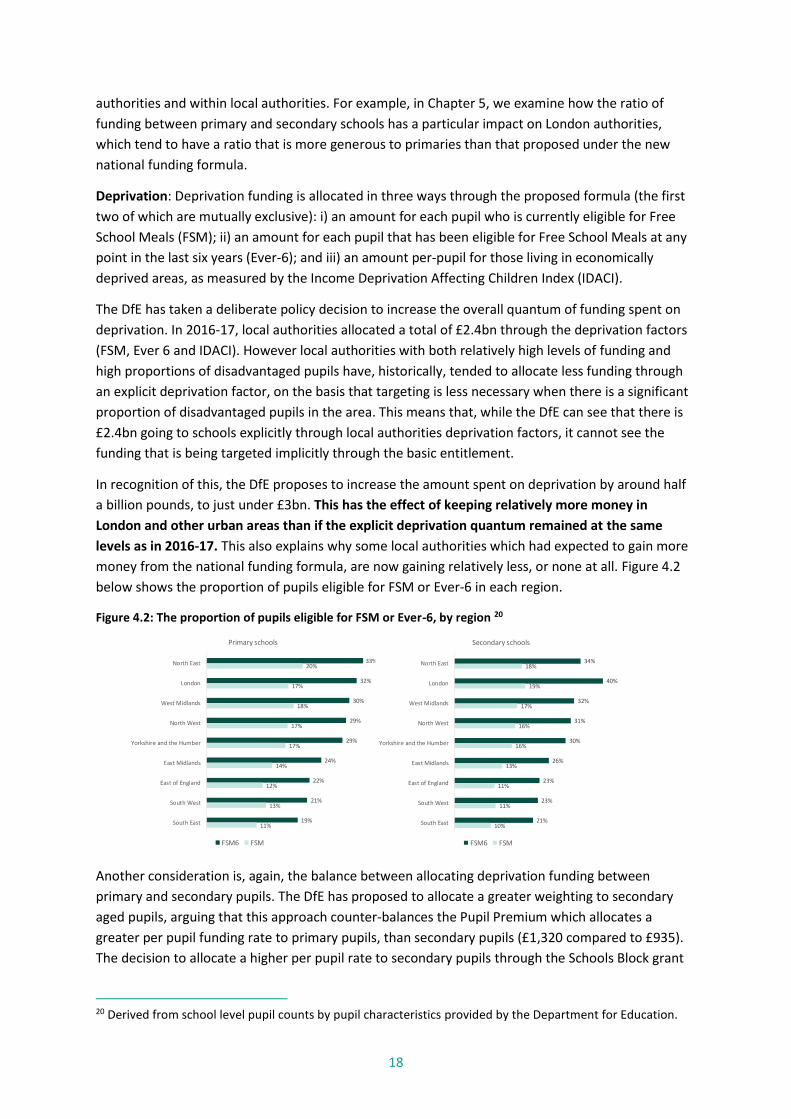
money from the national funding formula, are now gaining relatively less, or none at all. Figure 4.2
below shows the proportion of pupils eligible for FSM or Ever-6 in each region.
Figure 4.2: The proportion of pupils eligible for FSM or Ever-6, by region 20
Another consideration is, again, the balance between allocating deprivation funding between
primary and secondary pupils. The DfE has proposed to allocate a greater weighting to secondary
aged pupils, arguing that this approach counter-balances the Pupil Premium which allocates a
greater per pupil funding rate to primary pupils, than secondary pupils (£1,320 compared to £935).
The decision to allocate a higher per pupil rate to secondary pupils through the Schools Block grant
20 Derived from school level pupil counts by pupil characteristics provided by the Department for Education.
20%
17%
18%
17%
17%
14%
12%
13%
11%
33%
32%
30%
29%
29%
24%
22%
21%
19%
North East
London
West Midlands
North West
Yorkshire and the Humber
East Midlands
East of England
South West
South East
Primary schools
FSM6 FSM
34%
40%
32%
31%
30%
26%
23%
23%
21%
18%
19%
17%
16%
16%
13%
11%
11%
10%
North East
London
West Midlands
North West
Yorkshire and the Humber
East Midlands
East of England
South West
South East
Secondary schools
FSM6 FSM
19
also reflects the practice of the vast majority of local authorities. In 2016-17, only 28 out of 151
authorities allocated a higher rate of funding to FSM or Ever6 primary pupils. Notwithstanding the
decision to reflect current local authority practice, the DfE’s proposal to apply a greater deprivation
weighting to secondary pupils compared to primary reflects an inconsistency in how it believes
deprivation funding should be targeted given current Pupil Premium policy.
The use of IDACI bands also enables the DfE to allocate additional funding to pupils who may come
from low or lower income families, but who do not qualify for FSM or Ever6. IDACI measures the
proportion of children aged 0-15 in each area who live in deprived families. Local authorities are
currently able to allocate funding to pupils in the six most deprived IDACI Bands (Bands A to F) and
the DfE proposes to continue to allocate funding to these Bands under the new national funding
formula. 44 per cent of all pupils live in the six most deprived IDACI bands, compared to 14 per cent
of pupils eligible for Free School Meals and 29 per cent eligible for Ever-6 – meaning that, by using
IDACI, the DfE will inevitably target funding to pupils whose families may not be at the bottom of the
deprivation distribution, but who may nonetheless be in what the Government has been referring to
as the ‘just about managing’ group. However, because this is an area-wide measure of deprivation, it
is likely to also include families who may not be considered as either economically disadvantaged or
‘just about managing’.
In Chapter 5, we consider the impact of the proposed distribution of IDACI funding under the new
formula.
Low Prior Attainment: Another way of targeting funding to pupils who are at risk of falling behind or
are from families who are ‘just about managing’ is by using a Low Prior Attainment (LPA) measure.
The LPA factor allocates £1,050 for each primary pupil who did not reach the expected level of
development by the end of the Reception year (as measured by the Early Years Foundation Stage
Profile) and £1,550 for each pupil in secondary schools who did not meet the expected standard by
the end of primary (as measured by Key Stage 2 assessments).
The DfE is proposing to increase significantly the quantum of money which will be allocated through
the LPA factor, relative to how much local authorities spent in 2016-17. It proposes to increase it by
around £1bn from £1.4bn to £2.4bn. This has the effect of moving more funding to schools and
areas which have high proportions of pupils not meeting the expected standards by the end of the
Reception year and by the end of Key Stage 2.
One of the difficulties with this measure is that it uses the Early Years Foundation Stage Profile
(EYFSP) to decide whether pupils should attract additional LPA funding when they start Key Stage 1.
The EYFSP, however, is a teacher-assessment of a child’s level of development at the end of the
Reception year and therefore the measure could act as an incentive for teachers to depress pupils’
results in order to attract more funding to the school. This is not a new dilemma but its risk and
impact is increased by the fact that the LPA per-pupil funding for primary pupils would be £1,050 –
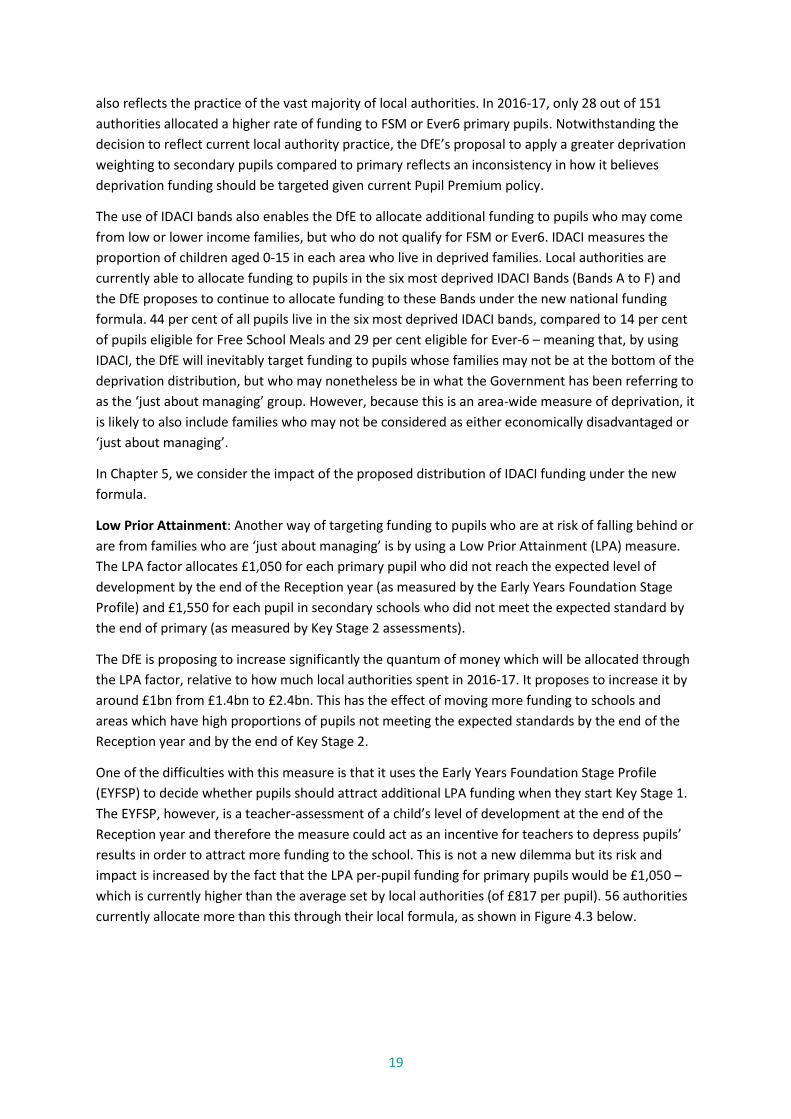
which is currently higher than the average set by local authorities (of £817 per pupil). 56 authorities
currently allocate more than this through their local formula, as shown in Figure 4.3 below.
20
Figure 4.3: The per pupil funding rate for Low Prior Attainment in primary schools, by local authority21
As the chart above shows, there is also significant variation in the per pupil amounts which local
authorities allocate to primary schools through the LPA factor. Eight authorities did not include a
primary LPA factor in their local formulae in 2016-17, while Medway and Richmond-upon-Thames
both allocated more than £2,000 per pupil.
This variation could reflect mixed views amongst local authorities about the reliability of the EYFSP
as an indicator of low prior attainment.
Not only does the use of the EYFSP create a perverse incentive for schools, but its future as an
assessment is also in doubt. After reversing plans to roll out the Reception Baseline assessment, the
DfE confirmed that the EYFSP would remain in place until 2017-18, and that a consultation on the
future of primary assessment and accountability would be published in early 2017.22
English as an Additional Language: Local authorities can currently allocate funding to pupils who are
classified as having English as an Additional Language (EAL) for either one, two or three years from
the point at which they have entered the state-school system.23 Under the proposed national
funding formula, the DfE have indicated that it will fund EAL pupils for the full three years at a rate of
£515 for primary aged pupils and £1,385 for secondary aged pupils. The total spending on this factor
would increase by over £100m, from £282m in 2016-17 to £388m.
While this represents an increase in the explicit funding that was targeted to EAL pupils in 2016-17,
similar to deprivation funding, some local authorities with high levels of EAL pupils would not
necessarily have targeted a significant amount of funding explicitly through an EAL factor but would
21 https://www.gov.uk/government/publications/dedicated-schools-grant-dsg-2016-to-2017 22 Written statement HCWS203, 19 October 2016 23 Pupils are classified as having English as an Additional Language on the School Census
Richmond upon Thames
Medway
Windsor and Maidenhead
Hounslow
Barnet, Bournemouth, Central Bedfordshire, Coventry, Derby, Greenwich, Northamptonshire,
Warrington
£0
£500
£1,000
£1,500
£2,000
£2,500
£3,000
Fun
din
g p
er p
up
il (£
)
Local authorities ranked by LPA funding per primary pupil in 2016-17
21
instead have expected a larger basic per pupil entitlement to reach these pupils. This may well mean
that schools in areas with large proportions of EAL pupils, may see overall reductions to funding for
these pupils.
Another issue with the proposed approach is that pupils with EAL may have joined a school without
any prior attainment data (because they might have come from outside England). This means that,
while they would be eligible for EAL funding, and potentially deprivation funding, they could miss
out on prior attainment funding.
Additionally, there is currently no externally moderated assessment of EAL needs (schools supply
data on EAL pupils to the Department via the School Census) and so there remains a risk that EAL
eligibility is over-claimed by schools in order to receive additional funding. The Department needs to
address this risk and introduce a reliable measure for targeting funding for EAL pupils.
Pupil Mobility and Pupil Growth: Local authorities can currently allocate additional funding to
schools if they experience significant in-year movement of pupils, or if their pupil numbers grow
substantially from year to year. Because school funding is, and will remain, based on a lagged
timescale (i.e. funding is allocated based on a school’s demographics in the previous year), any in-
year pressures are not recognised through national allocations. Instead, local authorities have the
flexibility to top-slice funding in order to meet in-year pressures which arise as a result of mobility
and growth.
The DfE has not, yet, found a way to replicate this in the national funding formula and so it proposes
to allocate funding for these factors based on how much a local authority spent in the previous year.
This means that around £200m would be distributed based on historical spending patterns and,
where new pressures on mobility or pupil growth emerge, these would not be recognised in the new
funding formula and allocations. The DfE acknowledges that this issue needs to be addressed and is
seeking views through the consultation process.
Lump Sum: Local authorities have traditionally allocated a lump sum to schools to reflect some of
the fixed costs they face, and to provide stability to small schools whose budgets would otherwise
be unsustainable or fluctuate significantly due to low pupil numbers. As discussed in Chapter 3, the
extent to which this funding helps to sustain small schools, particularly in urban areas, poses a policy
and political dilemma for ministers.
When the DfE sought to rationalise the local funding arrangements in 2013-14, it initially required
local authorities to set a single lump sum of £200,000 for both primary and secondary schools.
However, this resulted in significant turbulence to school budgets (albeit protected, to some extent,
by the Minimum Funding Guarantee) because of the existing variation in lump sum amounts. To
mitigate this, in 2014-15, the Department changed the regulations so that local authorities could set
separate lump sum values of up to £175,000 for both primary and secondary schools (with a
weighted lump sum for middle schools).
For the national funding formula, the DfE proposes to revert back to a single lump sum of £110,000
for all schools. This has the effect of reducing the total amount spent on the lump sum from £2.6bn
in 2016-17, to £2.3bn under the new formula. Because this is combined with an increase in money
spent on the sparsity factor (see below), the impact on small, rural schools is moderated. We show
this in more detail in Chapter 5.
22
There is no evidence on how much funding a small school needs in order to meet its fixed costs. In
setting the lump sum at £110,000, the Department has said that it wants to ‘encourage schools to
share services and functions where possible…and to make more funding available to invest in pupil-
led factors’.24 There is, however, a lack of rationale from the Department as to why the lump sum is
being set at £110,000.
Sparsity: Currently, local authorities are able to target funding to schools that are in remote, rural
areas and which are vital to local populations, but are unlikely to be viable on per-pupil and lump
sum funding alone. Under the proposed national funding formula, eligible primary schools in areas
of sparsity would receive up to £25,000 and eligible secondary, middle and all-through schools
would receive up to £65,000. As with the lump sum, the DfE has not offered an evidence based
rationale for setting these amounts. The DfE proposes to increase the total amount of funding
available for schools which are eligible for sparsity funding from £15m in 2016-17 to £25m under the
new formula.
Premises related factors: At present, local authorities can allocate funding based on actual costs of
PFI contracts, business rates and schools which operate on split sites. Because the DfE does not hold
data on the premise related features of all state-funded schools in the country, it proposes to
allocate funding to schools based on historic spend for the first year of the formula. This means that
schools will receive, where relevant, the same amount of cash for split sites and rates in 2018-19 as
they did in 2017-18 (PFI funding will be uprated in line with inflation). In 2016-17, these costs
totalled £567m.
In doing this, the Department proposes to ‘top-slice’ £569m from the Schools Block to pay for the
premises costs. The remaining funding will then be allocated through the formula. This approach
benefits local authorities which have significant PFI contracts because it means that schools will get
their formula allocation, plus the additional funding required to meet their PFI obligations. In short,
the PFI costs incurred by schools, are being spread nationally and not from within each local
authority’s budget. There are currently 83 local authorities in which schools have PFI contracts –
ranging from £1,461 in Northumberland to £8.1m in Kent. There are 9 authorities which have PFI
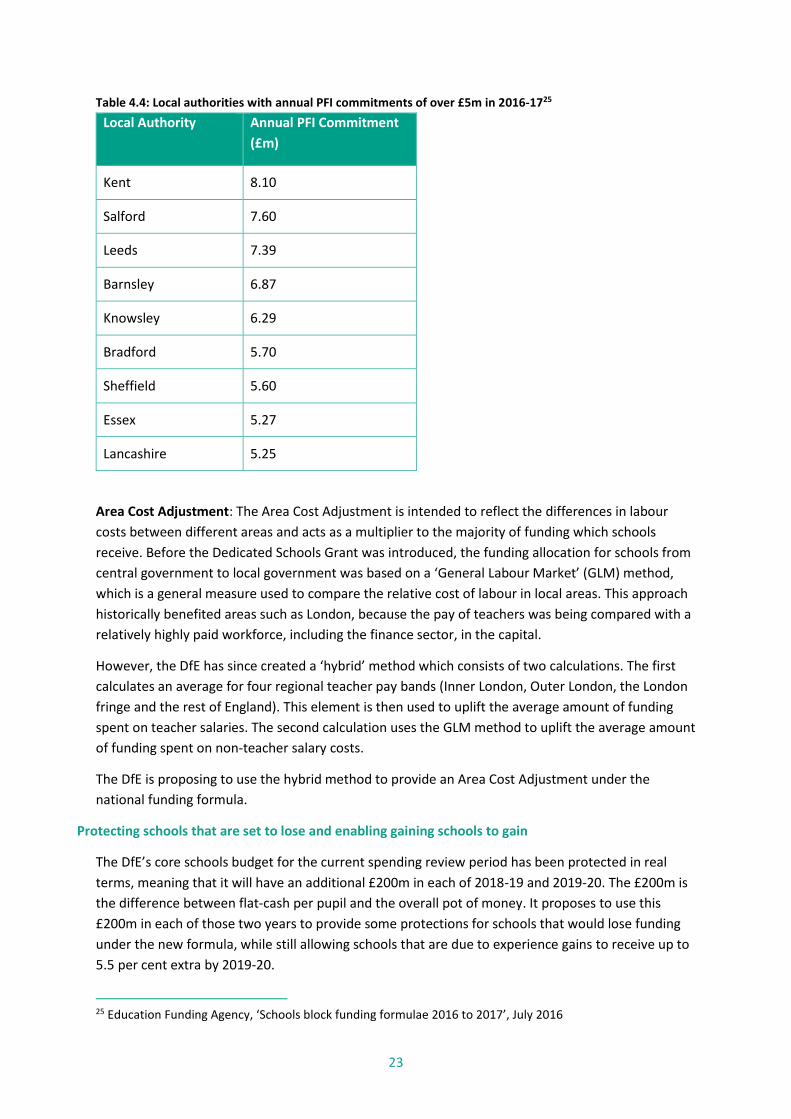
commitments totalling over £5m each year, these are set out in Table 4.4 below.
24 Department for Education, ‘Schools national funding formula Government consultation – stage 2’,
December 2016
23
Table 4.4: Local authorities with annual PFI commitments of over £5m in 2016-1725
Local Authority Annual PFI Commitment
(£m)
Kent 8.10
Salford 7.60
Leeds 7.39
Barnsley 6.87
Knowsley 6.29
Bradford 5.70
Sheffield 5.60
Essex 5.27
Lancashire 5.25
Area Cost Adjustment: The Area Cost Adjustment is intended to reflect the differences in labour
costs between different areas and acts as a multiplier to the majority of funding which schools
receive. Before the Dedicated Schools Grant was introduced, the funding allocation for schools from
central government to local government was based on a ‘General Labour Market’ (GLM) method,
which is a general measure used to compare the relative cost of labour in local areas. This approach
historically benefited areas such as London, because the pay of teachers was being compared with a
relatively highly paid workforce, including the finance sector, in the capital.
However, the DfE has since created a ‘hybrid’ method which consists of two calculations. The first
calculates an average for four regional teacher pay bands (Inner London, Outer London, the London
fringe and the rest of England). This element is then used to uplift the average amount of funding
spent on teacher salaries. The second calculation uses the GLM method to uplift the average amount
of funding spent on non-teacher salary costs.
The DfE is proposing to use the hybrid method to provide an Area Cost Adjustment under the
national funding formula.
Protecting schools that are set to lose and enabling gaining schools to gain
The DfE’s core schools budget for the current spending review period has been protected in real
terms, meaning that it will have an additional £200m in each of 2018-19 and 2019-20. The £200m is
the difference between flat-cash per pupil and the overall pot of money. It proposes to use this
£200m in each of those two years to provide some protections for schools that would lose funding
under the new formula, while still allowing schools that are due to experience gains to receive up to
5.5 per cent extra by 2019-20.
25 Education Funding Agency, ‘Schools block funding formulae 2016 to 2017’, July 2016
24
To protect the schools that are due to see reductions to their budgets, the DfE proposes to continue
with a Minimum Funding Guarantee of -1.5 per cent per pupil for the first two years of the new
formula (2018-19 and 2019-20). It does, however, recognise, that even with the MFG in place, the
impact of the new formula compared to current budgets means that some schools could still lose
significant sums of money each year. The DfE has therefore proposed to build in a minus 3 per cent
‘cash floor’ to the formula – meaning that no school will lose more than 3 per cent per pupil of its
overall budget.
For schools that are due to gain under the new formula, the DfE has set the budget so that it enables
those schools to gain up to 3 per cent in 2018-19 and up to a further 2.5 per cent in 2019-20.
It is not clear what will happen beyond 2019-20, as decisions will be subject to the next spending
review. However, if the DfE is required to make savings to the schools budget or it isn’t given enough
additional funding to continue to increase the budgets of schools that are due to gain more than 5.5
per cent, it will inevitably be faced with pressure to lower the 3 per cent cash floor – meaning that
schools that are set to lose funding under the new formula will do so to a greater degree. We return
to this issue in the concluding section of this report.
25
Chapter 5: The impact of the proposed national funding formula
This chapter considers the implications of the proposed national funding formula on the Schools
Block element of the Dedicated Schools Grant. In line with the December 2016 consultation
document, the analysis in this chapter is illustrative, based on the features and demographics of
schools as provided to the Department for Education.26
All of the analysis in this chapter is based on the final national funding formula allocations as
published by the DfE; we assume gaining schools receive 100 per cent of their increases under the
funding formula (i.e. their gains are not capped by 5.5 per cent) and schools which are set to lose,
are protected by the -3 per cent per pupil cash floor. A detailed explanation of the method used in
this section is included in the Technical Annex.
It is important, in reading this chapter, to understand that redistribution of funding will be due to
three main (sometimes overlapping) factors. These are:
The overall pot of money being allocated through the schools block is increasing modestly in 2018-
19 and 2019-20. As explained in the previous chapter, this allows the Department to maintain a -1.5
per cent Minimum Funding Guarantee for schools set to lose funding, while also enabling gaining
schools to receive increases of up to 5.5 per cent by the end of the spending review period. This
means that, at a national level, the overall schools budget is increasing in cash terms. But the
proposed formula means that the redistribution of the existing budget, plus the distribution of the
additional £400m, has very different implications for individual schools and local authorities.
The current rate of local authorities’ per pupil unit of funding and changes in pupil demographics
over the last few decades. By definition, the proposed formula allocates a single value for each pupil
and then sets values based on the characteristics of those pupils. Areas which currently have a
relatively high per-pupil value and where the demographics of the local population have changed
over a generation (particularly those which have become more affluent), are more likely to see
reductions to their funding as a result of this redistribution. This is one of the reasons behind the
reductions we observe in London, which are explored throughout this chapter.
The extent to which individual schools will lose or gain funding from the new formula also
depends on the construction of their current local formulae. For example, small schools in areas
which currently set a high lump sum may find themselves with less funding due to the national
funding formula’s relatively smaller lump sum of £110,000.
26 This will not reflect any changes made since March 2016 for maintained schools and May 2016 for
academies
26
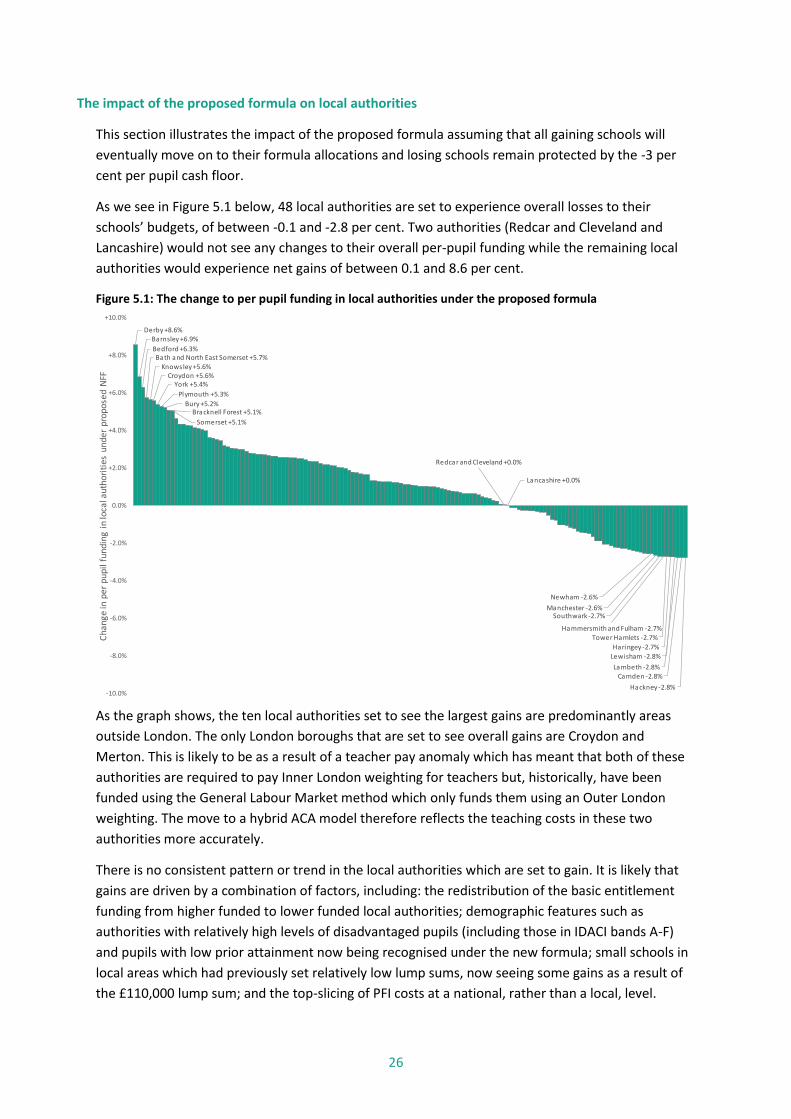
The impact of the proposed formula on local authorities
This section illustrates the impact of the proposed formula assuming that all gaining schools will
eventually move on to their formula allocations and losing schools remain protected by the -3 per
cent per pupil cash floor.
As we see in Figure 5.1 below, 48 local authorities are set to experience overall losses to their
schools’ budgets, of between -0.1 and -2.8 per cent. Two authorities (Redcar and Cleveland and
Lancashire) would not see any changes to their overall per-pupil funding while the remaining local
authorities would experience net gains of between 0.1 and 8.6 per cent.
Figure 5.1: The change to per pupil funding in local authorities under the proposed formula
As the graph shows, the ten local authorities set to see the largest gains are predominantly areas
outside London. The only London boroughs that are set to see overall gains are Croydon and
Merton. This is likely to be as a result of a teacher pay anomaly which has meant that both of these
authorities are required to pay Inner London weighting for teachers but, historically, have been
funded using the General Labour Market method which only funds them using an Outer London
weighting. The move to a hybrid ACA model therefore reflects the teaching costs in these two
authorities more accurately.
There is no consistent pattern or trend in the local authorities which are set to gain. It is likely that
gains are driven by a combination of factors, including: the redistribution of the basic entitlement
funding from higher funded to lower funded local authorities; demographic features such as
authorities with relatively high levels of disadvantaged pupils (including those in IDACI bands A-F)
and pupils with low prior attainment now being recognised under the new formula; small schools in
local areas which had previously set relatively low lump sums, now seeing some gains as a result of
the £110,000 lump sum; and the top-slicing of PFI costs at a national, rather than a local, level.
Derby +8.6%Barnsley +6.9%
Bedford +6.3%Bath and North East Somerset +5.7%
Knowsley +5.6%Croydon +5.6%
York +5.4%
Plymouth +5.3%
Bury +5.2%Bracknell Forest +5.1%
Somerset +5.1%
Redcar and Cleveland +0.0%
Lancashire +0.0%
Newham -2.6%
Manchester -2.6%Southwark -2.7%
Hammersmith and Fulham -2.7%Tower Hamlets -2.7%
Haringey -2.7%
Lewisham -2.8%
Lambeth -2.8%Camden -2.8%
Hackney -2.8%-10.0%
-8.0%
-6.0%
-4.0%
-2.0%
0.0%
+2.0%
+4.0%
+6.0%
+8.0%
+10.0%
Cha
nge
in p
er p
upil
fund
ing
in lo
cal a
utho
riti
es u
nder
pro
pose
d N
FF
27
Under current plans set out by the DfE, no local authority would experience losses of greater than
2.3 per cent because of the 3 per cent cash floor.
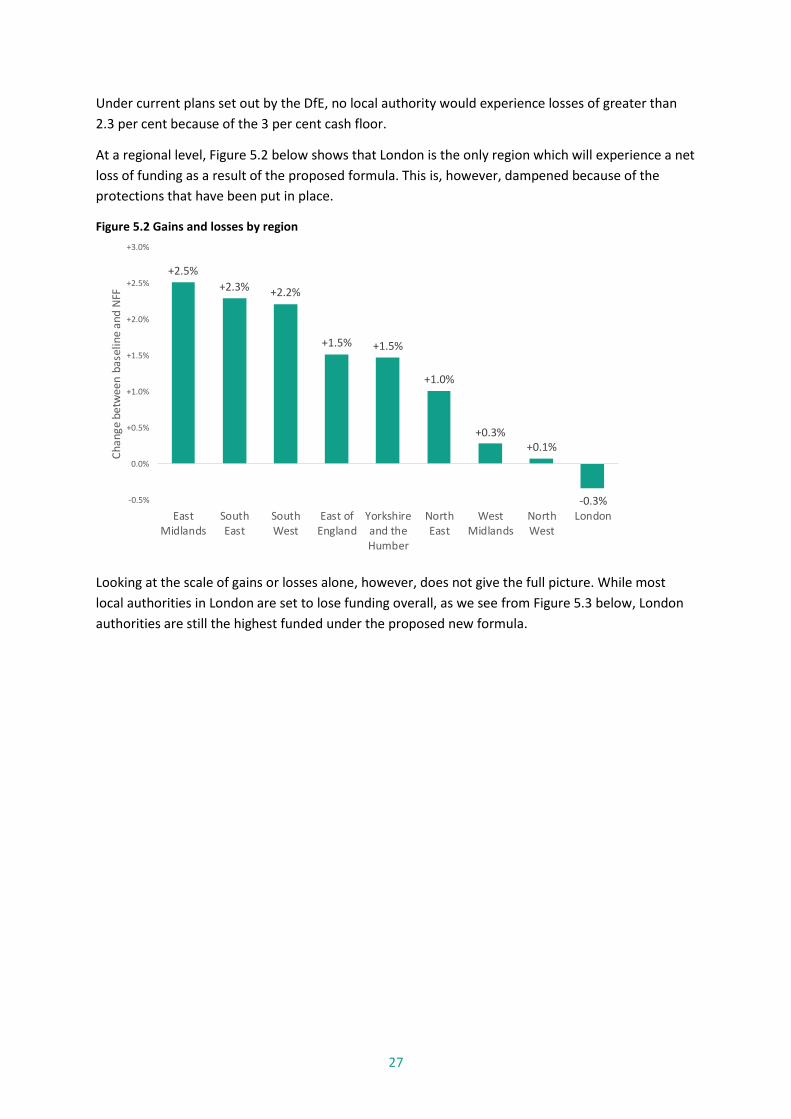
At a regional level, Figure 5.2 below shows that London is the only region which will experience a net
loss of funding as a result of the proposed formula. This is, however, dampened because of the
protections that have been put in place.
Figure 5.2 Gains and losses by region
Looking at the scale of gains or losses alone, however, does not give the full picture. While most
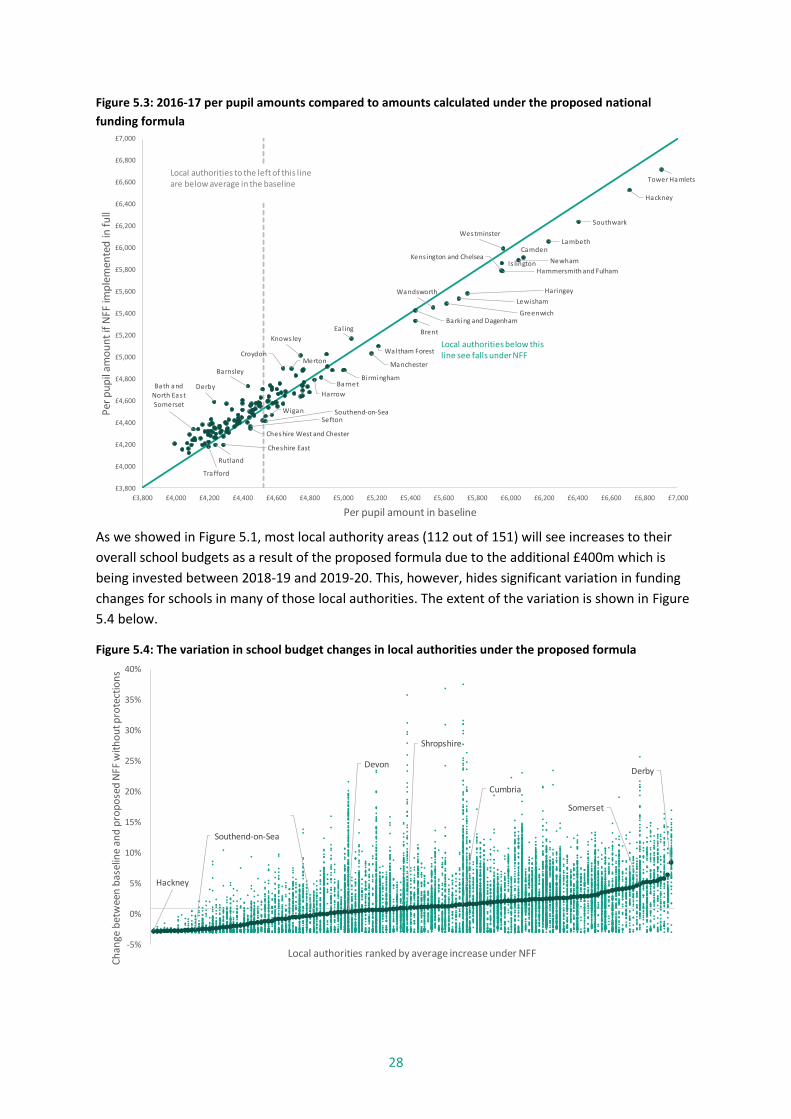
local authorities in London are set to lose funding overall, as we see from Figure 5.3 below, London
authorities are still the highest funded under the proposed new formula.
+2.5%
+2.3% +2.2%
+1.5% +1.5%
+1.0%
+0.3%+0.1%
-0.3%-0.5%
0.0%
+0.5%
+1.0%
+1.5%
+2.0%
+2.5%
+3.0%
EastMidlands
SouthEast
SouthWest
East ofEngland
Yorkshireand theHumber
NorthEast
WestMidlands
NorthWest
London
Ch
ange
bet
wee
n b
asel
ine
and
NFF
28
Figure 5.3: 2016-17 per pupil amounts compared to amounts calculated under the proposed national
funding formula
As we showed in Figure 5.1, most local authority areas (112 out of 151) will see increases to their
overall school budgets as a result of the proposed formula due to the additional £400m which is
being invested between 2018-19 and 2019-20. This, however, hides significant variation in funding
changes for schools in many of those local authorities. The extent of the variation is shown in Figure
5.4 below.
Figure 5.4: The variation in school budget changes in local authorities under the proposed formula
Derby
Rutland
Southend-on-Sea
Camden
Hackney
Hammersmith and Fulham
Haringey
Is lingtonKens ington and Chelsea
Lambeth
Lewisham
Newham
Southwark
Tower Hamlets
Wandsworth
Westminster
Cheshire East
Cheshire West and Chester
Knowsley
Manchester
Sefton
Trafford
Wigan
Barking and Dagenham
Barnet
Brent
Croydon
Eal ing
Greenwich
Harrow
Merton
Waltham Forest
Bath and
North East Somerset
BirminghamBarnsley
£3,800
£4,000
£4,200
£4,400
£4,600
£4,800
£5,000
£5,200
£5,400
£5,600
£5,800
£6,000
£6,200
£6,400
£6,600
£6,800
£7,000
£3,800 £4,000 £4,200 £4,400 £4,600 £4,800 £5,000 £5,200 £5,400 £5,600 £5,800 £6,000 £6,200 £6,400 £6,600 £6,800 £7,000
Per
pu
pil
amo
un
t if
NFF
imp
lem
ente
d in
fu
ll
Per pupil amount in baseline
Local authorities to the left of this line are below average in the baseline
Local authorities below this line see falls under NFF
Cumbria
Derby
Devon
Hackney
Shropshire
Somerset
Southend-on-Sea
-5%
0%
5%
10%
15%
20%
25%
30%
35%
40%
Ch
ange
bet
wee
n b
asel
ine
and
pro
po
sed
NFF
wit
ho
ut p
rote
ctio
ns
Local authorities ranked by average increase under NFF
29
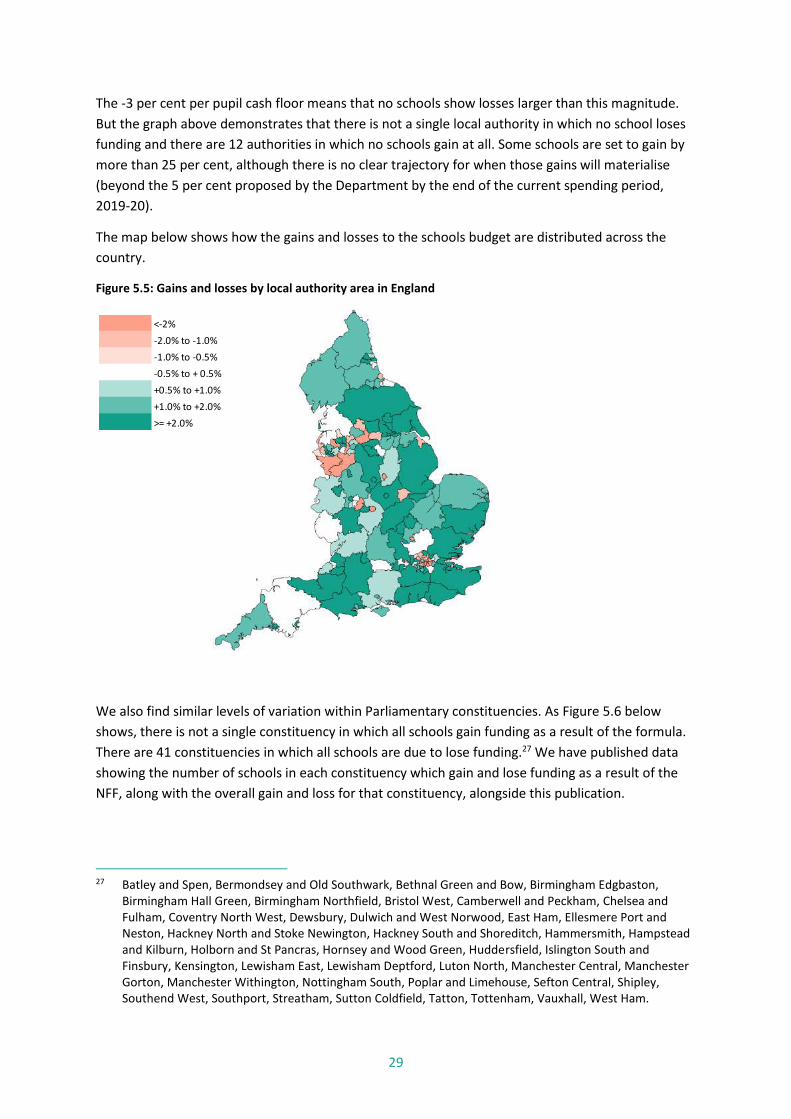
The -3 per cent per pupil cash floor means that no schools show losses larger than this magnitude.
But the graph above demonstrates that there is not a single local authority in which no school loses
funding and there are 12 authorities in which no schools gain at all. Some schools are set to gain by
more than 25 per cent, although there is no clear trajectory for when those gains will materialise
(beyond the 5 per cent proposed by the Department by the end of the current spending period,
2019-20).
The map below shows how the gains and losses to the schools budget are distributed across the
country.
Figure 5.5: Gains and losses by local authority area in England
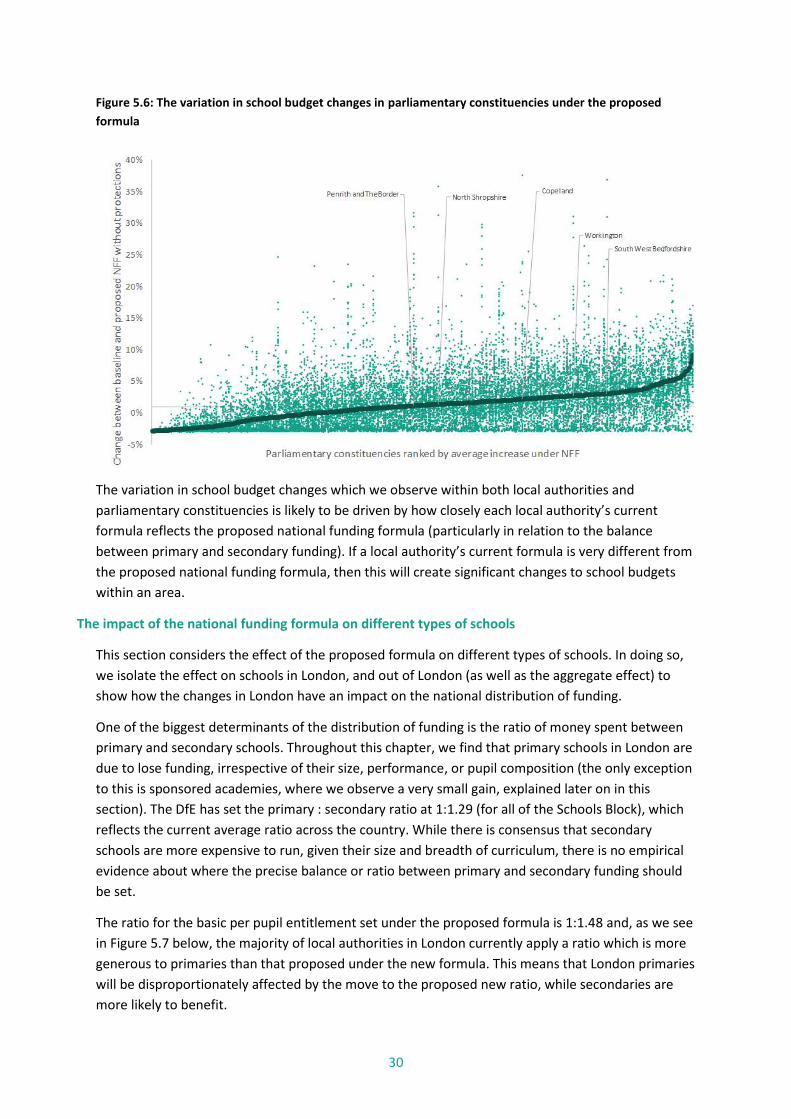
We also find similar levels of variation within Parliamentary constituencies. As Figure 5.6 below
shows, there is not a single constituency in which all schools gain funding as a result of the formula.
There are 41 constituencies in which all schools are due to lose funding.27 We have published data
showing the number of schools in each constituency which gain and lose funding as a result of the
NFF, along with the overall gain and loss for that constituency, alongside this publication.
27 Batley and Spen, Bermondsey and Old Southwark, Bethnal Green and Bow, Birmingham Edgbaston,
Birmingham Hall Green, Birmingham Northfield, Bristol West, Camberwell and Peckham, Chelsea and Fulham, Coventry North West, Dewsbury, Dulwich and West Norwood, East Ham, Ellesmere Port and Neston, Hackney North and Stoke Newington, Hackney South and Shoreditch, Hammersmith, Hampstead and Kilburn, Holborn and St Pancras, Hornsey and Wood Green, Huddersfield, Islington South and Finsbury, Kensington, Lewisham East, Lewisham Deptford, Luton North, Manchester Central, Manchester Gorton, Manchester Withington, Nottingham South, Poplar and Limehouse, Sefton Central, Shipley, Southend West, Southport, Streatham, Sutton Coldfield, Tatton, Tottenham, Vauxhall, West Ham.
<-2%
-2.0% to -1.0%
-1.0% to -0.5%
-0.5% to + 0.5%
+0.5% to +1.0%
+1.0% to +2.0%
>= +2.0%
30
Figure 5.6: The variation in school budget changes in parliamentary constituencies under the proposed
formula
The variation in school budget changes which we observe within both local authorities and
parliamentary constituencies is likely to be driven by how closely each local authority’s current
formula reflects the proposed national funding formula (particularly in relation to the balance
between primary and secondary funding). If a local authority’s current formula is very different from
the proposed national funding formula, then this will create significant changes to school budgets
within an area.
The impact of the national funding formula on different types of schools
This section considers the effect of the proposed formula on different types of schools. In doing so,
we isolate the effect on schools in London, and out of London (as well as the aggregate effect) to
show how the changes in London have an impact on the national distribution of funding.
One of the biggest determinants of the distribution of funding is the ratio of money spent between
primary and secondary schools. Throughout this chapter, we find that primary schools in London are
due to lose funding, irrespective of their size, performance, or pupil composition (the only exception
to this is sponsored academies, where we observe a very small gain, explained later on in this
section). The DfE has set the primary : secondary ratio at 1:1.29 (for all of the Schools Block), which
reflects the current average ratio across the country. While there is consensus that secondary
schools are more expensive to run, given their size and breadth of curriculum, there is no empirical
evidence about where the precise balance or ratio between primary and secondary funding should
be set.
The ratio for the basic per pupil entitlement set under the proposed formula is 1:1.48 and, as we see
in Figure 5.7 below, the majority of local authorities in London currently apply a ratio which is more
generous to primaries than that proposed under the new formula. This means that London primaries
will be disproportionately affected by the move to the proposed new ratio, while secondaries are
more likely to benefit.
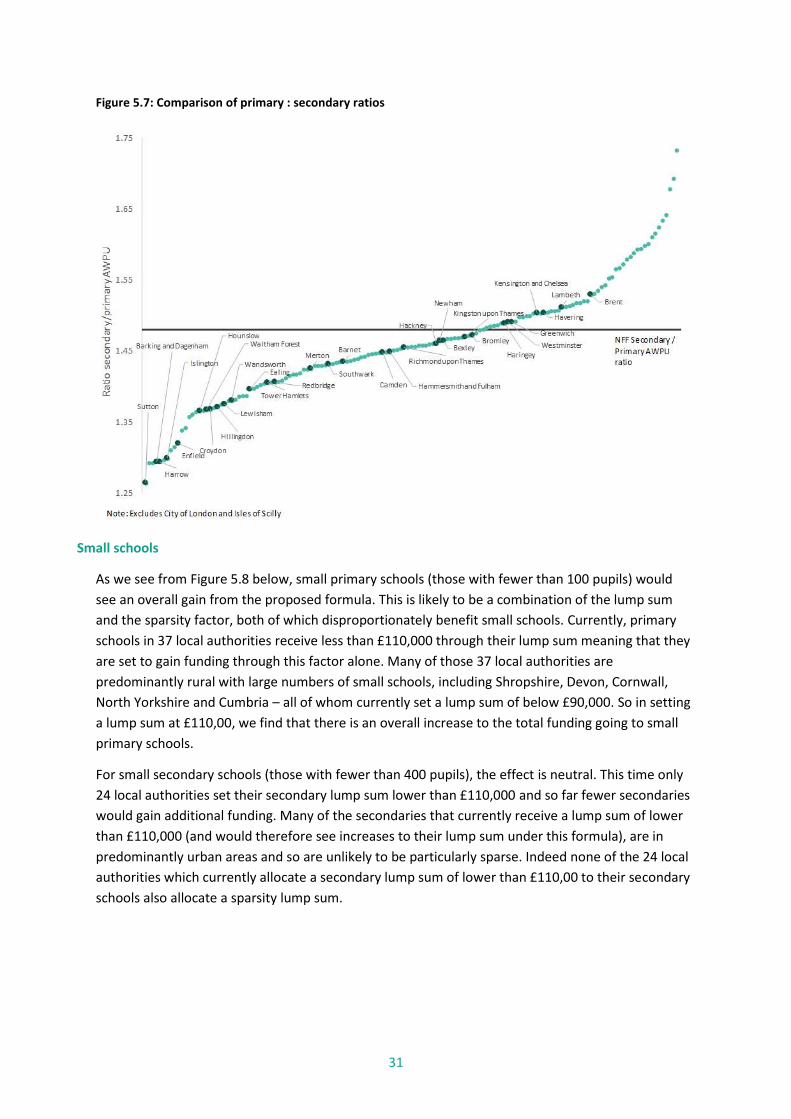
31
Figure 5.7: Comparison of primary : secondary ratios
Small schools
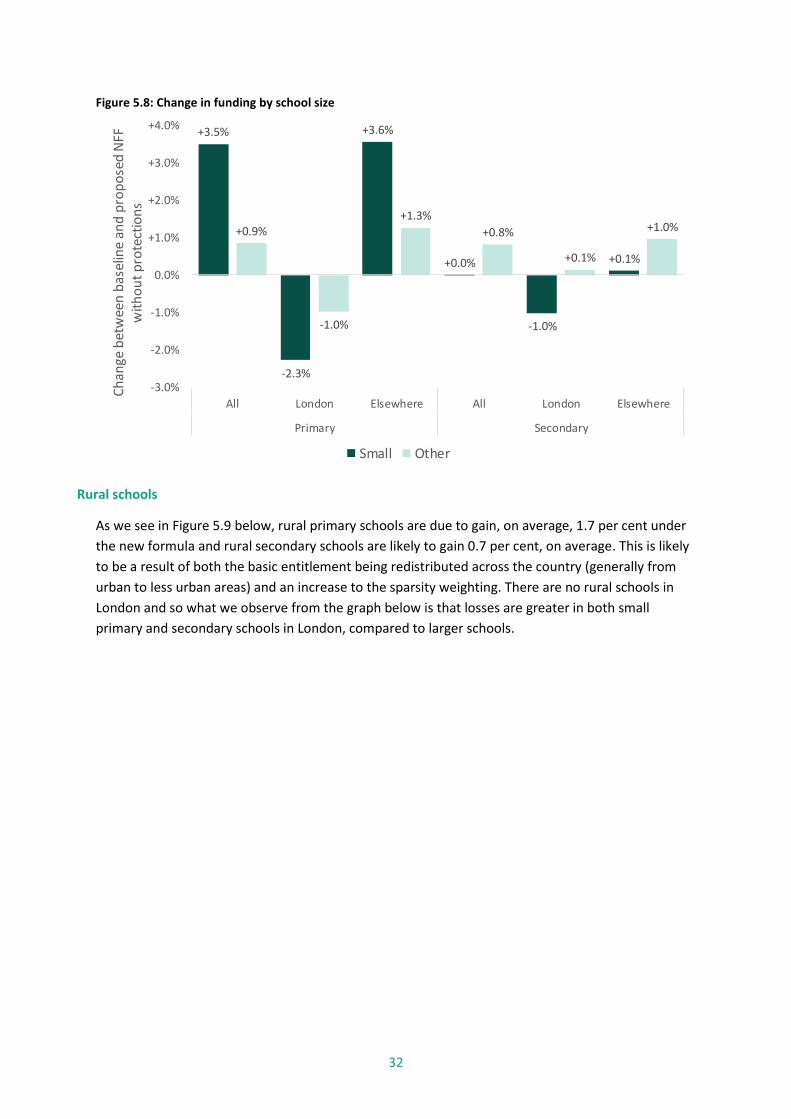
As we see from Figure 5.8 below, small primary schools (those with fewer than 100 pupils) would
see an overall gain from the proposed formula. This is likely to be a combination of the lump sum
and the sparsity factor, both of which disproportionately benefit small schools. Currently, primary
schools in 37 local authorities receive less than £110,000 through their lump sum meaning that they
are set to gain funding through this factor alone. Many of those 37 local authorities are
predominantly rural with large numbers of small schools, including Shropshire, Devon, Cornwall,
North Yorkshire and Cumbria – all of whom currently set a lump sum of below £90,000. So in setting
a lump sum at £110,00, we find that there is an overall increase to the total funding going to small
primary schools.
For small secondary schools (those with fewer than 400 pupils), the effect is neutral. This time only
24 local authorities set their secondary lump sum lower than £110,000 and so far fewer secondaries
would gain additional funding. Many of the secondaries that currently receive a lump sum of lower
than £110,000 (and would therefore see increases to their lump sum under this formula), are in
predominantly urban areas and so are unlikely to be particularly sparse. Indeed none of the 24 local
authorities which currently allocate a secondary lump sum of lower than £110,00 to their secondary
schools also allocate a sparsity lump sum.
32
Figure 5.8: Change in funding by school size
Rural schools
As we see in Figure 5.9 below, rural primary schools are due to gain, on average, 1.7 per cent under
the new formula and rural secondary schools are likely to gain 0.7 per cent, on average. This is likely
to be a result of both the basic entitlement being redistributed across the country (generally from
urban to less urban areas) and an increase to the sparsity weighting. There are no rural schools in
London and so what we observe from the graph below is that losses are greater in both small
primary and secondary schools in London, compared to larger schools.
+3.5%
-2.3%
+3.6%
+0.0%
-1.0%
+0.1%
+0.9%
-1.0%
+1.3%
+0.8%
+0.1%
+1.0%
-3.0%
-2.0%
-1.0%
0.0%
+1.0%
+2.0%
+3.0%
+4.0%
All London Elsewhere All London Elsewhere
Primary Secondary
Ch
ange
bet
wee
n b
asel
ine
and
pro
po
sed
NFF
w
ith
ou
t p
rote
ctio
ns
Small Other
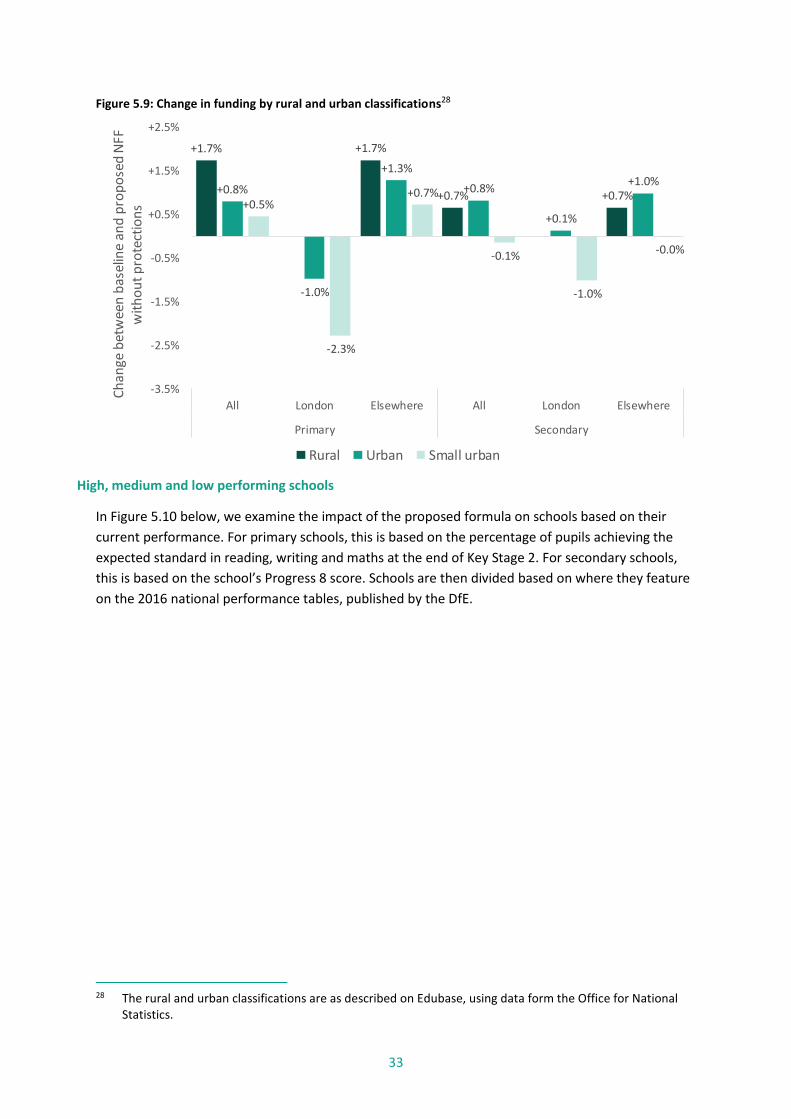
33
Figure 5.9: Change in funding by rural and urban classifications28
High, medium and low performing schools
In Figure 5.10 below, we examine the impact of the proposed formula on schools based on their
current performance. For primary schools, this is based on the percentage of pupils achieving the
expected standard in reading, writing and maths at the end of Key Stage 2. For secondary schools,
this is based on the school’s Progress 8 score. Schools are then divided based on where they feature
on the 2016 national performance tables, published by the DfE.
28 The rural and urban classifications are as described on Edubase, using data form the Office for National
Statistics.
+1.7% +1.7%
+0.7% +0.7%+0.8%
-1.0%
+1.3%
+0.8%
+0.1%
+1.0%
+0.5%
-2.3%
+0.7%
-0.1%
-1.0%
-0.0%
-3.5%
-2.5%
-1.5%
-0.5%
+0.5%
+1.5%
+2.5%
All London Elsewhere All London Elsewhere
Primary Secondary
Ch
ange
bet
wee
n b
asel
ine
and
pro
po
sed
NFF
w
ith
ou
t p
rote
ctio
ns
Rural Urban Small urban
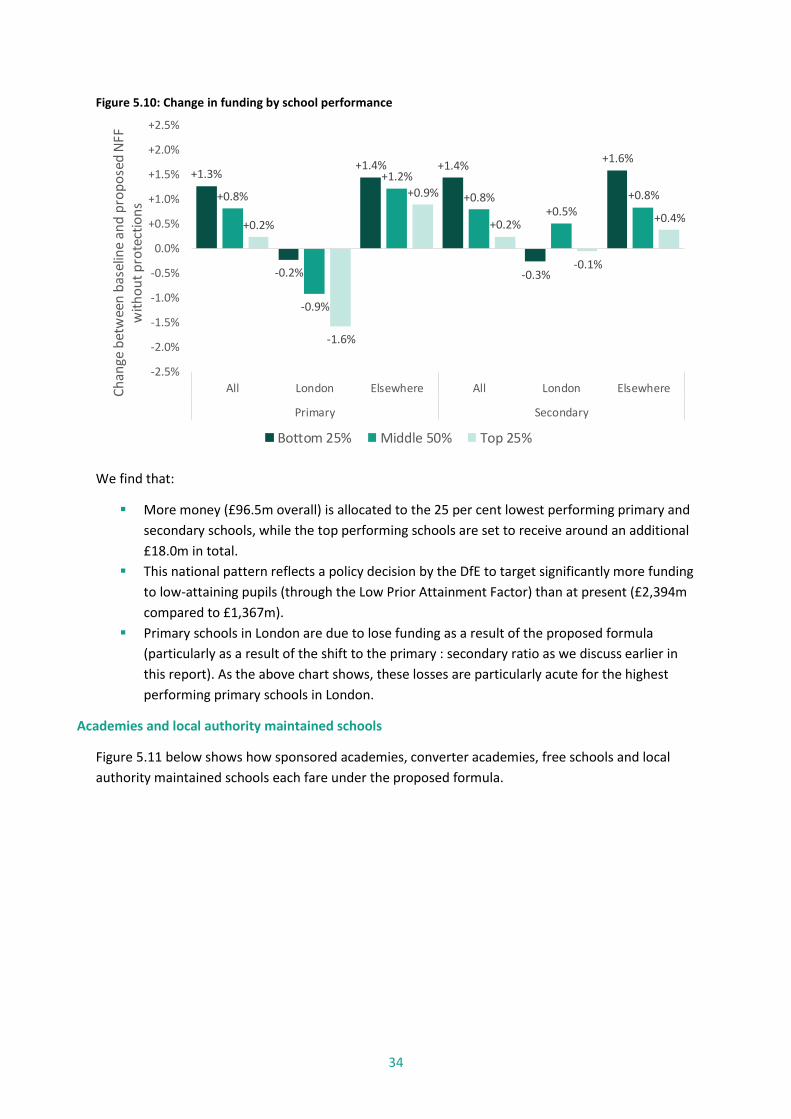
34
Figure 5.10: Change in funding by school performance
We find that:
More money (£96.5m overall) is allocated to the 25 per cent lowest performing primary and
secondary schools, while the top performing schools are set to receive around an additional
£18.0m in total.
This national pattern reflects a policy decision by the DfE to target significantly more funding
to low-attaining pupils (through the Low Prior Attainment Factor) than at present (£2,394m
compared to £1,367m).
Primary schools in London are due to lose funding as a result of the proposed formula
(particularly as a result of the shift to the primary : secondary ratio as we discuss earlier in
this report). As the above chart shows, these losses are particularly acute for the highest
performing primary schools in London.
Academies and local authority maintained schools
Figure 5.11 below shows how sponsored academies, converter academies, free schools and local
authority maintained schools each fare under the proposed formula.
+1.3%
-0.2%
+1.4% +1.4%
-0.3%
+1.6%
+0.8%
-0.9%
+1.2%
+0.8%+0.5%
+0.8%
+0.2%
-1.6%
+0.9%
+0.2%
-0.1%
+0.4%
-2.5%
-2.0%
-1.5%
-1.0%
-0.5%
0.0%
+0.5%
+1.0%
+1.5%
+2.0%
+2.5%
All London Elsewhere All London Elsewhere
Primary Secondary
Ch
ange
bet
wee
n b
asel
ine
and
pro
po
sed
NFF
w
ith
ou
t p
rote
ctio
ns
Bottom 25% Middle 50% Top 25%
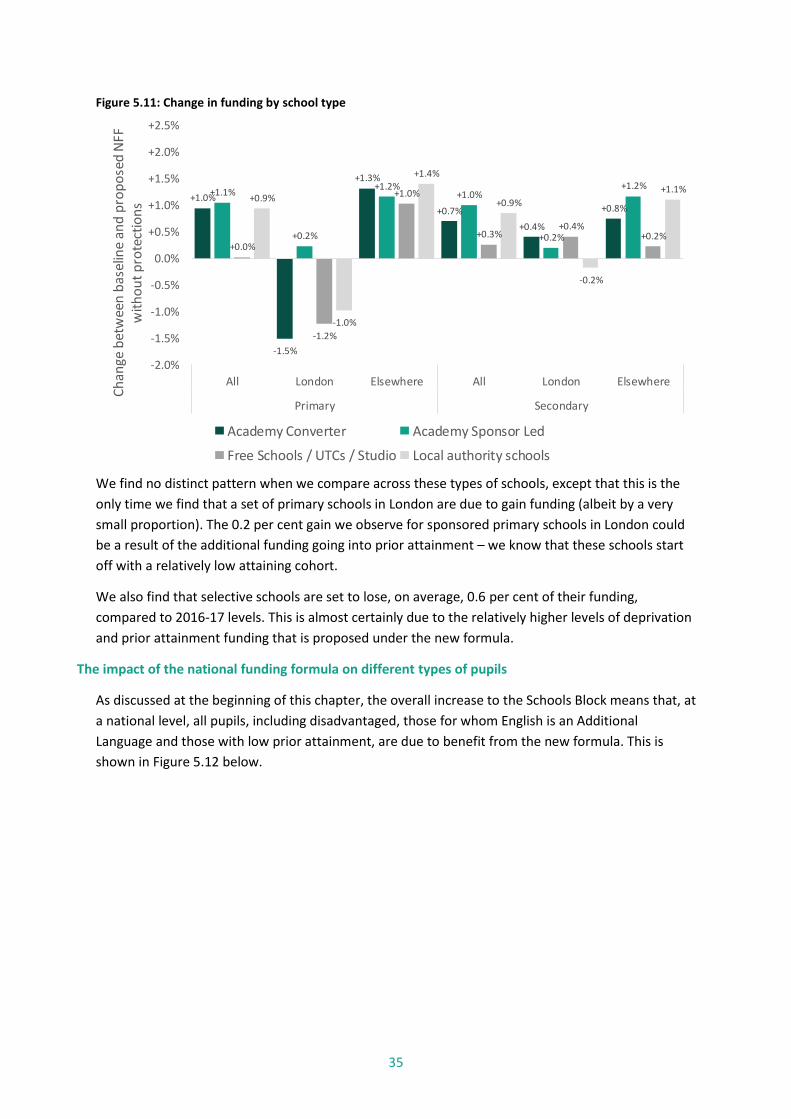
35
Figure 5.11: Change in funding by school type
We find no distinct pattern when we compare across these types of schools, except that this is the
only time we find that a set of primary schools in London are due to gain funding (albeit by a very
small proportion). The 0.2 per cent gain we observe for sponsored primary schools in London could
be a result of the additional funding going into prior attainment – we know that these schools start
off with a relatively low attaining cohort.
We also find that selective schools are set to lose, on average, 0.6 per cent of their funding,
compared to 2016-17 levels. This is almost certainly due to the relatively higher levels of deprivation
and prior attainment funding that is proposed under the new formula.
The impact of the national funding formula on different types of pupils
As discussed at the beginning of this chapter, the overall increase to the Schools Block means that, at
a national level, all pupils, including disadvantaged, those for whom English is an Additional
Language and those with low prior attainment, are due to benefit from the new formula. This is
shown in Figure 5.12 below.
+1.0%
-1.5%
+1.3%
+0.7%
+0.4%
+0.8%
+1.1%
+0.2%
+1.2%+1.0%
+0.2%
+1.2%
+0.0%
-1.2%
+1.0%
+0.3%+0.4%
+0.2%
+0.9%
-1.0%
+1.4%
+0.9%
-0.2%
+1.1%
-2.0%
-1.5%
-1.0%
-0.5%
0.0%
+0.5%
+1.0%
+1.5%
+2.0%
+2.5%
All London Elsewhere All London Elsewhere
Primary Secondary
Ch
ange
bet
wee
n b
asel
ine
and
pro
po
sed
NFF
w
ith
ou
t p
rote
ctio
ns
Academy Converter Academy Sponsor Led
Free Schools / UTCs / Studio Local authority schools
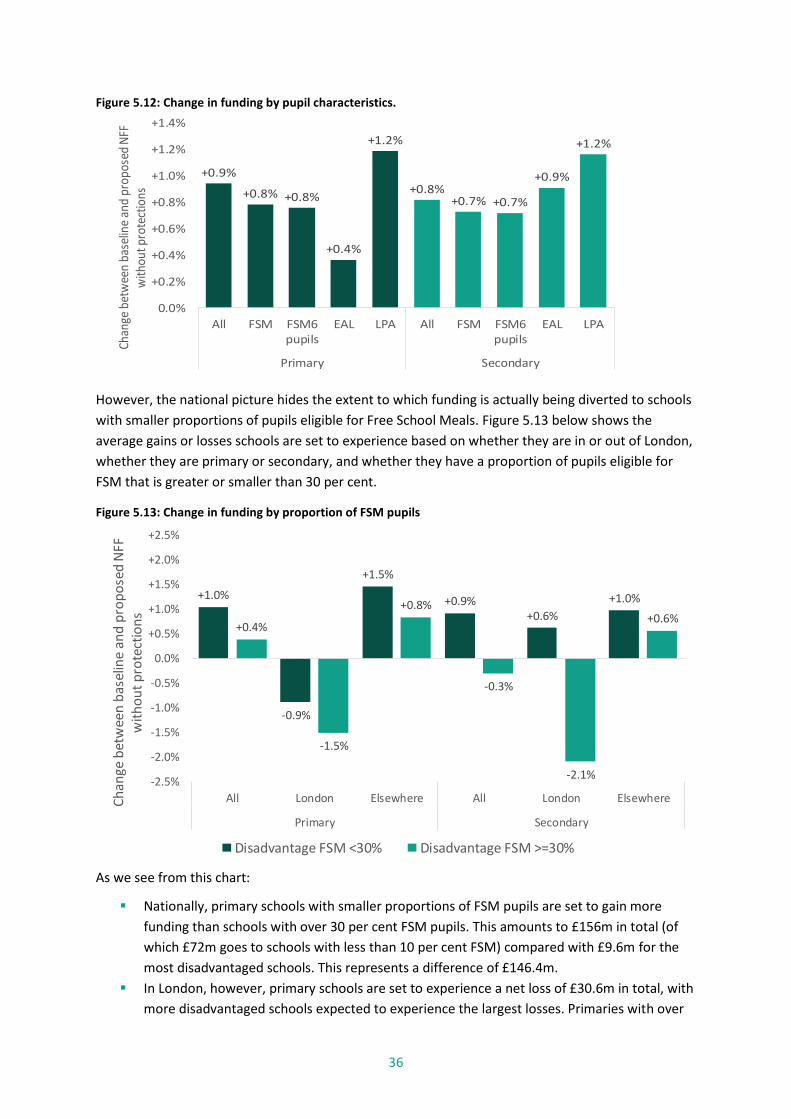
36
Figure 5.12: Change in funding by pupil characteristics.
However, the national picture hides the extent to which funding is actually being diverted to schools
with smaller proportions of pupils eligible for Free School Meals. Figure 5.13 below shows the
average gains or losses schools are set to experience based on whether they are in or out of London,
whether they are primary or secondary, and whether they have a proportion of pupils eligible for
FSM that is greater or smaller than 30 per cent.
Figure 5.13: Change in funding by proportion of FSM pupils
As we see from this chart:
Nationally, primary schools with smaller proportions of FSM pupils are set to gain more
funding than schools with over 30 per cent FSM pupils. This amounts to £156m in total (of
which £72m goes to schools with less than 10 per cent FSM) compared with £9.6m for the
most disadvantaged schools. This represents a difference of £146.4m.
In London, however, primary schools are set to experience a net loss of £30.6m in total, with
more disadvantaged schools expected to experience the largest losses. Primaries with over
+0.9%
+0.8% +0.8%
+0.4%
+1.2%
+0.8%+0.7% +0.7%
+0.9%
+1.2%
0.0%
+0.2%
+0.4%
+0.6%
+0.8%
+1.0%
+1.2%
+1.4%
All FSM FSM6pupils
EAL LPA All FSM FSM6pupils
EAL LPA
Primary Secondary
Chan
ge b
etw
een
base
line
and
prop
osed
NFF
w
ithou
t pro
tect
ions
+1.0%
-0.9%
+1.5%
+0.9%+0.6%
+1.0%
+0.4%
-1.5%
+0.8%
-0.3%
-2.1%
+0.6%
-2.5%
-2.0%
-1.5%
-1.0%
-0.5%
0.0%
+0.5%
+1.0%
+1.5%
+2.0%
+2.5%
All London Elsewhere All London Elsewhere
Primary Secondary
Ch
ange
bet
wee
n b
asel
ine
and
pro
po
sed
NFF
w
ith
ou
t p
rote
ctio
ns
Disadvantage FSM <30% Disadvantage FSM >=30%
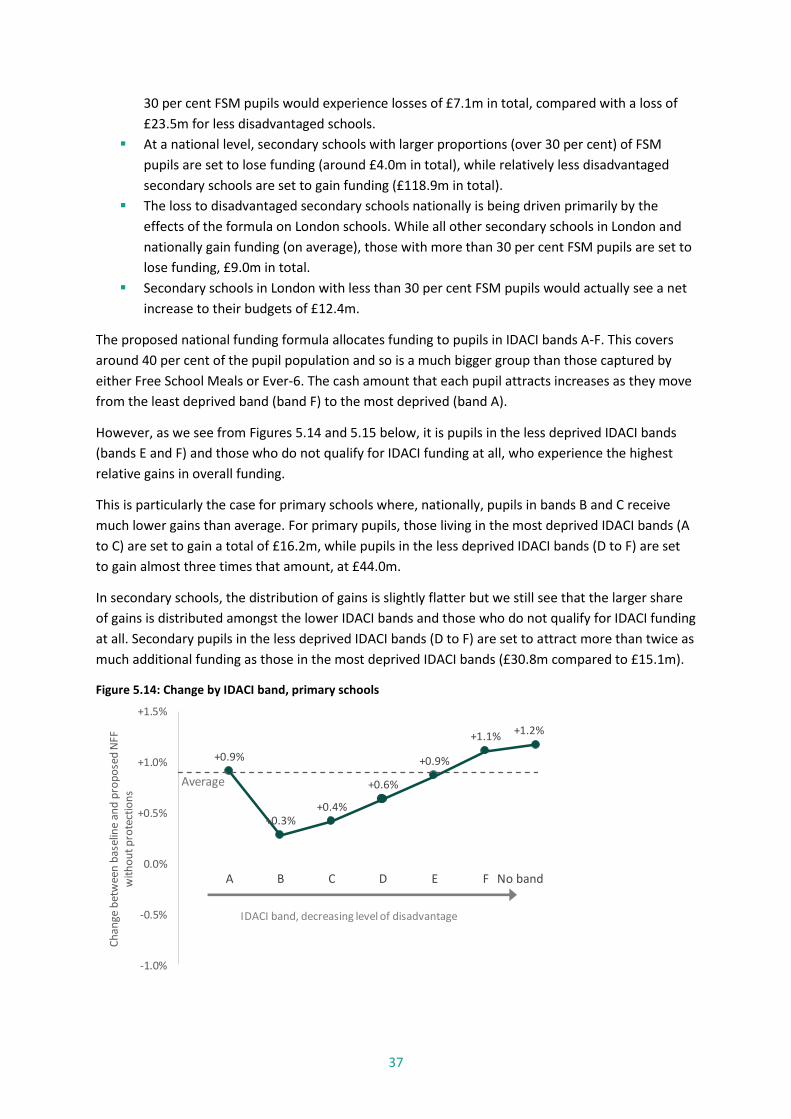
37
30 per cent FSM pupils would experience losses of £7.1m in total, compared with a loss of
£23.5m for less disadvantaged schools.
At a national level, secondary schools with larger proportions (over 30 per cent) of FSM
pupils are set to lose funding (around £4.0m in total), while relatively less disadvantaged
secondary schools are set to gain funding (£118.9m in total).
The loss to disadvantaged secondary schools nationally is being driven primarily by the
effects of the formula on London schools. While all other secondary schools in London and
nationally gain funding (on average), those with more than 30 per cent FSM pupils are set to
lose funding, £9.0m in total.
Secondary schools in London with less than 30 per cent FSM pupils would actually see a net
increase to their budgets of £12.4m.
The proposed national funding formula allocates funding to pupils in IDACI bands A-F. This covers
around 40 per cent of the pupil population and so is a much bigger group than those captured by
either Free School Meals or Ever-6. The cash amount that each pupil attracts increases as they move
from the least deprived band (band F) to the most deprived (band A).
However, as we see from Figures 5.14 and 5.15 below, it is pupils in the less deprived IDACI bands
(bands E and F) and those who do not qualify for IDACI funding at all, who experience the highest
relative gains in overall funding.
This is particularly the case for primary schools where, nationally, pupils in bands B and C receive
much lower gains than average. For primary pupils, those living in the most deprived IDACI bands (A
to C) are set to gain a total of £16.2m, while pupils in the less deprived IDACI bands (D to F) are set
to gain almost three times that amount, at £44.0m.
In secondary schools, the distribution of gains is slightly flatter but we still see that the larger share
of gains is distributed amongst the lower IDACI bands and those who do not qualify for IDACI funding
at all. Secondary pupils in the less deprived IDACI bands (D to F) are set to attract more than twice as
much additional funding as those in the most deprived IDACI bands (£30.8m compared to £15.1m).
Figure 5.14: Change by IDACI band, primary schools
+0.9%
+0.3%+0.4%
+0.6%
+0.9%
+1.1% +1.2%
A B C D E F No band
-1.0%
-0.5%
0.0%
+0.5%
+1.0%
+1.5%
Ch
ange
bet
wee
n b
asel
ine
and
pro
po
sed
NFF
w
ith
ou
t p
rote
ctio
ns
Average
IDACI band, decreasing level of disadvantage
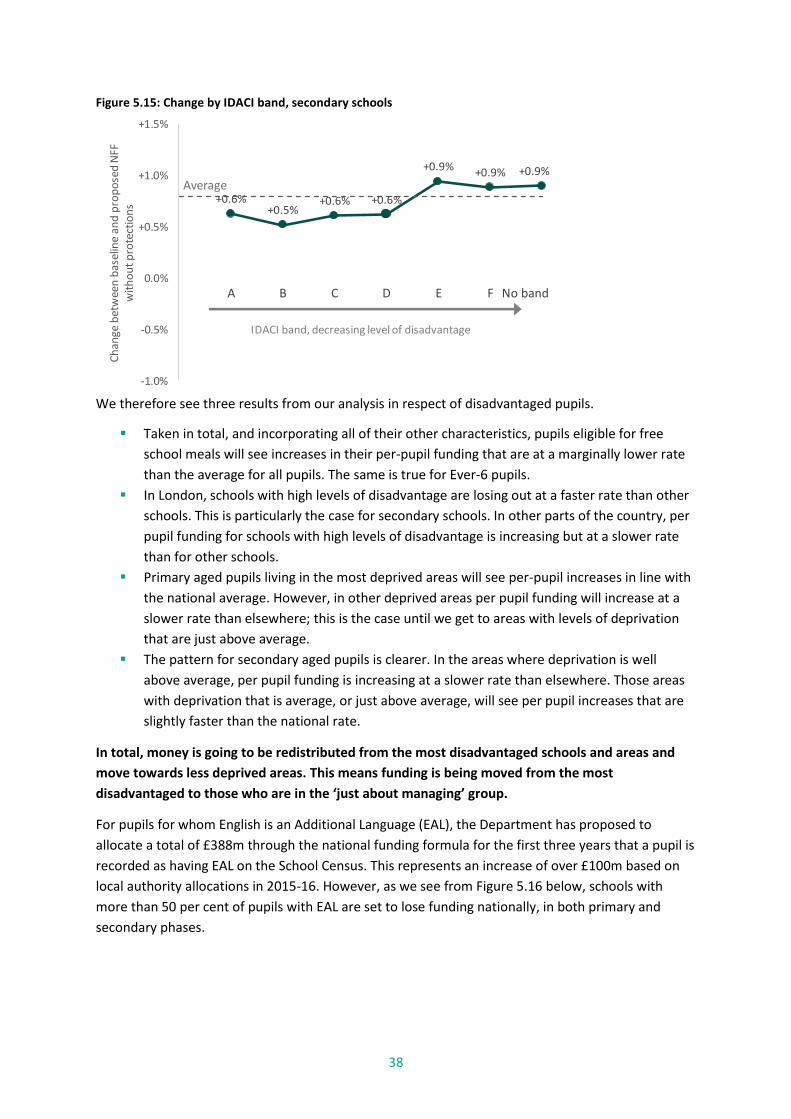
38
Figure 5.15: Change by IDACI band, secondary schools
We therefore see three results from our analysis in respect of disadvantaged pupils.
Taken in total, and incorporating all of their other characteristics, pupils eligible for free
school meals will see increases in their per-pupil funding that are at a marginally lower rate
than the average for all pupils. The same is true for Ever-6 pupils.
In London, schools with high levels of disadvantage are losing out at a faster rate than other
schools. This is particularly the case for secondary schools. In other parts of the country, per
pupil funding for schools with high levels of disadvantage is increasing but at a slower rate
than for other schools.
Primary aged pupils living in the most deprived areas will see per-pupil increases in line with
the national average. However, in other deprived areas per pupil funding will increase at a
slower rate than elsewhere; this is the case until we get to areas with levels of deprivation
that are just above average.
The pattern for secondary aged pupils is clearer. In the areas where deprivation is well
above average, per pupil funding is increasing at a slower rate than elsewhere. Those areas
with deprivation that is average, or just above average, will see per pupil increases that are
slightly faster than the national rate.
In total, money is going to be redistributed from the most disadvantaged schools and areas and
move towards less deprived areas. This means funding is being moved from the most
disadvantaged to those who are in the ‘just about managing’ group.
For pupils for whom English is an Additional Language (EAL), the Department has proposed to
allocate a total of £388m through the national funding formula for the first three years that a pupil is
recorded as having EAL on the School Census. This represents an increase of over £100m based on
local authority allocations in 2015-16. However, as we see from Figure 5.16 below, schools with
more than 50 per cent of pupils with EAL are set to lose funding nationally, in both primary and
secondary phases.
+0.6%+0.5%
+0.6% +0.6%
+0.9% +0.9% +0.9%
A B C D E F No band
-1.0%
-0.5%
0.0%
+0.5%
+1.0%
+1.5%C
han
ge b
etw
een
bas
elin
e an
d p
rop
ose
d N
FF
wit
ho
ut
pro
tect
ion
s
Average
IDACI band, decreasing level of disadvantage
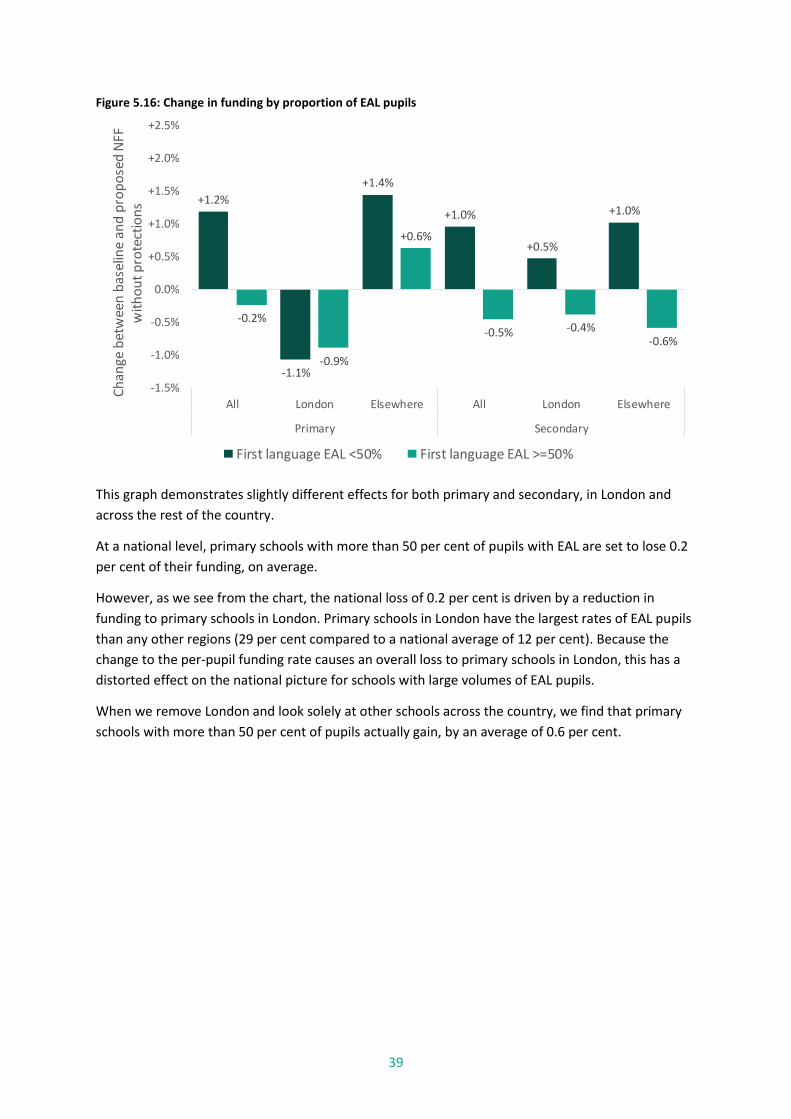
39
Figure 5.16: Change in funding by proportion of EAL pupils
This graph demonstrates slightly different effects for both primary and secondary, in London and
across the rest of the country.
At a national level, primary schools with more than 50 per cent of pupils with EAL are set to lose 0.2
per cent of their funding, on average.
However, as we see from the chart, the national loss of 0.2 per cent is driven by a reduction in
funding to primary schools in London. Primary schools in London have the largest rates of EAL pupils
than any other regions (29 per cent compared to a national average of 12 per cent). Because the
change to the per-pupil funding rate causes an overall loss to primary schools in London, this has a
distorted effect on the national picture for schools with large volumes of EAL pupils.
When we remove London and look solely at other schools across the country, we find that primary
schools with more than 50 per cent of pupils actually gain, by an average of 0.6 per cent.
+1.2%
-1.1%
+1.4%
+1.0%
+0.5%
+1.0%
-0.2%
-0.9%
+0.6%
-0.5% -0.4%-0.6%
-1.5%
-1.0%
-0.5%
0.0%
+0.5%
+1.0%
+1.5%
+2.0%
+2.5%
All London Elsewhere All London Elsewhere
Primary Secondary
Ch
ange
bet
wee
n b
asel
ine
and
pro
po
sed
NFF
w
ith
ou
t p
rote
ctio
ns
First language EAL <50% First language EAL >=50%
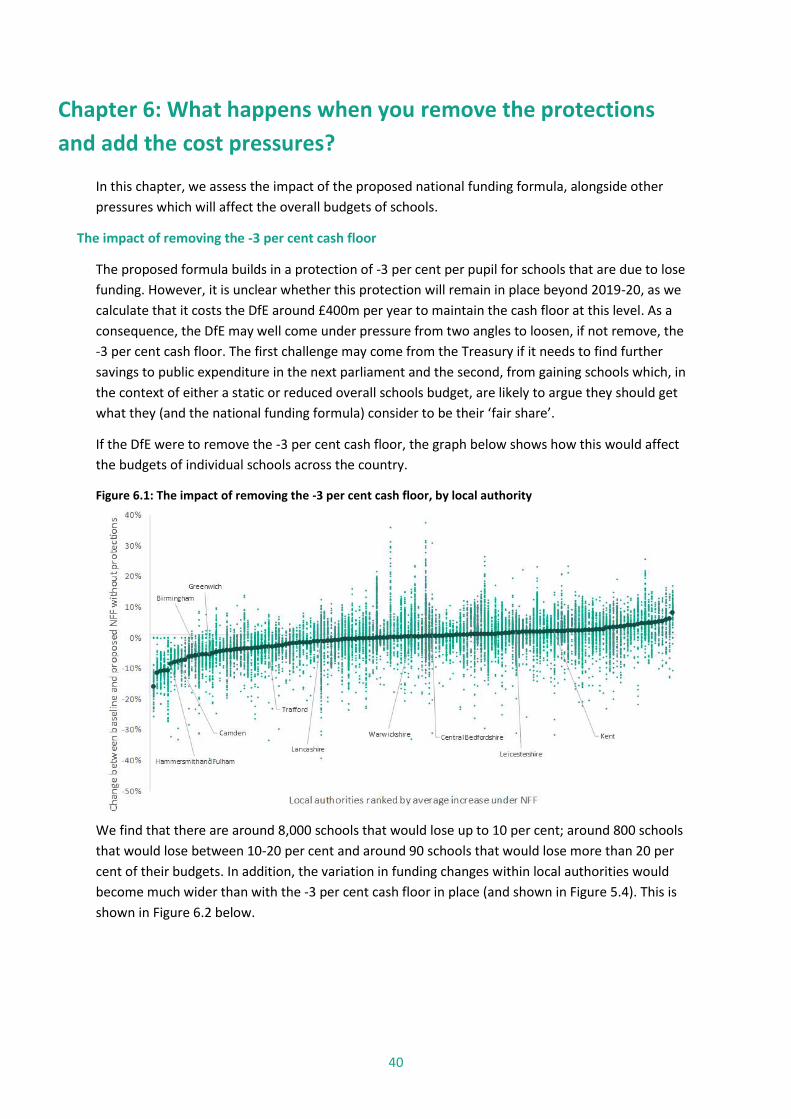
40
Chapter 6: What happens when you remove the protections
and add the cost pressures?
In this chapter, we assess the impact of the proposed national funding formula, alongside other
pressures which will affect the overall budgets of schools.
The impact of removing the -3 per cent cash floor
The proposed formula builds in a protection of -3 per cent per pupil for schools that are due to lose
funding. However, it is unclear whether this protection will remain in place beyond 2019-20, as we
calculate that it costs the DfE around £400m per year to maintain the cash floor at this level. As a
consequence, the DfE may well come under pressure from two angles to loosen, if not remove, the
-3 per cent cash floor. The first challenge may come from the Treasury if it needs to find further
savings to public expenditure in the next parliament and the second, from gaining schools which, in
the context of either a static or reduced overall schools budget, are likely to argue they should get
what they (and the national funding formula) consider to be their ‘fair share’.
If the DfE were to remove the -3 per cent cash floor, the graph below shows how this would affect
the budgets of individual schools across the country.
Figure 6.1: The impact of removing the -3 per cent cash floor, by local authority
We find that there are around 8,000 schools that would lose up to 10 per cent; around 800 schools
that would lose between 10-20 per cent and around 90 schools that would lose more than 20 per
cent of their budgets. In addition, the variation in funding changes within local authorities would
become much wider than with the -3 per cent cash floor in place (and shown in Figure 5.4). This is
shown in Figure 6.2 below.
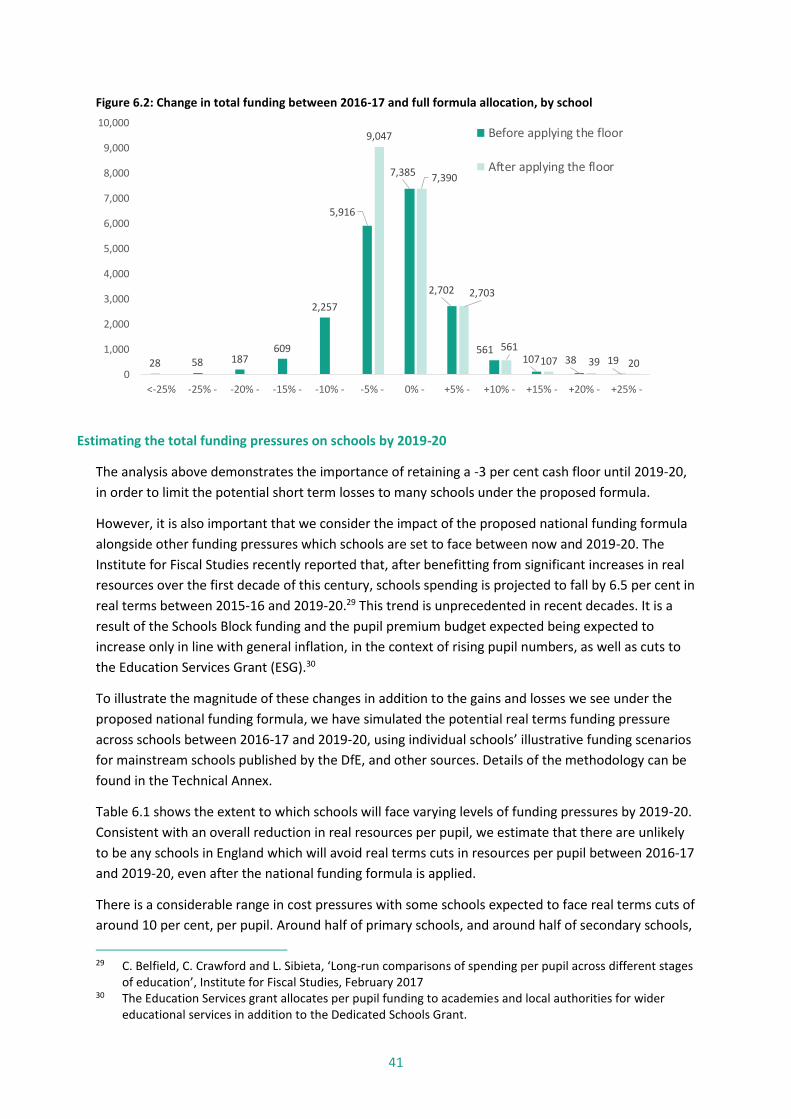
41
Figure 6.2: Change in total funding between 2016-17 and full formula allocation, by school
Estimating the total funding pressures on schools by 2019-20
The analysis above demonstrates the importance of retaining a -3 per cent cash floor until 2019-20,
in order to limit the potential short term losses to many schools under the proposed formula.
However, it is also important that we consider the impact of the proposed national funding formula
alongside other funding pressures which schools are set to face between now and 2019-20. The
Institute for Fiscal Studies recently reported that, after benefitting from significant increases in real
resources over the first decade of this century, schools spending is projected to fall by 6.5 per cent in
real terms between 2015-16 and 2019-20.29 This trend is unprecedented in recent decades. It is a
result of the Schools Block funding and the pupil premium budget expected being expected to
increase only in line with general inflation, in the context of rising pupil numbers, as well as cuts to
the Education Services Grant (ESG).30
To illustrate the magnitude of these changes in addition to the gains and losses we see under the
proposed national funding formula, we have simulated the potential real terms funding pressure
across schools between 2016-17 and 2019-20, using individual schools’ illustrative funding scenarios
for mainstream schools published by the DfE, and other sources. Details of the methodology can be
found in the Technical Annex.
Table 6.1 shows the extent to which schools will face varying levels of funding pressures by 2019-20.
Consistent with an overall reduction in real resources per pupil, we estimate that there are unlikely
to be any schools in England which will avoid real terms cuts in resources per pupil between 2016-17
and 2019-20, even after the national funding formula is applied.
There is a considerable range in cost pressures with some schools expected to face real terms cuts of
around 10 per cent, per pupil. Around half of primary schools, and around half of secondary schools,
29 C. Belfield, C. Crawford and L. Sibieta, ‘Long-run comparisons of spending per pupil across different stages
of education’, Institute for Fiscal Studies, February 2017 30 The Education Services grant allocates per pupil funding to academies and local authorities for wider
educational services in addition to the Dedicated Schools Grant.
28 58 187609
2,257
5,916
7,385
2,702
561107 38 19
9,047
7,390
2,703
561
107 39 200
1,000
2,000
3,000
4,000
5,000
6,000
7,000
8,000
9,000
10,000
<-25% -25% - -20% - -15% - -10% - -5% - 0% - +5% - +10% - +15% - +20% - +25% -
Before applying the floor
After applying the floor
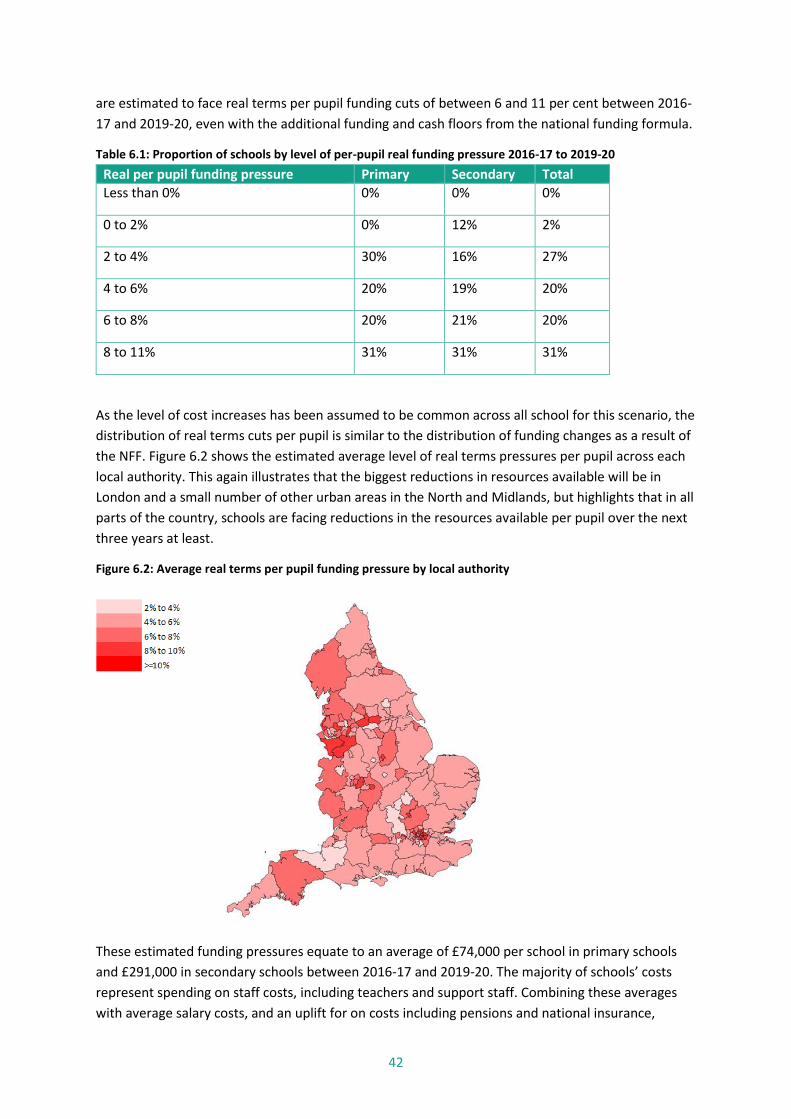
42
are estimated to face real terms per pupil funding cuts of between 6 and 11 per cent between 2016-
17 and 2019-20, even with the additional funding and cash floors from the national funding formula.
Table 6.1: Proportion of schools by level of per-pupil real funding pressure 2016-17 to 2019-20
Real per pupil funding pressure Primary Secondary Total
Less than 0% 0% 0% 0%
0 to 2% 0% 12% 2%
2 to 4% 30% 16% 27%
4 to 6% 20% 19% 20%
6 to 8% 20% 21% 20%
8 to 11% 31% 31% 31%
As the level of cost increases has been assumed to be common across all school for this scenario, the
distribution of real terms cuts per pupil is similar to the distribution of funding changes as a result of
the NFF. Figure 6.2 shows the estimated average level of real terms pressures per pupil across each
local authority. This again illustrates that the biggest reductions in resources available will be in
London and a small number of other urban areas in the North and Midlands, but highlights that in all
parts of the country, schools are facing reductions in the resources available per pupil over the next
three years at least.
Figure 6.2: Average real terms per pupil funding pressure by local authority
These estimated funding pressures equate to an average of £74,000 per school in primary schools
and £291,000 in secondary schools between 2016-17 and 2019-20. The majority of schools’ costs
represent spending on staff costs, including teachers and support staff. Combining these averages
with average salary costs, and an uplift for on costs including pensions and national insurance,
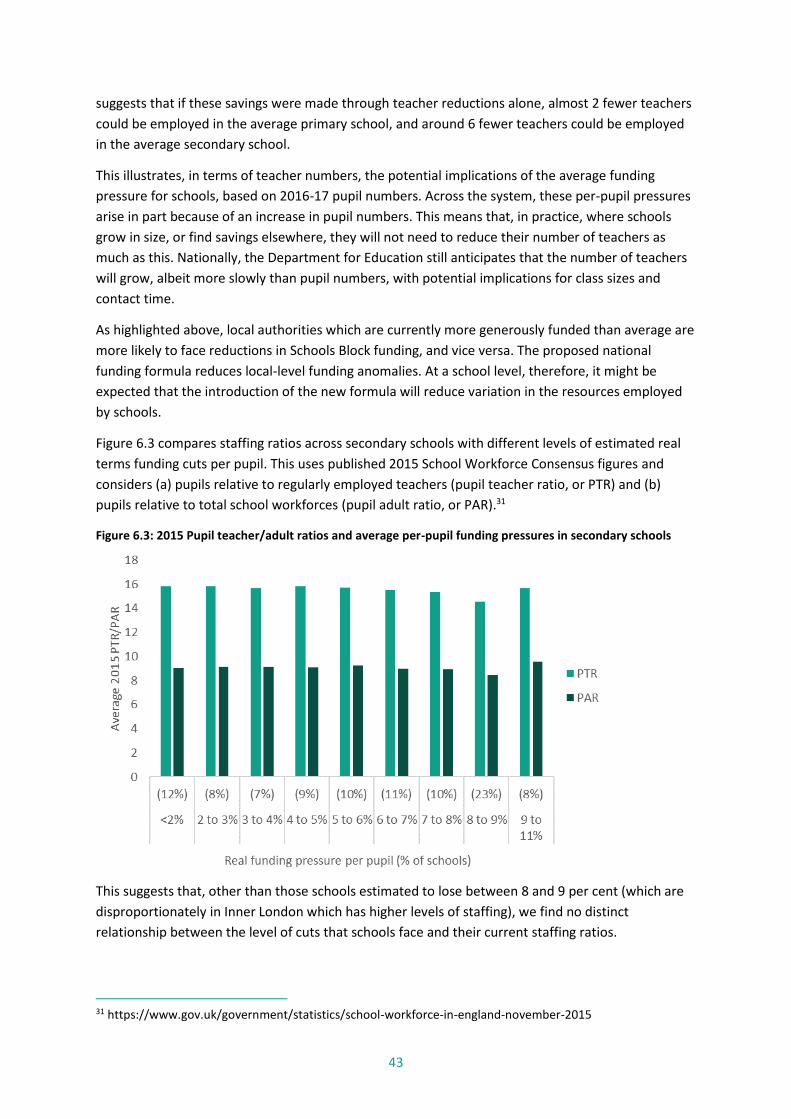
43
suggests that if these savings were made through teacher reductions alone, almost 2 fewer teachers
could be employed in the average primary school, and around 6 fewer teachers could be employed
in the average secondary school.
This illustrates, in terms of teacher numbers, the potential implications of the average funding
pressure for schools, based on 2016-17 pupil numbers. Across the system, these per-pupil pressures
arise in part because of an increase in pupil numbers. This means that, in practice, where schools
grow in size, or find savings elsewhere, they will not need to reduce their number of teachers as
much as this. Nationally, the Department for Education still anticipates that the number of teachers
will grow, albeit more slowly than pupil numbers, with potential implications for class sizes and
contact time.
As highlighted above, local authorities which are currently more generously funded than average are
more likely to face reductions in Schools Block funding, and vice versa. The proposed national
funding formula reduces local-level funding anomalies. At a school level, therefore, it might be
expected that the introduction of the new formula will reduce variation in the resources employed
by schools.
Figure 6.3 compares staffing ratios across secondary schools with different levels of estimated real
terms funding cuts per pupil. This uses published 2015 School Workforce Consensus figures and
considers (a) pupils relative to regularly employed teachers (pupil teacher ratio, or PTR) and (b)
pupils relative to total school workforces (pupil adult ratio, or PAR).31
Figure 6.3: 2015 Pupil teacher/adult ratios and average per-pupil funding pressures in secondary schools
This suggests that, other than those schools estimated to lose between 8 and 9 per cent (which are
disproportionately in Inner London which has higher levels of staffing), we find no distinct
relationship between the level of cuts that schools face and their current staffing ratios.
31 https://www.gov.uk/government/statistics/school-workforce-in-england-november-2015
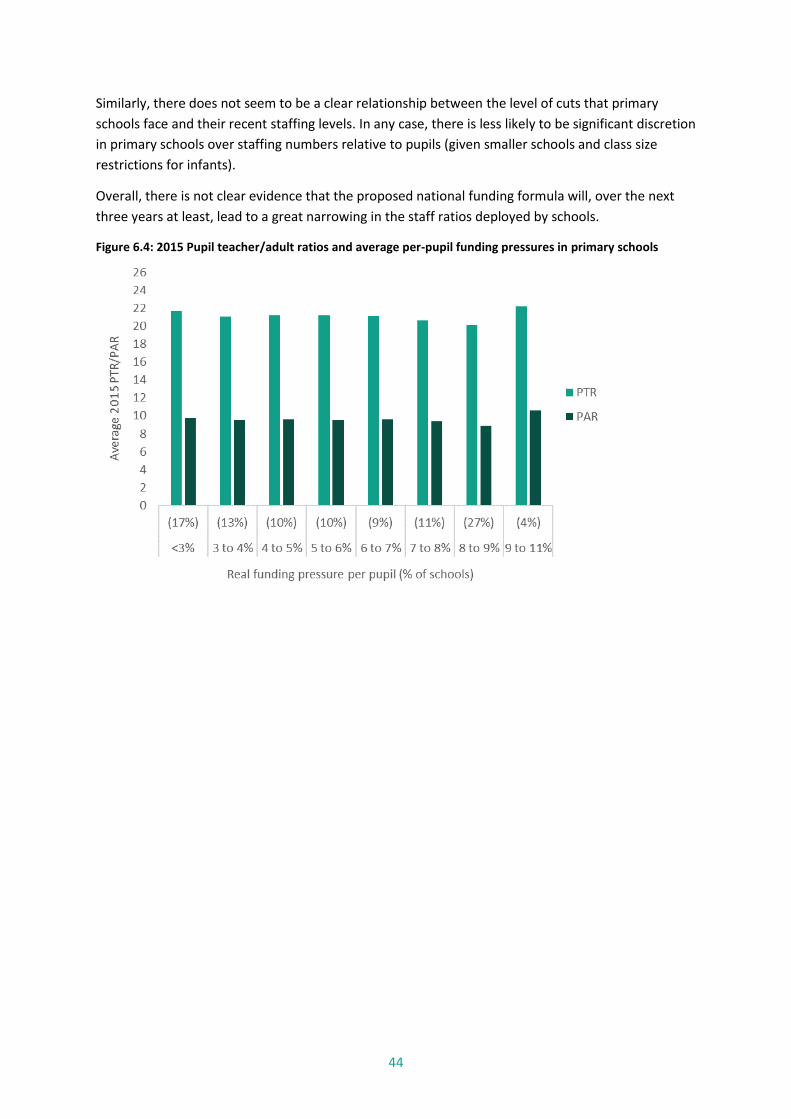
44
Similarly, there does not seem to be a clear relationship between the level of cuts that primary
schools face and their recent staffing levels. In any case, there is less likely to be significant discretion
in primary schools over staffing numbers relative to pupils (given smaller schools and class size
restrictions for infants).
Overall, there is not clear evidence that the proposed national funding formula will, over the next
three years at least, lead to a great narrowing in the staff ratios deployed by schools.
Figure 6.4: 2015 Pupil teacher/adult ratios and average per-pupil funding pressures in primary schools

45
Conclusions and challenges for government
The principle of introducing a new national funding formula, in which schools across the country are
funded on a consistent and transparent basis, is rational. However, while the current government
has gone further than any other in attempting to address the historic anomalies of the school
funding system, there are still a number of areas in which greater clarity, evidence and certainty is
required.
First, the DfE has made a number of decisions which are not supported (one way or another) by
empirical evidence. While, as we discuss in Chapter 3, it is difficult to generate the cost of running a
school or of bringing different pupils up to a desired level, there are relative judgements in relation
to the balance of deprivation funding between primary and secondary schools in which the DfE has
an unclear and inconsistent position. The lack of an evidence-based approach is also apparent in the
DfE’s proposals to fund small schools through a combination of a lump sum and sparsity weighting.
The quantum of the lump sum, £110,000, has no basis in evidence and the DfE has not commented
on why the same lump sum is applied to both primary and secondary schools.
In addition, while the Department proposes to increase the total amounts targeted to deprivation
and pupils with English as an Additional Language (EAL), relative to the amount which local
authorities explicitly allocated through their local formulae in 2016-17, we find that the
redistribution of the basic entitlement, increases to the weighting of prior attainment and the use of
wider area based deprivation measures, means that the most disadvantaged schools and those with
the highest proportions of EAL pupils are set, on average, to lose funding in London, and gain
proportionately less in areas outside of London.
In the short term, the Department considers that it has protected schools from experiencing
unmanageable reductions through the -3 per cent per pupil cash floor. In reality, our analysis finds
that the combination of funding decisions, including the impact of increases to inflation, pupil
numbers and pension costs, means that there are unlikely to be any schools which will not face real
term cuts by 2019-20. We estimate that this is likely to mean the average primary school will need to
save the equivalent of almost 2 teachers, and the average secondary school the equivalent of
around 6 teachers.
Finally, the Department should be clearer about the trajectory beyond 2019-20. Schools that are set
to gain more than 5.5 per cent should have some indication about how long it is likely to take before
they are on their full formula allocation. Similarly, schools that are due to see further reductions (if
the -3 per cent cash floor is loosened or removed) should have as much time as possible in order to
plan to make savings so that there is minimal impact on teaching and learning.
If the Department does not remove the -3 per cent floor and move gaining schools up to their
formula amount, it must accept that different schools with similar pupils will continue to be funded
at different levels. The introduction of a new national funding formula can only create a consistent
and transparent system if it is fully implemented and not just a vehicle for setting notional budgets.
46
Technical Annex
Method for estimating the proposed national funding formula
Estimates for the impact on different school and pupil types are derived by linking published
illustrative allocations with school and pupil characteristics data.
Impact by school characteristics
The analysis in this report includes a range of school characteristics taken from a range of sources.
These are:
Characteristic Source and further information
School size Pupil count as recorded in the January 2016 School Census. Small is defined as <100 pupils in a
primary school and <400 pupils in a secondary school. Where schools have changed URN since
the School Census (e.g. if they have become an academy) data from the predecessor school has
been used.
Rural / Urban Rural / urban classification as recorded in Edubase (as at January 2017).
School
performance
Performance as reported in the School Performance Tables 2016 (published December 2016 for
primary and January 2017 for secondary).
Performance at primary level is defined using the proportion of pupils achieving the expected
standard in reading, writing and mathematics. Performance at secondary level is defined using
Progress 8.
Schools with no performance data are excluded from the analysis. This includes infant schools,
middle schools not covering Key Stage 2 and any other school with results not reported (for
example where results were suppressed in the performance tables.
Where schools have changed URN since September 2015 (i.e. where results were published
against the predecessor school) results have been matched back to predecessor school.
School type The school type as recorded in Edubase as at January 2017.
Proportion of
FSM pupils
Proportion of pupils known to be eligible for free school meals as recorded in the January 2016
school census. Where schools have changed URN since the School Census (e.g. if they have
become an academy) data from the predecessor school has been used.
Proportion of
EAL pupils
Proportion of pupils whose first language is known, or believed, to be other than English as
recorded in the January 2016 school census. Where schools have changed URN since the School
Census (e.g. if they have become an academy) data from the predecessor school has been used.
This information is linked to the published school baseline funding and illustrative allocations under
the NFF. The impact of the NFF on each school characteristic is calculated by summing the baseline
data for all schools with that that characteristic and summing the illustrative allocation for all schools
with that characteristic and calculating the percentage change between the two. As the underlying
pupil numbers are assumed to be the same in the baseline and the allocation this reflects changes in
both the total and per pupil amounts.
Further information:
School Census data is available from the publication ‘Schools, pupils and their
characteristics: January 2016’: https://www.gov.uk/government/statistics/schools-pupils-
and-their-characteristics-january-2016
Edubase data is available from: http://www.education.gov.uk/edubase/home.xhtml
47
School Performance Tables are available from: https://www.compare-school-
performance.service.gov.uk/
Impact by pupil characteristics
This analysis is made possible by the provision of underlying pupil counts for each characteristic
provided by the Department for Education. This data includes the number of:
Pupils (split primary, Key Stage 3 and Key Stage 4)
Pupils eligible for free school meals (split primary / secondary)
Pupils eligible for free school meals in any of the last 6 years (split primary / secondary)
Pupils in each IDACI band (split primary / secondary)
Pupils whose first language is known, or believed, to be other than English (split primary /
secondary)
Pupils with low prior attainment (split primary / secondary).
Using the overall pupil numbers and the published baseline and illustrative allocations we calculate a
per pupil amount for each school in the baseline and under the NFF. We then:
Assume that within a school each pupil attracts this same per pupil funding and multiply the
per pupil amounts by the number of pupils with each characteristic within the school.
Aggregate those totals across all schools to get the total amount of funding that pupils with
each characteristic attract (e.g. we calculate the total pot of money in the baseline and
under the NFF for pupils eligible for free school meals).
We are then able to examine the change in overall funding for each characteristic by comparing the
totals under the baseline and under the NFF.
Note that this is not the premium that a particular pupil attracts for having that characteristic, these
are given by the funding formula, it is instead the total amount of money that pupils with those
characteristics attract. This is important as, for example, pupils from disadvantaged backgrounds are
more likely to also attract low prior attainment funding and funding for living in a deprived area.
Removing the 3 per cent floor
This is made possible by the supply of data from the Department for Education that gives the
additional funding, per pupil, that is applied to an individual school to lift them to the 3 per cent
floor. This is multiplied by the adjusted pupil counts to give the total additional funding given to each
school and then subtracted from the illustrative allocation to give an illustrative allocation without
the floor.
Impact at parliamentary constituency level
This is calculated by linking the school level baseline and illustrative allocations data with the
parliamentary constituency information for each school recorded in Edubase. Constituency level
statistics are the aggregation of school level baseline and illustrative allocations.
Method for estimating the 2019-20 cost pressures
We used the following approach and assumptions:
48
Baseline schools block per-pupil funding is calculated for each school in the consultation
dataset for 2016-17, using the pupil counts published from the APT for maintained schools
and GAG for academies, taking into account MFG (consistent with the measure of baseline
funding the Department uses in its analysis).
To this, where schools can be matched to published allocations data, pupil premium
allocations for 2016-17 are added, using a per-pupil figure for each school.32 The amount is
reduced proportionately for schools that are recorded as open for only part of the year in
2016-17 in the NFF dataset.
For academies, where schools can be matched to published allocations, ESG allocations for
2016-17 are added, using a per-pupil figure for each school.33 For maintained schools, the
funding rate for 2016-17 of £77 per pupil is used.34 The amount is reduced proportionately
for schools that are recorded as open for only part of the year in 2016-17 in the NFF dataset.
ESG for retained duties (funded at £15 per pupil) is being moved into the central schools
block rather than cuts in current proposals, and this is excluded from the analysis.
For comparison against 2016-17, per pupil NFF funding in 2019-20 is estimated by taking the
published pupil and school-led funding for each school, maintaining the 3 per cent funding
floor, but modelling a 5.5 per cent limit to funding increases in line with the proposals on
protections. Premises factors are added back in to these totals. This implicitly assumes that
the minimum funding guarantee of 1.5 per cent applied over three years does not create an
additional floor on losses. In practice, if schools’ pupil characteristics change between now
and 2019-20 this may not be the case, and some schools may therefore face slightly smaller
losses than those assumed here. At the same time, with baselines for subsequent years
expected to be set in 2017-18, some schools may see bigger increases in NFF funding from
2016-17 levels than those modelled here. As such, whilst the overall distribution of funding
pressures modelled here is informative, individual school estimates are not and are
therefore not reported.
2019-20 Pupil Premium funding is estimated for each school by applying a universal uplift to
each school’s 2016-17 per-pupil figure. This uplift is calculated by comparing the
government’s commitment to protect the budget in real terms and the expected growth in
total pupil numbers.35
32 https://www.gov.uk/government/publications/pupil-premium-conditions-of-grant-2016-to-2017
Per-pupil amounts take into account all pupils in the school, not just those eligible for the pupil premium (so that no assumptions on changes in pupil characteristics are required), and are calculated using the pupil counts in the pupil premium dataset.
33 https://www.gov.uk/government/publications/schools-block-funding-allocations-2016-to-2017 Per-pupil amounts are calculated using the pupil counts in the schools block dataset.
34 Actual ESG will have differed across schools in practice with transitional protections for cuts to 2016-17, but the averages across LAs will be consistent with actual funding allocations.
35 https://www.gov.uk/government/publications/spending-review-and-autumn-statement-2015-documents, https://www.gov.uk/government/statistics/national-pupil-projections-july-2016
49
General ESG is reduced to zero in 2019-20, in line with current policy.36
The National Audit Office recently reported DfE estimates showing cumulative cost
pressures of 3.4 per cent in 2016-17, rising to 8.7 per cent in 2019-20. This implies cost
pressures of 5.1 per cent between 2016-17 and 2019-20, and this rate of inflation is applied
to all schools.37
44 schools who had negative reported baseline premises funding in the DfE data have been
excluded from the analysis as their 2016-17 funding is likely to have reflected one-off
adjustments, making it difficult to infer future funding pressures.
Pupil teacher ratios are matched to schools in the NFF consultation dataset from the
underlying data from the 2015 School Workforce Census published by the Department for
Education, where schools are found in both.38 These data include some schools where the
relevant staff information was not provided or has been suppressed, and these are excluded
from the analysis of staffing levels and funding. Pupil adult ratios are inferred from the
workforce data, taking into account the total school workforce reported in each school
rather than the more limited coverage of staff types used in the DfE’s published statistics on
this measure.
Teacher numbers equivalent to average real terms cuts are estimated using the average
teacher salaries for maintained primary/nursery schools and maintained secondary schools
reported in the School Workforce Census 2015, assuming on costs of 25% of salaries.39
As should be clear from this description, several assumptions are used which mean that individual
school level cost pressures will not match those estimated here. Schools will use different inputs in
different proportions, and whilst a single rate of inflation affecting schools has been assumed here,
in practice these varying inputs will be subject to different rates of inflation at a local level.40
However, the analysis provides an illustration of the potential variation in real terms cost pressures
using the best available evidence of the changes likely to affect most schools.
36 https://www.gov.uk/government/speeches/school-revenue-funding-settlement-for-2017-to-2018 37 National Audit Office, ‘Financial sustainability of schools’, December 2016 38 https://www.gov.uk/government/statistics/school-workforce-in-england-november-2015 39 https://www.gov.uk/government/statistics/school-workforce-in-england-november-2015 40 Most importantly, 70 to 80% of schools’ costs tend to be attributed to staff costs, but expenditure data
suggest there is some variation. As the IFS have noted (C. Belfield, C. Crawford and L. Sibieta, ‘Long-run comparisons of spending per pupil across different stages of education’, February 2017, p.18), continued wage restraint for teachers means that in practice schools may on average face similar cost pressures to other employers after 2016-17 (after teacher pension changes have taken effect). This also means that differences between the average inflation rates faced by schools with different proportions of costs attributable to staffing may be less significant than in recent years.
1