About Our Precinct Numbers! - Leon County, Florida and Demographics... · Leon County Florida 2006...
1
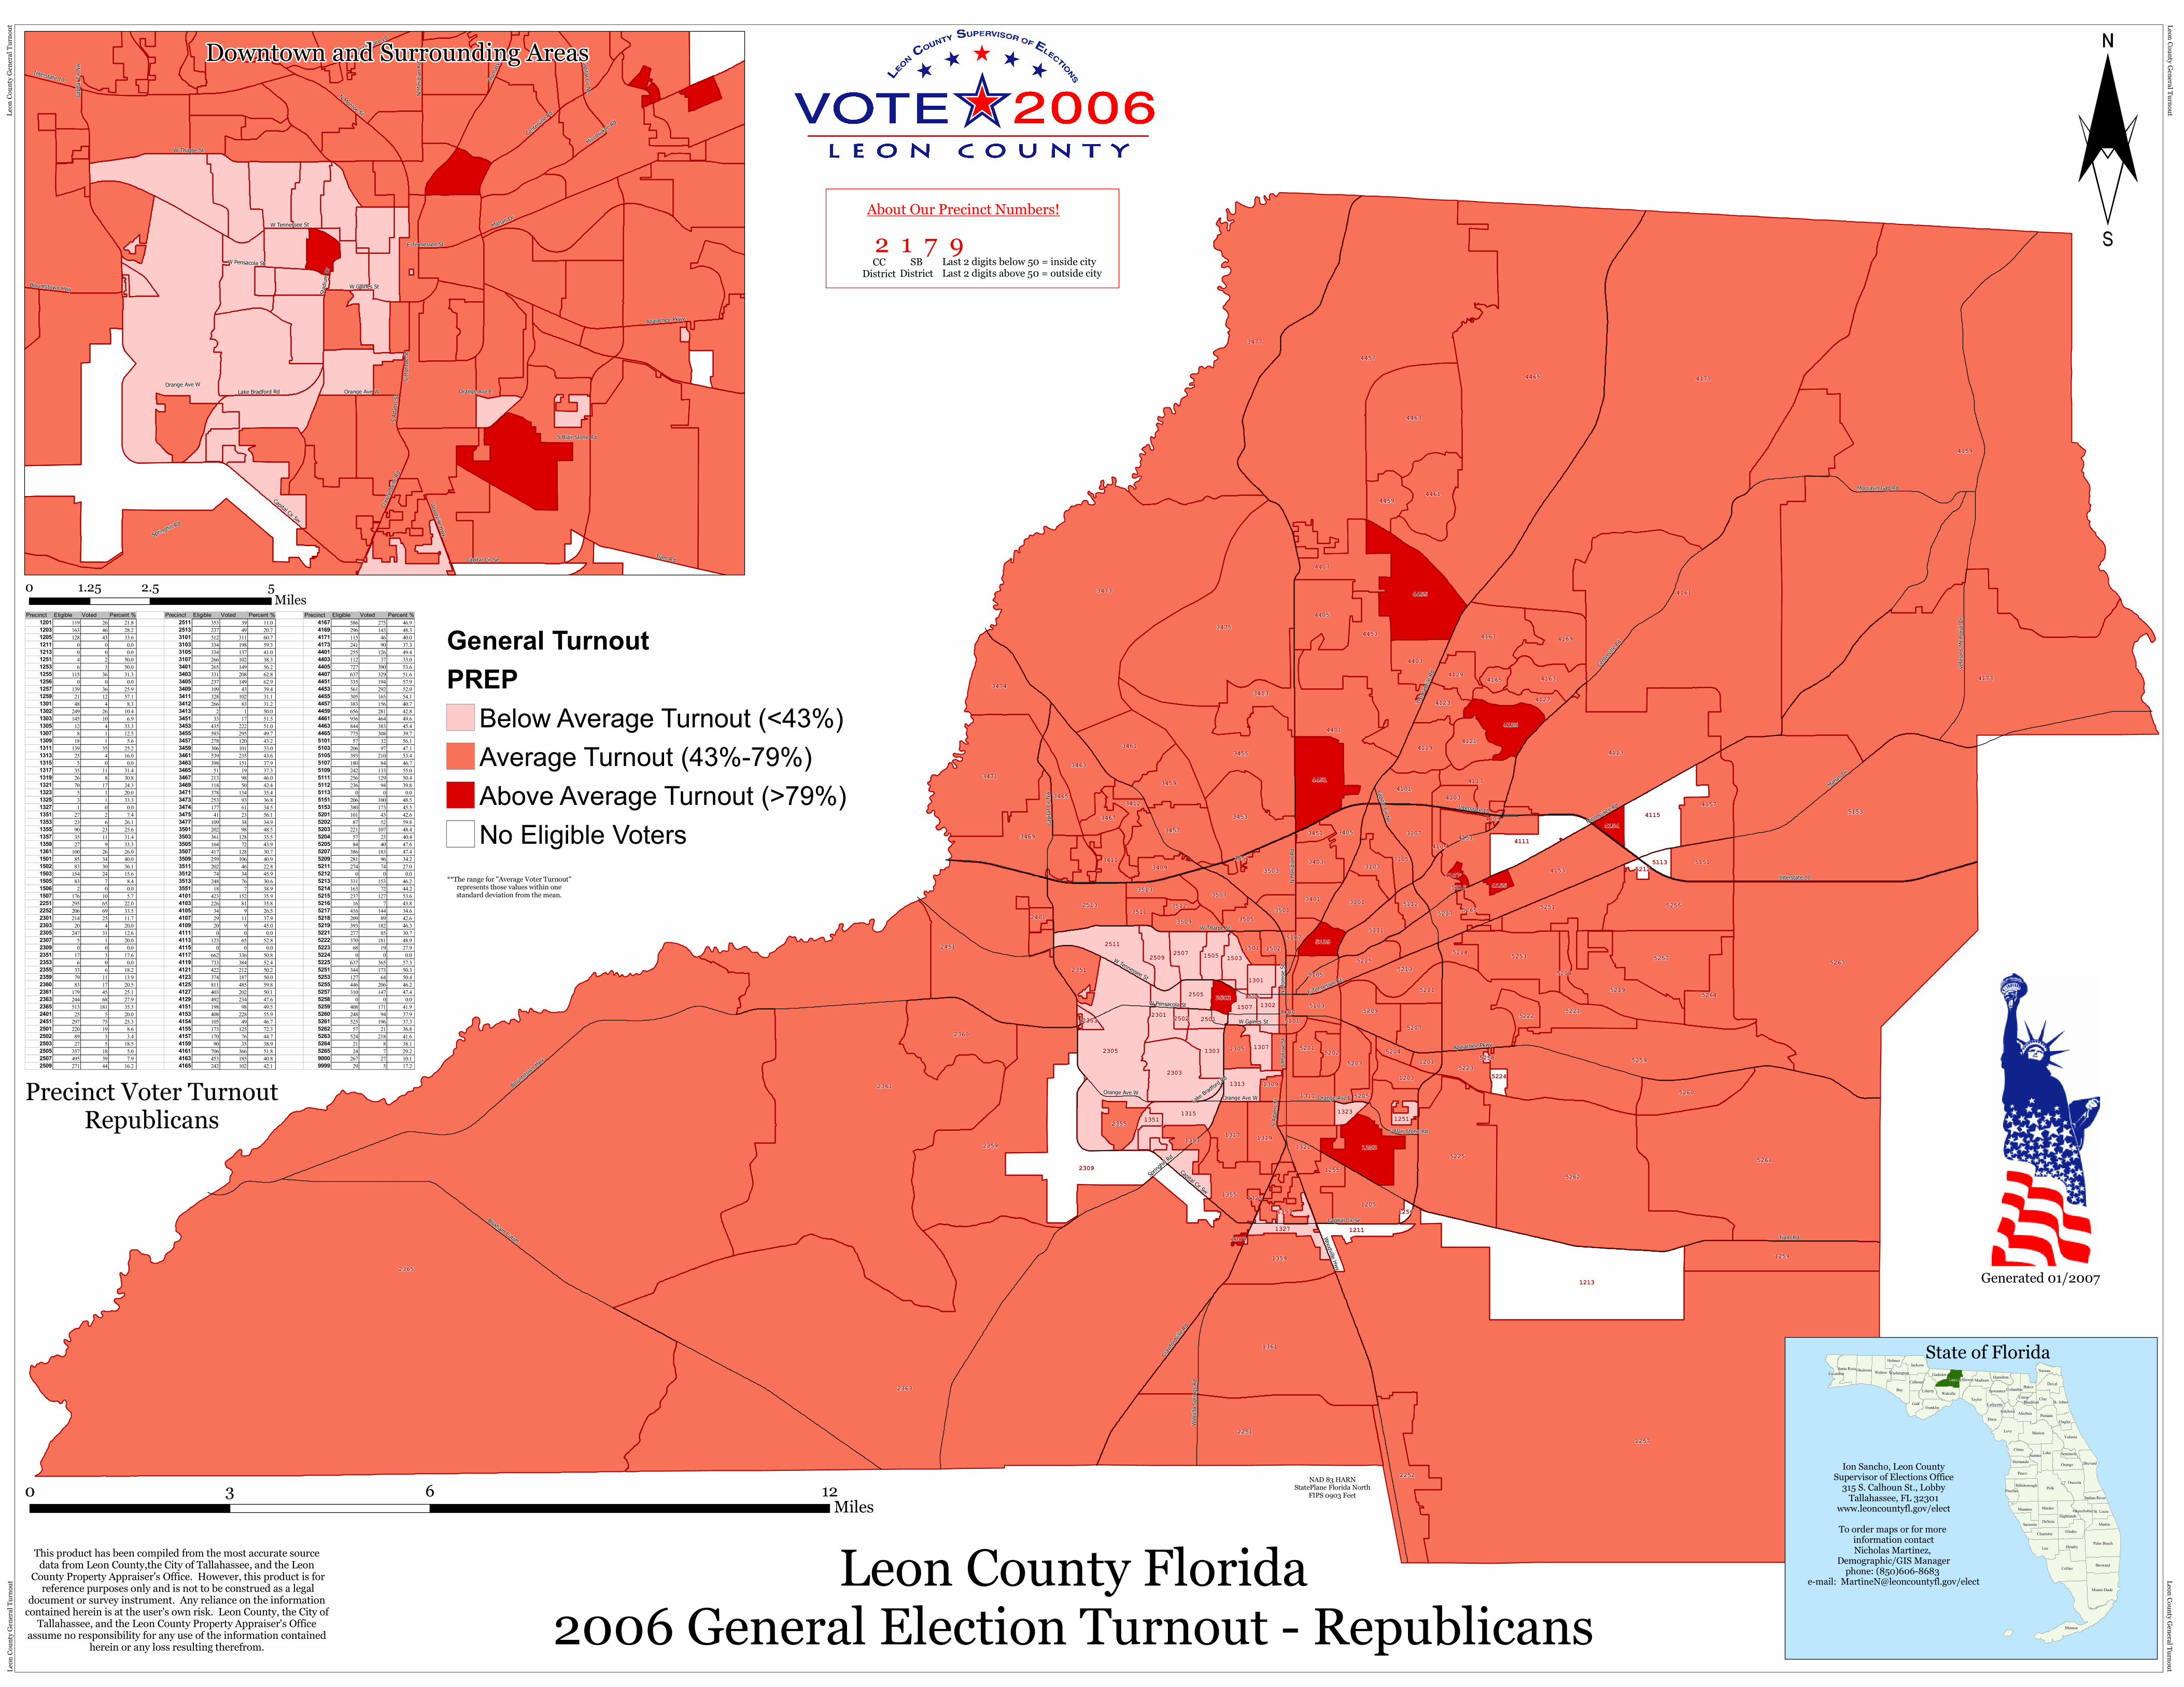
2365 1257 2363 4159 4171 2361 4465 4457 4161 4173 5263 3473 5153 5261 3477 5262 1361 3475 4113 2251 2451 5259 2359 1213 3471 2309 2305 5225 3455 4463 5221 4453 4401 4455 1205 4153 5257 5255 3469 2360 1259 2252 5219 3453 3474 3457 5253 3461 5251 4151 4167 4115 4451 1359 4405 4407 5217 4461 4157 2303 3463 2513 5260 1315 1253 3503 4169 1311 3459 5264 3413 1355 2511 4111 4125 5209 3107 5151 4117 3101 1321 4119 4163 3411 1319 4403 5203 5213 5207 1317 4101 3105 5111 3403 4459 4121 3465 1255 3507 2351 3405 5223 5201 5105 2301 2509 1211 1327 4129 2507 2355 4123 5215 1303 1313 3103 5103 3509 4127 3513 5211 3401 1203 3412 3505 1353 2401 3409 5222 1305 5101 1302 3467 5109 1505 1503 4103 1309 3501 3511 5214 1307 2505 1507 1301 5112 5202 1501 5107 2501 4154 1502 1351 2503 5205 4165 5113 5204 1201 3451 1323 1251 5224 1357 5218 4105 4155 5265 3512 2353 5212 2502 3551 4107 1325 1256 2307 4109 5258 5216 1506 9000 Mahan Dr Interstate 10 Tram Rd Miccosukee Rd Thomasville Rd N Meridian Rd Blountstown Hwy Centerville Rd Bloxham Cutoff N Monroe St Springhill Rd Apalachee Pkwy Woodville Hwy Capital Cir Sw Veterans Memorial Dr W Tennessee St Crawfordville Rd Capital Cir Se W Tharpe St Capital Cir Nw Capital Cir Ne Moccasin Gap Rd S Monroe St Wakulla Springs Rd W Pensacola St Orange Ave E Orange Ave W W Gaines St Lake Bradford Rd E Tennessee St S Blair Stone Rd S Adams St Orange Ave W Interstate 10 Leon County Florida 2006 General Election Turnout - Republicans 2309 2305 5225 1205 3469 5253 4151 5217 2303 2513 1315 1253 3503 1311 1355 2511 4111 5209 3101 1321 3411 1319 5203 5213 5207 1317 3105 5111 3403 1255 3507 2351 5223 5201 5105 2301 2509 1211 1327 2507 2355 5215 1303 1313 3103 5103 3509 3513 5211 3401 1203 3505 1353 2401 3409 5222 1305 5101 1302 5109 1505 1503 1309 3501 3511 5214 1307 2505 1507 1301 5112 5202 1501 5107 2501 1502 1351 2503 5205 5204 1201 1323 1251 5224 1357 4105 4155 5265 3512 2353 2502 3551 4107 1325 1256 5258 5216 1506 9000 Tram Rd Capital Cir Sw Interstate 10 Mahan Dr Capital Cir Se Miccosukee Rd W Tharpe St Springhill Rd W Tennessee St N Monroe St Apalachee Pkwy Capital Cir Ne Centerville Rd S Monroe St Thomasville Rd W Pensacola St N Meridian Rd Capital Cir Nw Woodville Hwy Orange Ave E Crawfordville Rd Orange Ave W W Gaines St Lake Bradford Rd Blountstown Hwy E Tennessee St S Blair Stone Rd S Adams St Stadium Dr Orange Ave W Interstate 10 ¨ 0 6 12 3 Miles 0 2.5 5 1.25 Miles This product has been compiled from the most accurate source data from Leon County,the City of Tallahassee, and the Leon County Property Appraiser's Office. However, this product is for reference purposes only and is not to be construed as a legal document or survey instrument. Any reliance on the information contained herein is at the user's own risk. Leon County, the City of Tallahassee, and the Leon County Property Appraiser's Office assume no responsibility for any use of the information contained herein or any loss resulting therefrom. Monroe Polk Collier Lee Levy Bay Lake Marion Palm Beach Miami-Dade Brevard Osceola Volusia Taylor Walton Hendry Gulf Dixie Broward Duval Pasco Glades Orange Leon Clay Citrus Franklin Jackson Alachua Liberty Martin Highlands Putnam Manatee Nassau Baker Hillsborough Charlotte Hardee Wakulla Sarasota DeSoto Madison Flagler St. Lucie Holmes Gadsden Hernando Lafayette Hamilton Okaloosa Santa Rosa St. Johns Escambia Columbia Sumter Pinellas Okeechobee Jefferson Calhoun Suwannee Washington Indian River Gilchrist Union Seminole Bradford About Our Precinct Numbers! 2 1 7 9 CC District SB District Last 2 digits below 50 = inside city Last 2 digits above 50 = outside city Ion Sancho, Leon County Supervisor of Elections Office 315 S. Calhoun St., Lobby Tallahassee, FL 32301 www.leoncountyfl.gov/elect To order maps or for more information contact Nicholas Martinez, Demographic/GIS Manager phone: (850)606-8683 e-mail: [email protected]/elect State of Florida Generated 01/2007 Downtown and Surrounding Areas Leon County General Turnout Leon County General Turnout Leon County General Turnout Leon County General Turnout NAD 83 HARN StatePlane Florida North FIPS 0903 Feet Precinct Voter Turnout Republicans Precinct Eligible Voted Percent % Precinct Eligible Voted Percent % Precinct Eligible Voted Percent % 1201 119 26 21.8 2511 353 39 11.0 4167 586 275 46.9 1203 163 46 28.2 2513 237 49 20.7 4169 296 143 48.3 1205 128 43 33.6 3101 512 311 60.7 4171 115 46 40.0 1211 0 0 0.0 3103 334 198 59.3 4173 241 90 37.3 1213 0 0 0.0 3105 334 137 41.0 4401 255 126 49.4 1251 4 2 50.0 3107 266 102 38.3 4403 112 37 33.0 1253 6 3 50.0 3401 265 149 56.2 4405 727 390 53.6 1255 115 36 31.3 3403 331 208 62.8 4407 637 329 51.6 1256 0 0 0.0 3405 237 149 62.9 4451 335 194 57.9 1257 139 36 25.9 3409 109 43 39.4 4453 561 292 52.0 1259 21 12 57.1 3411 328 102 31.1 4455 305 165 54.1 1301 48 4 8.3 3412 266 83 31.2 4457 383 156 40.7 1302 249 26 10.4 3413 2 1 50.0 4459 656 281 42.8 1303 145 10 6.9 3451 33 17 51.5 4461 936 464 49.6 1305 12 4 33.3 3453 435 222 51.0 4463 844 383 45.4 1307 8 1 12.5 3455 593 295 49.7 4465 775 308 39.7 1309 18 1 5.6 3457 278 120 43.2 5101 57 32 56.1 1311 139 35 25.2 3459 306 101 33.0 5103 206 97 47.1 1313 25 4 16.0 3461 539 235 43.6 5105 393 210 53.4 1315 5 0 0.0 3463 398 151 37.9 5107 180 84 46.7 1317 35 11 31.4 3465 51 19 37.3 5109 242 133 55.0 1319 26 8 30.8 3467 213 98 46.0 5111 256 129 50.4 1321 70 17 24.3 3469 118 50 42.4 5112 236 94 39.8 1323 5 1 20.0 3471 378 134 35.4 5113 0 0 0.0 1325 3 1 33.3 3473 253 93 36.8 5151 206 100 48.5 1327 1 0 0.0 3474 177 61 34.5 5153 380 173 45.5 1351 27 2 7.4 3475 41 23 56.1 5201 101 43 42.6 1353 23 6 26.1 3477 109 38 34.9 5202 87 52 59.8 1355 90 23 25.6 3501 202 98 48.5 5203 221 107 48.4 1357 35 11 31.4 3503 361 128 35.5 5204 57 23 40.4 1359 27 9 33.3 3505 164 72 43.9 5205 84 40 47.6 1361 100 26 26.0 3507 417 128 30.7 5207 386 183 47.4 1501 85 34 40.0 3509 259 106 40.9 5209 281 96 34.2 1502 83 30 36.1 3511 202 46 22.8 5211 274 74 27.0 1503 154 24 15.6 3512 74 34 45.9 5212 0 0 0.0 1505 83 7 8.4 3513 248 76 30.6 5213 331 153 46.2 1506 2 0 0.0 3551 18 7 38.9 5214 163 72 44.2 1507 176 10 5.7 4101 423 152 35.9 5215 237 127 53.6 2251 295 65 22.0 4103 226 81 35.8 5216 16 7 43.8 2252 206 69 33.5 4105 34 9 26.5 5217 416 144 34.6 2301 214 25 11.7 4107 29 11 37.9 5218 209 89 42.6 2303 20 4 20.0 4109 20 9 45.0 5219 393 182 46.3 2305 247 31 12.6 4111 0 0 0.0 5221 277 85 30.7 2307 5 1 20.0 4113 123 65 52.8 5222 370 181 48.9 2309 0 0 0.0 4115 0 0 0.0 5223 68 19 27.9 2351 17 3 17.6 4117 662 336 50.8 5224 0 0 0.0 2353 6 0 0.0 4119 733 384 52.4 5225 637 365 57.3 2355 33 6 18.2 4121 422 212 50.2 5251 344 173 50.3 2359 79 11 13.9 4123 374 187 50.0 5253 127 64 50.4 2360 83 17 20.5 4125 811 485 59.8 5255 446 206 46.2 2361 179 45 25.1 4127 403 202 50.1 5257 310 147 47.4 2363 244 68 27.9 4129 492 234 47.6 5258 0 0 0.0 2365 513 181 35.3 4151 198 98 49.5 5259 408 171 41.9 2401 25 5 20.0 4153 408 228 55.9 5260 248 94 37.9 2451 297 75 25.3 4154 105 49 46.7 5261 525 196 37.3 2501 220 19 8.6 4155 173 125 72.3 5262 57 21 36.8 2502 89 3 3.4 4157 170 76 44.7 5263 524 218 41.6 2503 27 5 18.5 4159 90 35 38.9 5264 21 8 38.1 2505 357 18 5.0 4161 706 366 51.8 5265 24 7 29.2 2507 495 39 7.9 4163 453 185 40.8 9000 267 27 10.1 2509 271 44 16.2 4165 242 102 42.1 9999 29 5 17.2 General Turnout PREP Below Average Turnout (<43%) Average Turnout (43%-79%) Above Average Turnout (>79%) No Eligible Voters **The range for "Average Voter Turnout" represents those values within one standard deviation from the mean.
Transcript of About Our Precinct Numbers! - Leon County, Florida and Demographics... · Leon County Florida 2006...
2365
1257
2363
4159
4171
2361
4465
4457
4161
4173
5263
3473
5153
5261
3477
5262
1361
3475
4113
2251
2451
5259
2359
1213
3471
2309
2305
5225
3455
4463
5221
4453
4401
4455
1205
4153
5257
5255
3469
2360
1259
2252
5219
3453
3474
3457
5253
3461
5251
4151
4167
4115
4451
1359
4405
4407
5217
4461
4157
2303
3463
2513
5260
1315
1253
3503
4169
1311
3459
5264
3413
1355
2511
4111
4125
5209
3107
5151
4117
3101
1321
4119
4163
3411
1319
4403
5203
5213
5207
1317
4101
3105
5111
3403
4459
4121
3465
1255
3507
2351
3405
5223
5201
5105
2301
2509
12111327
4129
2507
2355
4123
5215
1303
1313
3103
5103
3509
4127
3513
5211
3401
1203
3412
3505
1353
2401
3409
5222
1305
5101
1302
3467
51091505 1503
4103
1309
35013511
5214
1307
25051507
1301
5112
5202
15015107
2501
4154
1502
1351
2503
5205
4165
5113
52041201
3451
13231251
5224
1357
5218
4105
4155
52653512
2353
5212
2502
3551
4107
13251256
2307
4109
5258
5216
1506
9000
Mahan Dr
Interstate 10
Tram Rd
Miccosukee Rd
Thom
asville
Rd
N Meri
dian R
d
Blountst
own Hwy
Centerv
ille Rd
Bloxham Cutoff
N Mon
roe St
Springh
ill Rd
Apalachee Pkwy
Woodville Hwy
Capital Cir Sw
Veter
ans M
emori
al Dr
W Tennessee St
Crawfo
rdville
Rd
Capital Cir Se
W Tharpe St
Capit
al Cir
Nw Capital Cir Ne
Moccasin Gap Rd
S Mon
roe St
Waku
lla Sp
rings
Rd
W Pensacola St
Orange Ave EOrange Ave W
W Gaines St
Lake Bradf
ord Rd
E Tennessee St
S Blair Stone Rd
S Ada
ms St
Orange Ave W
Interstate 10
Leon County Florida2006 General Election Turnout - Republicans
2309
2305
5225
1205
3469
5253
4151
5217
2303
2513
1315
1253
3503
1311
1355
2511
4111
5209
3107
3101
1321
3411
1319
5203
5213
5207
1317
3105
5111
3403
1255
3507
2351
3405
5223
5201
5105
2301
2509
12111327
2507
2355
5215
1303
1313
3103
5103
3509
3513
5211
3401
1203
3505
1353
2401
3409
5222
1305
5101
1302
5109
1505 1503
1309
35013511
5214
1307
25051507
1301
5112
5202
15015107
2501
1502
1351
2503
5205
52041201
3451
13231251
5224
1357
4105
4155
52653512
2353 2502
3551
4107
1325
1256
5258
5216
1506
9000
Tram Rd
Capital Cir Sw
Interstate 10
Mahan Dr
Capital Cir Se
Miccosuke
e Rd
W Tharpe St
Springhill Rd
W Tennessee St
N Monroe St
Apalachee Pkwy
Capital Cir Ne
Centerv
ille Rd
S Mon
roe St
Thom
asville
Rd
W Pensacola St
N Meri
dian R
d
Capit
al Cir
Nw
Woodville Hwy
Orange Ave ECra
wfordv
ille Rd
Orange Ave W
W Gaines St
Lake Bradford Rd
Blountstown Hwy
E Tennessee St
S Blair Stone Rd
S Ada
ms St
Stadiu
m Dr
Orange Ave W
Interstate 10
¨
0 6 123 Miles
0 2.5 51.25 Miles
This product has been compiled from the most accurate source data from Leon County,the City of Tallahassee, and the Leon
County Property Appraiser's Office. However, this product is for reference purposes only and is not to be construed as a legal
document or survey instrument. Any reliance on the information contained herein is at the user's own risk. Leon County, the City of
Tallahassee, and the Leon County Property Appraiser's Office assume no responsibility for any use of the information contained
herein or any loss resulting therefrom. Monroe
Polk
Collier
Lee
Levy
Bay
Lake
Marion
Palm Beach
Miami-Dade
Brevard
Osceola
Volusia
Taylor
Walton
Hendry
Gulf
Dixie
Broward
Duval
Pasco
Glades
Orange
Leon
Clay
Citrus
Franklin
Jackson
Alachua
Liberty
MartinHighlands
Putnam
Manatee
Nassau
Baker
Hillsborough
Charlotte
Hardee
Wakulla
Sarasota DeSoto
Madison
Flagler
St. Lucie
Holmes
Gadsden
Hernando
Lafayette
HamiltonOkaloosaSanta Rosa
St. Johns
Escambia
Columbia
Sumter
Pinellas
Okeechobee
JeffersonCalhounSuwannee
Washington
Indian River
Gilchrist
Union
Seminole
Bradford
About Our Precinct Numbers!
2 1 7 9CC
DistrictSB
DistrictLast 2 digits below 50 = inside cityLast 2 digits above 50 = outside city
Ion Sancho, Leon CountySupervisor of Elections Office
315 S. Calhoun St., LobbyTallahassee, FL 32301
www.leoncountyfl.gov/electTo order maps or for more
information contactNicholas Martinez,
Demographic/GIS Managerphone: (850)606-8683
e-mail: [email protected]/elect
State of Florida
Generated 01/2007
Downtown and Surrounding AreasLe
on Co
unty
Gene
ral Tu
rnou
t Leon County General TurnoutLeon County General TurnoutLe
on Co
unty
Gene
ral Tu
rnou
t
NAD 83 HARNStatePlane Florida North
FIPS 0903 Feet
Precinct Voter TurnoutRepublicans
Precinct Eligible Voted Percent % Precinct Eligible Voted Percent % Precinct Eligible Voted Percent %1201 119 26 21.8 2511 353 39 11.0 4167 586 275 46.91203 163 46 28.2 2513 237 49 20.7 4169 296 143 48.31205 128 43 33.6 3101 512 311 60.7 4171 115 46 40.01211 0 0 0.0 3103 334 198 59.3 4173 241 90 37.31213 0 0 0.0 3105 334 137 41.0 4401 255 126 49.41251 4 2 50.0 3107 266 102 38.3 4403 112 37 33.01253 6 3 50.0 3401 265 149 56.2 4405 727 390 53.61255 115 36 31.3 3403 331 208 62.8 4407 637 329 51.61256 0 0 0.0 3405 237 149 62.9 4451 335 194 57.91257 139 36 25.9 3409 109 43 39.4 4453 561 292 52.01259 21 12 57.1 3411 328 102 31.1 4455 305 165 54.11301 48 4 8.3 3412 266 83 31.2 4457 383 156 40.71302 249 26 10.4 3413 2 1 50.0 4459 656 281 42.81303 145 10 6.9 3451 33 17 51.5 4461 936 464 49.61305 12 4 33.3 3453 435 222 51.0 4463 844 383 45.41307 8 1 12.5 3455 593 295 49.7 4465 775 308 39.71309 18 1 5.6 3457 278 120 43.2 5101 57 32 56.11311 139 35 25.2 3459 306 101 33.0 5103 206 97 47.11313 25 4 16.0 3461 539 235 43.6 5105 393 210 53.41315 5 0 0.0 3463 398 151 37.9 5107 180 84 46.71317 35 11 31.4 3465 51 19 37.3 5109 242 133 55.01319 26 8 30.8 3467 213 98 46.0 5111 256 129 50.41321 70 17 24.3 3469 118 50 42.4 5112 236 94 39.81323 5 1 20.0 3471 378 134 35.4 5113 0 0 0.01325 3 1 33.3 3473 253 93 36.8 5151 206 100 48.51327 1 0 0.0 3474 177 61 34.5 5153 380 173 45.51351 27 2 7.4 3475 41 23 56.1 5201 101 43 42.61353 23 6 26.1 3477 109 38 34.9 5202 87 52 59.81355 90 23 25.6 3501 202 98 48.5 5203 221 107 48.41357 35 11 31.4 3503 361 128 35.5 5204 57 23 40.41359 27 9 33.3 3505 164 72 43.9 5205 84 40 47.61361 100 26 26.0 3507 417 128 30.7 5207 386 183 47.41501 85 34 40.0 3509 259 106 40.9 5209 281 96 34.21502 83 30 36.1 3511 202 46 22.8 5211 274 74 27.01503 154 24 15.6 3512 74 34 45.9 5212 0 0 0.01505 83 7 8.4 3513 248 76 30.6 5213 331 153 46.21506 2 0 0.0 3551 18 7 38.9 5214 163 72 44.21507 176 10 5.7 4101 423 152 35.9 5215 237 127 53.62251 295 65 22.0 4103 226 81 35.8 5216 16 7 43.82252 206 69 33.5 4105 34 9 26.5 5217 416 144 34.62301 214 25 11.7 4107 29 11 37.9 5218 209 89 42.62303 20 4 20.0 4109 20 9 45.0 5219 393 182 46.32305 247 31 12.6 4111 0 0 0.0 5221 277 85 30.72307 5 1 20.0 4113 123 65 52.8 5222 370 181 48.92309 0 0 0.0 4115 0 0 0.0 5223 68 19 27.92351 17 3 17.6 4117 662 336 50.8 5224 0 0 0.02353 6 0 0.0 4119 733 384 52.4 5225 637 365 57.32355 33 6 18.2 4121 422 212 50.2 5251 344 173 50.32359 79 11 13.9 4123 374 187 50.0 5253 127 64 50.42360 83 17 20.5 4125 811 485 59.8 5255 446 206 46.22361 179 45 25.1 4127 403 202 50.1 5257 310 147 47.42363 244 68 27.9 4129 492 234 47.6 5258 0 0 0.02365 513 181 35.3 4151 198 98 49.5 5259 408 171 41.92401 25 5 20.0 4153 408 228 55.9 5260 248 94 37.92451 297 75 25.3 4154 105 49 46.7 5261 525 196 37.32501 220 19 8.6 4155 173 125 72.3 5262 57 21 36.82502 89 3 3.4 4157 170 76 44.7 5263 524 218 41.62503 27 5 18.5 4159 90 35 38.9 5264 21 8 38.12505 357 18 5.0 4161 706 366 51.8 5265 24 7 29.22507 495 39 7.9 4163 453 185 40.8 9000 267 27 10.12509 271 44 16.2 4165 242 102 42.1 9999 29 5 17.2
General TurnoutPREP
Below Average Turnout (<43%)Average Turnout (43%-79%)Above Average Turnout (>79%)No Eligible Voters
**The range for "Average Voter Turnout"represents those values within onestandard deviation from the mean.