Abortion Surveillance — United States, 2005 Surveillance — United States, 2005 MMWR Centers for...
36
Department Of Health And Human Services Centers for Disease Control and Prevention Surveillance Summaries November 28, 2008 / Vol. 57 / No. SS-13 Morbidity and Mortality Weekly Report www.cdc.gov/mmwr Abortion Surveillance — United States, 2005
Transcript of Abortion Surveillance — United States, 2005 Surveillance — United States, 2005 MMWR Centers for...

Department Of Health And Human ServicesCenters for Disease Control and Prevention
Surveillance Summaries November 28, 2008 / Vol. 57 / No. SS-13
Morbidity and Mortality Weekly Reportwww.cdc.gov/mmwr
Abortion Surveillance — United States, 2005

MMWR
Centers for Disease Control and PreventionJulie L. Gerberding, MD, MPH
DirectorTanja Popovic, MD, PhD
Chief Science OfficerJames W. Stephens, PhD
Associate Director for ScienceSteven L. Solomon, MD
Director, Coordinating Center for Health Information and ServiceJay M. Bernhardt, PhD, MPH
Director, National Center for Health MarketingKatherine L. Daniel, PhD
Deputy Director, National Center for Health Marketing
Editorial and Production StaffFrederic E. Shaw, MD, JD
Editor, MMWR SeriesSusan F. Davis, MD
(Acting) Assistant Editor, MMWR SeriesTeresa F. Rutledge
Managing Editor, MMWR SeriesDavid C. Johnson
(Acting) Lead Technical Writer-EditorPatricia A. McGee
Project EditorPeter M. Jenkins
(Acting) Lead Visual Information SpecialistMalbea A. LaPete
Stephen R. SpriggsVisual Information Specialists
Kim L. Bright, MBAQuang M. Doan, MBA
Phyllis H. KingInformation Technology Specialists
Editorial BoardWilliam L. Roper, MD, MPH, Chapel Hill, NC, Chairman
Virginia A. Caine, MD, Indianapolis, INDavid W. Fleming, MD, Seattle, WA
William E. Halperin, MD, DrPH, MPH, Newark, NJMargaret A. Hamburg, MD, Washington, DC
King K. Holmes, MD, PhD, Seattle, WADeborah Holtzman, PhD, Atlanta, GA
John K. Iglehart, Bethesda, MDDennis G. Maki, MD, Madison, WI
Sue Mallonee, MPH, Oklahoma City, OKPatricia Quinlisk, MD, MPH, Des Moines, IA
Patrick L. Remington, MD, MPH, Madison, WIBarbara K. Rimer, DrPH, Chapel Hill, NCJohn V. Rullan, MD, MPH, San Juan, PR
William Schaffner, MD, Nashville, TNAnne Schuchat, MD, Atlanta, GA
Dixie E. Snider, MD, MPH, Atlanta, GAJohn W. Ward, MD, Atlanta, GA
The MMWR series of publications is published by the Coordinating Center for Health Information and Service, Centers for Disease Control and Prevention (CDC), U.S. Department of Health and Human Services, Atlanta, GA 30333.Suggested Citation: Centers for Disease Control and Prevention. [Title]. Surveillance Summaries, [Date]. MMWR 2008;57(No. SS-13).
ContEntS
Introduction .............................................................................. 1
Methods ................................................................................... 2
Results ...................................................................................... 3
Discussion................................................................................. 6
Acknowledgments ..................................................................... 9
References ................................................................................ 9

Vol. 57 / SS-13 Surveillance Summaries 1
Abortion Surveillance — United States, 2005Sonya B. Gamble, MS
Lilo T. Strauss, MAWilda Y. Parker
Douglas A. Cook, MBISSuzanne B. Zane, DVM
Saeed Hamdan, MD, PhDDivision of Reproductive Health
National Center for Chronic Disease Prevention and Health Promotion
Abstract
Problem/Condition: CDC began abortion surveillance in 1969 to document the number and characteristics of women obtaining legal induced abortions.Reporting Period Covered: This report summarizes and describes data voluntarily reported to CDC regarding legal induced abortions obtained in the United States in 2005.Description of System: For each year since 1969, CDC has compiled abortion data by state or area of occurrence. Information is requested each year from all 50 states, New York City, and the District of Columbia. For 2005, data were received from 49 reporting areas: New York City, District of Columbia, and all states except California, Louisiana, and New Hampshire. For the purpose of trends analysis, data were evaluated from the 46 reporting areas that have been consistently reported since 1995.Results: A total of 820,151 legal induced abortions were reported to CDC for 2005 from 49 reporting areas, the abor-tion ratio (number of abortions per 1,000 live births) was 233, and the abortion rate was 15 per 1,000 women aged 15–44 years. For the 46 reporting areas that have consistently reported since 1995, the abortion rate declined during 1995–2000 but has remained unchanged since 2000.For 2005, the highest percentages of reported abortions were for women who were known to be unmarried (81%), white (53%), and aged <25 years (50%). Of all abortions for which gestational age was reported, 62% were performed at <8 weeks’ gestation and 88% at <13 weeks. From 1992 (when detailed data regarding early abortions were first col-lected) through 2005, the percentage of abortions performed at <6 weeks’ gestation has increased. A small percentage of abortions occurred at >15 weeks’ gestation (3.7% at 16–20 weeks and 1.3% at >21 weeks). A total of 35 reporting areas submitted data stating that they performed and enumerated medical (nonsurgical) procedures, making up 9.9% of all known reported procedures from the 45 areas with adequate reporting on type of procedure. In 2004 (the most recent years for which data are available), seven women died as a result of complications from known legal induced abortion. One death was associated with known illegal abortion.Interpretation: For the 46 reporting areas that have consistently reported since 1995, the number of abortions has steadily declined over the previous 10 years. The abortion rate declined from 1995 to 2000, but remained unchanged since 2000. In 2004, as in the previous years, deaths related to legal induced abortions occurred rarely.Public Health Action: Abortion surveillance in the United States continues to provide the data necessary for examining trends in numbers and characteristics of women who obtain legal induced abortions and to increase understanding of this pregnancy outcome. Policymakers and program planners use these data to improve the health and well-being of women and evaluate efforts to prevent unintended pregnancies.
IntroductionCDC began conducting abortion surveillance in 1969 to
document the number and characteristics of women obtaining legal induced abortions. This report is based on abortion data for 2005, provided voluntarily to CDC’s National Center for Chronic Disease Prevention and Health Promotion, Division of Reproductive Health.
The material in this report originated in the National Center for Chronic Disease Prevention and Health Promotion, Janet Collins, PhD, Director; and the Division of Reproductive Health, John Lehnherr, Acting Director.Corresponding address: CDC/National Center for Chronic Disease Prevention and Health Promotion/Division of Reproductive Health, 1600 Clifton Rd., NE, MS K-21, Atlanta, GA 30333. E-mail: [email protected].

2 MMWR November 28, 2008
MethodsFor 2005, CDC compiled data that were voluntarily pro-
vided from 49 reporting areas in the United States: 47 states (excluding California, New Hampshire, and Louisiana), the District of Columbia (DC), and New York City (NYC). Legal induced abortion was defined as a procedure, performed by a licensed physician or someone acting under the supervi-sion of a licensed physician, that was intended to terminate a suspected or known intrauterine pregnancy and to produce a nonviable fetus at any gestational age (1,2). The total number of legal induced abortions was available from all reporting areas; however, not all of these areas collected data on some or all characteristics of women who obtained abortions, and the availability of such data varied by reporting area. Abortion data were compiled using suggested table shells that were sent to the reporting areas. Not all reporting areas used the sug-gested tables.
The findings in this report reflect characteristics of women only from reporting areas that submitted adequate data for the characteristics being examined. Among all areas that reported data on the age of women who obtained abortions, data were collected and reported adequately (i.e., categorized in accor-dance with surveillance variables and with <15% unknown values) by 48 reporting areas (46 states excluding FL, DC, and NYC), representing 88% of all reported procedures. Data on ethnicity were collected and reported adequately by only 30 reporting areas, representing 56% of all reported procedures. For the majority of state tables, the percentage data include a category for unknown values, and the percentage known to be in each category might be lower than the true percentage in that category because of missing information. However, for trend data, out-of-area residents, adolescent ages, and two-characteristics tables, percentages presented are based on known values only.
For the 49 reporting areas, data concerning the number of women obtaining legal induced abortions were provided by the central health agency.* These agencies provided data on numbers of abortions and characteristics of women obtaining abortions by the reporting area in which the abortion was per-formed (i.e., state of occurrence). For the majority of reporting areas, abortion totals also were available by the woman’s state or area of residence. However, three states (Delaware, Maryland, and Wisconsin) reported characteristics only for residents who obtained abortions in the state but not for women from out-of-state. Two states (Florida and Kentucky) did not report abortion totals by resident status, and three states (Arizona, Iowa, and Massachusetts) provided only the total number of
abortions for out-of-state residents without specifying indi-vidual states or areas of residence.
This report provides overall and state-specific abortion statistics. For all characteristics for which birth or population data were available, abortion ratios (number of abortions per 1,000 live births) or abortion rates (number of abortions per 1,000 women in a given age group) are provided. Beginning with 1996 data, abortion ratios were calculated by using the number of live births to residents of each area from birth data reported to CDC’s National Center for Health Statistics (NCHS); these numbers were previously received from state health departments. The population data used for calculating most recent abortion rates were obtained from the U.S. Census Bureau postcensual data (3).
Women aged 20–39 years who obtained legal induced abor-tions were categorized by 5-year age groups, adolescents aged 15–19 years were categorized by single years of age, and the relatively few abortions at <15 years or ≥40 years each had one group. Abortion numbers, ratios, and rates are presented by age group. Because 94% of abortions among adolescents aged <15 years occurred among those aged 13–14 years in 1988 (the latest year for which this information is known) (4), the population of adolescents aged 13–14 years was used as the denominator for calculating abortion rates for adolescents aged <15 years. Rates for women aged >40 years were based on the number of women aged 40–44 years. However, rates for all females who obtained abortions were based on the population of females aged 15–44 years.
Race was categorized by three groups: white, black, and all other races. Other races included Asian or Pacific Islander, American Indian, Alaska Native, and women classified as “other” race. Ethnicity was categorized as either Hispanic or non-Hispanic. As in previous reports, race and ethnicity were provided as separate variables, and abortions were not cross-classified by race and ethnicity. States were not requested to report data by ethnicity and race cross-classification for this year. Abortion numbers, ratios, and rates are presented by both race and ethnicity.
Despite efforts to collect and provide a cross-classification of race and ethnicity for the 2001 report in compliance with OMB Directive 15, which specifies federal standards for the collection of data on race and ethnicity (5), only 28 states (accounting for 39% of the total number of reported abor-tions) provided adequate data for use of the recommended race categories. Eleven states could not adequately break down the data by ethnicity. Moreover, three recommended racial cat-egories (Asian, Native Hawaiian or other Pacific Islander, and American Indian or Alaskan Native) had to be combined into one category of “other” to accommodate overlapping categories provided by multiple states. For these reasons, no additional * Includes state, DC, and NYC health departments.

Vol. 57 / SS-13 Surveillance Summaries 3
information regarding race or ethnicity was obtained as a result of unavailable data. However, further efforts to collect data cross-classified by race and ethnicity will be attempted in future reports.
Marital status was reported as either married (including women who were married or separated) or unmarried (includ-ing those who were never married, widowed, or divorced). Abortion numbers and ratios are presented by marital status.
Gestational age (in weeks) at the time of abortion was cat-egorized as <6, 7, 8 and <8, 9–10, 11–12, 13–15, 16–20, and >21. Weeks of gestation were estimated in 11 reporting areas as the time elapsed since the woman’s most recent menstrual period. For 27 other states, gestational age was reported on the basis of the physician’s estimate (data from the clinical exami-nation, including ultrasound results). For the remaining six states, gestational age was derived from a combination of the physician’s estimates and the time elapsed since the woman’s most recent menstrual period. Of the 44 areas that reported adequate data on weeks of gestation at the time of abortion, 41 also reported abortions performed at <8 weeks’ gestation separately for those performed at <6, 7, and 8 weeks’ gestation. Abortion numbers are presented by gestational age.
The type of abortion procedure was categorized as curettage (including suction and/or sharp curettage) at any gestational age and reported separately for ≤12 weeks and >12 weeks, intrauterine instillation, medical (nonsurgical) abortion (meth-otrexate and misoprostol or mifepristone and misoprostol were reported for abortions performed at <8 weeks gestation; vaginal prostaglandins were primarily reported for abortions performed at later weeks of gestation), and procedures described as other (including hysterectomy and hysterotomy).
CDC has reported data on abortion-related deaths peri-odically since these deaths were first included in the Abortion Surveillance Report in 1972 (6,7). An abortion-related death was defined as a death resulting from a direct complication of an abortion, an indirect complication caused by the chain of events initiated by abortion, or aggravation of a preexisting condition by the physiologic or psychologic effects of the abor-tion (1,2). All deaths causally related to induced abortion were classified as induced abortion-related regardless of the duration of time between the abortion and the death.
Sources used to identify possible abortion-related deaths included national and state vital records, maternal mortality review committees, surveys, private citizens and groups, media reports, health-care providers, medical examiners’ reports, public health agencies, and computerized searches of full-text newspaper/print media databases. For each death possibly related to an induced abortion or an abortion of unknown type, clinical records and autopsy reports were requested and reviewed by two clinically experienced medical epidemiolo-
gists to determine the cause of death and whether the death was abortion-related. Each abortion-related death was then categorized by abortion type as legal induced, illegal induced, spontaneous, or unknown type. Data on abortion-related deaths for 1972–2004 are provided in this report. The 2004 data have not been published previously and are the most recent data available. National case-fatality rates were calculated as the number of known legal induced abortion-related deaths per 100,000 reported legal induced abortions. Case-fatality rates for 1972–1997 are provided in this report. Case-fatality rates for 1998–2004 cannot be calculated because a substantial number of abortions occur in the three nonreporting states and, therefore, the total number of abortions (the denomina-tor) is unknown.
ResultsIn 2005, for the 46 reporting areas that have consistently
reported since 1995, a total of 809,881 legal induced abortions were reported to CDC. This is a decline of 1.2% from 819,353 legal induced abortions reported in 2004. A total of 820,151 legal induced abortions were reported to CDC by 49 report-ing areas. This change represents a 2.3% decline from 2004, for which 49 areas reported 839,226 legal induced abortions (Tables 1 and 2). The only difference between these 2 years was that West Virginia did not report in 2004 and Louisiana did not report in 2005. Therefore, changes between these two years must be interpreted with that difference in mind. Overall, the annual number of legal induced abortions in the United States increased gradually from 1973 until it peaked in 1990, and it generally declined thereafter (Figure 1).
The national legal induced abortion ratio increased from 196 per 1,000 live births in 1973 (the first year that 52 areas reported) to 358 per 1,000 in 1979 and remained nearly stable through 1981 (Figure 1) (Table 2). The ratio peaked at 364 per 1,000 in 1984 and since then has demonstrated a generally steady decline. However in 1998, abortion data were not avail-able for Alaska, California, New Hampshire, and Oklahoma. The result of this unavailable data caused a major decrease in the abortion ratio, from 306 to 264, with steady decreases in the years to follow. In 2005, the abortion ratio was 233 per 1,000 in 49 reporting areas and 236 for the same 46 reporting areas for which data were available since 1995 (Table 2).
The national legal induced abortion rate increased from 14 per 1,000 women aged 15–44 years in 1973 to 25 per 1,000 in 1980. The rate remained stable, at 23–24 per 1,000 during the 1980s and early 1990s and at 20–21 per 1,000 during 1994–1997. The abortion rate in 1998 experienced a significant loss of information from some reporting areas. The abortion rate changed from 20 in 1997 to 17 in 1998, with a
4 MMWR November 28, 2008
modest decline in the following years for 49 reporting areas. The abortion rate in 1998 experienced a great change because of the unavailability of data from four states. In 2005, the abortion rate was 15 per 1,000 in 49 reporting areas.
The numbers, ratios, and rates of reported legal induced abortions are presented by area of residence and by area of occurrence (Table 3). In 2005, the highest number of reported legal induced abortions occurred in Florida (92,513), NYC (88,891), and Texas (77,108); the fewest† occurred in Wyoming (14), South Dakota (805), and Idaho (1,099) (Table 3). The abortion ratios by state or area of occurrence ranged from 48 per 1,000 live births in Idaho to 756 per 1,000 in NYC. Among women aged 15–44 years, rates by occurrence ranged from four per 1,000 women in Idaho to 30 per 1,000 in New York State. These ratios and rates should be viewed with consideration of the sizable variation by state in the percentage of abortions obtained by out-of-state residents. In 2005, approximately 8% of reported abortions were obtained by out-of-state residents (range: from 0.3% [in Alaska] to 51% [in DC]) (Table 3). Data by state of residence are incom-plete because three states (California, New Hampshire, and Louisiana) did not report any data on abortion, and six states (Alaska, Arizona, Florida, Iowa, Kentucky, and Massachusetts) did not provide data concerning the residence status of all women obtaining abortions in their state. Therefore, ratios and rates by state of residence should be viewed with caution because of the substantial variation in completeness of report-ing of residence information.
Women known to be aged 20–24 years obtained 33% of all abortions for which age was adequately reported. Adolescents aged <15 years obtained <1.0% of all abortions in the 48 areas that reported age. Among the 48 reporting areas, age was not reported for 0.5% of patients; however, this percentage ranged from 0.0% (in 22 areas) to 4.1% (Arizona) (Table 4). Abortion ratios were highest for adolescents aged <15 years (764 per 1,000 live births) and lowest for women aged 30–34 years (140 per 1,000) (Figure 2) (Table 4). In contrast to abortion ratios, among females for whom age was reported, abortion rates were highest for women aged 20–24 years (29 per 1,000 women) and lowest for females at the extremes of reproductive age (1 per 1,000 adolescents aged <15 years and 3 per 1,000 women aged >40 years) (Table 4). Among women aged <20 years (46 reporting areas), the percentage of abortions obtained increased with age (Table 5); the abortion ratio, however, was
highest for adolescents aged <15 years§ (776 per 1,000 live births) and lowest for women aged 19 years (316 per 1,000). Conversely, the rates of abortions were lowest (1 per 1,000) for adolescents aged <15 years and highest (26 per 1,000) for women aged 19 years (Table 5).
Abortion trends by age indicated that since 1973, abortion ratios have been higher for adolescents aged <15 years than for any other age group (Figure 3). For females aged <19 years and those aged >40 years, the abortion ratio generally increased from 1974 through the early 1980s and declined thereafter. The abortion ratio for women aged 20–34 years (those with the highest fertility rates) has declined slightly since the mid-1980s. The abortion ratio for women aged 35–39 years has declined gradually over time (Figure 3).
In 2005, for women from areas where weeks of gestation at the time of abortion were adequately reported (43 reporting areas), 61% of reported legal induced abortions were known to have been obtained at <8 weeks’ gestation and 87% at <12 weeks (Table 6). Overall (40 reporting areas), 29% of abortions were known to have been performed at <6 weeks’ gestation, 18% at 7 weeks, and 14% at 8 weeks (Table 7). Few reported abortions were known to have occurred after 15 weeks’ gestation: 3.7% at 16–20 weeks and 1.3% at >21 weeks (Table 6).
For women whose type of procedure was adequately reported, 81% of abortions were known to have been per-formed by curettage (which includes dilatation and evacua-tion [D&E]) and 0.8% by intrauterine instillation (Table 8). Thirty-five reporting areas submitted information regarding performance of medical (nonsurgical) procedures,¶ hereafter referred to as medical abortions. Known medical abortions made up approximately 10% of all procedures reported from the 45 areas with adequate reporting on type of procedure. Additionally, two areas that did not collect data separately for medical abortions on their abortion reporting form included medical abortions in the “other” category. For the 35 areas that reported medical abortions separately, 66,485 medical abortion procedures were performed in 2005. (Seven states reported that no medical abortions were performed in 2005 but did not specify whether such abortions were available.) For the 34 reporting areas that reported one or more medical abortion for both 2004 and 2005, the data reflected an increase of 1%, from 66,036 in 2004 to 66,391 in 2005 (8). The extent to which the 66,485 medical abortions reported to CDC for
† Wyoming reported 12 abortions occurring in 2004. As a result of the small number and because computing abortion ratios and rates for such a limited number is not appropriate, Wyoming was not included in this sequence in the text.
§ Ratios for adolescents aged <15 years differ in Tables 4 and 5 because a differ-ent number of areas reported; Table 4 includes 48 reporting areas, and Table 5 includes 46.
¶ Medical (nonsurgical) abortion procedures involve the administration of a medication or medications to induce abortion.
Vol. 57 / SS-13 Surveillance Summaries 5
2005 represents the use of this method in all reporting areas is unknown. Hysterectomy and hysterotomy were included in the “other” procedure category and were known to have been used rarely in all abortions.
In the 38 reporting areas for which race was provided, clas-sified according to the same categories used in previous years, approximately 53% of women who obtained legal induced abortions were known to be white; 35%, black; and 8% other; for 4%, race was not known (Table 9). The abortion ratio for black women (467 per 1,000 live births) was 2.9 times the ratio for white women (158 per 1,000), and the ratio for women of the heterogeneous “other” race category (319 per 1,000) was 2.0 times the ratio for white women. The abortion rate for black women (28 per 1,000 women) was 3.1 times the rate for white women (nine per 1,000), whereas the abortion rate for women of other races (18 per 1,000 women) was 2.0 times the rate for white women.
Thirty reporting areas had separate and adequate data** on the ethnicity of women who obtained legal induced abortions (Table 10). The percentage of abortions known to have been obtained by Hispanic women in these reporting areas was 19% overall (range: from 0.5% [in Mississippi] to 52% [in New Mexico]). For Hispanic women in these reporting areas, the abortion ratio was 205 per 1,000 live births, and the abortion rate was 21 per 1,000 women. However, only 46% of Hispanic women in the United States lived in these reporting areas.
For women whose marital status was adequately reported (43 reporting areas), 81% of women who obtained abortions were known to be unmarried (Table 11). The abortion ratio for unmarried women (485 per 1,000 live births) was 8.4 times that for married women (58 per 1,000).
For women who obtained legal induced abortions and for whom data on previous live births were adequately reported (40 reporting areas), 40.4% were known to have had no previ-ous live births, 26.2% one previous live birth, 31.9% two or more previous live births, and 1.4% unknown live births (Table 12). The abortion ratio was highest for women who had three previous live births (264 per 1,000 live births) and lowest for those who had one previous live birth (182 per 1,000).
For women who obtained an abortion and whose number of previous abortions were adequately reported (43 reporting areas), 54% were reported to have obtained an abortion for the first time, 25% were reported to have had one abortion, and 19% were reported to have had at least two previous abortions (Table 13).
For women whose age and race were known (38 reporting areas), the differences in age distributions of white and black women were relatively small. White women had a slightly higher percentage of abortions in the oldest (>35 years) age groups compared with black women (12.6% versus 9.9%, respectively), whereas women of other races who had abor-tions tended to be older (Table 14). For women whose marital status and race were both known (37 reporting areas), the percentage of reported abortions among black women who were unmarried was higher (89.0%) than that among white women (81.5%) or among women of other races (66.1%). Among older (age >35 years) women obtaining abortions whose age and ethnicity were known and reported adequately (30 reporting areas), the percentage of abortions obtained by non-Hispanic women (12.4%) exceeded that for Hispanic women (10.1%) (Table 15). Among women whose marital status and ethnicity were known and reported adequately (30 reporting areas), the percentage of reported abortions obtained by unmarried women was similar for non-Hispanic women than for Hispanic women (Table 15).
As in the past, for all abortions for which gestational age at the time of abortion was known and reported adequately (42 reporting areas), approximately 88.5% were obtained at <12 weeks’ gestation (Table 16). The percentage of women who obtained an abortion at <8 weeks’ gestation increased with age (Figure 4) (Table 16). This association was most pronounced for abortions obtained at <6 weeks’ gestation (40 reporting areas) (Table 17). The percentage of women who obtained an abortion decreased with age for women who obtained an abor-tion at 9–10, 11–12, and 13–15 weeks’ gestation, through age 30–34 years at 16–20 weeks’ gestation, and through age 25–29 years at >21 weeks’ gestation (Table 16). Among women with adequately reported race and weeks of gestation (35 reporting areas), white women and women of other races were more likely than black women to obtain abortions at <6 and 7 weeks’ gestation. (Table 16 and 17). Among women with adequately reported known ethnicity and weeks of gestation (31 report-ing areas), the difference in timing of their abortions between Hispanic and non-Hispanic women was minimal (<3.8%) at any gestational age (Tables 16 and 17).
For women whose type of procedure and weeks of gestation were known and adequately reported (42 reporting areas), approximately 87.7% of reported abortions obtained at <15 weeks’ gestation were performed by using curettage (primarily suction procedures) (Table 18). Approximately 94% of the 58,146 reported medical abortions when gestational age is known were performed at <8 weeks’ gestation, representing 15.1% of all abortions performed at <8 weeks’ gestation. At >16 weeks’ gestation, medical abortions (n = 847) made up 2.2% of all abortions. Medical abortions constituted 1.5%
** After exclusion of 12 areas in which ethnicity data were unknown for >15% of women who obtained an abortion.
6 MMWR November 28, 2008
of procedures performed in the 9–15 weeks’ gestation range. Intrauterine instillation involving use of saline or prostaglan-din was used rarely (0.1% of all abortions), primarily at >16 weeks’ gestation.
From the National Pregnancy Mortality Surveillance System, CDC identified 19 deaths for 2004 that were thought to be potentially related to abortion. These deaths were identified either by some indication of abortion on the death certificate, from health-care providers, or from information such as a news or public health report associated with the death. Investigation of the 2004 cases revealed that seven of the 19 deaths were related to legal induced abortion and one to illegal induced abortion (Table 19). One of the seven legal induced abortion-related deaths occurred following a medical (nonsurgical) abortion procedure. Of the 11 deaths that were determined not to be related to legal induced abortions, five deaths were attributed to spontaneous abortion, three deaths were attributed to stillbirths, and three deaths were found not to be abortion-related. Numbers of deaths were attributed to legal induced abortion were highest before the 1980s. Possible abortion-related deaths that occurred during 2005–2008 are currently being investigated.
DiscussionA total of 820,151 legal induced abortions were reported
in the United States for 2005 from 49 areas, which reflects a decline of 2.3% from the number of legal induced abortions reported for 2004. A slight increase of 0.1% in the number of abortions occurred in 2002, followed by a slight decline in 2003–2005. This pattern also is observed when the same 46 reporting areas that reported for all years, 1998–2005, are com-pared with those that reported for 2001–2005 (Table 2). Before 1998, a substantial number of legal induced abortions were estimated to have been performed in California (e.g., >23% of the U.S. total in 1997) (9). The lack of data for California for 2004 largely explains the majority of the 28% decrease from the annual number of abortions reported for 1997 (9) and part of the decrease in the total ratio and rate.
Overall, abortion ratios and abortion rates have declined over time until 2000. However, during 2000–2005, the abortion rate has remained unchanged (Figure 1) (Table 2). The abortion ratio for 2005 (233 per 1,000 live births for 49 reporting areas) decreased from the previous year (238). The overall declines in the abortion ratio and rate over time might reflect multiple factors, including a decrease in the number of unintended pregnancies (10); a shift in the age distribution of women toward the older and less fertile ages (11); reduced or limited access to abortion services, including the passage of abortion laws that affect adolescents (e.g., parental consent
or notification laws and mandatory waiting periods) (12–16); and changes in contraceptive practices, including increased use of contraceptives (e.g., condoms and, among young women, of long-acting hormonal contraceptive methods that were introduced in the early 1990s) (17–22).
In this report, the abortion rate for the United States was higher than recent rates reported for Canada and Western European countries and lower than rates reported for China, Cuba, the majority of Eastern European countries, and cer-tain newly independent states of the former Soviet Union (23–25).
As in previous years, the abortion ratio in 2005 varied by age. Although the abortion ratio was highest for adolescents in 2005, since the mid-1980s, the ratio had gradually declined for those aged <15 and 15–19 years, through 2000, increased through 2003, again declined for 2004, and increased slightly in the <15 and 15–19 age categories for 2005 (Figure 3). Other studies also have indicated a decrease in birth rates for females aged 10–14 and 15–19 years during 1991–2005 and a decrease in adolescent pregnancy rates during 1990–2004 (26–34). However, abortion rates have not varied equally among women of all races and ethnicities. Abortion rates are declining more slowly among adolescents who are not enrolled in school (10,34).
The percentage distribution of abortions by known weeks of gestation has shifted slightly since the late 1970s. From 1992 (when detailed data on early abortions were first avail-able) through 2002, data have indicated steady increases in procedures performed at <6 weeks’ gestation, with a mini-mal decrease in 2003 but increase in 2004–2005. Decreases occurred in the percentage of abortions performed at 7–10 weeks. The increase in the percentage of abortions known to have been performed at <6 weeks’ gestation might be related to an increase in the availability of early abortion services since 1992 and an increase in medical and surgical procedures that can be performed early in gestation (35,36). Abortions per-formed early in pregnancy are associated with lower risks for mortality and morbidity (37,38). The proportions of abortions performed later in pregnancy (>13 weeks) have varied mini-mally since 1992. The gestational age at which an abortion is obtained can be influenced by multiple factors in addition to those for which surveillance data are available (i.e., age, race, and ethnicity). These additional factors include level of educa-tion, availability and accessibility of abortion services, timing of confirmation of pregnancy, timing of personal decision-making, timing of prenatal diagnosis, level of fear of discovery of pregnancy, and denial of pregnancy (39–41).
Since the mid-1990s, two medical regimens (mifepristone and methotrexate, each used in conjunction with misoprostol) have been tested in clinical trials and used by clinical prac-

Vol. 57 / SS-13 Surveillance Summaries 7
titioners to perform early medical abortions (36,42). CDC surveillance data indicate that approximately 61% of all U.S. abortions are performed at <8 weeks’ gestation, which is similar to the timing of the regimen used for both mifepristone and methotrexate (38,43). Mifepristone for medical abortion was approved in September 2000 by the U.S. Food and Drug Administration (FDA) for distribution and use in the United States. The FDA-approved protocol can be initiated at <49 days of gestation and requires three office visits by the patient: administration of oral mifepristone, followed 48 hours later by oral misoprostol in the health-care provider’s office, and a follow-up visit in approximately 14 days. Clinical studies of alternative medical abortion regimens have been performed in multiple countries and are ongoing (44–52). Midtrimester nonsurgical abortion with mifepristone and misoprostol or misoprostol alone also have been shown to be clinically effec-tive (53,54).
In 1997, the U.S. Induced Termination of Pregnancy (ITOP) standard report published by NCHS and used by providers for abortion reporting to state health departments was revised to include a category for “medical (nonsurgical)” procedures (55). Medical abortion procedures have been included in this report since then as a separate category. CDC will continue to monitor early medical procedures and to report on the number of these procedures (Table 8).
The percentage of abortions known to be performed by curet-tage increased from 88% in 1973 to >96% during 1980–2001 and then decreased to 87% in 2005 (Table 1), whereas the percentage of abortions performed by intrauterine instillation declined sharply, from 10% in 1973 to <1% since 1989. The increase in use of curettage at >13 weeks is likely attributable to the lower risk for complications associated with the procedure (56,57). The percentage of abortions performed by curettage at >13 weeks’ gestation (D&E) increased from 31% in 1974 (the first year for which these data were available) to 96% in 2005, and the percentage of abortions performed by intrauter-ine instillation at >13 weeks’ gestation decreased from 57% to 0.4%; the percentage of medical abortions increased from 1.0% in 2000 to 9.9% in 2005 (Table 18) (58,59).
The proportion differential of the abortion ratio for black women and that for white women increased from 2.0 in 1989 (the first year for which black and other races were reported separately) to 3.0 in 2005 (60). In addition, the abortion rate for black women has been approximately 3 times as high as that for white women (range: 2.6–3.1) since 1991 (the first year for which rates by race were published) (61). These rates by race are substantially lower than rates previously published by NCHS (33) and indicate that the reporting areas for the 2005 report might not be truly representative of the U.S. black female population of reproductive age. In considering abortion
patterns among white and Hispanic women, Census Bureau estimates and birth certificate data play an important role because they indicate that a substantial majority of Hispanic women report themselves as white (3,26). Therefore, data for certain white women represent white women of Hispanic ethnicity.
In 2005, a total of 38 states, DC, and NYC reported Hispanic ethnicity of women who obtained abortions. Because of concerns regarding the completeness of such data (>15% unknown data) in certain states, in 2005, data from only 28 states, DC, and NYC were used to determine the number and percentage of abortions obtained by women of Hispanic ethnicity. These geographic areas represent approximately 45% of reproductive-age Hispanic women in the United States for 2005 and approximately 46% of U.S. Hispanic births (3,26). Thus, the number of Hispanic women who obtained abortions was underestimated, and the number, ratio, and rate of abor-tions for Hispanic women in this report are not generalizable to the overall Hispanic population in the United States. Moreover, the value of making comparisons between the Hispanic and non-Hispanic populations is questionable because each group is substantially diverse.
Abortion ratios for both Hispanic and non-Hispanic women have declined considerably since 1992 (31% and 27%, respec-tively). As in the past, the abortion rate for Hispanic women was higher (21 per 1,000 women) than the rate for non-Hispanic women (14 per 1,000). Race- and ethnicity-specific differences in legal induced abortion ratios and rates might reflect differences among populations in socioeconomic status, access to and use of family planning and contraceptive services, contraceptive use, and incidence of unintended pregnancies.
NCHS vital statistics reports indicate that fertility and live birth rates were substantially higher for Hispanic women as a whole than for non-Hispanic women for all age groups in 2005 (26). However, because fertility and live birth rates differ substantially among both the different Hispanic (i.e., Mexican, Puerto Rican, Cuban, and other Hispanic) and non-Hispanic (white, black, and other) subpopulations, comparisons between Hispanic and non-Hispanic populations are of limited value (26). Available abortion surveillance data do not permit cross-classification of race by Hispanic ethnicity.
Compared with the early 1970s, the annual number of deaths associated with known legal induced abortion in the first half of this decade has decreased by nearly two thirds (Table 19). In 1972, a total of 24 women died from causes known to be associated with legal abortions, and 39 died as a result of known illegal abortions. No more than two illegal abortion deaths have occurred in any year since 1979. In 2004, seven women died from causes known to be associated with legal induced abortions, and one died as a result of known illegal induced

8 MMWR November 28, 2008
abortion. National case-fatality rates for 1998–2004 cannot be calculated because a substantial number of abortions occur in nonreporting states (four states in 1998 and 1999 and three states in 2000–2004); therefore, the total number of abortions (the denominator) is unknown.
Of the seven legal induced abortion-related deaths identified in 2004, one occurred after a medical (nonsurgical) abortion procedure. This case has been described previously (62). This is the second year for which a maternal death related to a medical abortion procedure has been identified.
LimitationsThese data are reported voluntarily and are subject to at least
five limitations. First, abortion data are compiled and reported to CDC by the central health department in the reporting area in which the abortion was performed rather than the area in which the woman resided. This choice of area inflates the numbers, ratios, and rates of abortions for areas in which a high proportion of legal abortions are obtained by out-of-state resi-dents and undercounts procedures for states with limited abor-tion services, more stringent legal requirements for obtaining an abortion, or convenient geographical proximity to another state. Second, four states (Alaska, California, New Hampshire, and Oklahoma) did not report abortion data for 1998–1999, three states (Alaska, California, and New Hampshire) did not report data for 2000–2002, three states (California, New Hampshire, and West Virginia) did not report data for 2003 and 2004, and three states (California, New Hampshire, and Louisiana) did not report data for 2005. Data for California and Oklahoma were estimated before 1998; however, data for nonreporting states have not been estimated since then. Third, data provided to state or area health departments by providers might be incomplete (63). Fourth, the overall number, ratio, and rate of abortions are conservative estimates; the total numbers of legal induced abortions provided by central health agencies and reported to CDC for 2005 were probably lower than the numbers actually performed. In addition, the abortion total for 2000 provided to CDC by central health agencies are 20% lower than that reported for 2000 (the most recent year for which data are available) for the same reporting areas by The Alan Guttmacher Institute, a private organization that contacts abortion providers directly (64). A previous report documented a discrepancy of approximately 12% (65); the reasons for this larger discrepancy are unclear. Finally, because not all states collected or reported data on all characteristics (e.g., age, race, and the number of weeks’ gestation) of women obtaining a legal induced abortion in 2005, the numbers, rates, and ratios derived in this analysis might not be representative of all women who obtained abortions.
Public Health ActionsDespite these limitations, findings from ongoing national
surveillance of legal induced abortion are useful for at least five purposes. First, public health agencies use data from abortion surveillance to identify characteristics of women who are at high risk for unintended pregnancy and use this information to develop interventions to prevent such pregnancies. Second, ongoing annual surveillance is used to monitor trends in the number, ratio, and rate of abortions in the United States. Third, statistics regarding the number of pregnancies ending in abortion are used in conjunction with birth data and fetal death computations to estimate pregnancy rates (e.g., preg-nancy rates among adolescents) (27–31,33). Fourth, abortion and pregnancy rates can be used to evaluate the effectiveness of family planning programs and programs for preventing unintended pregnancy. Finally, ongoing surveillance provides data for assessing changes in clinical practice patterns related to abortion (e.g., longitudinal changes in the types of procedures and trends in weeks of gestation at the time of abortion).
The Health Insurance Portability and Accountability Act (HIPAA) was enacted by Congress in 1996 to facilitate the electronic transfer of health data relating primarily to insurance coverage and transferability (66). HIPAA provisions mandate adoption of federal privacy protections for certain individu-ally identifiable health information. The U.S. Department of Health and Human Services issued the Privacy Rule that became effective on April 14, 2003. Because the Privacy Rule exempts protected health information required for public health purposes from privacy protections, covered entities may provide such information without a person’s authorization to a public health authority (e.g., CDC) whose stated purpose is to prevent and control disease. Collection of surveillance data for this report is exempt from the Privacy Rule. However, the complexity of the rule might result in difficulties in its inter-pretation and, therefore, in collecting surveillance data on the part of certain contributing agencies (66).
Approximately one in five U.S. pregnancies have ended in abortion, according to the most recent estimates from NCHS (31). Inconsistent method use of oral contraceptive methods (75.9%) and condoms (49.3%) were the most common reasons that women became pregnant and obtained abortions (22). Unintended pregnancy is a pervasive public health problem for all population subgroups and women of reproductive age (10,61,67).
Although induced abortions usually are performed for women who have unintended pregnancies, which often occur despite the use of contraception, the approximately 4.6 million women who have had intercourse in the previous 3 months but were not using contraception might be the most at risk for

Vol. 57 / SS-13 Surveillance Summaries 9
unintended pregnancy (18). Thus, a reduction in the number of abortions will require adapting complex strategies aimed at reducing such pregnancies. Insurance coverage of reversible contraception (e.g., vasectomy and tubal ligation) has increased substantially since 1993 (68), although gaps in coverage remain substantial. Education regarding abstinence and contraceptive use, including emergency contraception, combined with access to and education regarding safe, effective contraception and family planning services, might help reduce the incidence of unintended pregnancy and, therefore, the number of legal induced abortions in the United States (69,70).
AcknowledgmentsThe authors thank Kristi Seed, Division of Reproductive Health,
National Centerfor Chronic Disease Prevention and Health Promotion, CDC, for her help with the tables.
References 1. CDC. Abortion surveillance, 1977. Atlanta, GA: US Department of
Health, Education, and Welfare, Public Health Service, CDC; 1979. 2. CDC. Abortion surveillance, 1978. Atlanta, GA: US Department of
Health and Human Services, Public Health Service, CDC; 1980. 3. US Census Bureau, Population Estimates Branch. State estimates by
demographic characteristics, 6 race group. Released August 4, 2006. Available at http://www.census.gov/popest/states/asrh/files/SC_EST2005_alldata6.txt.
4. Kochanek KD. Induced terminations of pregnancy: reporting states, 1988. Hyattsville, MD: US Department of Health and Human Servic-es, CDC, National Center for Health Statistics; 1991. (Monthly vital statistics reports; vol 39, no. 12 Suppl).
5. Office of Management and the Budget. Provisional guidance on the implementation of the 1997 standards for federal data on race and eth-nicity. Washington, DC: Office of Management and Budget; 2000. Available at http://www.ofm.wa.gov/pop/race/omb.pdf.
6. CDC. Abortion surveillance, 1972. Atlanta, GA: US Department of Health, Education, and Welfare, Public Health Service, CDC; 1974.
7. Strauss LT, Gamble S, Parker W, et al. Abortion surveillance— United States, 2004. In: Surveillance Summaries, November 23, 2007. MMWR 2007;56(No. SS-9).
8. Strauss LT, Gamble S, Parker W, et al. Abortion surveillance— United States, 2003. In: Surveillance Summaries, November 24, 2006. MMWR 2006;55(No. SS-11).
9. Koonin LM, Strauss LT, Chrisman CE, Parker WY. Abortion surveil-lance—United States, 1997. In: Surveillance Summaries, December 8, 2000. MMWR 1999;49(No. SS-11).
10. Jones RK, Darroch JE, Henshaw SK. Patterns in the socioeconomic characteristics of women obtaining abortions in 2000–2001. Perspect Sex Reprod Health 2002;34:226–35.
11. Population Division, U.S. Census Bureau. Table 1: annual estimates of the population by sex and five-year age groups for the United States: April 1, 2000 to July 1, 2007 (NC-EST2007-01). Release date: May 1, 2008. Available at http://www.census.gov/popest/national/asrh/NC-EST2007-sa.html.
12. Henshaw SK. Factors hindering access to abortion services. Fam Plann Perspect 1995;27:54–9.
13. Henshaw SK. Abortion incidence and services in the United States, 1995–1996. Fam Plann Perspect 1998;30:263–70, 287.
14. Alan Guttmacher Institute. State policies in brief. New York, NY: Alan Guttmacher Institute; 2004. Available at http://www.guttmacher.org/pubs/spib.html.
15. Ellertson C. Mandatory parental involvement in minors’ abortions: effects of the laws in Minnesota, Missouri, and Indiana. Am J Public Health 1997;87:1367–74.
16. Henshaw SK, Finer LB. The accessibility of abortion services in the United States, 2001. Perspect Sex Reprod Health 2003;35:16–24.
17. Piccinino LJ, Mosher WD. Trends in contraceptive use in the United States: 1982–1995. Fam Plann Perspect 1998;30:4–10, 46.
18. Mosher WD, Martinez GM, Chandra A, Abma JC, Willson SJ. Use of contraception and use of family planning services in the United States: 1982–2002. Advance data from vital and health statistics; no. 350. Hyattsville, Maryland: US Department of Health and Human Services, CDC, National Center for Health Statistics; 2004.
19. Abma JC, Martinez GM, Mosher WD, Dawson B. Teenagers in the United States: sexual activity, contraceptive use, and childbearing, 2002. Hyattsville, MD: US Department of Health and Human Ser-vices, CDC, National Center for Health Statistics; 2004. (Vital and Health Statistics; series 23, no. 24).
20. Darroch JE, Singh S. Why is teenage pregnancy declining? The roles of abstinence, sexual activity and contraceptive use. New York, NY: Alan Guttmacher Institute. (Occasional Report No. 1, 1999.)
21. Abma JC, Sonenstein FL. Sexual activity and contraceptive practices among teenagers in the United States, 1988 and 1995. Hyattsville, MD: US Department of Health and Human Services, CDC, National Center for Health Statistics, 2001; DHHS publication no (PHS)2001–1997. (Vital and health statistics; series 23, no. 21).
22. Jones RK, Darroch JE, Henshaw SK. Contraceptive use among U.S. women having abortions in 2000–2001. Perspect Sex Reprod Health 2002;34:294–303.
23. Henshaw SK, Singh S, Haas T. The incidence of abortion worldwide. Int Fam Plann Perspect 1999;25(Suppl):S30–S8.
24. Statistics Canada. Induced (therapeutic) abortions, 2000. The Daily: Friday, March 28, 2003. Ottawa, Canada: Statistics Canada. Available at http://www.statcan.ca/Daily/English/030328/d030328e.htm.
25. Lawlor DA, Shaw M. Teenage pregnancy rates: high compared with where and when? J Royal Soc Med 2004;97:121–3.
26. Martin JS, Hamilton BE, Sutton PD, et al. Births: final data for 2005. Hyattsville, MD: US Department of Health and Human Services, CDC, National Center for Health Statistics; 2007. (National vital sta-tistics reports; vol 56, no. 6).
27. CDC. National and state-specific pregnancy rates among adolescents—United States, 1995–1997. MMWR 2000;49:605–11.
28. Ventura SJ, Mathews TJ, Hamilton BE. Teenage births in the United States: state trends, 1991–2000, an update. Hyattsville, MD: US Depart-ment of Health and Human Services, CDC, National Center for Health Statistics; 2002. (National vital statistics reports; vol. 50, no. 9).
29. Ventura SJ, Mosher WD, Curtin SC, Abma JC, Henshaw S. Trends in pregnancies and pregnancy rates by outcome: estimates for the United States, 1976–1996. Hyattsville, MD: US Department of Health and Human Services, CDC, National Center for Health Statistics; 2000. (Vital and health statistics; series 21, no. 56).
30. Ventura SJ, Mathews TJ, Hamilton BE. Births to teenagers in the Unit-ed States, 1940–2000. Hyattsville, MD: US Department of Health and Human Services, CDC, National Center for Health Statistics, 2001. (National vital statistics reports; vol. 49, no. 10).
31. Ventura SJ, Abma JC, Mosher WD, Henshaw SK. Estimates pregnan-cy rates by outcome for the United States, 1990–2004. Hyattsville, MD: US Department of Health and Human Services, CDC, National Center for Health Statistics; 2008. (National vital statistics reports; vol 56, no. 15).
32. Ventura SJ, Curtin SC, Mathews TJ. Variations in teenage birth rates, 1991–98: national and state trends. Hyattsville, MD: US Department of Health and Human Services, CDC, National Center for Health Statistics; 2000. (National vital statistics reports; vol. 48, no. 6).

10 MMWR November 28, 2008
33. Ventura SJ, Abma JC, Mosher WD, Henshaw S. Estimated pregnancy rates for the United States, 1990–2000: an update. Hyattsville, MD: US Department of Health and Human Services, CDC, National Cen-ter for Health Statistics; 2004. (National vital statistics report; vol. 52, no. 23).
34. Ludmer PI, Nucci-Sack A, Diaz A. Adolescent abortion: trends and techniques. Curr Women’s Health Rep 2003;3:438–44.
35. Edwards J, Carson SA. New technologies permit safe abortion at less than six weeks’ gestation and provide timely detection of ectopic gesta-tion. Am J Obstet Gynecol 1997;176:1101–6.
36. Creinin MD, Edwards J. Early abortion: surgical and medical options. Curr Probl Obstet Gynecol Fertil 1997;20:1–32.
37. Bartlett LA, Berg CJ, Shulman HB, et al. Risk factors for legal induced abortion-related mortality in the United States. Obstet Gynecol 2004;103:729–37.
38. Hausknecht R. Mifepristone and misoprostol for early medical abor-tion: 18 months’ experience in the United States. Contraception 2003;67:463–5.
39. Evans MI, Wapner RJ. Future directions. Clin Perinatol 2001;28: 477–80.
40. Fielding WL, Sachtleben MR, Friedman LM, Friedman EA. Compari-son of women seeking early and late abortion. Am J Obstet Gynecol 1978;131:304–10.
41. Tietze C, Henshaw SK. Induced abortion: a world review, 1986. 6th ed. New York, NY: Alan Guttmacher Institute; 1986:29–52.
42. Kahn JG, Becker BJ, MacIsaa L, et al. The efficacy of medical abortion: a meta-analysis. Contraception 2000;61:29–40.
43. Joffe C. Medical abortion in social context. Am J Obstet Gynecol 2000;183(Suppl):S10–S15.
44. World Health Organisation Task Force on Post Ovulatory Methods of Fertility Regulation. Comparison of two doses of mifepristone in com-bination with misoprostol for early medical abortion: a randomized trial. Br J Obstet Gynaecol 2000;107:524–30.
45. El-Refaey H, Rajasekar D, Abdalla M, Calder L, Templeton A. Induc-tion of abortion with mifepristone (RU 486) and oral or vaginal miso-prostol. N Engl J Med 1995;332:983–7.
46. Clark WH, Hassoun D, Gemzell-Danielsson K, Fiala C, Winikoff B. Home use of two doses of misoprostol after mifepristone for medical abortion: a pilot study in Sweden and France. European J Contracept Reprod Health Care 2005;10:184–91.
47. Ashok PW, Penney GC, Flett GMM, Templeton A. An effective regi-men for early medical abortion: a report of 2000 consecutive cases. Hum Reprod 1998;13:2962–5.
48. Schaff EA, Fielding SL, Westhoff C, et al. Vaginal misoprostol admin-istered 1, 2, or 3 days after mifepristone for early medical abortion: a randomized trial. JAMA 2000;284:1948–53.
49. Tang OS, Chan CC, Kan AS, Ho PC. A prospective randomized comparison of sublingual and oral misoprostol when combined with mifepristone for medical abortion at 12–20 weeks gestation. Human Reprod 2005;20:3062–6.
50. Schreiber CA, Creinin MD, Harwood B, Murthy AS. A pilot study of mifepristone and misoprostol administered at the same time for abortion in women with gestation from 50 to 63 days. Contraception 2005;71:447–50.
51. Ngai SW, Tang OS, Chan YM, Ho PC. Vaginal misoprostal alone for medical abortion up to 9 weeks of gestation: efficacy and acceptability. Human Reprod 2000;15:1159–62.
52. Child TJ, Thomas J, Rees M, MacKenzie IZ. A comparative study of surgical and medical procedures: 932 pregnancy terminations up to 63 days gestation. Human Reprod 2001;16:67–71.
53. Ashok PW, Templeton A. Nonsurgical mid-trimester termination of pregnancy: a review of 500 consecutive cases. Br J Obstet Gynaecol 1999;106:706–10.
54. Tang OS, Ting Lau WN, Wai Chan CC, Ho PC. A prospective ran-domized comparison of sublingual and vaginal misoprostol in second trimester termination of pregnancy. BJOG 2004;111:1001–5.
55. CDC. Handbook on the reporting of induced termination of pregnan-cy. Hyattsville, MD: US Department of Health and Human Services, CDC, National Center for Health Statistics; 1998; DHHS publication no. (PHS)98 1117:1–18.
56. Cates W Jr, Schulz KF, Grimes DA, et al. Dilatation and evacuation procedures and second-trimester abortions: the role of physician skill and hospital setting. JAMA 1982;248:559–63.
57. Grimes DA. Second-trimester abortions in the United States. Fam Plann Perspect 1984;16:260–6.
58. CDC. Abortion surveillance, 1974. Atlanta, GA: US Department of Health, Education, and Welfare, Public Health Service, CDC; 1976.
59. CDC. Abortion surveillance—United States, 2000. In: Surveillance Summaries, November 28, 2003. MMWR 2003;52(No. SS-12).
60. Koonin LM, Smith JC, Ramick M, Lawson HW. Abortion surveil-lance—United States, 1989. In: Surveillance Summaries, September 4, 1992. MMWR 1992;41(No. SS-5).
61. CDC. Abortion surveillance—United States, 1991. In: Surveillance Summaries, May 5, 1995. MMWR 1995;44(No. SS-2).
62. Fischer M, Bhatnagar J, Guarner J, Reagan S, Hacker JK, Van Meter SH. Fatal toxic shock syndrome associated with Clostridium sordellii after medical abortion. N Engl J Med. 2005;353:2352–60.
63. Henshaw SK, Feivelson DJ. Teenage abortion and pregnancy statistics by state, 1996. Fam Plann Perspect 2000;32:272–80.
64. Finer LB, Henshaw SK. Abortion incidence and services in the United States in 2000. Perspect Sex Reprod Health 2003;35:6–15.
65. CDC. Abortion surveillance—United States, 1996. In: Surveillance Summaries, July 30, 1999. MMWR 1999;48(No. SS-4).
66. CDC. HIPAA Privacy Rule and public health: guidance from CDC and the U.S. Department of Health and Human Services. In Surveil-lance Summaries, May 2, 2003. MMWR 2003;52(No. SS-l).
67. Henshaw SK. Unintended pregnancy in the United States. Fam Plann Perspect 1998;30:24–9, 46.
68. Sonfield A, Gold RB, Frost JJ, Darroch JE. U.S. insurance coverage of contraceptives and the impact of contraceptive coverage mandates, 2002. Perspect Sex Reprod Health 2004;36:72–9.
69. Gonen JS. Value purchasing: investing in women’s health: strategies for employers. Washington, DC: Jacobs Institute of Women’s Health; 2000.
70. Grimes DA, Creinin, MD. Induced abortion: an overview for inter-nists. Ann Intern Med 2004;140:620–6.

Vol. 57 / SS-13 Surveillance Summaries 11
Rate
0
0.2
0.4
0.6
0.8
1.0
1.2
1.4
1.6
1.8
100
200
300
400Ratio
§
Num
ber (
milli
ons)
1974 1977 1980 1983 1986 1989 1992 1995 1998 2001 2004
Year
RatioRateNumber
0
5
10
15
20
25
30
FIGURE 1. Number, ratio,* and rate† of legal abortions performed, by year — United States, 1974–2005§
* Number of abortions per 1,000 live births.† Number of abortions per 1,000 women aged 15–44 years.§ For 1995–2005, data are from 46 reporting areas (see Table 2).
0
200
400
600
800
1,000
<15 15–19 20–24 25–29 30–34 35–39 >40
Age group (yrs)
Ra
tio
FIGURE 2. Abortion ratio,* by age group of women who obtained a legal abortion — selected states,† United States, 2005
* Number of abortions per 1,000 live births.† Data are from 46 states, the District of Columbia, and New York City (see Table 4).

12 MMWR November 28, 2008
Year
§
<15
15–19
20–34
35–39
>40
0
200
400
600
800
1,000
1,200
1,400
1,600
1,800
2,000
Year
Ra
tio
1973 1976 1979 1982 1985 1988 1991 1994 1997 2000 2003 2005
FIGURE 3. Abortion ratio,* by age group† of women who obtained a legal abortion — selected areas,§ United States, 1973–2005
* Number of abortions per 1,000 live births.† In years.§ For 1998–1999 and 2003–2005, data are from 47 reporting areas and for 2000–2002, from 48 reporting areas.
0
10
20
30
40
50
60
70
80
90
100
<15 15–19 20–24 25–29 30–34 35–39 >40
Age group (yrs)
Early 9–15 weeks Late
Pe
rce
nta
ge
FIGURE 4. Percentage* of women who obtained early† or late§ abortions, by age group — selected states,¶ United States, 2005
* Based on total known weeks of gestation.† <8 weeks’ gestation.§ >16 weeks’ gestation.¶ Data are for 40 states, District of Columbia, and New York City; excludes three state (Mississippi, Nebraska, and Nevada) in which gestational age was
unknown for >15% of women (see Table 16).

Vol. 57 / SS-13 Surveillance Summaries 13
TABLE 1. Characteristics of women who obtained legal abortions — United States, 1973–2005Characteristics 1973 1974 1975 1976 1977 1978 1979 1980 1981 1982 1983
Reported no. of legal abortions* 615,831 763,476 854,853 988,267 1,079,430 1,157,776 1,251,921 1,297,606 1,300,760 1,303,980 1,268,987
Percent distribution§
ResidenceIn-state/area 74.8 86.6 89.2 90.0 90.0 89.3 90.0 92.6 92.5 92.9 93.3Out-of-state/area 25.2 13.4 10.8 10.0 10.0 10.7 10.0 7.4 7.5 7.1 6.7
Age (yrs)<19 32.7 32.6 33.1 32.1 30.8 30.0 30.0 29.2 28.0 27.1 27.1
20–24 32.0 31.8 31.9 33.3 34.5 35.0 35.4 35.5 35.3 35.1 34.7>25 35.3 35.6 35.0 34.6 34.7 35.0 34.6 35.3 36.7 37.8 38.2
Race¶
White 72.5 69.7 67.8 66.6 66.4 67.0 68.9 69.9 69.9 68.5 67.6Black 27.5 30.3 32.2 33.4 33.6 33.0 31.1 30.1 30.1 31.5 32.4Other** —†† — — — — — — — — — —
EthnicityHispanic — — — — — — — — — — —Non-Hispanic — — — — — — — — — — —
Marital statusMarried 27.4 27.4 26.1 24.6 24.3 26.4 24.7 23.1 22.1 22.0 21.4Unmarried 72.6 72.6 73.9 75.4 75.7 73.6 75.3 76.9 77.9 78.0 78.6
No. of live births§§ 0 48.6 47.9 47.1 47.7 53.4 56.6 58.1 58.4 58.3 57.8 57.11 18.8 19.6 20.2 20.7 19.0 19.2 19.1 19.4 19.7 20.3 20.72 14.2 14.8 15.5 15.4 14.4 14.1 13.8 13.7 13.7 13.9 14.23 8.7 8.7 8.7 8.3 7.0 5.9 5.5 5.3 5.3 5.1 5.2
>4 9.7 9.0 8.5 7.9 6.2 4.2 3.5 3.2 3.0 2.9 2.8
Type of procedureCurettage 88.4 89.7 91.0 92.8 93.7 94.6 95.0 95.5 96.1 96.5 96.8 Suction curettage 74.9 77.4 82.6 82.6 90.7 90.2 91.3 89.8 90.4 90.7 91.1 Sharp curettage 13.5 12.3 8.4 10.2 3.0 4.4 3.7 5.7 5.7 5.8 5.7Intrauterine instillation 10.3 7.8 6.2 6.0 5.4 3.9 3.3 3.1 2.8 2.5 2.1Hysterotomy/hysterectomy¶¶ 0.7 0.6 0.4 0.3 0.2 0.1 0.1 0.1 0.1 0.0 0.0Other¶¶ 0.6 1.9 2.4 0.9 0.7 1.4 1.6 1.3 1.0 1.0 1.1
Weeks of gestation<8 36.1 42.6 44.6 47.0 51.1 52.2 52.1 51.7 51.2 50.6 49.7<6 — — — — — — — — — — —
7 — — — — — — — — — — —8 — — — — — — — — — — —
9–10 29.4 28.7 28.4 28.1 27.2 26.9 26.9 26.2 26.8 26.7 26.811–12 17.9 15.4 14.9 14.4 13.1 12.3 12.5 12.2 12.1 12.4 12.813–15 6.9 5.5 5.0 4.5 3.4 4.0 4.2 5.1 5.2 5.3 5.816–20 8.0 6.6 6.1 5.1 4.3 3.7 3.4 3.9 3.7 3.9 3.9
>21 1.7 1.2 1.0 0.9 0.9 0.9 0.9 0.9 1.0 1.1 1.0 * See Table 2 for number of areas reporting each year. † With two exceptions (i.e., Louisiana and West Virginia), no characteristics were available for the excluded states in years before 1998. Alaska data were available for 2004;
Oklahoma for 2000–2003; West Virginia for 1995–2002; and Louisiana data not available for 2005. § Based on known values in data from all areas reporting a given characteristic with <15% unknowns. The number of areas adequately reporting a given characteristic varied.
For 2005, the number of areas included for residence was 47; age, 48; race, 38; ethnicity, 30; marital status, 43; number of previous live births, 40; number of previous induced abortions, 42; type of procedure, 45; and weeks of gestation, 42. Early numbers might differ (by 0.1%) from numbers previously published because of adjusting percentages to total 100.0%.
¶ Black race reported as black and other races through 1984. For 1990–1997, one state included “other” races with blacks. ** Includes all other races. †† Not available. §§ For 1973–1977, data indicate number of living children. ¶¶ Hysterotomy and hysterectomy included in “other” beginning in 1984. “Other” also included procedures reported as “other” and medical (nonsurgical) procedures (see Table
8) beginning in 1996. For 2005, the number of medical (nonsurgical) procedures reported was 66,487. *** Data for 36 of 39 areas reporting weeks of gestation. ††† Data for 38 of 41 areas reporting weeks of gestation. §§§ Data for 38 of 40 areas reporting weeks of gestation. ¶¶¶ Data for 37 of 40 areas reporting weeks of gestation. **** Data for 40 of 42 areas reporting weeks of gestation. †††† Data for 42 of 44 areas reporting weeks of gestation. §§§§ Data for 41 of 43 areas reporting weeks of gestation. ¶¶¶¶ Data for 41 of 44 areas reporting weeks of gestation. ***** Data for 39 of 40 areas reporting weeks of gestation.

14 MMWR November 28, 2008
TABLE 1. (Continued) Characteristics of women who obtained legal abortions — United States, 1973–2005Characteristics 1984 1985 1986 1987 1988 1989 1990 1991 1992 1993 1994
Reported no. of legal abortions* 1,333,521 1,328,570 1,328,112 1,353,671 1,371,285 1,396,658 1,429,247 1,388,937 1,359,146 1,330,414 1,267,415
Percent distribution§
ResidenceIn-state/area 92.0 92.4 92.4 91.7 91.4 91.0 91.8 91.7 92.1 91.4 91.5Out-of-state/area 8.0 7.6 7.6 8.3 8.6 9.0 8.2 8.3 7.9 8.6 8.5
Age (yrs)<19 26.4 26.3 25.3 25.8 25.3 24.2 22.4 21.0 20.1 20.0 20.2
20–24 35.3 34.7 34.0 33.4 32.8 32.6 33.2 34.4 34.5 34.4 33.5>25 38.3 39.0 40.7 40.8 41.9 43.2 44.4 44.6 45.4 45.6 46.3
Race¶
White 67.4 66.7 67.0 66.4 64.4 64.2 64.8 63.9 61.6 60.9 60.6Black 32.6 29.8 28.7 29.3 31.1 31.2 31.9 32.5 33.9 34.9 34.7Other** —†† 3.5 4.3 4.3 4.5 4.6 3.3 3.6 4.5 4.2 4.7
EthnicityHispanic — — — — — — 11.4 13.2 15.0 14.5 14.1Non-Hispanic — — — — — — 88.6 86.8 85.0 85.5 85.9
Marital statusMarried 20.5 19.3 20.2 20.8 20.3 20.1 21.7 21.4 20.8 20.4 19.9Unmarried 79.5 80.7 79.8 79.2 79.7 79.9 78.3 78.6 79.2 79.6 80.1
No. of live births§§ 0 57.0 56.3 55.1 53.6 52.4 52.2 49.1 47.8 45.9 46.5 46.21 20.9 21.6 22.1 22.8 23.4 23.6 24.4 25.3 25.9 25.8 25.92 14.4 14.5 14.9 15.5 16.0 15.9 17.0 17.5 18.0 17.8 17.83 5.1 5.1 5.3 5.5 5.6 5.7 6.1 6.4 6.7 6.6 6.7
>4 2.6 2.5 2.6 2.6 2.6 2.6 3.4 3.0 3.5 3.3 3.4
Type of procedureCurettage 96.8 97.5 97.0 97.2 98.6 98.8 98.9 99.0 98.9 99.1 99.1 Suction curettage 93.1 94.6 94.5 93.4 95.1 97.1 97.2 96.5 95.7 95.5 96.5 Sharp curettage 3.7 2.9 2.5 3.8 3.5 1.7 1.7 2.5 3.2 3.6 2.6Intrauterine instillation 1.9 1.7 1.4 1.3 1.1 0.9 0.8 0.6 0.7 0.6 0.5Other¶¶ 1.3 0.8 1.6 1.5 0.3 0.3 0.3 0.4 0.4 0.3 0.4
Weeks of gestation<8 50.5 50.3 51.0 50.4 48.7 49.8 51.6 52.4 52.1 52.3 53.7<6 — — — — — — — — 14.3*** 14.7††† 15.7§§§
7 — — — — — — — — 15.6***¶¶¶ 16.2††† 16.5§§§
8 — — — — — — — — 22.2*** 21.6††† 21.6§§§
9–10 26.4 26.6 25.8 26.0 26.4 25.8 25.3 25.1 24.2 24.4 23.511–12 12.6 12.5 12.2 12.4 12.7 12.6 11.7 11.5 12.1 11.6 10.913–15 5.8 5.9 6.1 6.2 6.6 6.6 6.4 6.1 6.0 6.3 6.316–20 3.9 3.9 4.1 4.2 4.5 4.2 4.0 3.8 4.2 4.1 4.3
>21 0.8 0.8 0.8 0.8 1.1 1.0 1.0 1.1 1.4 1.3 1.3 * See Table 2 for number of areas reporting each year. † With two exceptions (i.e., Louisiana and West Virginia), no characteristics were available for the excluded states in years before 1998. Alaska data were available for 2004;
Oklahoma for 2000–2003; West Virginia for 1995–2002; and Louisiana data not available for 2005. § Based on known values in data from all areas reporting a given characteristic with <15% unknowns. The number of areas adequately reporting a given characteristic varied.
For 2005, the number of areas included for residence was 47; age, 48; race, 38; ethnicity, 30; marital status, 43; number of previous live births, 40; number of previous induced abortions, 42; type of procedure, 45; and weeks of gestation, 42. Early numbers might differ (by 0.1%) from numbers previously published because of adjusting percentages to total 100.0%.
¶ Black race reported as black and other races through 1984. For 1990–1997, one state included “other” races with blacks. ** Includes all other races. †† Not available. §§ For 1973–1977, data indicate number of living children. ¶¶ Hysterotomy and hysterectomy included in “other” beginning in 1984. “Other” also included procedures reported as “other” and medical (nonsurgical) procedures (see Table
8) beginning in 1996. For 2005, the number of medical (nonsurgical) procedures reported was 66,487. *** Data for 36 of 39 areas reporting weeks of gestation. ††† Data for 38 of 41 areas reporting weeks of gestation. §§§ Data for 38 of 40 areas reporting weeks of gestation. ¶¶¶ Data for 37 of 40 areas reporting weeks of gestation. **** Data for 40 of 42 areas reporting weeks of gestation. †††† Data for 42 of 44 areas reporting weeks of gestation. §§§§ Data for 41 of 43 areas reporting weeks of gestation. ¶¶¶¶ Data for 41 of 44 areas reporting weeks of gestation. ***** Data for 39 of 40 areas reporting weeks of gestation.

Vol. 57 / SS-13 Surveillance Summaries 15
TABLE 1. (Continued) Characteristics of women who obtained legal abortions — United States, 1973–2005Characteristics 1995 1996 1997 1998 1999 2000 2001 2002 2003 2004 2005
Reported no. of legal abortions* 1,210,883 1,225,937 1,186,039 884,273 861,789 857,475 853,485 854,122 848,163 839,226 820,151
Reported no. of legal abor-tions excluding AK, CA, LA, NH, OK, WV† 905,577 932,079 897,363 881,535 859,291 847,744 844,115 845,573 839,713 830,577 809,881
Percent distribution§
ResidenceIn-state/area 91.5 91.7 91.8 91.4 91.2 91.3 91.3 91.2 91.5 92.1 91.7Out-of-state/area 8.5 8.3 8.2 8.6 8.8 8.7 8.7 8.8 8.5 7.9 8.3
Age (yrs)<19 20.1 20.3 20.1 19.8 19.2 18.8 18.1 17.5 17.4 17.4 17.1
20–24 32.5 31.8 31.7 31.8 32.2 32.8 33.4 33.4 33.5 32.8 32.8>25 47.4 47.9 48.2 48.4 48.6 48.4 48.5 49.1 49.1 49.8 50.1
Race¶
White 59.6 59.1 58.4 58.7 56.2 56.6 55.4 55.5 55.0 54.1 55.1Black 35.0 35.3 35.9 35.4 37.3 36.3 36.6 36.6 37.1 38.2 36.9Other** 5.4 5.6 5.7 5.9 6.5 7.1 8.0 7.9 7.9 7.7 8.0
EthnicityHispanic 15.1 15.7 15.6 17.1 17.3 17.2 17.1 18.2 18.1 21.5 20.3Non-Hispanic 84.9 84.3 84.4 82.9 82.7 82.8 82.9 81.8 81.9 78.5 79.7
Marital statusMarried 19.7 19.6 19.0 18.9 19.2 18.7 18.4 18.1 17.9 17.2 16.9Unmarried 80.3 80.4 81.0 81.1 80.8 81.3 81.6 81.9 82.1 82.8 83.1
No. of live births§§ 0 45.2 44.2 42.2 41.1 40.6 40.0 45.2 40.0 40.2 41.0 41.01 26.5 26.8 27.6 27.9 27.9 27.7 25.2 27.3 27.1 26.8 26.62 18.0 18.4 19.1 19.6 19.8 20.1 18.4 20.2 20.1 19.7 19.83 6.8 7.0 7.3 7.5 7.7 7.9 7.3 8.2 8.2 8.1 8.2
>4 3.5 3.6 3.8 3.9 4.0 4.3 3.9 4.3 4.4 4.5 4.4
Type of procedureCurettage 98.9 98.8 98.3 98.3 98.2 97.9 95.5 92.4 90.0 88.6 87.1 Suction curettage 96.6 96.5 97.3 96.8 96.0 95.6 92.8 90.0 88.3 87.4 86.2 Sharp curettage 2.3 2.3 1.0 1.5 2.2 2.3 2.7 2.4 1.7 1.2 0.9Intrauterine instillation 0.5 0.4 0.4 0.3 0.2 0.4 0.6 0.8 0.9 0.6 0.8Other¶¶ 0.6 0.8 1.3 1.4 1.6 1.7 3.9 6.8 9.1 10.8 12.1
Weeks of gestation<8 54.0 54.6 55.4 55.7 57.6 58.1 59.1 60.5 60.5 61.4 62.1<6 15.7††† 16.3§§§ 17.6**** 19.2†††† 21.9§§§§ 23.3§§§§ 24.9**** 27.1†††† 26.9†††† 28.1¶¶¶¶ 29.6*****
7 17.1††† 17.4§§§ 18.1**** 17.8†††† 17.6§§§§ 17.8§§§§ 17.9**** 17.8†††† 18.1†††† 18.1¶¶¶¶ 18.1*****8 21.2††† 21.0§§§ 19.6**** 18.8†††† 18.2§§§§ 17.1§§§§ 16.4**** 15.6†††† 15.5†††† 15.2¶¶¶¶ 14.6*****
9–10 23.1 22.6 22.0 21.5 20.2 19.8 19.0 18.4 18.0 17.6 17.111–12 10.9 11.0 10.7 10.9 10.2 10.2 10.0 9.6 9.7 9.3 9.313–15 6.3 6.0 6.2 6.4 6.2 6.2 6.2 6.0 6.2 6.3 6.316–20 4.3 4.3 4.3 4.1 4.3 4.3 4.3 4.1 4.2 4.0 3.8
>21 1.4 1.5 1.4 1.4 1.5 1.4 1.4 1.4 1.4 1.4 1.4 * See Table 2 for number of areas reporting each year. † With two exceptions (i.e., Louisiana and West Virginia), no characteristics were available for the excluded states in years before 1998. Alaska data were available for 2004;
Oklahoma for 2000–2003; West Virginia for 1995–2002; and Louisiana data not available for 2005. § Based on known values in data from all areas reporting a given characteristic with <15% unknowns. The number of areas adequately reporting a given characteristic varied.
For 2005, the number of areas included for residence was 47; age, 48; race, 38; ethnicity, 30; marital status, 43; number of previous live births, 40; number of previous induced abortions, 42; type of procedure, 45; and weeks of gestation, 42. Early numbers might differ (by 0.1%) from numbers previously published because of adjusting percentages to total 100.0%.
¶ Black race reported as black and other races through 1984. For 1990–1997, one state included “other” races with blacks. ** Includes all other races. †† Not available. §§ For 1973–1977, data indicate number of living children. ¶¶ Hysterotomy and hysterectomy included in “other” beginning in 1984. “Other” also included procedures reported as “other” and medical (nonsurgical) procedures (see Table
8) beginning in 1996. For 2005, the number of medical (nonsurgical) procedures reported was 66,487. *** Data for 36 of 39 areas reporting weeks of gestation. ††† Data for 38 of 41 areas reporting weeks of gestation. §§§ Data for 38 of 40 areas reporting weeks of gestation. ¶¶¶ Data for 37 of 40 areas reporting weeks of gestation. **** Data for 40 of 42 areas reporting weeks of gestation. †††† Data for 42 of 44 areas reporting weeks of gestation. §§§§ Data for 41 of 43 areas reporting weeks of gestation. ¶¶¶¶ Data for 41 of 44 areas reporting weeks of gestation. ***** Data for 39 of 40 areas reporting weeks of gestation.

16 MMWR November 28, 2008
TABLE 2. Number, ratio,* and rate† of legal abortions and source of reporting for all reporting areas and for the 46 areas that reported in 1998–2005, by year — United States, 1970–2005
Year No. of legal abortions Ratio* Rate†
No. of areas reporting
Central health agency§ Hospitals/Facilities¶
All reporting areas1970 193,491 52 5 8 71971 485,816 137 11 19 71972 586,760 180 13 21 81973 615,831 196 14 26 261974 763,476 242 17 37 151975 854,853 272 18 39 131976 988,267 312 21 41 111977 1,079,430 325 22 46 61978 1,157,776 347 23 48 41979 1,251,921 358 24 47 51980 1,297,606 359 25 47 51981 1,300,760 358 24 46 61982 1,303,980 354 24 46 61983 1,268,987 349 23 46 61984 1,333,521 364 24 44 81985 1,328,570 354 24 44 81986 1,328,112 354 23 43 91987 1,353,671 356 24 45 71988 1,371,285 352 24 45 71989 1,396,658 346 24 45 71990 1,429,247 344 24 46 61991 1,388,937 338 24 47 51992 1,359,146 334 23 47 51993 1,330,414 333 23 47 51994 1,267,415 321 21 47 51995 1,210,883 311 20 48 41996 1,225,937 315** 21 48 41997 1,186,039 306 20 48 41998†† 884,273 264 17 48 01999†† 861,789 256 17 48 02000§§ 857,475 245 16 49 02001§§ 853,485 246 16 49 02002§§ 854,122 246 16 49 02003¶¶ 848,163 241 16 49 02004¶¶ 839,226 238 16 49 02005*** 820,151 233 15 49 0
46 Reporting areas†††
1995 894,086 280 18 45 11996 920,214 288** 18 45 11997 885,624 277 18 44 21998 870,184 267 17 46 01999 847,283 258 17 46 02000 836,360 249 16 46 02001 833,183 250 16 46 02002 835,122 251 16 46 02003 829,071 258 16 46 02004 819,353 241 16 46 02005 809,881 236 16 46 0
* Number of abortions per 1,000 live births. † Number of abortions per 1,000 women aged 15–44 years. § State health departments and the health departments of New York City and the District of Columbia. ¶ Hospitals or other medical facilities in state. ** Beginning in 1996, the ratio was based on births reported by the National Center for Health Statistics, CDC. †† Without estimates for Alaska, California, New Hampshire, and Oklahoma, which did not report number of legal abortions for 1998–1999. §§ Without estimates for Alaska, California, and New Hampshire, which did not report number of legal abortions for 1998–2002. ¶¶ Without estimates for California, New Hampshire, and West Virginia, which did not report number of legal abortions for 2003 and 2004. *** Without estimates for California, New Hampshire, and Louisiana, which did not report for 2005. ††† Without estimates for Alaska, which did not report number of legal abortions for 1998–2002; for California and New Hampshire, which did not report for
1998–2004; for Oklahoma, which did not report for 1998–1999; for West Virginia, which did not report for 2003-2004; and for Louisiana, which did not report for 2005.

Vol. 57 / SS-13 Surveillance Summaries 17
TABLE 3. Reported number,* ratio,† and rate§ of legal abortions, by residence and occurrence, and percentage of abortions obtained by out-of-state residents,¶ by state of occurrence — United States, 2005
State/Area
Residence Occurrence % of legal abortions obtained by out-of-
state residentsNo. of legal abortions Ratio Rate
No. of legal abortions Ratio Rate
Alabama 9,905 164 11 11,211 185 12 16.8Alaska 2,207 211 15 1,955 187 14 0.3Arizona** 10,786 112 9 10,723 111 9 3.1Arkansas 4,862 124 9 4,695 120 8 13.5California†† —§§ — — — — — —Colorado 10,636 154 11 11,682 169 12 9.7Connecticut 12,501 300 17 12,110 290 17 3.1Delaware¶¶ 3,275 281 18 4,148 356 23 26.9Dist. Of Columbia 2,181 274 15 2,518 316 17 50.7Florida*** — — — 92,513 409 27 —Georgia 28,440 200 14 31,680 223 16 11.6Hawaii 3,538 197 14 3,548 198 14 0.5Idaho 1,843 80 6 1,099 48 4 3.1Illinois 39,317 220 15 43,409 242 16 7.9Indiana 11,741 135 9 10,686 123 8 3.9Iowa¶¶ 5,672 144 10 5,881 150 10 11.3Kansas 5,643 141 10 10,462 262 19 47.0Kentucky 2,594 46 3 3,776 67 4 —Louisiana†† — — — — — — —Maine 2,535 180 10 2,653 188 10 5.2Maryland¶¶ 10,875 145 9 10,797 144 9 14.7Massachusetts** 23,219 302 17 23,268 303 17 4.3Michigan 24,938 195 12 25,209 197 12 2.8Minnesota 12,840 181 12 13,362 188 12 7.9Mississippi 6,286 148 10 3,041 72 5 2.8Missouri 13,968 178 12 7,977 101 7 8.2Montana 2,021 174 11 2,155 186 12 8.1Nebraska 2,810 107 8 3,173 121 9 14.7Nevada 9,949 267 20 10,565 283 21 6.3New Hampshire†† — — — — — — —New Jersey††† 31,590 278 18 31,230 274 17 5.5New Mexico 6,273 218 16 5,934 206 15 5.6New York 118,861 482 29 124,849 507 30 —City 82,925 706 — 88,891§§§ 756 — 7.1¶¶¶
State 35,936**** 279 — 35,958 279 — 6.8¶¶¶
North Carolina 27,521 224 15 32,335 263 18 16.9North Dakota 882 105 7 1,231 147 10 36.8Ohio 32,019 216 14 34,128 230 15 8.1Oklahoma 7,018 135 10 6,641 128 9 4.0Oregon 10,432 227 14 11,602 253 16 12.3Pennsylvania 36,852 253 15 34,909 240 14 4.1Rhode Island 4,035 318 18 5,091 401 22 23.0South Carolina 12,278 213 14 6,716 116 8 3.9South Dakota 916 80 6 805 70 5 18.3Tennessee 13,850 169 11 16,178 198 13 21.3Texas 74,569 193 15 77,108 200 15 3.5Utah 3,445 67 6 3,556 69 6 7.8Vermont 1,466 233 12 1,620 257 13 10.6Virginia 27,576 264 17 26,309 252 16 4.7Washington 24,242 293 18 24,108 292 18 5.0West Virginia†† 2,089 100 6 1,674 80 5 13.3Wisconsin¶¶ 10,798 152 10 9,817 138 9 2.6Wyoming 904 125 9 14 2†††† 0†††† 0.0Other residence§§§§ 2,759 — — NA¶¶¶¶ NA NA NATotal known 716,496 820,151 233 15 8.3

18 MMWR November 28, 2008
TABLE 3. (Continued) Reported number,* ratio,† and rate§ of legal abortions, by residence and occurrence, and percentage of abortions obtained by out-of-state residents,¶ by state of occurrence — United States, 2005
State/Area
Residence Occurrence % of legal abortions obtained by out-of-
state residentsNo. of legal abortions Ratio Rate
No. of legal abortions Ratio Rate
Unknown residence***** 6,901
Not reported by residence††††† 96,754
Total 820,151 233 15 * Abortion data reported by central health agencies. † Number of abortions per 1,000 live births. Number of live births obtained. Source: Martin JA, Hamilton BE, Sutton PD,Ventura SJ, Menacker F, Kirmeyer S. Births: final data
for 2004. Atlanta, GA: US Department of Health and Human Services, CDC, National Center for Health Statistics; 2006. (National Vital Statistics Reports; vol. 55, no. 1). § Number of abortions per 1,000 women aged 15–44 years. Source: US Bureau of the Census, Population Estimates Branch, state estimates by demographic characteristics,
6 race group. Released August 4, 2006. Available at http://www.census.gov/popest/states/ASRH/files/SC_EST2005_alldata6.txt. ¶ Based on number of abortions for which residence of women were known. ** Reported numbers of abortions for in-state residents without detailed information regarding out-of-state residents. †† State did not report abortions. §§ Not available. ¶¶ Reported for own residents only. *** State reported abortions by occurrence only. ††† Numbers do not include private physicians’ procedures. §§§ Reported by the New York City Department of Health. ¶¶¶ Percentage based on number of abortions reported as “out-of-reporting area.” **** Abortions for women whose state of residence was listed as “New York.” †††† Ratio and rate not provided because of small numbers. §§§§ Women whose residence was listed as Canada, Mexico, or “other.” ¶¶¶¶ Not applicable. ***** Reported as unknown residence (6,901) or out-of-state residence, but not specified (2,759). ††††† Total for states that did not report abortions by residence.

Vol. 57 / SS-13 Surveillance Summaries 19
TABLE 4. Reported legal abortions, by age group of women who obtained an abortion and state of occurrence — selected states,* United States, 2005
State/Area
Age group (yrs)
Total<15 15–19 20–24 25–29 30–34 35–39 >40 Unknown
No. (%) No. (%) No. (%) No. (%) No. (%) No. (%) No. (%) No. (%) No. (%)†
Alabama 97 (0.9) 1,992 (17.8) 3,917 (34.9) 2,575 (23.0) 1,577 (14.1) 788 (7.0) 260 (2.3) 5 (0.0) 11,211 (100.0)Alaska 12 (0.6) 374 (19.1) 679 (34.7) 421 (21.5) 242 (12.4) 146 (7.5) 77 (3.9) 4 (0.2) 1,955 (100.0)Arizona 55 (0.5) 1,868 (17.4) 3,582 (33.4) 2,267 (21.1) 1,372 (12.8) 822 (7.7) 317 (3.0) 440 (4.1) 10,723 (100.0)Arkansas 45 (1.0) 740 (15.8) 1,588 (33.8) 1,070 (22.8) 727 (15.5) 395 (8.4) 129 (2.7) 1 (0.0) 4,695 (100.0)Colorado 79 (0.7) 2,077 (17.8) 3,911 (33.5) 2,475 (21.2) 1,614 (13.8) 1,038 (8.9) 447 (3.8) 41 (0.4) 11,682 (100.0)Connecticut 87 (0.7) 2,216 (18.3) 3,942 (32.6) 2,749 (22.7) 1,602 (13.2) 1,019 (8.4) 340 (2.8) 155 (1.3) 12,110 (100.0)Delaware§ 20 (0.7) 555 (18.3) 1,082 (35.7) 685 (22.6) 371 (12.2) 242 (8.0) 76 (2.5) 0 (0.0) 3,031 (100.0)Dist. of Columbia 25 (1.0) 433 (17.2) 785 (31.2) 628 (24.9) 368 (14.6) 204 (8.1) 75 (3.0) 0 (0.0) 2,518 (100.0)Georgia 246 (0.8) 4,656 (14.7) 10,048 (31.7) 7,927 (25.0) 5,103 (16.1) 2,796 (8.8) 904 (2.9) 0 (0.0) 31,680 (100.0)Hawaii 19 (0.5) 678 (19.1) 1,173 (33.1) 771 (21.7) 472 (13.3) 303 (8.5) 127 (3.6) 5 (0.1) 3,548 (100.0)Idaho§ 6 (0.5) 208 (18.9) 330 (30.0) 267 (24.3) 138 (12.6) 107 (9.7) 43 (3.9) 0 (0.0) 1,099 (100.0)Illinois§,¶ 237 (0.6) 6,672 (17.5) 11,753 (30.8) 9,103 (23.9) 5,810 (15.2) 3,400 (8.9) 1,178 (3.1) 0 (0.0) 38,153 (100.0)Indiana 41 (0.4) 1,716 (16.1) 3,676 (34.4) 2,476 (23.2) 1,519 (14.2) 844 (7.9) 297 (2.8) 117 (1.1) 10,686 (100.0)Iowa 32 (0.5) 1,055 (17.9) 2,051 (34.9) 1,311 (22.3) 779 (13.2) 455 (7.7) 179 (3.0) 19 (0.3) 5,881 (100.0)Kansas 56 (0.5) 1,771 (16.9) 3,614 (34.5) 2,457 (23.5) 1,419 (13.6) 842 (8.0) 303 (2.9) 0 (0.0) 10,462 (100.0)Kentucky 23 (0.6) 543 (14.4) 1,276 (33.8) 863 (22.9) 554 (14.7) 363 (9.6) 124 (3.3) 30 (0.8) 3,776 (100.0)Maine 12 (0.5) 510 (19.2) 863 (32.5) 569 (21.4) 329 (12.4) 201 (7.6) 91 (3.4) 78 (2.9) 2,653 (100.0)Maryland§ 43 (0.5) 1,276 (13.9) 2,900 (31.5) 2,370 (25.8) 1,455 (15.8) 877 (9.5) 277 (3.0) 0 (0.0) 9,198 (100.0)Massachusetts 100 (0.4) 3,709 (15.9) 7,547 (32.4) 5,136 (22.1) 3,366 (14.5) 2,455 (10.6) 932 (4.0) 23 (0.1) 23,268 (100.0)Michigan 175 (0.7) 4,497 (17.8) 8,259 (32.8) 5,676 (22.5) 3,697 (14.7) 2,174 (8.6) 712 (2.8) 19 (0.1) 25,209 (100.0)Minnesota 50 (0.4) 1,975 (14.8) 4,569 (34.2) 3,198 (23.9) 1,905 (14.3) 1,229 (9.2) 436 (3.3) 0 (0.0) 13,362 (100.0)Mississippi 35 (1.2) 469 (15.4) 1,144 (37.6) 760 (25.0) 397 (13.1) 162 (5.3) 70 (2.3) 4 (0.1) 3,041 (100.0)Missouri 55 (0.7) 1,230 (15.4) 2,709 (34.0) 1,824 (22.9) 1,142 (14.3) 721 (9.0) 296 (3.7) 0 (0.0) 7,977 (100.0)Montana 7 (0.3) 467 (21.7) 737 (34.2) 412 (19.1) 289 (13.4) 170 (7.9) 72 (3.3) 1 (0.0) 2,155 (100.0)Nebraska 17 (0.5) 532 (16.8) 1,105 (34.8) 706 (22.3) 427 (13.5) 279 (8.8) 107 (3.4) 0 (0.0) 3,173 (100.0)Nevada 36 (0.3) 1,696 (16.1) 3,155 (29.9) 2,349 (22.2) 1,545 (14.6) 998 (9.4) 365 (3.5) 421 (4.0) 10,565 (100.0)New Jersey** 184 (0.6) 5,593 (17.9) 9,591 (30.7) 7,650 (24.5) 4,460 (14.3) 2,692 (8.8) 1,055 (3.4) 5 (0.0) 31,230 (100.0)New Mexico 32 (0.5) 1,126 (19.0) 2,099 (35.4) 1,306 (22.0) 702 (11.8) 403 (6.8) 190 (3.2) 76 (1.3) 5,934 (100.0)New York 751 (0.6) 22,012 (17.6) 37,806 (30.3) 29,031 (23.3) 18,601 (14.9) 11,741 (9.4) 4,497 (3.6) 410 (0.3) 124,849 (100.0)City 524 (0.6) 14,838 (16.7) 25,905 (29.1) 21,483 (24.2) 14,036 (15.8) 8,594 (9.7) 3,156 (3.6) 355 (0.4) 88,891 (100.0)State 227 (0.6) 7,174 (20.0) 11,901 (33.1) 7,548 (21.0) 4,565 (12.7) 3,147 (8.8) 1,341 (3.7) 55 (0.2) 35,958 (100.0)
North Carolina 235 (0.7) 4,815 (14.9) 10,533 (32.6) 7,595 (23.5) 4,678 (14.5) 2,496 (7.7) 834 (2.6) 1,149 (3.6) 32,335 (100.0)North Dakota†† — — 255 (20.7) 447 (36.3) 262 (21.3) 137 (11.1) 90 (7.3) 38 (3.1) — — 1,231 (100.0)Ohio 240 (0.7) 5,817 (17.0) 11,502 (33.7) 7,968 (23.3) 4,687 (13.7) 2,708 (7.9) 947 (2.8) 259 (0.8) 34,128 (100.0)Oklahoma 34 (0.5) 1,099 (16.5) 2,312 (34.8) 1,524 (22.9) 930 (14.0) 523 (7.9) 181 (2.7) 38 (0.6) 6,641 (100.0)Oregon 48 (0.4) 1,899 (16.4) 3,759 (32.4) 2,672 (23.0) 1,686 (14.5) 1,061 (9.1) 449 (3.9) 28 (0.2) 11,602 (100.0)Pennsylvania 226 (0.6) 5,760 (16.5) 11,714 (33.6) 7,903 (22.6) 5,028 (14.4) 3,105 (8.9) 1,172 (3.4) 1 (0.0) 34,909 (100.0)Rhode Island 19 (0.4) 868 (17.0) 1,712 (33.6) 1,132 (22.2) 717 (14.1) 398 (7.8) 185 (3.6) 60 (1.2) 5,091 (100.0)South Carolina 43 (0.6) 1,218 (18.1) 2,132 (31.7) 1,509 (22.5) 1,044 (15.5) 571 (8.5) 199 (3.0) 0 (0.0) 6,716 (100.0)South Dakota†† — — 135 (16.8) 281 (34.9) 179 (22.2) 116 (14.4) 68 (8.4) 25 (3.1) — — 805 (100.0)Tennessee 126 (0.8) 2,495 (15.4) 5,548 (34.3) 3,918 (24.2) 2,381 (14.7) 1,284 (7.9) 373 (2.3) 53 (0.3) 16,178 (100.0)Texas 208 (0.3) 9,911 (12.9) 26,264 (34.1) 19,654 (25.5) 11,790 (15.3) 6,720 (8.7) 2,558 (3.3) 3 (0.0) 77,108 (100.0)Utah 14 (0.4) 569 (16.0) 1,139 (32.0) 842 (23.7) 495 (13.9) 332 (9.3) 103 (2.9) 62 (1.7) 3,556 (100.0)Vermont 7 (0.4) 326 (20.1) 570 (35.2) 342 (21.1) 176 (10.9) 130 (8.0) 68 (4.2) 1 (0.1) 1,620 (100.0)Virginia 118 (0.4) 3,938 (15.0) 8,980 (34.1) 6,198 (23.6) 3,767 (14.3) 2,283 (8.7) 875 (3.3) 150 (0.6) 26,309 (100.0)Washington 132 (0.5) 4,404 (18.3) 8,055 (33.4) 5,294 (22.0) 3,277 (13.6) 2,106 (8.7) 833 (3.5) 7 (0.0) 24,108 (100.0)West Virginia 5 (0.3) 303 (18.1) 567 (33.9) 413 (24.7) 233 (13.9) 114 (6.8) 37 (2.2) 2 (0.1) 1,674 (100.0)Wisconsin§ 53 (0.6) 1,673 (17.5) 3,341 (34.9) 2,083 (21.8) 1,309 (13.7) 791 (8.3) 316 (3.3) 0 (0.0) 9,566 (100.0)Wyoming†† — — — — — — — — — — — — — — — — 14 (100.0)
Total§§ 4,085 (0.6) 118,131 (16.4) 234,747 (32.6) 168,520 (23.4) 104,433 (14.5) 62,646 (8.7) 23,169 (3.2) 3,667 (0.5) 719,415 (100.0)
Abortion ratio¶¶ 764 358 283 187 140 168 278 219
Abortion rate*** 1 14 29 22 13 8 3 14 * Data from 46 states, the District of Columbia, and New York City. † Percentages might not add to 100.0 because of rounding. § Includes residents only. ¶ Number of procedures for the >45 years age group are included with those of the unknown age group because data were not available separately (data have been <0.2% in
previous years). The category of >40 years, therefore, represents the 40–44 years group for Illinois. ** Numbers do not include private physicians’ procedures. †† Cell details not displayed because of small numbers. §§ Totals do not include small numbers. ¶¶ Calculated as the number of legal abortions obtained by women in a given age group per 1,000 live births to women in the same age group for these states. For each state,
data for women of unknown age were distributed according to the known age distribution for that state. *** Calculated as the number of legal abortions obtained by women in a given age group per 1,000 women in the same age group for these states. Women aged 13–14 years were
used for the denominator for the <15 years age group, women aged 40–44 years were used for the denominator for the >40 years age group, and women aged 15–44 years were used for the denominator for the total rate. For each state, data for women of unknown age were distributed according to the known age distribution for that state.

20 MMWR November 28, 2008
TABLE 5. Reported legal abortions obtained by adolescents, by known age and state of occurrence — selected states,∗ United States, 2005
State/Area
Age (yrs)
Total<15 15 16 17 18 19
No. (%) No. (%) No. (%) No. (%) No. (%) No. (%) No. (%)†
Alabama 97 (4.6) 151 (7.2) 250 (12.0) 304 (14.6) 540 (25.8) 747 (35.8) 2,089 (100.0)Alaska 12 (3.1) 17 (4.4) 33 (8.5) 78 (20.2) 116 (30.1) 130 (33.7) 386 (100.0)Arizona 55 (2.9) 101 (5.3) 199 (10.3) 288 (15.0) 565 (29.4) 715 (37.2) 1,923 (100.0)Arkansas 45 (5.7) 60 (7.6) 107 (13.6) 131 (16.7) 208 (26.5) 234 (29.8) 785 (100.0)Colorado 79 (3.7) 136 (6.3) 200 (9.3) 371 (17.2) 639 (29.6) 731 (33.9) 2,156 (100.0)Connecticut 87 (3.8) 138 (6.0) 260 (11.3) 511 (22.2) 613 (26.6) 694 (30.1) 2,303 (100.0)Delaware§ 20 (3.5) 31 (5.4) 75 (13.0) 109 (19.0) 148 (25.7) 192 (33.4) 575 (100.0)Dist. of Columbia 25 (5.5) 36 (7.9) 63 (13.8) 96 (21.0) 95 (20.7) 143 (31.2) 458 (100.0)Georgia 246 (5.0) 331 (6.8) 598 (12.2) 768 (15.7) 1,352 (27.6) 1,607 (32.8) 4,902 (100.0)Hawaii 19 (2.7) 57 (8.2) 95 (13.6) 147 (21.1) 183 (26.3) 196 (28.1) 697 (100.0)Idaho 6 (2.8) 17 (7.9) 23 (10.7) 33 (15.4) 68 (31.8) 67 (31.3) 214 (100.0)Indiana 41 (2.3) 112 (6.4) 182 (10.4) 256 (14.6) 514 (29.3) 652 (37.1) 1,757 (100.0)Iowa§ 32 (2.9) 71 (6.5) 136 (12.5) 159 (14.6) 300 (27.6) 389 (35.8) 1,087 (100.0)Kansas 56 (3.1) 120 (6.6) 228 (12.5) 291 (15.9) 499 (27.3) 633 (34.6) 1,827 (100.0)Kentucky 23 (4.1) 65 (11.5) 66 (11.7) 87 (15.4) 143 (25.3) 182 (32.2) 566 (100.0)Maine 12 (2.3) 26 (5.0) 47 (9.0) 115 (22.0) 141 (27.0) 181 (34.7) 522 (100.0)Massachusetts 100 (2.6) 214 (5.6) 418 (11.0) 594 (15.6) 1,124 (29.5) 1,359 (35.7) 3,809 (100.0)Michigan 175 (3.7) 290 (6.2) 504 (10.8) 789 (16.9) 1,358 (29.1) 1,556 (33.3) 4,672 (100.0)Minnesota 50 (2.5) 110 (5.4) 213 (10.5) 309 (15.3) 586 (28.9) 757 (37.4) 2,025 (100.0)Mississippi 35 (6.9) 26 (5.2) 40 (7.9) 73 (14.5) 141 (28.0) 189 (37.5) 504 (100.0)Missouri 55 (4.3) 91 (7.1) 125 (9.7) 155 (12.1) 357 (27.8) 502 (39.1) 1,285 (100.0)Montana 7 (1.5) 31 (6.5) 62 (13.1) 113 (23.8) 121 (25.5) 140 (29.5) 474 (100.0)Nebraska 17 (3.1) 25 (4.6) 69 (12.6) 96 (17.5) 144 (26.2) 198 (36.1) 549 (100.0)Nevada 36 (2.1) 106 (6.1) 207 (12.0) 315 (18.2) 489 (28.2) 579 (33.4) 1,732 (100.0)New Jersey¶ 184 (3.2) 406 (7.0) 723 (12.5) 1,184 (20.5) 1,530 (26.5) 1,750 (30.3) 5,777 (100.0)New Mexico 32 (2.8) 82 (7.1) 141 (12.2) 233 (20.1) 316 (27.3) 354 (30.6) 1,158 (100.0)New York 751 (3.3) 1,557 (6.8) 2,942 (12.9) 4,497 (19.8) 6,113 (26.9) 6,903 (30.3) 22,763 (100.0)City 524 (3.4) 1,096 (7.1) 2,070 (13.5) 2,995 (19.5) 4,094 (26.7) 4,583 (29.8) 15,362 (100.0)State 227 (3.1) 461 (6.2) 872 (11.8) 1,502 (20.3) 2,019 (27.3) 2,320 (31.3) 7,401 (100.0)
North Carolina 235 (4.7) 326 (6.5) 545 (10.8) 753 (14.9) 1,409 (27.9) 1,782 (35.3) 5,050 (100.0)North Dakota** — — — — 28 (10.9) 42 (16.3) 80 (31.1) 97 (37.7) 257 (100.0)Ohio 240 (4.0) 434 (7.2) 717 (11.8) 973 (16.1) 1,688 (27.9) 2,005 (33.1) 6,057 (100.0)Oklahoma 34 (3.0) 73 (6.4) 126 (11.1) 188 (16.6) 332 (29.3) 380 (33.5) 1,133 (100.0)Oregon 48 (2.5) 120 (6.2) 218 (11.2) 355 (18.2) 511 (26.2) 695 (35.7) 1,947 (100.0)Pennsylvania 226 (3.8) 403 (6.7) 623 (10.4) 831 (13.9) 1,756 (29.3) 2,147 (35.9) 5,986 (100.0)Rhode Island 19 (2.1) 50 (5.6) 75 (8.5) 141 (15.9) 268 (30.2) 334 (37.7) 887 (100.0)South Carolina 43 (3.4) 86 (6.8) 131 (10.4) 290 (23.0) 329 (26.1) 382 (30.3) 1,261 (100.0)South Dakota** — — — — 13 (9.6) 29 (21.3) 36 (26.5) 44 (32.4) 136 (100.0)Tennessee 126 (4.8) 169 (6.4) 305 (11.6) 356 (13.6) 742 (28.3) 923 (35.2) 2,621 (100.0)Texas 208 (2.1) 498 (4.9) 971 (9.6) 1,610 (15.9) 2,749 (27.2) 4,083 (40.3) 10,119 (100.0)Utah 14 (2.4) 37 (6.3) 65 (11.1) 87 (14.9) 190 (32.6) 190 (32.6) 583 (100.0)Vermont 7 (2.1) 20 (6.0) 26 (7.8) 62 (18.6) 86 (25.8) 132 (39.6) 333 (100.0)Virginia 118 (2.9) 243 (6.0) 412 (10.2) 575 (14.2) 1,201 (29.6) 1,507 (37.2) 4,056 (100.0)Washington 132 (2.9) 276 (6.1) 507 (11.2) 867 (19.1) 1,248 (27.5) 1,506 (33.2) 4,536 (100.0)West Virginia 5 (1.6) 18 (5.8) 39 (12.7) 43 (14.0) 95 (30.8) 108 (35.1) 308 (100.0)Wisconsin§ 53 (3.1) 132 (7.6) 172 (10.0) 273 (15.8) 501 (29.0) 595 (34.5) 1,726 (100.0)Wyoming** — — — — — — — — — — — — 2 (100.0)
Total†† 3,805 (3.3) 7,292 (6.4) 12,979 (11.4) 19,577 (17.2) 31,624 (27.7) 38,690 (33.9) 113,993 (100.0)
Abortion ratio§§ 776 546 433 360 367 316 366
Abortion rate¶¶ 1 5 9 13 22 26 11 * Data from 44 states, the District of Columbia, and New York City. † Percentages might not add to 100.0 because of rounding. § Includes residents only. ¶ Numbers do not include private physicians’ procedures. ** Cell details not displayed because of small numbers. †† Totals do not include small numbers. §§ Calculated as the number of legal abortions obtained by women of a given age per 1,000 live births to women of the same age for these states. For each
state, data for women whose age was unknown were distributed according to the known age distribution for that state. ¶¶ Calculated as the number of legal abortions obtained by women of a given age per 1,000 women of the same age for these states. Women aged 13–14
years were used for the denominator for the <15 years age group. For each state, data for women whose age was unknown were distributed according to the known age distribution for that state.

Vol. 57 / SS-13 Surveillance Summaries 21
TABLE 6. Reported legal abortions, by weeks of gestation* and state of occurrence — selected states,† United States, 2005
State/Area
Week of gestation
Total<8 9–10 11–12 13–15 16–20 >21 Unknown
No. (%) No. (%) No. (%) No. (%) No. (%) No. (%) No. (%) No. (%)§
Alabama¶ 6,890 (61.5) 1,775 (15.8) 1,088 (9.7) 869 (7.8) 535 (4.8) 34 (0.3) 20 (0.2) 11,211 (100.0)Alaska¶,** 1,112 (56.9) 467 (23.9) 278 (14.2) 73 (3.7) 8 (0.4) — — — — 1,955 (100.0)Arizona¶ 6,208 (57.9) 1,715 (16.0) 859 (8.0) 603 (5.6) 342 (3.2) 133 (1.2) 863 (8.0) 10,723 (100.0)Arkansas††,** 2,698 (57.5) 767 (16.3) 443 (9.4) 390 (8.3) 395 (8.4) — — — — 4,695 (100.0)Colorado¶ 7,549 (64.6) 1,730 (14.8) 966 (8.3) 713 (6.1) 392 (3.4) 273 (2.3) 59 (0.5) 11,682 (100.0)Connecticut¶ 7,554§§ (62.4) 2,083§§ (17.2) 1,128§§ (9.3) 806 (6.7) 319 (2.6) 32 (0.3) 188 (1.6) 12,110 (100.0)Delaware¶,¶¶ 1,903 (62.8) 529 (17.5) 286 (9.4) 218 (7.2) 82 (2.7) 6 (0.2) 7 (0.2) 3,031 (100.0)Dist. of Columbia 1,655 (65.7) 307 (12.2) 153 (6.1) 205 (8.1) 198 (7.9) 0 (0.0) 0 (0.0) 2,518 (100.0)Georgia 17,284 (54.6) 6,277 (19.8) 3,351 (10.6) 2,028 (6.4) 1,646 (5.2) 1,094 (3.5) 0 (0.0) 31,680 (100.0)Hawaii¶ 1,872 (52.8) 746 (21.0) 420 (11.8) 237 (6.7) 225 (6.3) 16 (0.5) 32 (0.9) 3,548 (100.0)Idaho¶ 645 (58.7) 303 (27.6) 118 (10.7) 15 (1.4) 13 (1.2) 5 (0.5) 0 (0.0) 1,099 (100.0)Indiana¶ 6,499 (60.8) 2,150 (20.1) 1,203 (11.3) 238 (2.2) 118 (1.1) 0 (0.0) 478 (4.5) 10,686 (100.0)Iowa¶¶ 4,320 (73.5) 736 (12.5) 445 (7.6) 222 (3.8) 134 (2.3) 13 (0.2) 11 (0.2) 5,881 (100.0)Kansas¶ 6,541 (62.5) 1,548 (14.8) 836 (8.0) 626 (6.0) 452 (4.3) 459 (4.4) 0 (0.0) 10,462 (100.0)Kentucky 2,127 (56.3) 613 (16.2) 415 (11.0) 263 (7.0) 232 (6.1) 54 (1.4) 72 (1.9) 3,776 (100.0)Maine*** 1,807 (68.1) 492 (18.5) 244 (9.2) 82 (3.1) 26 (1.0) — — — — 2,653 (100.0)Michigan*** 16,304 (64.7) 3,982 (15.8) 2,092 (8.3) 1,914 (7.6) 723 (2.9) 181 (0.7) 13 (0.1) 25,209 (100.0)Minnesota¶ 8,292 (62.1) 2,229 (16.7) 1,282 (9.6) 785 (5.9) 726 (5.4) 48 (0.4) 0 (0.0) 13,362 (100.0)Missouri 4,853 (60.8) 1,533 (19.2) 882 (11.1) 392 (4.9) 249 (3.1) 34 (0.4) 34 (0.4) 7,977 (100.0)Montana¶ 1,155 (53.6) 414 (19.2) 267 (12.4) 171 (7.9) 125 (5.8) 22 (1.0) 1 (0.0) 2,155 (100.0)New Jersey††† 18,423 (59.0) 4,772 (15.3) 1,902 (6.1) 3,049 (9.8) 2,234 (7.2) 850 (2.7) 0 (0.0) 31,230 (100.0)New Mexico*** 3,510 (59.2) 889 (15.0) 515 (8.7) 362 (6.1) 380 (6.4) 106 (1.8) 172 (2.9) 5,934 (100.0)New York 69,690 (55.8) 22,061 (17.7) 11,267 (9.0) 7,267 (5.8) 5,956 (4.8) 2,956 (2.4) 5,652 (4.5) 124,849 (100.0) City¶ 56,296 (63.3) 13,520 (15.2) 6,634 (7.5) 4,727 (5.3) 4,695 (5.3) 2,221 (2.5) 798 (0.9) 88,891 (100.0) State 13,394 (37.2) 8,541 (23.8) 4,633 (12.9) 2,540 (7.1) 1,261 (3.5) 735 (2.0) 4,854 (13.5) 35,958 (100.0)North Carolina¶,** 17,452 (54.0) 4,453 (13.8) 2,498 (7.7) 2,189 (6.8) — — — — 4,772 (14.8) 32,335 (100.0)North Dakota¶ 710 (57.7) 253 (20.6) 172 (14.0) 89 (7.2) 7 (0.6) 0 (0.0) 0 (0.0) 1,231 (100.0)Ohio¶ 19,549 (57.3) 6,097 (17.9) 3,450 (10.1) 2,484 (7.3) 1,738 (5.1) 577 (1.7) 233 (0.7) 34,128 (100.0)Oklahoma¶ 4,273 (64.3) 1,137 (17.1) 613 (9.2) 390 (5.9) 220 (3.3) 8 (0.1) 0 (0.0) 6,641 (100.0)Oregon¶ 7,505 (64.7) 1,630 (14.0) 1,016 (8.8) 617 (5.3) 561 (4.8) 227 (2.0) 46 (0.4) 11,602 (100.0)Pennsylvania 20,478 (58.7) 6,796 (19.5) 3,633 (10.4) 2,508 (7.2) 1,302 (3.7) 192 (0.6) 0 (0.0) 34,909 (100.0)Rhode Island¶ 3,510 (68.9) 693 (13.6) 375 (7.4) 325 (6.4) 139 (2.7) 11 (0.2) 38 (0.7) 5,091 (100.0)South Carolina 4,933 (73.5) 1,033 (15.4) 643 (9.6) 74 (1.1) 15 (0.2) 17 (0.3) 1 (0.0) 6,716 (100.0)South Dakota¶,** 443 (55.0) 215 (26.7) 102 (12.7) 32 (4.0) — — 10 (1.2) — — 805 (100.0)Tennessee¶ 10,356 (64.0) 2,916 (18.0) 2,141 (13.2) 534 (3.3) 55 (0.3) 11 (0.1) 165 (1.0) 16,178 (100.0)Texas¶ 54,367 (70.5) 10,974 (14.2) 5,676 (7.4) 4,826 (6.3) 865 (1.1) 395 (0.5) 5 (0.0) 77,108 (100.0)Utah¶ 2,227 (62.6) 522 (14.7) 268 (7.5) 254 (7.1) 175 (4.9) 7 (0.2) 103 (2.9) 3,556 (100.0)Vermont** 1,120 (69.1) 287 (17.7) 124 (7.7) 75 (4.6) 12 (0.7) — — — — 1,620 (100.0)Virginia¶ 17,615 (67.0) 4,789 (18.2) 2,704 (10.3) 729 (2.8) 288 (1.1) 58 (0.2) 126 (0.5) 26,309 (100.0)Washington¶ 14,869 (61.7) 4,004 (16.6) 2,185 (9.1) 1,398 (5.8) 1,161 (4.8) 444 (1.8) 47 (0.2) 24,108 (100.0)West Virginia 976 (58.3) 328 (19.6) 214 (12.8) 113 (6.8) 36 (2.2) 6 (0.4) 1 (0.1) 1,674 (100.0)Wisconsin††,¶¶ 5,185 (54.2) 1,779 (18.6) 1,139 (11.9) 767 (8.0) 493 (5.2) 203 (2.1) 0 (0.0) 9,566 (100.0)Wyoming**,†† 6 (42.9) 6 (42.9) — — 0 (0.0) 0 (0.0) 0 (0.0) — — 14 (100.0)
Total§§§ 384,465 (60.8) 106,030 (16.8) 57,393 (9.1) 38,932 (6.2) 22,577 (3.7) 8,482 (1.3) 13,139 (2.1) 632,017 (100.0)
* Data for legal abortions obtained at <8 weeks of gestation are presented in Table 7 by <6, 7, and 8 weeks of gestation. † Data from 40 states, the District of Columbia, and New York City; excludes three states (Mississippi, Nebraska, and Nevada) in which gestational age was reported as unknown
for >15% of women. § Percentages might not add to 100.0 because of rounding. ¶ Weeks of gestation based on physicians’ estimates. ** Cell details not displayed because of small numbers. †† Weeks of gestation based on physicians’ estimates only if date of last menstrual period was unknown. §§ Numbers obtained at <12 weeks of gestation were redistributed. ¶¶ Includes residents only. *** Weeks of gestation based on date of last menstrual period only if physicians’ estimates were unknown. ††† Numbers do not include private physicians’ procedures. §§§ Totals do not include small numbers.

22 MMWR November 28, 2008
TABLE 7. Reported legal abortions obtained at <8 weeks of gestation, by known weeks of gestation and state of occurrence — selected states,* United States, 2005
State/Area
Weeks of gestationTotal obtained at <8 weeks of gestation<6 7 8
No. (%) No. (%) No. (%) No. (%)†
Alabama§ 3,473 (31.0) 1,902 (17.0) 1,515 (13.5) 6,890 (61.5)Alaska 388 (19.8) 351 (18.0) 373 (19.1) 1,112 (56.9)Arizona§ 2,462 (23.0) 2,088 (19.5) 1,658 (15.5) 6,208 (57.9)Arkansas¶ 1,473 (31.4) 645 (13.7) 580 (12.4) 2,698 (57.5)Colorado§ 3,851 (33.0) 2,011 (17.2) 1,687 (14.4) 7,549 (64.6)Delaware§,** 882 (29.1) 533 (17.6) 488 (16.1) 1,903 (62.8)District of Columbia 920 (36.5) 452 (18.0) 283 (11.2) 1,655 (65.7)Georgia 6,567 (20.7) 5,881 (18.6) 4,836 (15.3) 17,284 (54.6)Hawaii§ 621 (17.5) 667 (18.8) 584 (16.5) 1,872 (52.8)Idaho§ 167 (15.2) 202 (18.4) 276 (25.1) 645 (58.7)Indiana§ 3,038 (28.4) 1,785 (16.7) 1,676 (15.7) 6,499 (60.8)Iowa** 2,667 (45.3) 1,006 (17.1) 647 (11.0) 4,320 (73.5)Kansas§ 3,491 (33.4) 1,752 (16.7) 1,298 (12.4) 6,541 (62.5)Kentucky 887 (23.5) 765 (20.3) 475 (12.6) 2,127 (56.3)Maine†† 883 (33.3) 507 (19.1) 417 (15.7) 1,807 (68.1)Michigan 7,562 (30.0) 4,753 (18.9) 3,989 (15.8) 16,304 (64.7)Minnesota§ 3,734 (27.9) 2,633 (19.7) 1,925 (14.4) 8,292 (62.1)Missouri 2,202 (27.6) 1,547 (19.4) 1,104 (13.8) 4,853 (60.8)Montana§ 505 (23.4) 337 (15.6) 313 (14.5) 1,155 (53.6)New Jersey§§ 8,273 (26.5) 5,699 (18.2) 4,451 (14.3) 18,423 (59.0)New Mexico†† 1,865 (31.4) 873 (14.7) 772 (13.0) 3,510 (59.2)New York 31,414 (25.2) 20,594 (16.5) 17,682 (14.2) 69,690 (55.8) City§ 28,772 (32.4) 15,400 (17.3) 12,124 (13.6) 56,296 (63.3) State 2,642 (7.3) 5,194 (14.4) 5,558 (15.5) 13,394 (37.2)North Carolina§ 7,410 (22.9) 5,723 (17.7) 4,319 (13.4) 17,452 (54.0)North Dakota§ 184 (14.9) 281 (22.8) 245 (19.9) 710 (57.7)Ohio§ 8,958 (26.2) 5,816 (17.0) 4,775 (14.0) 19,549 (57.3)Oklahoma§ 2,093 (31.5) 1,289 (19.4) 891 (13.4) 4,273 (64.3)Oregon§ 4,197 (36.2) 1,902 (16.4) 1,406 (12.1) 7,505 (64.7)Pennsylvania 8,274 (23.7) 6,357 (18.2) 5,847 (16.7) 20,478 (58.7)Rhode Island§ 1,910 (37.5) 931 (18.3) 669 (13.1) 3,510 (68.9)South Carolina 2,818 (42.0) 1,116 (16.6) 999 (14.9) 4,933 (73.5)South Dakota§ 72 (8.9) 175 (21.7) 196 (24.3) 443 (55.0)Tennessee§ 4,731 (29.2) 3,526 (21.8) 2,099 (13.0) 10,356 (64.0)Texas§ 32,007 (41.5) 12,578 (16.3) 9,782 (12.7) 54,367 (70.5)Utah§ 867 (24.4) 747 (21.0) 613 (17.2) 2,227 (62.6)Vermont 523 (32.3) 336 (20.7) 261 (16.1) 1,120 (69.1)Virginia§ 8,137 (30.9) 5,234 (19.9) 4,244 (16.1) 17,615 (67.0)Washington§ 6,742 (28.0) 4,668 (19.4) 3,459 (14.3) 14,869 (61.7)West Virginia 346 (20.7) 332 (19.8) 298 (17.8) 976 (58.3)Wyoming¶,¶¶ — — — — — — 6 (42.9)
Total*** 176,594 (28.9) 107,994 (17.7) 87,132 (14.3) 371,726 (60.9) * Data from 38 states, the District of Columbia, and New York City; excludes three states (Mississippi, Nebraska, and Nevada) in which gestational age
was reported as unknown for >15% of women and two states (Connecticut and Wisconsin) that were included in Table 6 but did not provide component weeks of gestation for abortions obtained at <8 weeks.
† Percentages might not add to total percentage obtained at <8 weeks because of rounding. § Weeks of gestation based on physicians’ estimates. ¶ Weeks of gestation based on physicians’ estimates only if date of last menstrual period was unknown. ** Includes residents only. †† Weeks of gestation based on date of last menstrual period only if physicians’ estimates were unknown. §§ Numbers do not include private physicians’ procedures. ¶¶ Cell details not displayed because of small numbers. *** Totals do not include small numbers.

Vol. 57 / SS-13 Surveillance Summaries 23
TABLE 8. Reported legal abortions, by type of procedure and state of occurrence — selected states,* United States, 2005
State/Area
Procedure
TotalCurettage <12 Weeks
Curettage >12 Weeks All Curettage†
Intrauterine instillation Medical Other§ Unknown
No. (%) No. (%) No. (%) No. (%) No. (%) No. (%) No. (%) No. (%)¶
Alabama 8,022 (71.6) 1,390 (12.4) 9,423 (84.1) 11 (0.1) ** (0.0) 1,744†† (15.3) 33 (0.3) 11,211 (100.0)Alaska 933 (47.7) 50 (2.6) 993 (50.8) 0 (0.0) 451 (23.1) 497 (25.4) 14 (0.7) 1,955 (100.0)Arizona§§ 5,090 (47.5) 871 (8.1) 6,546 (61.0) — — 3,095 (28.9) 1,081 (10.1) — — 10,723 (100.0)Arkansas§§ 3,903 (83.1) 781 (16.6) 4,684 (99.8) 0 (0.0) 9 (0.2) — — — — 4,695 (100.0)Colorado§§ 7,227 (61.9) 1,055 (9.0) 8,327 (71.3) — — 2,506 (21.5) 847 (7.3) — — 11,682 (100.0)Connecticut§§ —¶¶ (0.0) —¶¶ (0.0) 10,794 (89.1) 0 (0.0) 1,311 (10.8) — — — — 12,110 (100.0)Delaware§§,*** 2,229 (73.5) 303 (10.0) 2,534 (83.6) — — 485 (16.0) — — 8 (0.3) 3,031 (100.0)Dist. of Columbia —¶¶ (0.0) —¶¶ (0.0) 2,072 (82.3) 0 (0.0) 443 (17.6) 0 (0.0) 0 (0.0) 2,518 (100.0)Georgia 25,795 (81.4) 4,658 (14.7) 30,453 (96.1) 13 (0.0) ** (0.0) 136†† (0.4) 1,078 (3.4) 31,680 (100.0)Hawaii§§ 3,022 (85.2) 469 (13.2) 3,523 (99.3) — — ††† - 13 (0.4) — — 3,548 (100.0)Idaho§§ 956 (87.0) 18 (1.6) 974 (88.6) — — 117 (10.6) — — 0 (0.0) 1,099 (100.0)Indiana 8,897 (83.3) 350 (3.3) 9,537 (89.2) 0 (0.0) 878 (8.2) 142 (1.3) 126 (1.2) 10,686 (100.0)Iowa 3,536 (60.1) 148 (2.5) 3,687 (62.7) 0 (0.0) 1,856 (31.6) 242 (4.1) 96 (1.6) 5,881 (100.0)Kansas§§ 7,972 (76.2) 1,117 (10.7) 9,089 (86.9) — — 954 (9.1) 415 (4.0) — — 10,462 (100.0)Maine 2,094 (78.9) 85 (3.2) 2,180 (82.2) 0 (0.0) 469 (17.7) 0 (0.0) 4 (0.2) 2,653 (100.0)Maryland*** —¶¶ (0.0) —¶¶ (0.0) 8,091 (88.0) 470 (5.1) 0 (0.0) 637 (6.9) 0 (0.0) 9,198 (100.0)Massachusetts§§ —¶¶ (0.0) —¶¶ (0.0) 14,689 (63.1) 4,023 (17.3) 4,552 (19.6) — — — — 23,268 (100.0)Michigan 19,606 (77.8) 2,733 (10.8) 22,339 (88.6) 14 (0.1) 2,814 (11.2) 14 (0.1) 17 (0.1) 25,209 (100.0)Minnesota 10,547 (78.9) 1,528 (11.4) 12,075 (90.4) 8 (0.1) 1,262 (9.4) 16 (0.1) 1 (0.0) 13,362 (100.0)Mississippi 2,304 (75.8) 205 (6.7) 3,041 (100.0) 0 (0.0) 0 (0.0) 0 (0.0) 0 (0.0) 3,041 (100.0)Missouri§§ 5,921 (74.2) 655 (8.2) 6,602 (82.8) 0 (0.0) 1,367 (17.1) — — — — 7,977 (100.0)Montana 1,687 (78.3) 317 (14.7) 2,005 (93.0) 0 (0.0) 0 (0.0) 150 (7.0) 0 (0.0) 2,155 (100.0)Nebraska 459 (14.5) 31 (1.0) 3,130 (98.6) 0 (0.0) 43 (1.4) 0 (0.0) 0 (0.0) 3,173 (100.0)Nevada§§ 7,634 (72.3) 874 (8.3) 10,313 (97.6) — — 0 (0.0) — — 251 (2.4) 10,565 (100.0)New Jersey§§§ 24,363 (78.0) 6,088 (19.5) 30,451 (97.5) 10 (0.0) 748 (2.4) 21 (0.1) 0 (0.0) 31,230 (100.0)New Mexico§§ 4,148 (69.9) 819 (13.8) 5,069 (85.4) — — 585 (9.9) — — 279 (4.7) 5,934 (100.0)New York 92,939 (74.1) 15,789 (12.6) 112,798 (89.9) 79 (0.0) 11,744 (9.4) 399 (0.3) 418 (0.3) 125,438¶¶¶ (100.0)City 69,395 (78.1) 11,401 (12.8) 81,401 (91.6) 24 (0.0) 6,971 (7.8) 77 (0.1) 418 (0.5) 88,891 (100.0)State 23,544 (64.4) 4,388 (12.0) 31,397 (85.9) 55 (0.1) 4,773 (13.1) 322 (0.9) 0 (0.0) 36,547¶¶¶ (100.0)
North Carolina 21,080 (65.2) 3,006 (9.3) 27,340 (84.6) 167 (0.5) 17 (0.1) 4,811 (14.9) 0 (0.0) 32,335 (100.0)North Dakota 1,135 (92.2) 96 (7.8) 1,231 (100.0) 0 (0.0) 0 (0.0) 0 (0.0) 0 (0.0) 1,231 (100.0)Ohio 23,469 (68.5) 4,682 (13.7) 28,317 (82.6) 299 (0.9) 4,700 (13.7) 694 (2.0) 271 (0.8) 34,281¶¶¶ (100.0)Oklahoma 4,813 (72.5) 617 (9.3) 6,047 (91.1) 0 (0.0) 1,033 (15.6) 177 (2.7) 1 (0.0) 6,641 (100.0)Oregon§§ 7,770 (67.0) 1,371 (11.8) 10,512 (90.6) — — 2,422 (20.9) 15 (0.1) — — 11,602 (100.0)Pennsylvania 26,911 (77.1) 3,928 (11.3) 30,839 (88.3) 18 (0.1) 4,031 (11.5) 21 (0.1) 0 (0.0) 34,909 (100.0)Rhode Island§§ 4,249 (83.5) 454 (8.9) 4,725 (92.8) — — 330 (6.5) — — 33 (0.6) 5,091 (100.0)South Carolina§§ 4,918 (73.2) 79 (1.2) 4,997 (74.4) 7 (0.1) — — 1,699 (25.3) — — 6,716 (100.0)South Dakota 699 (86.8) 33 (4.1) 732 (90.9) 0 (0.0) 73 (9.1) 0 (0.0) 0 (0.0) 805 (100.0)Tennessee§§ 13,404 (82.9) 562 (3.5) 14,091 (87.1) — — 0 (0.0) — — 2,055 (12.7) 16,178 (100.0)Texas 59,793 (77.5) 5,933 (7.7) 65,729 (85.2) 24 (0.0) 11,306 (14.7) 49 (0.1) 0 (0.0) 77,108 (100.0)Utah 2,127 (59.8) 424 (11.9) 2,608 (73.3) 0 (0.0) 948 (26.7) 0 (0.0) 0 (0.0) 3,556 (100.0)Vermont§§ 1,136 (70.1) 76 (4.7) 1,212 (74.8) 0 (0.0) 406 (25.1) — — — — 1,620 (100.0)Virginia 23,597 (89.7) 994 (3.8) 24,705 (93.9) 5 (0.0) 1,465 (5.6) 79 (0.3) 55 (0.2) 26,309 (100.0)Washington 17,126 (71.0) 2,930 (12.2) 20,093 (83.3) 26 (0.1) 3,969 (16.5) 17 (0.1) 3 (0.0) 24,108 (100.0)West Virginia 1,434 (85.7) 138 (8.2) 1,573 (94.0) 0 (0.0) 96 (5.7) 0 (0.0) 5 (0.3) 1,674 (100.0)Wyoming 14 (100.0) 0 (0.0) 14 (100.0) 0 (0.0) 0 (0.0) 0 (0.0) 0 (0.0) 14 (100.0)
Total**** 462,959 (68.8) 65,657 (9.8) 544,634 (81.0) 5,174 (0.8) 66,485 (9.9) 13,916 (2.1) 5,031 (0.7) 668,662 (100.0) * Data from 43 states, the District of Columbia, and New York City. † Includes abortions of unknown gestational age. Therefore, the first two columns might not add to the third. § Includes hysterotomy/hysterectomy and procedures reported as “other.” ¶ Percentages might not add to 100.0 because of rounding. ** Medical procedures included with “other.” †† Includes medical (nonsurgical) procedures; no separate numbers provided. §§ Cell details not displayed because of small numbers. ¶¶ Not available. *** Includes residents only. ††† Recording area does not collect medical abortions as a separate category on abortion reporting form; whether any medical procedures are included in the “other” category
is unknown. §§§ Numbers do not include private physicians’ procedures. ¶¶¶ Does not add to total abortions reported because of some reported combination procedures. **** Totals do not include small numbers.

24 MMWR November 28, 2008
TABLE 9. Reported legal abortions, by race of women who obtained an abortion and state of occurrence — selected states,* United States, 2005
State/Area
Race
TotalWhite Black Other Unknown
No. (%) No. (%) No. (%) No. (%) No. (%)†
Alabama 4,788 (42.7) 6,127 (54.7) 238 (2.1) 58 (0.5) 11,211 (100.0)Alaska 1,162 (59.4) 131 (6.7) 592 (30.3) 70 (3.6) 1,955 (100.0)Arkansas 2,837 (60.4) 1,493 (31.8) 326 (6.9) 39 (0.8) 4,695 (100.0)Colorado 8,383 (71.8) 771 (6.6) 1,529 (13.1) 999 (8.6) 11,682 (100.0)Delaware§ 1,630 (53.8) 1,274 (42.0) 127 (4.2) 0 (0.0) 3,031 (100.0)District of Columbia 512 (20.3) 1,243 (49.4) 741 (29.4) 22 (0.9) 2,518 (100.0)Georgia 11,853 (37.4) 18,325 (57.8) 1,502 (4.7) 0 (0.0) 31,680 (100.0)Hawaii 906 (25.5) 101 (2.8) 2,275 (64.1) 266 (7.5) 3,548 (100.0)Idaho 1,018 (92.6) 16 (1.5) 55 (5.0) 10 (0.9) 1,099 (100.0)Indiana 6,898 (64.6) 3,084 (28.9) 326 (3.1) 378 (3.5) 10,686 (100.0)Iowa§ 4,684 (79.6) 540 (9.2) 564 (9.6) 93 (1.6) 5,881 (100.0)Kansas 6,974 (66.7) 2,336 (22.3) 1,120 (10.7) 32 (0.3) 10,462 (100.0)Kentucky 2,602 (68.9) 733 (19.4) 285 (7.5) 156 (4.1) 3,776 (100.0)Maine 2,277 (85.8) 61 (2.3) 259 (9.8) 56 (2.1) 2,653 (100.0)Maryland§ 2,108 (22.9) 6,019 (65.4) 976 (10.6) 95 (1.0) 9,198 (100.0)Massachusetts 11,619 (49.9) 4,491 (19.3) 4,948 (21.3) 2,210 (9.5) 23,268 (100.0)Michigan 14,088 (55.9) 9,336 (37.0) 991 (3.9) 794 (3.1) 25,209 (100.0)Minnesota 8,529 (63.8) 2,831 (21.2) 1,683 (12.6) 319 (2.4) 13,362 (100.0)Mississippi 672 (22.1) 2,348 (77.2) 8 (0.3) 13 (0.4) 3,041 (100.0)Missouri 4,492 (56.3) 3,091 (38.7) 371 (4.7) 23 (0.3) 7,977 (100.0)Montana 1,764 (81.9) 17 (0.8) 280 (13.0) 94 (4.4) 2,155 (100.0)New Jersey¶ 9,861 (31.6) 13,979 (44.8) 7,216 (23.1) 174 (0.6) 31,230 (100.0)New York City 34,701 (39.0) 41,953 (47.2) 5,083 (5.7) 7,154 (8.0) 88,891 (100.0)North Carolina 13,426 (41.5) 14,304 (44.2) 1,495 (4.6) 3,110 (9.6) 32,335 (100.0)North Dakota 990 (80.4) 31 (2.5) 202 (16.4) 8 (0.6) 1,231 (100.0)Ohio 19,673 (57.6) 12,070 (35.4) 799 (2.3) 1,586 (4.6) 34,128 (100.0)Oklahoma 4,781 (72.0) 1,277 (19.2) 583 (8.8) 0 (0.0) 6,641 (100.0)Oregon 9,677 (83.4) 707 (6.1) 1,090 (9.4) 128 (1.1) 11,602 (100.0)Pennsylvania 19,837 (56.8) 13,260 (38.0) 1,791 (5.1) 21 (0.1) 34,909 (100.0)Rhode Island 3,313 (65.1) 776 (15.2) 348 (6.8) 654 (12.8) 5,091 (100.0)South Carolina 3,965 (59.0) 2,560 (38.1) 188 (2.8) 3 (0.0) 6,716 (100.0)South Dakota 640 (79.5) 46 (5.7) 118 (14.7) 1 (0.1) 805 (100.0)Tennessee 8,289 (51.2) 7,269 (44.9) 407 (2.5) 213 (1.3) 16,178 (100.0)Texas 54,643 (70.9) 17,955 (23.3) 3,391 (4.4) 1,119 (1.5) 77,108 (100.0)Vermont 1,543 (95.2) 28 (1.7) 49 (3.0) 0 (0.0) 1,620 (100.0)Virginia 11,398 (43.3) 10,940 (41.6) 2,251 (8.6) 1,720 (6.5) 26,309 (100.0)West Virginia 1,454 (86.9) 183 (10.9) 28 (1.7) 9 (0.5) 1,674 (100.0)Wisconsin§ 6,615 (69.2) 2,285 (23.9) 0** (0.0)†† 666§§ (7.0)§§ 9,566 (100.0)
Total 304,602 (53.0) 203,991 (35.5) 44,235 (7.7) 22,293 (3.9) 575,121 (100.0)
Abortion ratio¶¶ 158 467 319 220
Abortion rate*** 9 28 18 13 * Data from 36 states, the District of Columbia, and New York City; excludes eight states (Arizona, Nebraska, Nevada, New Mexico, New York Upstate,
Utah, Washington, and Wyoming) in which race was reported as unknown for >15% of women. † Percentages might not add to 100.0 because of rounding. § Includes residents only. ¶ Numbers do not include private physicians’ procedures. ** “Other” included with “unknown.” †† Not applicable. §§ Includes “other.” ¶¶ Calculated as the number of legal abortions obtained by women of a given race per 1,000 live births to women of the same race for these states. For
each state, data for women of unknown race were distributed according to the known racial distribution for that state. *** Calculated as the number of legal abortions obtained by women of a given race per 1,000 women aged 15–44 years of the same race for these states.
For each state, data for women of unknown race were distributed according to the known racial distribution for that state. New York City data were ex-cluded because separate population data were not readily available for New York City.

Vol. 57 / SS-13 Surveillance Summaries 25
TABLE 10. Reported legal abortions, by ethnicity of women who obtained an abortion and state of occurrence — selected states,* United States, 2005
State/Area
Ethnicity
Hispanic Non-Hispanic Unknown Total
No. (%) No. (%) No. (%) No. (%)†
Alabama 309 (2.8) 10,866 (96.9) 36 (0.3) 11,211 (100.0)Arizona 4,097 (38.2) 6,014 (56.1) 612 (5.7) 10,723 (100.0)Arkansas 199 (4.2) 4,474 (95.3) 22 (0.5) 4,695 (100.0)Colorado 2,457 (21.0) 7,660 (65.6) 1,565 (13.4) 11,682 (100.0)Delaware§ 277 (9.1) 2,711 (89.4) 43 (1.4) 3,031 (100.0)Dist. of Columbia 359 (14.3) 2,143 (85.1) 16 (0.6) 2,518 (100.0)Hawaii 221 (6.2) 3,077 (86.7) 250 (7.0) 3,548 (100.0)Idaho 133 (12.1) 959 (87.3) 7 (0.6) 1,099 (100.0)Indiana 745 (7.0) 8,532 (79.8) 1,409 (13.2) 10,686 (100.0)Kansas 1,049 (10.0) 9,193 (87.9) 220 (2.1) 10,462 (100.0)Maine 53 (2.0) 2,246 (84.7) 354 (13.3) 2,653 (100.0)Minnesota 747 (5.6) 12,498 (93.5) 117 (0.9) 13,362 (100.0)Mississippi 16 (0.5) 3,020 (99.3) 5 (0.2) 3,041 (100.0)Missouri 187 (2.3) 7,764 (97.3) 26 (0.3) 7,977 (100.0)New Jersey¶ 7,436 (23.8) 23,401 (74.9) 393 (1.3) 31,230 (100.0)New Mexico 3,114 (52.5) 2,235 (37.7) 585 (9.9) 5,934 (100.0)New York 31,727 (25.4) 81,092 (65.0) 12,030 (9.6) 124,849 (100.0) City 27,210 (30.6) 54,926 (61.8) 6,755 (7.6) 88,891 (100.0) State 4,517 (12.6) 26,166 (72.8) 5,275 (14.7) 35,958 (100.0)Ohio 1,118 (3.3) 32,618 (95.6) 392 (1.1) 34,128 (100.0)Oregon 1,291 (11.1) 10,288 (88.7) 23 (0.2) 11,602 (100.0)Pennsylvania 2,218 (6.4) 32,677 (93.6) 14 (0.0) 34,909 (100.0)South Carolina 317 (4.7) 6,397 (95.3) 2 (0.0) 6,716 (100.0)South Dakota 44 (5.5) 761 (94.5) 0 (0.0) 805 (100.0)Tennessee 728 (4.5) 15,153 (93.7) 297 (1.8) 16,178 (100.0)Texas 28,006 (36.3) 47,983 (62.2) 1,119 (1.5) 77,108 (100.0)Utah 702 (19.7) 2,550 (71.7) 304 (8.5) 3,556 (100.0)Vermont 28 (1.7) 1,587 (98.0) 5 (0.3) 1,620 (100.0)West Virginia 10 (0.6) 1,659 (99.1) 5 (0.3) 1,674 (100.0)Wisconsin§ 868 (9.1) 8,698 (90.9) 0 (0.0) 9,566 (100.0)Wyoming∗∗ — — 11 (78.6) — — 14 (100.0)
Total†† 88,456 (19.4) 348,267 (76.3) 19,851 (4.3) 456,577 (100.0)
Abortion ratio§§ 205 223 219
Abortion rate¶¶ 21 14 15 * Data from 28 states, the District of Columbia, and New York City; excludes 12 states (Alaska, Georgia, Massachusetts, Montana, Nebraska, Nevada,
North Carolina, North Dakota, Oklahoma, Rhode Island, Virginia, and Washington) in which ethnicity was reported as unknown for >15% of women. † Percentages might not add to 100.0 because of rounding. § Includes residents only. ¶ Numbers do not include private physicians’ procedures. ** Cell details not displayed because of small numbers. †† Totals do not include small numbers. §§ Calculated as the number of legal abortions obtained by women of a given ethnicity per 1,000 live births to women of the same ethnicity for these states.
For each state, data for women of unknown ethnicity were distributed according to the known ethnicity distribution for that state. ¶¶ Calculated as the number of legal abortions obtained by women of a given ethnicity per 1,000 women aged 15–44 years of the same ethnicity for these
states. For each state, data for women of unknown ethnicity were distributed according to the known ethnicity distribution for that state.

26 MMWR November 28, 2008
TABLE 11. Reported legal abortions, by marital status of women who obtained an abortion and state of occurrence — selected states,* United States, 2005
State/Area
Marital status
Married† Unmarried§ Unknown Total
No. (%) No. (%) No. (%) No. (%)¶
Alabama 1,429 (12.7) 9,670 (86.3) 112 (1.0) 11,211 (100.0)Alaska 341 (17.4) 1,571 (80.4) 43 (2.2) 1,955 (100.0)Arizona 1,904 (17.8) 8,819 (82.2) 0 (0.0) 10,723 (100.0)Colorado 2,154 (18.4) 8,928 (76.4) 600 (5.1) 11,682 (100.0)Delaware** 379 (12.5) 2,652 (87.5) 0 (0.0) 3,031 (100.0)Dist. of Columbia 189 (7.5) 2,309 (91.7) 20 (0.8) 2,518 (100.0)Georgia 5,647 (17.8) 24,488 (77.3) 1,545 (4.9) 31,680 (100.0)Hawaii 566 (16.0) 2,962 (83.5) 20 (0.6) 3,548 (100.0)Idaho 219 (19.9) 878 (79.9) 2 (0.2) 1,099 (100.0)Illinois** 6,341 (16.5) 31,342 (81.6) 726 (1.9) 38,409 (100.0)Indiana 1,687 (15.8) 8,766 (82.0) 233 (2.2) 10,686 (100.0)Iowa 1,121 (19.1) 4,731 (80.4) 29 (0.5) 5,881 (100.0)Kansas 1,904 (18.2) 8,543 (81.7) 15 (0.1) 10,462 (100.0)Kentucky 577 (15.3) 3,199 (84.7) 0 (0.0) 3,776 (100.0)Maine 446 (16.8) 2,095 (79.0) 112 (4.2) 2,653 (100.0)Maryland** 1,795 (19.5) 7,137 (77.6) 266 (2.9) 9,198 (100.0)Massachusetts 3,350 (14.4) 18,892 (81.2) 1,026 (4.4) 23,268 (100.0)Michigan 3,335 (13.2) 21,764 (86.3) 110 (0.4) 25,209 (100.0)Minnesota 2,219 (16.6) 10,995 (82.3) 148 (1.1) 13,362 (100.0)Mississippi 267 (8.8) 2,771 (91.1) 3 (0.1) 3,041 (100.0)Missouri 1,443 (18.1) 6,413 (80.4) 121 (1.5) 7,977 (100.0)Montana 357 (16.6) 1,585 (73.5) 213 (9.9) 2,155 (100.0)Nevada 2,099 (19.9) 7,734 (73.2) 732 (6.9) 10,565 (100.0)New Jersey†† 4,369 (14.0) 26,758 (85.7) 103 (0.3) 31,230 (100.0)New Mexico 843 (14.2) 4,961 (83.6) 130 (2.2) 5,934 (100.0)New York City 12,722 (14.3) 73,793 (83.0) 2,376 (2.7) 88,891 (100.0)North Carolina 6,592 (20.4) 24,261 (75.0) 1,482 (4.6) 32,335 (100.0)North Dakota 203 (16.5) 1,024 (83.2) 4 (0.3) 1,231 (100.0)Ohio 5,279 (15.5) 27,963 (81.9) 886 (2.6) 34,128 (100.0)Oklahoma 1,383 (20.8) 5,258 (79.2) 0 (0.0) 6,641 (100.0)Oregon 2,362 (20.4) 8,993 (77.5) 247 (2.1) 11,602 (100.0)Pennsylvania 5,246 (15.0) 29,660 (85.0) 3 (0.0) 34,909 (100.0)Rhode Island 863 (17.0) 4,025 (79.1) 203 (4.0) 5,091 (100.0)South Carolina 1,116 (16.6) 5,593 (83.3) 7 (0.1) 6,716 (100.0)South Dakota 177 (22.0) 628 (78.0) 0 (0.0) 805 (100.0)Tennessee 2,749 (17.0) 13,121 (81.1) 308 (1.9) 16,178 (100.0)Texas 14,472 (18.8) 61,573 (79.9) 1,063 (1.4) 77,108 (100.0)Utah 825 (23.2) 2,418 (68.0) 313 (8.8) 3,556 (100.0)Vermont 288 (17.8) 1,313 (81.0) 19 (1.2) 1,620 (100.0)Virginia 4,599 (17.5) 18,909 (71.9) 2,801 (10.6) 26,309 (100.0)West Virginia 314 (18.8) 1,327 (79.3) 33 (2.0) 1,674 (100.0)Wisconsin** 1,339 (14.0) 8,176 (85.5) 51 (0.5) 9,566 (100.0)Wyoming 0 (0.0) 14 (100.0) 0 (0.0) 14 (100.0)
Total 105,510 (16.5) 518,012 (81.0) 16,105 (2.5) 639,627 (100.0)
Abortion ratio§§ 58 485 215 * Data from 41 states, the District of Columbia, and New York City; excludes two states (Arkansas and Nebraska) in which marital status was reported as
unknown for >15% of women. † Includes married and separated. § Includes never married, divorced, and widowed. ¶ Percentages might not add to 100.0 because of rounding. ** Includes residents only. †† Numbers do not include private physicians’ procedures. §§ Calculated as the number of legal abortions obtained by women of a given marital status per 1,000 live births to women of the same marital status for
these states. For each state, data for women of unknown marital status were distributed according to the known marital status distribution for that state.

Vol. 57 / SS-13 Surveillance Summaries 27
TABLE 12. Reported legal abortions, by number of previous live births and state of occurrence — selected states,* United States, 2005
State
No. of previous live births
0 1 2 3 >4 Unknown Total
No. (%) No. (%) No. (%) No. (%) No. (%) No. (%) No. (%)†
Alabama 4,447 (39.7) 3,368 (30.0) 2,256 (20.1) 772 (6.9) 353 (3.1) 15 (0.1) 11,211 (100.0)Alaska 814 (41.6) 490 (25.1) 348 (17.8) 169 (8.6) 123 (6.3) 11 (0.6) 1,955 (100.0)Arizona 4,724 (44.1) 2,550 (23.8) 1,922 (17.9) 949 (8.9) 556 (5.2) 22 (0.2) 10,723 (100.0)Arkansas 1,809 (38.5) 1,379 (29.4) 992 (21.1) 356 (7.6) 159 (3.4) 0 (0.0) 4,695 (100.0)Colorado 5,814 (49.8) 2,477 (21.2) 1,966 (16.8) 778 (6.7) 412 (3.5) 235 (2.0) 11,682 (100.0)Delaware§ 1,203 (39.7) 843 (27.8) 559 (18.4) 276 (9.1) 145 (4.8) 5 (0.2) 3,031 (100.0)Georgia 11,877 (37.5) 8,564 (27.0) 6,651 (21.0) 2,709 (8.6) 1,429 (4.5) 450 (1.4) 31,680 (100.0)Hawaii 1,651 (46.5) 792 (22.3) 614 (17.3) 269 (7.6) 176 (5.0) 46 (1.3) 3,548 (100.0)Idaho 520 (47.3) 235 (21.4) 224 (20.4) 83 (7.6) 32 (2.9) 5 (0.5) 1,099 (100.0)Indiana 3,437 (32.2) 2,621 (24.5) 2,109 (19.7) 866 (8.1) 533 (5.0) 1,120 (10.5) 10,686 (100.0)Iowa§ 2,617 (44.5) 1,410 (24.0) 1,118 (19.0) 475 (8.1) 247 (4.2) 14 (0.2) 5,881 (100.0)Kansas 4,301 (41.1) 2,717 (26.0) 2,090 (20.0) 915 (8.7) 439 (4.2) 0 (0.0) 10,462 (100.0)Maine 1,400 (52.8) 639 (24.1) 400 (15.1) 152 (5.7) 62 (2.3) 0 (0.0) 2,653 (100.0)Maryland§,¶ 3,293 (35.8) 2,736 (29.7) 1,998 (21.7) 819 (8.9) 352 (3.8) 0 (0.0) 9 198 (100.0)Michigan 10,182 (40.4) 6,525 (25.9) 5,204 (20.6) 2,111 (8.4) 1,186 (4.7) 1 (0.0) 25,209 (100.0)Minnesota 5,663 (42.4) 3,196 (23.9) 2,585 (19.3) 1,169 (8.7) 735 (5.5) 14 (0.1) 13,362 (100.0)Mississippi 964 (31.7) 1,036 (34.1) 670 (22.0) 250 (8.2) 120 (3.9) 1 (0.0) 3,041 (100.0)Missouri 3,125 (39.2) 2,175 (27.3) 1,618 (20.3) 673 (8.4) 386 (4.8) 0 (0.0) 7,977 (100.0)Montana 1,076 (49.9) 501 (23.2) 357 (16.6) 158 (7.3) 61 (2.8) 2 (0.1) 2,155 (100.0)Nebraska 1,268 (40.0) 846 (26.7) 645 (20.3) 272 (8.6) 142 (4.5) 0 (0.0) 3,173 (100.0)Nevada 4,336 (41.0) 2,496 (23.6) 1,935 (18.3) 884 (8.4) 514 (4.9) 400 (3.8) 10,565 (100.0)New Jersey** 12,995 (41.6) 8,272 (26.5) 5,932 (19.0) 2,479 (7.9) 1,509 (4.8) 43 (0.1) 31,230 (100.0)New York 54,079 (43.3) 31,517 (25.2) 22,631 (18.1) 9,830 (7.9) 5,865 (4.7) 927 (0.7) 124,849 (100.0)City 35,584 (40.0) 24,046 (27.1) 17,013 (19.1) 7,166 (8.1) 4,155 (4.7) 927 (1.0) 88,891 (100.0)State 18,495 (51.4) 7,471 (20.8) 5,618 (15.6) 2,664 (7.4) 1,710 (4.8) 0 (0.0) 35,958 (100.0)
North Dakota 544 (44.2) 301 (24.5) 216 (17.5) 110 (8.9) 60 (4.9) 0 (0.0) 1,231 (100.0)Ohio 9,415 (27.6) 9,505 (27.9) 6,964 (20.4) 2,784 (8.2) 1,515 (4.4) 3,945 (11.6) 34,128 (100.0)Oklahoma¶ 2,514 (37.9) 1,835 (27.6) 1,451 (21.8) 580 (8.7) 261 (3.9) 0 (0.0) 6,641 (100.0)Oregon 5,268 (45.4) 2,798 (24.1) 2,225 (19.2) 840 (7.2) 460 (4.0) 11 (0.1) 11,602 (100.0)Pennsylvania 14,362 (41.1) 9,321 (26.7) 6,901 (19.8) 2,825 (8.1) 1,490 (4.3) 10 (0.0) 34,909 (100.0)Rhode Island¶ 2,144 (42.1) 1,352 (26.6) 894 (17.6) 403 (7.9) 178 (3.5) 120 (2.4) 5,091 (100.0)South Carolina 2,944 (43.8) 1,914 (28.5) 1,209 (18.0) 460 (6.8) 185 (2.8) 4 (0.1) 6,716 (100.0)South Dakota¶ 346 (43.0) 183 (22.7) 163 (20.2) 87 (10.8) 26 (3.2) 0 (0.0) 805 (100.0)Tennessee 5,713 (35.3) 4,734 (29.3) 3,457 (21.4) 1,325 (8.2) 756 (4.7) 193 (1.2) 16,178 (100.0)Texas 29,876 (38.7) 21,184 (27.5) 16,083 (20.9) 6,709 (8.7) 3,185 (4.1) 71 (0.1) 77,108 (100.0)Utah 1,459 (41.0) 801 (22.5) 727 (20.4) 315 (8.9) 190 (5.3) 64 (1.8) 3,556 (100.0)Vermont 864 (53.3) 360 (22.2) 281 (17.3) 77 (4.8) 37 (2.3) 1 (0.1) 1,620 (100.0)Virginia 10,491 (39.9) 7,230 (27.5) 5,340 (20.3) 2,009 (7.6) 943 (3.6) 296 (1.1) 26,309 (100.0)Washington 11,141 (46.2) 5,856 (24.3) 4,476 (18.6) 1,766 (7.3) 854 (3.5) 15 (0.1) 24,108 (100.0)West Virginia 619 (37.0) 550 (32.9) 331 (19.8) 128 (7.6) 46 (2.7) 0 (0.0) 1,674 (100.0)Wyoming†† 10 (71.4) — — — — — — 0 (0.0) 0 (0.0) 14 (100.0)
Total§§ 239,305 (40.4) 155,309 (26.2) 115,542 (19.5) 47,832 (8.1) 25,722 (4.3) 8,041 (1.4) 591,755 (100.0)
Abortion ratio¶¶ 226 182 254 264 219 219 * Data from 39 states and New York City; excludes three states (Massachusetts, New Mexico, and North Carolina) in which the number of previous live
births were reported as unknown for >15% of women. † Percentages might not add to 100.0 because of rounding. § Includes residents only. ¶ Indicates number of living children. ** Numbers do not include private physicians’ procedures. †† Cell detail not displayed because of small numbers. §§ Totals do not include small numbers. ¶¶ Calculated as the number of legal abortions obtained by women with a given number of previous live births per 1,000 live births to women with the same
number of previous live births for these states. For each state, data for women whose number of previous live births were unknown were distributed ac-cording to the known number of previous live births for that state.

28 MMWR November 28, 2008
TABLE 13. Reported legal abortions, by number of previous legal induced abortions and state of occurrence — selected states,* United States, 2005
State
No. of previous induced abortions
Total0 1 2 >3 Unknown
No. (%) No. (%) No. (%) No. (%) No. (%) No. (%)†
Alabama 7,413 (66.1) 2,642 (23.6) 806 (7.2) 334 (3.0) 16 (0.1) 11,211 (100.0)Alaska 1,281 (65.5) 431 (22.0) 126 (6.4) 85 (4.3) 32 (1.6) 1,955 (100.0)Arizona 6,665 (62.2) 2,823 (26.3) 865 (8.1) 349 (3.3) 21 (0.2) 10,723 (100.0)Arkansas 2,932 (62.4) 1,014 (21.6) 461 (9.8) 286 (6.1) 2 (0.0) 4,695 (100.0)Colorado 7,394 (63.3) 2,884 (24.7) 809 (6.9) 370 (3.2) 225 (1.9) 11,682 (100.0)Delaware§ 1,938 (63.9) 638 (21.0) 297 (9.8) 153 (5.0) 5 (0.2) 3,031 (100.0)Georgia 18,363 (58.0) 7,993 (25.2) 2,868 (9.1) 1,470 (4.6) 986 (3.1) 31,680 (100.0)Hawaii 2,002 (56.4) 845 (23.8) 293 (8.3) 213 (6.0) 195 (5.5) 3,548 (100.0)Idaho 856 (77.9) 177 (16.1) 46 (4.2) 15 (1.4) 5 (0.5) 1,099 (100.0)Indiana 5,732 (53.6) 2,654 (24.8) 925 (8.7) 407 (3.8) 968 (9.1) 10,686 (100.0)Iowa§ 3,759 (63.9) 1,457 (24.8) 450 (7.7) 202 (3.4) 13 (0.2) 5,881 (100.0)Kansas 6,437 (61.5) 2,556 (24.4) 955 (9.1) 514 (4.9) 0 (0.0) 10,462 (100.0)Kentucky 2,105 (55.7) 971 (25.7) 378 (10.0) 322 (8.5) 0 (0.0) 3,776 (100.0)Maine 1,764 (66.5) 621 (23.4) 186 (7.0) 82 (3.1) 0 (0.0) 2,653 (100.0)Maryland§ 2,281 (24.8) 3,066 (33.3) 2,067 (22.5) 1,003 (10.9) 781 (8.5) 9,198 (100.0)Massachusetts 11,191 (48.1) 5,907 (25.4) 2,907 (12.5) 2,132 (9.2) 1,131 (4.9) 23,268 (100.0)Michigan 12,879 (51.1) 6,607 (26.2) 3,185 (12.6) 2,537 (10.1) 1 (0.0) 25,209 (100.0)Minnesota 7,766 (58.1) 3,277 (24.5) 1,353 (10.1) 965 (7.2) 1 (0.0) 13,362 (100.0)Mississippi 1,951 (64.2) 800 (26.3) 233 (7.7) 57 (1.9) 0 (0.0) 3,041 (100.0)Missouri 4,509 (56.5) 2,062 (25.8) 901 (11.3) 504 (6.3) 1 (0.0) 7,977 (100.0)Montana 1,132 (52.5) 604 (28.0) 248 (11.5) 169 (7.8) 2 (0.1) 2,155 (100.0)Nebraska 2,019 (63.6) 754 (23.8) 219 (6.9) 181 (5.7) 0 (0.0) 3,173 (100.0)Nevada 5,576 (52.8) 2,807 (26.6) 1,163 (11.0) 783 (7.4) 236 (2.2) 10,565 (100.0)New Jersey¶ 20,177 (64.6) 5,757 (18.4) 2,949 (9.4) 2,298 (7.4) 49 (0.2) 31,230 (100.0)New York 56,704 (45.4) 30,121 (24.1) 16,659 (13.3) 15,667 (12.5) 5,698 (4.6) 124,849 (100.0)City 39,275 (44.2) 22,567 (25.4) 13,060 (14.7) 12,742 (14.3) 1,247 (1.4) 88,891 (100.0)State 17,429 (48.5) 7,554 (21.0) 3,599 (10.0) 2,925 (8.1) 4,451 (12.4) 35,958 (100.0)
North Carolina 16,025 (49.6) 7,383 (22.8) 2,710 (8.4) 1,374 (4.2) 4,843 (15.0) 32,335 (100.0)North Dakota 835 (67.8) 271 (22.0) 82 (6.7) 43 (3.5) 0 (0.0) 1,231 (100.0)Oklahoma 4,300 (64.7) 1,606 (24.2) 494 (7.4) 241 (3.6) 0 (0.0) 6,641 (100.0)Oregon 6,439 (55.5) 2,909 (25.1) 1,242 (10.7) 996 (8.6) 16 (0.1) 11,602 (100.0)Pennsylvania 19,244 (55.1) 9,091 (26.0) 3,911 (11.2) 2,653 (7.6) 10 (0.0) 34,909 (100.0)Rhode Island 2,623 (51.5) 1,394 (27.4) 589 (11.6) 359 (7.1) 126 (2.5) 5,091 (100.0)South Carolina 4,231 (63.0) 1,661 (24.7) 531 (7.9) 293 (4.4) 0 (0.0) 6,716 (100.0)South Dakota 559 (69.4) 176 (21.9) 52 (6.5) 18 (2.2) 0 (0.0) 805 (100.0)Tennessee 5,713 (35.3) 4,734 (29.3) 3,457 (21.4) 2,081 (12.9) 193 (1.2) 16,178 (100.0)Texas 43,544 (56.5) 21,266 (27.6) 8,015 (10.4) 4,246 (5.5) 37 (0.0) 77,108 (100.0)Utah 2,308 (64.9) 809 (22.8) 249 (7.0) 190 (5.3) 0 (0.0) 3,556 (100.0)Vermont 962 (59.4) 397 (24.5) 185 (11.4) 76 (4.7) 0 (0.0) 1,620 (100.0)Virginia 14,436 (54.9) 7,345 (27.9) 2,856 (10.9) 1,496 (5.7) 176 (0.7) 26,309 (100.0)Washington 12,694 (52.7) 6,336 (26.3) 2,805 (11.6) 2,231 (9.3) 42 (0.2) 24,108 (100.0)West Virginia 1,142 (68.2) 370 (22.1) 110 (6.6) 52 (3.1) 0 (0.0) 1,674 (100.0)Wyoming** 12 (85.7) — — 0 (0.0) 0 (0.0) — — 14 (100.0)
Total†† 329,893 (53.5) 155,216 (25.2) 68,637 (11.1) 47,447 (7.7) 15,811 (2.6) 617,006 (100.0) * Data from 41 states, the District of Columbia, and New York City; excludes two states (New Mexico and Ohio) in which number of previous induced abor-
tions were reported as unknown for >15% of women. † Percentages might not add to 100.0 because of rounding. § Includes residents only. ¶ Numbers do not include private physicians’ procedures. ** Cell detail not displayed because of small numbers. †† Totals do not include small numbers.

Vol. 57 / SS-13 Surveillance Summaries 29
TABLE 15. Reported legal abortions, by known ethnicity, age group, and marital status of women who obtained an abortion — selected states, United States, 2005
Characteristic
Ethnicity
TotalHispanic Non-Hispanic
No. (%) No. (%) No. (%)
Age groups (yrs)<15 431 (0.5) 1,937 (0.6) 2,368 (0.5)
15–19 13,840 (15.8) 57,103 (16.5) 70,943 (16.4)20–24 29,634 (33.8) 112,734 (32.7) 142,368 (32.9)25–29 22,189 (25.3) 80,209 (23.2) 102,398 (23.7)30–34 12,736 (14.5) 50,224 (14.6) 62,960 (14.5)35–39 6,624 (7.6) 30,979 (9.0) 37,603 (8.7)
≥40 2,281 (2.6) 11,914 (3.5) 14,195 (3.3)
Total* 87,735 (100.0) 345,100 (100.0) 432,835 (100.0)
Marital statusMarried 14,468 (17.6) 50,529 (16.2) 64,997 (16.5)Unmarried 67,561 (82.4) 260,759 (83.8) 328,320 (83.5)
Total† 82,029 (100.0) 311,288 (100.0) 393,317 (100.0)* Data from 28 states, the District of Columbia, and New York City; excludes 12 states (Alaska, Georgia, Massachusetts, Montana, Nebraska, Nevada, North
Carolina, North Dakota, Oklahoma, Rhode Island, Virginia, and Washington) in which ethnicity was reported as unknown for >15% of women.† Data from 28 states, the District of Columbia, and New York City; excludes 12 states (Alaska, Arkansas, Georgia, Massachusetts, Montana, Nebraska,
Nevada, North Carolina, North Dakota, Oklahoma, Rhode Island, and Virginia) in which ethnicity or marital status was reported as unknown for >15% of women.
TABLE 14. Reported legal abortions, by known race, age group, and marital status of women who obtained an abortion — selected states,* United States, 2005
Characteristic
Race
TotalWhite Black Other
No. (%) No. (%) No. (%) No. (%)
Age group (yrs)<15 1,258 (0.4) 1,561 (0.8) 134 (0.3) 2,953 (0.6)
15–19 47,797 (16.4) 31,701 (16.1) 5,013 (13.1) 84,511 (16.0)20–24 98,832 (33.9) 63,788 (32.3) 10,959 (28.5) 173,579 (32.9)25–29 66,074 (22.7) 50,528 (25.6) 9,237 (24.1) 125,839 (23.9)30–34 40,895 (14.0) 30,314 (15.4) 6,795 (17.7) 78,004 (14.8)35–39 26,290 (9.0) 14,972 (7.6) 4,449 (11.6) 45,711 (8.7)
>40 10,312 (3.5) 4,608 (2.3) 1,812 (4.7) 16,732 (3.2)
Total* 291,458 (100.0) 197,472 (100.0) 38,399 (100.0) 527,329 (100.0)
Marital statusMarried 52,441 (18.5) 20,526 (11.0) 12,381 (33.9) 85,348 (16.9)Unmarried 230,529 (81.5) 165,968 (89.0) 24,139 (66.1) 420,636 (83.1)
Total† 282,970 (100.0) 186,494 (100.0) 36,520 (100.0) 505,984 (100.0)* Data from 36 states, the District of Columbia, and New York City; excludes eight states (Arizona, Nebraska, Nevada, New Mexico, New York Upstate, Utah,
Washington, and Wyoming) in which race was reported as unknown for >15% of women. Percentages might not add to 100.0 because of rounding.† Data from 35 states, the District of Columbia, and New York City; excludes seven states (Arizona, Arkansas, Nebraska, Nevada, New Mexico, Utah, and
Wyoming) in which race or marital status was reported as unknown for >15% of women.
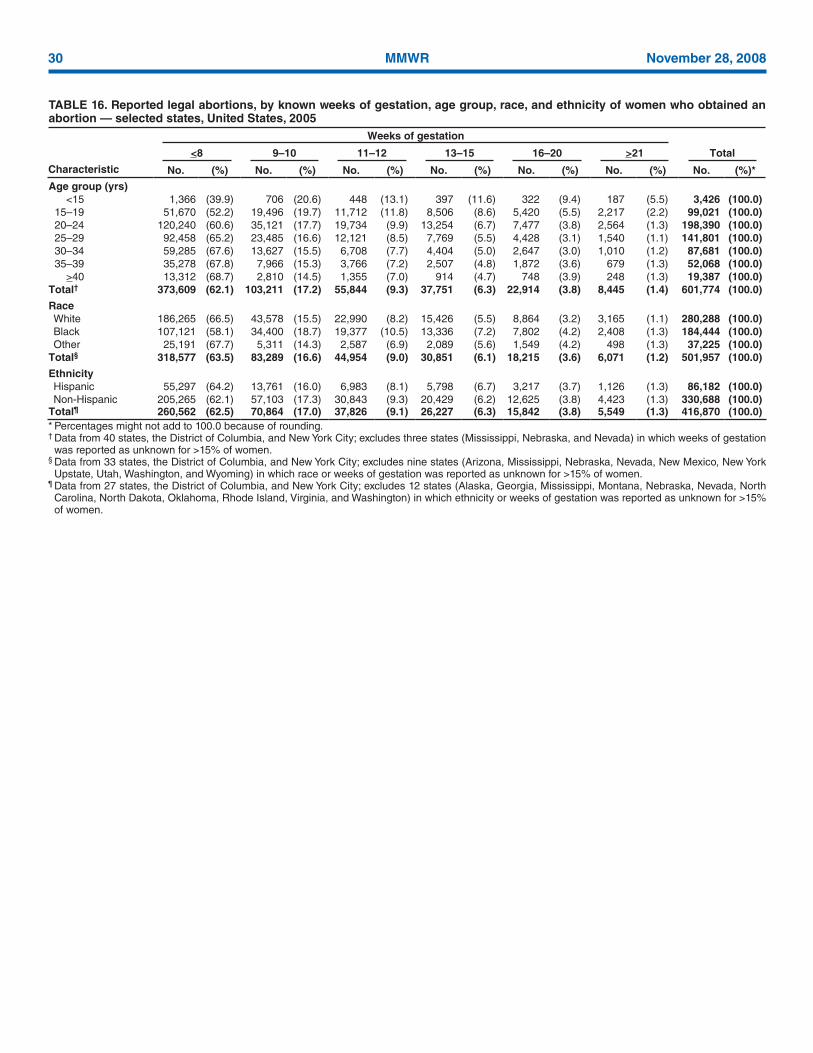
30 MMWR November 28, 2008
TABLE 16. Reported legal abortions, by known weeks of gestation, age group, race, and ethnicity of women who obtained an abortion — selected states, United States, 2005
Characteristic
Weeks of gestation
Total<8 9–10 11–12 13–15 16–20 >21
No. (%) No. (%) No. (%) No. (%) No. (%) No. (%) No. (%)*
Age group (yrs) <15 1,366 (39.9) 706 (20.6) 448 (13.1) 397 (11.6) 322 (9.4) 187 (5.5) 3,426 (100.0)
15–19 51,670 (52.2) 19,496 (19.7) 11,712 (11.8) 8,506 (8.6) 5,420 (5.5) 2,217 (2.2) 99,021 (100.0)20–24 120,240 (60.6) 35,121 (17.7) 19,734 (9.9) 13,254 (6.7) 7,477 (3.8) 2,564 (1.3) 198,390 (100.0)25–29 92,458 (65.2) 23,485 (16.6) 12,121 (8.5) 7,769 (5.5) 4,428 (3.1) 1,540 (1.1) 141,801 (100.0)30–34 59,285 (67.6) 13,627 (15.5) 6,708 (7.7) 4,404 (5.0) 2,647 (3.0) 1,010 (1.2) 87,681 (100.0)35–39 35,278 (67.8) 7,966 (15.3) 3,766 (7.2) 2,507 (4.8) 1,872 (3.6) 679 (1.3) 52,068 (100.0)
>40 13,312 (68.7) 2,810 (14.5) 1,355 (7.0) 914 (4.7) 748 (3.9) 248 (1.3) 19,387 (100.0)Total† 373,609 (62.1) 103,211 (17.2) 55,844 (9.3) 37,751 (6.3) 22,914 (3.8) 8,445 (1.4) 601,774 (100.0)
RaceWhite 186,265 (66.5) 43,578 (15.5) 22,990 (8.2) 15,426 (5.5) 8,864 (3.2) 3,165 (1.1) 280,288 (100.0)Black 107,121 (58.1) 34,400 (18.7) 19,377 (10.5) 13,336 (7.2) 7,802 (4.2) 2,408 (1.3) 184,444 (100.0)Other 25,191 (67.7) 5,311 (14.3) 2,587 (6.9) 2,089 (5.6) 1,549 (4.2) 498 (1.3) 37,225 (100.0)
Total§ 318,577 (63.5) 83,289 (16.6) 44,954 (9.0) 30,851 (6.1) 18,215 (3.6) 6,071 (1.2) 501,957 (100.0)
EthnicityHispanic 55,297 (64.2) 13,761 (16.0) 6,983 (8.1) 5,798 (6.7) 3,217 (3.7) 1,126 (1.3) 86,182 (100.0)Non-Hispanic 205,265 (62.1) 57,103 (17.3) 30,843 (9.3) 20,429 (6.2) 12,625 (3.8) 4,423 (1.3) 330,688 (100.0)
Total¶ 260,562 (62.5) 70,864 (17.0) 37,826 (9.1) 26,227 (6.3) 15,842 (3.8) 5,549 (1.3) 416,870 (100.0)* Percentages might not add to 100.0 because of rounding.† Data from 40 states, the District of Columbia, and New York City; excludes three states (Mississippi, Nebraska, and Nevada) in which weeks of gestation
was reported as unknown for >15% of women.§ Data from 33 states, the District of Columbia, and New York City; excludes nine states (Arizona, Mississippi, Nebraska, Nevada, New Mexico, New York
Upstate, Utah, Washington, and Wyoming) in which race or weeks of gestation was reported as unknown for >15% of women.¶ Data from 27 states, the District of Columbia, and New York City; excludes 12 states (Alaska, Georgia, Mississippi, Montana, Nebraska, Nevada, North
Carolina, North Dakota, Oklahoma, Rhode Island, Virginia, and Washington) in which ethnicity or weeks of gestation was reported as unknown for >15% of women.

Vol. 57 / SS-13 Surveillance Summaries 31
TABLE 17. Reported legal abortions obtained at <8 weeks of gestation, by known weeks of gestation, age group, race, and ethnicity of women who obtained an abortion — selected states, United States, 2005
Characteristic
Weeks of gestation
Total<6 7 8
No. (%) No. (%) No. (%) No. (%)*
Age group (yrs) <15 510 (15.1) 419 (12.4) 424 (12.6) 1,353 (40.1)
15–19 21,774 (22.4) 15,172 (15.6) 13,961 (14.3) 50,907 (52.3)20–24 55,599 (28.5) 34,407 (17.6) 28,486 (14.6) 118,492 (60.7)25–29 44,317 (31.7) 26,419 (18.9) 20,536 (14.7) 91,272 (65.3)30–34 28,537 (33.0) 17,101 (19.8) 12,851 (14.9) 58,489 (67.7)35–39 17,184 (33.5) 10,047 (19.6) 7,551 (14.7) 34,782 (67.8)
>40 6,910 (36.2) 3,563 (18.7) 2,656 (13.9) 13,129 (68.8)Total† 174,831 (29.5) 107,128 (18.1) 86,465 (14.6) 368,424 (62.2)
RaceWhite 96,052 (34.3) 50,847 (18.1) 39,366 (14.0) 186,265 (66.5)Black 46,358 (25.1) 32,983 (17.9) 27,780 (15.1) 107,121 (58.1)Other 13,195 (35.4) 6,983 (18.8) 5,013 (13.5) 25,191 (67.7)
Total§ 155,605 (31.0) 90,813 (18.1) 72,159 (14.4) 318,577 (63.5)
EthnicityHispanic 28,746 (33.4) 14,750 (17.1) 11,801 (13.7) 55,297 (64.2)Non-Hispanic 98,036 (29.6) 58,955 (17.8) 48,274 (14.6) 205,265 (62.1)
Total¶ 126,782 (30.4) 73,705 (17.7) 60,075 (14.4) 260,562 (62.5)* Percentages were calculated using total number of abortions obtained at all known weeks of gestation. Percentages might not add to the percentage
obtained at <8 weeks of gestation because fewer states are included in certain variables. Also, percentages might not add to the total percentage because of rounding.
† Data from 38 states, the District of Columbia, and New York City; excludes three states (Mississippi, Nebraska, and Nevada) in which weeks of gestation was reported as unknown for >15% of women.
§ Data from 33 states, the District of Columbia, and New York City; excludes nine states (Arizona, Mississippi, Nebraska, Nevada, New Mexico, New York Upstate, Utah, Washington, and Wyoming) in which race or weeks of gestation was reported as unknown for >15% of women.
¶ Data from 29 states, the District of Columbia, and New York City; excludes 12 states (Alaska, Georgia, Mississippi, Montana, Nebraska, Nevada, North Carolina, North Dakota, Oklahoma, Rhode Island, Virginia, and Washington) in which ethnicity or weeks of gestation was reported as unknown for >15% of women.
TABLE 18. Reported legal abortions, by known weeks of gestation and types of procedures — selected states,* United States, 2005
Type of procedure
Weeks of gestation
Total<8 9–10 11–12 13–15 16–20 >21
No. (%) No. (%) No. (%) No. (%) No. (%) No. (%) No. (%)
Curettage (suction or sharp)† 300,255 (82.4) 98,492 (97.3) 53,815 (98.7) 36,385 (98.6) 21,211 (95.4) 6,951 (85.1) 517,109 (88.0)
Intrauterine instillation 212 (0.1) 92 (0.1) 46 (0.1) 50 (0.1) 137 (0.7) 91 (1.1) 628 (0.1)Medical§ 54,872 (15.1) 2,016 (2.0) 262 (0.5) 149 (0.4) 460 (2.1) 387 (4.7) 58,146 (9.9)Other¶ 9,251 (2.5) 601 (0.6) 374 (0.7) 321 (0.9) 434 (2.0) 743 (9.1) 11,724 (2.0)
Total 364,590 (100.0) 101,201 (100.0) 54,497 (100.0) 36,905 (100.0) 22,242 (100.0) 8,172 (100.0) 587,607 (100.0)* Data from 40 states, the District of Columbia, and New York City; excludes three states (Mississippi, Nebraska, and Nevada) in which gestational age was
reported as unknown for >15% of women.† Includes dilatation and evacuation.§ Medical (nonsurgical) procedures differed by weeks of gestation (i.e., methotrexate and misoprostol or mifepristone and misoprostol were reported for
abortions performed at <8 weeks gestation; vaginal prostaglandins were primarily reported for abortions performed at later weeks of gestation).¶ Includes hysterotomy/hysterectomy and procedures reported as “other.”

32 MMWR November 28, 2008
TABLE 19. Number of deaths and case-fatality rates* for abortion-related deaths reported to CDC, by type of abortion — United States, 1972–2004†
Year
Type of abortion
Total Case-fatality rate*
Induced
Unknown§Legal Illegal
1972 24 39 2 65 4.11973 25 19 3 47 4.11974 26 6 1 33 3.41975 29 4 1 34 3.41976 11 2 1 14 1.11977 17 4 0 21 1.61978 9 7 0 16 0.81979 22 0 0 22 1.81980 9 1 2 12 0.71981 8 1 0 9 0.61982 11 1 0 12 0.81983 11 1 0 12 0.91984 12 0 0 12 0.91985 11 1 1 13 0.81986 11 0 2 13 0.81987 7 2 0 9 0.51988 16 0 0 16 1.21989 12 1 0 13 0.91990 9 0 0 9 0.61991 11 1 0 12 0.81992 10 0 0 10 0.71993 6 1 2 9 0.51994 10 2 0 12 0.81995 4 0 0 4 0.31996 9 0 0 9 0.71997 7 0 0 7 0.61998 10 0 0 10 —¶
1999 4 0 0 4 —¶
2000 11 0 0 11 —¶
2001 6 1 0 7 —¶
2002 9 0 0 9 —¶
2003 10 0 0 10 —¶
2004 7 1 0 8 —¶
Total 393 95 15 504 1.1∗∗ * Legal induced abortion-related deaths per 100,000 reported legal induced abortions for the United States. † Certain numbers might differ from those in previously published reports because additional information has been supplied to CDC. § Unknown whether induced or spontaneous abortions. ¶ Case-fatality rates for 1998–2004 cannot be calculated because a substantial number of abortions occurred in the nonreporting states/areas, and the
total number of abortions (the denominator) is unknown. ** Case-fatality rate computed for 1972–1997 only.


MMWR
The Morbidity and Mortality Weekly Report (MMWR) Series is prepared by the Centers for Disease Control and Prevention (CDC) and is available free of charge in electronic format. To receive an electronic copy each week, send an e-mail message to [email protected]. The body content should read SUBscribe mmwr-toc. Electronic copy also is available from CDC’s Internet server at http://www.cdc.gov/mmwr or from CDC’s file transfer protocol server at ftp://ftp.cdc.gov/pub/publications/mmwr. Paper copy subscriptions are available through the Superintendent of Documents, U.S. Government Printing Office, Washington, DC 20402; telephone 202-512-1800.
Data in the weekly MMWR are provisional, based on weekly reports to CDC by state health departments. The reporting week concludes at close of business on Friday; compiled data on a national basis are officially released to the public on the following Friday. Data are compiled in the National Center for Public Health Informatics, Division of Integrated Surveillance Systems and Services. Address all inquiries about the MMWR Series, including material to be considered for publication, to Editor, MMWR Series, Mailstop E-90, CDC, 1600 Clifton Rd., N.E., Atlanta, GA 30333 or to [email protected].
All material in the MMWR Series is in the public domain and may be used and reprinted without permission; citation as to source, however, is appreciated.
Use of trade names and commercial sources is for identification only and does not imply endorsement by the U.S. Department of Health and Human Services.
References to non-CDC sites on the Internet are provided as a service to MMWR readers and do not constitute or imply endorsement of these organizations or their programs by CDC or the U.S. Department of Health and Human Services. CDC is not responsible for the content of these sites. URL addresses listed in MMWR were current as of the date of publication.
✩U.S. Government Printing Office: 2009-523-019/41137 Region IV ISSN: 1546-0738