
ABN 51 116 399 430 For personal use only · 2009. 2. 24. · Goodman Fielder Limited Analyst...
43
Goodman Fielder Limited ABN 51 116 399 430 75 Talavera Road Macquarie Park, NSW, 2113 Phone: 02 8874 6000 Fax: 02 8874 6099 www.goodmanfielder.com.au The registered office of Goodman Fielder Limited and its Australian subsidiaries is 75 Talavera Road, Macquarie Park, NSW, 2113 25 February 2009 Announcements Officer Listed Company Relations Company Announcements Office New Zealand Exchange Limited ASX Limited Level 2, NZX Centre Exchange Centre 11 Cable Street 20 Bridge Street WELLINGTON SYDNEY NSW 2000 NEW ZEALAND Goodman Fielder Limited Analyst Briefing – Results for the period ended 31 December 2008 I attach a copy of the Analyst Briefing to be presented today in connection with the financial results of Goodman Fielder Limited for the half year ended 31 December 2008. The Analyst Briefing will be posted to Goodman Fielder’s website once released to the market. Yours sincerely, JONATHON WEST Company Secretary For personal use only
Transcript of ABN 51 116 399 430 For personal use only · 2009. 2. 24. · Goodman Fielder Limited Analyst...

Goodman Fielder Limited ABN 51 116 399 430
75 Talavera Road
Macquarie Park, NSW, 2113
Phone: 02 8874 6000
Fax: 02 8874 6099
www.goodmanfielder.com.au
The registered office of Goodman Fielder Limited and its Australian subsidiaries is 75 Talavera Road, Macquarie Park, NSW, 2113
25 February 2009 Announcements Officer Listed Company Relations Company Announcements Office New Zealand Exchange Limited ASX Limited Level 2, NZX Centre Exchange Centre 11 Cable Street 20 Bridge Street WELLINGTON SYDNEY NSW 2000 NEW ZEALAND
Goodman Fielder Limited Analyst Briefing – Results for the period ended 31 December 2008
I attach a copy of the Analyst Briefing to be presented today in connection with the financial results of Goodman Fielder Limited for the half year ended 31 December 2008. The Analyst Briefing will be posted to Goodman Fielder’s website once released to the market. Yours sincerely,
JONATHON WEST Company Secretary
For
per
sona
l use
onl
y

Left
HY F’09 25 Feb 2009 1
Right
Building for the futurePresentation to Analysts - HY F’09
For
per
sona
l use
onl
y
Left
HY F’09 25 Feb 2009 2
Right
AgendaAgenda
1. Group Highlights
2. Divisional Review
3. Financial Results
4. Outlook
3
Building for the futurePresentation to Analysts - HY F’09
For
per
sona
l use
onl
y

Left
HY F’09 25 Feb 2009 3
Right
Group HighlightsGroup Highlights
5
Building for the futurePresentation to Analysts - HY F’09
For
per
sona
l use
onl
y

Left
HY F’09 25 Feb 2009 4
Right
Group HighlightsGroup Highlights
• Strong revenue growth
• Commodity volatility impacts earnings– $120m cost increase
• Changing consumer buying patterns– PLG migration
• Reported earnings– Timing on NZ brand sale (H1→H2)
– Includes $6.6m restructuring costs
7
8
Group Financial SummaryGroup Financial Summary
8
A$m HY F’09 HY F’08 Change
Revenue 1,477.6 1,316.8 12.2%
EBITDA 175.9 189.7 -7.3%
Reported NPAT 73.9 94.6 -21.9%
For
per
sona
l use
onl
y

Left
HY F’09 25 Feb 2009 5
Right
Group HighlightsGroup Highlights
• Strong Cash Flows
• Prudent Balance Sheet management
• Dividend Payout Ratio of 80%
9
10
Group Financial SummaryGroup Financial Summary
10
A$m HY F’09 HY F’08 Change
Free Cash Flow 164.6 168.3 -2.2%
Operating Cash Flow 87.7 95.3 -8.0%
Cash Realisation 115% 99% 16%
Net Debt 1,103.1 1,060.0 -4.1%
Dividend (cps) 4.5 6.0 -25%For
per
sona
l use
onl
y
Left
HY F’09 25 Feb 2009 6
Right
Group HighlightsGroup Highlights
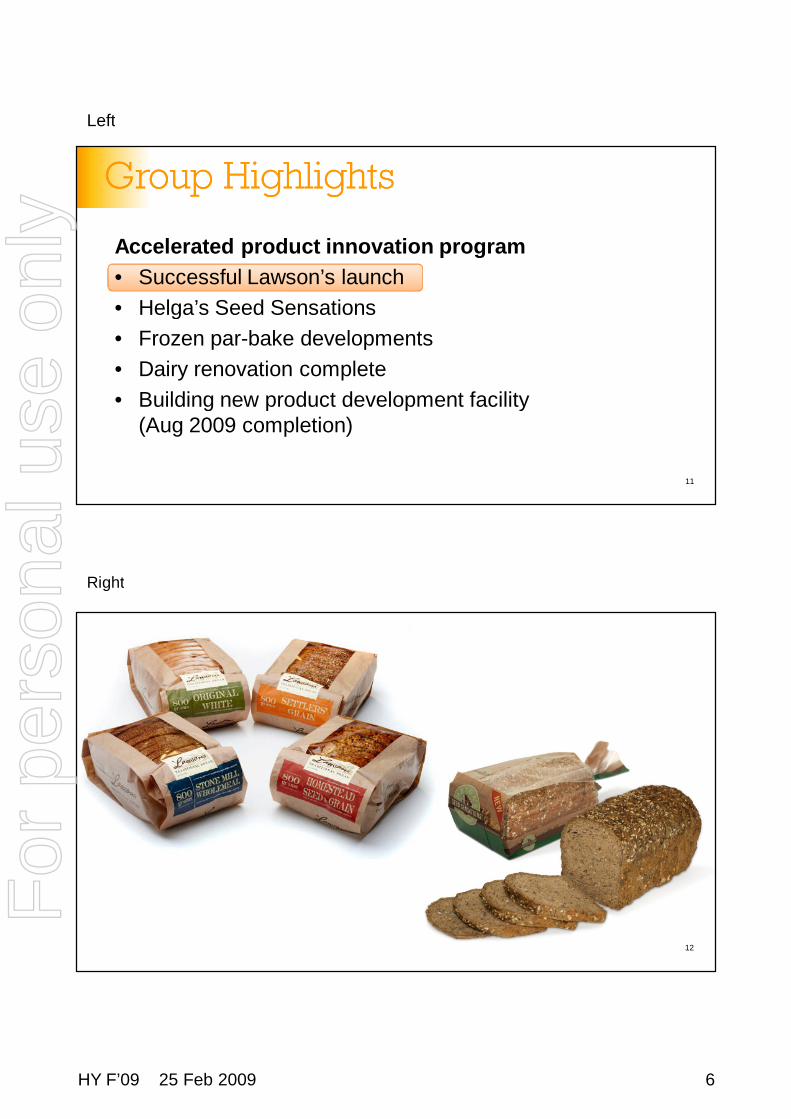
Accelerated product innovation program
• Successful Lawson’s launch
• Helga’s Seed Sensations
• Frozen par-bake developments
• Dairy renovation complete
• Building new product development facility(Aug 2009 completion)
11
12
For
per
sona
l use
onl
y

Left
HY F’09 25 Feb 2009 7
Right
Group HighlightsGroup Highlights
Efficiency drive well advanced
• Erskine Park completion 2009
• Stage 1 Mascot closure Dec 2008
• China commercial production Nov 2008
• Announced development of new Brisbane bakery
• On track to reduce workforce by 5% during F’09
13
Photo ofErskine Park
New Erskine Park FacilityNew Erskine Park Facility
For
per
sona
l use
onl
y

Left
HY F’09 25 Feb 2009 8
Right
Group HighlightsGroup Highlights
• Good progress in the development of a scale Asia-Pacificbusiness
– Strong revenue growth (+36.8%)
– Established local manufacturing capability
– New category development leveraging expertise inDairy / Milling / Fats & Oils
– Strong management team
15
16
For
per
sona
l use
onl
y

Left
HY F’09 25 Feb 2009 9
Right
Group HighlightsGroup Highlights
• Good progress in the development of a scale Asia-Pacificbusiness
– Strong revenue growth (+36.8%)
– Established local manufacturing capability
– New category development leveraging expertise inDairy / Milling / Fats & Oils
– Strong management team
• Commodities retreating from historic highs
– Goodman Fielder well positioned
17
Group HighlightsGroup Highlights
185YR Average July 2008 Feb 2009 Jun 2009 (Forecast)
254
428
298
0
100
200
300
400
500
Wheat
36
56
48
40
0
10
20
30
40
50
60
Dairy (Milk)
1084
1680
1310
0
500
1000
1500
2000
Canola
Market PricesA$/mt cpl A$/mt
For
per
sona
l use
onl
y

Left
HY F’09 25 Feb 2009 10
Right
Group HighlightsGroup Highlights
• Good progress in the development of a scale Asia-Pacificbusiness
– Strong revenue growth (+36.8%)
– Established local manufacturing capability
– New category development leveraging expertise inDairy / Milling / Fats & Oils
– Strong management team
• Commodities retreating from historic highs
– Goodman Fielder well positioned
• Successfully refinanced $770m debt over the last 12 months
19
Building for the futurePresentation to Analysts - HY F’09
For
per
sona
l use
onl
y

Left
HY F’09 25 Feb 2009 11
Right
Divisional ReviewDivisional Review
21
Building for the futurePresentation to Analysts - HY F’09
For
per
sona
l use
onl
y

Left
HY F’09 25 Feb 2009 12
Right
GF Fresh BakingGF Fresh Baking –– Key Take OutsKey Take Outs
• Earnings impacted by– Slowing economy (PLG growth)
– High wheat costs
– Weaker (NZ) currency
• Improved Q2 following successful NPD initiatives– Lawson’s
– La Famiglia
• Continued strong management of working capital
23
24
GF Fresh BakingGF Fresh Baking
24
A$m HY F’09 HY F’08 Change
Revenue 493.3 499.4 -1.2%
EBITDA 57.5 75.6 -23.9%
EBITDA Margin (%) 11.7% 15.1% -3.4%
Working Capital -3.9 16.2 124.1%
Free Cash Flow 43.2 69.2 -37.6%
Capex 13.0 9.7 -34.0%For
per
sona
l use
onl
y

Left
HY F’09 25 Feb 2009 13
Right
GF Fresh BakingGF Fresh Baking –– Key Take OutsKey Take Outs
• Outstanding progress in our manufacturing performance– Cost / Quality / Service
– 6 Sigma program
• Manufacturing consolidation– New Brisbane Bakery
• Logistics restructure to be completed (Q3)
25
26
For
per
sona
l use
onl
y

Left
HY F’09 25 Feb 2009 14
Right
GF Fresh BakingGF Fresh Baking –– Key Take OutsKey Take Outs
• Continuing to build our frozen par-bake capability
• Improved commodity outlook to underpin margindevelopment
• PLG contract negotiations in progress
27
28
For
per
sona
l use
onl
y

Left
HY F’09 25 Feb 2009 15
Right
GF CommercialGF Commercial –– Key Take OutsKey Take Outs
• A difficult trading environment; Viz– Extreme commodity volatility
– Softening customer demand (weaker economy)
– Competitive discounting to move inventory
– Existing conditions set to continue through F’09
29
30
GF CommercialGF Commercial
30
A$m HY F’09 HY F’08 Change
Revenue 286.7 251.3 14.1%
EBITDA 32.2 29.5 9.2%
EBITDA Margin (%) 11.2% 11.7% -0.5%
Working Capital 96.2 82.6 -16.5%
Free Cash Flow 9.4 6.5 44.6%
Capex 6.0 5.8 -3.4%For
per
sona
l use
onl
y

Left
HY F’09 25 Feb 2009 16
Right
GF CommercialGF Commercial –– Key Take OutsKey Take Outs
• Portfolio development– Leveraging expertise in Milling / Fats & Oils technology /
Bakery solutions
• Channel development– Food Service / Industrial / QSR
• Operational improvements well progressed– Murarrie / Footscray capital programs
– Mascot closure 2009
– China in-country production commenced (Nov)
– Management talent 31
32
For
per
sona
l use
onl
y

Left
HY F’09 25 Feb 2009 17
Right
GF CommercialGF Commercial –– Key Take OutsKey Take Outs
• Paradigm shift in commodity markets– Catalyst for further industry consolidation
33
34
For
per
sona
l use
onl
y

Left
HY F’09 25 Feb 2009 18
Right
GF Home IngredientsGF Home Ingredients –– Key Take OutsKey Take Outs
• Strong revenue growth– Paradise acquisition
– Solid market shares
• Spreads growth constrained by new line commissioning
• Earnings solid despite commodity cost increases
35
36
GF Home IngredientsGF Home Ingredients
36
A$m HY F’09 HY F’08 Change
Revenue 266.7 197.8 34.8%
EBITDA 49.7 46.9 6%
EBITDA Margin (%) 18.6% 23.7% -5.1%
Working Capital 44.0 35.7 -23.2%
Free Cash Flow 60.7 55.9 8.6%
Capex 8.1 - -For
per
sona
l use
onl
y

Left
HY F’09 25 Feb 2009 19
Right
GF Home IngredientsGF Home Ingredients –– Key Take OutsKey Take Outs
• Robust category growth despite a softening economy
37
GF Home IngredientsGF Home Ingredients
11.8
8.0
19.0
1.4
10.0
6.9 6.3
11.2
0.0
2.0
4.0
6.0
8.0
10.0
12.0
14.0
16.0
18.0
20.0
Spreads D&M FrozenPastry
Cooking Oil Flour Cake Mix Dips Biscuits
%C
hg
Category
NationalDollars (000s) Growth % YA
Qtr to 4/1/09
38* Aztec Data to 4/1/09
For
per
sona
l use
onl
y

Left
HY F’09 25 Feb 2009 20
Right
GF Home IngredientsGF Home Ingredients –– Key Take OutsKey Take Outs
• Robust category growth despite a softening economy
• Successful NPD program
39
40
For
per
sona
l use
onl
y

Left
HY F’09 25 Feb 2009 21
Right
GF Home IngredientsGF Home Ingredients –– Key Take OutsKey Take Outs
• Robust category growth despite a softening economy
• Successful NPD program
• Significant improvement in operational capability– Carole Park (Biscuits)
– Salisbury (Dips)
• Erskine Park liquid grocery facility well advanced
41
For
per
sona
l use
onl
y

Left
HY F’09 25 Feb 2009 22
Right
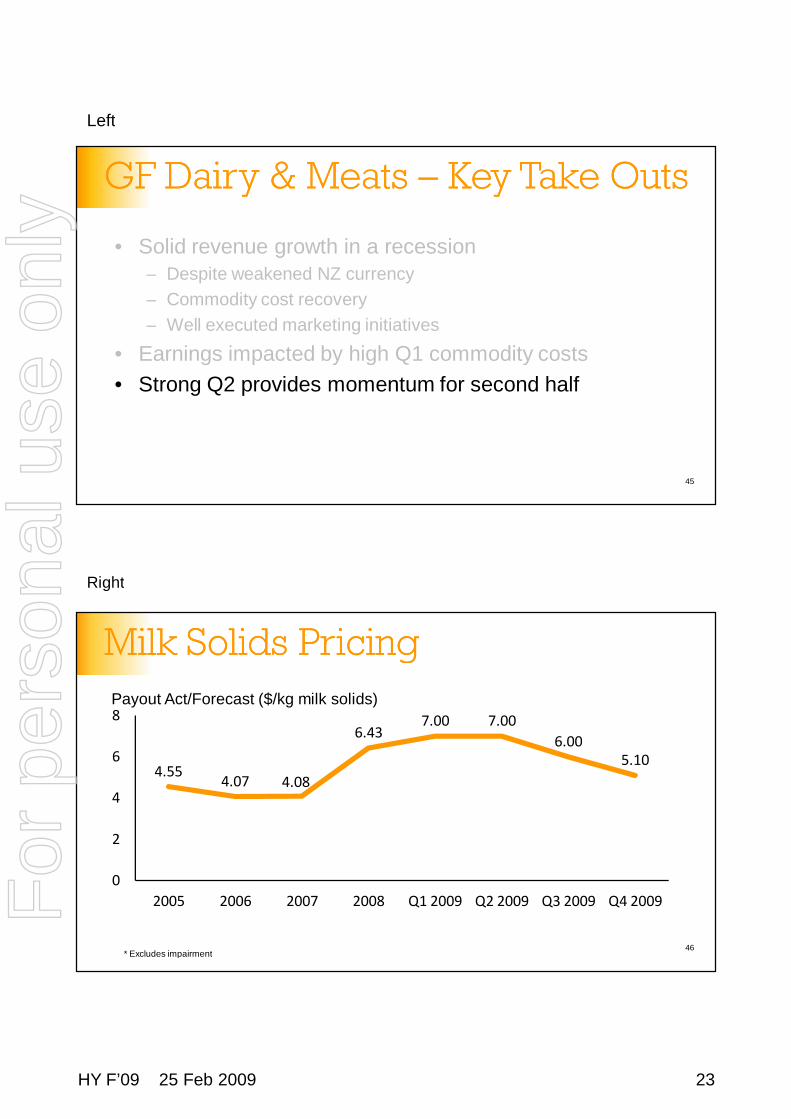
GF Dairy & MeatsGF Dairy & Meats –– Key Take OutsKey Take Outs
• Solid revenue growth in a recession– Despite weakened NZ currency
– Commodity cost recovery
– Well executed marketing initiatives
• Earnings impacted by high Q1 commodity costs
43
44
GF Dairy & MeatsGF Dairy & Meats
44
A$m HY F’09 HY F’08 Change
Revenue 243.1 231.0 5.2%
EBITDA 18.2 26.0 -30.0%
EBITDA Margin (%) 7.5% 11.3% -3.8%
Working Capital 10.7 60.2 82.2%
Free Cash Flow 25.2 20.0 26%
Capex 2.9 7.7 62.3%For
per
sona
l use
onl
y
Left
HY F’09 25 Feb 2009 23
Right
GF Dairy & MeatsGF Dairy & Meats –– Key Take OutsKey Take Outs
• Solid revenue growth in a recession– Despite weakened NZ currency
– Commodity cost recovery
– Well executed marketing initiatives
• Earnings impacted by high Q1 commodity costs
• Strong Q2 provides momentum for second half
45
Milk Solids PricingMilk Solids Pricing
46
4.554.07 4.08
6.437.00 7.00
6.005.10
0
2
4
6
8
2005 2006 2007 2008 Q1 2009 Q2 2009 Q3 2009 Q4 2009
* Excludes impairment
Payout Act/Forecast ($/kg milk solids)
For
per
sona
l use
onl
y

Left
HY F’09 25 Feb 2009 24
Right
GF Dairy & MeatsGF Dairy & Meats –– Key Take OutsKey Take Outs
• Marketing programs building for the future– Beverages
• Impulse
– Yogurts / desserts
– Specialty cheese• Blue / brie
47
48
For
per
sona
l use
onl
y

Left
HY F’09 25 Feb 2009 25
Right
GF Dairy & MeatsGF Dairy & Meats –– Key Take OutsKey Take Outs
• Marketing programs building for the future– Meats / Smallgoods
• Kiwi
49
50
For
per
sona
l use
onl
y

Left
HY F’09 25 Feb 2009 26
Right
GF Dairy & MeatsGF Dairy & Meats –– Key Take OutsKey Take Outs
Manufacturing optimisation
• Longburn
– Major capital works completed
– Improved labour efficiency
– Yield focus
• Christchurch
– Low cost UHT production
– Reviewing capacity expansion
• Puhoi
– Significant yield / efficiency improvements51
52
For
per
sona
l use
onl
y

Left
HY F’09 25 Feb 2009 27
Right
GF Asia PacificGF Asia Pacific –– Key Take OutsKey Take Outs
• Strong revenue growth– Price recovery against commodity cost increases
– Solid Pacific volumes
• Earnings performance underpinned by Pacificmarketing initiatives
53
54
GF Asia PacificGF Asia Pacific
54
A$m HY F’09 HY F’08 Change
Revenue 187.8 137.3 36.8%
EBITDA 23.8 17.9 33%
EBITDA Margin (%) 12.7% 13.0% -0.3%
Working Capital 58.8 37.5 -56.8%
Free Cash Flow 26.1 16.7 56.3%
Capex 1.4 0.8 -75%For
per
sona
l use
onl
y

Left
HY F’09 25 Feb 2009 28
Right
GF Asia PacificGF Asia Pacific –– Key Take OutsKey Take Outs
• Future growth underpinned by– Category expansion (Dairy / Bakery / Snacks)
– Improved commodity cost outlook
– Strong management team
55
56
For
per
sona
l use
onl
y

Left
HY F’09 25 Feb 2009 29
Right
2009 Strategy Focus2009 Strategy Focus
• Cash generation
• Preserve our strong Balance Sheet
• Strategic review underway
57
Building for the futurePresentation to Analysts - HY F’09
For
per
sona
l use
onl
y

Left
HY F’09 25 Feb 2009 30
Right
Financial ResultsFinancial Results
59
Building for the futurePresentation to Analysts - HY F’09
For
per
sona
l use
onl
y

Left
HY F’09 25 Feb 2009 31
Right
HY F’09 Financial ResultsHY F’09 Financial Results
• EBITDA includes restructure costs $6.6m
• Interest reflects impact of commodity costs peak
• Tax rate 19.4% incorporates significant ongoingR&D benefit
• Reported Net Profit @ 5% of sales at the top ofcommodity cycle
61
62
HY F’09 Financial ResultsHY F’09 Financial Results
62
A$mHY F’09
Reported% NSV
Revenue 1,477.6 100%
EBITDA 175.9 11.9%
EBIT 145.6 9.9%
Interest 50.9 3.4%
Tax 18.4 1.2%
OEI 2.4 0.2%
NPAT 73.9 5%
For
per
sona
l use
onl
y
Left
HY F’09 25 Feb 2009 32
Right
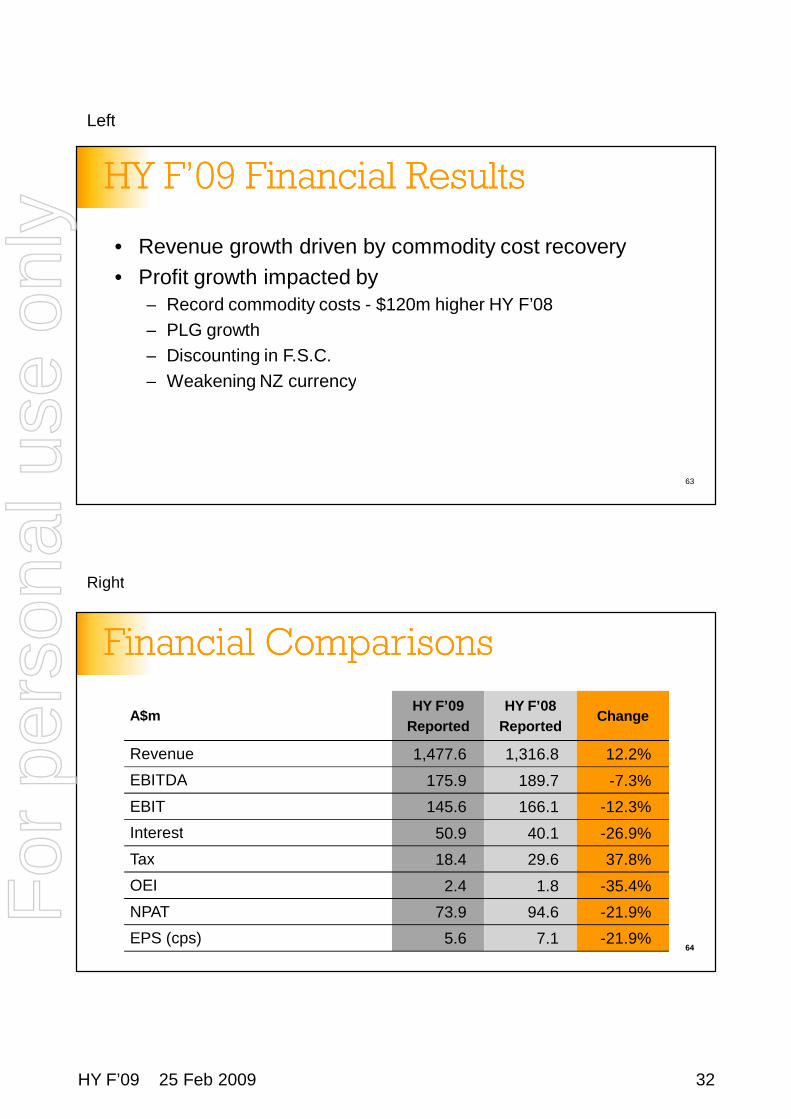
HY F’09 Financial ResultsHY F’09 Financial Results
• Revenue growth driven by commodity cost recovery
• Profit growth impacted by– Record commodity costs - $120m higher HY F’08
– PLG growth
– Discounting in F.S.C.
– Weakening NZ currency
63
64
Financial ComparisonsFinancial Comparisons
64
A$mHY F’09
Reported
HY F’08
ReportedChange
Revenue 1,477.6 1,316.8 12.2%
EBITDA 175.9 189.7 -7.3%
EBIT 145.6 166.1 -12.3%
Interest 50.9 40.1 -26.9%
Tax 18.4 29.6 37.8%
OEI 2.4 1.8 -35.4%
NPAT 73.9 94.6 -21.9%
EPS (cps) 5.6 7.1 -21.9%
For
per
sona
l use
onl
y

Left
HY F’09 25 Feb 2009 33
Right
Key Movements HY F’09 v HY F’08Key Movements HY F’09 v HY F’08
• COGS increases substantially recovered
• Maintaining brand investment
• Higher fuel costs only partially off-set by logistics re-orgs
• Fixed costs reduction reflecting lower employee numbers
65
Key Movements HY F’09 v HY F’08Key Movements HY F’09 v HY F’08
66
-15
1 3
161
-165
-1
-200
-150
-100
-50
0
50
100
150
200
Revenue COGS Selling &
Marketing
Warehousing
& Distribution
General &
Admin
Other
$m
For
per
sona
l use
onl
y

Left
HY F’09 25 Feb 2009 34
Right
Balance SheetBalance Sheet
• Absolute focus on cash generation and debt minimisation
• Pleasing working capital result as inventory values peak
• Capital Expenditure staged to align with internal cashtargets
67
68
Balance SheetBalance Sheet
68
A$m Dec 08 June 08
Trade & Other Debtors 280.3 290.4
Inventory 236.2 201.0
Net PPE 545.9 527.8
Goodwill & Intangibles 1,956.5 1,885.1
Other 7.6 28.4
Trade & Other Creditors (406.0) (358.9)
Capital Employed 2,620.5 2,573.8
Net Debt (1,103.1) (1,043.4)
Net Tax Assets 100.6 69.2
Net Assets 1,618.0 1,599.6
For
per
sona
l use
onl
y

Left
HY F’09 25 Feb 2009 35
Right
Cash FlowCash Flow
• Ongoing strong cash generation
• Efficient cash realisation*
HY F’09 115%
HY F’08 99%
FY F’08 105%
69
* Cash realisation ratio = [net cash inflow from operating activities] / [profit for the period]
Cash FlowCash Flow
70
145.6
87.7
45.6
31.3
20.9
30.3
9.6
0
20
40
60
80
100
120
140
160
180
200
Reported EBIT Dep'n andAmort'n
Changes inworking capital
Interest paid Tax paid Other Operating cashflow
A$m
For
per
sona
l use
onl
y

Left
HY F’09 25 Feb 2009 36
Right
F’09 Key RatiosF’09 Key Ratios
• F’09 EBITDA margin reflects high commoditycosts partially off-set by tight expense control
• Dividend payout ratio maintained at 80%
71
72
F’09 Key RatiosF’09 Key Ratios
72
HY F’09 HY F’08
EBITDA Margin 11.9% 14.4%
Earnings per Share (c) 5.6 7.1
Dividends per Share (c) 4.5 6.0
For
per
sona
l use
onl
y
Left
HY F’09 25 Feb 2009 37
Right
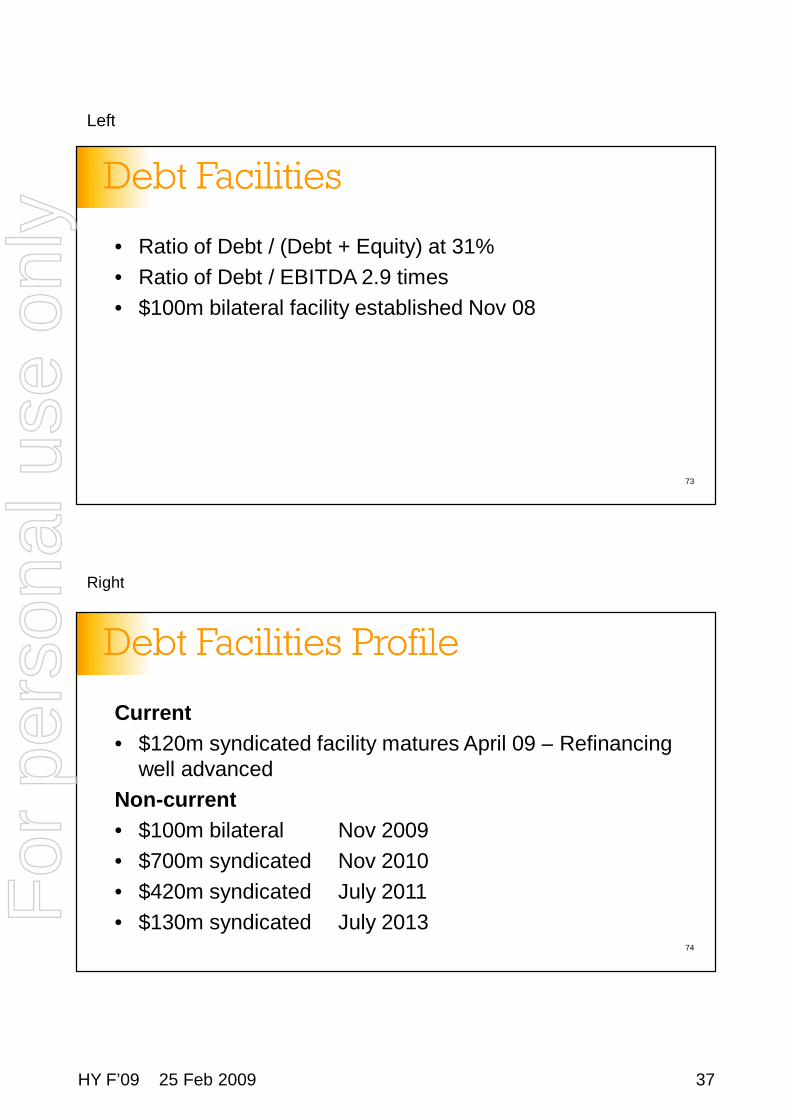
Debt FacilitiesDebt Facilities
• Ratio of Debt / (Debt + Equity) at 31%
• Ratio of Debt / EBITDA 2.9 times
• $100m bilateral facility established Nov 08
73
Debt Facilities ProfileDebt Facilities Profile
Current
• $120m syndicated facility matures April 09 – Refinancingwell advanced
Non-current
• $100m bilateral Nov 2009
• $700m syndicated Nov 2010
• $420m syndicated July 2011
• $130m syndicated July 201374
For
per
sona
l use
onl
y

Left
HY F’09 25 Feb 2009 38
Right
DividendDividend
• DRP implemented F’09– 2.5% discount
– 50% underwritten
• Franking impacted by lower tax
• Payout ratio 80% of reported NPAT
• HY franking 31% & estimated FY 31%
75
76
DividendDividend
76
DPS Franking %
F’09 Interim 4.5¢ 31%
F’08 Interim 6.0¢ 30%
Full Year F’08 13.5¢ 36%
For
per
sona
l use
onl
y
Left
HY F’09 25 Feb 2009 39
Right
OutlookOutlook
77
Building for the futurePresentation to Analysts - HY F’09
For
per
sona
l use
onl
y

Left
HY F’09 25 Feb 2009 40
Right
F’09 OutlookF’09 Outlook
• F’09 NPAT guidance of $170m - $185m
• Reflects;– Weakening NZ currency
– Timing on commodity cycle
– Softer economic conditions
• EBITDA projected above prior year
• Continued strong cash flows
79
FullYear NPAT GuidanceFullYear NPAT Guidance
80
F'08 * F'09
* Excludes impairment
NPAT A$m197
185
170
For
per
sona
l use
onl
y

Left
HY F’09 25 Feb 2009 41
Right
OutlookOutlook
• The company remains optimistic for F’10; viz:– Lower commodity costs (dairy/wheat/oils)
– Manufacturing cost improvements• Finalised plant closures
• New plants operational
• Operational disciplines
– Growth from innovation
– Strategic review recommendations
81
Building for the futurePresentation to Analysts - HY F’09
82
For
per
sona
l use
onl
y

Left
HY F’09 25 Feb 2009 42
Right
83
Building for the futurePresentation to Analysts - HY F’09
For
per
sona
l use
onl
y