ABN 35 094 006 023 Annual Report 2015 - ASX · 2015-09-22 · ABN 35 094 006 023 Annual Report 2015...
52
ABN 35 094 006 023 Annual Report 2015 For personal use only
Transcript of ABN 35 094 006 023 Annual Report 2015 - ASX · 2015-09-22 · ABN 35 094 006 023 Annual Report 2015...

ABN 35 094 006 023
Annual Report2015
For
per
sona
l use
onl
y

CORPORATE DIRECTORY
Principal Place of BusinessPharmAust Limited Suite 7, 29 The AvenueNedlands, Western Australia 6009Tel +61 (8) 9386 4787 Fax +61 (8) 9389 1464www.pharmaust.comasx code: Paa, Paao
Epichem Pty LtdSuite 5, 3 Brodie-Hall DriveBentley WA 6102
Registered OfficeSuite 7, 29 The AvenueNedlands, Western Australia 6009Tel +61 (8) 9386 4787 Fax +61 (8) 9389 1464
Sydney OfficeLevel 7/139 Macquarie StreetSydney, NSW 2000Tel +61 (2) 9251 1142
DirectorsDr Roger Aston Mr Robert Bishop Professor David Morris Mr Sam WrightDr Wayne Best (Appointed on 24th Oct 2014)
Company SecretaryMr Sam Wright
Share RegistryComputershare Investor Services Pty LimitedLevel 2, 45 St George’s TerracePerth, Western Australia 6000
AuditorsRSM Bird Cameron Partners8 St Georges TerracePerth, Western Australia 6000
SolicitorsFairweather Corporate Lawyers595 Stirling HighwayCottesloe, Western Australia 6011
Stock ExchangeAustralian Securities ExchangeExchange Plaza2 The EsplanadePerth, Western Australia 6000
For
per
sona
l use
onl
y

CONTENTSDirectors’ Report ..................................................................2
Corporate Governance .......................................................13
Auditor’s Independence Declaration ...................................14
Independent Auditor’s Report.............................................16
Directors’ Declaration ........................................................19
Statement of Comprehensive Income .................................20
Statement of Financial Position ..........................................21
Statement of Changes in Equity .........................................22
Statement of Cash Flows ....................................................23
Notes to the Financial Statements ......................................24
Shareholder Information ....................................................47
For
per
sona
l use
onl
y

DIRECTORS’REPORTYour Directors present their report on the Company and the entities it controlled for the financial year ended 30 June 2015.
DirectorsThe following persons held office as directors of PharmAust Limited during the financial year and up to the date of this report:
Dr Roger Aston Executive Chairman
Robert Bishop Executive Director
Professor David Morris Non-Executive Director
Sam Wright Non-Executive Director
Dr Wayne Best Non-Executive Director (Appointed on 24 October 2014)
Directors have been in office since the start of the financial period to the date of this report unless otherwise stated.
Principal ActivitiesThe principal continuing activities constituted by PharmAust Limited and the entities it controlled during the year were to develop its own drug discovery intellectual property, namely three platforms for the treatment of different types of cancers in humans and animals, as well as providing highly specialised medicinal and synthetic chemistry services on a contract basis to clients.
Operating ResultsThe results of the consolidated entity for the year ended 30 June 2015 was a loss, after income tax expense, of $1,925,091 (2014: loss of $1,317,853).
Financial PositionThe net assets of the consolidated entity were $8,839,066 as at 30 June 2015 (2014: $7,764,157).
Review of OperationsPITNEY PHARMACEUTICALS PTY LIMITED – 100% OWNED SUBSIDIARYPPL-1 CLINICAL TRIAL IN HUMANSDuring the year, the Company made significant progress with the development of its key anti-cancer product, PPL-1, and following the approval to begin a “First in Man” study by the Royal Adelaide Hospital Research Ethics Committee, the Company recruited, screened and commenced treatment of patients with its anti-cancer drug PPL-1.
The trial was led by Professor Michael Brown (the principal investigator), and managed by Contract Research Organisations for clinical services (IDT CMAX) and analytical services (CPR Pharma Services). The trial was structured as a rising dose study with the first three patients being treated at the lowest dose of drug. Subsequent patients received a higher
dose of PPL-1 to determine both safety and drug activity. Each patient received PPL-1 daily, for up to 28 days and was given the option to continue on the drug past this initial treatment period. Typically, the patients in the trial will have failed all “Standard of Care” for their cancers and not be taking other medications for treating their cancers.
The trial was conducted to GCP (Good Clinical Practice) enabling the results to be used in submissions to regulators (Therapeutic Goods Administration, Food and Drug Administration, European Medicines Agency) towards registration. The clinical trial managers and service providers, IDT-CMAX and CPR Pharma Services, are audited by the Food and Drug Administration.
PharmAust’s Executive Chairman, Dr Roger Aston said, “As a First in Man study, the drug will be potentially administered to patients suffering from diverse cancers. Recruitment will include selection of patients suffering from lung, pancreas, oesophageal, gastric, colorectal, ovarian, breast, prostate, liver, sarcoma, lymphoma, and melanoma. PharmAust has reached an exciting stage in its evolution and we look forward to reporting outcomes on the safety and activity of PPL-1.”
In March 2015, PAA reported that the third and final patient in the lowest dose cohort for the trial at the Royal Adelaide Hospital had been assessed for reduction in the blood marker, p70S6K, following treatment with PPL-1. The patient, suffering from lung cancer with metastases to the liver, brain and bone received PPL-1 for 28 days and demonstrated approximately a 50% reduction of p70S6K levels at both days 3 and 7 of treatment.
Aberrant expression of p70S6K is believed to contribute to aggressive features of cancer such as growth, invasion and metastasis. p70S6K levels in peripheral blood immune cells are expected to correlate with similar changes in the patient’s cancer. Studies in peer review journals have shown that factors that increase Mammalian Target of Rapamycin (mTOR)/ p70S6K signalling, lead to increased metastasis in human breast cancer cells. Similarly, activation of p70S6K has been shown to increase viability of colorectal cancer cells. Published evidence also suggests that some globally used anticancer drugs (Paclitaxel) may operate through inactivation of p70S6K.
Professor David Morris of the St George Hospital, Sydney said, “We have consistently observed that PPL-1 inhibits the p70S6K blood marker in patients with different cancers (6 out of 6 patients). The degree of inhibition has was as much as 65% as compared to the levels of p70S6K in patient’s blood before treatment with the drug (Day 1, pre-treatment). Although only three patients completed the 28-day treatment regimen, we have managed to determine the levels of p70S6K in a total of 6 patients who have received the drug for 3 days or more. Thus, despite the delays in completing the treatment of the first cohort due to patient withdrawals (unrelated to drug), we have managed to obtain p70S6K data from a larger group of patients giving higher statistical significance to the result (p<0.0005 at day 3).”
PharmAust Limited and its Controlled Entities
2
For
per
sona
l use
onl
y

Trial results to date show that there is a significant drop in a key cancer marker (p70S6K) in immune white blood cells, even at low doses of the drug. Inhibition of this marker is extensively correlated in peer review publications with a reduction in malignancy and the aggressive nature of cancer cells. The trials also confirm that PPL-1 has no adverse side effects, even at high doses.
Professor Michael Brown, Principal Investigator of the study at the Royal Adelaide Hospital said, “The use of surrogate tumour markers in the diagnosis of cancer and assessment of progression is now ubiquitous in clinical oncology. Although many cancers have a specific “marker association”, p70S6K appears to be a common indicator of malignancy. Typically, information on drug efficacy is hard to observe in phase I safety studies, particularly at the lowest doses being tested. The results so far indicate that PPL-1 is well tolerated at the lowest dose and it appears to be physiologically active in that it reduces a key indicator associated with malignancy.”
The next stage is for clinical trials with PPL-1 and chemotherapy. The Company has shown that PPL-1 can significantly enhance chemotherapy in model systems without associated enhancement of toxicity commonly seen with chemotherapy drugs. Today, if one includes palliative therapies, the chemotherapy market has topped US$100 billion1 (1Reuters). If successful, this will be a defining trial for PharmAust as their drug will need to be initially used on the backdrop of the chemotherapy “Standard of Care”.
The cancer chemotherapy market (estimated at US $42 billion/annum)* is currently the fastest growing sector within the pharma industry, mainly driven by the identification of new potential therapeutic targets. This growth is further fuelled by the magnitude of the disease worldwide, currently estimated at more than 25 million people suffering from cancer globally, and an estimated 5 million people dying each year from the disease.
*Reference: Research and Markets.com accessed 14th February 2014: http://www.researchandmarkets.com/reports/335548/chemotherapy _market_insights_20062016_a
PPL-1 CLINICAL TRIAL IN CANINESPharmAust in conjunction with Vet Oncology Consultants Pty Ltd at the Animal Referral Hospital (ARH) in Homebush, NSW, conducted a clinical trial to test the anticancer drug PPL-1 in a small number of pet dogs. The trial tested the safety and efficacy (Phase I/II) of PPL-1 for treating naturally occurring: superficial soft tissue sarcomas, chemo resistant lymphomas and metastatic melanomas. All pet dogs admitted to the trial were treated with the drug by their owners at their homes. To determine the safest and most effective dose, the trial design incorporated incremental increases in drug quantity to different groups of dogs. Groups of dogs were administered higher doses only after safety and efficacy of the lower dose has been established. All dog owners, researchers, administrators and sponsors knew what drug and how much drug is being administered to the dogs (it is an open ended trial).
In June 2015, PAA reported that PPL-1 significantly suppressed a key cancer marker in two dogs evaluated, and has been safe and well tolerated by all the dogs treated with the drug so far (11 dogs in total). The Company and Veterinary Oncology Consultants decided to move to the next stage of clinical evaluations which make use of the “synergy” discovery (announced to the market 17th February 2014), which showed that PPL-1 has the potential to significantly enhance the anti-cancer activity of conventional chemotherapeutics without simultaneously enhancing the associated side-effect profile. In these evaluations dogs will be treated with a combination of “standard of care” chemotherapy and PPL-1.
Following the trial, PharmAust will evaluate the commercial opportunities with the global animal health company, with which it has a collaborative research and option agreement.
Cancer is common in pet animals and the incidence increases with age. Cancer accounts for almost half of the deaths of pets over 10 years of age. Dogs get cancer at roughly the same rate as humans, while cats get fewer cancers. Each type of cancer requires individual care and may include a combination of treatment therapies such as surgery, chemotherapy, radiation, or immunotherapy. There are over 130 million dogs and cats in the USA with increasing use of conventional anticancer therapies being progressively adopted.
The US companion pet market sales (est. 2011) are in the region of US$14 billion whilst cancer therapies are estimated at $550 million with a price point of around $1500 per treatment.
RESEARCH COLLABORATION AND JOINT PATENT WITH JAPANESE COMPANYOn 18th November 2014, the Company reported that further to signing a Materials Transfer Agreement (MTA) with a yet to be named Japanese corporation part of a listed Japanese group in July 2013, it has now established a joint intellectual property (IP) position with this Japanese partner. The joint IP allows PharmAust access to some 80 analogues of PPL-1, which have been synthesised by the Japanese research partner and tested for anticancer activity by PharmAust. The Joint Patent Application, which will be published in March 2015, further permits PharmAust to commercialise the analogues subject to other prevailing IP at the time of commercialisation. This collaboration broadens and strengthens PharmAust’s IP position.
2015 Annual Report & Statutory Financial Statements
3
For
per
sona
l use
onl
y

SUBSEQUENT EVENTSOn 23rd July, the Company reported the successful closure of its Phase I (Phase IIa) “first in man” trial at the Royal Adelaide Hospital and confirmation that the last patient, who was treated at the higher dose of PPL-1 (25mg/kg), showed meaningful suppression of key cancer marker p70S6K. Importantly, during the trial, both principal end points were successfully met, namely:
1. PPL-1 demonstrated a very good safety profile as compared with many other established anticancer drugs, and
2. PPL-1 showed activity against cancer through the suppression of a key cancer marker.
In the trial, seven patients were treated with PPL-1 for various time periods and measurements were successfully taken for anticancer activity through marker suppression (p70S6K). Three patients completed the full 28-day treatment period. One patient was not included in the cancer marker results as they only received a single dose of the drug. One patient received the higher dose of PPL-1 (25mg/kg).
PharmAust’s contract research organisations (CPR and CMAX), which have managed the recruitment and implementation of the trial and have undertaken both pharmacokinetic and pharmacodynamic measurements (cancer markers), will now provide a report on the trial during September 2015, which will include further data on other cancer-specific markers (in addition to p70S6K) and levels of PPL-1 and its metabolites in patients’ circulation.
PharmAust’s Executive Chairman Dr Roger Aston said “We have now completed the “first stage” of studies with PPL-1 in humans and canines and we have shown that in both cases PPL-1 is well tolerated and importantly is active against cancer. The suppression of tumour marker, p70S6K, in man was highly significant when the data from 7 patients is combined and analysed (at day 3 of treatment p<0.0004 and at day 7 of treatment p<0.002). We have furthermore initiated the processes to move to the important next stage, which will include the treatment of patients with a combination of “Standard of Care” (chemotherapy drugs) in the presence of PPL-1. For the next stage of human work PharmAust will reformulate the drug into capsules, as the main challenge faced in both canine and human trials with liquid PPL-1 was the poor palatability of the formulation and nausea from the unpleasant taste”.
The key activities moving forward following completion of first human and canine trials, are planned to be:
Human:
• Completion of further supportive preclinical studies to enable combination therapy with “Standard of Care” in a Phase II study;
• Preparation and submission of the clinical trial report to PharmAust by service providers CMAX Ltd and CPR Ltd;
• Preparation of a new clinical trial application for the ethics committee of the Royal Adelaide Hospital and other centres that may wish to participate in the Phase II trial (currently under discussion);
• Initiate discussions for licensing of the human cancer applications of PPL-1; and
• Agreement of commercialisation strategy relating to joint patents with a major Japanese group.
Canine:
• Two canines have now received PPL-1 with “Standard of Care” chemotherapy with no observed adverse events;
• Canine recruitment will continue and the Company will continue reporting on the outcomes in canine patients; and
• The Company will determine the next stages with Option partner (top 5 pharmaceutical company) for the veterinary applications of PPL-1 and related molecules.
Dr Aston said “Aberrant expression of p70S6K is believed to contribute to aggressive features of cancer such as growth, invasion and metastasis. p70S6K levels in peripheral blood immune cells are expected to correlate with similar changes in the patient’s cancer. Studies in peer review journals have shown that factors that increase Mammalian Target of Rapamycin (mTOR)/ p70S6K signalling lead to increased metastasis in human breast cancer cells. Similarly, activation of p70S6K has been shown to increase viability of colorectal cancer cells. Published evidence also suggests that some globally used anticancer drugs (Paclitaxel) may operate through inactivation of p70S6K.”
On 24th August 2015, Professor David Morris advised the Board that he intends to retire a as a director of the Company, effective from the close of the Annual General Meeting. Professor Morris plans to concentrate on his work at St George Hospital and research work with his foundation. PharmAust Limited Executive Chairman, Dr Roger Aston, commented: “David has been a director of PharmAust since 12 August 2013 and has been a valuable contributor to the Company and the research and development of its three oncology technology platforms. The Board wishes him well in his future endeavours. With the recent capital raising and successful closure of its Phase I (Phase IIa) “first in man” trial at the Royal Adelaide Hospital, the path forward for PharmAust is very promising. The directors thank Professor Morris for his contribution to the Company.”
Other than what is mentioned above, no matters or circumstances have arisen since the end of the financial year which significantly affected or may significantly affect the operations of the Company, the results of those operations, or the state of affairs of the Company in future financial years.
PharmAust Limited and its Controlled Entities
4
For
per
sona
l use
onl
y

ALBENDAZOLEAlbendazole is an approved anti-parasitic drug that is being investigated for its used in treating ascites-related malignancy. The market is estimated at approximately $500 million per annum as defined by the only product on the market (Removab).
PharmAust is focused on developing an intraperitoneal formulation of albendazole to enable localization of the drug in the abdomen with minimal systemic toxicity and effective reduction of ascites accumulation in the abdomen. In order to successfully commercialise the product the company will need to:
1. Phase II study undertaken with a new formulation of albendazole designed to retain the drug in the abdomen. This activity may be undertaken with a partner specializing in drug formulation and development. The study will be in a rising dose format in order to identify the optimal therapeutic dose of the new albendazole formulation
2. Phase III registration trial as a prelude to launching with a partner (this trial may be unnecessary depending on the degree of clarity and efficacy seen in the Phase II and on whether regulators allow PharmAust to expand the Phase II trial into a registration trial.
MUCINMucin, a gelatinous secretion of tumours, is associated with poor prognosis and poor responses to chemotherapy. Removal of tumour-associated mucin has been shown by PharmAust to result in effective killing of cancer cells and increased sensitivity to chemotherapy.
To achieve dissolution of tumour associated mucin, PharmAust has developed a combination of two agents already available commercially for other clinical uses outside oncology. As such, PharmAust is accessing toxicology, safety and manufacturing know-how already developed by third parties.
Currently, mucin is removed manually using surgery and the process can take many hours as the mucin it is often disseminated in the abdomen. Furthermore, many clinicians are not prepared to undertake such laborious surgical processes. Thus, although targeting a “niche” market there is little or no competition.
PharmAust is currently optimizing the doses of the combination therapy and will be in a position to initiate clinical studies in early 2016 (Q1/Q2). The clinical programme to registration and launch is expected to take approximately 2.5 years.
The market for such a combination therapy is estimated at around $300 million per annum.
EPICHEM PTY LTD (“Epichem”) – 100% OWNED SUBSIDIARYEpichem has been delivering synthetic and medicinal chemistry services to the drug discovery and pharmaceutical industries worldwide for over 10 years. Epichem offers a range of rare and hard to find pharmaceutical impurities, degradants and metabolites of active ingredients and excipients, particularly for OTC and generic drugs.
Epichem has been at the forefront of synthesizing new and difficult to obtain standards and many of these are exclusive to Epichem and not available elsewhere. This range is continually expanding in response to customer requests and developments in the industry. Epichem is globally competitive with clients in 33 countries and is well placed to take advantage of the lower Australian dollar.
Epichem also excels in custom synthesis and contract drug discovery, boasting a highly skilled team of scientists, most with a PhD and industry experience. This valuable investment in people allows Epichem to lead drug discovery programs, perform custom synthesis, conduct optimisation and method development for scale-up and engage in high-level problem solving.
Epichem continued to promote its products and services both within Australia and overseas with staff attending a number of conferences and tradeshows including, AusBiotech (Gold Coast, 29-31 Oct), ASTMH (New Orleans, 3-7 Nov) and RACI National Congress (Adelaide 7-11 Dec). Most notably, Epichem was an exhibitor at CPhI WorldWide (Paris, 6-9 Oct), the world’s premier trade show for the pharmaceutical industry attended by 36,000 delegates. Feedback from CPhI was excellent with a number of new customers and prospects resulting.
Epichem was awarded a 12 month extension to its current contract with Drugs for Neglected Diseases initiative (DNDi) in December 2014. The contract, which is worth $1.16 million to the Company, sees Epichem continue to provide synthetic & medicinal chemistry support to DNDi’s drug discovery projects until 31 December 2015.
DNDi is a not-for-profit product development partnership working to research and develop new treatments for neglected diseases, in particular human African trypanosomiasis, leishmaniasis, Chagas disease, malaria, paediatric HIV, and specific helminth-related infections.
Epichem also has a long history of helping pharmaceutical companies identify trace impurities and has produced a range of pharmaceutical reference standards to aid the industry in detecting and measuring these impurities, ultimately assisting in the quality assurance and control of its clients’ medicines. Revenues from the sales of Reference Standards were a record $200k in Q4, which included Epichem’s first sale to Belarus.
Epichem also began a significant expansion in June. After 12 years at Murdoch University, Epichem is moving to much larger facilities at WA’s Technology Park. The new laboratory, which is being purpose built for Epichem’s needs, is expected to be complete by September. The extra capacity of the new facilities will allow Epichem to rapidly grow its business to our 5-year target of $10 million per annum.
2015 Annual Report & Statutory Financial Statements
5
For
per
sona
l use
onl
y

SUBSEQUENT EVENTSOn 7 July 2015 the Group entered into a construction contract with a value of $1,591,634 to construct a laboratory.
On 14th July 2015, Epichem received $411k from DNDi (currently Epichem’s largest client) as an advanced payment for work yet to be completed on its flagship project on Chagas disease. This payment is not included in these financial statements.
Other than what is mentioned above, no matters or circumstances have arisen since the end of the financial year which significantly affected or may significantly affect the operations of the Company, the results of those operations, or the state of affairs of the Company in future financial years.
CORPORATEOn 16th March 2015, The Company advised that it successfully raised $3.14 million through the issue of 400 million new ordinary shares at $0.00785 per share to sophisticated and professional investors through lead manager, Blue Ocean Equities.
PharmAust’s Executive Chairman Dr Roger Aston said “We are delighted by the overwhelming interest received for the Placement and appreciate the support from both new and existing shareholders. The placement was targeted to investors and institutions that recognise the potential of PharmAust’s oncology programmes and, as such, has helped us to build a stronger register. Furthermore, the strong signal of support from new shareholders reflects the ongoing endorsement of PharmAust’s assets and business strategy. We look forward to delivering value by expediting our clinical development programmes and by enhancing revenues from Epichem to our 5-year target of $10 million per annum.”
PharmAust has sufficient funds to complete its forward program. Consideration will now be given to joining with a major international pharmaceutical company to shorten the time to market and begin trials in the USA and Europe.
Board ChangesPharmAust shareholders approved the appointment of Dr Wayne Best as a director at the Annual General Meeting. Wayne is the Managing Director of PharmAust’s wholly owned subsidiary, Epichem Pty Ltd.
Annual General MeetingPharmAust held its Annual General Meeting of Shareholders on 24th October 2014 at 30 The Avenue, Nedlands and all resolutions that were put were unanimously passed on a show of hands.
PharmAust Receives ATO Research & Development RebateOn 24th June 2015, the Company advised that the Australian Taxation Office (“ATO”) has recognised the innovation of the Research and Development being developed by wholly owned subsidiaries, Epichem and Pitney.
The Company had previously lodged an application with Innovation Australia following advice from PharmAust’s consultants that the R&D may qualify for a Research and Development Tax Rebate on its 2014 tax return.
Following approval from the ATO of the Company’s application for a Research and Development rebate, an amount of $329,351.25 was deemed refundable on PharmAust’s 2014 Tax Return and a cheque for that amount plus interest has subsequently been received by PharmAust and banked.
DividendsSince the end of the financial year, no dividend has been paid, declared or recommended.
Significant Changes in State of AffairsA review of events during the reporting period can be found in the review of operations.
Future DevelopmentsIn the opinion of the Directors disclosure of information regarding likely developments in the Company’s operations and the expected results of those operations in subsequent financial years could prejudice the Company’s interests. Accordingly, this information has not been included in this report.
PharmAust Limited and its Controlled Entities
6
For
per
sona
l use
onl
y

Information on DirectorsDr Roger Aston – Executive Chairman
Qualifications BSc (Hons), Ph.D
Experience Dr Aston currently serves as Chief Executive Officer of Pitney. Dr Aston served as Chief Executive Officer of Mayne Pharma Group until 15 February 2012. During his career, he has been closely involved in start-up companies and major pharmaceutical companies. Aspects of his experience include FDA and EU product registration, clinical trials, global licensing agreements, fundraising through private placements, and a network of contacts within the pharmaceutical, banking and stock broking sectors. Dr Aston is both a scientist and seasoned biotechnology entrepreneur, with a successful track record in both fields.
Dr Aston holds a B.Sc. (Hons) and Ph.D. degrees from the University of Manchester from 1975 to 1981.
Interests in Shares and Options Dr Aston holds 105,282,951 Fully Paid Ordinary Shares and 528,634 Listed Options.
Other Current Directorships (ASX Listed Companies)
Previous Directorships (last 3 years) ASX Listed Companies
Immuron Limited (ASX:IMC), Oncosil Limited (ASX: OSL), Regeneus Limited (ASX:RGS) and ResApp Health Limited (ASX:RAP)
IDT Limited (ASX:IDT); and Polynovo Limited (ASX:PNV) (previously Calzada Limited (ASX:CZD))
Professor David Morris – Non-Executive Director
Qualifications MB, ChB, FRCS, MD, Ph.D, FRACS
Experience Professor Morris is the Head of the UNSW Department of Surgery, St George Hospital, Sydney. Professor Morris has been Department Head for over 20 years with almost 700 peer review publications. Professor Morris has maintained a basic cancer research laboratory for over 20 years and has a demonstrable successful track record in commercialising outcomes of research. Currently, Professor Morris is an active surgical oncologist concentrating on metastatic diseases of liver, lung and peritoneum.
Interests in Shares and Options Professor Morris holds 177,214,206 Fully Paid Ordinary Shares and 528,634 Listed Options.
Other Current Directorships (ASX Listed Companies)
Previous Directorships (last 3 years) ASX Listed Companies
Nil
Nil
Mr. Robert C Bishop –Executive Director
Qualifications Ll.B (Hons), Solicitor (New South Wales and England & Wales), MAICD
Experience Mr Bishop has 30 years’ experience in corporate finance and equity capital markets. Having worked extensively in London and Sydney, first as a lawyer at Linklaters & Paines and Allen, Allen & Hemsley; and then as a stockbroker and investment banker at Ord Minnett, Robert Fleming and, since 1998, at his Sydney based corporate finance business, First Capital Markets. He has extensive experience in the areas of stock market flotation’s, licensing and compliance work.
Interests in Shares and Options Mr Bishop, via his company, holds 54,071,824 Fully Paid Ordinary Shares and 1,365,707 Listed Options.
Other Current Directorships (ASX Listed Companies)
Previous Directorships (last 3 years) ASX Listed Companies
Nil
Nil
2015 Annual Report & Statutory Financial Statements
7
For
per
sona
l use
onl
y

Mr. Sam Wright – Non-Executive Director & Company Secretary
Qualifications AFin DipAcc ACIS MAICD
Experience Sam Wright is experienced in the administration of ASX listed companies, corporate governance and corporate finance. He joined the Company as the Financial Controller in September 2006, was appointed as the Company Secretary in August 2007, and was appointed as a Director in October 2008.
Mr Wright has over fifteen years’ experience in the pharmaceutical, biotech and healthcare industry and is a member of the Australian Institute of Company Directors, the Financial Services Institute of Australasia, and the Chartered Secretaries of Australia.
Mr Wright is currently Company Secretary of ASX listed companies, Buxton Resources Limited and Structural Monitoring Systems plc. Mr Wright also has filled the role of Director and Company Secretary with a number of unlisted companies.
He is the Managing Director of Perth-based corporate advisory firm Straight Lines Consultancy, specialising in the provision of corporate services to public companies.
Interests in Shares and Options
Other Current Directorships (ASX Listed Companies)
Previous Directorships (last 3 years) ASX Listed Companies
Mr Wright, via his company, holds 6,500,000 ordinary shares and 375,000 listed options in PharmAust Limited.
Nil
Buxton Resources Limited (ASX: BUX) and Structural Monitoring Systems plc (ASX: SMN)
Dr. Wayne Best – Non-Executive Director
Qualifications BSc (Hons), PhD, DIC, FRACI, GAICD
Experience Wayne has almost 30 years’ experience in synthetic and medicinal chemistry both in academia, government and industry. Wayne obtained his BSc (Hons) and PhD in Organic Chemistry from The University of Western Australia. He then spent two years at Imperial College in the UK where he obtained a DIC, followed by a year at the Australian National University in Canberra.
Wayne then took up a position with ICI Australia’s Research Group in Melbourne where he spent over four years designing and synthesizing a range of biologically active compounds, particularly agrochemicals. During this time Wayne was seconded for six months to ICI Agrochemicals’ Jealott’s Hill Research Station in the UK to work on the rational design of a novel herbicide target.
Following ICI, Wayne returned to Western Australia and spent the ten years preceding Epichem at the Chemistry Centre (WA) where he was responsible for the formation and running of the Me-dicinal & Biological Chemistry Section which undertook collaborative R&D into drug discovery and contract synthesis for the drug discovery and pharmaceutical industries.
Wayne is a Fellow of the Royal Australian Chemical Institute and has held appointments as an Adjunct Associate Professor at both Murdoch University and The University of Western Australia. He is also a Director of Epichem’s parent company, PharmAust Ltd, and a Graduate Member of the Australian Institute of Company Directors.
Interests in Shares and Options
Other Current Directorships (ASX Listed Companies)
Previous Directorships (last 3 years) ASX Listed Companies
Dr Best holds 2,874,290 ordinary shares and Nil listed options in PharmAust Limited.
Nil
Nil
PharmAust Limited and its Controlled Entities
8
For
per
sona
l use
onl
y
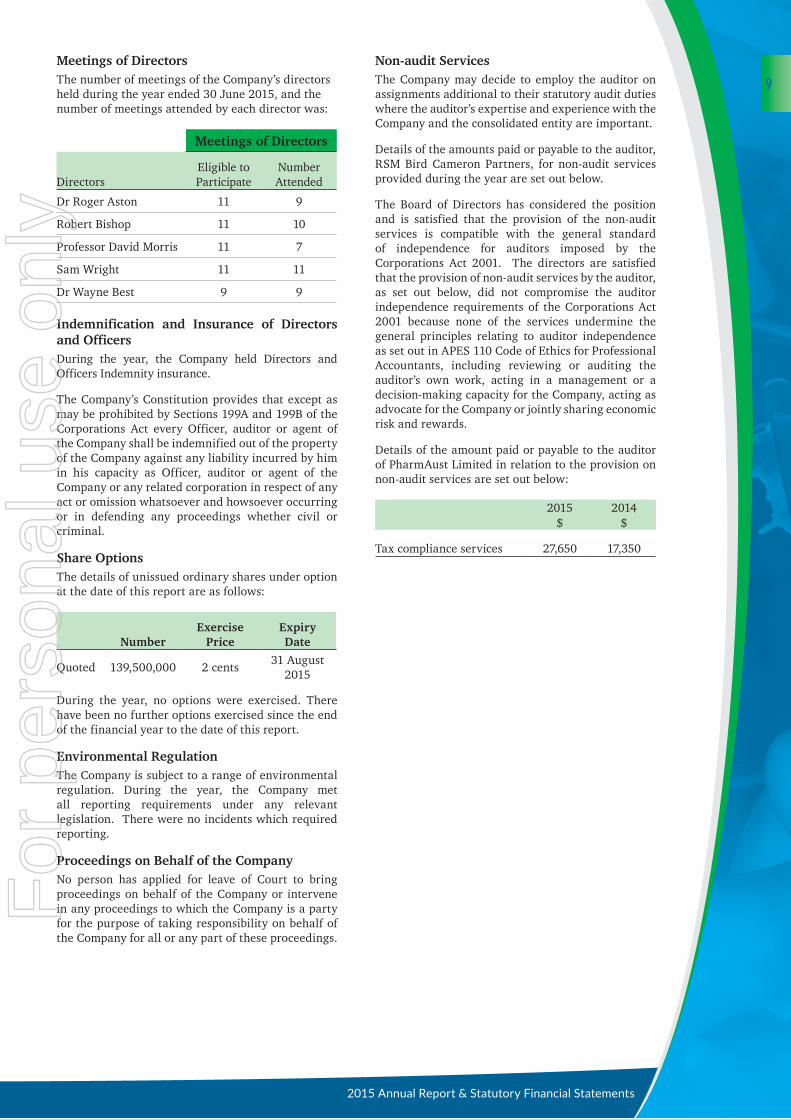
Meetings of DirectorsThe number of meetings of the Company’s directors held during the year ended 30 June 2015, and the number of meetings attended by each director was:
Meetings of Directors
DirectorsEligible to Participate
Number Attended
Dr Roger Aston 11 9
Robert Bishop 11 10
Professor David Morris 11 7
Sam Wright 11 11
Dr Wayne Best 9 9
Indemnification and Insurance of Directors and OfficersDuring the year, the Company held Directors and Officers Indemnity insurance.
The Company’s Constitution provides that except as may be prohibited by Sections 199A and 199B of the Corporations Act every Officer, auditor or agent of the Company shall be indemnified out of the property of the Company against any liability incurred by him in his capacity as Officer, auditor or agent of the Company or any related corporation in respect of any act or omission whatsoever and howsoever occurring or in defending any proceedings whether civil or criminal.
Share OptionsThe details of unissued ordinary shares under option at the date of this report are as follows:
NumberExercise
PriceExpiry Date
Quoted 139,500,000 2 cents31 August
2015
During the year, no options were exercised. There have been no further options exercised since the end of the financial year to the date of this report.
Environmental RegulationThe Company is subject to a range of environmental regulation. During the year, the Company met all reporting requirements under any relevant legislation. There were no incidents which required reporting.
Proceedings on Behalf of the CompanyNo person has applied for leave of Court to bring proceedings on behalf of the Company or intervene in any proceedings to which the Company is a party for the purpose of taking responsibility on behalf of the Company for all or any part of these proceedings.
Non-audit ServicesThe Company may decide to employ the auditor on assignments additional to their statutory audit duties where the auditor’s expertise and experience with the Company and the consolidated entity are important.
Details of the amounts paid or payable to the auditor, RSM Bird Cameron Partners, for non-audit services provided during the year are set out below.
The Board of Directors has considered the position and is satisfied that the provision of the non-audit services is compatible with the general standard of independence for auditors imposed by the Corporations Act 2001. The directors are satisfied that the provision of non-audit services by the auditor, as set out below, did not compromise the auditor independence requirements of the Corporations Act 2001 because none of the services undermine the general principles relating to auditor independence as set out in APES 110 Code of Ethics for Professional Accountants, including reviewing or auditing the auditor’s own work, acting in a management or a decision-making capacity for the Company, acting as advocate for the Company or jointly sharing economic risk and rewards.
Details of the amount paid or payable to the auditor of PharmAust Limited in relation to the provision on non-audit services are set out below:
2015 2014$ $
Tax compliance services 27,650 17,350
2015 Annual Report & Statutory Financial Statements
9
For
per
sona
l use
onl
y

Remuneration Report (Audited)The remuneration report, which has been audited, outlines the key management personnel (KMP) remuneration arrangements for the consolidated entity, in accordance with the requirements of the Corporations Act 2001 and its Regulations.
This report details the nature and amount of remuneration for each director and executive of PharmAust Limited.
Remuneration PolicyThe remuneration of directors and executives of PharmAust Limited has been designed to align director and executive objectives with shareholder and business objectives by providing a fixed remuneration component and offering specific long-term incentives based on key performance areas affecting the Company’s financial results. The Board of PharmAust Limited believes the remuneration policy to be appropriate and effective in its ability to attract and retain the best executives and directors to run and manage the Company, as well as create goal congruence between directors, executives and shareholders.
All executives receive a base salary (which is based on factors such as length of service and experience) and superannuation whilst some executives receive fringe benefits. The Board reviews executive packages periodically by reference to the Company’s performance, executive performance and comparable information from industry sectors and other listed companies in similar industries.
The performance of executives is measured against criteria agreed regularly with each executive and is based on factors including the forecast growth of profits and shareholders’ value.
The remuneration is designed to attract the highest calibre of executives and reward them for performance that results in long-term growth in shareholder wealth. The goal of the remuneration structures it to align the remuneration packages of the executives with the Company’s performance and specifically the Company’s earnings and the consequences of the Company’s performance on shareholder wealth including dividends, returns of capital and capital appreciation.
The executive directors and executives receive a superannuation guarantee contribution required by the government and do not receive any other retirement benefits. Individuals, however, have the option to sacrifice part of their salary to increase payments towards superannuation.
All remuneration paid to directors and executives is valued at the cost to the Company and expensed. Any shares given to directors and executives will be valued as the difference between the market price of those shares and the amount paid by the director or executive. Any options granted will be valued by an independent expert using the Black-Scholes, Binomial or any other methodologies that the independent expert deems appropriate.
The Board policy is to remunerate non-executive directors at market rates for comparable companies for time, commitment and responsibilities. The Board (excluding the relevant director) determines payments to the directors and reviews their remuneration regularly, based on market practice, duties and accountability. Independent external advice is sought when required. The maximum aggregate amount of fees that can be paid to non-executive directors is subject to approval by shareholders at the Annual General Meeting. Fees for non-executive directors are not linked to the performance of the Company.
Service agreements:Remuneration of Dr Roger Aston (Executive Chairman - PharmAust Limited)Term of the agreement – permanent and no specific term.
Base salary of $260,000 per year plus superannuation of 9.5% (2014:9.25%) of base salary.
Payment of termination benefit on termination by the employer, other than for gross misconduct, is equal to six (6) months base salary and superannuation.
Remuneration of Robert Bishop (Executive Director - PharmAust Limited)Term of the agreement – permanent and no specific term.
Base salary of $104,000 per year plus superannuation of 9.5%(2014:9.25%) of base salary.
Payment of termination benefit on termination by the employer, other than for gross misconduct, is equal to three (3) months base salary and superannuation.
Remuneration of Professor David Morris (Non-Executive Director – PharmAust Limited)Directors fee of $60,000 per annum plus superannuation of 9.5% (2014:9.25%).
Remuneration of Sam Wright (Non-Executive director and company secretary – PharmAust Limited)Term of the agreement – permanent and no specific term.
Consultancy fee of $7,500 plus GST per month, payable in arrears.
Payment of termination benefit on termination by the employer, other than for gross misconduct, is equal to six (6) months consultancy fee.
Remuneration of Colette Sims (Directors – Epichem Pty Ltd)Base salary of $96,900 per year plus superannuation of 9.5% (2014:9.25%) of base salary
Payment of termination benefit on termination by the employer, other than for gross misconduct, is equal to four (4) weeks base salary and superannuation.
Remuneration of Wayne Best (Non-Executive director – PharmAust Limited, Managing Director – Epichem Pty Ltd)Base salary of $150,000 per year plus superannuation of 9.5% (2014:9.25%) of base salary
Payment of termination benefit on termination by the employer, other than for gross misconduct, is equal to six (6) months base salary and superannuation.
Bonus of up to a maximum of $30,000 in the event of the satisfaction of Bonus milestones for any one financial year that Epichem Pty Ltd makes an after tax profit of:
$100,000 – bonus of $5,000; or$200,000- bonus of $10,000; or$350,000- bonus of $20,000; or$500,000- bonus of $30,000.
Remuneration of John Horton (Director – Epichem Pty Ltd)Consultancy fee of $10,000 per annum.
PharmAust Limited and its Controlled Entities
10
For
per
sona
l use
onl
y

Names and positions of key management personnel(KMP) in office at any time during the financial year are:
Person Position
Dr Roger Aston Executive Chairman
Robert Bishop Executive Director
Professor David Morris Non-Executive Director
Sam Wright Non- Executive Director and Company Secretary
Dr Wayne BestNon-Executive Director (appointed on 24th October 2014) and Managing Director – Epichem Pty Ltd
Dr John Horton Director – Epichem Pty Ltd
Dr Colette Sims Director – Epichem Pty Ltd
Details of the nature and amount of each element of remuneration of each key management personnel for the financial year are as follows:
2015 Short-term Post-employmentShare based
payment
Salary& Fees
$Other
$Superannuation
$Options
$
Termination benefits
$Total
$
Directors
Dr Roger Aston 260,000 - 24,700 - - 284,700
Dr Wayne Best * 188,000 - 17,385 - - 205,385
Robert Bishop 104,000 - 9,880 - - 113,880
Sam Wright 90,000 - - - - 90,000
Professor David Morris 60,000 - 5,700 - - 65,700
Executives
Dr Colette Sims 126,230 - 11,991 - - 138,221
Dr John Horton 10,000 - - - - 10,000
838,230 - 69,656 - - 907,886
* Appointed on 24th October 2014.
2014 Short-term Post-employmentShare based
payment
Salary& Fees
$Other
$Superannuation
$Options
$
Termination benefits
$Total
$
Directors
Dr Roger Aston 231,667 - 21,429 - - 253,096
Sam Wright 90,000 - - - - 90,000
Robert Bishop 69,333 - 6,413 - - 75,746
Professor David Morris 50,000 - 4,624 - - 54,624
Henry Gulev** 7,500 - - - - 7,500
Bryant Mclarty* - - - - - -
Executives
Dr Wayne Best 137,000 - 12,673 - - 149,673
Dr John Horton 10,000 - - - - 10,000
Dr Colette Sims 5,000 - - - - 5,000
600,500 - 45,139 - - 645,639
*Resigned on 12 August 2013. **Resigned on 29 October 2013.
2015 Annual Report & Statutory Financial Statements
11
For
per
sona
l use
onl
y

Additional disclosures relating to key management personnelOption holdingThe number options over ordinary shares in the company held during the financial year by each director and other members of key management personnel of the consolidated entity, including their personally related parties, is set out below:
2015 - NumberBalance
1 July 2014
Granted as Compen-
sationOptions
ExercisedNet Change
Other*Balance
30 June 2015 Total Vested Total
ExercisableTotal
Unexercisable
No. No. No. No. No. No. No. No.
Sam Wright 375,000 - - - 375,000 375,000 375,000 -
Roger Aston 528,634 - - - 528,634 528,634 528,634 -
Robert Bishop 1,365,707 - - - 1,365,707 1,365,707 1,365,707 -
David Morris 528,634 - - - 528,634 528,634 528,634 -
Wayne Best - - - - - - - -
John Horton - - - - - - - -
Collette Sims - - - - - - - -
*The net change other column above includes those options that have been disposed or acquired by holders during the year.
No other key management personnel held options in the Company.
ShareholdingThe number of shares in the company held during the financial year by each director and other members of key management personnel of the consolidated entity, including their personally related parties, is set out below:
2015 - NumberBalance
1 July 2014Received as
Compensation
At date of appointment and/or
resignationNet Change
Other**Balance
30 June 2015
No. No. No. No. No.
Sam Wright 5,000,000 - - 500,000 5,500,000
John Horton 25,000 - - - 25,000
Roger Aston 104,782,951 - - 500,000 105,282,951
Robert Bishop 53,571,824 - - 500,000 54,071,824
David Morris 176,678,197 - - 536,009 177,214,206
Wayne Best 2,374,290 - - 500,000 2,874,290
John Horton - - - - -
Collette Sims - - - - -
Share-based compensationIssue of sharesThere were no shares issued to directors and other KMP as part of compensation during the year ended 30 June 2015.
OptionThere were no options over ordinary shares granted to or vested by directors and other KMP as part of compensation during the year ended 30 June 2015.
Options granted as part of remunerationThere were no options issued as part of remuneration for the year ended 30 June 2015 and 30 June 2014.
No options expired during the year.
Other transactions with key management personnel and their related partiesThere were no other transactions with key management personnel and their related parties during the year.
PharmAust Limited and its Controlled Entities
12
For
per
sona
l use
onl
y

Annual Report Disclosure On Corporate GovernancePharmAust Limited is a drug discovery and development company. The Company has established, and continues to refine and improve procedures to ensure a culture of good corporate governance exists and is respected across the consolidated entity.
The Company has a written policy designed to ensure compliance with ASX Listing Rules and all other regulatory requirements for disclosures. Additionally the Company has adopted a policy designed to ensure procedures to implement the policy are suitable and effective.
The Board wishes to acknowledge that nothing has come to its attention that would lead it to conclude that its current practices and procedures are not appropriate for an organisation of the size and maturity of the Company. The Corporate Governance Policy and the Company’s corporate governance practices is set out on the Company’s web site at www.pharmaust.com
Shares Issued on Exercise of Compensation OptionsNo options were exercised last financial year, this financial year or since.
Auditor’s Independence DeclarationA copy of the auditor’s independence declaration as required under section 307C of the Corporations Act 2001 is included within these financial statements.
Signed in accordance with the Board of Directors.
Dr ROGER ASTONExecutive Chairman
Signed at Perth, Western Australia this 28th day of August 2015
2015 Annual Report & Statutory Financial Statements
13
For
per
sona
l use
onl
y

AUDITOR’S INDEPENDENCE DECLARATIONTO THE DIRECTORS OFPHARMAUST LIMITED
PharmAust Limited and its Controlled Entities
14
For
per
sona
l use
onl
y

2015 Annual Report & Statutory Financial Statements
15
For
per
sona
l use
onl
y

INDEPENDENT AUDIT REPORTTO THE MEMBERS OFPHARMAUST LIMITED
PharmAust Limited and its Controlled Entities
16
For
per
sona
l use
onl
y

2015 Annual Report & Statutory Financial Statements
17
For
per
sona
l use
onl
y

PharmAust Limited and its Controlled Entities
18
For
per
sona
l use
onl
y

DIRECTORS’ DECLARATIONIn accordance with a resolution of the Directors of PharmAust Limited, I state that:
1. In the opinion of the directors:
(a) the financial statements and notes of the consolidated entity are in accordance with the Corporations Act 2001, including:
(i) giving a true and fair view of the financial position of the consolidated entity as at 30 June 2015 and of its performance, for the year ended on that date; and
(ii) complying with Accounting Standards (including the Australian Accounting Interpretations) and the Corporations Regulations 2001;
(b) there are reasonable grounds to believe that the Company will be able to pay its debts as and when they become due and payable;
(c) the financial statements and notes also comply with International Financial Reporting Standards as disclosed in note 1;
2. This declaration has been made after receiving the declarations required to be made by the directors in accordance with sections of 295A of the Corporations Act 2001 for the financial year ending 30 June 2015.
On behalf of the Board
Dr ROGER ASTON
Executive Chairman
Signed at Perth, Western Australia this 28th day of August 2015
2015 Annual Report & Statutory Financial Statements
19
For
per
sona
l use
onl
y

STATEMENT OF COMPREHENSIVE INCOMEFor the year ended 30 June 2015
Consolidated
Note 2015 $
2014 $
Revenue 2 1,869,204 1,880,793
Other income 2 550,816 126,293
2,420,020 2,007,086
Raw materials and consumables used (207,780) (222,672)
Employee benefits expense (2,180,341) (1,724,836)
Depreciation expense (77,146) (53,365)
Finance costs (3,555) (2,666)
Research and development expenses (629,147) (211,642)
Administration expenses (1,247,142) (1,108,657)
Other expenses - (1,101)
(Loss) before income tax expense (1,925,091) (1,317,853)
Income tax expense 3a - -
(Loss) after income tax expense (1,925,091) (1,317,853)
Other comprehensive income - -
Total comprehensive (loss) for the year (1,925,091) (1,317,853)
Basic and diluted loss per share (cents per share) 16 (0.13) (0.1)
The accompanying notes form part of these financial statements.
PharmAust Limited and its Controlled Entities
20
For
per
sona
l use
onl
y

STATEMENT OF FINANCIAL POSITIONAs at 30 June 2015
Consolidated
Note 2015 $
2014 $
CURRENT ASSETS
Cash and cash equivalents 4 3,411,767 2,304,323
Trade and other receivables 5a 223,271 98,246
Other current assets 6 89,910 42,513
Financial assets 7 7,200 7,000
TOTAL CURRENT ASSETS 3,732,148 2,452,082
NON-CURRENT ASSETS
Intangible assets 8 5,179,128 5,179,128
Plant and equipment 9 611,009 578,423
TOTAL NON-CURRENT ASSETS 5,790,137 5,757,551
TOTAL ASSETS 9,522,285 8,209,633
CURRENT LIABILITIES
Trade and other payables 10 459,610 230,436
Borrowings 11 31,596 31,596
Provisions 12 172,630 143,949
TOTAL CURRENT LIABILITIES 663,836 405,981
NON-CURRENT LIABILITIES
Borrowings 11 7,899 39,495
Provisions 12 11,484 -
TOTAL NON-CURRENT LIABILITIES 19,383 39,495
TOTAL LIABILITIES 683,219 445,476
NET ASSETS 8,839,066 7,764,157
EQUITY
Issued capital 13 44,393,484 41,393,484
Reserves 14 941,629 941,629
Accumulated losses 27 (36,496,047) (34,570,956)
TOTAL EQUITY 8,839,066 7,764,157
The accompanying notes form part of these financial statements.
2015 Annual Report & Statutory Financial Statements
21
For
per
sona
l use
onl
y

STATEMENT OF CHANGES IN EQUITYFor the year ended 30 June 2015
Issued Capital
Accumulated Losses
Options Reserve
Total Equity
$ $ $ $
As at 1 July 2013 32,941,890 (33,253,103) 622,090 310,877
Loss for the year - (1,317,853) - (1,317,853)
Total comprehensive (Ioss) for the year - (1,317,853) - (1,317,853)
Shares issued (net) 8,451,594 - - 8,451,594
Options issued - - 319,539 319,539
As at 30 June 2014 41,393,484 (34,570,956) 941,629 7,764,157
As at 1 July 2014 41,393,484 (34,570,956) 941,629 7,764,157
Loss for the year - (1,925,091) - (1,925,091)
Total comprehensive (Ioss) for the year - (1,925,091) - (1,925,091)
Shares issued (net) 3,000,000 - - 3,000,000
As at 30 June 2015 44,393,484 (36,496,047) 941,629 8,839,066
The accompanying notes form part of these financial statements.
PharmAust Limited and its Controlled Entities
22
For
per
sona
l use
onl
y
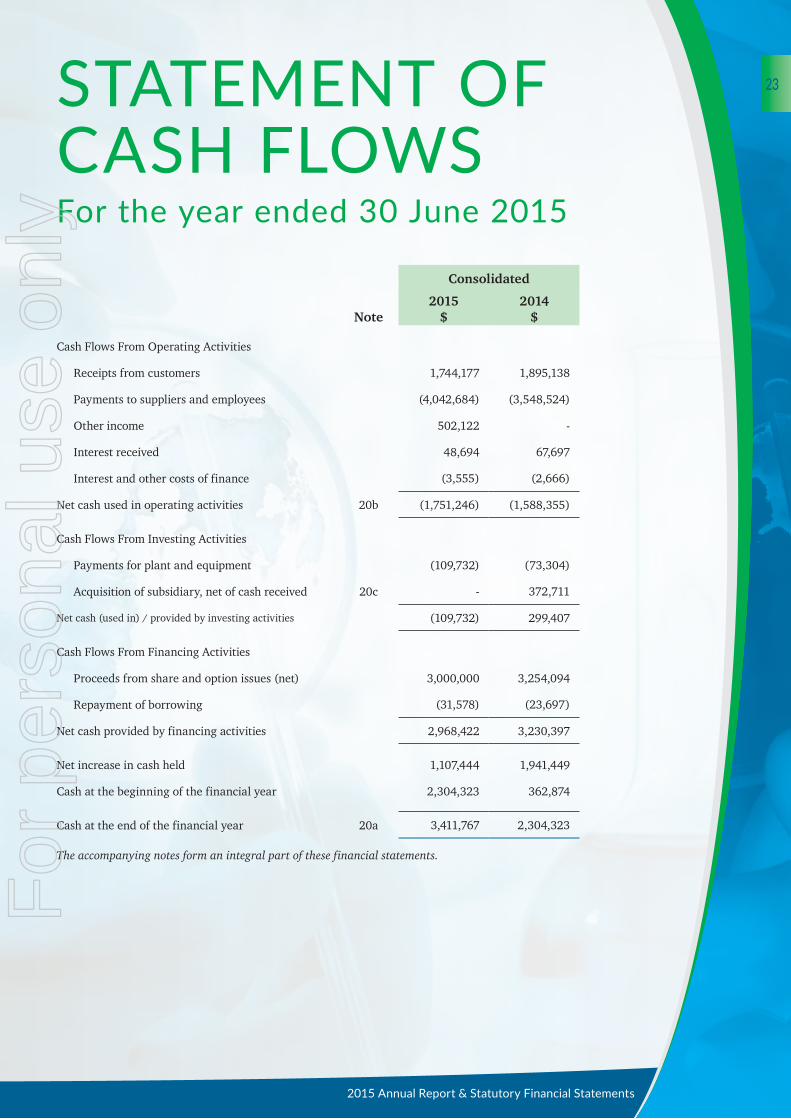
STATEMENT OF CASH FLOWSFor the year ended 30 June 2015
Consolidated
Note2015
$2014
$
Cash Flows From Operating Activities
Receipts from customers 1,744,177 1,895,138
Payments to suppliers and employees (4,042,684) (3,548,524)
Other income 502,122 -
Interest received 48,694 67,697
Interest and other costs of finance (3,555) (2,666)
Net cash used in operating activities 20b (1,751,246) (1,588,355)
Cash Flows From Investing Activities
Payments for plant and equipment (109,732) (73,304)
Acquisition of subsidiary, net of cash received 20c - 372,711
Net cash (used in) / provided by investing activities (109,732) 299,407
Cash Flows From Financing Activities
Proceeds from share and option issues (net) 3,000,000 3,254,094
Repayment of borrowing (31,578) (23,697)
Net cash provided by financing activities 2,968,422 3,230,397
Net increase in cash held 1,107,444 1,941,449
Cash at the beginning of the financial year 2,304,323 362,874
Cash at the end of the financial year 20a 3,411,767 2,304,323
The accompanying notes form an integral part of these financial statements.
2015 Annual Report & Statutory Financial Statements
23
For
per
sona
l use
onl
y

NOTES TO THE FINANCIAL STATEMENTSFor the year ended 30 June 2015These consolidated financial statements and notes represent those of PharmAust Limited and its Controlled Entities (the “consolidated entity” or “group”).
The separate financial statements of the parent entity, PharmAust Limited, have not been presented within this financial report as permitted by the Corporations Act 2001. Supplementary information about the parent entity is disclosed within this financial statements.
1 SIGNIFICANT ACCOUNTING POLICIESThe financial statements are general purpose financial statements that have been prepared in accordance with Australian Accounting Standards, Australian Accounting Interpretations, other authoritative pronouncements of the Australian Accounting Standards Board and the Corporations Act 2001. The Group is a for-profit entity for financial reporting purposes under Australian Accounting Standards.
Australian Accounting Standards set out accounting policies that the Australian Accounting Standards Board has concluded would result in financial statements containing relevant and reliable information about transactions, events and conditions. Compliance with Australian Accounting Standards ensures that the financial statements and notes also comply with International Financial Reporting Standards as issued by the IASB. Material accounting policies adopted in the preparation of these financial statements are presented below and have been consistently applied unless stated otherwise.
Except for cash flow information, the financial statements have been prepared on an accruals basis and are based on historical costs, modified, where applicable, by the measurement at fair value of selected non-current assets, financial assets and financial liabilities.
The financial report was authorised for issue on 28 August 2015 by the Directors of the Company.
(a) Principles of Consolidation
The consolidated financial statements incorporate all of the assets, liabilities and results of the PharmAust Limited and all of the subsidiaries (including any structured entities). Subsidiaries are entities the parent controls. The parent controls an entity when it is exposed to, or has rights to, variable returns from its involvement with the entity and has the ability to affect those returns through
its power over the entity.
The assets, liabilities and results of all subsidiaries are fully consolidated into the financial statements of the Group from the date on which control is obtained by the Group. The consolidation of a subsidiary is discontinued from the date that control ceases. Intercompany transactions, balances and unrealised gains or losses on transactions between group entities are fully eliminated on consolidation. Accounting policies of subsidiaries have been changed and adjustments made where necessary to ensure uniformity of the accounting policies adopted by the Group.
Equity interests in a subsidiary not attributable, directly or indirectly, to the Group are presented as “non-controlling interests”. The Group initially recognises non-controlling interests that are present ownership interests in subsidiaries and are entitled to a proportionate share of the subsidiary’s net assets on liquidation at either fair value or at the non-controlling interests’ proportionate share of the subsidiary’s net assets. Subsequent to initial recognition, non-controlling interests are attributed their share of profit or loss and each component of other comprehensive income. Non-controlling interests are shown separately within the equity section of the statement of financial position and statement of comprehensive income.
The consolidated financial statements incorporate the assets, liabilities and results of entities controlled by PharmAust Limited at the end of the reporting period. A controlled entity is any entity over which PharmAust Limited has the ability and right to govern the financial and operating policies so as to obtain benefits from the entity’s activities.
Where controlled entities have entered or left the Group during the year, the financial performance of those entities is included only for the period of the year that they were controlled.
Non-controlling interests, being the equity in a subsidiary not attributable, directly or indirectly, to a parent, are reported separately within the equity section of the consolidated statement of financial position and statements showing profit or loss and other comprehensive income. The non-controlling interests in the net assets comprise their interests at the date of the original business combination and their share of changes in equity since that date.
PharmAust Limited and its Controlled Entities
24
For
per
sona
l use
onl
y

Business combinations
Business combinations occur where an acquirer obtains control over one or more businesses.
A business combination is accounted for by applying the acquisition method, unless it is a combination involving entities or businesses under common control. The business combination will be accounted for from the date that control is attained, whereby the fair value of the identifiable assets acquired and liabilities (including contingent liabilities) assumed is recognised (subject to certain limited exemptions).
When measuring the consideration transferred in the business combination, any asset or liability resulting from a contingent consideration arrangement is also included. Subsequent to initial recognition, contingent consideration classified as equity is not remeasured and its subsequent settlement is accounted for within equity. Contingent consideration classified as an asset or liability is remeasured in each reporting period to fair value, recognising any change to fair value in profit or loss, unless the change in value can be identified as existing at acquisition date.
All transaction costs incurred in relation to business combinations are recognised as expenses in profit or loss when incurred.
The acquisition of a business may result in the recognition of goodwill or a gain from a bargain purchase.
(b) Income Tax
The income tax expense/(income) for the year comprises current income tax expense/(income) and deferred tax expense/(income).
Current income tax expense charged to profit or loss is the tax payable on taxable income. Current tax liabilities/(assets) are measured at the amounts expected to be paid to/(recovered from) the relevant taxation authority.
Deferred income tax expense reflects movements in deferred tax asset and deferred tax liability balances during the year as well as unused tax losses.
Current and deferred income tax expense/(income) is charged or credited outside profit or loss when the tax relates to items that are recognised outside profit or loss.
Except for business combinations, no deferred income tax is recognised from the initial recognition of an asset or liability, where there is no effect on accounting or taxable profit or loss.
Deferred tax assets and liabilities are calculated at the tax rates that are expected to apply to the period when the asset is realised or the liability is settled and their measurement also reflects the manner in which management expects to recover or settle the carrying amount of the related asset or liability. With
respect to non-depreciable items of property, plant and equipment measured at fair value and items of investment property measured at fair value, the related deferred tax liability or deferred tax asset is measured on the basis that the carrying amount of the asset will be recovered entirely through sale.
Deferred tax assets relating to temporary differences and unused tax losses are recognised only to the extent that it is probable that future taxable profit will be available against which the benefits of the deferred tax asset can be utilised.
Where temporary differences exist in relation to investments in subsidiaries, branches, associates, and joint ventures, deferred tax assets and liabilities are not recognised where the timing of the reversal of the temporary difference can be controlled and it is not probable that the reversal will occur in the foreseeable future.
Current tax assets and liabilities are offset where a legally enforceable right of set-off exists and it is intended that net settlement or simultaneous realisation and settlement of the respective asset and liability will occur. Deferred tax assets and liabilities are offset where: (a) a legally enforceable right of set-off exists; and (b) the deferred tax assets and liabilities relate to income taxes levied by the same taxation authority on either the same taxable entity or different taxable entities where it is intended that net settlement or simultaneous realisation and settlement of the respective asset and liability will occur in future periods in which significant amounts of deferred tax assets or liabilities are expected to be recovered or settled.
(c) Plant and Equipment
Plant and equipment are measured on the cost basis and therefore carried at cost less accumulated depreciation and any accumulated impairment. In the event the carrying amount of plant and equipment is greater than the estimated recoverable amount, the carrying amount is written down immediately to the estimated recoverable amount and impairment losses are recognised either in profit or loss or as a revaluation decrease if the impairment losses relate to a revalued asset.
The carrying amount of plant and equipment is reviewed annually by directors to ensure it is not in excess of the recoverable amount from these assets. The recoverable amount is assessed on the basis of the expected net cash flows that will be received from the asset’s employment and subsequent disposal. The expected net cash flows have been discounted to their present values in determining recoverable amounts.
Subsequent costs are included in the asset’s carrying amount or recognised as a separate asset, as appropriate, only when it is probable
2015 Annual Report & Statutory Financial Statements
25
For
per
sona
l use
onl
y

that future economic benefits associated with the item will flow to the Group and the cost of the item can be measured reliably. All other repairs and maintenance are recognised as expenses in profit or loss during the financial period in which they are incurred.
Depreciation
The depreciable amount of all plant and is depreciated on a straight line basis over their useful lives to the consolidated entity commencing from the time the asset is held ready for use.
The depreciation rates used for each class of depreciable assets are:
Class of Fixed Asset Depreciation Rate
Plant and equipment 2.5-33%
The assets’ residual values and useful lives are reviewed, and adjusted if appropriate, at the end of each reporting period.
An asset’s carrying amount is written down immediately to its recoverable amount if the asset’s carrying amount is greater than its estimated recoverable amount.
Gains and losses on disposals are determined by comparing proceeds with the carrying amount. These gains and losses are recognised in profit or loss in the period in which they arise. When revalued assets are sold, amounts included in the revaluation surplus relating to that asset are transferred to retained earnings.
(d) Leases
Leases of fixed assets, where substantially all the risks and benefits incidental to the ownership of the asset – but not the legal ownership – are transferred to entities in the consolidated group, are classified as finance leases.
Finance leases are capitalised by recognising an asset and a liability at the lower of the amounts equal to the fair value of the leased property or the present value of the minimum lease payments, including any guaranteed residual values. Lease payments are allocated between the reduction of the lease liability and the lease interest expense for the period.
Leased assets are depreciated on a straight-line basis over the shorter of their estimated useful lives or the lease term.
Lease payments for operating leases, where substantially all the risks and benefits remain with the lessor, are charged as expenses in the periods in which they are incurred.
Lease incentives under operating leases are recognised as a liability and amortised on a straight-line basis over the lease term.
(e) Financial Instruments
Recognition and initial measurementFinancial assets and financial liabilities are recognised when the entity becomes a party to the contractual provisions to the instrument. For financial assets, this is equivalent to the date that the company commits itself to either the purchase or sale of the asset (i.e. trade date accounting is adopted).
Financial instruments are initially measured at fair value plus transaction costs, except where the instrument is classified “at fair value through profit or loss”, in which case transaction costs are expensed to profit or loss immediately.
Classification and subsequent measurement
Financial instruments are subsequently measured at fair value, amortised cost using the effective interest method, or cost.
Amortised cost is calculated as the amount at which the financial asset or financial liability is measured at initial recognition less principal repayments and any reduction for impairment, and adjusted for any cumulative amortisation of the difference between that initial amount and the maturity amount calculated using the effective interest method.
Fair value is determined based on current bid prices for all quoted investments. Valuation techniques are applied to determine the fair value for all unlisted securities, including recent arm’s length transactions, reference to similar instruments and option pricing models.
The effective interest method is used to allocate interest income or interest expense over the relevant period and is equivalent to the rate that discounts estimated future cash payments or receipts (including fees, transaction costs and other premiums or discounts) over the expected life (or when this cannot be reliably predicted, the contractual term) of the financial instrument to the net carrying amount of the financial asset or financial liability. Revisions to expected future net cash flows will necessitate an adjustment to the carrying amount with a consequential recognition of an income or expense item in profit or loss.
The Group does not designate any interests in subsidiaries, associates or joint venture entities as being subject to the requirements of Accounting Standards specifically applicable to financial instruments.
(i) Loans and receivables
Loans and receivables are non-derivative financial assets with fixed or determinable payments that are not quoted in an active market and are subsequently measured at amortised cost. Gains or losses are recognised in profit or loss through the amortisation process and when the financial asset is derecognised.
(ii) Financial assets at fair value through profit or lossFinancial assets are classified at “fair value through profit or loss” when they are held for trading for the purpose of short-term profit taking, derivatives not held for hedging purposes, or when they are designated as such to avoid an accounting mismatch or to enable performance evaluation where a Group of financial assets is managed by key management personnel on a fair value basis in accordance with a documented risk management or investment strategy. Such assets are subsequently measured at fair value with changes in carrying amount being included in profit or loss.
(iii) Financial liabilitiesNon-derivative financial liabilities other than financial guarantees are subsequently measured at amortised cost. Gains or losses are recognised in profit or loss through the amortisation process and when the financial liability is derecognised.
PharmAust Limited and its Controlled Entities
26
For
per
sona
l use
onl
y

Impairment
At the end of each reporting period, the Group assesses whether there is objective evidence that a financial asset has been impaired. A financial asset (or a group of financial assets) is deemed to be impaired if, and only if, there is objective evidence of impairment as a result of one or more events (a “loss event”) having occurred, which has an impact on the estimated future cash flows of the financial asset(s).
In the case of available-for-sale financial assets, a significant or prolonged decline in the market value of the instrument is considered to constitute a loss event. Impairment losses are recognised in profit or loss immediately. Also, any cumulative decline in fair value previously recognised in other comprehensive income is reclassified to profit or loss at this point.
In the case of financial assets carried at amortised cost, loss events may include: indications that the debtors or a group of debtors are experiencing significant financial difficulty, default or delinquency in interest or principal payments; indications that they will enter bankruptcy or other financial reorganisation; and changes in arrears or economic conditions that correlate with defaults.
For financial assets carried at amortised cost (including loans and receivables), a separate allowance account is used to reduce the carrying amount of financial assets impaired by credit losses. After having taken all possible measures of recovery, if management establishes that the carrying amount cannot be recovered by any means, at that point the written-off amounts are charged to the allowance account or the carrying amount of impaired financial assets is reduced directly if no impairment amount was previously recognised in the allowance account.
When the terms of financial assets that would otherwise have been past due or impaired have been renegotiated, the Group recognises the impairment for such financial assets by taking into account the original terms as if the terms have not been renegotiated so that the loss events that have occurred are duly considered.
Derecognition
Financial assets are derecognised when the contractual rights to receipt of cash flows expire or the asset is transferred to another party whereby the entity no longer has any significant continuing involvement in the risks and benefits associated with the asset. Financial liabilities are derecognised when the related obligations are discharged, cancelled or have expired. The difference between the carrying amount of the financial liability extinguished or transferred to another party and the fair value of consideration paid, including the transfer of non-cash assets or liabilities assumed, is recognised in profit or loss.
(f) Foreign Currency Transactions and Balances
The functional currency of each of the entities in the consolidated entity is measured using the currency of the primary economic environment in which that entity operates. The consolidated financial statements are presented in Australian dollars which is the parent entity’s functional currency.
Transaction and balances
Foreign currency transactions are translated into functional currency using the exchange rates prevailing at the date of the transaction. Foreign currency monetary items are translated at the year-end exchange rate. Non-monetary items measured at historical cost continue to be carried at the exchange rate at the date of the transaction. Non-monetary items measured at fair value are reported at the exchange rate at the date when fair values were determined.
Exchange differences arising on the translation of non-monetary items are recognised directly in other comprehensive income to the extent that the underlying gain or loss is recognised in other comprehensive income; otherwise the exchange difference is recognised in profit or loss.
(g) Impairment of Assets
At the end of each reporting period, the Group assesses whether there is any indication that an asset may be impaired. The assessment will include the consideration of external and internal sources of information including dividends received from subsidiaries, associates or jointly controlled entities deemed to be out of pre-acquisition profits. If such an indication exists, an impairment test is carried out on the asset by comparing the recoverable amount of the asset, being the higher of the asset’s fair value less costs to sell and value in use, to the asset’s carrying amount. Any excess of the asset’s carrying amount over its recoverable amount is recognised immediately in profit or loss, unless the asset is carried at a revalued amount in accordance with another Standard (e.g. in accordance with the revaluation model in AASB 116: Property, Plant and Equipment). Any impairment loss of a revalued asset is treated as a revaluation decrease in accordance with that other Standard.
Where it is not possible to estimate the recoverable amount of an individual asset, the Group estimates the recoverable amount of the cash-generating unit to which the asset belongs.
Impairment testing is performed annually for goodwill, intangible assets with indefinite lives and intangible assets not yet available for use.
(h) Investments in Associates
Investments in associate companies are recognised in the financial statements by applying the equity method of accounting.
2015 Annual Report & Statutory Financial Statements
27
For
per
sona
l use
onl
y
(i) Employee Benefits
Short-term employee benefits
Provision is made for the group’s obligation for short-term employee benefits. Short-term employee benefits are benefits (other than termination benefits) that are expected to be settled wholly before 12 months after the end of the annual reporting period in which the employees render the related service, including wages and salaries. Short-term employee benefits are measured at the (undiscounted) amounts expected to be paid when the obligation is settled.
The group’s obligations for short-term employee benefits such as wages and salaries are recognised as a part of current trade and other payables in the statement of financial position. The Group’s obligations for employees’ annual leave and long service leave entitlements are recognised as provisions in the statement of financial position.
Other long-term employee benefits
Provision is made for employees’ long service leave and annual leave entitlements not expected to be settled wholly within 12 months after the end of the annual reporting period in which the employees render the related service. Other long-term employee benefits are measured at the present value of the expected future payments to be made to employees. Expected future payments incorporate anticipated future wage and salary levels, durations of service and employee departures and are discounted at rates determined by reference to market yields at the end of the reporting period on government bonds that have maturity dates that approximate the terms of the obligations. Any remeasurements for changes in assumptions of obligations for other long-term employee benefits are recognised in profit or loss in the periods in which the changes occur.
The group’s obligations for long-term employee benefits are presented as non-current provisions in its statement of financial position, except where the Group does not have an unconditional right to defer settlement for at least 12 months after the end of the reporting period, in which case the obligations are presented as current provisions.
(j) Provisions
Provisions are recognised when the consolidated entity has a legal or constructive obligation, as a result of past events, for which it is probable that an outflow of economic benefits will result and that outflow can be reliably measured.
Provisions are measured using the best estimate of the amounts required to settle the obligation at the end of the reporting period.
(k) Cash and Cash Equivalents
Cash and cash equivalents includes cash on hand, deposits held at call with banks and other short-term highly liquid investments with original maturities of three months or less, and bank overdrafts. Bank overdrafts are reported within short-term borrowings in current liabilities in the statement of financial position.
(l) Trade and other receivables
Trade and other receivables include amounts due from customers for goods sold and services performed in the ordinary course of business. Receivables expected to be collected within 12 months of the end of the reporting
period are classified as current assets. All other receivables are classified as non-current assets.
Trade and other receivables are initially recognised at fair value and subsequently measured at amortised cost using the effective interest method, less any provision for impairment.
(m) Revenue
Revenue is measured at the fair value of the consideration received or receivable after taking into account any trade discounts and volume rebates allowed. When the inflow of consideration is deferred, it is treated as the provision of financing and is discounted at a rate of interest that is generally accepted in the market for similar arrangements. The difference between the amount initially recognised and the amount ultimately received is interest revenue.
Revenue from the sale of goods is recognised at the point of delivery as this corresponds to the transfer of significant risks and rewards of ownership of the goods and the cessation of all involvement in those goods.
Interest revenue is recognised using the effective interest method.
All revenue is stated net of the amount of goods and services tax.
(n) Goods and services tax
Revenues, expenses and assets are recognised net of the amount of GST, except where the amount of GST incurred is not recoverable from the Australian Taxation Office (ATO).
Receivables and payables are stated inclusive of the amount of GST receivable or payable. The net amount of GST recoverable from, or payable to, the ATO is included with other receivables or payables in the statement of financial position.
Cash flows are presented on a gross basis. The GST components of cash flows arising from investing or financing activities which are recoverable from, or payable to, the ATO are presented as operating cash flows included in receipts from customers or payments to suppliers.
(o) Equity-settled compensation
The Group operates an employee share and option plan. Share-based payments to employees are measured at the fair value of the instruments issued and amortised over the vesting periods. Share-based payments to non-employees are measured at the fair value of goods or services received or the fair value of the equity instruments issued, if it is determined the fair value of the goods or services cannot be reliably measured, and are recorded at the date the goods or services are received. The corresponding amount is recorded to the option reserve. The fair value of options is determined using the Black-Scholes pricing model. The number of shares and options expected to vest is reviewed and adjusted at the end of each reporting period such that the amount recognised for services received as consideration for the equity instruments granted is based on the number of equity instruments that eventually vest.
(p) Contributed equity
Ordinary shares are classified as equity. Incremental costs directly attributable to the issue of new shares or options are shown in equity as a deduction, net of tax, from the proceeds.
PharmAust Limited and its Controlled Entities
28
For
per
sona
l use
onl
y

(q) Earnings per share
Basic earnings per share is calculated as net profit attributable to members of the Company, adjusted to exclude any costs of servicing equity (other than dividends) and preference share dividends, divided by the weighted average number of ordinary shares, adjusted for any bonus element.
(r) Borrowing Costs
Borrowing costs directly attributable to the acquisition, construction or production of assets that necessarily take a substantial period of time to prepare for their intended use or sale are added to the cost of those assets, until such time as the assets are substantially ready for their intended use or sale.
All other borrowing costs are recognised in profit or loss in the period in which they are incurred.
(s) Intangibles Assets
Intellectual property rights- three oncology technology platforms
Intellectual property rights are recognised at cost of acquisition less accumulated amortisation and any impairment losses. For intellectual property rights not yet in use, they are tested for impairment annually or more frequently if events or changes in circumstances indicate that they might be impaired, and are carried at cost less accumulated impairment losses.
Expenditure during the research phase of a project is recognised as an expense when incurred. Development costs are capitalised only when technical feasibility studies identify that the project is expected to deliver future economic benefits and these benefits can be measured reliably.
Intangible assets have a finite useful life and are amortised on a systematic basis based on the future economic benefits over the useful life of the project following commercialisation of the assets.
(t) Fair Value measurement
When an asset or liability, financial or non-financial, is measured at fair value for recognition or disclosure purposes, the fair value is based on the price that would be received to sell an asset or paid to transfer a liability in an orderly transaction between market participants at the measurement date; and assumes that the transaction will take place either: in the principal market; or in the absence of a principal market, in the most advantageous market.
Fair value is measured using the assumptions that market participants would use when pricing the asset or liability, assuming they act in their economic best interests. For non-financial assets, the fair value measurement is based on its highest and best use. Valuation techniques that are appropriate in the circumstances and for which sufficient data are available to measure fair value,
are used, maximising the use of relevant observable inputs and minimising the use of unobservable inputs.
Assets and liabilities measured at fair value are classified, into three levels, using a fair value hierarchy that reflects the significance of the inputs used in making the measurements. Classifications are reviewed at each reporting date and transfers between levels are determined based on a reassessment of the lowest level of input that is significant to the fair value measurement.
For recurring and non-recurring fair value measurements, external valuers may be used when internal expertise is either not available or when the valuation is deemed to be significant. External valuers are selected based on market knowledge and reputation. Where there is a significant change in fair value of an asset or liability from one period to another, an analysis is undertaken, which includes a verification of the major inputs applied in the latest valuation and a comparison, where applicable, with external sources of data.
(u) Comparative Figures
When required by Accounting Standards, comparative figures have been adjusted to conform to changes in presentation for the current financial year.
(v) Operating segments
Operating segments are presented using the ‘management approach’, where the information presented is on the same basis as the internal reports provided to the Chief Operating Decision Makers (‘CODM’). The CODM is responsible for the allocation of resources to operating segments and assessing their performance.
(w) Current and non-current classification
Assets and liabilities are presented in the statement of financial position based on current and non-current classification.
An asset is classified as current when: it is either expected to be realised or intended to be sold or consumed in normal operating cycle; it is held primarily for the purpose of trading; it is expected to be realised within 12 months after the reporting period; or the asset is cash or cash equivalent unless restricted from being exchanged or used to settle a liability for at least 12 months after the reporting period. All other assets are classified as non-current.
A liability is classified as current when: it is either expected to be settled in normal operating cycle; it is held primarilyfor the purpose of trading; it is due to be settled within 12 months after the reporting period; or there is no unconditional right to defer the settlement of the liability for at least 12 months after the reporting period. All other liabilities are classified as non-current.
Deferred tax assets and liabilities are always classified as non-current.
2015 Annual Report & Statutory Financial Statements
29
For
per
sona
l use
onl
y
(x) New, revised or amending accounting standards and interpretations adopted
In the current year, the Group has adopted all of the new and revised Standards and Interpretations issued by the Australian Accounting Standards Board (the AASB) that are relevant to its operations and effective for the current annual reporting period.
Any new, revised or amending Accounting Standards or Interpretations that are not yet mandatory have not been early adopted.
Any significant impact on the accounting policies of the consolidated entity from the adoption of these Accounting Standards and Interpretations are disclosed below. The adoption of these Accounting Standards and Interpretations did not have any significant impact on the financial performance or position of the consolidated entity.
The following Accounting Standards and Interpretations are most relevant to the consolidated entity:
AASB 2012-3 Amendments to Australian Accounting Standards - Offsetting Financial Assets and Financial Liabilities
The consolidated entity has applied AASB 2012-3 from 1 July 2014. The amendments add application guidance to address inconsistencies in the application of the offsetting criteria in AASB 132 ‘Financial Instruments: Presenta-tion’, by clarifying the meaning of ‘currently has a legally enforceable right of set-off’; and clarifies that some gross settlement systems may be considered to be equivalent to net settlement.
AASB 2013-3 Amendments to AASB 136 - Recoverable Amount Disclosures for Non-Financial Assets
The consolidated entity has applied AASB 2013-3 from 1 July 2014. The disclosure requirements of AASB 136 ‘Impairment of Assets’ have been enhanced to require ad-ditional information about the fair value measurement when the recoverable amount of impaired assets is based on fair value less costs of disposals. Additionally, if mea-sured using a present value technique, the discount rate is required to be disclosed.
AASB 2014-1 Amendments to Australian Accounting Standards (Parts A to C)
The consolidated entity has applied Parts A to C of AASB 2014-1 from 1 July 2014. These amendments affect the following standards: AASB 2 ‘Share-based Payment’: clarifies the definition of ‘vesting condition’ by separately defining a ‘performance condition’ and a ‘service condi-tion’ and amends the definition of ‘market condition’; AASB 3 ‘Business Combinations’: clarifies that contingent consideration in a business combination is subsequently measured at fair value with changes in fair value recog-nised in profit or loss irrespective of whether the contin-gent consideration is within the scope of AASB 9; AASB 8 ‘Operating Segments’: amended to require disclosures of judgements made in applying the aggregation criteria and clarifies that a reconciliation of the total reportable segment assets to the entity’s assets is required only if seg-ment assets are reported regularly to the chief operating decision maker; AASB 13 ‘Fair Value Measurement’: clari-fies that the portfolio exemption applies to the valuation of contracts within the scope of AASB 9 and AASB 139; AASB 116 ‘Property, Plant and Equipment’ and AASB 138
‘Intangible Assets’: clarifies that on revaluation, restate-ment of accumulated depreciation will not necessarily be in the same proportion to the change in the gross carry-ing value of the asset; AASB 124 ‘Related Party Disclo-sures’: extends the definition of ‘related party’ to include a management entity that provides KMP services to the entity or its parent and requires disclosure of the fees paid to the management entity; AASB 140 ‘Investment Property’: clarifies that the acquisition of an investment property may constitute a business combination.
(y) Critical Accounting Estimates and Judgements
Estimates and assumptions are continually evaluated and are based on historical experience and other factors, including expectations of future events that are believed to be reasonable under the circumstances. Equally, the Group continually employs judgement in the application of its accounting policies.
Management has identified the following critical accounting policies for which significant judgements, estimates and assumptions are made. Actual results may differ from these estimates under different assumptions and conditions. Those which may materially affect the carrying amounts of assets and liabilities reported in future periods are discussed below.
Share-based payment transactions
The consolidated entity measures the cost of equity-settled transactions with employees by reference to the fair value of the equity instruments at the date at which they are granted. The fair value is determined by using either the Binomial or Black-Scholes model taking into account the terms and conditions upon which the instruments were granted.
Impairment of non-financial assets other than goodwill and other indefinite life intangible assets
The consolidated entity assesses impairment of non-financial assets other than goodwill and other indefinite life intangible assets at each reporting date by evaluating conditions specific to the consolidated entity and to the particular asset that may lead to impairment. If an impairment trigger exists, the recoverable amount of the asset is determined. This involves fair value less costs of disposal or value-in-use calculations, which incorporate a number of key estimates and assumptions.
Provision for impairment of receivables
The provision for impairment of receivables assessment requires a degree of estimation and judgement. The level of provision is assessed by taking into account the recent sales experience, the ageing of receivables, historical collection rates and specific knowledge of the individual debtor financial position.
Estimation of useful lives of assets
The consolidated entity determines the estimated useful lives and related depreciation and amortisation charges for its property, plant and equipment and finite life intangible assets. The useful lives could change significantly as a result of technical innovations or some other event. The depreciation and amortisation charge will increase where the useful lives are less than previously estimated lives, or technically obsolete or non-strategic assets that have been abandoned or sold will be written off or written down.
PharmAust Limited and its Controlled Entities
30
For
per
sona
l use
onl
y

2 REVENUE Consolidated
2015 $
2014 $
Sales 1,869,204 1,880,793
OTHER INCOME
Interest received 48,694 67,696
Other revenue 502,122 58,597
550,816 126,293
3 INCOME TAX EXPENSE3a No income tax is payable as a tax loss has been incurred for income tax purposes.
Loss before income tax (1,925,091) (1,317,853)
Prima facie tax benefit at 30% (2014:30%) (577,527) (395,355)
Tax effect of:
- Other non-allowable items 203,745 119,867 - Deferred tax asset not brought to
account 373,782 275,488
- -
3b Deferred tax asset The potential deferred tax assets have not been recognised in the statement of financial position because their recovery
is not considered probable.
- Tax losses at 30% tax rate (not recognised) 6,549,019 6,265,615
PharmAust Limited and its wholly-owned Australian subsidiary have formed an income tax consolidated group under the Tax Consolidation Regime. PharmAust Limited is responsible for recognising the current and deferred tax assets and liabilities for the tax consolidated group. The tax consolidated group has entered a tax sharing agreement whereby each company in the consolidated entity contributes to the income tax payable in proportion to their contribution to the net profit before tax of the tax consolidated group.
4 CASH AND CASH EQUIVALENTS
Cash at bank 3,411,767 2,304,323
5 TRADE AND OTHER RECEIVABLES
Consolidated
2015 $
2014 $
5a CURRENT
Trade receivables 223,271 104,061
Less: provision for doubtful debts - (5,815)
223,271 98,246
Trade receivables: Payment terms are 30 days from the date of recognition.
2015 Annual Report & Statutory Financial Statements
31
For
per
sona
l use
onl
y

5b Provision for impairment of receivables Current trade and term receivables are non-interest bearing and generally on 30-day terms. Non-current trade and term receivables are assessed for recoverability based on the underlying terms of the contract. A provision for impairment is recognised when there is objective evidence that an individual trade or term receivable is impaired.
Movement in provision:
Consolidated2015
$2014
$Balance brought forward (5,815) -
Provision provided for during the year - (5,815)
Bad debts written off 5,815 -
Balance carried forward - (5,815)
5c Past due but not impairedAs of 30 June 2015, trade receivables of $28,398 (2014:$ 36,768) were past due but not impaired. These relate to a number of independent customers for whom there is no recent history of default. The ageing analysis of these trade receivables is as follows:
31 to 60 days 24,425 36,519
61 days and above 3,973 249
28,398 36,768
Based on the credit history of these other classes, it is expected that these amounts will be received when due. The Group does not hold any collateral in relation to these receivables.
5d Fair value and credit riskThe Group has no significant concentration of credit risk with respect to any single counterparty or group of counterparties other than those receivables specifically provided for and mentioned within Note 5. The class of assets described as “trade and other receivables” is considered to be the main source of credit risk related to the Group.
6 OTHER CURRENT ASSETS
GST receivables 64,210 5,315
Bond 4,291 1,575
Prepayments 21,409 35,623
89,910 42,513
7 FINANCIAL ASSETS
Financial assets held for trading
Shares in listed securities - fair value 7,200 7,000
7a Movements in Carrying Amounts
Carrying amount at beginning of the year 7,000 2,050
Disposals - -
Movement in fair value 200 4,950
Carrying amount at end of the year 7,200 7,000
Refer to Note 18 for further information on fair value measurement.
PharmAust Limited and its Controlled Entities
32
For
per
sona
l use
onl
y
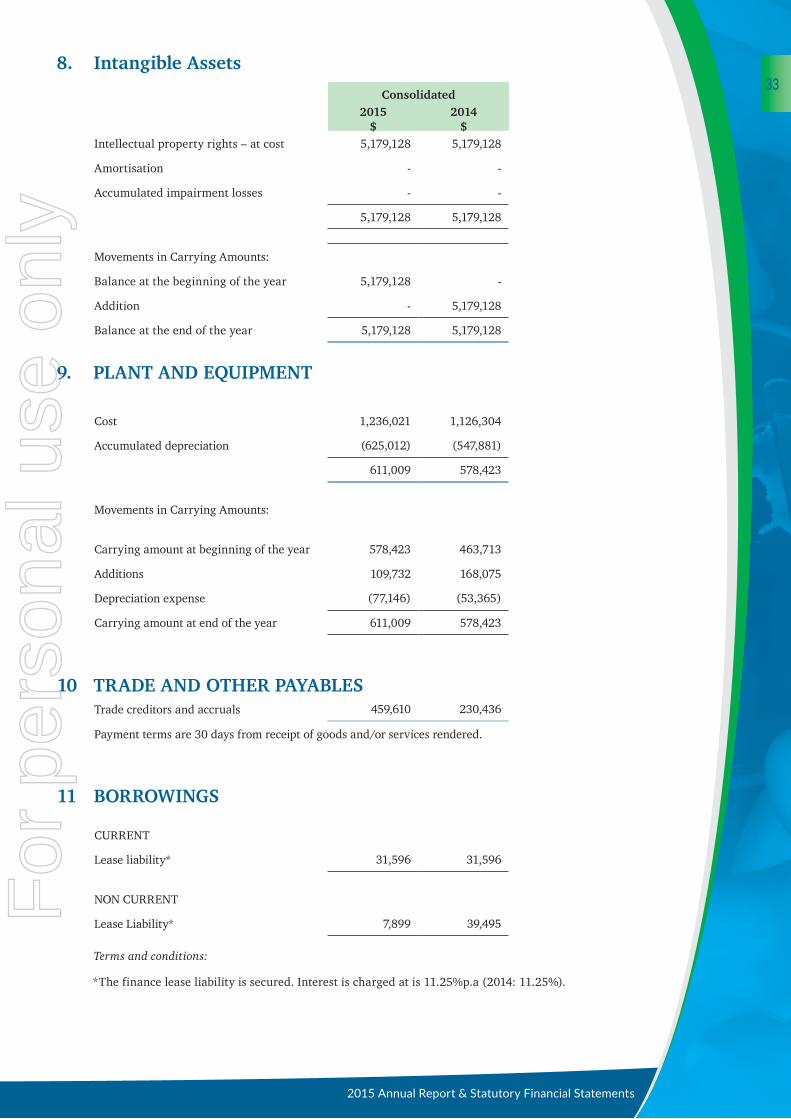
8. Intangible Assets
Consolidated2015
$2014
$Intellectual property rights – at cost 5,179,128 5,179,128
Amortisation - -
Accumulated impairment losses - -
5,179,128 5,179,128
Movements in Carrying Amounts:
Balance at the beginning of the year 5,179,128 -
Addition - 5,179,128
Balance at the end of the year 5,179,128 5,179,128
9. PLANT AND EQUIPMENT
Cost 1,236,021 1,126,304
Accumulated depreciation (625,012) (547,881)
611,009 578,423
Movements in Carrying Amounts:
Carrying amount at beginning of the year 578,423 463,713
Additions 109,732 168,075
Depreciation expense (77,146) (53,365)
Carrying amount at end of the year 611,009 578,423
10 TRADE AND OTHER PAYABLESTrade creditors and accruals 459,610 230,436
Payment terms are 30 days from receipt of goods and/or services rendered.
11 BORROWINGS
CURRENT
Lease liability* 31,596 31,596
NON CURRENT
Lease Liability* 7,899 39,495
Terms and conditions:
*The finance lease liability is secured. Interest is charged at is 11.25%p.a (2014: 11.25%).
2015 Annual Report & Statutory Financial Statements
33
For
per
sona
l use
onl
y

Financing arrangementsThe consolidated entity entered into a loan agreement to gain access to a loan facility of $750,000.
Interests: 3 month AFMA Bank Bill Average Bid Rate fix plus 5% margin.
Security: The parent entity is the guarantor of the loan facility.
Consolidated2015
$2014
$Loan facility:
Total facility limit 750,000 -
Amount utilised - -
Total unused facility at 30 June 750,000 -
12 PROVISIONS
CURRENT
Employee entitlements 172,630 143,949
NON CURRENT
Employee entitlements 11,484 -
Amounts not expected to be settled within the next 12 months
The current provision for employee benefits includes all unconditional entitlements where employees have completed the required period of service and also those where employees are entitled to pro-rata payments in certain circumstances. The entire amount is presented as current, since the consolidated entity does not have an unconditional right to defer settlement. However, based on past experience, the consolidated entity does not expect all employees to take the full amount of accrued leave or require payment within the next 12 months.
The following amounts reflect leave that is not expected to be taken within the next 12 months:
Employee benefits obligation expected to be settled after 12 months
86,315 71,975
13 ISSUED CAPITAL
Issued and paid up ordinary shares 44,393,484 41,393,484
13a Movement in fully paid ordinary shares
2015 2014 2015 2014
Ordinary Shares Number of shares $ $
At 1 July 1,440,006,606 617,506,606 41,393,484 32,941,890
Share issued as consideration of acquisition of subsidiary
- 472,500,000 - 5,197,500
Share placement (net)- for cash 400,000,000 350,000,000 3,000,000 3,254,094
At 30 June 1,840,006,606 1,440,006,606 44,393,484 41,393,484
13b Terms and ConditionsHolders of ordinary shares are entitled to receive dividends as declared from time to time and are entitled to one vote per share at shareholders’ meetings.
In the event of winding up the Company, ordinary shares rank after all other shareholders and creditors and are fully entitled to any proceeds from liquidation.
Ordinary shares issued as a result of the exercise of options, will rank equally and on the same terms and conditions as all other shareholders.
PharmAust Limited and its Controlled Entities
34
For
per
sona
l use
onl
y

13c Share options At 30 June 2015, there were 139,500,000 (2014: 139,500,000) unissued ordinary shares under options.
13d Capital Management Management controls the capital of the Group in order to maintain a good debt to equity ratio, provide
the shareholders with adequate returns and ensure that the Group can fund its operations and continue as a going concern.
The Group’s debt and capital includes ordinary share capital and financial liabilities, supported by financial assets.
There are no externally imposed capital requirements.
Management effectively manages the Group’s capital by assessing its financial risks and adjusting its capital structure in response to changes in these risks and in the market. These responses include the management of debt levels, distributions to shareholders and share issues.
There have been no changes in the strategy adopted by management to control the capital of the Group since the prior year. The gearing ratios for the year ended 30 June 15 and 30 June 2014 are as follows:
Consolidated
2015 $
2014 $
Total borrowings 10, 11 499,105 301,527
Less: cash and cash equivalents (3,411,767) (2,304,323)
Net debt (2,912,662) (2,002,796)
Total equity 8,839,066 7,764,157
Total capital 5,926,404 5,761,361
Gearing ratio - -
14 RESERVESOptions reserve 941,629 941,629
Movement in options issued as follow:
2015 No.Weighted Average
Exercise Price$
At 1 July 139,500,000 0.02
At 30 June 139,500,000 0.02
2014 No.Weighted Average
Exercise Price$
At 1 July - -
Capital raising- free attached options 87,500,000 0.02Share base payment- acquisition of subsidiary
50,000,000 0.02
Share base payment- supplier 2,000,000 0.02
At 30 June 139,500,000 0.02
All the options are exercisable as at 30 June 2015 and 30 June 2014.
As at the date of exercise, the weighted average share price of options exercised during the year was $0.02 (2014:$0.02).
The weighted average remaining contractual life of options outstanding at year-end was 0.16 years (2014: 1.16 years). The exercise price of outstanding shares at the end of the reporting period was $0.02 (2014: $0.02).
2015 Annual Report & Statutory Financial Statements
35
For
per
sona
l use
onl
y

15 RELATED PARTY TRANSACTIONSConsolidated
2015 $
2014 $
Aggregate amounts of each type of transaction with directors other than directors fees are as follows:
Re-imbursement of rental and variable outgoings expenses for the Company’s principal place of business – Bryant Mclarty - 12,000
Amount payable to related parties: Trade and other payables - -
Transactions between related parties are on normal commercial terms and conditions which are no more favourable than those available to other parties. There were no related party transactions other than those transactions identified above and key management personnel remuneration.
16 EARNINGS PER SHARE Net (loss) attributable to members of the Company (1,925,091) (1,317,853)
No. No.
Weighted average number of ordinary shares outstanding during the year used in calculating basic earnings per share. 1,517,091,538 1,332,236,058
16a Basic Earnings per ShareBasic earnings per share is determined by dividing the loss after income tax attributable to members of the Company by the weighted average number of ordinary shares outstanding during the financial period, adjusted for any bonus elements in ordinary shares issued during the year.
16b Diluted Earnings per ShareDiluted earnings per share is the same as basic earnings per share as there were no options on issue which would be potential ordinary shares.
17 AUDITOR’S REMUNERATION
Remuneration of RSM Bird Cameron Partners as auditor for: - auditing or reviewing the financial report 60,000 59,000
- taxation services 27,650 17,350
87,650 76,350
18 FINANCIAL RISK MANAGEMENT OBJECTIVES AND POLICIES The Group’s financial instruments consist mainly of deposits with banks, local money market instruments, short-term
investments, accounts receivable and payable, loans to and from subsidiaries, borrowings and leases.
The totals for each category of financial instruments, measured in accordance with AASB 139 as detailed in the accounting policies to these financial statements, are as follows:
Note Consolidated2015
$2014
$Financial assets
Cash and cash equivalents 4 3,411,767 2,304,323
Financial assets at fair value through profit or loss:
– held for trading 7 7,200 7,000
Loans and receivables (excluding GST) 5a, 6 248,971 135,444
Total financial assets 3,667,938 2,446,767
Financial liabilities
Financial liabilities at amortised cost:
– trade and other payables 10 459,610 230,436
– borrowings 11 39,495 71,091
Total financial liabilities 499,105 301,527
PharmAust Limited and its Controlled Entities
36
For
per
sona
l use
onl
y

Specific Financial Risk Exposures and Management The main risks arising from the Group’s financial instruments are cash flow interest rate risk, liquidity
risk and foreign exchange risk. Other minor risks are either summarised below or disclosed at Note 5 in the case of credit risk and Note 13 in the case of capital risk management. The Board reviews and agrees policies for managing each of these risks.
Cash Flow Interest Rate Risk The Group’s exposure to the risks of changes in market interest rates relates primarily to the Group’s short-
term deposits with a floating interest rate. These financial assets with variable rates expose the Group to cash flow interest rate risk. All other financial assets and liabilities in the form of receivables and payables are non-interest bearing. The Group does not engage in any hedging or derivative transactions to manage interest rate risk.
The following tables set out the carrying amount by maturity of the Group’s exposure to interest rate risk and the effective weighted average interest rate for each class of these financial instruments.
The Group has not entered into any hedging activities to cover interest rate risk. In regard to its interest rate risk, the Group does not have a formal policy in place to mitigate such risks.
2015
Weighted Average
Interest Rate
Floating Interest
Rate
Fixed Interest Rate
Within 1 Year
Fixed Interest Rate
Within 1-5 Years
Non-InterestBearing Total
$ $ $ $ $
Financial Assets
Cash and cash equivalents 2.38% 897,896 2,513,871 - - 3,411,767
Trade and other receivables - - - - 248,971 248,971
Other financial assets - - - - 7,200 7,200
Total financial assets 897,896 2,513,871 - 256,171 3,667,938
Financial liabilities
Trade and other payables - - - - (459,610) (459,610)
Borrowings 11.25% - (31,596) (7,899) - (39,495)
Total financial liabilities - (31,596) (7,899) (459,610) (499,105)
Net Financial
Assets/(Liabilities) 897,896 2,482,275 (7,899) (203,439) 3,168,833
2014
Weighted Average
Interest Rate
Floating Interest
Rate
Fixed Interest Rate
Within 1 Year
Fixed Interest Rate
Within 1-5 Years
Non-InterestBearing Total
$ $ $ $ $
Financial Assets
Cash and cash equivalents 2.9% 2,304,323 - - - 2,304,323
Trade and other receivables - - - - 135,444 135,444
Other financial assets - - - - 7,000 7,000
Total financial assets 2,304,323 - - 142,444 2,446,767
Financial liabilities
Trade and other payables - - - - (230,437) (230,437)
Borrowings 11.25% - (31,596) (39,495) - (71,091)
Total financial liabilities - (31,596) (39,495) (230,437) (301,528)
Net Financial
Assets/(Liabilities) 2,304,323 (31,596) (39,495) (87,993) 2,145,239
2015 Annual Report & Statutory Financial Statements
37
For
per
sona
l use
onl
y

Interest rate sensitivity analysis At 30 June 2015, if interest rates had changed by 100 basis points during the entire year with all other variables held constant,
profit for the year and equity would have been $8,979 (2014:$ 23,043) lower/higher, mainly as a result of lower/higher interest income from cash and cash equivalents.
Based on the sensitivity analysis only interest revenue from variable rate deposits and cash balances are impacted resulting in a decrease or increase in overall income.
Liquidity risk The Group manages liquidity risk by maintaining sufficient cash reserves and marketable securities and through the
continuous monitoring of budgeted and actual cash flows.
Consolidated
2015$
2014$
Contracted maturities
Payables
- within 1 year 459,610 230,436
Borrowings
- within 1 year 31,596 31,596
Price riskThe Group is not exposed to price risk.
Foreign exchange riskThe Group is exposed to foreign exchange rate arising from various currency exposures. Foreign exchange risk arises from future commercial transactions and recognised assets and liabilities denominated in a currency that is not the Group’s functional currency.
The Group’s exposure to foreign currency risk at the reporting date was as follows:
2015 2014
USD EUR GBP USD EUR GBP
$ $ $ $ $ $
Trade receivables 121,738 5,680 - 21,986 3,422 2,040
Trade payables 5,964 694 - 2,950 14,243 -
Foreign currency risk sensitivity analysis
At 30 June, the effect on profit and equity as a result of changes in the value of the Australian Dollar to the foreign currencies, with all other variables remaining constant is as follows:
2015 2014
Change in profit and equity with a +/- 10% in AUD to
Change in profit and equity with a +/- 10% in AUD to
USD EUR GBP USD EUR GBP
$ $ $ $ $ $
Trade receivables 11,620 542 - 1,231 1,057 910
Trade payables 569 66 - 165 4,398 -
Net fair valuesFor assets and other liabilities the net fair value approximates their carrying value. The Group has no financial assets where the carrying amount exceeds net fair values at reporting date.
The aggregate net fair values and carrying amounts of financial assets and financial liabilities are disclosed in the statement of comprehensive income and in the notes to the financial statements.
PharmAust Limited and its Controlled Entities
38
For
per
sona
l use
onl
y

Financial instruments at fair value
The financial instruments recognised at fair value in the statement of financial position have been analysed and classified using the fair value hierarchy reflecting the significance of the inputs used in making the measurements. The fair value hierarchy consists of the following levels:
- quoted prices in active markets for identical assets and liabilities (Level 1);
- inputs other than quoted prices included with Level 1 that are observable for the asset or liability, either directly (as prices) or indirectly (derived from prices) (Level 2); and
- inputs for the asset or liability that are not based on observable market data (unobservable inputs) (Level 3).
Level 1 Level 2 Level 3 Total
2015 $ $ $ $
Financial assets held for trading 7,200 - - 7,200
7,200 - - 7,200
2014
Financial assets held for trading 7,000 - - 7,000
7,000 - - 7,000
19 INVESTMENT IN CONTROLLED ENTITIES
Equity Holding Equity Holding
Country of Corporation
Class of Shares2015
%2014
%
Parent Entity:
PharmAust Limited Australia - - -
Name of Controlled Entity:
Epichem Pty Ltd Australia Ordinary 100 100
Pitney Pharmaceuticals Pty Ltd Australia Ordinary 100 100
20 NOTES TO THE STATEMENT OF CASH FLOWS20a Reconciliation of Cash
Consolidated
2015$
2014$
Cash at bank 3,411,767 2,304,323
2015 Annual Report & Statutory Financial Statements
39
For
per
sona
l use
onl
y
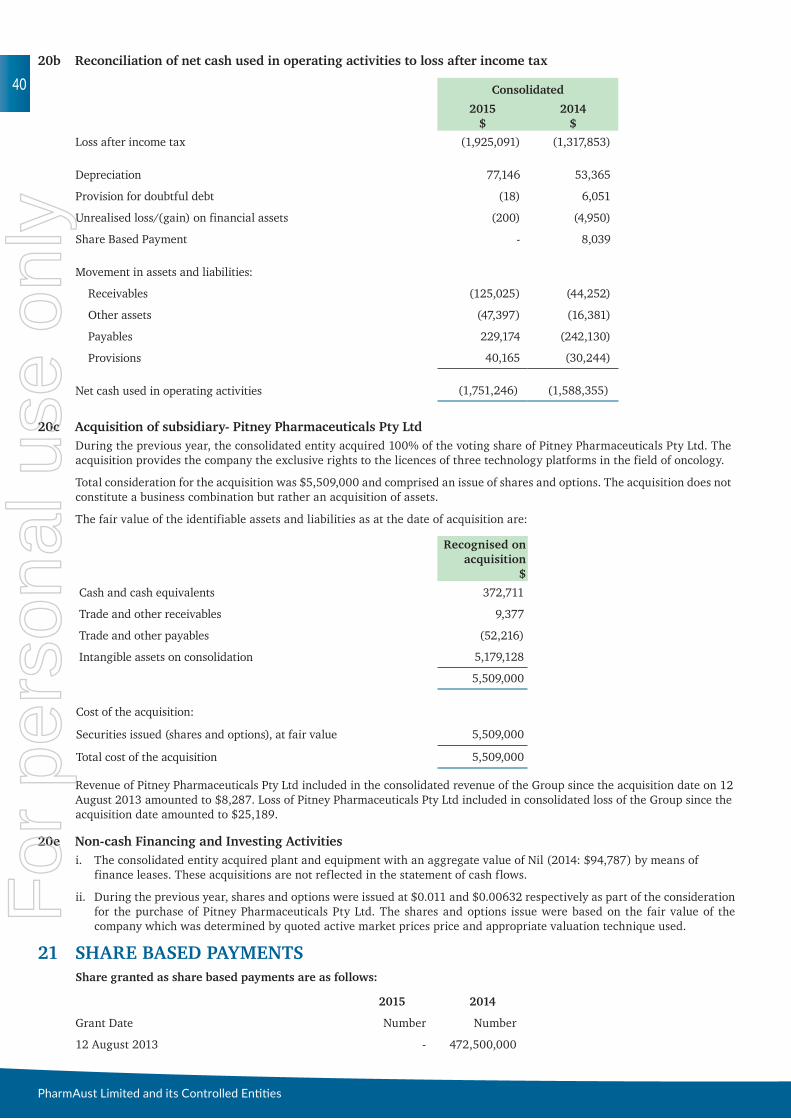
20b Reconciliation of net cash used in operating activities to loss after income tax
Consolidated
2015$
2014$
Loss after income tax (1,925,091) (1,317,853)
Depreciation 77,146 53,365
Provision for doubtful debt (18) 6,051
Unrealised loss/(gain) on financial assets (200) (4,950)
Share Based Payment - 8,039
Movement in assets and liabilities:
Receivables (125,025) (44,252)
Other assets (47,397) (16,381)
Payables 229,174 (242,130)
Provisions 40,165 (30,244)
Net cash used in operating activities (1,751,246) (1,588,355)
20c Acquisition of subsidiary- Pitney Pharmaceuticals Pty Ltd During the previous year, the consolidated entity acquired 100% of the voting share of Pitney Pharmaceuticals Pty Ltd. The acquisition provides the company the exclusive rights to the licences of three technology platforms in the field of oncology.
Total consideration for the acquisition was $5,509,000 and comprised an issue of shares and options. The acquisition does not constitute a business combination but rather an acquisition of assets.
The fair value of the identifiable assets and liabilities as at the date of acquisition are:
Recognised on acquisition
$
Cash and cash equivalents 372,711
Trade and other receivables 9,377
Trade and other payables (52,216)
Intangible assets on consolidation 5,179,128
5,509,000
Cost of the acquisition:
Securities issued (shares and options), at fair value 5,509,000
Total cost of the acquisition 5,509,000
Revenue of Pitney Pharmaceuticals Pty Ltd included in the consolidated revenue of the Group since the acquisition date on 12 August 2013 amounted to $8,287. Loss of Pitney Pharmaceuticals Pty Ltd included in consolidated loss of the Group since the acquisition date amounted to $25,189.
20e Non-cash Financing and Investing Activitiesi. The consolidated entity acquired plant and equipment with an aggregate value of Nil (2014: $94,787) by means of
finance leases. These acquisitions are not reflected in the statement of cash flows.
ii. During the previous year, shares and options were issued at $0.011 and $0.00632 respectively as part of the consideration for the purchase of Pitney Pharmaceuticals Pty Ltd. The shares and options issue were based on the fair value of the company which was determined by quoted active market prices price and appropriate valuation technique used.
21 SHARE BASED PAYMENTSShare granted as share based payments are as follows:
2015 2014
Grant Date Number Number
12 August 2013 - 472,500,000
PharmAust Limited and its Controlled Entities
40
For
per
sona
l use
onl
y

The weighted average fair value of those equity instruments was determined by reference to the market price which was $0.011 (2014: $0.011).
In 2015, there were no share based payments.
In 2014, these shares were issued as part of the consideration for the acquisition of Pitney Pharmaceuticals Pty Ltd. Refer to Note 20c for further details of the acquisition of subsidiary.
Options granted as share based payments are as follows:
2014
Grant date Expiry date Exercise price Number
05/08/2013* 31/08/2015 $0.02 50,000,000
16/10/2013** 31/08/2015 $0.02 2,000,000
52,000,000
* The options are issued as part of the consideration for acquisition of Pitney Pharmaceuticals Pty Ltd.
**The options are issued to Peloton Capital Pty Ltd as part of corporate advisory service provided.
The fair values were calculated using the Black-Scholes option pricing model applying the following input:
Share price Exercise Expected Dividend Risk-free Fair valueOptions at grant date price volatility yield interest rate at grant date
50,000,000 $0.012 $0.02 120.00% 0% 2.37% $0.00623
2,000,000 $0.01 $0.02 110.00% 0% 2.82% $0.00402
22 KEY MANAGEMENT PERSONNEL22a Remuneration of Key Management Personnel
Refer to the remuneration report contained in the directors’ report for details of the remuneration paid or payable to each member of the consolidated entity’s key management personnel for the year ended 30 June 2015 and 30 June 2014.
The totals of remuneration paid to key management personnel of the consolidated entity during the year are as follows:
Consolidated
2015$
2014$
Short term employee benefits 838,230 600,500
Post-employment benefits 69,656 45,139
907,886 645,639
23 Commitments23a Corporate advisory fees
- Not later than 12 months - 37,500
- Between 12 months and 5 years - -
Minimum payments - 37,500
23b Office lease commitmentsNon-cancellable operating leases contracted for but not recognised in the financial statements:
Payable – minimum lease payments
- Not later than 12 months 140,450 6,300
- Between 12 months and 5 years 530,000 -
- Later than 5 years 651,459 -
Minimum lease payments 1,321,909 6,300
2015 Annual Report & Statutory Financial Statements
41
For
per
sona
l use
onl
y

24 SEGMENT REPORTING Segment Information
Identification of reportable segments
The Group has identified its operating segments based on the internal reports that are reviewed and used by the Directors (chief operating decision makers) in assessing performance and determining the allocation of resources.
Descriptions of segments
i. Corporate
The corporate segment covers all the corporate overhead expenses.
ii. Pharmaceutical
The pharmaceutical segment provides products and services in synthetic and medicinal chemistry to the drug discovery and pharmaceutical industries.
Basis of accounting for purposes of reporting by operating segments
a. Accounting policies adopted
All amounts reported to the Directors, being the chief decision makers with respect to operating segments, are determined in accordance with accounting policies that are consistent to those adopted in these financial statements.
b. Intersegment transactions
There are no intersegment sales and purchase within the consolidated entity.
Intersegment loans payable and receivable are initially recognised at the consideration received/to be received net of transaction costs.
c. Segment assets
Where an asset is used across multiple segments, the asset is allocated to the segment that receives majority economic value from the asset. In the majority of instances, segment assets are clearly identifiable on the basis of their nature and physical location.
d. Segment liabilities
Liabilities are allocated to segments where there is a direct nexus between the incurrence of the liability and the opera-tions of the segment.
The consolidated entity operates in three business segments as disclosed below:
i) Segment Performance
Consolidated Corporate Pharmaceutical Total
2015 $ $ $
Revenue
External sales - 1,869,204 1,869,204
Other external revenue 318,872 231,944 550,816
Inter-segment sales - 46,415 46,415
Total segment revenue 318,872 2,147,563 2,466,435
Inter-segment elimination (46,415)
Total revenue per statement of comprehensive income 2,420,020
Results
Segment result from continuing operations before tax (1,917,693) (7,398) (1,925,091)
PharmAust Limited and its Controlled Entities
42
For
per
sona
l use
onl
y
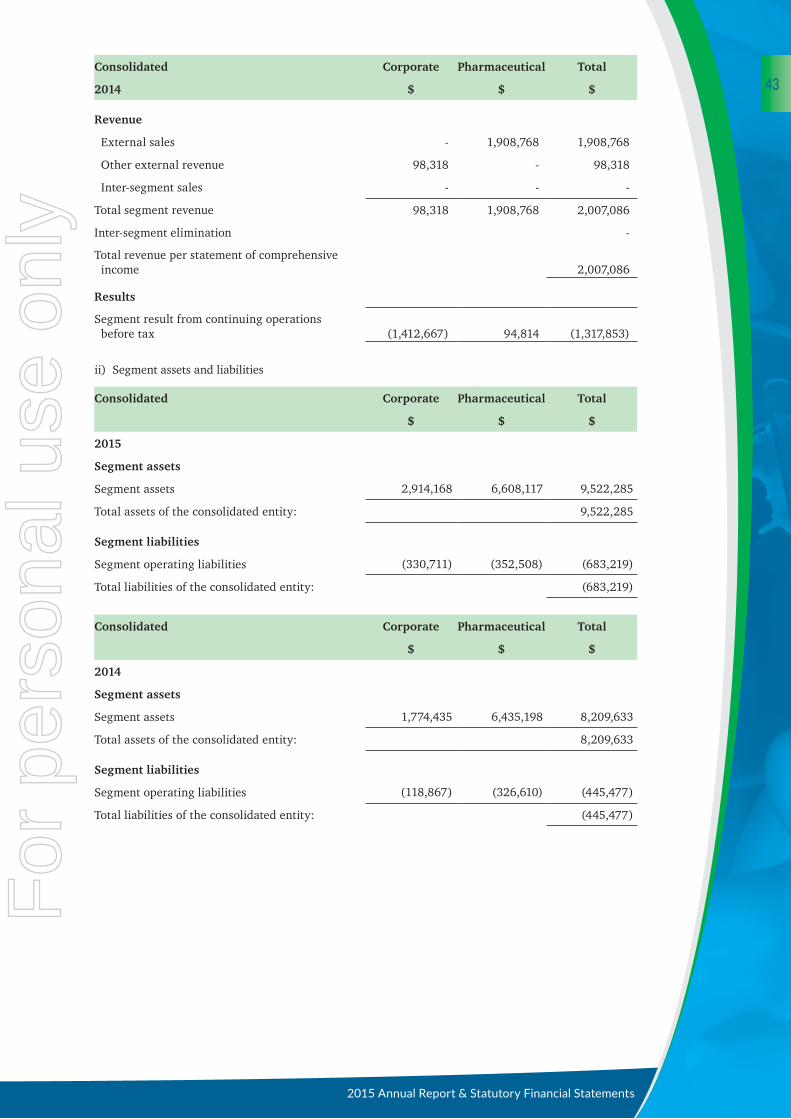
Consolidated Corporate Pharmaceutical Total
2014 $ $ $
Revenue
External sales - 1,908,768 1,908,768
Other external revenue 98,318 - 98,318
Inter-segment sales - - -
Total segment revenue 98,318 1,908,768 2,007,086
Inter-segment elimination -
Total revenue per statement of comprehensive income 2,007,086
Results
Segment result from continuing operations before tax (1,412,667) 94,814 (1,317,853)
ii) Segment assets and liabilities
Consolidated Corporate Pharmaceutical Total
$ $ $
2015
Segment assets
Segment assets 2,914,168 6,608,117 9,522,285
Total assets of the consolidated entity: 9,522,285
Segment liabilities
Segment operating liabilities (330,711) (352,508) (683,219)
Total liabilities of the consolidated entity: (683,219)
Consolidated Corporate Pharmaceutical Total
$ $ $
2014
Segment assets
Segment assets 1,774,435 6,435,198 8,209,633
Total assets of the consolidated entity: 8,209,633
Segment liabilities
Segment operating liabilities (118,867) (326,610) (445,477)
Total liabilities of the consolidated entity: (445,477)
2015 Annual Report & Statutory Financial Statements
43
For
per
sona
l use
onl
y

ii) Revenue by geographical region
Consolidated2015
$2014
$Revenue by geographical region
Revenue attributable to external customers is disclosed below, based on the location of the external customer: Switzerland 931,538 1,167,529
Australia 1,228,137 358,141
Others 260,345 481,416
Total revenue 2,420,020 2,007,086
Assets by geographical region
The location of segment assets by geographical location of the assets is disclosed below: Australia 9,522,285 8,209,633
Total assets 9,522,285 8,209,633
Major customersThe consolidated entity has a number or customers to which it provides both products and services. The consolidated entity supplies a single external customer within the pharmaceutical segment who accounts for 62% of external revenue (2014: 72%). The next most significant customer accounts for less than 10% of external revenue.
25 CONTINGENT LIABILITIES The consolidated entity has the following contingent liabilities at reporting date:
Issue of additional shares
As part of Share Sale Agreement to acquire Pitney Pharmaceuticals Pty Ltd, the consolidated entity will issue additional shares of 50 million each to the seller upon meeting the three milestones.
The three milestones are:
· Milestone 1 - One of the consolidated entity’s products being granted investigational new drug (IND) status from the US Food and Drug Administration and the Company receiving an IND number issued by the US Food and Drug Administration within 5 years of the Settlement Date and provided this is no later than 31 October 2018;
· Milestone 2 - Commencement of treatment of the first patient under a Phase II Trial with the product Albendazole within 5 years of the Settlement Date and provided this is no later than 31 October 2018; and
· Milestone 3 - Commencement of treatment of the first patient under a Phase II Trial using the product Monepantel within 5 years of the Settlement Date and provided this is no later than 31 October 2018.
Issue of options
As part of the corporate advisory mandate signed with Peloton Capital Pty Ltd whom is to provide advisory services to the company in relation to the placement of any further current capital raising and increase the consolidated entity’s profile and share price by way of investor relations initiatives, the consolidated entity will issue three trenches of 2.5 million options each at exercise price of $0.02 and expire on 31 August 2015 upon the consolidated entity’s share prices reaching weighted average of $0.02, $0.03 and $0.04 respectively for a 30 day period. No such options have been issued to date.
Other than the above, there were no other material contingent liabilities or contingent assets.
PharmAust Limited and its Controlled Entities
44
For
per
sona
l use
onl
y

26 PARENT INFORMATION
Statement of Financial Position2015
$2014
$
Assets
Current assets 8,413,567 7,266,967
Non-current assets 385,003 16,468
Total assets 8,798,570 7,283,435
Liabilities
Current liabilities 337,632 118,867
Non -current liabilities 214,063 -
Total liabilities 551,695 118,867
Equity
Issued capital 44,393,484 41,393,484
Reserves 941,629 941,629
Accumulated losses (37,088,238) (35,170,545)
Total equity 8,246,875 7,164,568
Statement of comprehensive income
(Loss) for the year (1,917,693) (1,412,667)
Other comprehensive income - -
Total comprehensive loss for the year (1,917,693) (1,412,667)
GuaranteesPharmAust Limited is a guarantor of a debt facility for its fully owned subsidiary during the year as disclosed in Note 11.
Other Commitments and ContingenciesPharmAust Limited has no commitments to acquire property, plant and equipment and has no contingent liabilities other than disclosed in Note 25.
27 EQUITY- ACCUMULATED LOSSES
Consolidated
2015 $
2014 $
Accumulated losses at beginning of the financial year (34,570,956) (33,253,103)
(Loss)after income tax for the year (1,925,091) (1,317,853)
Accumulated losses at the end of the financial year (36,496,047) (34,570,956)
28 EVENTS AFTER THE REPORTING PERIODOn 7 July 2015 the Group entered into a construction contract with a value of $1,591,634 to construct a laboratory.
On 14th July 2015, the group received $411,000 from DNDi (currently the group’s largest client) as an advanced payment for work yet to be completed on its flagship project on Chagas disease.
Other than the above, the directors are not aware of any significant events since the end of the reporting period.
2015 Annual Report & Statutory Financial Statements
45
For
per
sona
l use
onl
y

29 NEW ACCOUNTING STANDARDS AND INTERPRETATIONS NOT YET MANDATORY OR EARLY ADOPTED Australian Accounting Standards and Interpretations that have recently been issued or amended but are not yet mandatory, have not been early adopted by the consolidated entity for the annual reporting period ended 30 June 2015. The consolidated entity’s assessment of the impact of these new or amended Accounting Standards and Interpretations, most relevant to the consolidated entity, are set out below.
AASB 9 Financial Instruments
This standard is applicable to annual reporting periods beginning on or after 1 January 2018. The standard replaces all previous versions of AASB 9 and completes the project to replace IAS 39 ‘Financial Instruments: Recognition and Measurement’. AASB 9 introduces new classification and measurement models for financial assets. A financial asset shall be measured at amortised cost, if it is held within a business model whose objective is to hold assets in order to collect contractual cash flows, which arise on specified dates and solely principal and interest. All other financial instrument assets are to be classified and measured at fair value through profit or loss unless the entity makes an irrevocable election on initial recognition to present gains and losses on equity instruments (that are not held-for-trading) in other comprehensive income (‘OCI’). For financial liabilities, the standard requires the portion of the change in fair value that relates to the entity’s own credit risk to be presented in OCI (unless it would create an accounting mismatch). New simpler hedge accounting requirements are intended to more closely align the accounting treatment with the risk management activities of the entity. New impairment requirements will use an ‘expected credit loss’ (‘ECL’) model to recognise an allowance. Impairment will be measured under a 12-month ECL method unless the credit risk on a financial instrument has increased significantly since initial recognition in which case the lifetime ECL method is adopted. The standard introduces additional new disclosures. The consolidated entity will adopt this standard from 1 July 2018 but the impact of its adoption is yet to be assessed by the consolidated entity.
AASB 15 Revenue from Contracts with Customers
This standard is applicable to annual reporting periods beginning on or after 1 January 2017. The standard provides a single standard for revenue recognition. The core principle of the standard is that an entity will recognise revenue to depict the transfer of promised goods or services to customers in an amount that reflects the consideration to which the entity expects to be entitled in exchange for those goods or services. The standard will require: contracts (either written, verbal or implied) to be identified, together with the separate performance obligations within the contract; determine the transaction price, adjusted for the time value of money excluding credit risk; allocation of the transaction price to the separate performance obligations on a basis of relative stand-alone selling price of each distinct good or service, or estimation approach if no distinct observable prices exist; and recognition of revenue when each performance obligation is satisfied. Credit risk will be presented separately as an expense rather than adjusted to revenue. For goods, the performance obligation would be satisfied when the customer obtains control of the goods. For services, the performance obligation is satisfied when the service has been provided, typically for promises to transfer services to customers. For performance obligations satisfied over time, an entity would select an appropriate measure of progress to determine how much revenue should be recognised as the performance obligation is satisfied. Contracts with customers will be presented in an entity’s statement of financial position as a contract liability, a contract asset, or a receivable, depending on the relationship between the entity’s performance and the customer’s payment. Sufficient quantitative and qualitative disclosure is required to enable users to understand the contracts with customers; the significant judgments made in applying the guidance to those contracts; and any assets recognised from the costs to obtain or fulfil a contract with a customer. The consolidated entity will adopt this standard from 1 July 2017 but the impact of its adoption is yet to be assessed by the consolidated entity.
PharmAust Limited and its Controlled Entities
46
For
per
sona
l use
onl
y

SHAREHOLDER INFORMATIONAdditional information required by the Australian Stock Exchange Limited Listing Rules, and not disclosed elsewhere in this report.
SHAREHOLDINGSAt the date of this report two shareholders had lodged substantial shareholder notices with the Company.
a) Professor David Morris is a substantial shareholder holding a relevant interest in 177,214,206 shares representing 9.63% of the voting power.
b) Dr Roger Aston is a substantial shareholder holding a relevant interest in 105,282,951 shares representing 5.72% of the voting power.
CLASS OF SHARES AND VOTING RIGHTSThe voting rights attached to the Fully Paid Ordinary shares of the Company are:
(a) at a meeting of members or classes of members each member entitled to vote may vote in person or by proxy or by attorney; and
(b) on a show of hands every person present who is a member has one vote, and on a poll every person present in person or by proxy or attorney has one vote for each ordinary share held.
There are no voting rights attached to any Options on issue.
ORDINARY FULLY PAID SHARES (TOTAL) As of 21 August 2015Range of Units Snapshot Composition: ES1, ORD
Range Total holders Units % of Issued Capital
1 - 1,000. 45 9,254 0.00
1,001 - 5,000. 68 261,869 0.01
5,001 - 10,000. 36 303,340 0.02
10,001 - 100,000. 522 30,356,137 1.65
100,001 - 9,999,999,999. 918 1,809,076,006 98.32
Rounding 0.00
Total 1,589 1,840,006,606 100.00
Unmarketable Parcels
Minimum Parcel Size Holders Units
Minimum $500.00 parcel at $0.0080 per unit 62,500 458 12,218,954
LISTED OPTIONS EXPIRE 31/08/15 @ $0.02 As of 21 August 2015Range of Units Snapshot Composition: OP1, OPT
Range Total holders Units % of Issued Capital
1 - 1,000. 0 0 0.00
1,001 - 5,000. 1 4,407 0.00
5,001 - 10,000. 0 0 0.00
10,001 - 100,000. 11 664,500 0.48
100,001 - 9,999,999,999. 109 138,831,095 99.52
Rounding 0.00
Total 121 139,500,002 100.00
There is no current on-market buy back taking place.
During the reporting period the Company used its cash and assets in a manner consistent with its business objectives.
2015 Annual Report & Statutory Financial Statements
47
For
per
sona
l use
onl
y

TWENTY LARGEST SHAREHOLDERS (as at 21 Aug 2015)
Rank Name Units % of Units
1. PROFESSOR DAVID LAWSON MORRIS 173,116,590 9.412. DR ROGER ASTON 104,282,951 5.673. PERSHING AUSTRALIA NOMINEES PTY LTD <BLUE OCEAN EQUITIES A/C> 101,646,496 5.524. MYALL RESOURCES PTY LTD <MYALL GROUP SUPER FUND A/C> 86,000,000 4.675. ONMELL PTY LTD <ONM BPSF A/C> 57,556,052 3.136. LONGBOW CROFT CAPITAL PTY LTD 52,571,824 2.867. ZACHARIAH INVESTMENTS PTY LTD <M A W FAMILY A/C> 44,000,000 2.398. ABN AMRO CLEARING SYDNEY NOMINEES PTY LTD <CUSTODIAN A/C> 34,741,150 1.899. DR PAUL ANTHONY PORTER + DR TI-WAN NG <PORTER FAMILY A/C> 34,634,099 1.88
10. MR GRAHAM JAMES DARCY + MRS LYNNE CHRISTINE DARCY 27,000,000 1.4711. WEBINVEST PTY LTD <OLSB UNIT A/C> 26,495,749 1.4412. MR ZHONGSHI WU 25,000,000 1.3613. MR GREGORY PAUL YEATMAN 25,000,000 1.3614. OMNIOFFICES PTY LIMITED 24,712,305 1.3415. MR GERALD JAMES VAN BLOMMESTEIN + MRS GILLIAN VAN BLOMMESTEIN 23,735,705 1.2916. GRANDLODGE PTY LTD 19,108,280 1.0417. DASH CORP PTY LIMITED <DASH UNIT A/C> 15,923,566 0.8718. DEPOFO PTY LTD <ORDINARY A/C> 12,754,141 0.6919. LINWIERIK SUPER PTY LTD <LINTON SUPER FUND A/C> 12,738,853 0.6920. PLANE SAILING TRAILS PTY LTD <PST SUPER A/C> 12,602,793 0.68
Totals: Top 20 holders 913,620,554 49.65
Total Remaining Holders Balance 926,386,052 50.35
TWENTY LARGEST OPTIONHOLDERS (as at 21 Aug 2015)
Rank Name Units % of Units
1. FIRST INVESTMENT PARTNERS PTY LTD 19,085,241 13.682. MR STEVEN GARY HIRST 10,333,333 7.413. MR GRANTLAND LLOYD PEARCE <PEARCE FAMILY SUP FUND A/C> 6,000,000 4.304. JYZ SUPER PTY LTD <JYZ INTL P/L SUPER FUND A/C> 5,978,000 4.295. MR EMAD ABDULHADI MALAEKAH 4,000,000 2.876. NTJ INVESTMENTS PTY LTD <NTJ INVESTMENT A/C> 4,000,000 2.877. ELHKAN PTY LTD 3,000,000 2.158. MISS LEONIE JANE AKGOZ 2,500,000 1.799. MR DEVAKA SANATH HATTHOTUWA 2,500,000 1.79
10. TOCAROLY PTY LTD <TOCAROLY SUPER FUND A/C> 2,500,000 1.7911. VASTE DEVELOPMENTS PTY LTD 2,500,000 1.7912. MAGEE HOLDINGS PTY LTD <PLM SUPER FUND A/C> 2,300,000 1.6513. RBM NOMINEES PTY LTD <CASH PROTECTION A/C> 2,062,500 1.4814. MYALL RESOURCES PTY LTD <MYALL GROUP SUPER FUND A/C> 2,025,000 1.4515. MR GEORGE CATSAROS <THE CATSAROS FAMILY A/C> 2,000,000 1.4316. MR ANDREW JAMES MITCHELL + MRS CAROLYN ANNE MITCHELL 2,000,000 1.4317. NABIL GREGE PTY PTD <JAMES GREGE FAMILY A/C> 2,000,000 1.4318. MR RUSSELL WILLIAM OWEN + MR RICHARD STEWART OWEN 2,000,000 1.4319. UBS WEALTH MANAGEMENT AUSTRALIA NOMINEES PTY LTD 1,900,000 1.3620. CHIMAERA CAPITAL LIMITED 1,843,750 1.32
Totals: Top 20 holders 80,527,824 57.73
Total Remaining Holders Balance 58,972,178 42.27
PharmAust Limited and its Controlled Entities
48
For
per
sona
l use
onl
y

2015 Annual Report & Statutory Financial Statements
For
per
sona
l use
onl
y

ABN 35 094 006 023
Suite 7, 29 The Avenue Nedlands,
Western Australia 6009
Tel +61 (8) 9386 4787
Fax +61 (8) 9389 1464
@PharmAust www.PharmAust.comF
or p
erso
nal u
se o
nly


![[Shinobi] Claymore 094](https://static.fdocuments.in/doc/165x107/568c36fd1a28ab02359a1790/shinobi-claymore-094.jpg)