A.BIM.0029 - final report - edited 09-11
35
final rep port Project code: A.BIM.0029 Prepared by: Dr. Gareth M. Forde SEMF Pty Ltd. Date published: September 2010 PUBLISHED BY Meat & Livestock Australia Limited Locked Bag 991 NORTH SYDNEY NSW 2059 Unit costing in multi-product applications Meat & Livestock Australia acknowledges the matching funds provided by the Australian Government and contributions from the Australian Meat Processor Corporation to support the research and development detailed in this publication. This publication is published by Meat & Livestock Australia Limited ABN 39 081 678 364 (MLA). Care is taken to ensure the accuracy of the information contained in this publication. However MLA cannot accept responsibility for the accuracy or completeness of the information or opinions contained in the publication. You should make your own enquiries before making decisions concerning your interests. Reproduction in whole or in part of this publication is prohibited without prior written consent of MLA.
Transcript of A.BIM.0029 - final report - edited 09-11
final reppport
Project code: A.BIM.0029
Prepared by: Dr. Gareth M. Forde
SEMF Pty Ltd.
Date published: September 2010
PUBLISHED BY Meat & Livestock Australia Limited Locked Bag 991 NORTH SYDNEY NSW 2059
Unit costing in multi-product applications
Meat & Livestock Australia acknowledges the matching funds provided by the Australian Government and contributions from the Australian Meat Processor Corporation to support the research and development detailed in this publication.
This publication is published by Meat & Livestock Australia Limited ABN 39 081 678 364 (MLA). Care is taken to ensure the accuracy of the information contained in this publication. However MLA cannot accept responsibility for the accuracy or completeness of the information or opinions contained in the publication. You should make your own enquiries before making decisions concerning your interests. Reproduction in whole or in part of this publication is prohibited without prior written consent of MLA.

A.BIM.0029 - Unit costing in multi-product applications
Page 2 of 35
Executive summary
This report considers the scale-up of a process from laboratory scale to commercial scale for the production of alkaline phosphatase (AP) via the disaggregation and simulation of bovine liver tissue. The main stages of the process are collection, harvesting, chopping, disaggregation, stimulation and purification. However, certain process options are considered where some of these stages are removed, as per the table below. A financial model was developed by estimating the operating and capital expenses associated with the commercial scale process. To achieve this aim, several processing options and assumptions were considered for the manufacture of AP:
Process Major Assumptions
Novel, Non-automated - Yield per batch: 1508 kU AP from 500 g tissue feedstock. - 150 batches per year. - Scaled up version of the small scale laboratory methodology. - Relies heavily on skilled personnel.
Novel, Automated - Yield per batch: 1583 kU AP from 500 g tissue feedstock. - 5% improvement in active units yield per batch - 150 batches per year - Harnesses the use of automated equipment where ever possible to minimise the personnel requirements.
Traditional process - Yield per batch: 447 kU AP from 500 g tissue feedstock.
Generation of a high AP concentration slurry via the novel process
- Yield per batch: 2474 kU AP from 500 g tissue feedstock (higher yield due to no losses during purification stage). - Stages of collection and harvest, chopping, disaggregation, and stimulation were modelled. - Automated and non-automated approaches considered. Only data for automated presented as this was more economically viable process. - Slurry sold to a value adder. - Scenario also considered where QA of AP active Units concentration is required.
Facility for purification and QA/QC only of an AP product from the slurry.
- Yield per batch: 1455 kU AP from a 1700 ml slurry containing 2474 kU AP (as per from 500 g tissue feedstock (higher yield due to no losses during purification stage).
Novel, Non- automated, No disaggregation
- Yield per batch: 5914 kU AP from 5000 g tissue feedstock. - 150 batches per year - No disaggregation (mincing only) - No disaggregation results in the same AP activity per ml after stimulation, but the volume of culture is reduced on a per gram of tissue basis by 60.78%
Traditional process at a scale to produce the same units of AP as the “Novel, Non- automated, No disaggregation” process.
- Yield per batch: 5914 kU AP from 17,572 g tissue feedstock. - 150 batches per year. - Starting AP activity is the same as par the novel process. - No disaggregation (mincing only).

A.BIM.0029 - Unit costing in multi-product applications
Page 3 of 35
The scale of all of the above processes was assumed to be 150 batches per year, with each batch utilizing the amount of liver tissue listed. The following table summarizes the economic outcomes of the processes of greatest interest to the MLA, including the total capital investment (cap ex) and annual total production costs (op ex):
Non- automated Novel Process, 0.5
Automated Novel Process, 0.5 kg per batch
Slurry Generation, Automated Novel Process,
Non-automated Novel Process, No disaggregation,
Traditional process, No disaggregation, 17.6 kg per
kg per batch 0.5 kg per 5.0 kg per batch batch batch
Total Capital Investment (cap ex) $ 1.561 mil $2.280 mil $1.323 mil $1.630 mil $1.546 mil
Annual gross product sales
(in 1st
year ofoperation)
$ 3.670 mil $3.853 mil $1.654 mil $14.391 $14.391
Total production costs
(op ex) (1st
year ofoperation)
$ 2.585 mil $2.091 mil $1.238 mil $3.933 mil $5.148 mil
Discounted payback period (DPP)
2.92 years 2.77 years 4.6 years 1.23 years 1.28 years
Net Present Value (NPV)
$7.753 mil $11.265 mil $2.577 mil $130.051 mil $63.043 mil
Internal Rate of Return (IRR)
63% 66% 33% 461% 431%
Value per head over
life of plant (NPV / 144,000 head per annum for 10 years)
$5.38 / head $7.82 / head $1.79 / head $90.50 / head $43.78 / head
Value per head marginal additional gross revenue in 1st year only
$7.53 / head $12.24 / head $2.88 / head $72.62 / head $64.19 / head
Using this model as a basis, the traditional process (non-automated) resulted in a DPP of 7.7 years. In order for the traditional process (non-automated) to deliver a DPP of 3 years, the net annual sales would need to be increased to $1.744 mil pa, which represents a 60% increase in the AP yield per batch.
A sensitivity analysis was performed for the automated novel process. For the six key parameters modelled, the order of highest to lowest sensitivity on the discounted payback period were: Value of AP product, AP yield per batch, Batches per year (all three parameters of equal importance), Total Capital Investment (cap ex), Total production costs (op ex), then Labour costs.
The major errors in this model are associated with the market value that AP can be sold at, The report also provides a market review of AP, process flow diagrams, considerations of a value adder, recommendations for process improvements and identification of barriers to adoption.

A.BIM.0029 - Unit costing in multi-product applications
Page 4 of 35
Contents
Page
1 Alkaline phospatase (AP) - molecular information ..... 6
2 AP market price analysis ............................................... 7
2.1 Time Analysis of AP Market Value .............................................................. 7 2.2 Other Suppliers ............................................................................................. 9 2.3 Future Market Price Threats for Bovine Sourced AP ............................... 11
3 Documentation of existing facilities and unit operations .................................................................... 12
3.1 Site Visit ...................................................................................................... 12 3.2 Findings from the Site Visit ....................................................................... 12
3.2.1 Technical and economic ............................................................................... 12
3.2.2 Process Flow Diagrams ................................................................................ 12
3.2.3 Major Bottleneck: Disaggregation ................................................................. 12
3.2.4 Intellectual Property (IP) ............................................................................... 13
3.2.5 Lab visit ........................................................................................................ 13
4 Process flow diagrams ................................................ 20
5 Process economics model – novel process .............. 23
5.1 Introduction ................................................................................................. 23 5.2 Yields – Batch Basis ................................................................................... 23 5.3 Labour ......................................................................................................... 24 5.4 Results of Financial Analysis .................................................................... 25
6 Scale up to 5.0 kg per batch for novel process ......... 27
7 Estimated sale price of the ‘slurry’ to a value adder 28
7.1 Results of modelling of slurry production ................................................ 28 7.2 Benefits to the value adder by purchasing slurry produced by the novel
process ....................................................................................................... 29
8 Sensitivity analysis ...................................................... 30
8.1 500 g scale .................................................................................................. 30 8.2 Large scale Sensitivity Analysis – Non-Automated and No
Disaggregation for a 500 g batch ............................................................. 31
9 Results on a per heads basis ...................................... 32
10 Discussion of value adder undertaking entire process33

A.BIM.0029 - Unit costing in multi-product applications
Page 5 of 35
11 Recommendations for process improvements and
identification of barriers to adoption ......................... 34
11.1 Process Improvements .............................................................................. 34
11.2 Barriers to adoption ................................................................................... 34

A.BIM.0029 - Unit costing in multi-product applications
Page 6 of 35
1 Alkaline phospatase (AP) - molecular information
Alkaline phosphatase (AP) is a hydrolase enzyme which catalyses the dephosphorylation (removal of phosphate groups) from biomolecules such as nucleotides, proteins, and alkaloids. AP has a reported molecular mass of 58 – 69 kDa. AP is most effective in an alkaline environment with the optimal pH for bovine enzyme being pH 8.5.
AP is a useful tool in molecular biology laboratories - removing phosphate groups on the 5' end of DNA (ensures that the DNA molecules are kept linear thereby preventing ligation until the next step of the process), radio labelling (replacement by radioactive phosphate groups in order to measure the presence of the labelled DNA) and enzyme immunoassays. AP can then be denatured at high temperatures which means that a difficult clean up stage is not required. Specific laboratory molecular biology uses include:
1. Dephosphorylation of DNA prior to cloning.2. PCR Clean-Up for sequencing and SNP applications.3. Dephosphorylation of DNA prior to end-labelling using T4 PNK or OptiKinase4. Dephosphorylation of RNA.5. Protein dephosphorylation.
Figure 1: Three dimension computer generated representation of alkaline phosphatase (AP).

A.BIM.0029 - Unit costing in multi-product applications
Page 7 of 35
2 AP market price analysis
2.1 Time Analysis of AP Market Value
The data in the following tables was sourced from historical catalogues of Sigma Life Sciences (PO Box 970 Castle Hill NSW 1765) from Dr Gareth Forde’s library.
Product Information Date Value
AP from bovine
intestinal mucosa
Cat # P6774-50KU. 3.0 M NaCl
buffered aqueous solution containing 1 mM MgCl2, 0.1 mM ZnCl2, 30 mM triethanolamine, pH 7.6. Affinity Purified. Store at 2-8
oC.
FY06-07 $1295.40 for 50,000
units
“ “ FY08-09 $1347.00 for 50,000 units
“ “ FY09-10 $1,529.55 for 50,000 units
“ “ FY10-11 $1,622.40 for 50,000 units
Product Information Date Value
AP from bovine liver
Cat # P7034-25MG 10 units / mg protein in glycine buffer. Lyophilized powder. Store at -20
oC.
FY06-07 $627.30 for 250 units
“ “ FY08-09 $592.00 for 250 units
“ “ FY09-10 $829.15 for 250 units
“ “ FY10-11 $878.80 for 250 units
Product Information Date Value
AP from bovine kidney
Cat # P4653-1KU Lyophilized powder containing Tris-citrate buffer salts.
FY06-07 $583.10 for 1000 units
“ “ FY08-09 $606.50 for 1000 units
“ “ FY09-10 $771.47 for 1000 units
“ “ FY10-11 $817.44 for 1000 units

A.BIM.0029 - Unit costing in multi-product applications
Page 8 of 35
Figure 2: Change in AP value over time (Sigma-Aldrich).
The table below provides the results of an analysis of the percentage increase (compound) of each AP product for the years available.
Product Compound increase in value
FY06-07 to FY10-11
AP from bovine intestinal mucosa 5.80%
AP from bovine liver 8.79%
AP from bovine kidney 8.81%
For the financial analysis, the most conservative (i.e. lowest) market value and value increase was assumed, hence the data for AP from bovine intestinal mucosa was employed throughout this project. This is equivalent to $0.032 / Unit. For the economic analysis, a value of $0.0162 / Unit was assumed for bulk purified AP, which allows for a 100% mark-up of the AP product by the retailer to arrive at a market rate of $0.032 / Unit. $0.0162 / Unit was also the lowest reported market price for AP (Worthington Biochemical Corporation, 730 Vassar Ave., Lakewood, NJ, USA).
The percentage increase in the market value for AP from bovine intestinal mucosa as per the table above was used in the economic modeling of future AP values, as outlined in the pertinent sections of the report below.

A.BIM.0029 - Unit costing in multi-product applications
Page 9 of 35
2.2 Other Suppliers
Company: USB / Affimetrix
Location: 6838 Flanders Drive, San Diego, CA 92121-2904 USA
Product Details Information Date Value $AUS/U
Shrimp Alkaline Phosphatase, Recombinant (rSAP).
Molecular Weight: Monomer 55 kDa. Optimum pH: 10.4 in glycine buffer and pH 8.0 in Tris buffer. Optimum Temperature: 37°C Heat-Inactivation: 65°C for 15 min. Inhibitors: 10mM DTT,
0.1% -ME
Reaction Conditions: Active in NaCl, KCl. Requires Mg2+ for highest activity.
30/08/2010
$US419.00
for 5000 units.
0.0838
Company: New England Biolabs Location: 240 County Road, Ipswich, MA, USA 01938-2723
Product Details Information Date Value $AUS/U
AP from calf intestine
Cat # M0290S. 10 mM Tris-HCl, 50 mM KCl, 1 mM MgCl2,
0.1 mM ZnCl2, 50% Glycerol, pH 8.2 MW: 69 kDa. Store at -20 oC. 3,500 units/mg.
8/07/2010
$US244 for
5000 units.
0.054
Company: Worthington Biochemical Corporation
Location: 730 Vassar Ave., Lakewood, NJ 08701.
Product Details Information Date Value $AUS/U
AP from calf intestine
Cat # LS004228.
Chromatographically purified, EIA grade. A solution in 50% glycerol containing 5mM MgCl2 and 0.12mM ZnCl2. Protein concentration is approximately 20 mg/ml. MW: 140,000 g/mol. Store at 2-8
oC.
>3000 U / mg in DEA, 37°C, pH9.8.
8/07/2010
$US52.00 for 1mg. ≥3,000
units / 1mg
0.0193
AP from calf intestine
8/07/2010
$US218.00 for 5mg. ≥3,000
units / 1mg
0.0162
Note: This AP is not affinity purified (more expensive) but is chromatographically purified. Worthington Biochemical Corporation also supply AP from E.coli and chicken sources however these sources are more expensive – lowest costs are $0.65 / U from E.coli and for chicken is $0.018 / U.

A.BIM.0029 - Unit costing in multi-product applications
Page 10 of 35
Company: Promega Location: Promega Corporation, 2800 Woods Hollow Road, Madison, WI 53711 USA.
Product Details Information Date Value $AUS/U
AP from shrimp Cat # M8201. 25mM Tris- HCl (pH 7.6 at 4°C), 1mM MgCl2, 0.1mM ZnCl2 and 50% (v/v) glycerol. Store
at -20 oC.
30/08/2010
$AUS119
for 500 units.
0.238
AP, Calf Intestinal Cat # M1821. 20 U / ul. 10mM Tris-HCl (pH 8.0), 1mM MgCl2, 0.1mM ZnCl2, 50mM KCl, 50% (v/v)
glycerol. Store at -20 oC.
30/08/2010
$AUS107 for 1000
units.
0.107
Company: Scripps Laboratories Location: 6838 Flanders Drive, San Diego, CA 92121-2904 USA
Product Details Information Date Value $AUS/U
Source not provided.
Product: Alkaline Phosphatase, ≥ 2,000 units/mg - Cat. A0426; P/N 90378.
30/08/2010
Pricing data not provided.
Pricing data not provided.

A.BIM.0029 - Unit costing in multi-product applications
Page 11 of 35
2.3 Future Market Price Threats for Bovine Sourced AP
The industrial processing history of a bio-molecule often follows a similar developmental trend:
1. The active molecule is extracted from the “native” (animal / plant) source. Scales are low, costs are high and reproducibility is poor.
2. The purification process is optimized and improved (faster processing times and less unit operations) thereby lowering the costs.
3. The DNA sequence for the bio-molecule is determined, then cloned in a vector then produced in an expression system (e.g. yeast, E.coli) to generate a “recombinant” bio- molecule. The “native” bio-molecule maintains a cost advantage during development of the recombinant bio-molecule and a natural resistance to change by consumers.
4. Eventually, through process optimization and/or supply limitations for sources of the native molecule, the cost for the recombinant molecule is driven sufficiently low to capture the majority of the market share. Improvements to further over-express the target molecule and maintain activity.
5. A niche market remains for native bio-molecule with the majority of demand met with the recombinant molecule which can be produced at much lower costs.
6. This industrial processing history could well be repeated for AP except for the fact that there is an over-supply of bovine tissue for the production of AP and a limited demand. Hence, recombinant AP is more routinely used in areas where there are supply limitations i.e. AP from specific species. It is likely that eventually recombinant AP will be able to be produced much more cheaply than native AP.
USB / Affimetrix are already heavily marketing their recombinant AP in the following ways:
Claiming a “world-wide sourcing limitation”, Affimetrix is transitioning from native shrimp AP (nSAP) to recombinant SAP (rSAP),
Claiming the price of nSAP will increase, while rSAP will remain comparable.
Offering to simplify the entire validation process for switching to rSAP by supplying a test kit containing three different rSAP lots to compare rSAP to nSAP in assays. Technical assistance provided directly by USB’s R&D group to help throughout the entire process.
Advertising the advantages of rSAP: increased storage stability compared to nSAP (i.e. temperatures lower than 25°C), excellent heat inact ivation to halt reactions when required, larger rSAP lot sizes and better batch-to-batch consistency.
USB currently supplies rSAP at $0.0838 / U which is 2.62 times higher than the lowest rate for nAP offered by Sigma at $0.032 / Unit. RSAP has approximately the same specific activity as Calf Intestinal Alkaline Phosphatase (CIAP), and like CIAP, is active in virtually all restriction enzyme reaction buffers. Unlike CIAP, rShrimp Alkaline Phosphatase is completely and irreversibly inactivated by heating reactions at 65°C for 15 min.

A.BIM.0029 - Unit costing in multi-product applications
Page 12 of 35
3 Documentation of existing facilities and unit operations
3.1 Site Visit
A site visit was conduct by Dr Gareth Forde of the “Flinders Centre for Marine Bioprocessing and Bioproducts (FCMB2)”, Molecular Bioprocessing and Bioproducts Engineering Laboratory, School of Medicine, Flinders University, Bedford Park, Adelaide.
A workshop was held to discuss a number of items including: general background of the technology, the aims of the MLA brief for this specific project, the frame work for completing the economic process modelling for producing AP via the disaggregation and simulation of bovine liver, and clarification of data required for the economic modeling that was unclear.
3.2 Findings from the Site Visit
3.2.1 Technical and economic
The major technical findings from the workshop are summarized within the data entered into the Excel spreadsheet models, aspects of which are summarized in the following sections. The greatest time was spent on determining the staffing / personnel levels required for running a facility capable of processing 150 batches per year.
3.2.2 Process Flow Diagrams
The group was satisfied that the Process Flow Diagrams (PFDs) captured the elements of the processes. It was mentioned that it could be considered how the cell centrifugation and resuspension stages are represented as to whether these stages could be further clarified. This review has now taken place.
3.2.3 Major Bottleneck: Disaggregation
The main bottleneck for the process is the disaggregation stage which requires multiple rinsing / disaggregation / centrifugation stages that are labour intensive, require an expert technician to run and require expensive and specialised equipment. These stages would be difficult to scale up and automate due to the specialist nature of the work and the highly shear sensitive nature of the cells. At each stage, the cells are spun down and the skilled scientist makes a decision as to where the tissue, supernatant and red blood cell fractions are to be separated.
A technology that could automate this stage whilst ensuring that the tissue cells are not lysed prematurely is an automated robotic blood fractionation (ABF) system, such as from RTS Life Science (Manchester, U.K.), for which a verbal quote of $AUS180,000 was received (this figure was used in the economic modelling). Another suitable cellular separation suitable is available from JK Enterprises, for which a quote of $AUS 117,258 was received. A system than can separate red blood cells should be able to also separate liver cells. Whole blood fractionation, as per the disaggregation stages, is a time consuming process when undertaken manually and blood samples are highly variable in nature making automation extremely difficult. Use of high speed imaging systems (e.g. light absorption) enables each individual sample to be processed and fractionated individually. This information is linked to the input containers’ barcode and stored on a central database. The stored fraction heights are used to calculate the volume of each fraction using the known collection vessel dimensions. This information is used by the liquid

A.BIM.0029 - Unit costing in multi-product applications
Page 13 of 35
handling system to accurately aspirate off each fraction; before dispensing into cryovials in user specified aliquots for storage or downstream processing.
The other stages all pose a similar level of risk of process bottlenecks. However, these other stages can be more easily overcome than the disaggregation stage by simply having parallel operations of each stage.
Figure 3: Automated robotic blood fractionation (ABF) system, such as from RTS Life Science
(Manchester, U.K.).
3.2.4 Intellectual Property (IP)
The consideration of IP is beyond the scope of the project brief, however it is highly suggested that a clear IP position be formulated around this process as there are a number of institutional and individual stakeholders: MLA, Flinders University, and the academic, postdoctoral and postgraduate researchers.
3.2.5 Lab visit
A lab visit was undertaken, the images of which appear in the next section. The lab was found to be well equipped and highly suited to undertaking the research. Production of AP would probably not be able to take place in the laboratory as the shared equipment and utilities environment means that maintaining Good Manufacturing Practices (GMP) would be almost impossible. It was recommended that if production were to take place, that suitable facilities would need to be constructed or leased.

A.BIM.0029 - Unit costing in multi-product applications
Page 14 of 35
Figure 4: Medium scale bench-top centrifuge.
Figure 5: Rotor bucket for processing 16 x centrifuge tubes simultaneous.

A.BIM.0029 - Unit costing in multi-product applications
Page 15 of 35
Figure 6: Rotor for processing 5 x centrifuge tubes.
Figure 7: 0.2 micron filter for sterilizing liquids.

A.BIM.0029 - Unit costing in multi-product applications
Page 16 of 35
Figure 8: Biological safety cabinet.
Figure 9: Mincer for particularizing tissue
A.BIM.0029 - Unit costing in multi-product applications
Page 17 of 35
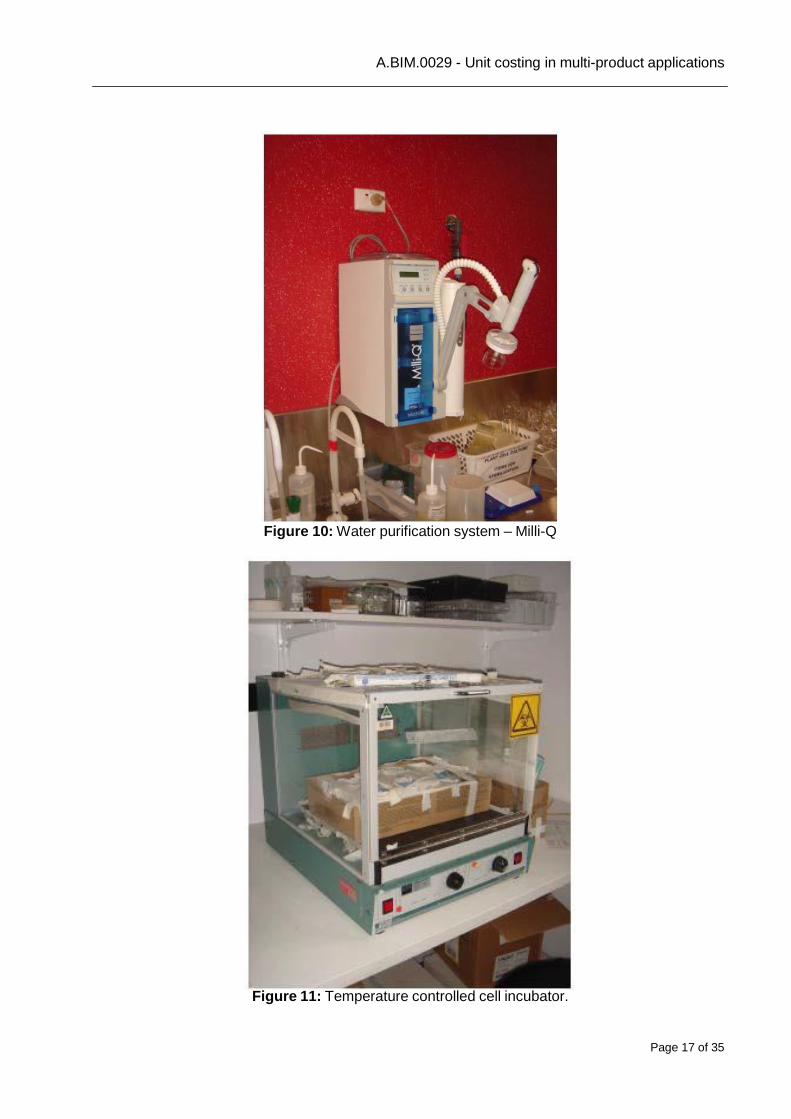
Figure 10: Water purification system – Milli-Q
Figure 11: Temperature controlled cell incubator.

A.BIM.0029 - Unit costing in multi-product applications
Page 18 of 35
Figure 12: Microscope for cell counting (centre) nd vortex for cell re-suspension (left).
Figure 13: Detection Equipment: Biotek uQuant microplate spectrophotometer
for 6, 12, 24, 48,96 and 384 well plates e.g. for ELISA assays of AP activity.

A.BIM.0029 - Unit costing in multi-product applications
Page 19 of 35
Figure 14: Detection Equipment: Shimadzu UV-1201 UV/VIS Spectrophotometer for measuring light absorbance.
Figure 15: Autoclave for sterilizing equipment.

A.BIM.0029 - Unit costing in multi-product applications
Page 20 of 35
4 Process flow diagrams
Process flow diagrams were created in AutoCAD by SEMF’s drafters. Drafts were reviewed by Flinders University to create accurate representations of the novel and traditional processes considered in this report.
Presented on the following pages are: Figure 16: The process flow diagram (PFD) for the novel process as developed by Flinders University.
Figure 17: The process flow diagram (PFD) for a potential traditional approach for direct purification of AP from bovine liver tissue.

Unit costing in multi-product applications
Page 21 o
f 35

Unit costing in multi-product applications
Page 22 of 35

Unit costing in multi-product applications
Page 23 of 35
5 Process economics model – novel process
5.1 Introduction
A full process economic model was developed for a production facility capable of running 150 batches of material per annum. The base model was a novel and non-automated process to produce AP, which is the most similar scenario to how AP is currently produced at Flinders University. The other scenarios of novel / automated, traditional, slurry and purification / QA were derived by altering the base model. Appropriate changes were made as indicated in the following sections. It was assumed that the net yield of AP units is increased by 5% via the use of an automated system due to lower losses, higher yields and faster processing times which facilitates maintenance of the AP activity.
5.2 Yields – Batch Basis
The following information was agreed upon as being the basis for the analysis:
Stage
Day
Time (hrs) Total Yield (U / batch)
Volumetric Yield (U / ml)
1 Collection & Harvest 1 0.50 2 Chopping 1 4.00 3 Disaggregation 2 4.33 706920.00 411.00
4 Stimulation - 24 hr 2 24.00 2383920.00 1386.00
5 Purification 3 8.00 1525708.80 887.04
6 QC, OH&S 0.5 4.00 TOTAL: Non-automated 44.83 1525708.80 887.04
The following table details the data, assumptions and calculations for determining the scale of the operations:
Parameter Value Units
Batches per annum 150 Batches pa
Batches per week 3 Batches per week
Starting mass of tissue 800 g wet weight
Disaggregation mass of tissue 500 g wet weight
Final volume liquid per batch 6640 ml at the end of dis-aggregation.
Total volume crude 1700 ml
Final mass protein per batch 30 g
Dr Julian Adams Estimate 235.62 mg AP per batch non-automated
247.4 mg AP per batch automated
One of the most important pieces of data for determining the scale of the purification / chromatography process is know the total mass of AP protein that is available for purification out of the total protein mass and at what concentration. A protein concentration of 20% w/w dry mass is assumed (http://www.nutritiondata.com/facts/beef-products/3468/2 - Beef, variety meats and by-products, liver, raw) at a moisture content of 70% (or 30% w/w solids).

Unit costing in multi-product applications
Page 24 of 35
It is postulated that the automated process provides the opportunity for producing up to 4 batches per week without the need for additional capital expenditure (208 batches per annum) however further development work with equipment suppliers is required to confirm that this level of production is possible.
5.3 Labour
Labour is the major component and a recurring expense (as high as 51% for the non-automated process). Hence, due consideration must be given to accurate staffing levels for the project. In the tables below “Tech” is an abbreviation for technician.
INDIRECT LABOUR NUMBER BASE SALARY,
AUS $ ANNUAL SALARY WITH 20% ADD-ON (Super etc)
Managing Director 0.2 108,000.00 25920
Sales Manager 1 97,200.00 116,640
Accountant 0.2 64,800.00 15552
Secretary 0.2 43,200.00 10368
Production Manager 1 115200 138,240
Sub-total 1.6 313,200.00 306,720
Direct labour cost estimation: Non-automated DIRECT LABOUR HOURLY
RATE NUMBER BASE SALARY,
AUS $ ANNUAL SALARY WITH 20% ADD-ON (Super etc)
1. Tech - Collection & Harvest 25 0.25 48000 14,400
2. Chopping 25 0.25 48000 14,400
3. Tech: Disaggregation 50 4 96000 460,800
4. Tech: Stimulation 50 2 96000 230,400
5. Tech: Purification 50 2 96000 230,400
6. QC personnel 50 1 96000 115,200
Sub-total 12.1 1,065,600
Direct labour cost estimation: Automated
TOTAL per annum 1,372,320
DIRECT LABOUR HOURLY RATE
NUMBER BASE SALARY, AUS $
ANNUAL SALARY WITH 20% ADD-ON (Super etc)
1. Tech - Collection & Harvest 25 0.25 48000 14,400
2. Chopping (cleaning) 25 0.25 48000 14,400
3. Tech: Dis-ag (Automated) 50 1.1 96000 126,720
4. Tech: Stimulation (Wave reactor)
50 1.1 96000
126,720
5. Tech: Purification 50 2 96000 230,400
6. QC personnel 50 1 96000 115,200
Sub-total 8.3 627,840
TOTAL per annum 934,560

Unit costing in multi-product applications
Page 25 of 35
5.4 Results of Financial Analysis
The sections below provide a graphical output of the delivered equipment capital costs and direct operational costs (laboratory expenses and labour costs) in order to provide an indicative comparison of which of the stages contributes the most to the cap ex and op ex of the process. These graphs do not present the total capital investment (cap ex) and annual total production costs (op ex) – this data is presented in Section 10 below.
Figure 18: Labour and Direct Laboratory Op Ex, and Delivered Equipment Cap Ex Graphical Results – Non-automated

Page 26 of 35
Unit costing in multi-product applications
Figure 19: Labour and Direct Laboratory Op Ex, and Delivered Equipment Cap Ex Graphical Results - Automated

Page 27 of 35
Unit costing in multi-product applications
Sample of Out-puts: Financial Analysis: Non-Automated
The following analysis assumes a plant life of 10 years and an interest rate of 6%.
Direct labour cost estimation: Non-Automated
6 Scale up to 5.0 kg per batch for novel process
The following section outlines the results of modelling a scale-up to 5000 g of tissue per batch. The major changes to the model were:
Small culture produced per g of tissue, however more culture volume per batch (6667 ml
compared to 1700 ml),
Increase in labour requirements (+0.25 for each of collection and chopping, +1.0 for each of stimulation and purification; disaggregation staff then used as rinsing staff). - Larger wave reactor and bag system (for processing 5 – 22 L).
There is minimal need for considering the automated scenario as the disaggregation step is removed.
Compared to the smaller scale system, a more modest initial AP concentration is assumed (60.8% lower).
After calculation that the annual AP production would be 887 million U pa, the system was scaled for a traditional process with the same AP activity in the initial tissue feedstock and producing the same gross amount of AP, to arrive at a feedstock requirement of 17,572 g of tissue. This is approximately the amount of tissue that can be obtained from 35 head of cattle.

Page 28 of 35
Unit costing in multi-product applications
7 Estimated sale price of the ‘slurry’ to a value adder
7.1 Results of modelling of slurry production
The following section outlines the calculation to estimate the sale price of the post-stimulation slurry generated via the novel and automated process. In order to complete this analysis, a model was firstly created for a business that only completed the two stages of purification and QA/QC. Using the “base case” of novel and automated, op ex and cap ex associated with the stages of Collection & Harvest, Chopping, Disaggregation and Stimulation were removed with associated reduction in labour, and building surface areas. If the slurry is provided at no cost, then the discounted payback period (DPP) would be 1.53 years, with a NPV of $17.5 mil and an IRR of 207%.
However, to determine an estimated sale price, a simulation was run to determine the maximum price that this business would be willing to pay to yield a DPP of 3 years. The model showed that $10,104 could be paid per batch of post-stimulation slurry, delivering a NPV of $5.6 mil and an IRR of 64%. The cap ex would be $0.953 mil with an initial total annual production cost of $3.244 mil and revenue in the first year of $3.853 mil. Out of interest, a scenario was run assuming that a value adder had already invested and depreciated all of the capital to conduct purifications (with the main costs then being labour, operating expenses, purchase of feed stock and a 5% maintenance allowance on existing fixed capital equipment), to provide a 100% return on the total annual production costs, the slurry could be purchased for as low as $3604 per batch and at a value of $6772 for a 50% return. For the same scenario, the breakeven slurry cost is $13,108 / batch (i.e. where annual gross sales equal annual total production costs).
Using this information, a second model was then run to determine the financial results for a process for Collection & Harvesting, Chopping, Disaggregation and Stimulation only that can sell the slurry at the calculated value of $11,025 per batch. Changes to the financial model were: reductions in indirect labour costs and removal of direct costs for purification and QA/QC, and reduction of the surface area of the buildings. The results showed a capital outlay of $1.323 mil, a DPP of 3.8 years, a NPV of $3.665 mil and an IRR of 43%.
Where the purchaser of the slurry demands some rudimentary QA/QC (i.e. unit concentration via spectrophotometric assay) of the slurry be performed, then additional costs include a micro- centrifuge, spectrophotometer, some associated consumables and 10% of a full time equivalent. The results showed a capital outlay of $1.343 mil, a DPP of 3.9 years, a NPV of $3.526 mil and an IRR of 41%.
For the generator of the slurry via a novel automated process to realize a DPP of 3 years, each slurry batch would need to be sold for $12,956 thereby providing annual revenue of $1.943 mil pa. For the generator of the slurry via a traditional non-automated process to realize a DPP of 3 years, each slurry batch would need to be sold for $9309 thereby providing annual revenue of $1.396 mil pa. However, as the traditional process only yields 28.2% of the AP units per batch compared to the novel batch, the actual batch cost to the value adder (when scaled to same AP units as per the novel system) is $32,961, which is 2.54 times the cost of the novel automated slurry on a per unit AP basis.

Page 29 of 35
Unit costing in multi-product applications
7.2 Benefits to the value adder by purchasing slurry produced by the novel process
A value adder will realize the following advantages in purchasing a slurry produced by the novel and automated process and purifying it versus using the traditional process of manufacturing the same bioactive:
The value adder will not bear the financial risk of investing in the facility to generate the
slurry.
The value adder will not bear the research and development costs required to create a commercial process for generating the slurry.
As the modelling above shows, the most economically viable process for a new facility is to use the novel automated process. For a new build, a unit of AP can be provided at 39% of the cost of a traditional process.
The specific yield (g AP / g total material) will be increased from 0.23% to 0.79%.
An increased specific yield results in greatly reduced processing costs by reducing the volumes of material that need to be processed to manufacture the same amount of material. This is achieved by reducing the net chromatography volumes (hence less buffer and cleaning), reduced resin costs, and faster processing times.
Increased specific yields also reduce the comparative amount of contaminant, which means that less elution and washing of contaminants is required and can yield a higher quality product.
The ultimate goal of a high specific yield is to facilitate drastic improvements in the downstream processing requirements, for example replacing 3 purification stages (e.g. affinity, ion exchange, size exclusion) with two or a single purification stage, thereby reducing downstream processing costs by 30 to 70%.
Faster processing times leads to higher protein (i.e. AP) activity as the protein can be processed and stored more quickly thereby reducing the chance that the protein is denatured, hence a higher quality product can be achieved.
The amount of AP per batch will be increased from 69.87 mg AP (698,700 units) to 235.62 mg (2,356,200 units). Hence, less batches will need to be generated which reduces transportation costs.
It is possible that this novel process could provide a more consistent feedstock for the downstream purification process, thereby delivering a more reliable feedstock.
Potential disadvantages of the novel process include:
The need to adjust / vary / re-develop the chromatography, vialing and QA/QC processes
to handle the new feedstock.
If the AP concentration is too high, then the protein can aggregate during the processing, hence attention will need to be paid to the aggregation concentration of AP and associated processing and storing buffers.
The higher cap ex and op ex of the novel process increases the financial risk of the business unit.

Unit costing in multi-product applications
8 Sensitivity analysis
8.1 500 g scale
The key parameters which have the greatest variability have been modelled to determine which parameter has the greatest impact on the discounted payback period. The table below shows the results for the discounted payback period for various percentage variations in the key parameter as indicated (+ and – 70, 50, 10, 5 and 1%). There is a direct linear correlation with revenue for the parameters of value of AP product (i.e. sale price of the bulk AP product), AP yield per batch and batches per year, hence the results are the same for the same percentage variation.
The figure below is a plot of the results in the above table. The sharper the gradient of the trend line, the greater the influence on the discounted payback period. Hence, this plot clearly shows the drastic influence that the AP value & yield has on the economic viability of the process.
Figure 21: Sensitivity analysis of the discounted payback period for the novel and automated process
Page 30 of 35
31

Unit costing in multi-product applications
Page 31 of 35
As can be seen in the above table and plot, any parameter which affects the annual gross product sales in a direct linear manner (value of product per unit, yield per batch, batches per year) has the greatest effect on the pay back period. The table below shows the acceptable variation in the parameter until the 3 year discounted payback period threshold is exceeded. The parameter which has the greatest influence, AP value /yield, may only drop by 10.8% before the discounted payback period exceeds 3 years. Labour, having the least influence, can increase by 41.1% before a three year DPP is exceeded.
Parameter % Variation to reach 3 year
Discounted Payback Threshold
Value of AP product $/U AP yield per batch (U/batch) Batches per year
-10.8%
Total Capital Investment (cap ex)
+23.6%
Total production costs (op ex)
+22.7%
Labour costs
+41.1%
8.2 Large scale Sensitivity Analysis – Non-Automated and No Disaggregation for a 500 g batch
As per the smaller scale, the parameter which has the greatest influence is AP value/yield, followed by Total Capital, then Total Production Costs then labour.

Unit costing in multi-product applications
Page 32 of 35
9 Results on a per heads basis
Assuming that an average bovine liver weighs 1.40 kg, a single cow is assumed to be able to provide sufficient tissue (800 g) for a single batch. Assuming 150 batches per year and a plant life of 10 years, 1500 bovine livers can be processed over the plant life. Hence, to determine the value per head of actual animals used, the NPV is divided by 1500. However, a more useful analysis is to divide the NPV by the entire number of cattle processed by the abattoir at large over a 10 year period to arrive at a net value per head for the entire facility. An estimate of 144,000 head per annum was provided for an average facility (600 head per day; 240 operational days per annum) which is then multiplied by 10 years (the expected plant life).
From an industry perspective, the figure of interest is on a per head value from an operational perspective (marginal additional gross revenue). To make this calculation, the annual total production costs are subtracted from the annual gross sales, then divided by 144,000 head per annum.

Unit costing in multi-product applications
Page 33 of 35
10 Discussion of value adder undertaking entire process
This section considers the scenario where a value adder purchases the organs and carries out the entire process at their own facility.
A typical licensing arrangement for IP around a biomolecule could be a signing fee of $0 - $250,000 or more upon signing of the agreement, and 1 – 10% of the value of net sales. The figures at the higher end of the scale are for block buster drugs, hence it is likely that licensing fees for the technology described in this report would be at the lower ends of these scales. At the highest end, 10% of net sales for the novel automated process would represent $385,328 pa, whilst 1% of the traditional process has a value of $10,882 pa, with 10% of the novel slurry net sales being $165,375.
A 10% licensing fee on net sales will have the following effects on the financial viability of the process.
Process DPP
(base case) DPP with a
licensing fee of 10% of net sales
10% licensing fee pa.
Novel and Automated
2.6 years
3.0 years
$0.385 mil
Novel and Non- Automated
2.8 years
3.4 years
$0.367 mil
Traditional (Non- Automated)
7.7 years
10.2 years
$0.109 mil
Traditional (Automated)
8.2 years
10.19 years
$0.109 mil
Slurry generation only, novel process
3.8 years
4.6 years
$0.165 mil
Slurry generation with preliminary QA, novel process
3.9 years
4.7 years
$0.165 mil
Purification and QA/QC only
3.0 years
4.6 years
$0.385 mil
The opportunity cost for licensing the technology would be the $12.353 mil of foregone NPV for the Novel and Automated process at the highest level to $0.709 mil of foregone NPV for a traditional (non-automated) process at the bottom level. The value of the tissue for other uses (e.g. protein meal) is a negligible opportunity cost as only 0.1% of the tissue is required in the AP production process as a percentage of the total tissue available in an average facility process of 144,000 head pa.
Unit costing in multi-product applications
11 Recommendations for process improvements and identification of barriers to adoption
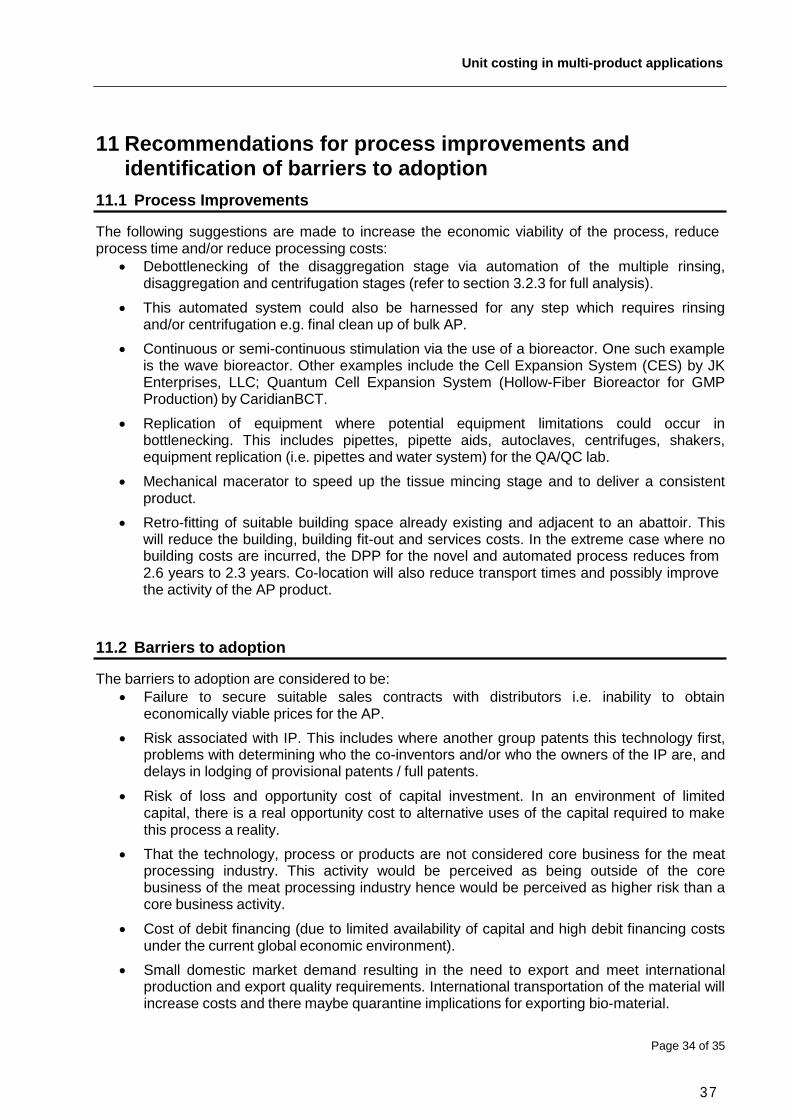
11.1 Process Improvements
The following suggestions are made to increase the economic viability of the process, reduce process time and/or reduce processing costs:
Debottlenecking of the disaggregation stage via automation of the multiple rinsing, disaggregation and centrifugation stages (refer to section 3.2.3 for full analysis).
This automated system could also be harnessed for any step which requires rinsing and/or centrifugation e.g. final clean up of bulk AP.
Continuous or semi-continuous stimulation via the use of a bioreactor. One such example is the wave bioreactor. Other examples include the Cell Expansion System (CES) by JK Enterprises, LLC; Quantum Cell Expansion System (Hollow-Fiber Bioreactor for GMP Production) by CaridianBCT.
Replication of equipment where potential equipment limitations could occur in bottlenecking. This includes pipettes, pipette aids, autoclaves, centrifuges, shakers, equipment replication (i.e. pipettes and water system) for the QA/QC lab.
Mechanical macerator to speed up the tissue mincing stage and to deliver a consistent product.
Retro-fitting of suitable building space already existing and adjacent to an abattoir. This will reduce the building, building fit-out and services costs. In the extreme case where no building costs are incurred, the DPP for the novel and automated process reduces from 2.6 years to 2.3 years. Co-location will also reduce transport times and possibly improve the activity of the AP product.
11.2 Barriers to adoption
The barriers to adoption are considered to be:
Failure to secure suitable sales contracts with distributors i.e. inability to obtain economically viable prices for the AP.
Risk associated with IP. This includes where another group patents this technology first, problems with determining who the co-inventors and/or who the owners of the IP are, and delays in lodging of provisional patents / full patents.
Risk of loss and opportunity cost of capital investment. In an environment of limited capital, there is a real opportunity cost to alternative uses of the capital required to make this process a reality.
That the technology, process or products are not considered core business for the meat processing industry. This activity would be perceived as being outside of the core business of the meat processing industry hence would be perceived as higher risk than a core business activity.
Cost of debit financing (due to limited availability of capital and high debit financing costs under the current global economic environment).
Small domestic market demand resulting in the need to export and meet international production and export quality requirements. International transportation of the material will increase costs and there maybe quarantine implications for exporting bio-material.
Page 34 of 35
37

Unit costing in multi-product applications
Risk of competition from break through technologies and/or competition from copy-cat facilities. These exists the possibility that a break through technology such as recombinant DNA technology or that a copy-cat facility could produce the molecule at a much lower rate, thereby reducing the revenue for this process.
Long lead times until the facility generates cash and has a net positive cash flow. From the time of commencing the design of the facility to the first product sale would be expected to be at least 2 years. This may be an unacceptable high length of time for businesses.
Page 35 of 35