
Aberrations of the Human Eye in Visible and Near...
10
ORIGINAL ARTICLE Aberrations of the Human Eye in Visible and Near Infrared Illumination LOURDES LLORENTE, OD, LUIS DIAZ-SANTANA, PhD, DAVID LARA-SAUCEDO, BSc, and SUSANA MARCOS, PhD Instituto de Óptica “Daza de Valdés”, Consejo Superior de Investigaciones Científicas, Serrano, Madrid, Spain (LL, SM), Applied Vision Research Centre, Department of Optometry and Visual Science, City University, Northhampton Square, London, United Kingdom (LDS), Blackett Laboratory, Imperial College of Science Technology and Medicine, London, United Kingdom (DLS) ABSTRACT: Purpose. In most current aberrometers, near infrared light is used to measure ocular aberrations, whereas in some applications, optical aberration data in the visible range are required. We compared optical aberration measurements using infrared (787 nm) and visible light (543 nm) in a heterogeneous group of subjects to assess whether aberrations are similar in both wavelengths and to estimate experimentally the ocular chromatic focus shift. Methods. Ocular aberrations were measured in near infrared and visible light using two different laboratory-developed systems: laser ray tracing (LRT) and Shack-Hartmann. Measurements were conducted on 36 eyes (25 and 11 eyes, respectively), within a wide range of ages (20 to 71 years), refractive errors (6.00 to 16.50), and optical quality (root mean square wavefront error, excluding defocus, from 0.40 to 9.89 m). In both systems, wave aberrations were computed from the ray aberrations by modal fitting to a Zernike polynomial base (up to seventh order in laser ray tracing and sixth order in Shack-Hartmann). We compared the Zernike coefficients and the root mean square wavefront error corresponding to different terms between infrared and green illumination. Results. A Student’s t-test performed on the Zernike coefficients indicates that defocus was significantly different in all of the subjects but one. Average focus shift found between 787 nm and 543 nm was 0.72 D. A very small percentage of the remaining coefficients was found to be significantly different: 4.7% of the 825 coefficients (25 eyes with 33 terms) for laser ray tracing and 18.2% of the 275 coefficients (11 eyes with 25 terms) for Shack-Hartmann. Astigmatism was statistically different in 8.3% of the eyes, root mean square wavefront error for third-order aberrations in 16.6%, and spherical aberration (Z 4 0 ) in 11.1%. Conclusions. Aerial images captured using infrared and green light showed noticeable differences. Apart from defocus, this did not affect centroid computations because within the variability of the techniques, estimates of aberrations with infrared were equivalent to those measured with green. In normal eyes, the Longitudinal Chromatic Aberration of the Indiana Chromatic Eye Model can predict the defocus term changes measured experimentally, although the intersub- ject variability could not be neglected. The largest deviations from the prediction were found on an aphakic eye and on the oldest subject. (Optom Vis Sci 2003;80:26–35) Key Words: ocular aberrations, Shack-Hartmann, laser ray tracing, near infrared I n the last few years, there has been a renewed interest in the measurement and understanding of the aberrations of the hu- man eye. Along with studies addressing important basic ques- tions on physiological optics (i.e., change of aberrations with ac- commodation, 1, 2 age, 3, 4 retinal eccentricity, 5 refractive error 6, 7 ), clinical applications of aberrometry are rapidly increasing. For ex- ample, it has been shown to be a useful tool in assessing keratoco- nus 8, 9 or corneal transplantation. 10, 11 In particular, aberrometry is of great use in refractive surgery, both as a tool to assess the outcomes of refractive surgery 12–15 and as a guide to optimize ablation algorithms to eventually compensate for the ocular aber- rations. 16 In addition, static 17 or dynamic aberration correc- tion, 18, 19 with great potential for high-resolution ophthalmosco- py, 20 relies on the accurate measurement of aberrations. All aberrometers are based on the common principle of measur- ing the slopes of the wave aberration, either as a light enters the eye (i.e., laser ray tracing, 21, 22 spatially resolved refractometer, 23, 24 Tscherning aberrometer 25 or the crossed-cylinder aberroscope 26 ) or as it emerges from the eye (Shack-Hartmann ocular wavefront sensor 27, 28 ). Apart from the spatially resolved refractometer, 1040-5488/03/8001-0026/0 VOL. 80, NO. 1, PP. 26–35 OPTOMETRY AND VISION SCIENCE Copyright © 2003 American Academy of Optometry Optometry and Vision Science, Vol. 80, No. 1, January 2003
Transcript of Aberrations of the Human Eye in Visible and Near...
ORIGINAL ARTICLE
Aberrations of the Human Eye in Visible andNear Infrared Illumination
LOURDES LLORENTE, OD, LUIS DIAZ-SANTANA, PhD, DAVID LARA-SAUCEDO, BSc, andSUSANA MARCOS, PhD
Instituto de Óptica “Daza de Valdés”, Consejo Superior de Investigaciones Científicas, Serrano, Madrid, Spain (LL, SM), Applied VisionResearch Centre, Department of Optometry and Visual Science, City University, Northhampton Square, London, United Kingdom (LDS),
Blackett Laboratory, Imperial College of Science Technology and Medicine, London, United Kingdom (DLS)
ABSTRACT: Purpose. In most current aberrometers, near infrared light is used to measure ocular aberrations, whereasin some applications, optical aberration data in the visible range are required. We compared optical aberrationmeasurements using infrared (787 nm) and visible light (543 nm) in a heterogeneous group of subjects to assess whetheraberrations are similar in both wavelengths and to estimate experimentally the ocular chromatic focus shift. Methods.Ocular aberrations were measured in near infrared and visible light using two different laboratory-developed systems:laser ray tracing (LRT) and Shack-Hartmann. Measurements were conducted on 36 eyes (25 and 11 eyes, respectively),within a wide range of ages (20 to 71 years), refractive errors (�6.00 to �16.50), and optical quality (root mean squarewavefront error, excluding defocus, from 0.40 to 9.89 �m). In both systems, wave aberrations were computed from theray aberrations by modal fitting to a Zernike polynomial base (up to seventh order in laser ray tracing and sixth orderin Shack-Hartmann). We compared the Zernike coefficients and the root mean square wavefront error correspondingto different terms between infrared and green illumination. Results. A Student’s t-test performed on the Zernikecoefficients indicates that defocus was significantly different in all of the subjects but one. Average focus shift foundbetween 787 nm and 543 nm was 0.72 D. A very small percentage of the remaining coefficients was found to besignificantly different: 4.7% of the 825 coefficients (25 eyes with 33 terms) for laser ray tracing and 18.2% of the 275coefficients (11 eyes with 25 terms) for Shack-Hartmann. Astigmatism was statistically different in 8.3% of the eyes,root mean square wavefront error for third-order aberrations in 16.6%, and spherical aberration (Z4
0) in 11.1%.Conclusions. Aerial images captured using infrared and green light showed noticeable differences. Apart from defocus,this did not affect centroid computations because within the variability of the techniques, estimates of aberrations withinfrared were equivalent to those measured with green. In normal eyes, the Longitudinal Chromatic Aberration of theIndiana Chromatic Eye Model can predict the defocus term changes measured experimentally, although the intersub-ject variability could not be neglected. The largest deviations from the prediction were found on an aphakic eye andon the oldest subject. (Optom Vis Sci 2003;80:26–35)
Key Words: ocular aberrations, Shack-Hartmann, laser ray tracing, near infrared
In the last few years, there has been a renewed interest in themeasurement and understanding of the aberrations of the hu-man eye. Along with studies addressing important basic ques-
tions on physiological optics (i.e., change of aberrations with ac-commodation,1, 2 age,3, 4 retinal eccentricity,5 refractive error6, 7),clinical applications of aberrometry are rapidly increasing. For ex-ample, it has been shown to be a useful tool in assessing keratoco-nus8, 9 or corneal transplantation.10, 11 In particular, aberrometryis of great use in refractive surgery, both as a tool to assess theoutcomes of refractive surgery12–15 and as a guide to optimize
ablation algorithms to eventually compensate for the ocular aber-rations.16 In addition, static17 or dynamic aberration correc-tion,18, 19 with great potential for high-resolution ophthalmosco-py,20 relies on the accurate measurement of aberrations.
All aberrometers are based on the common principle of measur-ing the slopes of the wave aberration, either as a light enters the eye(i.e., laser ray tracing,21, 22 spatially resolved refractometer,23, 24
Tscherning aberrometer25 or the crossed-cylinder aberroscope26)or as it emerges from the eye (Shack-Hartmann ocular wavefrontsensor27, 28). Apart from the spatially resolved refractometer,
1040-5488/03/8001-0026/0 VOL. 80, NO. 1, PP. 26–35OPTOMETRY AND VISION SCIENCECopyright © 2003 American Academy of Optometry
Optometry and Vision Science, Vol. 80, No. 1, January 2003
which is a psychophysical technique (and therefore visible lightmust be used) the rest of these techniques measure the light re-flected by the retina. Most of the currently available wavefront-sensing techniques use infrared (IR) illumination, which has sev-eral advantages over visible light. It is more comfortable for thepatient because the human eye is less sensitive to IR29; pupil dila-tion is not strictly required; the retina reflects a higher percentageof the incident light compared with shorter wavelengths30; andbackscatter by the anterior optics31 is reduced. Dynamic measure-ment of aberrations is then possible using IR illumination32 withnatural accommodation because mydriasis (and its associated cy-cloplegic effects) is not necessary.
Although current aberration measurements are typically donewith IR light, in most applications, data from visible light arerequired. For direct comparison between optical measurements(estimated from the wave aberration) and visual performance weneed to make sure that the results obtained in IR light are equiva-lent to those obtained with visible light. This is particularly impor-tant if the measured wave aberration is planned to be used to guideablation in refractive surgery procedures, where the aim is to im-prove the patient’s visual performance. Knowledge of the defocusshift between IR and visible wavelengths is essential if the resultsare to be used to predict refraction.
Previous measurements of aberrations at different visible wave-lengths using a spatially resolved refractometer showed slight dif-ferences in some aberration terms as a function of wavelength.33
The chromatic difference of focus agreed with previous psycho-physical results from the literature; however, the longitudinal chro-matic aberration (LCA) based on reflectometric double-pass mea-surements34, 35 has been reported to be lower than conventionalpsychophysical estimates. These results prompted us to revisit thequestion of whether reflections at different retinal layers may be thecause for the discrepancy. The following questions hence arise: (1)Are the aberrations measured with IR and green light equivalent?(2) Is the focus difference between IR and green predictable by theLCA (and therefore reasonably predictable across subjects), or canthe relative differences in reflectance and scattering across wave-lengths be affecting the aberration measurements?
There are two previous studies that compare visible and nearinfrared optical quality in the human eye.36, 37 Double-pass mea-surements of modulation transfer functions in IR and green lightappear to be similar. In this previous study, subtraction of back-ground halos (noticeably different between IR and green) was crit-ical.36 The other study used an objective crossed-cylinder aberro-scope to measure aberrations and reported that aberrations arevirtually identical in near IR and green light.37 However, the dataanalysis was mainly qualitative and limited to three eyes.
In this paper, we compare ocular aberrations between near IR(786 nm for laser ray tracing [LRT] and 788 nm for Shack-Hart-mann [SH]) and visible illumination (543 nm) measured with twoobjective techniques, LRT and SH. These are experimental sys-tems developed at Instituto de Optica (CSIC), Madrid, Spain andImperial College, London, UK, respectively, but the conclusionsdrawn here can be extrapolated to recent unrelated commerciallyavailable instruments, based on similar principles. We performedmeasurements on 36 subjects with a wide range of ages, refractions,and ocular conditions (including old and surgical eyes), thus cov-
ering a wide range of aberrations and, potentially, ocular and reti-nal structural differences.
METHODSLaser Ray Tracing
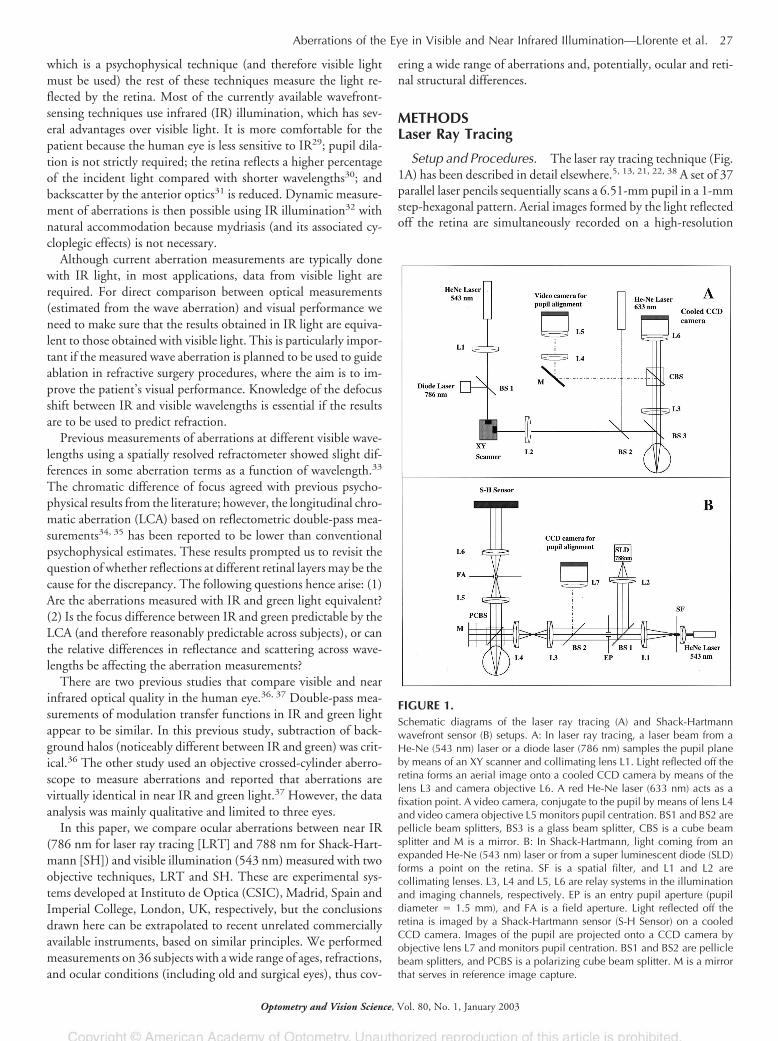
Setup and Procedures. The laser ray tracing technique (Fig.1A) has been described in detail elsewhere.5, 13, 21, 22, 38 A set of 37parallel laser pencils sequentially scans a 6.51-mm pupil in a 1-mmstep-hexagonal pattern. Aerial images formed by the light reflectedoff the retina are simultaneously recorded on a high-resolution
FIGURE 1.Schematic diagrams of the laser ray tracing (A) and Shack-Hartmannwavefront sensor (B) setups. A: In laser ray tracing, a laser beam from aHe-Ne (543 nm) laser or a diode laser (786 nm) samples the pupil planeby means of an XY scanner and collimating lens L1. Light reflected off theretina forms an aerial image onto a cooled CCD camera by means of thelens L3 and camera objective L6. A red He-Ne laser (633 nm) acts as afixation point. A video camera, conjugate to the pupil by means of lens L4and video camera objective L5 monitors pupil centration. BS1 and BS2 arepellicle beam splitters, BS3 is a glass beam splitter, CBS is a cube beamsplitter and M is a mirror. B: In Shack-Hartmann, light coming from anexpanded He-Ne (543 nm) laser or from a super luminescent diode (SLD)forms a point on the retina. SF is a spatial filter, and L1 and L2 arecollimating lenses. L3, L4 and L5, L6 are relay systems in the illuminationand imaging channels, respectively. EP is an entry pupil aperture (pupildiameter � 1.5 mm), and FA is a field aperture. Light reflected off theretina is imaged by a Shack-Hartmann sensor (S-H Sensor) on a cooledCCD camera. Images of the pupil are projected onto a CCD camera byobjective lens L7 and monitors pupil centration. BS1 and BS2 are pelliclebeam splitters, and PCBS is a polarizing cube beam splitter. M is a mirrorthat serves in reference image capture.
Aberrations of the Eye in Visible and Near Infrared Illumination—Llorente et al. 27
Optometry and Vision Science, Vol. 80, No. 1, January 2003
CCD camera. The centroid of each aerial image is estimated. Thedeviations of the centroids from the reference (which is the posi-tion of the centroid corresponding to the chief ray) are propor-tional to the local derivative of the wave aberration. The waveaberration is obtained from the sets of derivatives by means of amodal fitting to the Zernike polynomial basis (through seventhorder). In previous studies using this technique, measurementswere obtained using a 543-nm HeNe laser beam (Melles Griot, 5mW). For this study, light from an IR (786 nm) laser diode cou-pled to an optical fiber (Schäfter � Kirchhoff, 15 mW) was in-serted into the system using a pellicle beam splitter and coalignedto the green beam. Both lasers were attenuated, by means of neu-tral-density filters, and light exposure was at least one order ofmagnitude below safety limits.39
Setting and Control Experiment. Measurements were con-ducted at Instituto de Óptica, CSIC, Madrid, Spain. The systemwas calibrated to verify that it did not introduce chromatic aberra-tion. For this purpose, we placed a calibrated aberrated phaseplate17 in front of a diffraction-limited artificial eye and measuredits aberrations using green and IR light. Identical results were ob-tained for all aberration terms within the accuracy of the tech-nique, including the defocus term, and replicated the nominalaberrations of the phase-plate.
Subjects. We measured 25 eyes (labeled #1 to #25) from 16subjects: 19 eyes were normal, one eye was aphakic (#8), and fiveeyes had undergone laser-assisted in situ keratomileuesis refractivesurgery (#5, #6, #10, #12, and #13). Ages ranged from 20 to 71years (mean � SD, 33 � 11 years), spherical error ranged from�6.00 to �16.50 D (mean, �1.62 � 4.42 D), and astigmatismranged from 3.78 to 0.07 D (mean, 1.07 � 0.98 D).
Before the measurement, an informed consent form approvedby institutional ethical committees was signed by each patient inaccordance with the tenets of the Declaration of Helsinki. Thepupil was dilated with one drop of Tropicamide 1%.
Measurements. Subjects were stabilized with a dental im-pression and a forehead rest, and the eye was monitored with aCCD camera to ensure alignment of the pupil center to the opticalaxis of the instrument during the measurement. Spherical refrac-tive errors were compensated with trial lenses when necessary.
Each session consisted of 10 runs, each run (37 images corre-sponding to the 37 rays sampling the pupil) lasted approximately4 s. Five consecutive series were collected using green light (543nm), and then five series were collected using near IR light (786nm).
Shack-Hartmann
Setup and Procedures. A schematic diagram of the SHwavefront sensor used in this study is shown in Fig. 1B. A detaileddescription of a similar system can be found elsewhere38, 40–42
without the minor modifications introduced for this study. Lightfrom an IR (788 nm) super luminescent diode (Anritsu, 10 �W)was introduced by means of a pellicle beam splitter and coalignedto the green (543 nm) He-Ne laser beam (Melles Griot, 1 mW)used in previous measurements. The He-Ne laser was spatiallyfiltered and expanded before collimation, bringing the maximumpower reaching the eye to �5 �W over an 8-mm diameter pupil.Further power reduction was achieved by reducing the beam di-
ameter to 1.5 to 2 mm and by the use of neutral-density filtersbefore spatial filtering. The super luminescent diode power waslargely reduced after fiber coupling (to about 10% of its maximumnominal power), and further power reduction was electronicallycontrolled with its driver. In all cases, the maximum power reach-ing the eye was at least one order of magnitude below the safetylimits.39 The principle of the SH system has been described exten-sively in the literature. A narrow collimated laser beam forms a spoton the retina, and the light reflected and emerging from the eye issampled by a rectangular lenslet array placed on a plane conjugateto the eye pupil. A CCD camera, placed on the focal plane of thelenslet array and conjugate to the retina, is used to record the SHspot pattern. Deviations from the ideal SH spot pattern are pro-portional to the local slopes of the wave aberration.
For this study, wave aberration was estimated from measuredslopes using a least-mean square procedure. Wave aberration wasfitted to a sixth-order Zernike polynomial expansion (27 terms).
The size of each lenslet was 0.8 mm � 0.8 mm over the pupilplane, and the focal length was 35 mm. The pupil size was 6 mm.
Setting and Control Experiment. Measurements were con-ducted at Imperial College of Science Technology and Medicine,London, United Kingdom. The system was calibrated to ensurethat it did not introduce chromatic aberration. Two reference SHimages using green and IR light were compared. The green refer-ence was used to calculate the aberrations of the IR reference. Theorder of magnitude of every Zernike coefficient was always smallerthan or equal to the standard deviations of any series of 10 mea-surements of ocular aberrations using only one wavelength. Thisprocedure proves that no significant amount of chromatic aberra-tion is introduced by the optics of the system.
Subjects. We measured 11 normal eyes (labeled #26 to #36)(six subjects). Ages ranged from 22 to 26 years (mean, 23 � 1.47years), spherical error ranged from �6.00 to �0.75 D (mean, 2.51� 3.24 D), and astigmatism ranged from 0.07 to 4.00 (mean, 1.30� 1.5 D).
The institutional research and ethical committee approved theuse of the wavefront sensor and the experimental design. Writtenconsent was obtained from all subjects participating in the studyaccording to the tenets of the Declaration of Helsinki. Pupils weredilated using Tropicamide 1% and Phenylephrine 2.5% 30 minbefore the beginning of the measurements.
Measurements. Subjects were stabilized with the help of adental impression, and the pupil of the eye was aligned to theoptical axis of the instrument while it was continuously monitoredwith a CCD camera. The illumination source was used as thefixation point. Spherocylindrical refractive errors were compen-sated when necessary.
At least six series of 10 SH images were collected, three usinggreen illumination (543 nm) and the rest using IR illumination(788 nm). Images with the same wavelength were collectedconsecutively.
Equivalence of LRT and SH
The equivalence of the SH and LRT wavefront sensors has beendemonstrated in previous studies.22, 43 Control measurements ontwo subjects showed that the SH and LRT systems used in this
28 Aberrations of the Eye in Visible and Near Infrared Illumination—Llorente et al.
Optometry and Vision Science, Vol. 80, No. 1, January 2003

study (in Madrid and London, respectively) provided similar ab-errations in normal eyes.38
RESULTSRaw Data
Raw data obtained from both techniques consist of a set of aerialimages (in different frames for the LRT or a single frame for theSH). Each image corresponds to a pupil position (entry pupilposition for LRT and exit pupil position for SH).
Fig. 2 A and B shows a set of aerial images obtained with LRTfor eye #5, for green and IR light, respectively. Each image has beenplaced at the corresponding entry pupil position. The intensitypatterns differ significantly across wavelengths. Fig. 2C shows thespot diagram (joint plot of the position of the centroids of the sameset) corresponding to the average data of three consecutive runswith green light (crosses) and four consecutive runs with IR light(circles) for eye #5. The error bars indicate the standard deviationof the positions of the centroid between runs. Chromatic defocus isresponsible for the consistent shift between wavelengths, whichincreases with entry pupil eccentricity.
Fig. 2 D and E shows SH images for green and IR light, respec-tively, for eye #29. The presence of a halo surrounding the centroidis more evident for the image with IR illumination than for thatwith green illumination. The spots at the upper right and the lowerleft corners of the image appear dimmer (particularly for greenillumination) due to the use of crossed polarization between illu-
mination and recording.38 Fig. 2F shows the SH centroids corre-sponding to D (crosses) and E (circles). As in LRT, the shift be-tween the green and IR spots increases toward the periphery of theimage.
Wave Aberration Maps
Fig. 3 shows wave aberration maps from LRT measurements forboth wavelengths for third- and higher-order aberrations. Eyes #9and #22 were normal eyes, whereas #13 had undergone laser-assisted in situ keratomileuesis surgery. Each map is the average ofat least three experimental runs. Contour lines have been plottedevery 0.2 �m. Fig. 4 shows wave aberration maps for three normaleyes (#29, #30, and #31) measured with SH for both wavelengths,excluding tilt and defocus. Contour lines have been plotted every0.5 �m.
For both systems, the wave aberration patterns corresponding togreen and IR wavelengths for the same subject are very similar.
Zernike Coefficients and Root Mean SquareWavefront Error (RMS)
Fig. 5 shows plots of sets of Zernike coefficients for green (cross-es) and IR (circles) light for the same eyes as in Figs. 3 and 4. Thecoefficient ordering and normalization follows the Optical Societyof America standardization committee recommendations.44 First-
FIGURE 2.Raw data as obtained from laser ray tracing (panels A, B, and C) and Shack-Hartmann wavefront sensor (panels D, E, and F). In laser ray tracing, a seriesof retinal images is captured sequentially as a function of the entry pupil position. Aerial images obtained for eye #5 using green and infrared light areshown in panels A and B, respectively. Panel C shows the corresponding spot diagram. Crosses represent green illumination, and circles represent IRillumination. Panels D and E show Shack-Hartmann images for eye #29 for green and IR light, respectively. Panel E plots the corresponding centroidsof the SH images. Symbol notation is the same as for panel C.
Aberrations of the Eye in Visible and Near Infrared Illumination—Llorente et al. 29
Optometry and Vision Science, Vol. 80, No. 1, January 2003

and second-order terms have been cancelled to allow a higher-resolution view of higher-order terms.
Error bars represent the standard deviation of the measurement.Mean variability (standard deviation) averaged across Zernike co-efficients and subjects was 0.10 � 0.06 for green light and 0.07 �0.04 for IR light for the measurements performed with LRT and0.019 � 0.009 for green light and 0.015 � 0.009 for IR light forthe measurements performed with SH. The differences betweenthe Zernike coefficients measured with green or IR light shown inFig. 6 are within the inherent variability of the techniques.
We performed a univariate statistical analysis (Student’s t-test)
on each Zernike coefficient for each eye to detect which subjectsand particular terms showed significant differences (p � 0.01)when measured in green and IR light. For the 25 eyes measuredwith LRT only 39 coefficients (excluding defocus) of 825 (25 � 33terms), i.e., 4.7%, were statistically different. The defocus term(Z0
2) was statistically different in 24 of the 25 eyes (96% of thesubjects). All the other statistically different terms were randomlydistributed.
For the 11 eyes measured with SH, 22% (61 of 275 [25 coeffi-cients � 11 eyes]) of the coefficients were statistically different.The defocus term (Z0
2) was statistically different in all of the eyes.Among terms other than defocus, 50 of 275 (18%) were found tobe significantly different.
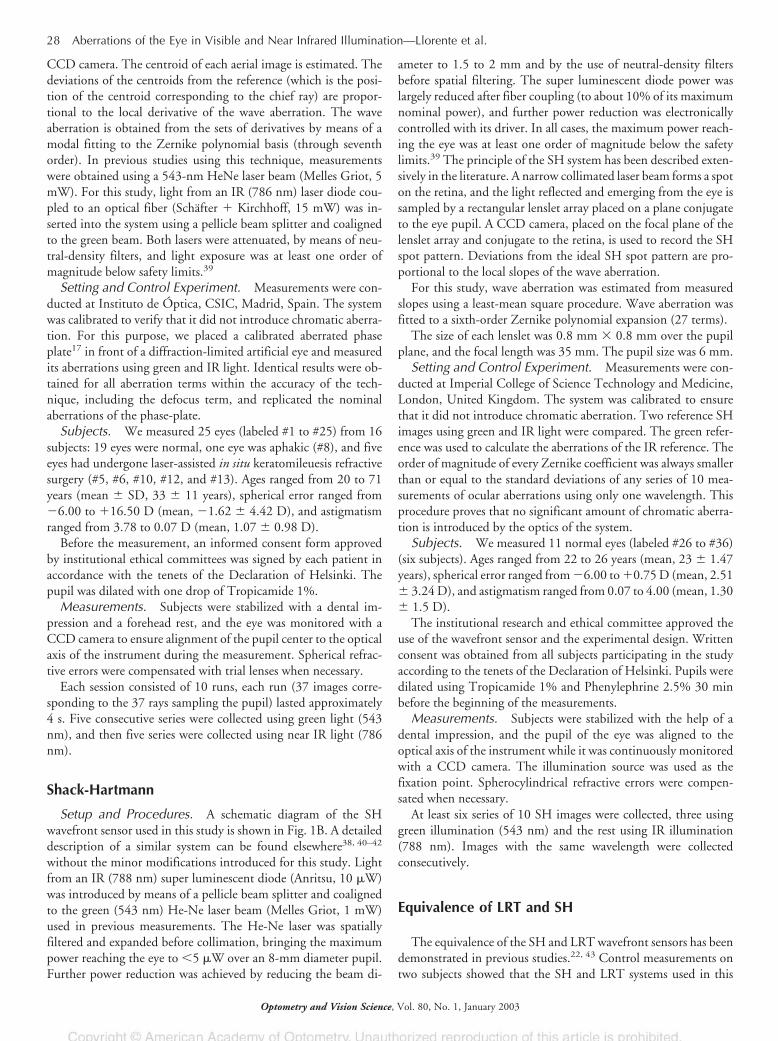
Fig. 6 shows defocus for IR wavelength vs. green wavelength indiopters for all subjects. There is a good linear correlation (R2 �0.976), and the slope of the linear fit is close to one (0.9615). Thefocus shift between IR and green given by the fitting equation is0.722. The experimental focus shift was 0.78 � 0.29 D.
Bar diagrams in Fig. 7 compare individual terms (astigmatismand spherical aberration) and the RMS including different terms
FIGURE 3.Wave aberration maps from laser ray tracing measurements for green andinfrared light. First- and second-order terms have been excluded. Eyes #9and #22 were normal eyes, and #13 had undergone laser-assisted in situkeratomileusis surgery. Each map is the average of at least three experi-mental runs. Contour lines are plotted every 0.2 �m.
FIGURE 4.Wave aberration maps for three normal eyes (#29, #30, and #31) measuredwith a Shack-Hartmann wavefront sensor for both wavelengths. Tilts anddefocus have been excluded. Contour lines are plotted every 0.5 �m.
FIGURE 5.Plots of sets of the Zernike coefficients for green (crosses) and infrared(circles) light for the same eyes as in Fig. 3 and 4. The coefficient orderingand normalization follows the Optical Society of America standardizationcommittee recommendations.45 First- and second-order terms have beencancelled. Error bars represent the standard deviation of the measurement.Asterisks indicate the statistically different coefficients.
30 Aberrations of the Eye in Visible and Near Infrared Illumination—Llorente et al.
Optometry and Vision Science, Vol. 80, No. 1, January 2003
obtained with green (black bars) and IR (gray bars) wavelengths forall subjects. Eyes #1 to #25 were measured with LRT, and eyes #26to #36 were measured with SH. Asterisks indicate eyes that showedstatistically significant differences (p � 0.01). Astigmatism (Fig.7A) was statistically different in three of the 36 subjects (8.3%).RMS for third-order aberrations (Fig. 7B) was statistically differentin six of the 36 subjects (16.6%). RMS for third- and higher-orderaberrations (Fig. 7C) was statistically different in five of the 36subjects (13.5%). Spherical aberration (Z4
0) (Fig. 7D) was statisti-cally different in four of the 36 subjects (11.1%)
Only one eye (#35) came out significantly different for all theterms or orders reported above (RMS for third- and higher-orderaberrations, third-order aberrations, spherical aberration, andastigmatism).
DISCUSSION
This study shows that although the intensity distribution ofLRT aerial images or SH images is notably different between greenand IR illumination, both wavelengths provide aberration esti-mates within the experimental error (except for defocus). Oursample includes eyes with large differences in optical quality (fromnormal eyes to surgical eyes) and ages (20 to 71 years), suggestingthat this conclusion holds for most of the population.
Differences in Image Intensity Profiles
Fig. 2 shows relevant intensity differences between the aerialimages obtained with IR and those obtained with green illumina-
tion. IR images are typically more spread and are surrounded by abroad halo. It has been suggested that most of the light contribut-ing to the core of double-pass aerial images is probably due to thelight captured and guided back from the photoreceptors.36, 45 Thehalo is probably produced by effects other than aberrations, such asretinal stray light scattered at the choroid.46, 47 Retinal scatteringincreases for longer wavelengths due to their deeper penetrationwithin the retina and the choroid.48, 49
Some previous comparisons of optical quality in IR and green lightwere based on estimates from double-pass aerial images. We per-formed a computer simulation to evaluate the contribution to theaerial image spread caused by degradation other than the ocular aber-rations and the influence of wavelength on this additional contribu-tion. We simulated LRT double-pass aerial images from the estimatedwave aberration function. LRT aerial images are the autocorrelation ofthe entry (first pass) and exit (second pass) point-spread function. Theentry pupil is a narrow incoming Gaussian beam (variance � 0.1034mm and 0.1332 mm, respectively, for green and IR illumination) andthe exit pupil is a 3-mm circular pupil. The entry and exit pupil sizescorrespond to the experimental values in the LRT setup. Insets in Fig.8 show real images and simulated images corresponding to an entrypupil centered at coordinates (�1.5, �2.6 mm). Fig. 8 A and B showsexperimental and simulated results for green and IR light, respectively,for eye #22. The plots represent the normalized radial intensity profileof the corresponding real (solid) and simulated (dashed) aerial images.The distance from the peak position to the zero position represents thecentroid deviation from the chief ray (which is practically the same forthe simulated and real images). The width of the simulated imagesaccounts for the spread caused exclusively by the measured aberra-tions, whereas the real images are further enlarged by scattering andnonmeasured higher-order aberrations.
The SH images in Fig. 2C also suggest a larger contribution ofscattered light in IR. A crossed-polarization configuration was used,which explains the “polarization-cross” pattern observed in green lightillumination.38 Green illumination maximizes the light reflected bythe photoreceptor outer segments,50 which are thought to partly re-tain polarization.51 Light multiply scattered by deeper layers (probablya significant component of the IR images49) does not retain polariza-tion, and, therefore, the SH spots will show little polarization-relatedintensity differences across the image.38
The effects mentioned above affect the shape and intensity dis-tribution of the aerial image and are critical in double-pass mea-surements of the optical quality of the eye. In this technique, mod-ulation transfer function estimates are directly obtained fromdouble-pass aerial images. An appropriate halo subtraction is crit-ical to obtain modulation transfer functions in IR consistent tothose measured in green light.36 However, reflectometric tech-niques for wave aberration measurements only rely on centroiddeviation computations, which, as we have shown, are not signif-icantly affected by wavelength.
Chromatic Difference of Focus
The defocus term was significantly different across wavelengths inall but one subject. The mean focus difference between green and IRacross subjects was 0.78 � 0.29 D, close to the shift estimated by the
FIGURE 6.Defocus for infrared vs. green wavelength in diopters for all subjects. Thesolid line represents the best linear fit to the data (R2 � 0.976). The focusshift between infrared and green given by the fitting equation is 0.722 D.The slope of the linear fit is close to one (0.9615). The dashed linecorresponds to a fitting line with slope equal to one and falls within thedata variability.
Aberrations of the Eye in Visible and Near Infrared Illumination—Llorente et al. 31
Optometry and Vision Science, Vol. 80, No. 1, January 2003

FIGURE 7.Bar diagrams comparing individual terms (astigmatism and spherical aberrations) and the root mean square wavefront error (RMS) for different orders,obtained with green (black bars) and infrared (gray bars) for all subjects. Eyes #1 to #25 were measured with laser ray tracing (LRT), and eyes #26 to#36 were measured with a Shack-Hartmann wavefront sensor (SH). Asterisks indicate eyes showing statistically significant differences (p � 0.01).
32 Aberrations of the Eye in Visible and Near Infrared Illumination—Llorente et al.
Optometry and Vision Science, Vol. 80, No. 1, January 2003

linear fitting shown in Fig. 7 (0.72 D). This value agrees well, withinthe inherent variability, with the chromatic focus shift predicted by theIndiana chromatic reduced eye model.52
RE � 633.46 � �� 1
�G � 214.102�
1
IR � 214.102�� 0.82 D(1)
where G � 543 nm and IR � 787 nm (mean between IRwavelength used was 786 nm for LRT and 788 nm for SH).
Thibos et al.52 obtained the parameters of the eye model by
fitting experimental data for a range of wavelengths between 400nm and 700 nm and using Cornu’s expression for the dependenceof the index of refraction with wavelength. Equation 1 agrees wellwith experimental data in the literature for wavelengths up to 760nm (close to the wavelength used in this study), with variationsclose to the intersubject variability in our sample.52 Whether thisexpression for the LCA still holds for longer wavelengths used insome commercial SH systems (i.e., 830 nm) remains to be studied.Typically, Cornu’s equation fails beyond the visible, and otherexpressions53 should be used.
It has been frequently argued that differences in the retinal layerwhere light is reflected may cause differences between manifestrefraction and retinoscopy.54, 55 Charman et al.56 and Williams etal.45 for red light, and later López-Gil and Artal36 for near IR lightshowed that the differences between subjective and reflectometricfocus were negligible and concluded that reflection contributing tothe central core of the point-spread function occurred within thephotoreceptor layer. Our results, based on the Zernike defocusterm of wave aberration reflectometric estimates, also support thisconclusion. The focus shift that we found is slightly lower than thechromatic shift prediction (by 0.10 D), which is consistent with areflection plane behind the photoreceptor layer. However, thisshift is of the order of the measurement error (0.12 D for greenlight and 0.08 D for IR light on average) and lower than theintersubject variability (0.29 D). We did not find any particulartrend for the focus shift in normal, young subjects as a function ofrefractive error (coefficient of correlation, r � 0.166, p � 0.44). Inaddition, we did not find any particular difference for the focusshift in eyes with abnormal corneas by laser-assisted in situ kerato-mileuesis surgery. However, we found that the focus shift for theaphakic eye was much higher than the average (1.7 D). Our pop-ulation did not sample different age groups homogeneously. How-ever, we found a slight increase of focus shift with age (r � 0.45,p � 0.022). The majority of subjects were young or middle-aged(20 to 43 years old), and we could not find an aged-related trend(r � 0.26, p � 0.2).
CONCLUSION
We have shown the equivalence of high-order aberrations mea-sured in visible or near infrared illumination with LRT and SH, atleast within the accuracy of the techniques. The shift in the defocusterm was consistent with the shift predicted by chromatic aberra-tion. These results are relevant because typical commercial wave-front-sensing devices use infrared illumination. This wavelengthhas several advantages over visible illumination: it is more comfort-able for the subject, pupil dilation is not essential, and light expo-sure can be lower due to the higher reflectance of the eye fundusand the better sensitivity of most of the photodetectors at thiswavelength. We have shown that despite the longer tails of theaerial images at this wavelength, it can be successfully used in all thetested conditions, including old and surgical eyes.
We also provide an experimental value for the focus shift be-tween near infrared (786 to 788 nm) and green (543 nm) illumi-nation in two reflectometric aberrometers (LRT and SH). One ofthe most promising applications of wavefront-sensing devices istheir use as sophisticated autorefractometers. They are now being
FIGURE 8.Experimental and simulated aerial images for green (A) and infrared (B)light, respectively, for eye #22 and entry pupil at coordinates (�1.5, �2.6mm). The image on the upper left corner of the plot is the aerial imageobtained experimentally, and the image below is the aerial image simu-lated from measured aberrations as the autocorrelation of first- and sec-ond-pass point-spread functions. The plots represent the normalized radialintensity profile of the corresponding real (dashed) and simulated (solid)aerial images. The distance to zero position represents the centroid devi-ation from the chief ray. The width of the simulated images accounts forthe spread caused exclusively by the measured aberrations, whereas thatof the real images also includes other effects, such as scattering andnonmeasured higher-order aberrations, together with the measuredaberrations.
Aberrations of the Eye in Visible and Near Infrared Illumination—Llorente et al. 33
Optometry and Vision Science, Vol. 80, No. 1, January 2003
applied for use in refractive surgery to guide ablation with the aimof compensating both low- (second order) and high-order (thirdand higher) aberrations. An accurate transformation of the IR es-timates of spherical error into visible wavelengths is crucial to de-termine the actual correction that should be applied. We haveshown that Thibos’s chromatic reduced eye model equation is avalid expression to predict focus shift for our wavelength. How-ever, for longer wavelengths, there is no evidence of the validity ofthis equation, and new expressions for the refractive index andchromatic difference of refraction may need to be developed. Inaddition, we found that discrepancies can occur in aphakic eyesand that there might be age-dependent corrections to Equation 1.Several reports in the literature found differences in the LCA’s ofaphakic eyes57 and pseudoaphakic eyes58 with respect to normaleyes. Possible age-related changes of LCA have been a matter ofcontroversy.59–62 Although much of these refractive discrepanciesare small, their magnitude can be comparable to the higher-orderaberrations, and therefore accurate predictions of spherical errorsfor visible light from IR measurements are important.
ACKNOWLEDGMENTS
This study was supported by grants CAM 08.7/0010./2000 from ComunidadAutónoma de Madrid, Spain and BFM 2002–02638, Ministerio de Cienciay Tecnologia, Spain to S. Marcos, TCI98-0925-C02-01 from the Ministeriode Educación y Cultura, Spain to R. Navarro, CONACyT 150238 predoc-toral fellowship, Mexico to D. Lara-Saucedo and CAM 03/0101/1999 to L.Llorente.
We thank S. Barbero for his valuable help with experimental measure-ments. E. Moreno Barriuso contributed in the early stages of this study. We areindebted to C. Dainty and the Photonics Optics Group at Imperial College forallowing the use and modifications of the wavefront sensor and to Y. Tsangfrom City University for his invaluable help during the experimental sessions.
Received April 30, 2002; revision received July 26, 2002.
REFERENCES
1. He JC, Burns SA, Marcos S. Monochromatic aberrations in the ac-commodated human eye. Vision Res 2000;40:41–8.
2. Atchison DA, Collins MJ, Wildsoet CF, Christensen J, WaterworthMD. Measurement of monochromatic ocular aberrations of humaneyes as a function of accommodation by the Howland aberroscopetechnique. Vision Res 1995;35:313–23.
3. McLellan JS, Marcos S, Burns SA. Age-related changes in monochro-matic wave aberrations of the human eye. Invest Ophthalmol Vis Sci2001;42:1390–5.
4. Artal P, Berrio E, Guirao A, Piers P. Contribution of the cornea andinternal surfaces to the change of ocular aberrations with age. J OptSoc Am (A) 2002;19:137–43.
5. Navarro R, Moreno E, Dorronsoro C. Monochromatic aberrationsand point-spread functions of the human eye across the visual field.J Opt Soc Am (A) 1998;15:2522–9.
6. Collins MJ, Wildsoet CF, Atchison DA. Monochromatic aberrationsand myopia. Vision Res 1995;35:1157–63.
7. Marcos S, Moreno-Barriuso E, Llorente L, Navarro R, Barbero S. Domyopic eyes suffer from larger amount of aberrations? In: Thorn F,Troilo D, Gwiazda J, eds. Myopia 2000: Proceedings of the VIIIInternational Conference on Myopia. Boston: The New EnglandCollege of Optometry, 2000:118–21.
8. Barbero S, Marcos S, Merayo-Lloves J, Moreno-Barriuso E. Valida-tion of the estimation of corneal aberrations from videokeratographyin keratoconus. J Refract Surg 2002;18:263–70.
9. Schwiegerling J. Cone dimensions in keratoconus using Zernikepolynomials. Optom Vis Sci 1997;74:963–9.
10. López-Gil N, Marín JM, Castejón-Mochón J, Benito A, Artal P.Ocular and corneal aberrations after corneal transplantation. InvestOphthalmol Vis Sci 2001;42:S529.
11. Munson K, Hong X, Thibos LN. Use of a Shack-Hartmann aber-rometer to assess the optical outcome of corneal transplantation in akeratoconic eye. Optom Vis Sci 2001;78:866–71.
12. Seiler T, Kaemmerer M, Mierdel P, Krinke HE. Ocular optical aber-rations after photorefractive keratectomy for myopia and myopicastigmatism. Arch Ophthalmol 2000;118:17–21.
13. Moreno-Barriuso E, Lloves JM, Marcos S, Navarro R, Llorente L,Barbero S. Ocular aberrations before and after myopic corneal refrac-tive surgery: LASIK-induced changes measured with laser ray tracing.Invest Ophthalmol Vis Sci 2001;42:1396–403.
14. Marcos S, Barbero S, Llorente L, Merayo-Lloves J. Optical responseto LASIK surgery for myopia from total and corneal aberration mea-surements. Invest Ophthalmol Vis Sci 2001;42:3349–56.
15. Marcos S. Aberrations and visual performance following standardlaser vision correction. J Refract Surg 2001;17:S596–601.
16. MacRae SM, Schwiegerling J, Snyder R. Customized corneal ablationand super vision. J Refract Surg 2000;16:S230–5.
17. Navarro R, Moreno-Barriuso E, Bará S, Mancebo T. Phase-plates forwave aberration compensation in the human eye. Optics Lett 2000;25:236–8.
18. Hofer H, Chen L, Yoon GY, Singer B, Yamauchi Y, Williams DR.Improvement in retinal image quality with dynamic correction of theeye’s aberrations. Optics Express 2001;8:631–3. Available at: http://www.opticsexpress.org/oearchive/source/31887.htm. Accessed Au-gust 28, 2002.
19. Fernandez EJ, Iglesias I, Artal P. Closed-loop adaptive optics in thehuman eye. Optics Lett 2001;26:746–8.
20. Burns SA, Marcos S, Elsnser AE, Bará S. Contrast improvement forconfocal retinal imaging using phase correcting plates. Optics Lett2002;27:400–2.
21. Navarro R, Losada MA. Aberrations and relative efficiency of lightpencils in the living human eye. Optom Vis Sci 1997;74:540–7.
22. Moreno-Barriuso E, Marcos S, Navarro R, Burns SA. Comparinglaser ray tracing, the spatially resolved refractometer, and the Hart-mann-Shack sensor to measure the ocular wave aberration. OptomVis Sci 2001;78:152–6.
23. He JC, Marcos S, Webb RH, Burns SA. Measurement of the wave-front aberration of the eye by a fast psychophysical procedure. J OptSoc Am (A) 1998;15:2449–56.
24. Webb RH, Penney CM, Thompson KP. Measurement of ocularwavefront distortion with a spatially resolved refractometer. ApplOptics 1992;31:3678–86.
25. Mierdel P, Krinke HE, Wiegand W, Kaemmerer M, Seiler T. Mea-suring device for determining monochromatic aberration of the hu-man eye. Ophthalmologe 1997;94:441–5.
26. Walsh G, Cox MJ. A new computerised video-aberroscope for thedetermination of the aberration of the human eye. OphthalmicPhysiol Opt 1995;15:403–8.
27. MacRae S, Fujieda M. Slit skiascopic-guided ablation using theNidek laser. J Refract Surg 2000;16:S576–80.
28. Liang J, Grimm B, Goelz S, Bille JF. Objective measurement of waveaberrations of the human eye with the use of a Hartmann-Shackwave-front sensor. J Opt Soc Am (A) 1994;11:1949–57.
29. Liang J, Williams DR. Aberrations and retinal image quality of thenormal human eye. J Opt Soc Am (A) 1997;14:2873–83.
30. Wyszecki G, Stiles WS. Color Science: Concepts and Methods,Quantitative Data and Formulae. New York: Wiley, 1982.
34 Aberrations of the Eye in Visible and Near Infrared Illumination—Llorente et al.
Optometry and Vision Science, Vol. 80, No. 1, January 2003

31. Delori FC, Burns SA. Fundus reflectance and the measurement ofcrystalline lens density. J Opt Soc Am (A) 1996;13:215–26.
32. van den Berg TJ. Light scattering by donor lenses as a function ofdepth and wavelength. Invest Ophthalmol Vis Sci 1997;38:1321–32.
33. Hofer HJ, Porter J, Williams DR. Dynamic measurement of the waveaberration of the human eye. Invest Ophthalmol Vis Sci 1998;39:S203.
34. Marcos S, Burns SA, Moreno-Barriusop E, Navarro R. A new ap-proach to the study of ocular chromatic aberrations. Vision Res 1999;39:4309–23.
35. Rynders MC, Navarro R, Losada MA. Objective measurement of theoff-axis longitudinal chromatic aberration in the human eye. VisionRes 1998;38:513–22.
36. Charman WN, Jennings JA. Objective measurements of the longitu-dinal chromatic aberration of the human eye. Vision Res 1976;16:999–1005.
37. Lopez-Gil N, Artal P. Comparison of double-pass estimates of theretinal-image quality obtained with green and near-infrared light.J Opt Soc Am (A) 1997;14:961–71.
38. Lopez-Gil N, Howland HC. Measurement of the eye’s near infraredwave-front aberration using the objective crossed-cylinder aberro-scope technique. Vision Res 1999;39:2031–7.
39. Marcos S, Diaz-Santana L, Llorente L, Dainty C. Ocular aberrationswith ray tracing and Shack-Hartmann wave-front sensors: does po-larization play a role? J Opt Soc Am (A) 2002;19:1063–72.
40. American National Standard Institute. American National Standardfor the Safe Use of Lasers, Standard Z-136.1-1993. Orlando, FL: TheInstitute, 1993.
41. Diaz Santana HL, Dainty JC. Single-pass measurements of the wave-front aberrations of the human eye by use of retinal lipofuscinautofluorescence. Optics Lett 1999;24:61–3.
42. Diaz-Santana HL, Dainty JC. Single vs. symmetric and asymmetricdouble-pass measurements of the wavefront aberration of the humaneye. In: Love GD, ed. Proceedings of the Second International Work-shop on Adaptive Optics for Industry and Medicine: University ofDurham, England, July 12–16, 1999. Singapore: World Scientific,2000:45–50.
43. Diaz-Santana HL. Wavefront sensing in the human eye with a Shack-Hartmann sensor. 2000. PhD Thesis. London: Imperial College ofScience Technology and Medicine.
44. Moreno-Barriuso E, Navarro R. Laser ray tracing versus Hartmann-Shack sensor for measuring optical aberrations in the human eye.J Opt Soc Am (A) 2000;17:974–85.
45. Thibos LN, Applegate RA, Schwiegerling JT, Webb R. Standards forreporting the optical aberrations of eyes. In: Lakshminarayanan V, ed.OSA trends in optics and photonics. Vision Science and Its Applica-tions, Vol 35. OSA Technical Digest Series. Washington, DC: Op-tical Society of America, 2000:232–44.
46. Williams DR, Brainard DH, McMahon MJ, Navarro R. Double-pass
and interferometric measures of the optical quality of the eye. J OptSoc Am (A) 1994;11:3123–35.
47. Westheimer G, Liang J. Influence of ocular light scatter on the eye’soptical performance. J Opt Soc Am (A) 1995;12:1417–24.
48. Westheimer G, Campbell FW. Light distribution in the imageformed by the living human eye. J Opt Soc Am 1962;52:1040–4.
49. Elsner AE, Burns SA, Hughes GW, Webb RH. Reflectometry with ascanning laser ophthalmoscope. Appl Optics 1992;31:3697–710.
50. Gorrand JM, Alfieri R, Boire JY. Diffusion of the retinal layers of theliving human eye. Vision Res 1984;24:1097–106.
51. Elsner AE, Burns SA, Weiter JJ, Delori FC. Infrared imaging ofsub-retinal structures in the human ocular fundus. Vision Res 1996;36:191–205.
52. Thibos LN, Ye M, Zhang XX, Bradley A. The chromatic eye: a newreduced-eye model of ocular chromatic aberration in humans. ApplOptics 1992;31:3594–600.
53. Herzberger M. Colour correction in optical systems and a new dis-persion formula. Optica Acta 1969;5:197–215.
54. Millodot M, O’Leary DJ. On the artifact of retinoscopy and chro-matic aberration. Am J Optom Physiol Opt 1980;57:822–4.
55. Millodot M, O’Leary D. The discrepancy between retinoscopic andsubjective measurements: effect of age. Am J Optom Physiol Opt1978;55:309–16.
56. Charman WN. Some sources of discrepancy between static retinos-copy and subjective refraction. Br J Physiol Opt 1975;30:108–18.
57. Millodot M. The influence of age on the chromatic aberration of theeye. Albrecht Von Graefes Arch Klin Exp Ophthalmol 1976;198:235–43.
58. Negishi K, Ohnuma K, Hirayama N, Noda T. Effect of chromaticaberration on contrast sensitivity in pseudophakic eyes. Arch Oph-thalmol 2001;119:1154–8.
59. Howarth PA, Zhang XX, Bradley A, Still DL, Thibos LN. Does thechromatic aberration of the eye vary with age? J Opt Soc Am (A)1988;5:2087–92.
60. Mordi JA, Adrian WK. Influence of age on chromatic aberration ofthe human eye. Am J Optom Physiol Opt 1985;62:864–9.
61. Morrell A, Whitefoot HD, Charman WN. Ocular chromatic aberra-tion and age. Ophthalmic Physiol Opt 1991;11:385–90.
62. Calver RI, Cox MJ, Elliott DB. Effect of aging on the monochro-matic aberrations of the human eye. J Opt Soc Am (A) 1999;16:2069–78.
Lourdes LlorenteInstituto de Óptica “Daza de Valdés”
Consejo Superior de Investigaciones CientíficasSerrano, 121, Madrid, 28006
Spaine-mail: [email protected]
Aberrations of the Eye in Visible and Near Infrared Illumination—Llorente et al. 35
Optometry and Vision Science, Vol. 80, No. 1, January 2003


![Untitled Document [] · eye (OS) of an unilateral aphakic subject, with a double purpose: 1) Cross-validation of techniques in an eye where corneal and total aberrations should be](https://static.fdocuments.in/doc/165x107/5e9d3357c66ec23fa10744c5/untitled-document-eye-os-of-an-unilateral-aphakic-subject-with-a-double-purpose.jpg)