Aberration-freemeasurements ofthe visibility ofisoluminant ...
13
Sekiguchi et at. Vol. 10, No. 10/0ctober 1993/J. Opt. Soc. Am. A Aberration-free measurements of the visibility of isoluminant gratings Nobutoshi Sekiguchi, * David R. Williams, and David H. Brainard t Center for Visual Science, University of Rochester, Rochester, New Thrk 14627 2105 Received August 19, 1992; revised manuscript received April 7, 1993; accepted April 8, 1993 We developed a new apparatus and psychophysical technique to extend isoluminant contrast-sensitivity mea- surements to high spatial frequencies. The apparatus consists of two identical laser interferometers that are designed to produce phase-locked two-color interference fringes on the retina without the influence of diffrac- tion and most aberrations in the eye. However, even with interferometry, transverse chromatic aberration of the eye can produce a wavelength-dependent phase shift in the interference fringes, which can be exaggerated by head movements. To reduce the effect of head movements, isoluminant red and green interference fringes of equal spatial frequency and orientation were drifted slowly in opposite directions to guarantee a purely isochromatic (in phase) and a purely isoluminant (out of phase) stimulus during each cycle of stimulus presenta- tion. With this technique we found that observers could resolve red and green stripes at spatial frequencies higher than 20 cycles per degree (c/deg) (20-27 c/deg), substantially higher than has previously been reported. This places a lower bound on the sampling density of neurons that mediate color vision. At all spatial frequen- cies, even those above the isoluminant resolution limit, a relative phase of the red and the green components could be found that obliterated the appearance of luminance modulation at the fringe frequency. Above the resolution limit, red-green-isoluminant interference fringes are seen as spatial noise, which may be chromatic aliasing caused by spatial sampling at some stage in the chromatic pathway. INTRODUCTION The basic properties of the visual system for detecting spatial modulation in chromaticity can be described by contrast-sensitivity functions for isoluminant color direc- tions. Many investigators have reported contrast- sensitivity measurements for isoluminant gratings.':" In these previous measurements, however, the range of spa- tial frequencies over which isoluminant contrast sensitiv- ity could be measured was restricted by several factors. One restriction comes from technical difficulties in pro- ducing high-contrast isoluminant gratings with CRT dis- plays, which many studies have used. This is because spectrally broadband phosphors in CRT displays lower the effective contrast of isoluminant but not of isochromatic stimuli. In addition, CRT displays cannot produce high luminance levels, which restricts the ability to measure performance at higher spatial frequencies. Perhaps the most important restriction is the contrast reduction caused by optical blurring in the eye, particularly by axial and transverse chromatic aberration. Mullen7,8 and Anderson et al. 9 separated the positions of the different wavelength components of their stimulus to compensate for both axial and transverse chromatic aber- rations. Even with this compensation, their measure- ments did not extend beyond 10 cycles per degree (c/deg), In this paper we show that these spatial-frequency re- strictions can be overcome by producing an isoluminant stimulus with laser interferometry and by measuring per- formance with a new psychophysical technique. The ad- vantages of using laser interferometry are as follows: 1. Interferometry permits contrast-sensitivity mea- surements at high spatial frequencies, since it can avoid 0740-3232/93/102105-13$06.00 the influence of optical blurring. 1O - 12 Moreover, par- ticularly for isoluminant conditions, this technique can avoid luminance artifacts produced by axial chromatic aberration. 2. Laser sources emit monochromatic light, which permits higher chromatic contrasts than can easily be achieved with CRT displays. 3. A laser source can easily produce the high lumi- nances at which contrast sensitivity is maximal. Although the use of interferometry solves many of the technical problems associated with the production of high- contrast isoluminant gratings, it does not eliminate the possibility of a luminance artifact caused by a phase error between the two grating components. Independently of how isoluminant gratings are produced, this sort of phase error can be introduced by transverse chromatic aberra- tion of the eye. The effect can be exaggerated by head movements. 13 In order to reduce the influence of the phase artifacts, we have developed a new psychophysical technique to guarantee the presentation of a pure isolumi- nant stimulus despite the small head movements of an ob- server clenching a bite bar. In experiment 1 we validate the new psychophysical technique. In experiment 2 we use our technique to mea- sure the foveal resolution limit for isoluminant red-green fringes. We find that observers can resolve such fringes at spatial frequencies of 20-27 c/deg, substantially higher than has previously been measured. In the companion paper 14 we apply this technique to measure both isolumi- nant and isochromatic contrast-sensitivity functions and to compare the efficiency of the visual system for detect- ing these two types of stimulus. © 1993 Optical Society of America
Transcript of Aberration-freemeasurements ofthe visibility ofisoluminant ...

Sekiguchi et at. Vol. 10, No. 10/0ctober 1993/J. Opt. Soc. Am. A
Aberration-free measurements of the visibilityof isoluminant gratings
Nobutoshi Sekiguchi,* David R. Williams, and David H. Brainard t
Center for Visual Science, University of Rochester, Rochester, New Thrk 14627
2105
Received August 19, 1992; revised manuscript received April 7, 1993; accepted April 8, 1993
We developed a new apparatus and psychophysical technique to extend isoluminant contrast-sensitivity measurements to high spatial frequencies. The apparatus consists of two identical laser interferometers that aredesigned to produce phase-locked two-color interference fringes on the retina without the influence of diffraction and most aberrations in the eye. However, even with interferometry, transverse chromatic aberration ofthe eye can produce a wavelength-dependent phase shift in the interference fringes, which can be exaggeratedby head movements. To reduce the effect of head movements, isoluminant red and green interference fringesof equal spatial frequency and orientation were drifted slowly in opposite directions to guarantee a purelyisochromatic (in phase) and a purely isoluminant (out of phase) stimulus during each cycle of stimulus presentation. With this technique we found that observers could resolve red and green stripes at spatial frequencieshigher than 20 cycles per degree (c/deg) (20-27 c/deg), substantially higher than has previously been reported.This places a lower bound on the sampling density of neurons that mediate color vision. At all spatial frequencies, even those above the isoluminant resolution limit, a relative phase of the red and the green componentscould be found that obliterated the appearance of luminance modulation at the fringe frequency. Above theresolution limit, red-green-isoluminant interference fringes are seen as spatial noise, which may be chromaticaliasing caused by spatial sampling at some stage in the chromatic pathway.
INTRODUCTIONThe basic properties of the visual system for detectingspatial modulation in chromaticity can be described bycontrast-sensitivity functions for isoluminant color directions. Many investigators have reported contrastsensitivity measurements for isoluminant gratings.':" Inthese previous measurements, however, the range of spatial frequencies over which isoluminant contrast sensitivity could be measured was restricted by several factors.One restriction comes from technical difficulties in producing high-contrast isoluminant gratings with CRT displays, which many studies have used. This is becausespectrally broadband phosphors in CRT displays lower theeffective contrast of isoluminant but not of isochromaticstimuli. In addition, CRT displays cannot produce highluminance levels, which restricts the ability to measureperformance at higher spatial frequencies. Perhaps themost important restriction is the contrast reductioncaused by optical blurring in the eye, particularly by axialand transverse chromatic aberration.
Mullen7,8 and Anderson et al. 9 separated the positions ofthe different wavelength components of their stimulus tocompensate for both axial and transverse chromatic aberrations. Even with this compensation, their measurements did not extend beyond 10 cycles per degree (c/deg),
In this paper we show that these spatial-frequency restrictions can be overcome by producing an isoluminantstimulus with laser interferometry and by measuring performance with a new psychophysical technique. The advantages of using laser interferometry are as follows:
1. Interferometry permits contrast-sensitivity measurements at high spatial frequencies, since it can avoid
0740-3232/93/102105-13$06.00
the influence of optical blurring.1O-
12 Moreover, particularly for isoluminant conditions, this technique canavoid luminance artifacts produced by axial chromaticaberration.
2. Laser sources emit monochromatic light, whichpermits higher chromatic contrasts than can easily beachieved with CRT displays.
3. A laser source can easily produce the high luminances at which contrast sensitivity is maximal.
Although the use of interferometry solves many of thetechnical problems associated with the production of highcontrast isoluminant gratings, it does not eliminate thepossibility of a luminance artifact caused by a phase errorbetween the two grating components. Independently ofhow isoluminant gratings are produced, this sort of phaseerror can be introduced by transverse chromatic aberration of the eye. The effect can be exaggerated by headmovements. 13 In order to reduce the influence of thephase artifacts, we have developed a new psychophysicaltechnique to guarantee the presentation of a pure isoluminant stimulus despite the small head movements of an observer clenching a bite bar.
In experiment 1 we validate the new psychophysicaltechnique. In experiment 2 we use our technique to measure the foveal resolution limit for isoluminant red-greenfringes. We find that observers can resolve such fringesat spatial frequencies of 20-27 c/deg, substantially higherthan has previously been measured. In the companionpaper 14 we apply this technique to measure both isoluminant and isochromatic contrast-sensitivity functions andto compare the efficiency of the visual system for detecting these two types of stimulus.
© 1993 Optical Society of America
2106 J. Opt. Soc. Am. A/Vol. 10, No. 10/0ctober 1993 Sekiguchi et at.
EYEFig. 1. Schematic diagram of one of the two polarizationinterferometers.
preserves their polarization properties. The combinedbeams are expanded by a spatial filter, SPF, which alsofunctions to remove the spatial noise from the beams, andare collimated by lens L1. (Other lenses are denotedL2-L6.)
The beam is divided again by the polarization beamsplitter, PBS3, and the Sand P components travel in thetriangular common-path interferometer clockwise andcounterclockwise, respectively, until they are recombinedby PBS3. Inside the triangle, the two beams cross insidethe glass cube, C, traveling in nearly opposite directions.Rotations of the glass cube control fringe spatial frequencyand orientation as described below. The beams are combined by PBS3 and then pass through a linear polarizer,LP2 the orientation of which is set to transmit an equalamount of the S and the P components and also to beperpendicular to the orientation of LP2' in the other interferometer. The beams from the two interferometers arecombined by beam splitter BSl and go through an analyzer, LP3. The analyzer permits control of the relativeintensity of the two interference fringes that are orthogonally polarized.
To reduce the influence of the speckle noise, which inevitably exists in coherent light, one can add a spatiallyuniform incoherent background to the interference fringes.The incoherent background is produced by a typical twochannel Maxwellian optical system, not shown in the diagram. The incoherent light is produced by a tungstenlight source and passes through monochrometers, one i.neach channel. It is combined with the interferometricbeams by beam splitter BS2. The beams from the twointerferometers and the incoherent channels are focusedon the observer's pupil plane by a final (Maxwellian) lens,L6. The size of the incoherent image at the pupil planeis smaller than 2 mm so that no light is occluded by the
L6
INCOHERENTBACKGROUND
LS
BSI
PBSI LPI HPAOM
LP2'SECOND n
INTERFERENCE ·--------11FRINGE
Optical DesignThe new apparatus consists of two similar interferometers,each of which has its own laser source. Typically, thelaser source of each interferometer is of a different wavelength so that one can produce chromatic fringes bysuperimposing the interferometers' outputs. The spatialfrequency, orientation, contrast, phase, and temporal frequency of the two interference fringes can be controlledindependently in each interferometer. All these parameters are under computer control, except for spatial frequency and orientation for one of the interferometers,which are controlled manually. Otherwise the twodevices are identical.
Figure 1 shows one of the two interferometers. A polarized laser beam, produced by the laser source, LS, firstpasses through a half-wave retardation plate, HP, and alinear polarizer, LPl. The orientation of LPl determinesthe relative intensity of two orthogonally polarized components, Sand P, which in turn determine the maximumcontrast of the interference fringe. Usually LPl is adjusted to equate the two polarization components so thatunity contrast is obtained. The rotation of HP about theoptical axis rotates the plane of polarization. The polarization direction relative to the plane of preferred transmission of LPl determines the total intensity of theinterference fringe, preserving the relative intensity of thetwo polarized components. The laser beam is divided intwo by the polarization beam splitter, PBSl. The S component is reflected and the P component is transmitted.Each beam passes through an acousto-optic modulator,AOM, that controls the contrast and the spatial phase ofthe interference fringe (see below). The two beams arerecombined by the polarization beam splitter, PBS2, which
APPARATUS: TWO-CHANNEL LASERINTERFEROMETERWilliams12 improved the design of a laser interferometerfor vision research to permit computer control of the parameters that specify the spatial and temporal propertiesof an interference fringe. Here we have made furtherimprovements of the previous design, constructing twoidentical interferometers that produce two fringes on theretina with a relative phase that can be precisely controlled. Our new interferometers are designed to phaselock the two fringes and to minimize fringe distortion.To do this we capitalized on the benefits of common-pathinterferometry.15.16 For most of their optical paths, thetwo interfering beams traverse the same components, sothat the resulting interference fringe is much less affectedby outside disturbances than in an interferometer inwhich the two beams are widely separated. Furthermore,the fringe distortion produced by optical components is reduced in the common-path scheme because the two interfering beams share the same components.
Whereas the need for stability favors the common-pathscheme, the control of all the fringe parameters, especiallycontrast and temporal frequency, requires the separationof the interfering beams into different optical paths in oneportion of the interferometer. However, the two beamscan still share a large portion of their optical paths if theyare tagged with different polarization states." We incorporated this concept into our design.

Sekiguchi et al. Vol. 10, No. 10/0ctober 1993/J. Opt. Soc. Am. A 2107
(1)
PULSE OVERLAP (%)
Fig. 2. Contrast of the interference fringes produced by the twopolarization interferometers as a function of the temporal overlapbetween a pair of pulsed interfering beams. Circles anddiamonds represent the results for interferometer A and interferometer B, respectively.
separation between the two interfering point sources atthe pupil plane with a narrow slit attached to a micrometertranslational stage. This was done for both vertical andhorizontal interference fringes (632.8 nm) every 30 c/degup to and including 150 c/deg. The resulting frequencyerror was measurable at very high spatial frequencies butnever exceeded 3%.
10010
ContrastThe fringe contrast is controlled by the pulse-overlap technique described by Willtams.P Each laser beam ischopped by an acousto-optic modulator (AOM) into 1-mspulses at 500 Hz. The contrast of the fringe is controlledby the temporal overlap of the two pulses, one from eachAOM. That is, when the two pulses occur simultaneously,the fringe contrast is 100%. Reducing the overlap in timeof the pulse pair reduces the contrast, which reaches 0 contrast when the pulses do not overlap at all. This methodpermits control of the contrast without changing the totalamount of light arriving at the retina.
The fringe contrast for both interferometers was calibrated with a high-resolution CCD camera. The interference fringe was imaged on the CCD array, and weprocessed the output from the central 512 X 512 pixelswith a fast-Fourier-transform program to obtain its frequency spectrum. We then filtered the spectrum near±5% of the fundamental frequency, transformed the resultback to the space domain, and calculated the Michelsoncontrast. Figure 2 shows the measured fringe contrast asa function of the nominal contrast defined by the ratio ofpulse overlap. The results for the two interferometers arequite similar. The results indicate a residual contrast of-4% at low contrast levels. This residual contrast is generated by polarization cross talk between the two beamsof the interferometer. We believe that most of this crosstalk is produced by the microscope's objective lens in thespatial filter and by incomplete extinction by the polarization beam splitters. All the contrast-sensitivity measurements described below were made in a contrast range wellabove that for which the residual contrast was problematic. This was done with the use of an incoherent background. The background reduced the residual contrastbelow interference-fringe contrast threshold for the ob-
Spatial Frequency and OrientationThe fringe spatial frequency, f (c/deg), is proportional tothe separation, d (mm), between the two point sources inthe entrance pupil and is approximately represented by
'TTdf = 180A'
where A (mm) is the wavelength of a laser source. Fringeorientation is perpendicular to the orientation of the twopoint sources in the entrance pupil. The glass cube, C,refracts the two beams, displacing them by equal amountsin opposite directions. The amount and the direction ofthis displacement depend on the orientation of the cube.The two rotational axes of the glass cube are perpendicular to each other and to the optical axis, permitting control of the positions of the point sources in two dimensions.The glass cube is conjugate with the entrance pupil of theeye, so that the beam displacements that it produces arefaithfully rendered in the pupil. Since the displacementsare always symmetric about the optical axis, spatial frequency and orientation can be controlled without the needfor realigning the observer's eye. The spatial frequencyand orientation of one of the fringes can be controlled by acomputer, while those of the other fringe are controlledmanually with a fine micrometer screw that provides continuous adjustment. of spatial frequency and orientation.In the present system both a He-Ne laser (632.8 nm) and aHe-Cd laser (441.6 nm; used in the study reported in thecompanion paper14) are aligned as potential sources forthe interferometer with the computer-controlled cube, andan Ar" laser (514.5 nm) is the source for the interferometer with the manually controlled cube. We will refer tothe former as interferometer A and the latter as interferometer B.
The fringe spatial frequency and orientation for interferometer A were calibrated by two different methods. Inthe first method, a Ronchi ruling of known spatial frequency was placed at field stop FS1 shown in Fig. 1. Theobserver saw the interference fringe superimposed uponthe ruling and adjusted the fringe spatial frequency tominimize the frequency of the moire pattern generatedby them. We used five Ronchi rulings (8.6, 12.9, 17.2,21.5, and 25.8 c/deg) to calibrate both horizontal and vertical fringes produced by a He-Ne laser (632.8 nm) and aHe-Cd laser (441.6 nm), In the second method, we calibrated the higher spatial frequencies by measuring the
IrIS. The field stops, FS1 and FS2, are conjugate withthe retina.
We isolated the whole system from vibrations transmitted through the floor by floating the optical table on anarray of 10-in.-(25-cm) diameter inner tubes. Furthermore, the two interferometers are close together [built on a3 ft X 3 ft (1.1 m X 1.1 m) optical breadboard anchored tothe floating table] so that any variation in fringe positionof one interferometer tends to occur in the other, withthe relative phase relationship remaining constant. Wesurrounded most of the optical components by acrylicenclosures to reduce disturbances resulting from air circulation. This is particularly effective for the pathwaybetween PBS1 and PBS2, which is only the place wherethe two interfering beams in each interferometer areseparated.

2108 J. Opt. Soc. Am. A/Vol. 10, No. lO/October 1993 Sekiguchi et al.
server (_0.5%).12,17 At higher contrast levels the actualcontrast is proportional to the nominal contrast, althoughit is very slightly lower (1-2%). We attributed the lowerfringe contrast to the presence of speckle noise.
Phase (Drift Rate)The AOM's also controlled the spatial phase of the interference fringes as described by Coletta et al. 15 The relativephase shift in the 40-MHz signals that drive the ADM'sproduces a delay in one of the wave fronts relative to theother to produce a spatial phase shift in the resulting interference fringe. To produce a drifting interferencefringe, we update the phase shift every 2 ms (500 Hz),which permits smooth drift at any temporal frequencywithin the visible range.
Fringe StabilityFor a pure isoluminant interference fringe to be produced,the phases of the two component fringes must be stable.A phase shift of one fringe relative to the other causes aluminance artifact that affects measured isoluminantcontrast sensitivity. When the temporal frequency wasnominally zero, the fringe stability, in terms of the relative phase shift between the two interference fringes, wasmeasured with the high-resolution CCD camera. A circular aperture placed at the position conjugate to the CCDarray in each interferometer was aligned so that twofringes were adjacent to each other on the CCD array.5-c/deg fringes of unity contrast produced by a He-Nelaser (632.8 nm) and an Ar " laser (514.5 nm) were tested.We took an image containing both fringes, and we processed each fringe image independently with a fastFourier-transform program to obtain phase information.Images were collected every 10 min over a period of 2 h.The results show that the relative phase shift is very slow,approximately 2 deg of phase angle per minute. Theseslow phase shifts were probably caused by thermal drift inthe optical system.
Fringe DistortionThe fringe distortion produced by the optical componentsin the apparatus was estimated as the minimum moirefrequency produced between the fringe and the retinalimage of a Ronchi ruling placed at field stop FS1 shownin Fig. 1. For both interferometers the resulting moirepattern was less than 1 cycle across the circular test field6 deg in diameter. The local phase error that was observed when two fringes with the same spatial frequencyand orientation were added together on the retina wasmeasured in terms of the frequency of a nonlinear distortion product.P''" The measurement was done with 632.8and 514.5-nm interference fringes. We confirmed that,with a careful adjustment of the manually controlled glasscube, we could achieve no measureable local phase errorwithin at least a central 2-deg field.
Alignment ProcedureThe procedure for aligning the observer's eye in the apparatus was similar to that described by Williams.12 First,on the basis of the alignment procedure in the conventional Maxwellian view, the observer's pupil center wasaligned to the apparatus. Second, some observers required a small adjustment along the system's optical axis
to minimize the granular appearance of the test field.This minimization occurs when the point sources are focused on the corneal surface. Third, the observer's eyewas realigned both horizontally and vertically with respectto its Stiles-Crawford maximum in the entrance pupil, instead of the pupil center, so that the effectiveness of thetwo beams from each interferometer could be kept equal.The circular field stop placed at FS1 was temporarilymoved to a position that rendered it out of focus, and thefringe spatial frequency was set to -90 c/deg. This procedure produces a double image of the field stop on theretina: horizontal and vertical fringes produce verticaland horizontal displacements, respectively. The horizontal or vertical positioning was achieved by making the twofields, displaced horizontally or vertically, equally bright.
ARTIFACTS IN THE GENERATION OFTWO-COLOR GRATINGSOne persistent problem in producing isoluminant gratingsis the possibility of generating a luminance artifact that isdue to chromatic aberration in the eye. When isoluminant gratings are produced by simply adding red andgreen gratings of the same spatial properties, a luminanceartifact can be introduced in any of three ways: as a result of (1) an amplitude difference, (2) a magnification difference, or (3) a phase shift between the two components.
If one component is blurred more than the other, a luminance modulation appears in the sum. Such amplitudedifferences can occur with conventional gratings becauseof axial chromatic aberration and diffraction of the eye,which demodulate gratings by an amount that depends ontheir wavelength. Many investigators have used achromatizing lenses to correct axial chromatic aberration.2,22-24
We used interference fringes, which not only avoid axialchromatic aberration but also avoid diffraction and monochromatic aberrations of the eye.
If there is a difference in spatial frequency between thetwo components, a luminance modulation also appears inthe sum. Such a magnification (spatial-frequency) errorcan occur both with conventional gratings and with interference fringes because of transverse chromatic aberrationof the eye, which displaces the principal rays of the gratings by an amount that depends on their wavelength andincident angle. Note that the achromatizing techniqueoften used with conventional gratings to correct for axialchromatic aberration does not correct for transverse chromatic aberration.25,26 Therefore, whether one uses conventional gratings or interference fringes, one must takeadditional steps to equate the spatial frequency of the twocomponent gratings. In our experiment each observerequated the spatial frequencies of the fringes from thetwo interferometers.
If the phase of one component is shifted relative to thatof the other, a spurious luminance modulation also appears in the sum. Such phase shifts can occur both withconventional gratings and with interference fringes because of displacements of the light entering the pupil withrespect to the achromatic axis of the eye's optics. In theMaxwellian view head and eye movements cause such displacements. In Appendix A we describe a ray-tracing estimate of how large the relative phase shift that is due tothe observer's head and eye movements might be for

Sekiguchi et al, Vol. 10, No. 10/0ctober 1993/J. Opt. Soc. Am. A 2109
PSYCHOPHYSICAL TECHNIQUE
1S0LUMINANTlAACONTRAST
ISOCHROMATIC L 2 sec -'
CONTRAST C=2iL t
Fig. 3. Oppositely drifting red-green interference fringes.(a) Red and green fringes drifting in opposite directions at0.25 Hz, (b) resulting isoluminant and isochromatic contrastmodulated sinusoidally at 0.5 Hz.
red-green interference fringes. We show that head movements are expected to produce much larger effects thanare eye movements and that these effects become particularly disruptive at higher spatial frequencies. We alsoprovide estimates of the effects of head movements onmeasured isoluminant contrast sensitivity. Our computations suggest that head movements prevent measurement of isoluminant contrast sensitivity at high spatialfrequencies with static interference fringes. This resultis consistent with the observers' subjective observations:at spatial frequencies higher than 8-10 c/deg, most observers found it difficult to preserve the relative phase ofthe red and the green interference fringes. At low spatialfrequencies they had no difficulty.
Drifting TechniqueIn order to reduce the effect of head movements, we havedeveloped a new psychophysical technique, which we referto simply as the drifting technique. In this technique ared (632.8-nm) and a green (514.5-nm) interference fringeof equal spatial frequency, orientation, and space-averagedretinal illuminance were drifted slowly in opposite directions at 0.25 Hz, as shown in Fig. 3(a). When the fringesare in phase, the stimulus consists only of luminance variations in the yellow (mixture of red and green) field.When they are out of phase, the stimulus consists of alternating red and green bars. Each condition appears onceduring each temporal cycle, as shown in Fig. 3(b). Thisstimulus can be thought of as the sum of an isochromaticand an isoluminant grating, with the contrast of eachmodulated sinusoidally at 0.5 Hz.
The advantage of this oppositely drifting fringe stimulus over conventional static grating stimuli is that we canalways guarantee a purely isochromatic and a purely isoluminant stimulus during each cycle of stimulus presentation. Eye or head movements can slightly advance ordelay when these events occur, but they do not eliminatethem. This technique avoids the uncertainty in adjustingthe relative phase of the two interference fringes that
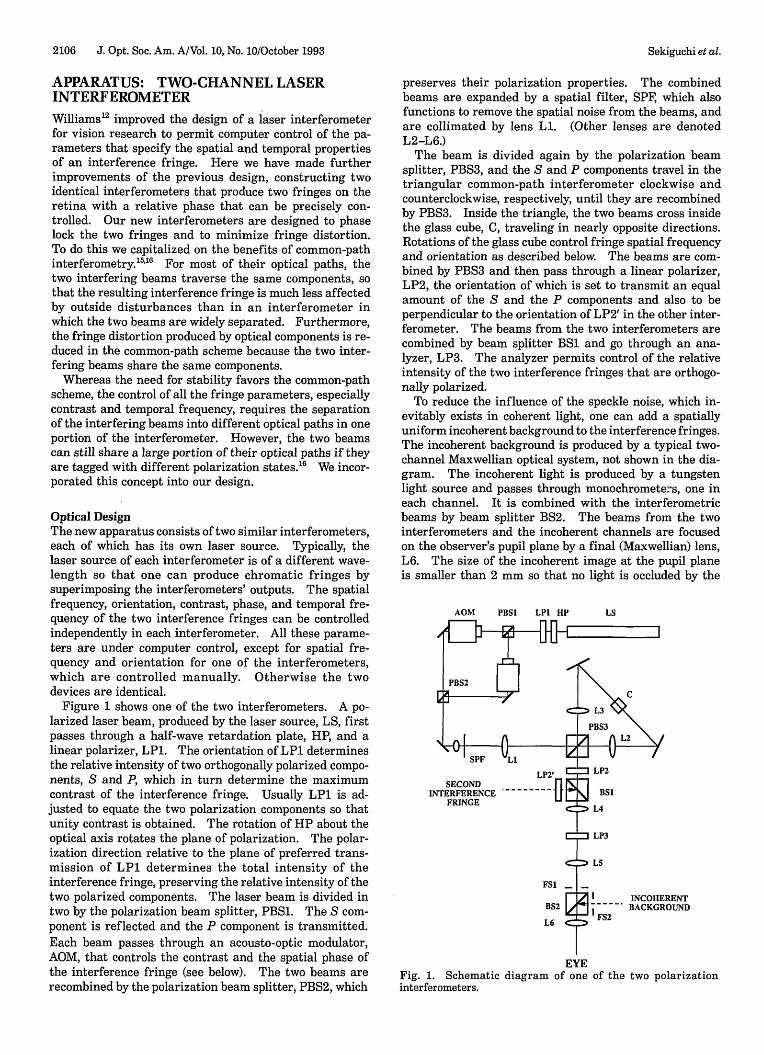
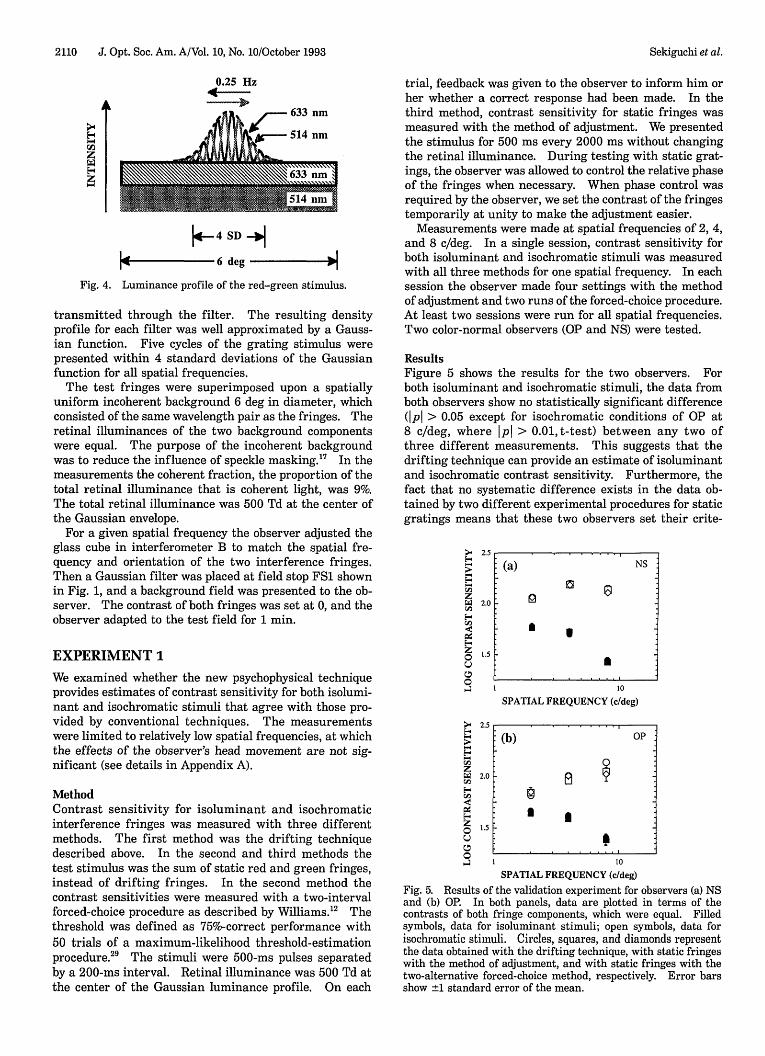
Test Stimulus and ProcedureAs shown in Fig. 4, we presented all fringes in a circularfield windowed by a Gaussian aperture to eliminate thepossibility of an edge artifact.27
•28 The Gaussian lumi
nance profile was produced by placement of a photographictransparency at field stop FSI shown in Fig. 1. The twodimensional Gaussian density distribution was generatedby a computer, and the image was directly photographedby a film recorder. The size of each pixel is 0.48 arcmin,which is not resolved by the eye's optics. Since the typicalphotographic process is known to be nonlinear, we calibrated the Gaussian filters by measuring with a highresolution CCD camera the intensity profile of the light
exists when static fringe stimuli are used, particularly athigh spatial frequencies and when they are presented inthe parafovea. The phase uncertainty may cause a luminance artifact when we try to add the two interferencefringes 180 deg out of phase, or it may reduce the luminance contrast when we try to add them in phase. Thesefactors could distort the estimates of both isoluminant andisochromatic contrast sensitivities.
In all cases the contrasts of the two fringes were equal,and the observer adjusted the contrasts of the two fringessimultaneously to find threshold. In order to measureisochromatic contrast sensitivity, the observer adjustedthe contrast until the luminance modulation was just detectable. In order to measure isoluminant contrast sensitivity, the observer adjusted the contrast until the red andgreen modulation was just detectable. These two tasksturned out to be easy for observers to perform.
The criterion for determining the isoluminant contrastthreshold is based on the appearance of chromatic stripes.This itself may help to avoid the influence of a luminanceartifact, but we still wish to deliver the highest-possibleisoluminant (chromatic) contrast to the observer, whichoccurs only when the red and green fringes are exactlyout of phase. The underlying assumption in this technique is that the observer can distinguish chromatic eventsfrom luminance events and independently determinethreshold for each in a single stimulus. This assumptionis tested below in experiment 1.
Flicker PhotometryThe space-averaged retinal illuminances of the two interference fringes were equated for each observer by flickerphotometry. The red (632.8-nm) and the green (514.5nm) interference fringes were set at zero contrast andzero spatial frequency and were presented alternately at12 Hz. The observer fixated the center of the field andadjusted an analyzer, LP3 in Fig. 1, to control the relativeintensity of the red and the green lights to minimizeflicker. The total retinal illuminance was kept constantat 500 trolands (Td). The test stimuli were presented in asharp-edged circular field, and no background field wasused. In Appendix B we estimate the distortion in measured isoluminant contrast sensitivity caused by errors inflicker photometry. The effects are less severe thanthose caused by the relative phase shift between the twofringe components. Weestimate that variability in flickersettings, which may appear depending on the spatial frequency or stimulus size, would not affect measured isoluminant contrast sensitivity by more than 0.1 log unit.
0.25 Hz
+--
'\f\N\J\!\-+
'\f\N\J\!\(b)
RED FRINGE
GREEN FRINGE
(a)
2110 J. Opt. Soc. Am. A/Vol. 10, No. 10/0ctober 1993 Sekiguchi et at.
Fig. 4. Luminance profile of the red-green stimulus.
2.5 .(a) NS
~ e2.0
g
I •1.5 •
10
SPATIAL FREQUENCY (c/deg)
2.5 I
(b) OP
2.0 B ~©I I
1.5 •
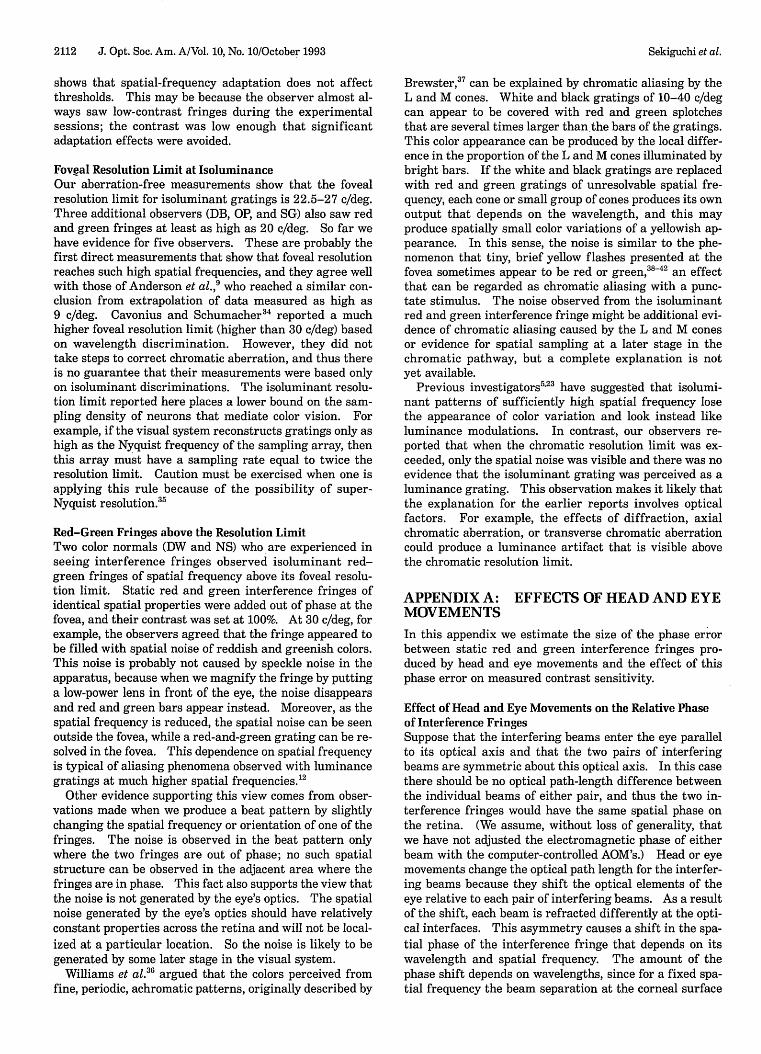
ResultsFigure 5 shows the results for the two observers. Forboth isoluminant and isochromatic stimuli, the data fromboth observers show no statistically significant difference(ipi > 0.05 except for isochromatic conditions of OP at8 c/deg, where Ipi > 0.01, t-test) between any two ofthree different measurements. This suggests that thedrifting technique can provide an estimate of isoluminantand isochromatic contrast sensitivity. Furthermore, thefact that no systematic difference exists in the data obtained by two different experimental procedures for staticgratings means that these two observers set their crite-
trial, feedback was given to the observer to inform him orher whether a correct response had been made. In thethird method, contrast sensitivity for static fringes wasmeasured with the method of adjustment. We presentedthe stimulus for 500 ms every 2000 ms without changingthe retinal illuminance. During testing with static gratings, the observer was allowed to control the relative phaseof the fringes when necessary. When phase control wasrequired by the observer, we set the contrast of the fringestemporarily at unity to make the adjustment easier.
Measurements were made at spatial frequencies of 2, 4,and 8 c/deg. In a single session, contrast sensitivity forboth isoluminant and isochromatic stimuli was measuredwith all three methods for one spatial frequency. In eachsession the observer made four settings with the methodof adjustment and two runs of the forced-choice procedure.At least two sessions were run for all spatial frequencies.Two color-normal observers (OP and NS) were tested.
>Eo<:>ECI)
z~CI)
Eo<CI)
<c::Eo<;ZoUeo...:l 10
SPATIAL FREQUENCY (c/deg)
Fig. 5. Results of the validation experiment for observers (a) NSand (b) OP. In both panels, data are plotted in terms of thecontrasts of both fringe components, which were equal. Filledsymbols, data for isoluminant stimuli; open symbols, data forisochromatic stimuli. Circles, squares, and diamonds representthe data obtained with the drifting technique, with static fringeswith the method of adjustment, and with static fringes with thetwo-alternative forced-choice method, respectively. Error barsshow ±1 standard error of the mean.
~I
14 nm
\4-4 SD-.J
0.25 Hz~
14------6 deg -------
EXPERIMENT 1We examined whether the new psychophysical techniqueprovides estimates of contrast sensitivity for both isoluminant and isochromatic stimuli that agree with those provided by conventional techniques. The measurementswere limited to relatively low spatial frequencies, at whichthe effects of the observer's head movement are not significant (see details in Appendix A).
transmitted through the filter. The resulting densityprofile for each filter was well approximated by a Gaussian function. Five cycles of the grating stimulus werepresented within 4 standard deviations of the Gaussianfunction for all spatial frequencies.
The test fringes were superimposed upon a spatiallyuniform incoherent background 6 deg in diameter, whichconsisted of the same wavelength pair as the fringes. Theretinal illuminances of the two background componentswere equal. The purpose of the incoherent backgroundwas to reduce the influence of speckle masking.F In themeasurements the coherent fraction, the proportion of thetotal retinal illuminance that is coherent light, was 9%.The total retinal illuminance was 500 Td at the center ofthe Gaussian envelope.
For a given spatial frequency the observer adjusted theglass cube in interferometer B to match the spatial frequency and orientation of the two interference fringes.Then a Gaussian filter was placed at field stop FSI shownin Fig. 1, and a background field was presented to the observer. The contrast of both fringes was set at 0, and theobserver adapted to the test field for 1 min.
MethodContrast sensitivity for isoluminant and isochromaticinterference fringes was measured with three differentmethods. The first method was the drifting techniquedescribed above. In the second and third methods thetest stimulus was the sum of static red and green fringes,instead of drifting fringes. In the second method thecontrast sensitivities were measured with a two-intervalforced-choice procedure as described by Williams.P Thethreshold was defined as 75%-correct performance with50 trials of a maximum-likelihood threshold-estimationprocedure." The stimuli were 500-ms pulses separatedby a 200-ms interval. Retinal illuminance was 500 Td atthe center of the Gaussian luminance profile. On each

Sekiguchi et at. Vol. 10, No. 10/0ctober 1993/J. Opt. Soc. Am. A 2111
Table 1. Results of Foveal Resolution for Isoluminant and Isochromatic Interference Fringes
Foveal Resolution Limit (e/deg)
three color-normal observers (OP, DB, and SG) viewedthe red and green interference fringes at 20 c/deg only,and all three reported resolving red and green stripes.
Observer Mean Standard Error Mean Standard Error
Isochromatic IsoluminantDISCUSSION
EXPERIMENT 2
rion in the adjustment procedure close to that establishedby the forced-choice procedure. Head-movement artifactsforced us to limit this comparison to low spatial frequencies. We assume that the validation established at lowfrequencies holds at high frequencies, as well.
ResultsResults are shown in Table 1. For the isochromatic interference fringe, the foveal resolution limit for each observeris ~48 c/deg, slightly lower than the previous estimates ofthe foveal resolution limit.3o
,31 Since we did not use anincoherent background, this result is probably due to theinfluence of speckle masking. However, even thoughspeckle noise lowers the visibility of the interferencefringe, both observers saw red and green stripes at spatialfrequencies higher than 20 c/deg. The results show thatthe foveal resolution limits for observers DW and NS were27 and 22.5 c/deg, respectively. These are substantiallyhigher than had previously been measured. An additional
MethodWe measured the foveal resolution limit for both isoluminant and isochromatic modulations with the drifting technique. In order to produce continuous spatial-frequencyadjustment, we replaced the final Maxwellian lens, L6 inFig. 1, with a camera zoom lens (focal length 80-200 mm),With this lens, the spatial-frequency range was set between 15 and 38 c/deg for isoluminant measurements andbetween 29 and 72 c/deg for isochromatic measurements.The red (632.8-nm) and the green (514.5-nm) interferencefringes of unity contrast were windowed by a sharpedged circular aperture. No background was used. Withthese two fringes, the effective contrasts for the longwavelength-sensitive (L) and for the middle-wavelengthsensitive (M) cones produced by the isoluminant stimuluswere 25% and 69%, respectively. The size of the circularfield decreases with increasing spatial frequency, with thenumber of grating cycles kept constant. In this experiment the diameter of the circular field was set at 6 deg forobserver DW and at 2 deg for observer NS; these diameterswere determined at 24 and 45 c/deg for isoluminant conditions and for isochromatic conditions, respectively.To measure the foveal resolution limit for isochromaticstimuli, the observer adjusted the power of the zoomlens so that the luminance modulation was just detectable. For isoluminant stimuli the observer adjusted thezoom lens so that the red-green modulation was just detectable. A total of eight settings, four each for isoluminant and for isochromatic modulations, were made by theobserver. Two color-normal persons (DW and NS) servedas observers.
In this study a new psychophysical technique was developed for measuring isoluminant contrast sensitivity atmiddle and high spatial frequencies without the influenceof diffraction and aberrations of the eye. With our technique we have clear evidence that the foveal resolutionlimit for the red and green isoluminant interferencefringe exceeds 20 c/deg.
Influence of Masking and FacilitationThe results reveal additional important aspects of the useof the drifting technique. We found no evidence of masking or facilitation between the isoluminant and the isochromatic modulations; these effects have been reportedfor studies in which these two modulations are presentedsimultaneously.f'f" That such an interaction for thedrifting stimulus was not observed is revealed by the goodagreement of the contrast-sensitivity data obtained withthe oppositely drifting fringes and the data obtained withthe conventional static fringes (which contain either isoluminant or isochromatic modulation but not both). Thisresult may be explained by the difference in temporal factors. The previous studies found masking or facilitationeffects when isoluminant and isochromatic stimuli werepresented simultaneously. On the other hand, our drifting fringes produce the isoluminant and the isochromaticfringes in temporal quadrature. The maximum fringemodulations appear alternately approximately every 1 s.This temporal offset between isoluminant and isochromatic modulations probably reduces the interactions.
Appearance of the Test StimulusThe appearance of the test stimulus, the sum of a red anda green fringe of the same spatial properties drifting inopposite directions, can be described as a pair of counterphase gratings from which the isoluminant and the isochromatic modulation appear alternately. No particularmotion (e.g., either right or left) can be perceived when thetwo fringes are approximately isoluminant. Our stimulusis similar to that used in the judging of isoluminance witha minimum-motion technique.22
,32,33 This stimulus consisted of two gratings: a red-and-green grating and alight-and-dark-yellow grating, each of which appearedalternately with the phase reversed from that of its predecessor. The apparent motion of the stimulus was minimized when the red and green bars were isoluminant.We observed the same phenomenon at isoluminance, although the motion null was not so clearly defined as theflicker nulls that we obtained with flicker photometry.
Influence of Spatial-Frequency AdaptationAnother important aspect to be considered is the influenceof spatial-frequency adaptation. With oppositely driftingfringes, gratings of the same spatial frequency and orientation are presented more or less continuously, though thedirection of modulation in color space is always changing.However, the good agreement between contrast sensitivities with the drifting and with the conventional techniques
0.10.1
27.022.5
0.40.8
48.647.6
DWNS
2112 J. Opt. Soc. Am. A/Vol. 10, No. 10/0ctobe!-" 1993 Sekiguchi et at.
shows that spatial-frequency adaptation does not affectthresholds. This may be because the observer almost always saw low-contrast fringes during the experimentalsessions; the contrast was low enough that significantadaptation effects were avoided.
Foveal Resolution Limit at IsoluminanceOur aberration-free measurements show that the fovealresolution limit for isoluminant gratings is 22.5-27 c/deg.Three additional observers (DB, OP, and SG) also saw redand green fringes at least as high as 20 c/deg, So far wehave evidence for five observers. These are probably thefirst direct measurements that show that foveal resolutionreaches such high spatial frequencies, and they agree wellwith those of Anderson et al.,9 who reached a similar conclusion from extrapolation of data measured as high as9 c/deg. Cavonius and Schumacher f reported a muchhigher foveal resolution limit (higher than 30 c/deg) basedon wavelength discrimination. However, they did nottake steps to correct chromatic aberration, and thus thereis no guarantee that their measurements were based onlyon isoluminant discriminations. The isoluminant resolution limit reported here places a lower bound on the sampling density of neurons that mediate color vision. Forexample, if the visual system reconstructs gratings only ashigh as the Nyquist frequency of the sampling array, thenthis array must have a sampling rate equal to twice theresolution limit. Caution must be exercised when one isapplying this rule because of the possibility of superNyquist resolution."
Red-Green Fringes above the Resolution LimitTwo color normals (DW and NS) who. are experienced inseeing interference fringes observed isoluminant redgreen fringes of spatial frequency above its foveal resolution limit. Static red and green interference fringes ofidentical spatial properties were added out of phase at thefovea, and their contrast was set at 100%. At 30 c/deg, forexample, the observers agreed that the fringe appeared tobe filled with spatial noise of reddish and greenish colors.This noise is probably not caused by speckle noise in theapparatus, because when we magnify the fringe by puttinga low-power lens in front of the eye, the noise disappearsand red and green bars appear instead. Moreover, as thespatial frequency is reduced, the spatial noise can be seenoutside the fovea, while a red-and-green grating can be resolved in the fovea. This dependence on spatial frequencyis typical of aliasing phenomena observed with luminancegratings at much higher spatial frequencies."
Other evidence supporting this view comes from observations made when we produce a beat pattern by slightlychanging the spatial frequency or orientation of one of thefringes. The noise is observed in the beat pattern onlywhere the two fringes are out of phase; no such spatialstructure can be observed in the adjacent area where thefringes are in phase. This fact also supports the view thatthe noise is not generated by the eye's optics. The spatialnoise generated by the eye's optics should have relativelyconstant properties across the retina and will not be localized at a particular location. So the noise is likely to begenerated by some later stage in the visual system.
Williams et al.36 argued that the colors perceived fromfine, periodic, achromatic patterns, originally described by
Brewster." can be explained by chromatic aliasing by theLand M cones. White and black gratings of 10-40 e/degcan appear to be covered with red and green splotchesthat are several times larger than, the bars of the gratings.This color appearance can be produced by the local difference in the proportion of the Land M cones illuminated bybright bars. If the white and black gratings are replacedwith red and green gratings of unresolvable spatial frequency, each cone or small group of cones produces its ownoutput that depends on the wavelength, and this mayproduce spatially small color variations of a yellowish appearance. In this sense, the noise is similar to the phenomenon that tiny, brief yellow flashes presented at thefovea sometimes appear to be red or green,38-42 an effectthat can be regarded as chromatic aliasing with a punctate stimulus. The noise observed from the isoluminantred and green interference fringe might be additional evidence of chromatic aliasing caused by the Land M conesor evidence for spatial sampling at a later stage in thechromatic pathway, but a complete explanation is notyet available.
Previous investigators'r" have suggested that isoluminant patterns of sufficiently high spatial frequency losethe appearance of color variation and look instead likeluminance modulations. In contrast, our observers reported that when the chromatic resolution limit was exceeded, only the spatial noise was visible and there was noevidence that the isoluminant grating was perceived as aluminance grating. This observation makes it likely thatthe explanation for the earlier reports involves opticalfactors. For example, the effects of diffraction, axialchromatic aberration, or transverse chromatic aberrationcould produce a luminance artifact that is visible abovethe chromatic resolution limit.
APPENDIX A: EFFECTS OF HEAD AND EYEMOVEMENTS
In this appendix we estimate the size of the phase errorbetween static red and green interference fringes produced by head and eye movements and the effect of thisphase error on measured contrast sensitivity.
Effect of Head and Eye Movements on the Relative Phaseof Interference FringesSuppose that the interfering beams enter the eye parallelto its optical axis and that the two pairs of interferingbeams are symmetric about this optical axis. In this casethere should be no optical path-length difference betweenthe individual beams of either pair, and thus the two interference fringes would have the same spatial phase onthe retina. (We assume, without loss of generality, thatwe have not adjusted the electromagnetic phase of eitherbeam with the computer-controlled AOM's.) Head or eyemovements change the optical path length for the interfering beams because they shift the optical elements of theeye relative to each pair of interfering beams. As a resultof the shift, each beam is refracted differently at the optical interfaces. This asymmetry causes a shift in the spatial phase of the interference fringe that depends on itswavelength and spatial frequency. The amount of thephase shift depends on wavelengths, since for a fixed spatial frequency the beam separation at the corneal surface

(A2)
For any grating spatial frequency, we let the constants TL
and Tc represent contrast threshold for gratings thatstimulate each mechanism alone. We can write themechanism responses in terms of the contrasts CL andCc seen by each mechanism and of these contrastthresholds: RL = CL/TL and Rc = Cc/Tc. We allow thecontrast thresholds for each mechanism to depend' ongrating spatial frequency, but we assume that the spectralresponsivity of each mechanism is independent of thisspatial frequency.53,54 We also assume that the responseof each mechanism does not depend on the spatial phase ofthe grating.
We next determine CL and Cc as a function of the phaseerror between the two fringes. Recall that static red-
Vol. 10, No. lO/October 1993/J. Opt. Soc. Am. A 2113
Effect of Phase Error on Measured Contrast SensitivityTo understand the effect of head and eye movements onred-green-isoluminant contrast sensitivity measured withstatic interference fringes, we estimated the effect of thephase error between the two components on measuredcontrast sensitivity. To do this, we required a model forhow the visual system detects sinusoidal gratings. In thecalculations that follow, we assume that the detection ofour red and green interference fringes is mediated by theresponses RL and Rc of a luminance mechanism and achromatic mechanism, respectively. Each mechanism responds linearly to grating contrast, but the two mechanisms are characterized by different spectral responsivityfunctions: the luminance mechanism does not respondto spatial modulations that are isoluminant, and the chromatic mechanism does not respond to spatial modulationthat have a constant chromaticity. We assume a vectorlength model of summation between the responses of thetwo mechanisms'v" so that a stimulus is above contrastthreshold when
20 c/deg. Figure 6(a) shows the phase error as a functionof eye rotation, assuming that the observer tries to fixatethe test stimulus. The phase error increases monotonically with the amount of eye rotation and the fringespatial frequency. The size of fixational eye movementsis estimated to be as large as 10 arcmin.tv" The phaseerror between 632.8- and 514.5-nm interference fringesproduced by an eye movement of 10 arcmin is -1.5 deg at8 c/deg and 2.7 deg at 20 c/deg. Figure 6(b) shows thephase error as a function of head translation. The resultsshow that the phase error increases monotonically withthe amount of head translation and the fringe spatial frequency. Since we are unaware of direct measurements ofthe size of head translations for an observer clenching abite bar, we made estimates based on the conservativeassumption that all the within-session variability in measurements of the Stiles-Crawford maximum made byWilliams'" and those of transverse chromatic aberrationmade by Simonet and Campbell'" was caused by headmovements. Our calculation based on that assumptionsuggests that typical head translations range between 130and 460 iux»; A lateral head movement of 300 /Lm, forexample, produces a phase error of 30 deg at 8 c/deg and70 deg at 20 c/deg, each of which is more than 20 timesgreater than that from typical fixational eye movements.
(AI)
135
(b)90
enQ)s 45
c.::0c.:: 0c.::r..;lr..;l -4500-<::::Q" -90
-------135-0.50 -0.25 0.00 0.25 0.50
is approximately proportional to wavelength, as shownby Eq. (1), and thus the effect is smaller for shorterwavelength components.
To estimate the relative phase shift that is due to theobserver's head and eye movements for our red and greeninterference fringes, we made an optical ray tracing inwhich we used Snell's law to calculate the refraction ateach optical interface. We used Le Grand's schematic eyemodel" to define the optical interfaces. This modelprovides a good description of axial chromatic aberrationfor the wavelengths that we used (514.5-632.8 nm), Wemodeled eye movements as rotations of the eye about itsgeometrical center and head movements as lateral shiftsof the eye in a single plane. We traced the principal ray ofeach interfering beam and computed its optical path lengthas a function of head and eye position. The relative phase8 between the two interference fringes is given by
8 = ~Pl _ ~P2,Al A2
Sekiguchi et at.
(a)
enQ) 4S
c.::0c.:: 0c.::r..;lr..;l00 -4-<::::Q"
-8
-20 -10 0 10 20
EYE ROTATION (arcmin)
where Al and A2 are the wavelengths of the two interference fringes and ~Pl and ~P2 are the optical path-lengthdifferences between the individual beams of each fringe.(The problem can be described in one spatial dimensionbecause the two fringes have the same orientation: anymovements of the eye or the head along the direction ofthe fringe bars produce no phase error.)
Figure 6 shows the estimates of the phase differencebetween 632.8- and 514.5-nm interference fringes as afunction of eye and head movements. The calculationswere made for the fringe spatial frequencies of 8 and
HEAD TRANSLATION (mm)
Fig. 6. Phase error caused by (a) eye rotation and (b) head translation between 632.8- and 5l4.5-nm interference fringes.

2114 J. Opt. Soc. Am. A/Vol. 10, No. lO/October 1993 Sekiguchi et al.
green-isoluminant fringe stimuli consist of a red (632.8nm) and a green (514.5-nm) interference fringe of thesame spatial frequency, f, orientation, and contrast, C,which would be in spatial counterphase in the absence ofeye and head movements. Since the incoherent background is composed of the same wavelengths as those ofthe interference fringes, and since the retinal illuminances of the two background components are in the sameratio as that of the interference fringes, the effect of thebackground can be incorporated directly into the commoncontrast, C. We ignore effects of the Gaussian window.The intensity profiles of the red and the green components of the stimulus, lR and la, respectively, can be described as
IR(x) = ER[1+ C Si+X + :)lIa(x) = Ea[1 - C Sin(rx - :)]. (A3)
where ER and Ea represent the mean radiance of the redand the green interference fringes, respectively, and 8represents the phase error between them (8 = 0 indicatesspatial counterphase). When the fringes are superimposed upon the retina, the spatial modulation seen bythe luminance mechanism is given by
where AR is the wavelength of the red interference fringe,Aa is the wavelength of the green interference fringe, andSL(A) is the spectral responsivity of the luminance mechanism. By substituting for lR(X) and la(x) and then simplifying with the use of standard trigonometric identities,we can rewrite the modulation seen by the luminancemechanism as
hex) = KLB~1T + C{[KLB~O cos(8/2)P
+ [KLB~1T sin(8/2)pp/2 sin[fx - 'PL(8)], (A5)
where K LB-O= ERSL(AR) - EaSL(Aa), and K L
B=1T =ERSL(AR) + EaSL(Aa). The exact form of the phase 'PL(8)is not critical for the calculations that follow. Equation (A5) tells us that as the phase error 8 between the twointerference fringes changes, the modulation seen by theluminance mechanism is always a sinusoid with meanlevel K LB=1T. Both the amplitude and the phase of thissinusoid vary with 8. The constants IKLB=ol and IKLB~1T1
specify, for any contrast C, the amplitude of the sinusoidseen by the luminance mechanism when the two fringesare in spatial counterphase and in spatial register, respectively. Similarly, we can describe the modulation seen bythe chromatic mechanism as
le(x) = K eB=1T + C{[KeB=o cos(8/2)P
+ [KeB=1T sin(8/2)pp/2 sin[fx - 'Pe(8)], (A6)
where the definitions of KeB=o, KeB~7T, and 'Pe(8) are analogous to those of KLB=o, K L
B=1T, and 'PL(8), with the exceptionthat the spectral responsivity function of the luminancemechanism SL(A) is replaced by the spectral responsivityfunction of the chromatic mechanism SeCA). Because ourred and green interference fringes are isoluminant, we
know that the luminance mechanism does not respondwhen the fringes are presented in spatial counterphase sothat KLB=O = O. Because the chromatic mechanism doesnot respond to modulations of constant chromaticity, wealso have K C
B=1T = O. Thus the amplitudes of the modulations seen by the luminance and the chromatic mechanisms as a function of the phase error between the redand the green fringes are given by the expressionsCIKL
B=1Tlsin(8/2) and CIKcB=olcos(8/2), respectively. We define contrast scales for the luminance and the chromaticmechanisms so that mechanism contrast corresponds tothe common fringe contrast C when the fringes are perfectly in phase (8 = 7T) (for the luminance mechanism) andperfectly out of phase (8 = 0) (for the chromatic mechanism). From the preceding expressions for amplitude wesee that this implies that the contrast seen by the luminance mechanism as a function of phase error is given byCL(8) = C sin(8/2), while contrast seen by the chromaticmechanism is given by Ce(8) = C cos(8/2). Combiningthese two expressions with relation (A2), incorporatingthe relation between contrast and mechanism response,and solving for contrast threshold, we have that measuredcontrast threshold depends on the phase error accordingto
We define contrast sensitivity as the reciprocal of contrast threshold and let k represent the ratio of measuredcontrast sensitivity for isochromatic stimuli to that forisoluminant stimuli: k = Tc/TL • Then we can computethe ratio of the measured contrast sensitivity [1/C(8)] tothe contrast sensitivity that we would like to measure(l/Te) as a function of phase error by
Tc/C(8) = {[k sin(8/2)p + [cos(8/2)Pp/2. (A8)
Figure 7(a) plots the effect of the phase error on measuredisoluminant contrast sensitivity for two different choicesof k. Preliminary experiments show that the ratio of contrast sensitivity for isochromatic stimuli to that for theisoluminant stimuli is -0.5 log unit at 8 c/deg and -1.0 logunit at 20 c/deg. For these choices of k, our calculationsshow that measured isoluminant contrast sensitivity islowest when there is no phase error between the two grating components. That is, a phase error between the twofringes would make isoluminant contrast sensitivity appear to be higher than it really is. At 20 c/deg (whichroughly corresponds to the curve labeled 1.0 LOG), ourcalculations suggest that the phase error must be lessthan 8.8 deg for measurement of the isoluminant contrastsensitivity with an error smaller than 0.1 log unit. At8 c/deg (which roughly corresponds to the curve labeled0.5 LOG), the corresponding phase error is 29.5 deg.
In Fig. 7(b) the predicted error in contrast-sensitivitymeasurements for isoluminant fringes is shown replottedas a function of head translation. For both 8 and 20 c/deg,head translation increases the estimate of isoluminantcontrast sensitivity. The effect is more severe at thehigher spatial frequency. Our calculations suggest thatfor measuring isoluminant contrast sensitivity with anerror smaller than 0.1 log unit at 20 c/deg, the tolerable

APPENDIX B: EFFECTS OF ISOLUMINANCEERROR
HEAD TRANSLATION (urn)Fig. 7. (a) Effect of phase error on isoluminant contrast sensitivity, (b) effect of head translation on isoluminant contrastsensitivity.
(B2)
><Eo-~
~~
1.0Eo-~
~ooOZ 0.8~I:l;:l~oo
0.6I:l;:lEo-COO0< 0.4..J~
Z 0.20UZ 0.0~
Vol.10, No. 10/0ctober 1993/J. Opt. Soc. Am. A 2115
where k is again the ratio of isochromatic to isoluminantcontrast sensitivity.
Figure 8 shows the effects of an error in the luminanceratio on isoluminant contrast sensitivity. The artifactproduced by an error in the luminance ratio is typicallymuch less severe than that produced by a phase error.For example, if the ratio of contrast sensitivity for theisochromatic stimuli to that for the isoluminant stimuli is1.0 log unit, which it is at roughly 20 c/deg, our calculations suggest that the tolerable error in the luminanceratio is within the range ±16.5% for measuring red-greenisoluminant contrast sensitivity data with an accuracy of0.1 log unit. The standard errors in flicker photometryare typically very small. In our case the 99% confidenceinterval for the mean setting is less than ±10%. Thus weconclude that errors in the luminance ratio of our red togreen fringes are unlikely to have contaminated our measurements of isoluminant contrast sensitivity. We havealso performed our calculations with a model of contrastsensitivity that assumes that the two mechanisms contribute independently to grating detection.53
,54 The results of these calculations lead us to similar conclusionsabout the effect of luminance error on our measurements.
Tc/C(K) = {[k(l - K)/(l + K)P + 1P/2, (B3)
0.1 1 10
RIGFig. 8. Effects of isoluminance error on isoluminant contrastsensitivity.
expression for the contrast seen by the luminance mechanism as a function of the radiances ER and EG of the redand the green fringes, respectively. This expression is
The contrast seen by the chromatic mechanism does notchange with ER and EG , because this mechanism is assumed to adapt so that it never sees modulations of constant chromaticity.
If we let K represent the ratio of the luminance of thered component to that of the green component, K =ERSL(AR)/EGSL(AG), then we can simplify Eq. (B1) toCL(K) = Gil - KI/11 + KI. From this we can computethe ratio of measured contrast sensitivity to red-greenisoluminant contrast sensitivity by
C (E E) _ GlKL8=ol _ CIERSL(AR) - EGSL(AG)IL R, G - !KL8=1T1 - IERSdAR) + EGSL(AG)I' (B1)
Similarly, we can start with Eq. (A6) and derive for thechromatic mechanism that
180
LCSF/CCSF
60 120
PHASE ERROR (deg)
1.4
>< (b)E-c 1.2~
~~
1.0E-c~
~CIl
OZ 0.8~r.:l~CIl
0.6r.:lE-ce,:,CIl0< 0.4..J~
Z 0.20UZ 0.0~
-0.2-600 -450 -300 -150 0 150 300 450 600
This appendix provides an estimate of the difference in theluminance of the red and the green fringes on measuredisoluminant contrast sensitivity. Such a difference willproduce a luminance artifact, so that detection is mediated by both the luminance and the chromatic mechanisms. We make the computation for the case in whichthe gratings are presented in exact counterphase, corresponding to 8 = 0, as defined in Appendix A. Startingwith Eq. (A5), substituting for 8 = 0, and using the samedefinition of contrast as in Appendix A, we can derive an
head translation can be no more than 30 usn, which maybe difficult to achieve. At 8 c/deg, however, the tolerablehead translation can be as high as 304 usix. This is comparable with the size of typical head movements that weestimated above. This suggests that 8 c/deg is approximately the highest spatial frequency at which we can accurately measure isoluminant contrast sensitivity withstatic red-green interference fringes. The phase errorscaused by eye movements are so small that they producenegligible distortion in measured contrast sensitivity, evenat high spatial frequencies. We have also performed ourcalculations with a model of contrast sensitivity that assumes that the two mechanisms contribute independentlyto grating detection.53
,54 The results of these calculationslead us to substantially the same conclusions about the acceptable phase error.
Sekiguchi et al.
>< (a)E-c~
~~
1.0E-c~
~CIl
OZ 0.8~r.:l~CIl
0.6r.:lE-ce,:,CIl0< 0.4..J~
Z 0.20U
Z 0.0~
-180 -120 -60 0

2116 J. Opt. Soc. Am. A/VoL 10, No. 10/0ctober 1993 Sekiguchi et al.
ACKNOWLEDGMENTS
We thank Arthur Bradley for his comments on an earlierversion of this manuscript. We also thank Orin Packerand Sue Galvin for serving as observers and Bill Haakeand Alan Russell for technical assistance. This researchwas supported by grants EY04367, EY01319, EY06278,and EY09625 from the National Institutes of Health.
*Present address, Basic Research Department, OlympusOptical Co., Ltd., 2-3 Kuboyama, Hachioji, Tokyo 192Japan.
"Present address, Department of Psychology, Universityof California, Santa Barbara, Santa Barbara, California93106
REFERENCES
1. O. H. Schade, "On the quality of color-television images andthe perception of color detail," J. Soc. Motion Picture Telev.Eng. 67, 801-819 (1958).
2. G. J. C. Van der Horst, C. M. M. De Weert, and M. A.Boumann, "Transfer of spatial chromaticity-contrast atthreshold in the human eye," J. Opt. Soc. Am. 57,1260-1266(1967).
3. G. J. C. Van der Horst and M. A. Boumann, "Spatiotemporalchromaticity discrimination," J. Opt. Soc. Am. 59, 14821488 (1969).
4. R. Hilz and C. R. Cavonius, "Wavelength discrimination measured with square-wave gratings," J. Opt. Soc. Am. 60, 273277 (1970).
5. E. M. Granger and J. C. Heurtley, "Visual chromaticitymodulation transfer function," J. Opt. Soc. Am. 63, 11731174 (1973).
6. C. Noorlander, M. J. G. Heuts, and J. J. Koenderink, "Influence of the target size on the detection threshold for luminance and chromaticity contrast," J. Opt. Soc. Am. 70,1116-1121 (1980).
7. K. T. Mullen, "The contrast sensitivity of human color visionto red-green and blue-yellow chromatic gratings," J. PhysioL359, 381-400 (1985).
8. K. T. Mullen, "Colour vision as a post-receptoral specialization of the central visual field," Vision Res. 31, 119-130(1991).
9. S. J. Anderson, K. T. Mullen, and R. F.Hess, "Human peripheral spatial resolution for achromatic and chromatic stimuli:limits imposed by optical and retinal factors," J. PhysioL 442,47-64 (1991).
10. Y. Le Grand, "Sur la mesure de l'acuite visuelle au moyen defranges d'interference," C. R. Acad. Sci. Paris 200, 490-491.
11. F. W. Campbell and D. G. Green, "Optical and retinal factorsaffecting visual resolution," J. PhysioL 181, 576-593 (1965).
12. D. R. Williams, '1\liasing in human foveal vision," Vision Res.25, 195-205 (1985).
13. L. N. Thibos, A. Bradley, and D. L. Still, "Interferometricmeasurement of visual acuity and the effect of ocular chromatic aberration," AppL Opt. 30, 2079-2087 (1991).
14. N. Sekiguchi, D. R. Williams, and D. H. Brainard, "Efficiencyin detection of isoluminant and isochromatic interferencefringes," J. Opt. Soc. Am. A 10, 2118-2133 (1993).
15. S. Mallick, "Common-path interferometers," in Optical ShopTesting, D. Malacara, ed. (Wiley, New York, 1978), pp. 81104.
16. W. H. Steel, Interferometry, 2nd ed. (Cambridge U. Press,Cambridge, 1983).
17. D. R. Williams, "Visibility of interference fringes near theresolution limit," J. Opt. Soc. Am. A 2, 1087-1093 (1985).
18. N. J. Coletta, D. R. Williams, and C. L. M. Tiana, "Consequences of spatial sampling for human motion perception,"Vision Res. 30, 1631-1648 (1990).
19. G. J. Burton, "Evidence for non-linear response processes inthe human visual system from measurements on the threshold of spatial beat frequencies," Vision Res. 13, 1211-1225(1973).
20. D. I. A. MacLeod, D. R. Williams, and W. Makous, '1\ visualnonlinearity fed by single cones," Vision Res. 32, 347-363(1992).
21. N. Sekiguchi, D. R. Williams, and O. Packer, "Nonlinear distortion of gratings at the foveal resolution limit," Vision Res.31, 815-831 (1991).
22. S. Anstis and P. Cavanagh, '1\ minimum motion technique forjudging equiluminance," in Colour Vision, J. D. Mollon andL. T. Sharpe, eds. (Academic, London, 1983), pp. 155-166.
23. K. K. De Valois and E. Switkes, "Simultaneous maskinginteractions between chromatic and luminance gratings,"J. Opt. Soc. Am. 73, 11-18 (1983).
24. E. Switkes, A. Bradley, and K. K. De Valois, "Contrast dependence and mechanisms of masking interactions among chromatic and luminance gratings," J. Opt. Soc. Am. A 5,1149-1162 (1988).
25. F. W. Campbell and R. W. Gubisch, "The effect of chromaticaberration on visual acuity," J. PhysioL 192,345-358 (1966).
26. X. Zhang, A. Bradley, and L. N. Thibos, 'Achromatiaing thehuman eye: the problem of chromatic parallax," J. Opt. Soc.Am. A 8, 686-691 (1991).
27. F.W. Campbell, R. H. S. Carpenter, and J. Z. Levinson, "Visibility of aperiodic patterns compared with that of sinusoidalgratings," J. PhysioL 204, 283-298 (1969).
28. D. H. Kelly, "Effects of sharp edges on the visibility ofsinusoidal gratings," J. Opt. Soc. Am. 60, 98-103 (1970).
29. A. B. Watson and D. G. Pelli, "QUEST: a Bayesian adaptivepsychometric method," Percept. Psychophys. 33, 113-120(1983).
30. O. Packer, D. R. Williams, N. Sekiguchi, N. J. Coletta, and S.Galvin, "Effects of chromatic adaptation on foveal acuity andaliasing," Invest. Ophthal, Vis. Sci. SuppL 30, 53 (1989).
31. O. Packer and D. R. Williams, "Blurring by fixational eyemovements," Vision Res. 32, 1931-1939 (1992).
32. P. Cavanagh, S. Anstis, and G. Mather, "Screening for colorblindness using optokinetic nystagmus," Invest. OphthalmoLVis. Sci. 25, 463-466 (1984).
33. P. Cavanagh, D. I. A. MacLeod, and S. M. Anstis, "Equiluminance: spatial and temporal factors and the contribution ofblue-sensitive cones," J. Opt. Soc. Am. A 4, 1428-1438 (1987).
34. C. R. Cavonius and A. W. Schumacher, "Human visual acuitymeasured with colored test objects," Science 152, 1276-1277(1966).
35. D. R. Williams and N. J. Coletta, "Cone spacing and the visual resolution limit," J. Opt. Soc. Am. A 4,1514-1523 (1987).
36. D. R. Williams, N. Sekiguchi, W. Haake, D. Brainard, andO. Packer, "The cost of trichromacy for spatial vision," inFrom Pigments to Perception, A. Valberg and B. B. Lee, eds.(Plenum, New York, 1991), pp. 11-22.
37. D. Brewster, "On the undulations excited in the retina by theaction of luminous points and lines," London EdinburghPhilos. Mag. J. Sci. 1, 169-174 (1832).
38. J. Krauskopf, "Color appearance of small stimuli and the spatial distribution of color receptors," J. Opt. Soc. Am. 54, 1171(1964).
39. J. Krauskopf, "On identifying detectors," in Visual Psychophysics and Physiology, J. C. Armington, J. Krauskopf, andB. R. Wooten, eds. (Academic, New York, 1978), pp. 283-295.
40. J. Krauskopf and R. Srebro, "Spectral sensitivity of colormechanisms: derivation from fluctuations of color appearance near threshold," Science 150, 1477-1479 (1965).
41. C. M. Cicerone and J. L. Nerger, "The relative numbers oflong-wavelength-sensitive to middle-wavelength-sensitivecones in the human fovea centralis," Vision Res. 29, 115-128(1989).
42. R. L. P. Vimal, J. Pokorny, V. C. Smith, and S. K. Shevell,"Fovealcone thresholds," Vision Res. 29, 61-78 (1989).
43. Y. Le Grand, Form and Space Vision, M. Milldot and G. G.Heath, eds. (Indiana U. Press, Bloomington, Ind., 1967),pp.5-23.
44. L. Riggs and J. C. Armington, "Motions of the retinal imageduring fixation," J. Opt. Soc. Am. 44, 315-321 (1954).
45. H. C. Bennet-Clark, "The oculomotor response to smalltarget displacements," Opt. Acta 11, 301-314 (1964).
46. R. M. Steinman, G. M. Haddad, A. A. Skavenski, and D.Wyman, "Miniature eye movement," Science 181, 810-819(1973).

Sekiguchi et al. Vol. 10, No. 10/0ctober 1993/J. Opt. Soc. Am. A 2117
47. M. Eizenman, P. E. Hallett, and R. C. Frecker, "Power spectra for ocular drift and tremor," Vision Res. 25, 1635-1640(1985).
48. D. R. Williams, "Visual consequences of the foveal pit," Invest. Ophthalmol. Vis. Sci. 19, 653-667 (1980).
49. P. Simonet and M. C. W. Campbell, "The optical transversechromatic aberration on the fovea of the human eye," VisionRes. 31, 187-206 (1990).
50. A. B. Poirson and B. A. Wandell, "Task-dependent color discrimination," J. Opt. Soc. Am. A 7,776-782 (1990).
51. A. B. Poirson, B. A. Wandell, D. C. Verner, and D. H. Brainard,
"Surface characterizations of color thresholds," J. Opt. Soc.Am. A 7,783-789 (1990).
52. A. B. Poirson, '~ppearance and detection of colored patterns," Ph.D. dissertation (Stanford University, Stanford,Calif., 1992).
53. K. Kranda and P. E. King-Smith, "Detection of colouredstimuli by independent linear systems," Vision Res. 19, 733746 (1979).
54. C. F. Stromeyer III, G. R. Cole, and R. E. Kronauer, "Secondsite adaptation in the red-green chromatic pathways," VisionRes. 25, 219-237 (1985).