Abdollah Homaifar (PhD) Duke Energy Eminent Professor...
30
Abdollah Homaifar (PhD) Duke Energy Eminent Professor Department of Electrical and Computer Engineering North Carolina A&T State University Contributors: Lacewell, Gebril, Buaba, Fetanat (PhD Students) Knapp, Khin (NOAA),Obeidat (NCAT)
Transcript of Abdollah Homaifar (PhD) Duke Energy Eminent Professor...

Abdollah Homaifar (PhD)Duke Energy Eminent ProfessorDepartment of Electrical and Computer EngineeringNorth Carolina A&T State UniversityContributors: Lacewell, Gebril, Buaba, Fetanat (PhD Students)
Knapp, Khin (NOAA),Obeidat (NCAT)

Visual Image Thermal Image
“Curse of dimensionality” 17k/month, approx. 200k/yr , (24 GB/yr) About 3.8 million images available (about 0.5 TB)
Fact: Data is growing rapidly!!!
Location
2.7 km ground sample coverage
Example: DMSP Satellite images
363 x 293 pixels 363 x 293 pixels
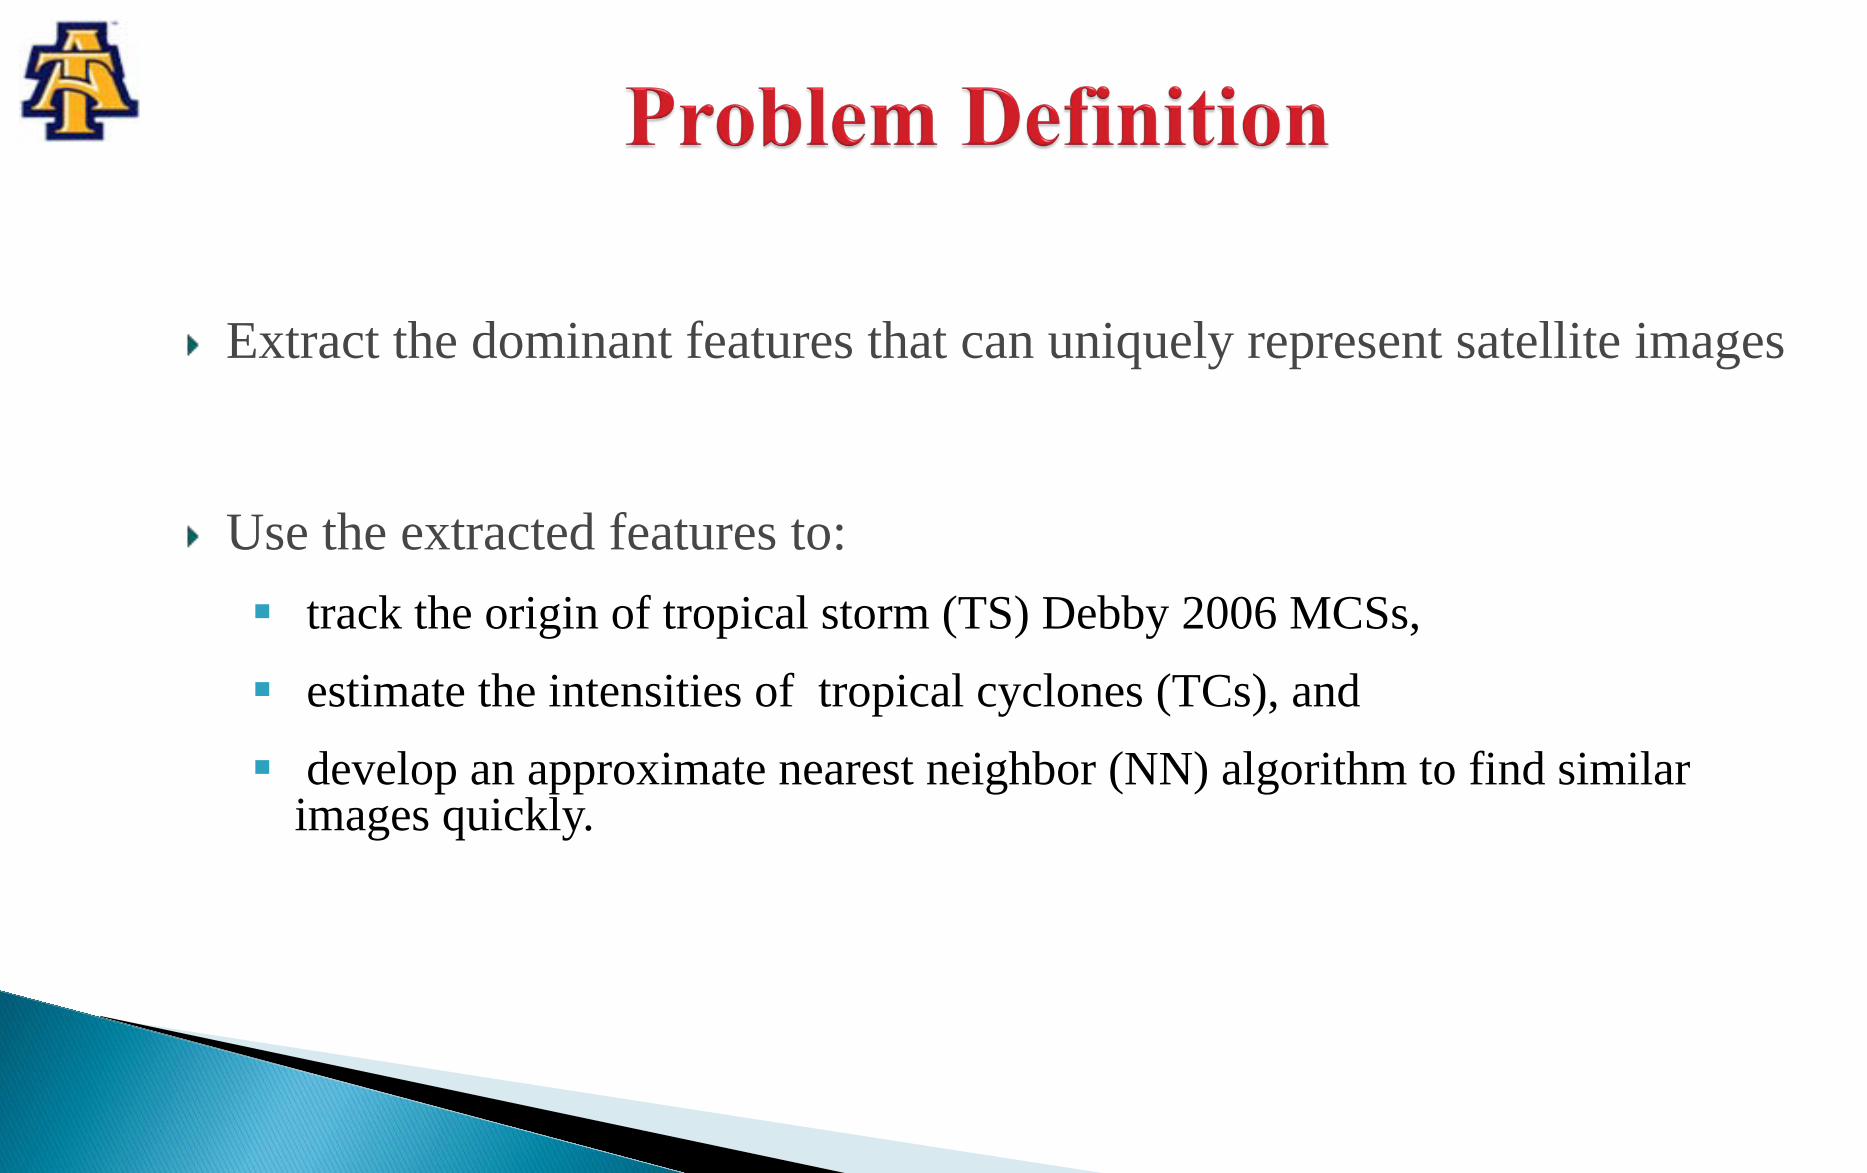
Extract the dominant features that can uniquely represent satellite images
Use the extracted features to: track the origin of tropical storm (TS) Debby 2006 MCSs, estimate the intensities of tropical cyclones (TCs), and develop an approximate nearest neighbor (NN) algorithm to find similar
images quickly.
Feature Extraction Estimation of Tropical Cyclone Intensity Similarity Estimation of Climatic Images Conclusion Future work Published Papers References
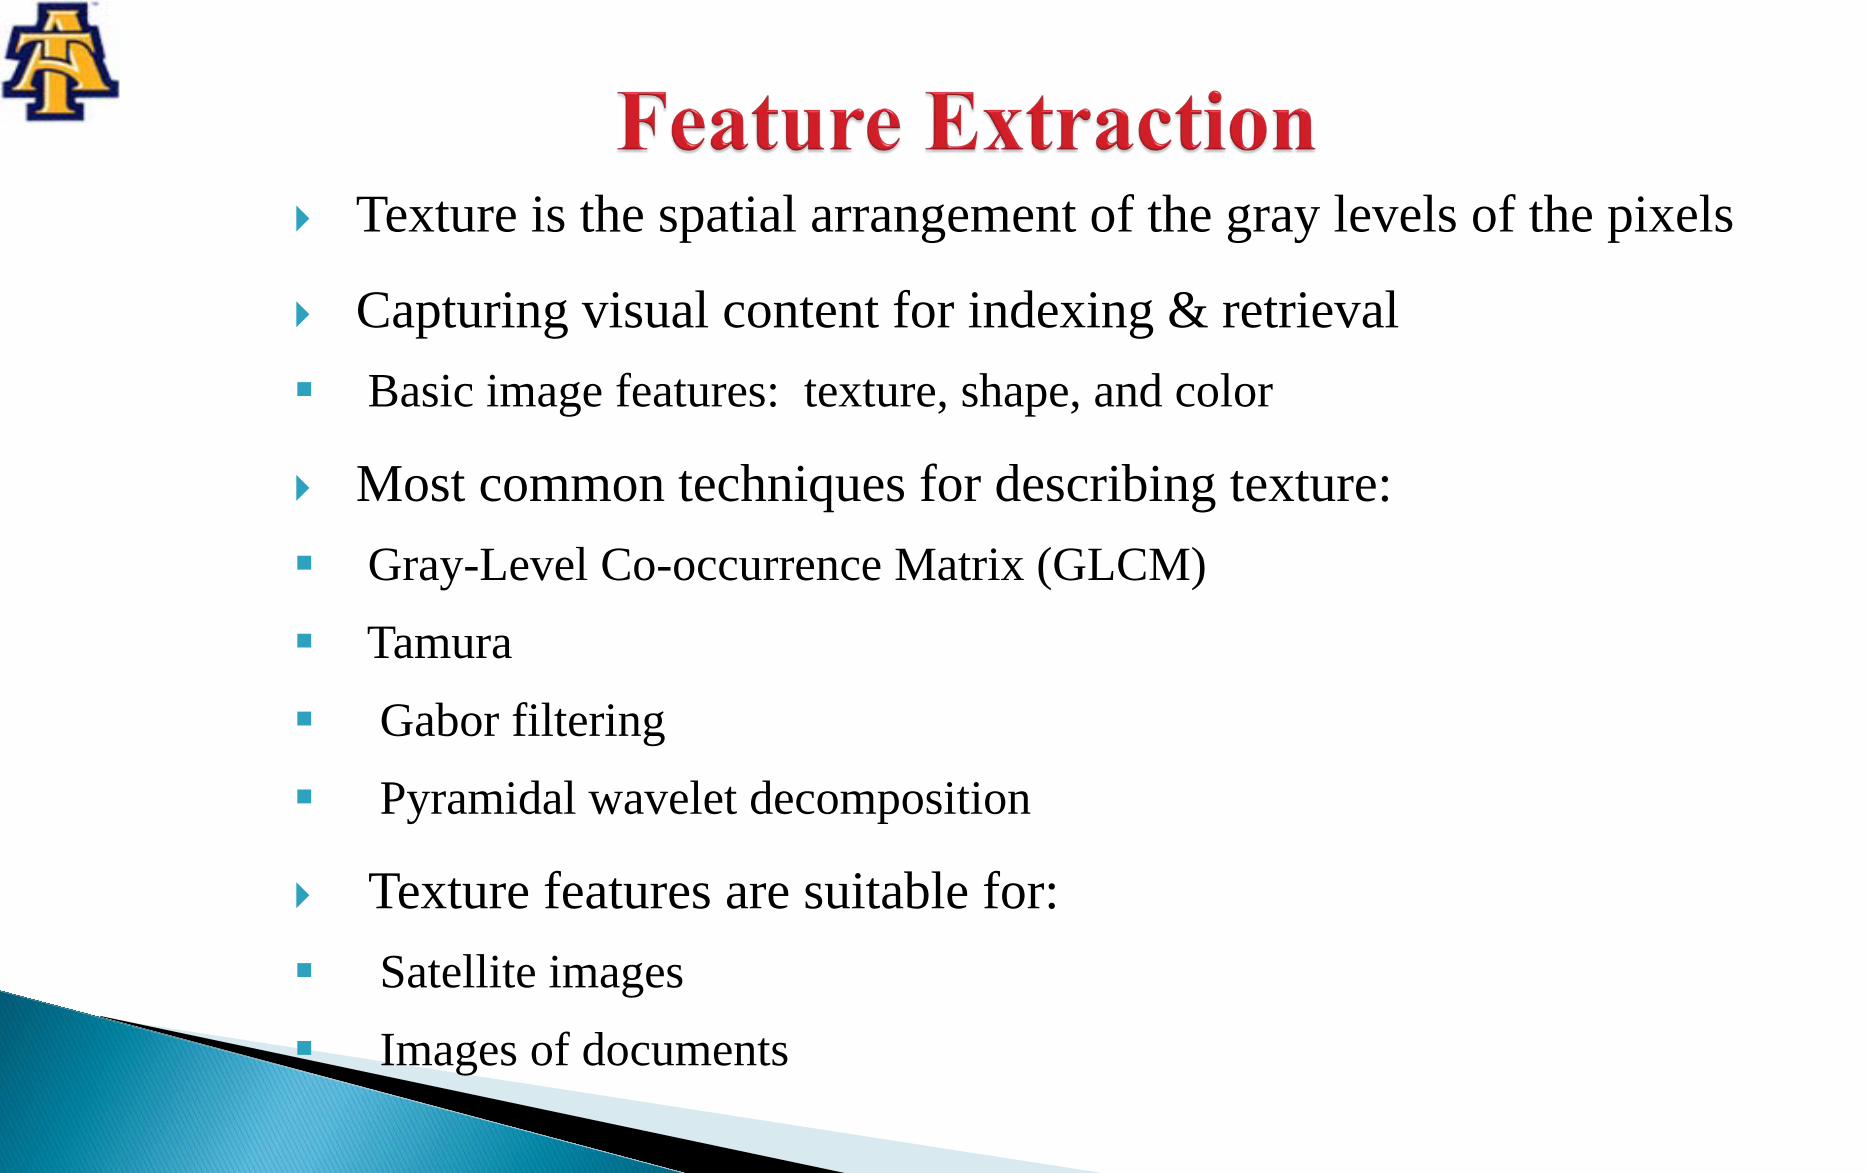
Texture is the spatial arrangement of the gray levels of the pixels
Capturing visual content for indexing & retrieval Basic image features: texture, shape, and color
Most common techniques for describing texture: Gray-Level Co-occurrence Matrix (GLCM) Tamura Gabor filtering Pyramidal wavelet decomposition
Texture features are suitable for: Satellite images Images of documents

GLCM :Statistical measurement of texture Pros: Simple, creates a good outline of the object Cones: Doesn’t extract the object, must have a known backgroundTamura texture feature Method for approximating intuitive texture features:
Coarseness: coarse vs fine Directionality: directional vs non-directional Contrast: high contrast vs low contrast Regularity: regular vs irregular (periodicity, randomness) Roughness: rough vs smooth
Pros: Simple, simulates psychological measurement of directionality Cones: Does not represent dependencies between pixels

Wavelet Transforms Mathematical transformations are applied to signals to obtain a further
information from that signal that is not readily available in the raw signal. Wavelet-based processing algorithms
Ability to discriminate different frequencies and to preserve signal details at different resolutions.
‘zoom in’ and ‘zoom out’ capability of the wavelet filters which can translate themselves to a location of a signal that is of interest
Pros: Multi-scale Complete reconstruction Edge types Resist noise
Cons: Time complexity

Sample Discrete Wavelet Transform Decomposition
Example: DWT

Both visual and thermal images have been reduced from 363x293 to 1x40 pixels.
Further reduced to 1x5 through feature selection
Texture feature vector per an image set is 1x10
Benefit Reduce memory from 2GB/month to
1.5 MB/ month
DWT applied to DMSP images

Region of interest: 30oW – 60oE and 5o – 15oNManual:

Data fusion Image fusion technique (Lacewell et al. 2010) Hybrid technique Discrete wavelet transform (DWT) Genetic Algorithm (GA)
Pattern Recognition Fuzzy C-Means Clustering (unsupervised technique) Feature Extraction and Tracking Technique used: Scale and Orientation Adaptive Mean Shift Tracking (SOAMST)
proposed by Ning et al. (2010) Solves problems of estimating the scale and orientation changes of an object Based on the area of the object and the second order moments (variance)
Automatic:

No progress in intensity prediction in the last 2 decades!

Three decades using the Dvorak TC intensity estimation inferring manually from cloud patterns and features
Examples of tropical cyclone patterns and their associated T‐numbers (adapted from Dvorak, 1975)

HURSAT Data
Sample 2006 TC classified by Location

Saffir–Simpson Hurricane Scale - Wikipedia, the free encycloped http://en.wikipedia.org/wiki/Saffir%E2%80%93Simpson_Hurrica Screen clipping taken: 7/8/2011 10:47 AM Sample Classification Results (North Atlantic)


Average Classification Accuracy: 71%
Class 0 1 2 3 4 5 0 142 15 2 0 0 0 1 35 155 17 5 2 0 2 5 17 50 10 0 0 3 5 3 10 47 6 0 4 11 10 5 11 51 5 5 2 0 0 0 2 10
Total 200 200 84 73 61 15
Northern Atlantic storms 1995 – 2005
Class 0 1 2 3 4 5
Training data 800 800 336 291 244 60
Testing data 200 200 84 73 61 15
Total 1000 1000 420 364 305 75
Number of Training and testing images
Confusion Matrix

Image Index
Is the intensity of TC stationary?Consider: “Danielle storm”
0 10 20 30 40 50 60 70 80 90-60
-40
-20
0
20
40
60residuals
0 10 20 30 40 50 60 70 80 900
20
40
60
80
100
y = - 0.67*x + 78
DANIELLE linear
Inte
nsity
Er
ror
Error: e[n] = x[n]-y[n] Average absolute error = 14.1472
Linear regression modeling
Image index
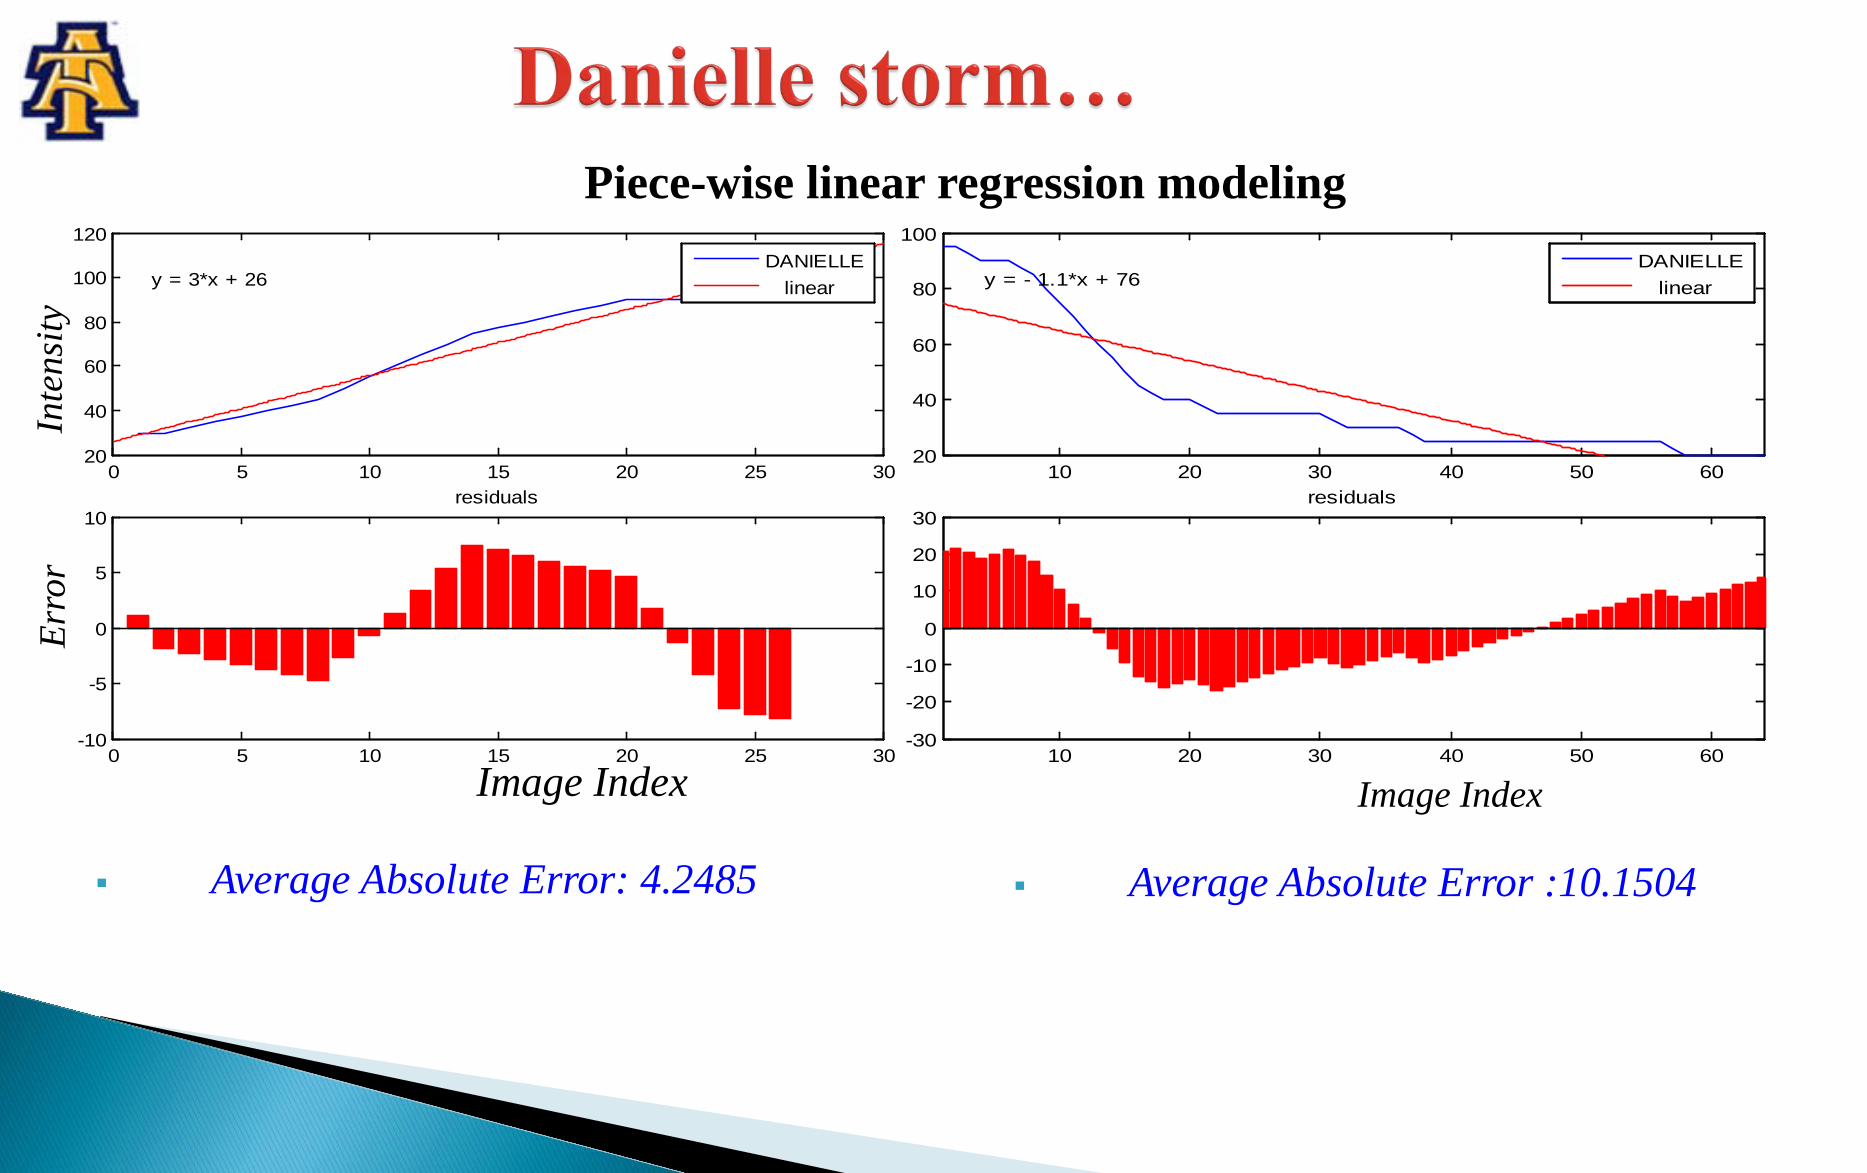
Average Absolute Error: 4.2485 Average Absolute Error :10.1504
0 5 10 15 20 25 30-10
-5
0
5
10residuals
0 5 10 15 20 25 3020
40
60
80
100
120
y = 3*x + 26
DANIELLE linear
10 20 30 40 50 60-30
-20
-10
0
10
20
30residuals
10 20 30 40 50 6020
40
60
80
100
y = - 1.1*x + 76
DANIELLE linear
Image IndexImage Index
Inte
nsity
Piece-wise linear regression modeling
Erro
r
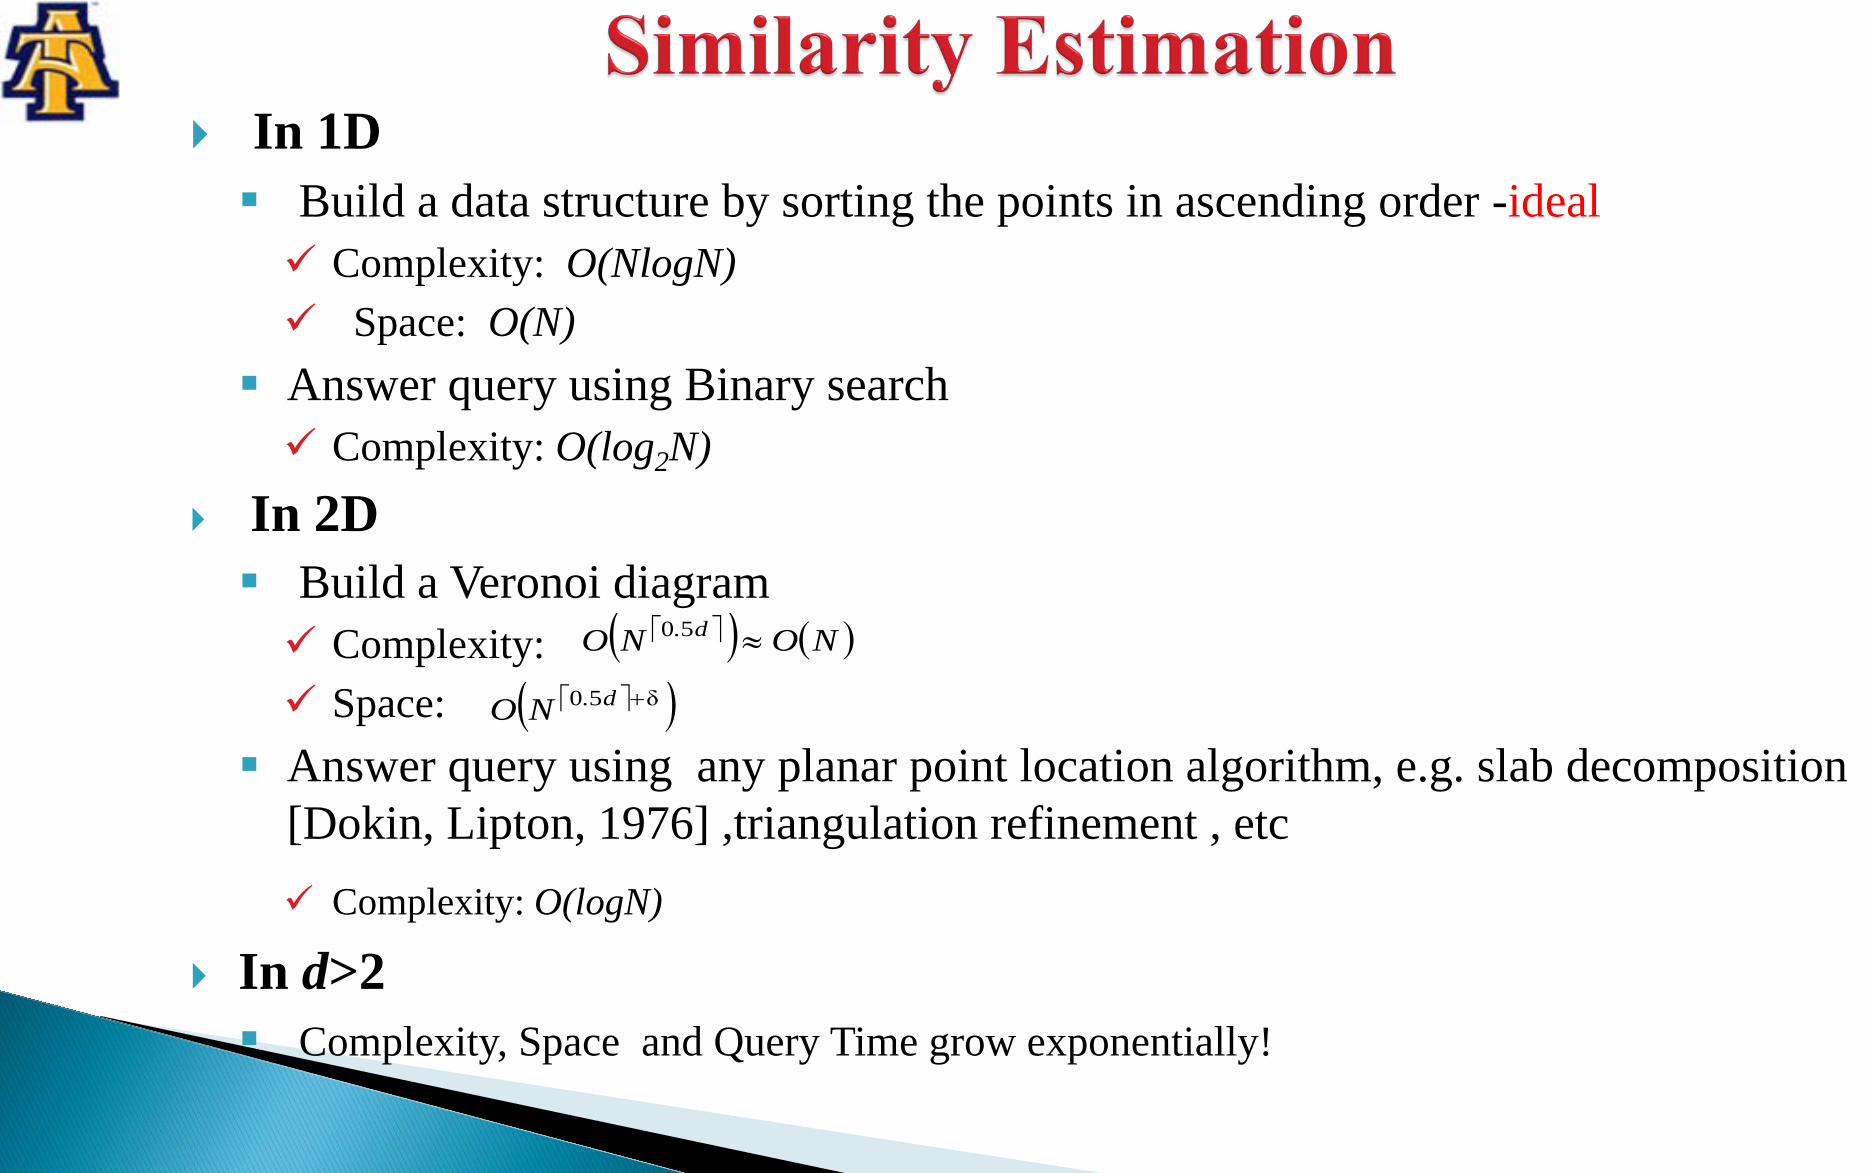
In 1D Build a data structure by sorting the points in ascending order -ideal Complexity: O(NlogN) Space: O(N)
Answer query using Binary search Complexity: O(log2N)
In 2D Build a Veronoi diagram Complexity: Space:
Answer query using any planar point location algorithm, e.g. slab decomposition [Dokin, Lipton, 1976] ,triangulation refinement , etc Complexity: O(logN)
In d>2 Complexity, Space and Query Time grow exponentially!
( ) ( )NONO d. ≈50
( )δ50 +d.NO

Building a Veronoi Diagram for data in 3D –space containing N items:Complexity: O(N2)Space : O(N2)Search Complexity: O(logN)
In practice we deal with higher dimensions ( say d≥10) and N ≥ 1million:Complexity: ≥ O(N5) -Ugh this program is taking too much timeSpace : ≥ O(N5) - Out of memory. Search Complexity: ≥ O(logN)
**Problem: Space is polynomial in N
Is it possible to build a data structure to simultaneously achieve roughly linear space and logarithmic query time? kd-trees (Friedman, Bentley, and Finkel, 1977) : Space: O(N)Search Complexity: O(logN)
In practice, kd- trees break down for higher dimensions
LSH ( Motwani, 1998) :Space: O(dN) O(1)
Search Complexity: O(dlogO(1)(dN))

General Methodology Feature Extraction
Data Structure/Search
M best matches
LSH

Hyper-planes => Gaussian normal distributions
Basic Idea of LSH-> scalar projections

Bin1,0
Bin1,1
Bin1,2m-2
Bin1,2
.
.
.
Table 1
Bin2,0
Bin2,1
Bin2,2m-2
Bin2,2
.
.
.
Table 2
Bin3,0
Bin3,1
Bin3,2m-2
Bin3,2
.
.
.
Table 3
. . .
BinL,0
BinL,1
BinL,2m-2
BinL,2
.
.
.
Table L
HF2 HF3 HFL. . .HF1
. . .
U
l2-space Quick sort M matches
q̂
q: query texture feature vector
M: number of nearest neighbors desired
Running A QueryCreating Hash Tables
Bin1,0
Bin1,1
Bin1,2m-2
Bin1,2
.
.
.
Table 1
Bin2,0
Bin2,1
Bin2,2m-2
Bin2,2
.
.
.
Table 2
Bin3,0
Bin3,1
Bin3,2m-2
Bin3,2
.
.
.
Table 3. . .
BinL,0
BinL,1
BinL,2m-2
BinL,2
.
.
.
Table L
HF2 HF3 HFL. . .HF1
p̂
mN /=α
] [0,~(z)H m
] [0, ~(z)b α
p: any d-dimensional texture feature vector
N: number of texture feature vectors
2,0~ dgdNzjh
1modˆ
)ˆ(1
)()(
},...,2,1{−+
+•= ∑
==∀
mmHbph
pHFk
z
zz
zj
Ljj α

mLSH
Action # OperationsMatch set (2dk +k+2)Ll2-distance (3d-1)αL
Quick-sort O(αL log αL)
LS
Action # OperationsHashing p into a bin 2dk +k+2
Hashing p onto L tables (2dk+k+2)L
Hashing all samples (2dk+k+2)LN
Creating The Hash Tables
Running A Query
Action # Operations
l2-distance (3d-1)NQuick-sort O(N log N)
Running A Query
Total: (2dk+3dα+k+2-α)L + O(αL log αL)
Note: (i) αL << N (ii) PDS = (αL/N)*100%
Gain = (3d-1)N + O(N log N)(2dk+3dα+k+2-α)L + O(αL log αL)
Gain>>1
Total: (3d-1)N + O(N log N)
1modˆ
)ˆ(1
)()(
},...,2,1{−+
+•= ∑
==∀
mmHbph
pHFk
z
zz
zj
Ljj α

Dataset size = 439,774

Query Index NNs out of M Search Time(ms) mLSH Gain Over LS
PDS (%)
mLSH LS mLSH mLSH
5555 50 154.5 17.6 8.79 4.6464113 50 153.3 6.9 22.22 2.2799045 45 163.2 1.6 102.95 0.27
101241 41 148.7 2.4 63.26 0.55135426 50 148.4 9.3 15.89 3.26165198 50 148.9 4.7 31.37 1.33264676 50 149.5 3.4 43.39 0.93276028 49 146.9 3.5 42.16 0.99339715 50 147.0 11.6 12.69 4.00429762 48 149.6 6.7 22.45 2.13Average 48 151.0 6.7 36.52 2.04
Note: M = 50, PDS: percentage of database searched (100% for LS)

Pre-TS Debby (2006) originated over the peak of the Ethiopian Highlands (10oN, 40oE) on 8/12/15Z
The K-mean classification performs fairly well for the TC intensity classification
TCs are non-stationary processes
mLSH is highly scalable and about 36 times faster than the LS
Results will be improved and generalized once sufficient data becomes available

Investigate the applicability of other feature extraction techniques (e.g. Shape) Implement a program to determine the probability of a cloud cluster developing
into a tropical cyclone (TC) Develop a statistical technique using histogram and feature attributes to
accurately detect origin of TCs Preprocess all tropical storms (TSs) to eliminate erroneous data Investigate temporal behavior of the extracted features as a step toward
prediction of future dynamics of a TC Use mLSH to index the TCs for faster retrieval Validate the stationary or non-stationary nature of all the other TSs Improve upon the mLSH by using an optimal hyper-plane for projection
G. Fetanat, R. Buaba, A. Homaifar,“A New ECG Arrhythmias classification technique based on Locality Sensitive Hashing” Submitted to Digital signal processing, Elsevier, Dec. 2010.
R. Buaba, M. Gebril, A. Homaifar, E. Kihn, and M. Zhizhin,“Satellite image retrieval using low memory locality sensitive hashing in Euclidean space,” Earth Science Informatics 2011, DOI 10.1007/s12145-010-0076-x, vol. 4, pp. 17–28.
R. Buaba, A. Homaifar, M. Gebril, E. Kihn ,“Satellite Image Retrieval Application Using Locality Sensitive Hashing in L2-Space,” 32nd IEEE Aerospace Conference, 2011.
M. Gebril, R. Buaba, A. Homaifar, E. Kihn “Structural Indexing of Satellite Images Using Automatic Classification,” 32nd IEEE Aerospace Conference, 2011.
R. Buaba, M. Gebril, A. Homaifar, E. Kihn, and M. Zhizhin, “Locality Sensitive Hashing for Satellite Images using Texture Feature Vectors,” 31st IEEE Aerospace Conference, 2010.
M. Gebril, R. Buaba, A. Homaifar, E. Kihn, and M. Zhizhin, “Structural Indexing of Satellite Images Using Texture Feature Extraction Retrieval,”31st IEEE Aerospace Conference, 2010.
C. W. Lacewell, M. Gebril, R. Buaba, and A. Homaifar, “Optimization of Image Fusion Using Genetic Algorithms and Discrete Wavelet Transform,” NAECON, 2010.