ABC HOLDINGS LIMITED Results Presentation for the year ended 31 December 2008.

ABC Technologies Holdings Inc.Management Presentation
January 2021
This presentation is dated January 26, 2021. A preliminary prospectus dated January 26, 2021 containing important information relating to the securities described in this document has been filed with the securities regulatory authorities in each of theprovinces and territories of Canada. A copy of the preliminary prospectus, and any amendment, is required to be delivered with this document. The preliminary prospectus is still subject to completion. There will not be any sale or any acceptance of anoffer to buy the securities until a receipt for the final prospectus has been issued. This document does not provide full disclosure of all material facts relating to the securities offered. Investors should read the preliminary prospectus, the final prospectusand any amendment for disclosure of those facts, especially risk factors relating to the securities offered, before making an investment decision.

CONFIDENTIAL
DisclaimerProspective investors should rely only on information contained in the preliminary prospectus dated January 26, 2021 (the “preliminary prospectus”). This presentation is qualified in its entirety by reference to, andmust be read in conjunction with, the information contained in the preliminary prospectus. Neither ABC Technologies Holdings Inc. (d/b/a ABC Technologies) (the “Company” or “ABC”), ABC Group Canada LP (the“Selling Shareholder”), nor any of the underwriters for the offering (collectively, the “Underwriters”) has authorized anyone to provide prospective purchasers with different or additional information from theinformation contained in the preliminary prospectus. The information contained on www.abctechnologies.com is not intended to be included in this presentation, and prospective investors should not rely on suchinformation when deciding whether or not to invest in the securities. Any graphs, tables or other information demonstrating our historical performance, or the performance of any other entity, contained in thispresentation are intended only to illustrate past performance and are not necessarily indicative of our future performance or the future performance of such entities. The Company, the Selling Shareholder and theUnderwriters take no responsibility for, and provide no assurance as to the reliability of, any other information that others may provide to you. No securities regulatory authority has expressed an opinion about thesecurities described herein and it is an offence to claim otherwise.
Capitalized terms used herein that are not otherwise defined have the meanings ascribed to such terms in the preliminary prospectus.
This presentation does not constitute an offer to sell or the solicitation of an offer to buy any securities, nor shall there be any sale or distribution of these securities in any jurisdiction in which such offer, solicitation,sale or distribution would be unlawful. The securities have not been and will not be registered under the United States Securities Act of 1933, as amended (the “U.S. Securities Act”) or any state securities laws andmay not be offered or sold in the United States or to, or for the account or benefit of, a U.S. person (within the meaning of Regulation S under the U.S. Securities Act) except pursuant to an exemption from theregistration requirements of the U.S. Securities Act and any applicable state securities laws.
This presentation does not provide full disclosure of all material facts relating to the Company, its securities or the contemplated offering and is not subject to liability for misrepresentations under applicablesecurities legislation. Prospective investors should not assume that the information contained in this presentation is accurate as of any date other than the date of this presentation, or where information is stated tobe as of a date other than the date of this presentation, such other applicable date.
Unless otherwise indicated or the context otherwise requires, all references in this presentation to “ABC”, the “Company,” “we,” “our,” “ours,” “us” or similar terms refer to ABC Technologies Holdings Inc (d/b/a ABCTechnologies) together with its subsidiaries and its joint ventures. All references to “$” and “US$” are to United States dollars and all references to “C$” are to Canadian dollars.
Non-IFRS Measures
This presentation makes reference to certain non-International Financial Reporting Standards (“IFRS”) measures, namely EBITDA, Adjusted EBITDA, Adjusted EBITDA Margin and Free Cash Flow. Thesemeasures are not recognized under IFRS as issued by the International Accounting Standards Board and do not have a standardized meaning prescribed by IFRS and are therefore unlikely to be comparable tosimilar measures presented by other companies. Accordingly, these measures should not be considered in isolation nor as a substitute for analysis of our financial information reported under IFRS. These non-IFRSmeasures are used to provide readers with supplemental measures of our operating performance and thus highlight trends in our business that may not otherwise be apparent when relying solely on IFRSmeasures. Our management also uses non-IFRS measures in order to facilitate operating performance comparisons from period to period, to prepare annual operating budgets and forecasts and to determinecomponents of management compensation. Please refer to “6. Appendix” to this presentation for the reconciliation of EBITDA, Adjusted EBITDA, and Free Cash Flow presented by the Company to the most directlycomparable IFRS measure. Our Adjusted EBITDA Margin is calculated as Adjusted EBITDA divided by Sales adjusted to include the proportionate share of joint venture sales attributable to ABC as well asestimated net lost sales due to the 2019 OEM Strike in Fiscal 2020.
Forward-Looking Information
This presentation contains “forward-looking information” and “forward-looking statements” within the meaning of applicable Canadian securities legislation (collectively, “forward-looking statements”), which reflectmanagement's expectations regarding the Company’s industry or the Company’s future growth, results from operations, performance and business prospects, future business plans and opportunities. Whereverpossible, words such as “plans”, “expects”, “projected”, “estimated”, “forecasts”, “anticipates”, “outlook”, “potential”, “strategy”, “targets” or “believes”, or variations of such words and phrases or statements thatcertain future conditions, actions, events or results “will”, “may”, or “could”, or negative or grammatical versions thereof, have been used to identify forward-looking statements.
By their nature, forward-looking statements are subject to inherent risks and uncertainties that may be general or specific and which give rise to the possibility that expectations, forecasts, predictions, projections orconclusions will not prove to be accurate, that assumptions may not be correct and that objectives, strategic goals and priorities will not be achieved. Known and unknown risk factors, many of which are beyond thecontrol of the Company, could cause actual results to differ materially from the forward-looking statements in this presentation.
Forward-looking statements are based on management’s beliefs and assumptions and on information currently available to management. Although the forward-looking statements contained in this presentation arebased upon what we believe are reasonable assumptions, you are cautioned against placing undue reliance on this information since actual results may vary from the forward-looking statements. Consequently, allof the forward-looking statements contained in this presentation are qualified by the foregoing cautionary statements, and there can be no guarantee that the results or performance that we anticipate will be realizedor, even if substantially realized, that they will have the expected consequences or effects on our business, financial condition or results of operation.
1

CONFIDENTIAL
Disclaimer (Cont’d)Three- and Six-Month Periods Ended December 31, 2020
Where this presentation provides the Company’s financial results or figures for or as at the Company’s three- and six-month periods ended December 31, 2020, such results or figures are based upon theCompany’s financial statements for such periods which have been prepared by management and are currently in the process of being reviewed.
Market and Industry Data
Market and industry data presented throughout this presentation was obtained from third-party sources, industry publications and reports, websites and other publicly available information, as well as industry andother data prepared by us or on our behalf, on the basis of our knowledge of, and experience in, the markets in which we operate. We believe that the market and economic data presented throughout thispresentation is accurate and, with respect to data prepared by us or on our behalf, that our estimates and assumptions are currently appropriate and reasonable, but we cannot offer any assurance as to theaccuracy or completeness thereof. The accuracy and completeness of the market and economic data presented throughout this presentation are not guaranteed and we make no representation as to the accuracyof such data. Actual outcomes may vary materially from those forecast in such reports or publications, and the prospect for material variation can be expected to increase as the length of the forecast periodincreases. Although we believe it to be reliable, we have not independently verified any of the data from third-party sources referred to in this presentation, or analyzed or verified the underlying market, economicand other assumptions relied upon by such sources.
Unless otherwise indicated or the context otherwise requires, all references in this presentation to the industry or to industry production, volumes and sales, refer to the light vehicle industry in North America.
The IHS Markit reports, data and information referenced herein (the "IHS Markit Materials") are the copyrighted property of IHS Markit Ltd. and its subsidiaries (“IHS Markit”) and represent data, research, opinionsor viewpoints published by IHS Markit, and are not representations of fact. The IHS Markit Materials speak as of the original publication date thereof and not as of the date of this document. The information andopinions expressed in the IHS Markit Materials are subject to change without notice and IHS Markit has no duty or responsibility to update the IHS Markit Materials. Moreover, while the IHS Markit Materialsreproduced herein are from sources considered reliable, the accuracy and completeness thereof are not warranted, nor are the opinions and analyses which are based upon it. IHS Markit and other trademarksappearing in the IHS Markit Materials are the property of IHS Markit or their respective owners.
Trademarks
We own or have the rights to use various trademarks, service marks and trade names referred to in this presentation. Solely for convenience, we may refer to trademarks, service marks and trade names in thispresentation without the ™ and ® symbols. Such references are not intended to indicate, in any way, that we will not assert, to the fullest extent permitted by law, our rights to our trademarks, service marks andtrade names. Other trademarks, trade names or service marks appearing in this presentation are the property of their respective owners.
Interpretation and Terms Used in this Presentation
Where we discuss figures, percentages and statistics relating to ABC’s content per vehicle (“CPV”), ABC’s content on vehicle models and / or ABC’s market share for products, we are referring to the Company andits joint ventures. Where we discuss having our content on over 75% of all North American light vehicles and having strong representation on the top 15 models, we refer to fiscal year-to-date ended December 31,2020, and, in the case of the latter, we are also including contracted business for a model currently in pre-production but for which parts have been shipped.
Where we discuss our manufacturing facilities, unless otherwise stated or the context otherwise requires, we are referring to the Company’s facilities and the facilities of its joint ventures, which consist of 20 wholly-owned and eight joint venture-owned manufacturing facilities, 22 of which are located in North America.
Where we discuss ABC’s outperformance in this presentation, we are referring to the growth in ABC’s Sales plus its proportionate share of revenue from joint ventures outperforming North American light vehicleindustry production volume growth (based on data made available through IHS Markit) in each year from Fiscal 2017 to Fiscal 2020.
Where we discuss our new business wins over the last three years, this figure represents the aggregate of the total sales expected under life of contracted program at the time business is awarded and consists ofnew and replacement contracted business. Such expected total sales is based upon awarded product part price per vehicle and the average annual IHS Markit production volumes over the life of the contract andassumes awarded business contracts will be performed until the end of their term. Such expected total sales exclude tooling sales and include our proportionate share of joint venture new business wins.
Where we discuss our North American market share in various product groups, we have relied on IHS Markit data regarding industry production volumes. The Company’s estimate of its market share in theseproduct groups for the relevant fiscal period has been derived by dividing the total volume of the units within such product group that we supplied to OEM’s in North America during such period, by management’sestimate of the total volume of such products on all light vehicles produced by OEM’s in North America during the same period. Where such product is only found on certain models within a platform we relied onmanagement’s estimate of the production number of models containing these products (including those supplied by our competitors). Where we provide market share for our running board and spoiler productgroups, we have excluded from the overall market size any after-market products, including any after-market running boards or spoilers installed by dealers as we view the after-market running board and spoilers tobe a distinct market in which we have elected to not compete. Management estimates regarding the size of the addressable market for our product groups are based on industry data (including IHS Markit) togetherwith internal information, information provided by the Company’s customers and other industry participants and management’s experience within the industry and the markets within which it competes.
Where we discuss the industry and industry production figures or trends, unless otherwise stated or the context otherwise requires, we are referring to the North American light vehicle industry.
2

CONFIDENTIAL
Introduction
1. Overview of ABC Technologies
2. Investment Highlights
3. Growth Opportunities
4. Financial Overview
5. Summary of the Offering
6. Appendix
3
Presentation Team Agenda
Todd SheppelmanChief Executive Officerand President
David SmithChief Financial Officer

1. Overview of ABC Technologies

CONFIDENTIAL
Powertrain-agnostic, lightweighting-focused product portfolio
Strong market shares across multiple product categories(1)
ABC Technologies OverviewAn Outperforming Market Leader with Strong Technological Differentiation
Highly engineered solutions with deep development expertise
A leading manufacturer and supplier of custom, highly engineered, technical plastics and lightweighting innovations to the global automotive industry
Market Leadership and Strength Technology and Innovation Leadership Drives CPV Growth
5
(1) See page 13 for further information on ABC’s market shares for key product groups.
Proprietary vertical integration in material compounding and machine-building
1st
Content on over 75% of all light vehicles and strong representation on the top 15 models in North America
Global footprint of 28 manufacturing facilities
CPV growth and industry outperformance driven by market differentiation and pioneering, first-to-market products
Serving More Than 25 OEMs Globally, Many for Over 45 Years

CONFIDENTIAL
Diversified and Highly Technical Product OfferingAbility to Cross-Sell Lightweighting Solutions Throughout the Entire Vehicle
Exterior Systems HVAC Systems
Air Induction Systems
Interior Systems
Flexible & Other
IP Duct
Fluid Management
Battery Cooling Duct
InjectionMolding
BlowMolding
2-ShotMolding
3D FlashlessBlow Molding
Class APainting
PolyurethaneComposite
Board
CompressionMolding
ContinuousExtrusion
Soft-Hard-Soft
Washer System Coolant ReservoirPower Steering
Reservoir
CVJ Boots
Centre Consoles
Interior Trim
Bumpers
Capabilities drive leading and pioneering products, such as running boards, load floors and HVAC ducts
6
Blow MoldedI-Pillar Load Floor
RamBox®
Spoilers & Winglets
Running Boards
Diverse Processes and Capabilities Enable Portfolio Breadth
OverheadDuct
High TemperatureTurbo Duct
Air Induction
Air Filter
Prop Shaft Boots
Wrapping ComplexAssembly

CONFIDENTIAL
Local Manufacturing with a Global Reach Drives OEM MomentumSupplier to 90% of all OEM production facilities in North AmericaStrategically located within 250 miles of a majority of our customers, providing logistical advantages
7
(1) Figure represents expected Fiscal 2021 forecasted Sales. Such forecast Fiscal 2021 figure is based on ABC’s current beliefs, expectations and assumptions, including anticipated light vehicle production volumes, and information currently available to it. See “Disclaimer – Forward-Looking Information.”
(2) All employees are non-union other than one joint venture plant in each of Canada and Mexico, our Mexican facilities and statutory unions.(3) Includes four standalone technical centres and six technical and customer centres that are located on-site at the relevant manufacturing facility.
25+OEM Customers
$1+ Billion Company(1)
6,150 Employees(2)
+1,450 in JVs
600+ Skilled Professionals
33Locations
28 Manufacturing Facilities
10 Technical andCustomer Centres(3)
Grand Rapids, MI, USA
Gallatin, TN, USA (3)
Toronto, ON, Canada (10)
Fremont, OH, USA
London, KY, USA
Livingston, TN, USA
Poznan, Poland
Soria, Spain
Ramos Arizpe, México
San Juan del Rio, Querétaro, México (4)
Shenyang, China
San Juan del Rio, Querétaro, México
Araras Sao Paulo, Brazil
Wholly Owned Facility
Joint Venture Facility
Shanghai, China
Ningbo, China
Standalone Technical Centres
Rüsselsheim, Germany
Southfield, MI, USA
Shanghai, ChinaYokohama, Japan

CONFIDENTIAL
Top 3 Customers83%
Asian OEMs13%
European OEMs & Other4%
Customer 126%
Customer 223%
Customer 315%
Customer 411%
Customer 510%
Other15%
Interior Systems
38%
Exterior Systems
24%
HVAC Systems
17%
Air Induction Systems
11%
Fluid Systems8%
Flexible & Other2%
North American Leader Diversified Across Product Groups and Within OEMs and Their Platforms
Sales by Product Group(1) – Fiscal 2020
8
Over $2 Billion of Diverse OEM New Business Wins Over Last 3 Fiscal Years
Sales by Geography – Fiscal 2020
Sales by Customer – Fiscal 2020
(1) Excludes tooling sales, which are typically associated with the start-up or renewal of platform programs. This provides for better comparability of company segmentation. Tooling sales have typically represented less than 10% of our Sales. Also includes proportionate share of joint venture revenues.
U.S.36%
Canada29%
Mexico29%
ROW6%

CONFIDENTIAL
7.4%
14.2%
Average for Interior Plastic Auto Parts Companies ABC
Able to Realize Substantially Higher Margin Versus “Traditional” Interior Plastic Auto Parts CompaniesWe believe ABC’s focus on technical, high-value-added plastics creates a premium margin
9
(1) Most recent comparable quarter is Q3 CY2020, which equates to ABC’s Q1 FY2021; based on publicly available information for Grupo Antolin and Samvardhana Motherson Automotive Systems Group, both of whom have disclosed Q3 CY2020 financial results.
Management believes leading product portfolio and innovation stream positions ABC to sustain premium margins over time
Premium margins maintained in most recent comparable quarter versus “traditional” interior plastic auto parts companies –demonstrates structural flexibility benefit of ABC(1)
ABC Premium
~8.0%
Adjusted EBITDA Margin – Most Recent Comparable Quarter(1)

CONFIDENTIAL
50%
108%
27%28%
9
7
4
8
-
2
4
6
8
10
12
-
20%
40%
60%
80%
100%
120%
Decline Growth Decline Growth
'01 - '09 '10 - '16 '17 - '20E '21E - '28E
Change from Last Trough / Peak Duration of Cycle (years)
-
5.0
10.0
15.0
20.0
U.S. SAAR (Annualized monthly light vehicle sales in millions)
SAAR quickly rebounding to pre-COVID levels in just a few months, with ongoing volume upside
Source: Based on WardsAuto data.
Current upcycle
2008 2020
Several years to recover from financial crisis
2009 2010 2011 2012 2013
Over $1 trillion global market size, with North America at 18% of global production(1)
Post-COVID19 volumes rebounding with expected 4.8% CAGR from Fiscal 2020 through Fiscal 2025(2)
IHS Markit has increased its forecast for CY2020 through CY2022 by 8.7%, or 3.7 million units, since June
Volumes have rebounded strongly following end of COVID-19-related shutdowns and ramping back up to pre-COVID-19 volumes, with ongoing growth, as opposed to a more gradual recovery after the global financial crisis
Poised for Industry Rebound and Cyclical Upswing
10
Historical North American Auto Production Cycles(3)
The two most recent downcycles lasted an average of 6.5 yearsThe most recently completed upcycle lasted approximately seven years
Source: Based on IHS Markit data.(1) Based on IHS Markit industry production volume data for the twelve-month period ended December 31, 2019, as well as ABC management’s estimate of CPV.(2) Based on IHS Markit industry production volume data as of January 2021.(3) A cycle is determined when volumes change by over 10% from peak / trough and there are at least two years of consecutive increases or declines.
Current upcycle projected to be 8 years

2. Investment Highlights

CONFIDENTIAL
Investment Highlights
12
Strong Market Share and Leadership Across North America1
Unique Vertical Integration and Plastics Lightweighting Capabilities2
Industry-Leading Technical Capability and Product / Process Development Expertise3
Lightweighting and Powertrain-Agnostic Portfolio Aligned with Key Trends Drives Above-Market Growth4
Entrenched Customer Relationships with Repeatable Blueprint for Growth and CPV Penetration5
Experienced Management Team with a Track Record of Driving Value Creation6
Significant Investments in Manufacturing Infrastructure and Processes are Expected to Drive Free Cash Flow7

CONFIDENTIAL
Strong Market Share and Leadership Across North AmericaSignificant market shares in multiple core product groupsThus far in Fiscal 2021, we had content on over 75% of all light vehicles manufactured in North America and strong representation on the top 15 models produced
13
1
Select North American Market Sharesin Key Product Groups (Fiscal 2020)(1)
Top 15 North American Production Models(YTD Fiscal 2021)
Source: Based on IHS Markit data.
Product Group Market Share
Running Boards(2)
> 40%
HVAC Duct Systems> 30%
Windshield Washer Systems> 30%
Model % of Total Light Vehicle Production
Ford F-Series 5%
Chevrolet Silverado 4%
FCA Ram 4%
Honda CR-V 3%
Toyota RAV4 3%
Toyota Camry 2%
Chevrolet Equinox 2%
Toyota Tacoma 2%
Ford Explorer 2%
Toyota Highlander 2%
Honda Civic 2%
Jeep Wrangler 2%
Jeep Grand Cherokee 2%
Honda Accord 2%
GMC Sierra 2%
Total 39%
Spoilers> 25%
Cargo Load Floors (SUV/CUV)> 25%
(1) Based on management estimates.(2) Running boards do not include retractable running boards.

CONFIDENTIAL
Unique Vertical Integration and Plastics Lightweighting Capabilities2
Ability to innovate across product development, materials and process resulting in a continual stream of industry unique and differentiated innovation capabilities
14
Vertical Integration Driving Unique Capabilities in the Auto Parts Value Chain
Custom, highly engineered, technical solutions
Custom-designed machines provide unique
process solutions
Proprietary resin compound formulations which allow for unique product designs and
process innovations exclusive to ABC
Collaborative development
Tooling & Machine Build
Group
Material Compounding
Group
ABC Innovation and
Parts Manufacturing
OEMs

CONFIDENTIAL
Unique Vertical Integration and Plastics Lightweighting Capabilities (Cont’d)2
Long history of first-to-market innovation will continue to allow ABC to outgrow the competition
Recent Success Example
Future Lightweighting and Innovation
Proprietary internal rib structure
Integral to award of FCA cargo system and Toyota load floors
Weight savings of over 30% vs alternative
Biopolymer composites with engineered cellulose fibre
8% weight savings and reduced press cycle times
Strength and reinforcement in an eco-friendly plastic
Prototype parts being tested
Unique integrated storage and activity features
Weight reduction vs alternative technologies
Leading position in fixed running boards
Industry-first plastic running boards
Weight savings of ~30% vs alternative
Cost savings
Multiple projects for integration of RCF across ABC product portfolio
>50% weight reduction and equal or increased rigidity
Blow Molded Running Boards
Criss-Cross Internal Wall
Structure Load Floor
Recycled Carbon Fibre (“RCF”) RB
Brackets
Cargo Management
Systems
Bio-Mass and Organic Plastics
Pioneering History Example
15
Biopolymer Air Induction

CONFIDENTIAL
Broad technical expertise and deep engineering portfolio allows ABC to drive continual innovation
Lightweight Material Substitution for Weight Reduction
Process Innovation for Lower Production Costs
Product Innovation for New Market Opportunities
Industry-Leading Technical Capability and Product / Process Development Expertise3
Sample of Next Generation Advanced Product Development Innovations
Under Seat and Rear Cargo Storage
Plastic Foamed Interior / Exterior
Components
Advanced Composite Tape
Additive Manufacturing (3D Printing and Material)
Recycled Carbon Fibre
In-Mold Welding Variable Cooling Injection Overmold
Airwave – Headliner Air Distribution System
Innovation by the Numbers
600+ Skilled Professionals (500 engineers and 100 additional employees serving in technical engineering roles) located in a cutting-edge engineering and testing technical centre in Toronto and 9 regional technical / design centres
139 Proprietary Resin Compound Formulations approved by OEMs for use in ABC exclusive applications
300+ Patents issued historically or currently pending
32 Research Collaborations and 22 Advanced In-House Research Projects under development
150+ New and Developing Products, Processes &Material-based Innovations and First-to-Market Solutions
16
Pivoted to medical device production during COVID-19

CONFIDENTIAL
58% 73% 80%
42% 27% 20%
FY2015 FY2020 FY2025
Light Trucks (%) Passenger Cars (%)
270 276 296
321
2018 2023ICE Battery EV
40.4
33.8
51.0
2017 2026
Average of OEMs’ CAFE Requirementsfor U.S. Light Vehicles (mpg)
Lightweighting and Powertrain-Agnostic Portfolio Aligned with Key Trends Drives Above-Market Growth4
17
Average Plastic Content by Powertrain Type (lbs)
Source: The Safer Affordable Fuel-Efficient (SAFE) Vehicles Rule for Model Years 2021–2026 Passenger Cars and Light Trucks, U.S. Department of Transportation. (April 30, 2020)
Plastic auto parts market benefiting from CAFE standards, including the need to further lightweight light trucks (growing segment) and electric vehicles (improved battery range)
North American Production by Vehicle Type (%)
Source: IHS Markit as of January 2021.
Source: Plastics in Global Electric Vehicle Market, Lucintel. (July 20, 2018)
+16.3%
California
Federal
U.S. Light Vehicle Sales by Drivetrain (%)
Source: Who Will Drive Electric Cars to the Tipping Point?, Boston Consulting Group. (January 2, 2020)
92% Light Trucks
4% 10% 26% 3%
21%
26%
93% 69%
48%
2020 2025 2030
BEV / PHEV HEV / MHEV ICE

CONFIDENTIAL
Lightweighting and Powertrain-Agnostic Portfolio Aligned with Key Trends Drives Above-Market Growth (Cont’d)4
18
ICE and Hybrid-Only Multi-Powertrain Electric Vehicle-Only
Segmentation of ABC Products by Powertrain
~90% of Sales are derived from powertrain-agnostic products
Air Induction
High TemperatureTurbo Duct
Battery CoolingDuct
Wheel Flares
Bumpers
IP Duct
Floor Duct
Console DuctWasher System
Spoilers &Winglets Load Floor &
Cargo Systems
~90% of Sales overlap
Centre Consoles
InteriorTrim
Running Boards
InteriorGarnish
Rocker Panel
Surge Tanks
Select Recent EV Wins
Rivian Amazon Van
Denotes lightweighting advantage over metal alternative
Seatback Ford F-150 Electric
Denotes use / potential use on battery electric vehicle
Ford Mustang Mach-E

CONFIDENTIAL
Customer Customer A Customer B Customer C Customer D Customer E Customer F Customer G
Relationship Tenure 46 yrs 46 yrs 46 yrs 32 yrs 27 yrs 32 yrs 4 yrs
% of Light Vehicles with ABC Content 99% 99% 79% 81% 76% 100% 59%
CPV Opportunity Medium High High High High High High
Interior
Exterior
HVAC
Fluids
Air Induction
Flexible
Entrenched Customer Relationships with Repeatable Blueprint for Growth and CPV Penetration
There remains significant opportunity to grow content per vehicle across OEMs and their platforms
ABC’s North American CPV: $72 average, $100 average on top 25 platforms by sales and $600 on top CPV coverage platform(1)
Multi-decade and integrated OEM relationships
5
19
Current and Awarded Business
(1) CPV calculated inclusive of joint ventures and excluding tooling sales. “top CPV coverage platform” means the Company’s North American platform with the highest dollar amount of CPV in Fiscal 2020.

CONFIDENTIAL
2017
2018
2019
2020
Experienced Management Team with a Track Record of Driving Value Creation6
Todd SheppelmanPresident & CEO
Man
agem
ent T
eam
Prio
r Exp
erie
nces
/ G
eogr
aphi
es
David EllacottChief HR Officer
Stuart GreidanusChief Commercial Officer
Paer (Pelle) MalmhagenChief Operating Officer
David SmithChief Financial Officer
~150 years of combined auto sector experience
20
Director, Global Tax Director, TotalRewardsVP, Operations – MEX Sr. VP, Global Sales
Director, Treasury HR Director, Mexico / U.S.
VP, OperationsCAD / Intl Sr. VP, Exteriors
Director, Financial Reporting
HR Director, Canada / InternationalDirector, Quality VP, Program
Management
Director, InternalAudit
VP, Global SupplyChain
VP, OperationalFinanceVP, Operations USA
VP, ContinuousImprovement
COO, JV – ABC INOAC
Year of hire

CONFIDENTIAL
17.2%
3.9%
June 30, 2017 December 31, 2020
7.5%
5.5%
FY2018 - FY2020 Average Ongoing
Capital Expenditures (% of Sales) Trade Working Capital(1) (% of LTM Sales)
Significant Investments in Manufacturing Infrastructure and Processes are Expected to Drive Free Cash Flow
Management has focused on facility improvements, modernization and working capital efficiency to position ABC for strong cash generation
7
21
Investments in Manufacturing Infrastructure and Processes
Greenfield facilities to support growth
Modernize largest facilities for efficiency and process improvement
Add specialized machines to support innovative products
(1) Trade working capital calculated as trade and other receivables plus inventories less trade payables
~
~

3. Growth Opportunities

CONFIDENTIAL
Growing industry
+Shift to light trucks
+Lightweighting trend
+Innovation-driven CPV
growth
+Product group and
platform expansion at OEMs
Operational process improvements
+Benchmark performance
across existing plants
+Ongoing material and
labour efficiencies
+Operating leverage
Highly fragmented with both strong synergistic and underperforming
players
+Management strength and
experience
+Strong balance sheet
+SG&A infrastructure
Improvements in capex versus historical levels
+Continued working capital
initiatives
Growth Opportunities
Fiscal2020FCF
Drive Sales That Will Outperform Industry Volume Forecasts
Improve Adjusted EBITDA Margin
Execute on Strategic, Accretive Acquisitions
Fiscal2025FCF
We believe we are well positioned to continue driving Sales growth, profitability and Free Cash Flow
Capital Efficient Business Model
23

CONFIDENTIAL
Increasing CPV with Customers Over TimeWe believe we have a repeatable blueprint for CPV penetration
ABC Revenue Growth Strategy
Establish Relationship
With OEM based on traditional
products: HVAC and Fluids
Expand Breadth
Expand across additional vehicle
platforms
Expand Depth
Cross-sell higher content / more
complex Interior, Exterior and Air
Induction
Sustained Growth
Expand onto higher volume
platforms across all product groups
Entrenched
Obtain highest volume platforms;
re-win replacement
business
1 3 4 52
24
Additional electric vehicle / autonomous driving opportunities
Recently increased CPV with one of our OEMs through content and product group expansion by…
from 3rd to 4th generation CUV~10%
from 3rd to 4th generation full-size pick-up truck and SUV~34%

CONFIDENTIAL
Case Study: Hyundai / Kia Growth StoryEarly stages of demonstrated expansion with a new customer in North America, growing to $24 million in new business awards within 4 years
Successful expansion into 4 of 6 ABC product groups on 8 Hyundai / Kia vehicle models within 3 years of initial awardin the North American region, demonstrating ABC’s proven blueprint for customer and CPV expansion
ABC began supplying Fluids products to Hyundai /
Kia in Fiscal 2019
ABC continued to win business for HVAC and Fluids products on additional Hyundai / Kia programs
Within four years, ABC had expanded into winning Interior and Exterior product groups
Sonata / Optima
Surge Tanks
Sorento
Awarded Value: $4 million
HVAC Surge Tanks
Cumulative Award Value: $16 million
HVAC Exterior Trim
Cumulative Award Value: $24 million
Santa Cruz
Elantra
Sportage
Load Floor and Interior Trim
25
Surge Tanks
FY2020 FY2021FY2018 FY2019
ABC awarded first program
Cumulative Award Value: $12 million
Santa Cruz TucsonSanta Fe

CONFIDENTIAL
Driving Adjusted EBITDA Margin Improvement Through Competitive Cost and Process ImprovementOngoing cost and process improvement actions to further drive long-term Adjusted EBITDA Margin enhancement
26
Competitive Cost and Process
Improvement
Shop Floor Competencies
Best Practice Salary Standardization
Best Practice Standard Specifications Machine
& Process
Centralized Materials Management & Procurement
Indirect Labour Best Practice
StandardizationCentralized Capacity Planning (Capex,
Machine, Floor Space)
Direct Labour Best Practice
Standardization
Global Inventory Reduction Process
Single-Minute Exchange of Dies
(“SMED”)
Standardized APQP Implementation
Six Sigma Black & Green Belt Training

CONFIDENTIAL
Acquisitions as an Incremental Upside Growth Lever
27
There are a number of opportunities to pursue accretive, add-on acquisitions, which we are evaluating and expect to actively pursue or continue to pursue
Strong Acquisition Platform
Strong management team that has been upgraded in virtually all areas of the organization
Substantially improved processes and systems that will facilitate acquisition integration
Very low leverage (1.5x Net Debt / FY2021E Adjusted EBITDA(1)) and significant liquidity
Excellent reputation with customers (e.g. customer-directed takeover of competitor business during COVID-19 downturn)
Robust Opportunity Set
Several logical acquisition targets long-held by financial sponsors looking for an exit
Pockets of distress among smaller suppliers that could bring complementary customers, locations or products
Significant Synergy Potential
Leveraging material cost spend
Reducing overhead and SG&A
Rationalizing manufacturing footprint
Improving Adjusted EBITDA and Free Cash Flow through best practice sharing (e.g. working capital)
(1) Pro forma for the Offering and Credit Agreement Amendment – see “Capitalization as of December 31, 2020” on slide 33 of this presentation, including related footnotes.

4. Financial Overview

CONFIDENTIAL
Industry Growth
Light Truck Share
Fuel Efficiency and Lightweighting
CPV
Competitive Cost and Process Management
Resin Pricing – ~50% of resin contracts have customer pricing mechanisms or other commercial practices that insulate or reduce exposure to market fluctuations
Business Equation – Pricing / economics offset by continuous improvement
Labour – Highly flexible, non-union(1)
labour force
FX – Hedging on principal currencies (CAD and MXN)
Capital Expenditures
Net Working Capital
Key Financial Drivers
29
(1) All employees are non-union other than one joint venture plant in each of Canada and Mexico, our Mexican facilities and statutory unions.
Topline Adjusted EBITDA Free Cash Flow

CONFIDENTIAL
$152
$165 $172 $170
$89
$162
Fiscal 2017 Fiscal 2018 Fiscal 2019 Fiscal 2020 Fiscal 2021E
Sales(US$ millions)
North American
Light Vehicle Production
(Units in millions)
Adjusted EBITDA
(US$ millions)
Adjusted EBITDA Margin(1)
(%)
16.2
~14%
Sales and Adjusted EBITDA
30
17.8 16.8 16.7
Source: IHS Markit as of January 2021.
14.9% 14.4%14.7%
Impacted by 2019 OEM Strike and COVID-19
Impacted by COVID-19
13.0
9.2%
$1,000
$1,000 $1,028 $1,058 $823
$1,035
(1) Adjusted EBITDA Margin is calculated as Adjusted EBITDA divided by Sales adjusted to include the proportionate share of joint venture sales attributable to ABC as well as estimated lost sales due to the 2019 OEM Strike in Fiscal 2020.

CONFIDENTIAL
Fiscal 2020 Fiscal 2021($ in USD millions) Q1 Q2 Q3 Q4 Q1 Q2
Sales $252 $250 $239 $82 $258 $261
EBITDA $29 $35 $32 ($26) $42 $42
Add: Additional launch and related costs $14 $7 - - - -Add: Impact of 2019 OEM Strike $4 $10 ($4) - - -
Add: Net JV impact(1) $1 ($1) $1 $2 $2 $2Less: Lease payments (IFRS 16 accounting) ($5) ($6) ($6) ($6) ($6) ($6)Add: Other adjustments ($2) $3 $7 ($1) $3 $5
Adjusted EBITDA $42 $48 $30 ($31) $41 $44
Adjusted EBITDA Margin (2) 13.9% 15.7% 11.5% (30.9%) 14.2% 14.7%
Quarterly Performance
31
Note: Numbers may not add due to rounding.(1) Comprised of EBITDA from joint ventures less share of income of joint ventures.(2) Adjusted EBITDA Margin is calculated as Adjusted EBITDA divided by Sales adjusted to include the proportionate share of joint venture sales attributable to ABC as well as estimated lost sales
due to the 2019 OEM Strike in Fiscal 2020.
Impacted by additional launch costs and 2019
OEM Strike
Impacted by COVID-19
CONFIDENTIAL
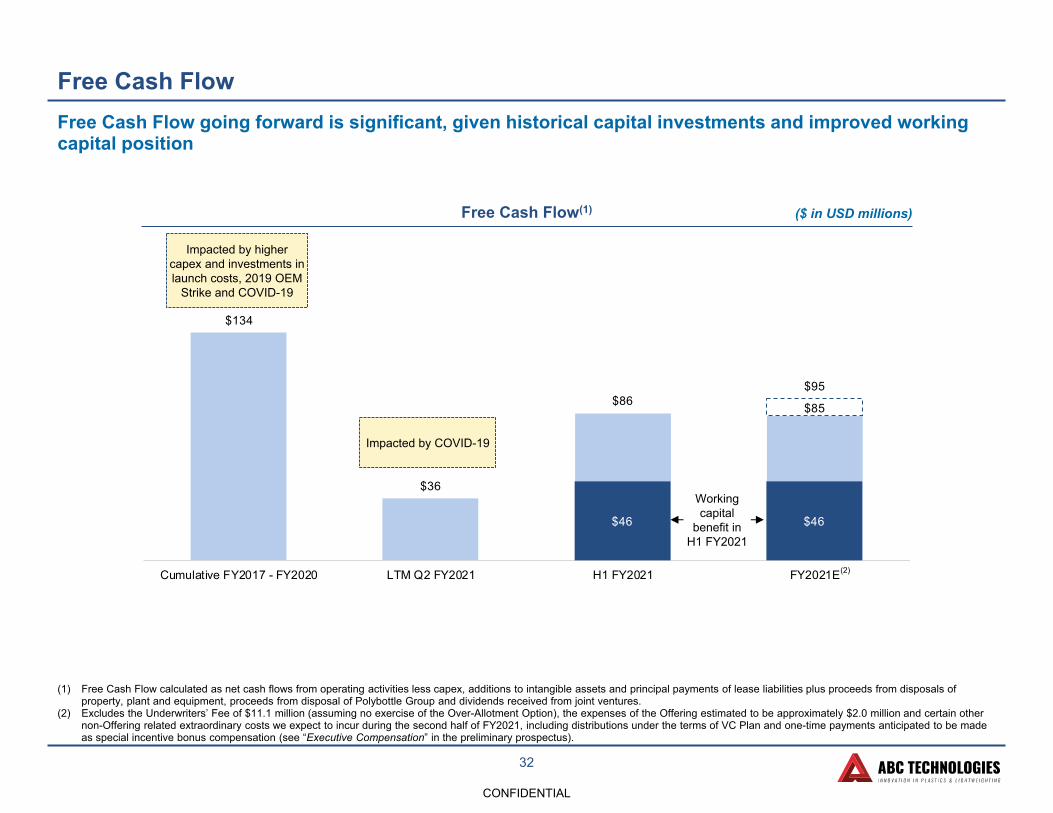
$85
$134
$36
$86 $95
Cumulative FY2017 - FY2020 LTM Q2 FY2021 H1 FY2021 FY2021E-
$46 $46
Free Cash Flow
32
Free Cash Flow(1) ($ in USD millions)
Free Cash Flow going forward is significant, given historical capital investments and improved working capital position
Impacted by higher capex and investments in launch costs, 2019 OEM
Strike and COVID-19
(1) Free Cash Flow calculated as net cash flows from operating activities less capex, additions to intangible assets and principal payments of lease liabilities plus proceeds from disposals of property, plant and equipment, proceeds from disposal of Polybottle Group and dividends received from joint ventures.
(2) Excludes the Underwriters’ Fee of $11.1 million (assuming no exercise of the Over-Allotment Option), the expenses of the Offering estimated to be approximately $2.0 million and certain other non-Offering related extraordinary costs we expect to incur during the second half of FY2021, including distributions under the terms of VC Plan and one-time payments anticipated to be made as special incentive bonus compensation (see “Executive Compensation” in the preliminary prospectus).
Impacted by COVID-19
Working capital
benefit in H1 FY2021
(2)

CONFIDENTIAL
Capitalization as of December 31, 2020Conservative balance sheet with over $200 million of total liquidity
33
Pro Forma Capitalization as of December 31, 2020 (US$ millions)
Pro Forma for the Offering(1)Pro Forma for the Offering and
Credit Agreement Amendment(2)
Debt $283 $293
Proportionate share of debt held at joint ventures -- --
Total debt $283 $293
Cash $50 $49
Proportionate share of cash held at joint ventures $14 $14
Total cash $65 $64
Net Debt(3) $219 $229
Net Debt / Adjusted EBITDA (Fiscal 2021E)(3) 1.4x 1.5x
(1) Cash is presented (A) after deducting the Underwriters’ Fee of $11.1 million (assuming no exercise of the Over-Allotment Option) and the expenses of the Offering estimated to be approximately $2.0 million but (B) without deducting certain other non-Offering related extraordinary costs we expect to incur during the second half of FY2021, including distributions under the terms of VC Plan and one-time payments anticipated to be made as special incentive bonus compensation (see “Executive Compensation” in the preliminary prospectus).
(2) Pro forma for the Offering (as described in footnote 1) and the Credit Agreement Amendment, including $1.1 million of estimated financing fees and the non-cash write-off of deferred financing costs in long-term debt of $9.6 million.
(3) Net Debt calculated as total debt less total cash. Assumes mid-point of ABC’s Adjusted EBITDA guidance for FY2021E of $157 million.(4) Excludes additional $50 million revolving credit facility that matures in April 2021 but will be extinguished as part of the Credit Agreement Amendment.
Pro Forma Liquidity as of December 31, 2020 (US$ millions)
Pro Forma for the Offering(1)Pro Forma for the Offering and
Credit Agreement Amendment(2)
Cash $50 $49
Proportionate share of cash held at joint ventures $14 $14
Undrawn amount of revolving credit facility $150 $157
Letters of credit ($3) ($3)
Total Liquidity $212 $218
(4)

CONFIDENTIAL
Key Metric Fiscal 2021E Outlook(1)
Sales $1,000 million to $1,035 million
Adjusted EBITDA $152 million to $162 million
Free Cash Flow(2) $85 million to $95 million
Fiscal 2021E (June 30, 2021) and Beyond
Sales Growth: Sales and our proportionate share of joint venture revenue, taken together, will continue to outpace the rate of growth of IHS Markit’s light vehicle production forecast
Fiscal 2020 – Fiscal 2025E industry volumes expected to grow at a 4.8% CAGR(3)
Approximately 90% of our Sales and proportionate share of joint venture revenue forecast for the next five fiscal years (excluding tooling sales) are classified as booked / replacement
Adjusted EBITDA Margin: Benefit from operating leverage and operational process improvements
Target improvement in Adjusted EBITDA Margin from pre-COVID 19 historical levels
Capital Expenditures: ~5.5% of Sales supports growth plan
34
(1) See “Disclaimer – Forward-Looking Information”.(2) Excludes the Underwriters’ Fee of $11.1 million (assuming no exercise of the Over-Allotment Option), the expenses of the Offering estimated to be approximately $2.0 million and certain other
non-Offering related extraordinary costs we expect to incur during the second half of FY2021, including distributions under the terms of VC Plan and one-time payments anticipated to be made as special incentive bonus compensation (see “Executive Compensation” in the preliminary prospectus).
(3) As per IHS Markit as of January 2021.
Five Year Outlook(1)

CONFIDENTIAL
SummaryDriving Sales Growth, Profitability Improvements and Free Cash Flow
35
Investment Highlights
Strong Market Share and Leadership Across North America
Unique Vertical Integration and Plastics Lightweighting Capabilities
Industry-Leading Technical Capability and Product / Process Development Expertise
Lightweighting and Powertrain-Agnostic Portfolio Aligned with Key Trends Drives Above-Market Growth
Entrenched Customer Relationships with Repeatable Blueprint for Growth and CPV Penetration
Experienced Management Team with a Track Record of Driving Value Creation
Significant Investments in Manufacturing Infrastructure and Processes are Expected to Drive Free Cash Flow

5. Summary of the Offering

CONFIDENTIAL
Summary of the Offering
37
Issuer ABC Technologies Holdings Inc. (the “Company”)
Selling Shareholders ABC Group Canada LP
Offering 17,000,000 – 21,250,000 Common Shares
Offering Price Between C$12.00 – C$15.00 per Common Share
Offering Size C$255,000,000 (100% Secondary)
Over-Allotment Option 15% of the Offering (100% Secondary)
Common Shares Outstanding 52,522,392
Dividend Policy Annualized aggregate dividend payments of C$7.9 million on a quarterly basis (C$0.15 per share)
Retained Interest Selling Shareholders: 60% – 68% (53% – 63% assuming full exercise of over-allotment option)
Offering Basis Marketed public offering in Canada; Private placement to QIBs in the U.S. via Rule 144A
Lock-Up Arrangements 180 days for the directors, executive officers and Selling Shareholders
Eligibility Eligible for RRSPs, RRIFs, RDSPs, DPSPs, RESPs and TFSAs
Listing The Company has applied to have the Offered Shares listed on the Toronto Stock Exchange under the trading symbol “ABCT”
Active Bookrunners Scotiabank, BMO Capital Markets and J.P. Morgan Securities Canada Inc.
Closing Date Expected the week of February 15, 2021

CONFIDENTIAL
Comparable Company Analysis
38
In accordance with Section 13.7(4) of National Instrument 41-101 – General Prospectus Requirements, all the information relating to ABC’s comparables and anydisclosure relating to the comparables, which is contained in the presentation to be provided to potential investors, has been removed from this template versionfor purposes of its filing on the System for Electronic Document Analysis and Retrieval (SEDAR).

6. Appendix
CONFIDENTIAL
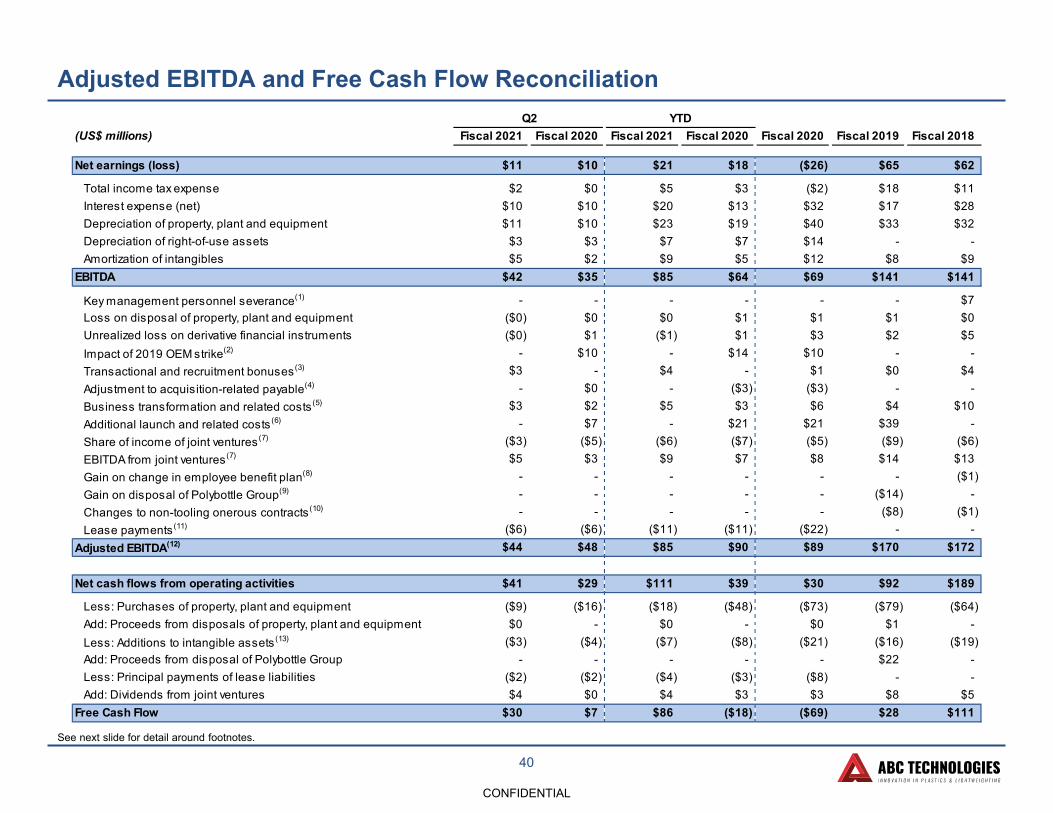
Q2 YTD(US$ millions) Fiscal 2021 Fiscal 2020 Fiscal 2021 Fiscal 2020 Fiscal 2020 Fiscal 2019 Fiscal 2018
Net earnings (loss) $11 $10 $21 $18 ($26) $65 $62
Total income tax expense $2 $0 $5 $3 ($2) $18 $11Interest expense (net) $10 $10 $20 $13 $32 $17 $28Depreciation of property, plant and equipment $11 $10 $23 $19 $40 $33 $32Depreciation of right-of-use assets $3 $3 $7 $7 $14 - -Amortization of intangibles $5 $2 $9 $5 $12 $8 $9
EBITDA $42 $35 $85 $64 $69 $141 $141
Key management personnel severance(1) - - - - - - $7Loss on disposal of property, plant and equipment ($0) $0 $0 $1 $1 $1 $0Unrealized loss on derivative financial instruments ($0) $1 ($1) $1 $3 $2 $5Impact of 2019 OEM strike(2) - $10 - $14 $10 - -Transactional and recruitment bonuses(3) $3 - $4 - $1 $0 $4Adjustment to acquisition-related payable(4) - $0 - ($3) ($3) - -Business transformation and related costs(5) $3 $2 $5 $3 $6 $4 $10Additional launch and related costs(6) - $7 - $21 $21 $39 -Share of income of joint ventures(7) ($3) ($5) ($6) ($7) ($5) ($9) ($6)EBITDA from joint ventures(7) $5 $3 $9 $7 $8 $14 $13Gain on change in employee benefit plan(8) - - - - - - ($1)Gain on disposal of Polybottle Group(9) - - - - - ($14) -Changes to non-tooling onerous contracts(10) - - - - - ($8) ($1)Lease payments(11) ($6) ($6) ($11) ($11) ($22) - -
Adjusted EBITDA(12) $44 $48 $85 $90 $89 $170 $172
Net cash flows from operating activities $41 $29 $111 $39 $30 $92 $189
Less: Purchases of property, plant and equipment ($9) ($16) ($18) ($48) ($73) ($79) ($64)Add: Proceeds from disposals of property, plant and equipment $0 - $0 - $0 $1 -Less: Additions to intangible assets(13) ($3) ($4) ($7) ($8) ($21) ($16) ($19)Add: Proceeds from disposal of Polybottle Group - - - - - $22 -Less: Principal payments of lease liabilities ($2) ($2) ($4) ($3) ($8) - -Add: Dividends from joint ventures $4 $0 $4 $3 $3 $8 $5
Free Cash Flow $30 $7 $86 ($18) ($69) $28 $111
Adjusted EBITDA and Free Cash Flow Reconciliation
40
See next slide for detail around footnotes.

CONFIDENTIAL
Adjusted EBITDA and Free Cash Flow Reconciliation (Cont’d)
(1) Represents severance expense related to key management personnel as a result of organizational changes in Fiscal 2018.
(2) Represents management’s estimate of lost EBITDA associated with the 2019 OEM Strike. The Company estimated lost sales by comparing customer forecasted demand from IHS Markit prior to the strike compared with actual releases on a per vehicle basis. This comparison was done by quarter up to the end of February 2020. The Company estimate considered that a portion of the lost volume was recovered as such OEM customer publicly announced it would work to recover lost sales through working over time and extra shifts.
(3) Represents incentive compensation paid to management in excess of 100% of the target level due to overperformance relative tobudget, as well as transactional and recruitment bonuses.
(4) Represents a gain recorded on the settlement of a liability payable to the former shareholders of ABC, established when the Company was acquired by the current shareholder.
(5) Represents costs including consulting fees associated with enhancing business operations, organizational capability and related processes. These costs include services provided by Cerberus Operations and Advisory LLC and certain of ABC’s directors.
(6) Represents estimated additional launch costs associated with large programs included in cost of sales and selling, general and administrative expense.
(7) Deducts share of income from joint ventures and adds EBITDA from joint ventures, which represents earnings before interest, taxes, and depreciation for the joint venture segment. This excludes any adjustment for the impact of the 2019 OEM Strike.
(8) Represents a one-time benefit received from changing the employee benefit plan to an administrative service only plan in Fiscal 2018.
(9) Represents the one-time gain realized from sale of all shares in the Polybottle Group, ABC’s packaging manufacturing facilities on November 1, 2018.
(10) Represents the adjustment of a reserve for non-tooling onerous contracts.
(11) Represents the adjustment for operating lease payments to reverse the impact of IFRS 16.
(12) Including the impact of IFRS 16, Adjusted EBITDA would have been $49 million, $54 million, $96 million, $100 million and $111million in Q2 Fiscal 2021, Q2 Fiscal 2020, YTD Fiscal 2021, YTD Fiscal 2020 and Fiscal 2020, respectively.
(13) Represents capitalized development costs under IAS 38 Intangible Assets.
41