Abbott
68
Abbott 2011 Annual Report i 20 20 20 2011 11 11 1 A Ann nnua u l Re R po po p p rt rt
-
Upload
saandeepchandra -
Category
Documents
-
view
53 -
download
8
Transcript of Abbott

Abbott 2011 Annual Report
i
202020201111111 AAnnnnuau l ReR popopp rtrt

1 Letter to Shareholders6 Nutritional Products, Diagnostics, Medical Devices
and Established Pharmaceuticals14 Pipeline Highlights: Nutritional Products, Diagnostics,
Medical Devices and Established Pharmaceuticals16 Proprietary Pharmaceuticals22 Pipeline Highlights: Proprietary Pharmaceuticals24 Financial Report25 Consolidated Financial Statements and Notes46 Management Report on Internal Control Over Financial Reporting47 Reports of Independent Registered Public Accounting Firm48 Financial Instruments and Risk Management49 Financial Review63 Summary of Selected Financial Data64 Directors and Corporate Offi cers65 Shareholder and Corporate Information
Abbott is a global, diversifi ed healthcare company devoted to the discovery, development, manufacture and marketing of pharmaceuticals, nutritional products for children and adults, and medical products, including devices, diagnostic tests and instruments. The company employs approximately 91,000 people and markets its products worldwide.
John Lamb was the fi rst patient to receive Abbott’s Absorb Bioresorbable Vascular Scaffold in clinical trials. Absorb is designed to treat a patient’s blocked coronary artery to restore blood fl ow to the heart and then dissolve after approximately two years.
Absorb is authorized for sale in Europe and is an investigational device in a number of countries around the world, including the United States, Japan, India, Brazil and New Zealand.
Absorb Bioresorbable Vascular ScaffoldJohn Lamb, Tauranga, New Zealand
On the cover:
Abbott 2011 Annual Report
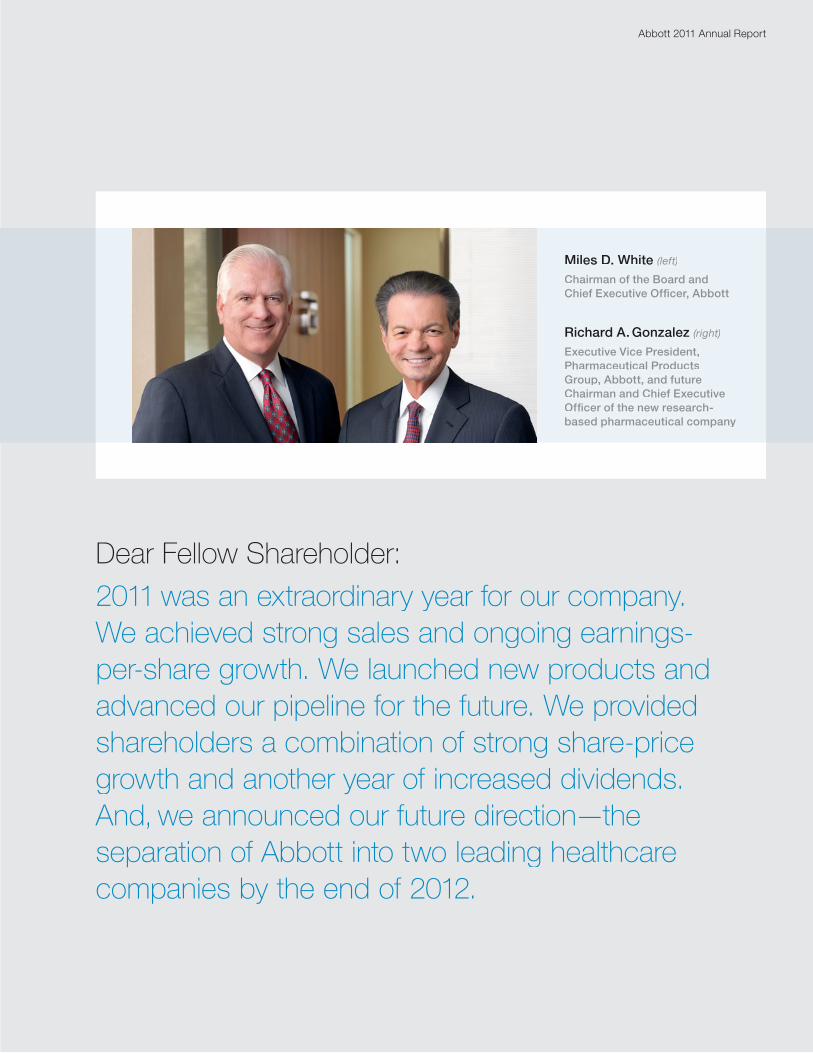
Dear Fellow Shareholder:
2011 was an extraordinary year for our company. We achieved strong sales and ongoing earnings-per-share growth. We launched new products and advanced our pipeline for the future. We provided shareholders a combination of strong share-price growth and another year of increased dividends. And, we announced our future direction—the separation of Abbott into two leading healthcare companies by the end of 2012.
Miles D. White (left)
Chairman of the Board and Chief Executive Offi cer, Abbott
Richard A. Gonzalez (right)
Executive Vice President,Pharmaceutical Products Group, Abbott, and future Chairman and Chief Executive Offi cer of the new research-based pharmaceutical company
Abbott 2011 Annual Report
2
In 2011, despite a very challenging business environment, Abbott grew its global sales by 10.5 percent and increased ongoing earnings per share by 11.8 percent. We delivered record operating cash fl ow of $9 billion. Dividends rose for the 39th consecutive year, returning approximately $3 billion to shareholders. Combined with our share-price growth of 17.4 percent, this produced a total return on Abbott stock of nearly 22 percent, outperforming the S&P 500 and S&P Healthcare indices. This was our best performance in fi ve years, and the best in our medical technology peer group.
It is, therefore, from a position of great strength that we move toward our future as two new healthcare leaders: a diversifi ed medical products company and a research-based pharmaceutical company.
Two Leading Healthcare Companies
The diversifi ed medical products company will retain the Abbott name, and I will lead it as Chairman and Chief Executive Offi cer. The new, research-based pharmaceutical company will be named later and will be led by Richard Gonzalez as Chairman and Chief Executive Offi cer. Rick is a 30-year Abbott veteran who has led our global pharmaceuticals business for the past two years and previously served as Abbott’s President and Chief Operating Offi cer. He is also one of the most seasoned and strategic leaders in the healthcare industry. The new company will be in very good hands.
The new, research-based pharmaceutical company will consist of our current proprietary pharmaceuticals business, equal to $17.4 billion in 2011 sales. The diversifi ed medical products company will include all of Abbott’s other businesses: Nutritional Products, Diagnostics, Established Pharmaceuticals and Medical Devices, including Vascular Care, Diabetes Care, Medical Optics and Animal Health, equal to $21.5 billion in sales last year.
Upon the completion of our separation, Abbott shareholders will own stock in two companies that will be leaders in their fi elds. On Day One of independent operation, both companies will be:
• Fortune 200 businesses;
• Market leaders with broad product portfolios and strong new-product pipelines;
• Global in reach, infrastructure and competitive critical mass; and,
• Organizations with strong balance sheets and signifi cant, durable cash fl ow.
We expect the two companies to each pay a dividend that, when combined, will equal the current Abbott dividend at the time of separation. These are the fundamental facts of our separation strategy—the “What.” Now I’ll explain the “Why.”
Letter to our shareholders
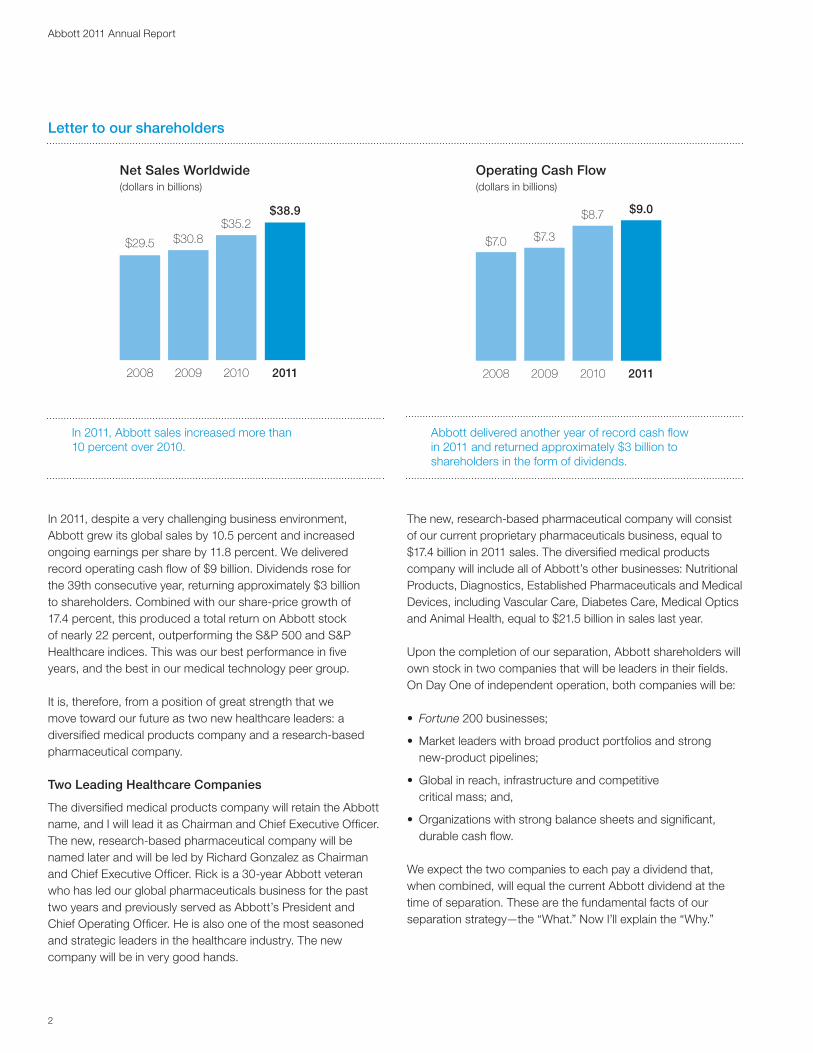
Abbott delivered another year of record cash fl ow in 2011 and returned approximately $3 billion to shareholders in the form of dividends.
Operating Cash Flow(dollars in billions)
2008 2009 2010 2011
$8.7 $9.0
$7.0 $7.3
In 2011, Abbott sales increased more than 10 percent over 2010.
Net Sales Worldwide(dollars in billions)
2008
$29.5
2009
$30.8
2010 2011
$35.2$38.9
Abbott 2011 Annual Report
3
Evolving in a Changing Environment
Our strategic actions of the past decade-plus have dramatically reshaped and strengthened Abbott. Most recently, we have expanded our presence in emerging markets and aggressively rebuilt our pharmaceutical pipeline. At the same time, the investment identities and operating models of our current medical products businesses and pharmaceuticals business evolved independently. They now represent two distinct and compelling investment opportunities for shareholders.
This period also saw signifi cant change in our operating environment, including the rise of emerging markets and their growing impact on global business. Abbott’s sales outside the United States now exceed those within. At the same time, rising global regulatory standards have changed the landscape for new healthcare products.
These changes in the environment essentially led each business to pursue distinctly different business models. Today, research-based pharmaceutical products have different approval and life cycles, research and development profi les, regulatory environments and geographical market focuses than our other businesses.
As a result, these two halves of today’s Abbott have moved in very different directions with equally different demands and priorities and are already functioning as separate, highly successful businesses. Acknowledging this, with the creation
of two independent companies, helps clarify for investors each business’ value, which we believe will be benefi cial for both companies and both stocks.
In making this decision, we challenged ourselves to think beyond our established and successful model to create the optimal pharmaceutical and medical products companies for the conditions of the 21st century. Because of the ways in which investors value these two different models, and because of their varying capital and investment needs, we concluded that we would be even more successful in the years ahead as two companies rather than one.
Business diversity will remain the core principle underlying the new Abbott medical products company. On Day One, it will be one of the most diversifi ed companies in healthcare. But, our strategy is to comprise a diversity of businesses, not business models. And, diversity certainly is not the only successful model in healthcare. In fact, many of the leading peers of our future research-based pharmaceutical company have narrowed themselves to this core business in recent years, as the model best suited to that particular market.
Sales in our global, research-based pharmaceuticals business grew 10 percent in 2011, while sales in the diversifi ed medical products businesses rose 11 percent. This strong performance in both halves of today’s Abbott—our two future companies—underscores the soundness of each model and the strength of each business.
Letter to our shareholders
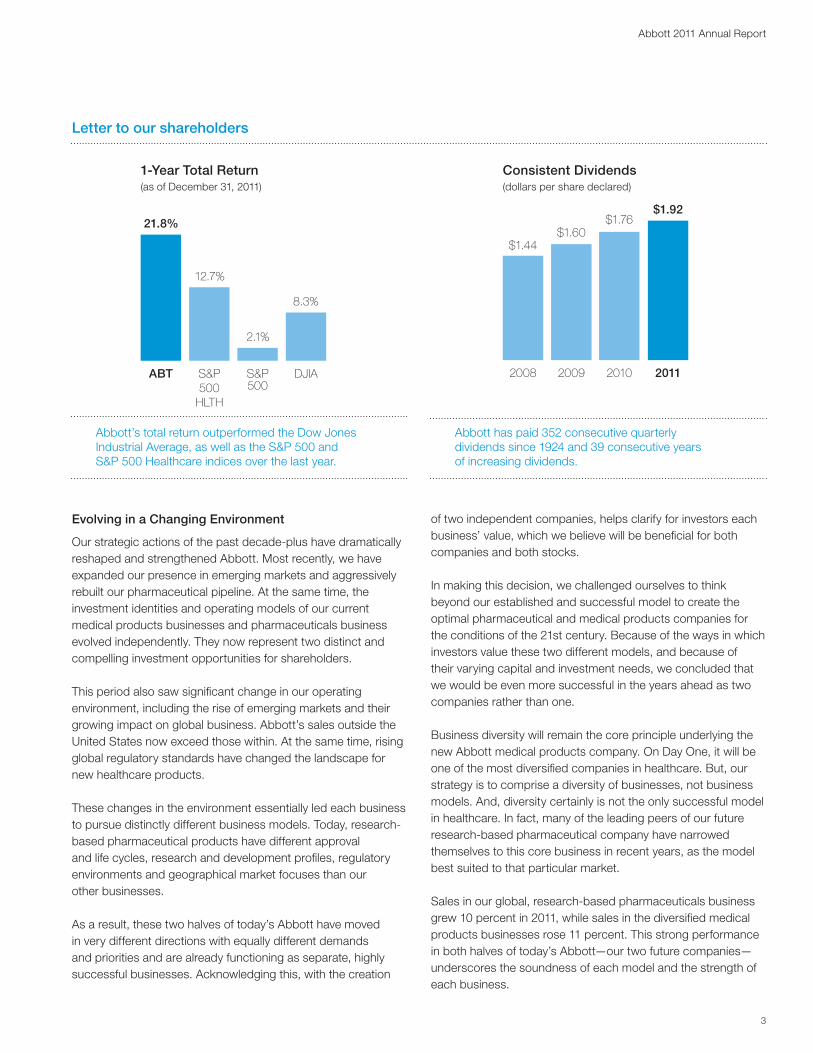
Abbott has paid 352 consecutive quarterly dividends since 1924 and 39 consecutive years of increasing dividends.
Consistent Dividends(dollars per share declared)
2008
$1.44
2009
$1.60
2010 2011
$1.76$1.92
Abbott’s total return outperformed the Dow Jones Industrial Average, as well as the S&P 500 and S&P 500 Healthcare indices over the last year.
1-Year Total Return(as of December 31, 2011)
ABT S&P500
HLTH
S&P500
DJIA
8.3%
12.7%
2.1%
21.8%
Abbott 2011 Annual Report
4
Moving Toward Our Future
As always, the key to this success is our people. Abbott has a deep bench of executive talent, a strong culture of achievement and a superior global team. Our people are focused on running our business with minimal disruption throughout this year of transition. Managing the separation process is a dedicated group, which we created years ago specifi cally to handle signifi cant organizational change of this kind.
An important step for the new company will be the organization of its board of directors, which will take place in the months ahead. This is a constant process in the life of a company, as demonstrated by changes to Abbott’s board in 2011. The year saw the retirement of three long-time directors: Lord David Owen, Roy Roberts, and Bill Smithburg. Their combined six decades of distinguished leadership and counsel helped Abbott thrive through the years, and we thank them sincerely for their service. Last year, we brought new talent and perspective to our board with the appointment of Sally Blount, Dean of the Kellogg School of Management at Northwestern University; and Nancy McKinstry, Chief Executive Offi cer and Chairman of the Executive Board of Netherlands-based Wolters Kluwer.
In 2012, we expect to deliver another year of strong earnings growth while investing appropriately to ensure successful futures for our two leading healthcare companies post separation.
This next large step in Abbott’s evolution fi ts squarely in our company’s long history of growth and success through continual strategic adaptation. We expect Abbott to be one of the fastest-growing large-cap diversifi ed medical products companies, with a durable mix of products and a strong emerging-markets presence. The new, research-based pharmaceutical company will be a leader in its industry with a strong and sustainable portfolio of specialty medicines, as well as a promising pipeline.
It’s by making the right changes at the right times that Abbott has thrived for almost a century and a quarter. Soon, two companies will carry forward this same great legacy, for the growing benefi t of all the people we serve.
Letter to our shareholders
Miles D. White Chairman of the Board and Chief Executive Offi cerMarch 2, 2012
• Nutritional Products• Diagnostics
• Medical Devices• Established Pharmaceuticals
Abbott Diversifi ed Medical Products:
• Proprietary Pharmaceuticals• Leading brands, including Humira
• Broad, promisingpharmaceutical pipeline of smallmolecules and biologics
New Research-Based Pharmaceutical Company:
Abbott is separating into two leading healthcare companies in diversifi ed medical products and research-based pharmaceuticals.

Abbott 2011 Annual Report
5
Abbott today is a diverse portfolio of businesses, each with market-leading products and strong research pipelines.
Abbott 2011 Annual Report
6
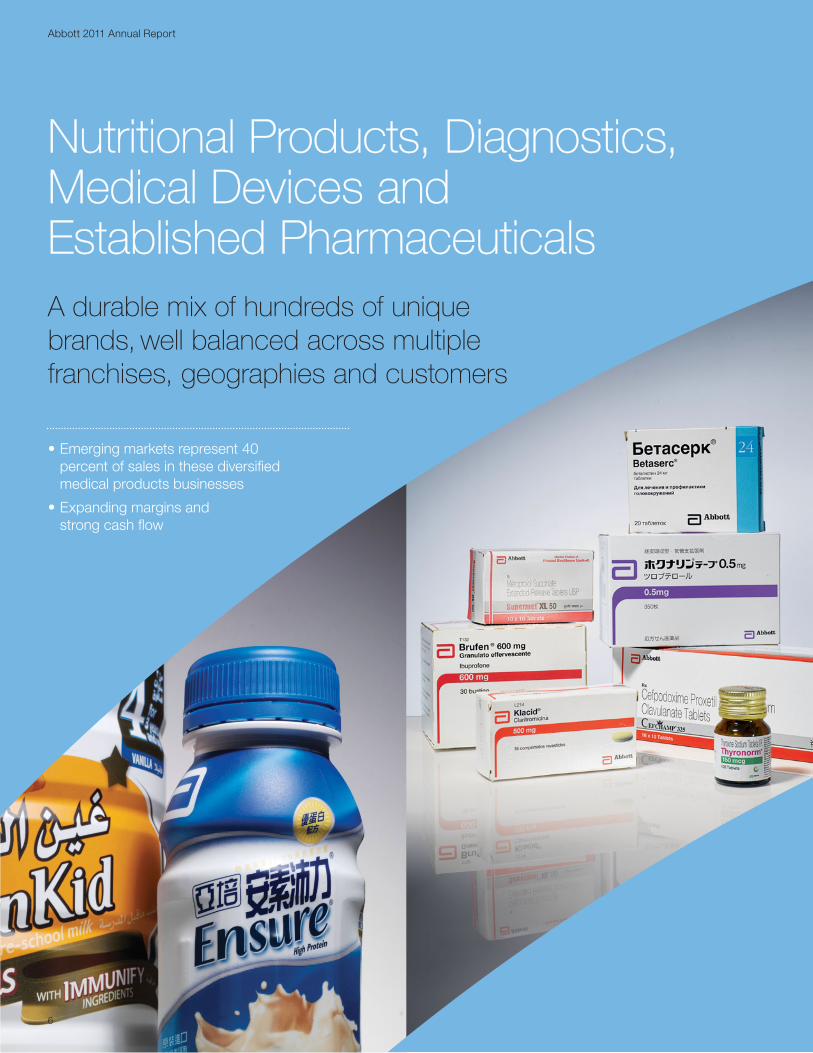
Nutritional Products, Diagnostics, Nutritional Products, Diagnostics, Medical Devices and Medical Devices and Established PharmaceuticalsEstablished PharmaceuticalsA durable mix of hundreds of unique brands, well balanced across multiple franchises, geographies and customers
• Emerging markets represent 40 percent of sales in these diversifi ed medical products businesses
• Expanding margins and strong cash fl ow
Abbott 2011 Annual Report
7
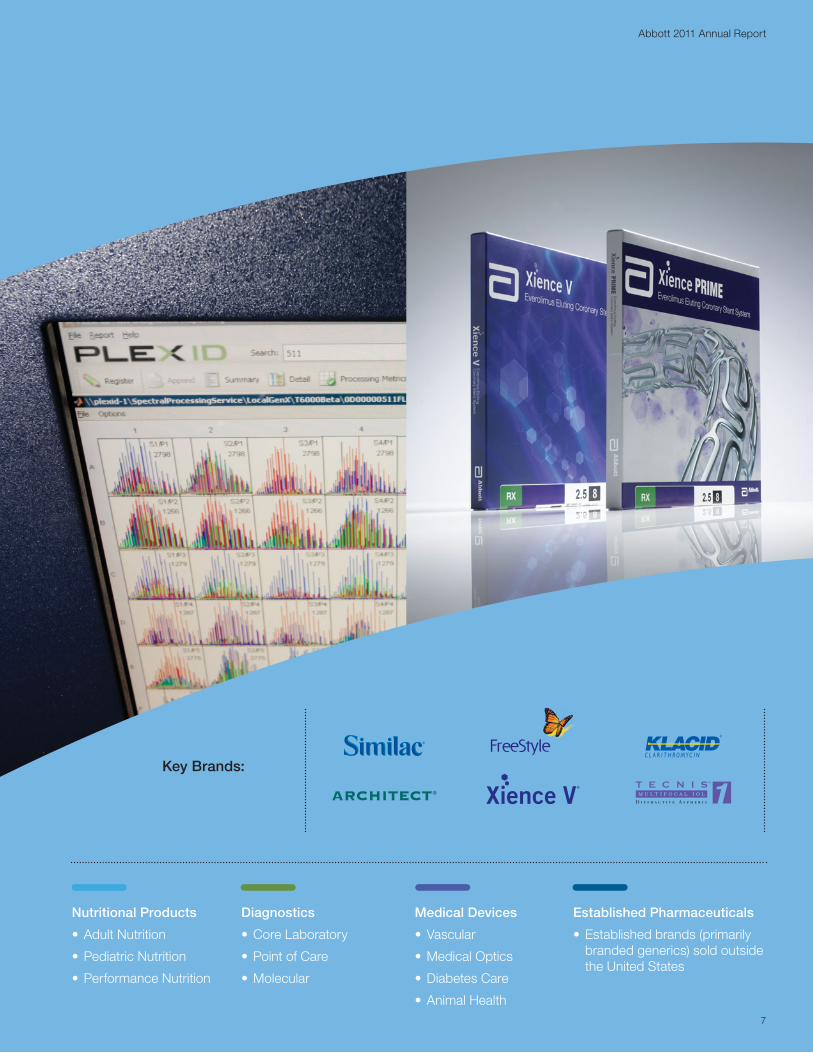
Nutritional Products
• Adult Nutrition
• Pediatric Nutrition
• Performance Nutrition
Medical Devices
• Vascular
• Medical Optics
• Diabetes Care
• Animal Health
Diagnostics
• Core Laboratory
• Point of Care
• Molecular
Established Pharmaceuticals
• Established brands (primarily branded generics) sold outside the United States
Key Brands:
Abbott 2011 Annual Report
8
Abbott is advancing nutrition, disease diagnosis, vision care, diabetes management and the treatment of vascular disease while expanding the reach of established pharmaceuticals.
Nutritional Products, Diagnostics, Medical Devices and Established Pharmaceuticals
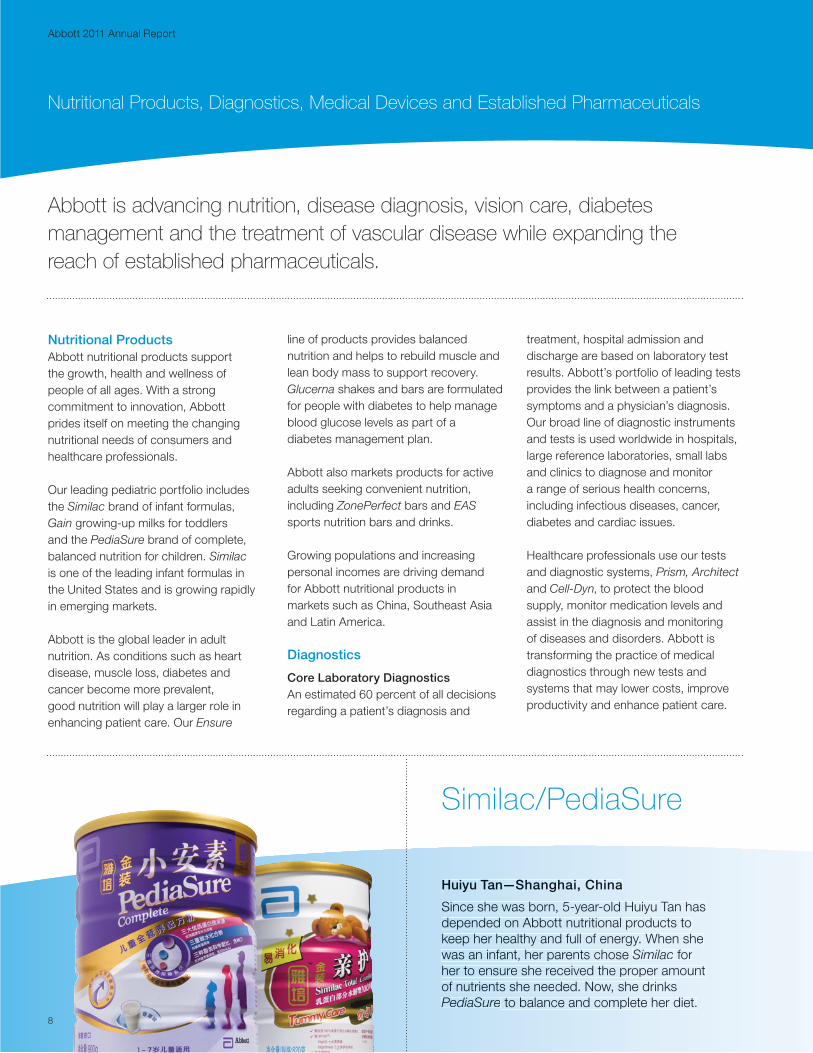
Similac/PediaSure
Huuiyu Taan—Shannghai, Chhina
Sinnce shhe was boorn, 5-yearr-old Huiyuu Tan has deependeed on Abbbott nutritiional produucts to keeep herr healthy aand full off energy. WWhen she waas an innfant, herr parents cchose Simmilac for heer to ennsure she received the proper amount of nutriennts she neeeded. Noow, she drrinks PeediaSurre to balaance and ccomplete hher diet.
Nutritional ProductsAbbott nutritional products support the growth, health and wellness of people of all ages. With a strong commitment to innovation, Abbott prides itself on meeting the changing nutritional needs of consumers and healthcare professionals.
Our leading pediatric portfolio includes the Similac brand of infant formulas, Gain growing-up milks for toddlers and the PediaSure brand of complete, balanced nutrition for children. Similac is one of the leading infant formulas in the United States and is growing rapidly in emerging markets.
Abbott is the global leader in adult nutrition. As conditions such as heart disease, muscle loss, diabetes and cancer become more prevalent, good nutrition will play a larger role in enhancing patient care. Our Ensure
line of products provides balanced nutrition and helps to rebuild muscle and lean body mass to support recovery. Glucerna shakes and bars are formulated for people with diabetes to help manage blood glucose levels as part of a diabetes management plan.
Abbott also markets products for active adults seeking convenient nutrition, including ZonePerfect bars and EAS sports nutrition bars and drinks.
Growing populations and increasing personal incomes are driving demand for Abbott nutritional products in markets such as China, Southeast Asia and Latin America.
Diagnostics
Core Laboratory Diagnostics An estimated 60 percent of all decisions regarding a patient’s diagnosis and
treatment, hospital admission and discharge are based on laboratory test results. Abbott’s portfolio of leading tests provides the link between a patient’s symptoms and a physician’s diagnosis. Our broad line of diagnostic instruments and tests is used worldwide in hospitals, large reference laboratories, small labs and clinics to diagnose and monitor a range of serious health concerns, including infectious diseases, cancer, diabetes and cardiac issues.
Healthcare professionals use our tests and diagnostic systems, Prism, Architect and Cell-Dyn, to protect the blood supply, monitor medication levels and assist in the diagnosis and monitoring of diseases and disorders. Abbott is transforming the practice of medical diagnostics through new tests and systems that may lower costs, improve productivity and enhance patient care.


Abbott 2011 Annual Report
11
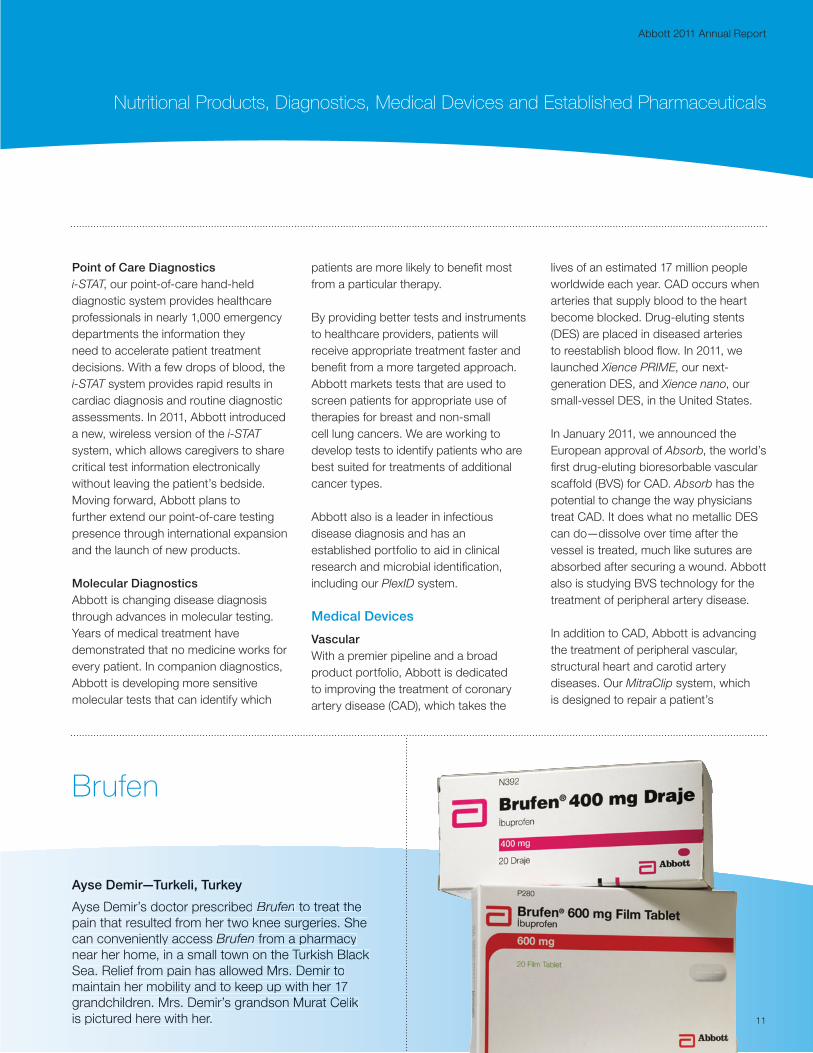
Brufen
Ayse Demir—Turkeli, Turkey
Ayse Demir’s doctor pprescribedd Brufen too treat tthe pain that ressulted fromm her two knee surggeries. Shee can convenniently acceess Brufenn from a phharmaccy near her home, in a smmall town on the Turrkish BBlacck Sea. Relief ffrom pain hhas alloweed Mrs. Deemir too maintain heer mobility aand to keeep up withh her 177 grandchildreen. Mrs. Demir’s graandson Muurat Ceelik is pictured hhere with hher.
Point of Care Diagnosticsi-STAT, our point-of-care hand-held diagnostic system provides healthcare professionals in nearly 1,000 emergency departments the information they need to accelerate patient treatment decisions. With a few drops of blood, the i-STAT system provides rapid results in cardiac diagnosis and routine diagnostic assessments. In 2011, Abbott introduced a new, wireless version of the i-STAT system, which allows caregivers to share critical test information electronically without leaving the patient’s bedside. Moving forward, Abbott plans to further extend our point-of-care testing presence through international expansion and the launch of new products.
Molecular DiagnosticsAbbott is changing disease diagnosis through advances in molecular testing. Years of medical treatment have demonstrated that no medicine works for every patient. In companion diagnostics, Abbott is developing more sensitive molecular tests that can identify which
patients are more likely to benefi t most from a particular therapy.
By providing better tests and instruments to healthcare providers, patients will receive appropriate treatment faster and benefi t from a more targeted approach. Abbott markets tests that are used to screen patients for appropriate use of therapies for breast and non-small cell lung cancers. We are working to develop tests to identify patients who are best suited for treatments of additional cancer types.
Abbott also is a leader in infectious disease diagnosis and has an established portfolio to aid in clinical research and microbial identifi cation, including our PlexID system.
Medical Devices
VascularWith a premier pipeline and a broad product portfolio, Abbott is dedicated to improving the treatment of coronary artery disease (CAD), which takes the
lives of an estimated 17 million people worldwide each year. CAD occurs when arteries that supply blood to the heart become blocked. Drug-eluting stents (DES) are placed in diseased arteries to reestablish blood fl ow. In 2011, we launched Xience PRIME, our next-generation DES, and Xience nano, our small-vessel DES, in the United States.
In January 2011, we announced the European approval of Absorb, the world’s fi rst drug-eluting bioresorbable vascular scaffold (BVS) for CAD. Absorb has the potential to change the way physicians treat CAD. It does what no metallic DES can do—dissolve over time after the vessel is treated, much like sutures are absorbed after securing a wound. Abbott also is studying BVS technology for the treatment of peripheral artery disease.
In addition to CAD, Abbott is advancing the treatment of peripheral vascular, structural heart and carotid artery diseases. Our MitraClip system, which is designed to repair a patient’s
Nutritional Products, Diagnostics, Medical Devices and Established Pharmaceuticals
Abbott 2011 Annual Report
12
Nutritional Products, Diagnostics, Medical Devices and Established Pharmaceuticals
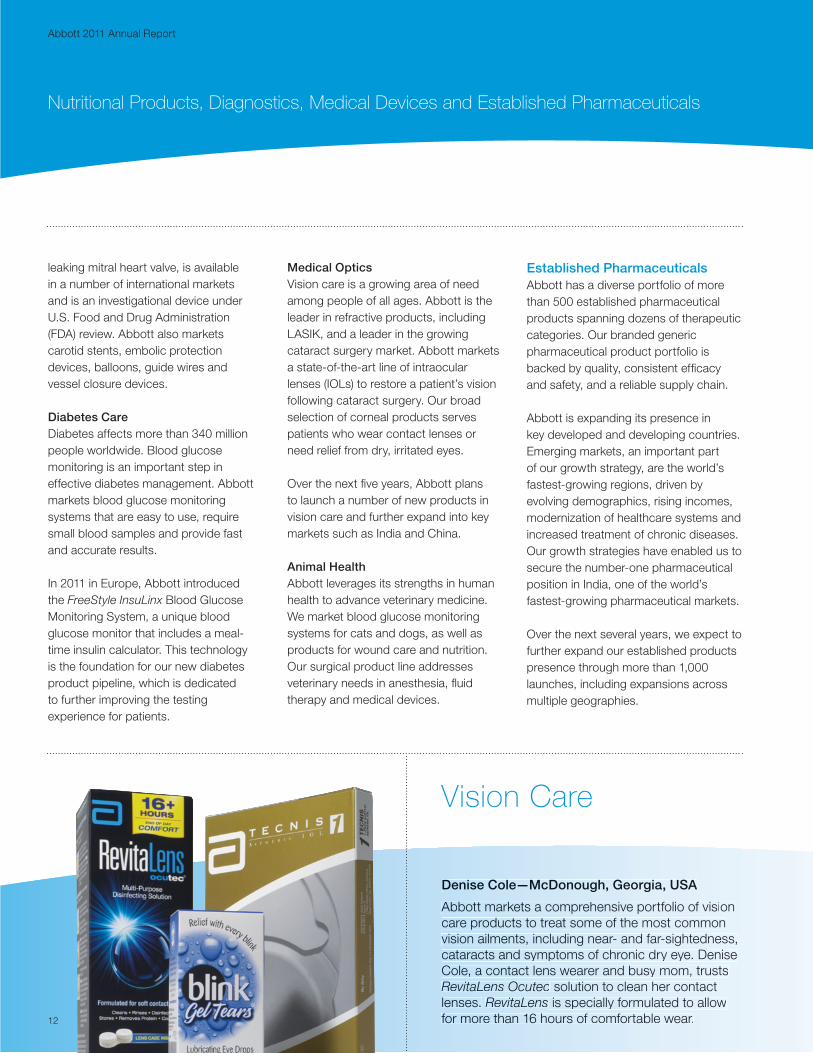
Vision Care
Deenise CCole—MccDonouggh, Georgiia, USA
Abbbott mmarkets a comprehhensive porrtfolio of visiion caare prodducts to ttreat somee of the moost commonn vission ailmments, inccluding neear- and faar-sightedneess, caataractss and symmptoms off chronic ddry eye. Dennise Coole, a ccontact lenns wearerr and busyy mom, trustts ReevitaLeens Ocutecc solutionn to clean hher contact lennses. RRevitaLenss is speciaally formulated to alloww forr more than 16 hhours of ccomfortablee wear.
leaking mitral heart valve, is available in a number of international markets and is an investigational device under U.S. Food and Drug Administration (FDA) review. Abbott also markets carotid stents, embolic protection devices, balloons, guide wires and vessel closure devices.
Diabetes CareDiabetes affects more than 340 million people worldwide. Blood glucose monitoring is an important step in effective diabetes management. Abbott markets blood glucose monitoring systems that are easy to use, require small blood samples and provide fast and accurate results.
In 2011 in Europe, Abbott introduced the FreeStyle InsuLinx Blood Glucose Monitoring System, a unique blood glucose monitor that includes a meal-time insulin calculator. This technology is the foundation for our new diabetes product pipeline, which is dedicated to further improving the testing experience for patients.
Medical OpticsVision care is a growing area of need among people of all ages. Abbott is the leader in refractive products, including LASIK, and a leader in the growing cataract surgery market. Abbott markets a state-of-the-art line of intraocular lenses (IOLs) to restore a patient’s vision following cataract surgery. Our broad selection of corneal products serves patients who wear contact lenses or need relief from dry, irritated eyes.
Over the next fi ve years, Abbott plans to launch a number of new products in vision care and further expand into key markets such as India and China.
Animal Health Abbott leverages its strengths in human health to advance veterinary medicine. We market blood glucose monitoring systems for cats and dogs, as well as products for wound care and nutrition. Our surgical product line addresses veterinary needs in anesthesia, fl uid therapy and medical devices.
Established PharmaceuticalsAbbott has a diverse portfolio of more than 500 established pharmaceutical products spanning dozens of therapeutic categories. Our branded generic pharmaceutical product portfolio is backed by quality, consistent effi cacy and safety, and a reliable supply chain.
Abbott is expanding its presence in key developed and developing countries. Emerging markets, an important part of our growth strategy, are the world’s fastest-growing regions, driven by evolving demographics, rising incomes, modernization of healthcare systems and increased treatment of chronic diseases. Our growth strategies have enabled us to secure the number-one pharmaceutical position in India, one of the world’s fastest-growing pharmaceutical markets.
Over the next several years, we expect to further expand our established products presence through more than 1,000 launches, including expansions across multiple geographies.

Abbott 2011 Annual Report
14
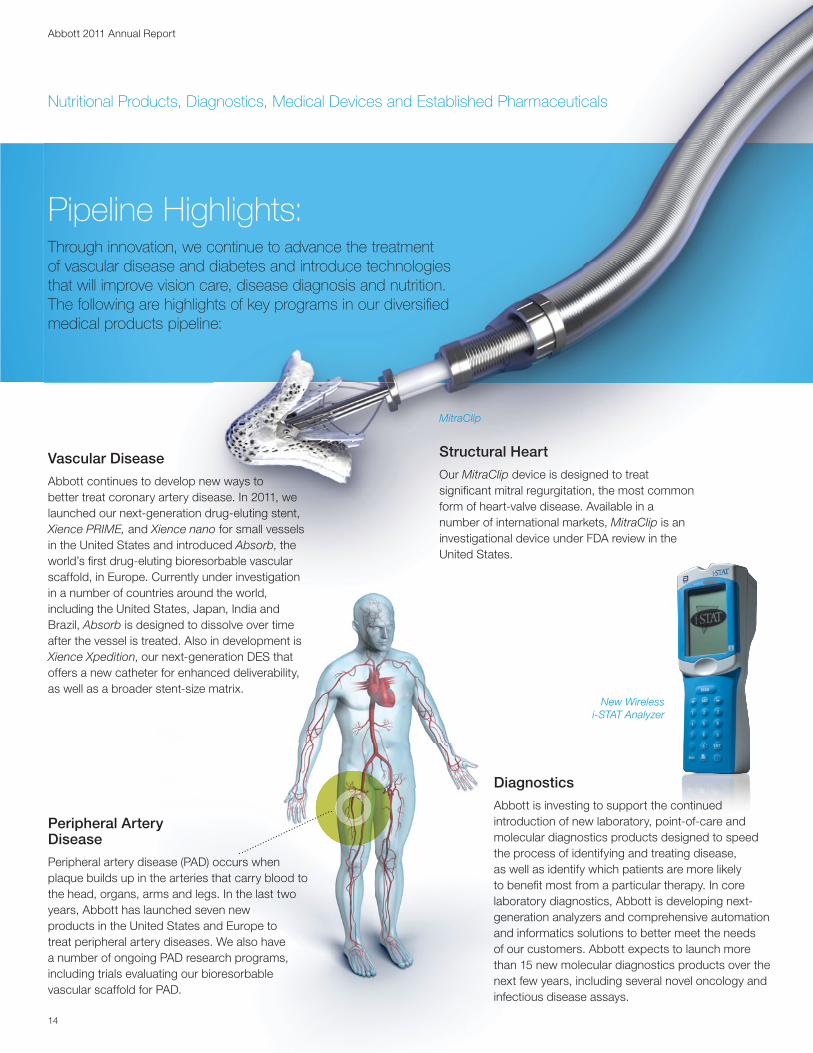
Peripheral Artery Disease
Peripheral artery disease (PAD) occurs when plaque builds up in the arteries that carry blood to the head, organs, arms and legs. In the last two years, Abbott has launched seven new products in the United States and Europe to treat peripheral artery diseases. We also have a number of ongoing PAD research programs, including trials evaluating our bioresorbable vascular scaffold for PAD.
Pipeline Highlights: Through innovation, we continue to advance the treatment of vascular disease and diabetes and introduce technologies that will improve vision care, disease diagnosis and nutrition. The following are highlights of key programs in our diversifi ed medical products pipeline:
Diagnostics
Abbott is investing to support the continued introduction of new laboratory, point-of-care and molecular diagnostics products designed to speed the process of identifying and treating disease, as well as identify which patients are more likely to benefi t most from a particular therapy. In core laboratory diagnostics, Abbott is developing next-generation analyzers and comprehensive automation and informatics solutions to better meet the needs of our customers. Abbott expects to launch more than 15 new molecular diagnostics products over the next few years, including several novel oncology and infectious disease assays.
Vascular Disease
Abbott continues to develop new ways to better treat coronary artery disease. In 2011, we launched our next-generation drug-eluting stent, Xience PRIME, and Xience nano for small vessels in the United States and introduced Absorb, the world’s fi rst drug-eluting bioresorbable vascular scaffold, in Europe. Currently under investigation in a number of countries around the world, including the United States, Japan, India and Brazil, Absorb is designed to dissolve over time after the vessel is treated. Also in development is Xience Xpedition, our next-generation DES that offers a new catheter for enhanced deliverability, as well as a broader stent-size matrix.
Structural Heart
Our MitraClip device is designed to treat signifi cant mitral regurgitation, the most common form of heart-valve disease. Available in a number of international markets, MitraClip is an investigational device under FDA review in the United States.
MitraClip
New Wireless i-STAT Analyzer
Nutritional Products, Diagnostics, Medical Devices and Established Pharmaceuticals
Abbott 2011 Annual Report
15
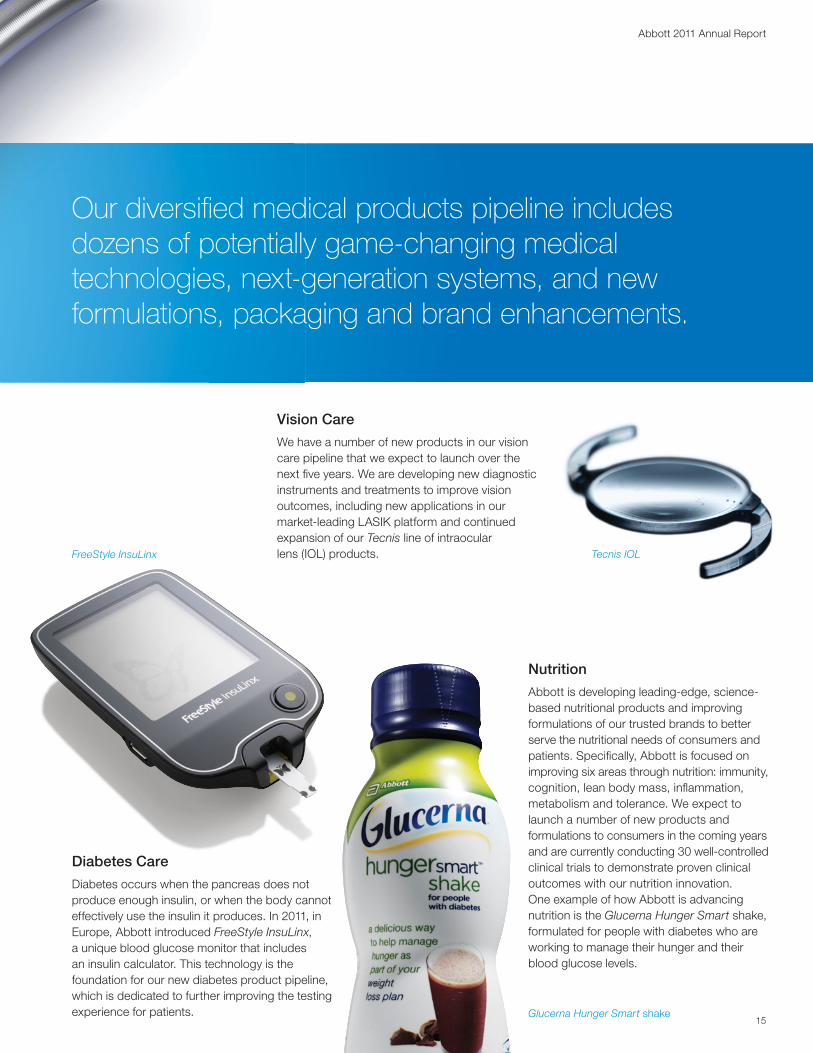
Nutrition
Abbott is developing leading-edge, science-based nutritional products and improving formulations of our trusted brands to better serve the nutritional needs of consumers and patients. Specifi cally, Abbott is focused on improving six areas through nutrition: immunity, cognition, lean body mass, infl ammation, metabolism and tolerance. We expect to launch a number of new products and formulations to consumers in the coming years and are currently conducting 30 well-controlled clinical trials to demonstrate proven clinical outcomes with our nutrition innovation. One example of how Abbott is advancing nutrition is the Glucerna Hunger Smart shake, formulated for people with diabetes who are working to manage their hunger and their blood glucose levels.
Our diversifi ed medical products pipeline includes dozens of potentially game-changing medical technologies, next-generation systems, and new formulations, packaging and brand enhancements.
Vision Care
We have a number of new products in our vision care pipeline that we expect to launch over the next fi ve years. We are developing new diagnostic instruments and treatments to improve vision outcomes, including new applications in our market-leading LASIK platform and continued expansion of our Tecnis line of intraocular lens (IOL) products.
Diabetes Care
Diabetes occurs when the pancreas does not produce enough insulin, or when the body cannot effectively use the insulin it produces. In 2011, in Europe, Abbott introduced FreeStyle InsuLinx, a unique blood glucose monitor that includes an insulin calculator. This technology is the foundation for our new diabetes product pipeline, which is dedicated to further improving the testing experience for patients.
FreeStyle InsuLinx Tecnis IOL
Glucerna Hunger Smart shake
Abbott 2011 Annual Report
16
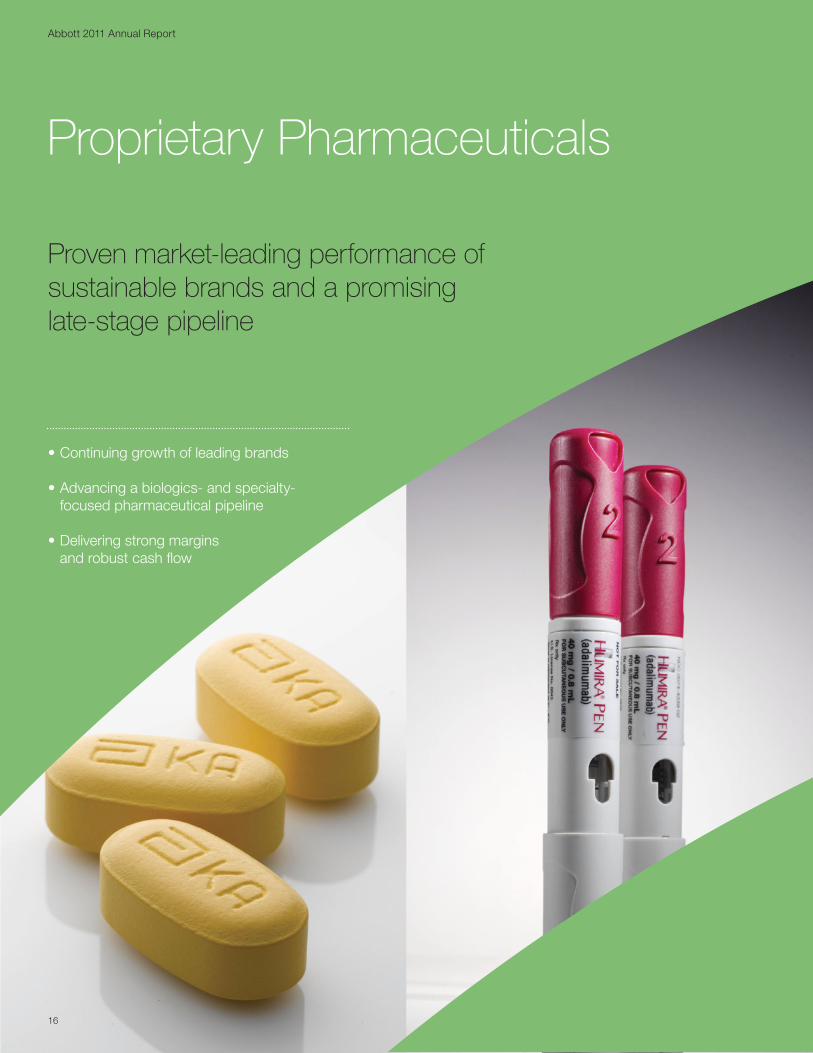
Proprietary Pharmaceuticals
Proven market-leading performance of sustainable brands and a promising late-stage pipeline
• Continuing growth of leading brands
• Advancing a biologics- and specialty- focused pharmaceutical pipeline
• Delivering strong margins and robust cash fl ow
Abbott 2011 Annual Report
17
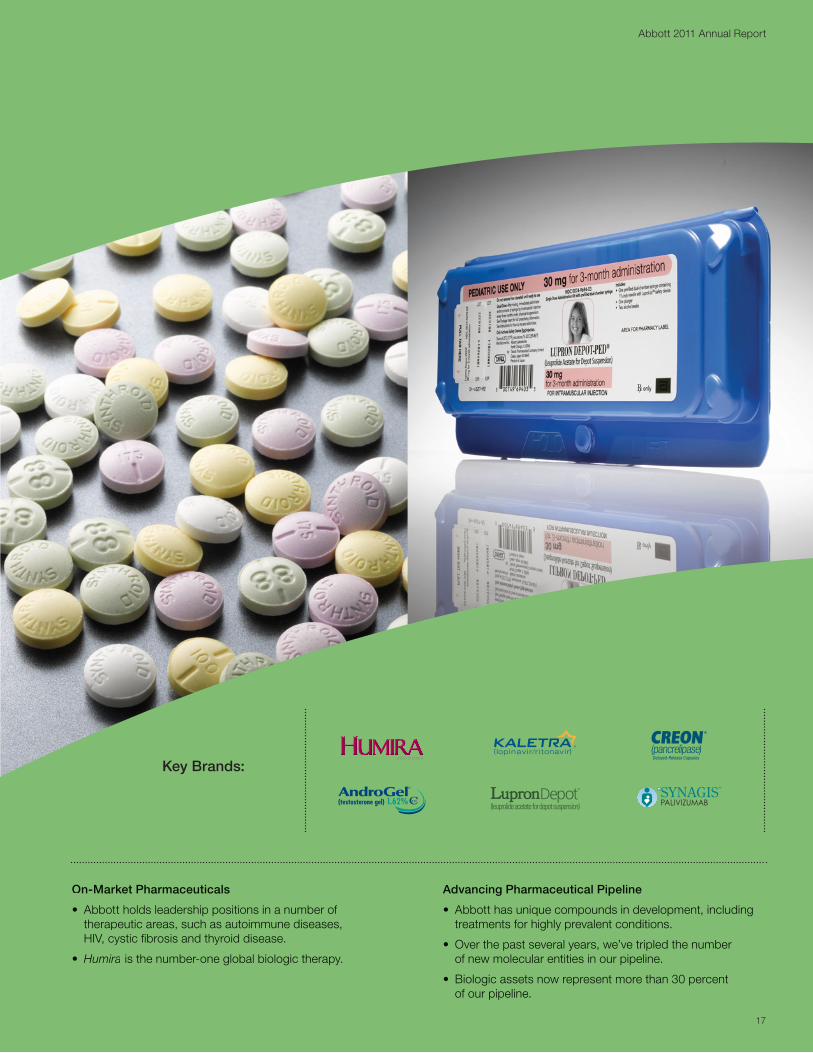
Key Brands:
On-Market Pharmaceuticals
• Abbott holds leadership positions in a number of therapeutic areas, such as autoimmune diseases, HIV, cystic fi brosis and thyroid disease.
• Humira is the number-one global biologic therapy.
Advancing Pharmaceutical Pipeline
• Abbott has unique compounds in development, including treatments for highly prevalent conditions.
• Over the past several years, we’ve tripled the number of new molecular entities in our pipeline.
• Biologic assets now represent more than 30 percent of our pipeline.
Abbott 2011 Annual Report
18
With a diverse portfolio of leading pharmaceutical brands supported by an innovative pipeline, Abbott is addressing some of the world’s most important areas of medical need.
Proprietary Pharmaceuticals
Abbott’s pharmaceutical business has a portfolio of proprietary products that includes dozens of medicines to treat prevalent conditions such as autoimmune diseases, HIV, prostate cancer, Parkinson’s disease and many others. Our on-market portfolio, composed of primarily specialty care products, provides therapy to millions of patients worldwide.
Autoimmune diseases develop when underlying defects in the immune system lead the body to attack its own organs, tissues and cells. These 80 chronic illnesses occur in nearly every part of the body, from joints to skin to the gastrointestinal tract.
The use of biologics to treat autoimmune diseases continues to grow globally. Our leading biologic therapy, Humira, is approved to treat six autoimmune diseases, including moderate to
severe rheumatoid arthritis, moderate to severe Crohn’s disease and moderate to severe chronic plaque psoriasis. It currently treats approximately 585,000 patients around the world, helping to provide some relief from these chronic conditions. Humira has the potential for strong future growth as it is being studied in six additional indications. We also are working on several product enhancements to improve the patient experience.
Beyond Humira, we have a number of market-leading products in our portfolio, including Kaletra and Norvir, our leading antiviral medicines that redefi ned the HIV treatment landscape; Synthroid, one of the most-widely prescribed products for hypothyroidism; Creon, the leading pancreatic enzyme therapy for exocrine pancreatic insuffi ciency due to cystic fi brosis and several other conditions; AndroGel, a testosterone replacement
therapy for men; Lupron Depot, for the palliative treatment of advanced prostate cancer, endometriosis and central precocious puberty; and Synagis, a product that protects at-risk infants from severe respiratory disease. Our lipid franchise includes Niaspan, TriCor and Trilipix.
Abbott also has a robust pipeline with a number of medicines in development that have the potential to greatly improve patient care and provide future growth. Over the years, Abbott has supplemented its internal pipeline with external partnerships and collaborations. Our continued focus on key therapeutic areas and enhanced R&D productivity is yielding impressive results. Over the past several years, we’ve tripled the number of new molecular entities in our pipeline—and we have more than 20 compounds or indications currently in Phase 2 or Phase 3 development.
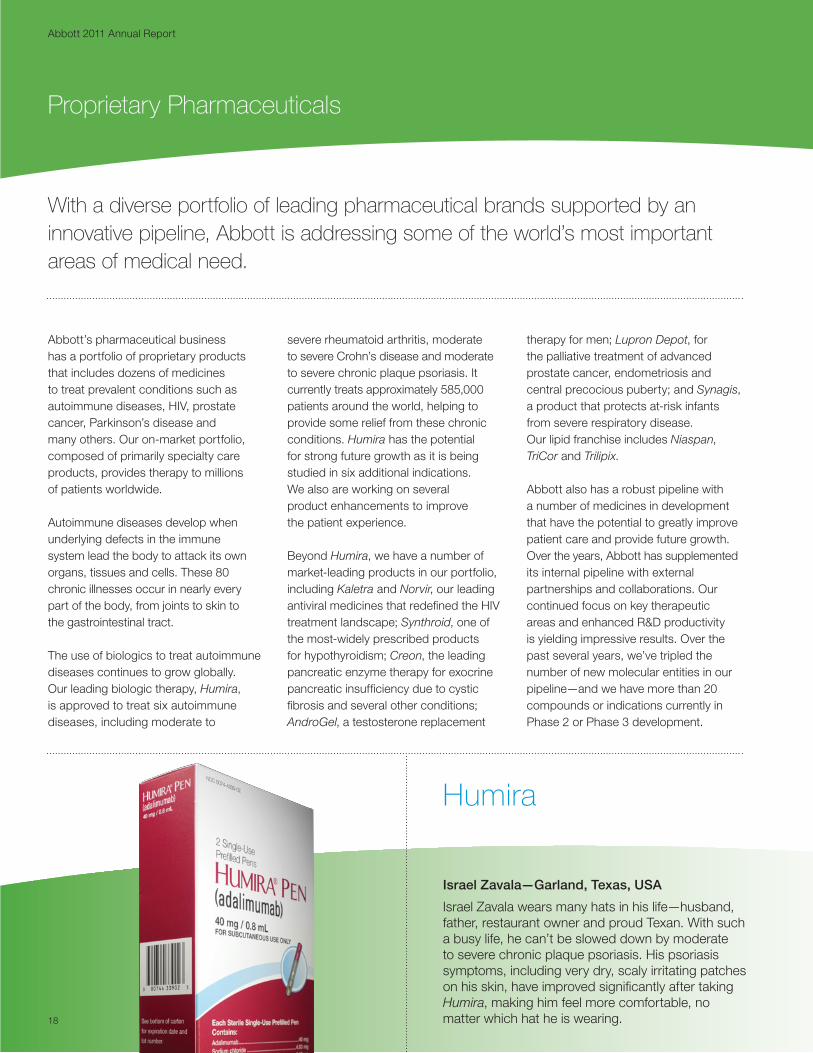
Humira
Israel Zavala—Garland, Texas, USA
Israel Zavala wears many hats in his life—husband, father, restaurant owner and proud Texan. With such a busy life, he can’t be slowed down by moderate to severe chronic plaque psoriasis. His psoriasis symptoms, including very dry, scaly irritating patches on his skin, have improved signifi cantly after taking Humira, making him feel more comfortable, no matter which hat he is wearing.


Abbott 2011 Annual Report
21
Proprietary Pharmaceuticals
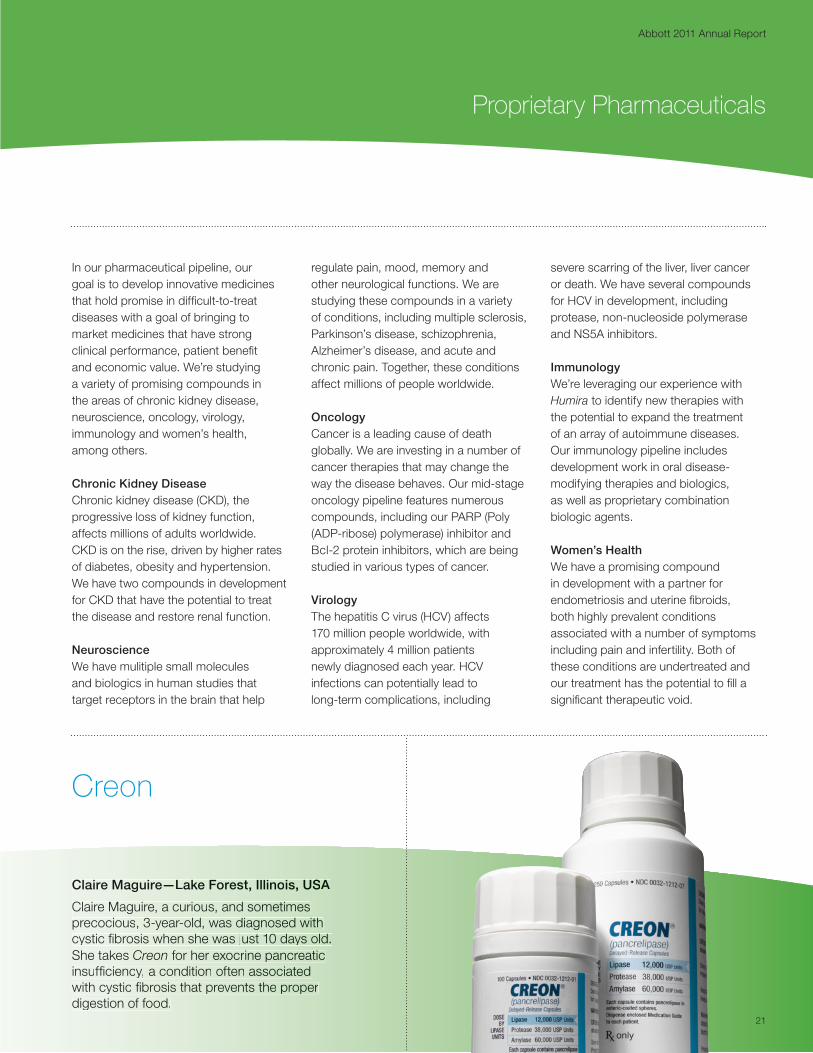
Creon
CClaaire Maaguuire——Lakkee Foresst, Illinnoois, UUSAA
CClaaire Magguire, a curiiouus, andd someetimess ppreecociouss, 3-yeaar-olld,, was ddiagnooseed wwith ccysstic fi broosis whhen sshee was jjust 100 ddays old. SShhe takes CCreon for hheer exocrine paanncreaatic innssuffi cienccyy, a coondittioon oftenn assoociatedd wwitth cysticc fi fibrosiis thaat prevennts thee ppropeer ddiggestion oof food..
In our pharmaceutical pipeline, our goal is to develop innovative medicines that hold promise in diffi cult-to-treat diseases with a goal of bringing to market medicines that have strong clinical performance, patient benefi t and economic value. We’re studying a variety of promising compounds in the areas of chronic kidney disease, neuroscience, oncology, virology, immunology and women’s health, among others.
Chronic Kidney DiseaseChronic kidney disease (CKD), the progressive loss of kidney function,affects millions of adults worldwide. CKD is on the rise, driven by higher ratesof diabetes, obesity and hypertension. We have two compounds in development for CKD that have the potential to treat the disease and restore renal function.
NeuroscienceWe have mulitiple small molecules and biologics in human studies that target receptors in the brain that help
regulate pain, mood, memory and other neurological functions. We are studying these compounds in a variety of conditions, including multiple sclerosis, Parkinson’s disease, schizophrenia, Alzheimer’s disease, and acute and chronic pain. Together, these conditions affect millions of people worldwide.
OncologyCancer is a leading cause of death globally. We are investing in a number of cancer therapies that may change the way the disease behaves. Our mid-stage oncology pipeline features numerous compounds, including our PARP (Poly (ADP-ribose) polymerase) inhibitor and Bcl-2 protein inhibitors, which are being studied in various types of cancer.
VirologyThe hepatitis C virus (HCV) affects 170 million people worldwide, with approximately 4 million patients newly diagnosed each year. HCV infections can potentially lead to long-term complications, including
severe scarring of the liver, liver cancer or death. We have several compounds for HCV in development, including protease, non-nucleoside polymerase and NS5A inhibitors.
Immunology We’re leveraging our experience with Humira to identify new therapies with the potential to expand the treatment of an array of autoimmune diseases. Our immunology pipeline includes development work in oral disease-modifying therapies and biologics, as well as proprietary combination biologic agents.
Women’s HealthWe have a promising compound in development with a partner for endometriosis and uterine fi broids, both highly prevalent conditions associated with a number of symptoms including pain and infertility. Both of these conditions are undertreated and our treatment has the potential to fi ll a signifi cant therapeutic void.
Abbott 2011 Annual Report
22
Pipeline Highlights:
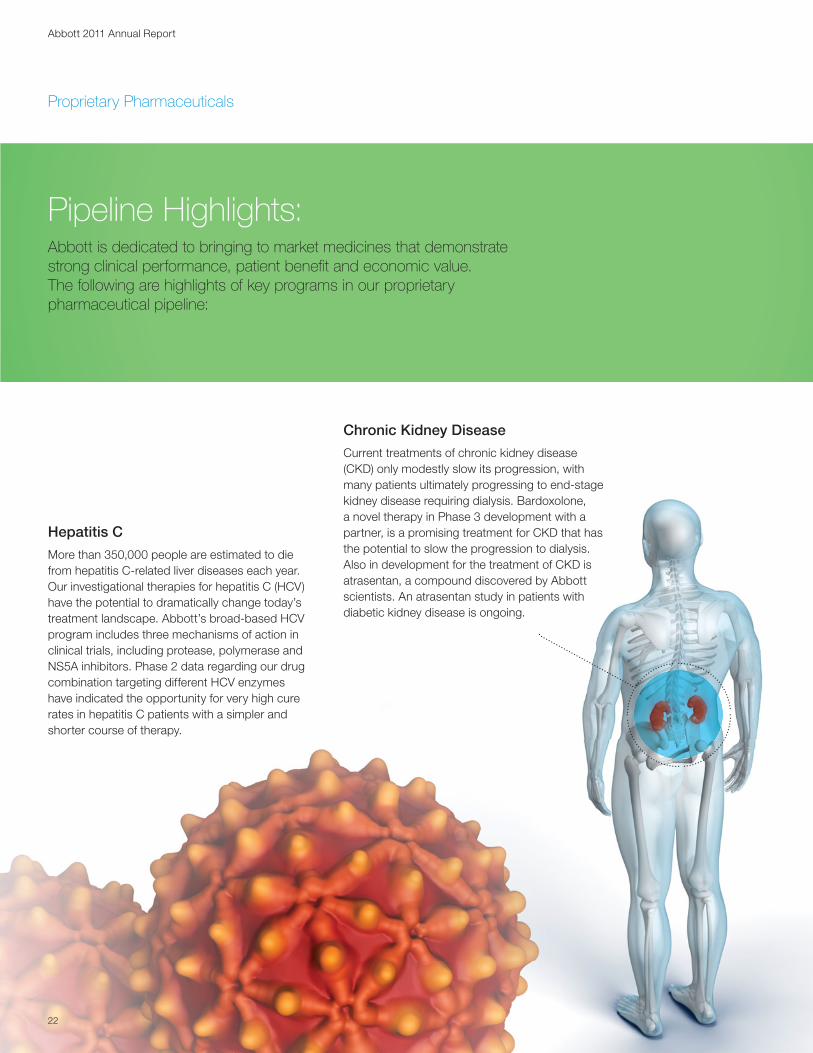
Hepatitis C
More than 350,000 people are estimated to die from hepatitis C-related liver diseases each year. Our investigational therapies for hepatitis C (HCV) have the potential to dramatically change today’s treatment landscape. Abbott’s broad-based HCV program includes three mechanisms of action in clinical trials, including protease, polymerase and NS5A inhibitors. Phase 2 data regarding our drug combination targeting different HCV enzymes have indicated the opportunity for very high cure rates in hepatitis C patients with a simpler and shorter course of therapy.
Abbott is dedicated to bringing to market medicines that demonstrate strong clinical performance, patient benefi t and economic value. The following are highlights of key programs in our proprietary pharmaceutical pipeline:
Chronic Kidney Disease
Current treatments of chronic kidney disease (CKD) only modestly slow its progression, with many patients ultimately progressing to end-stage kidney disease requiring dialysis. Bardoxolone, a novel therapy in Phase 3 development with a partner, is a promising treatment for CKD that has the potential to slow the progression to dialysis. Also in development for the treatment of CKD is atrasentan, a compound discovered by Abbott scientists. An atrasentan study in patients with diabetic kidney disease is ongoing.
Proprietary Pharmaceuticals
Abbott 2011 Annual Report
23
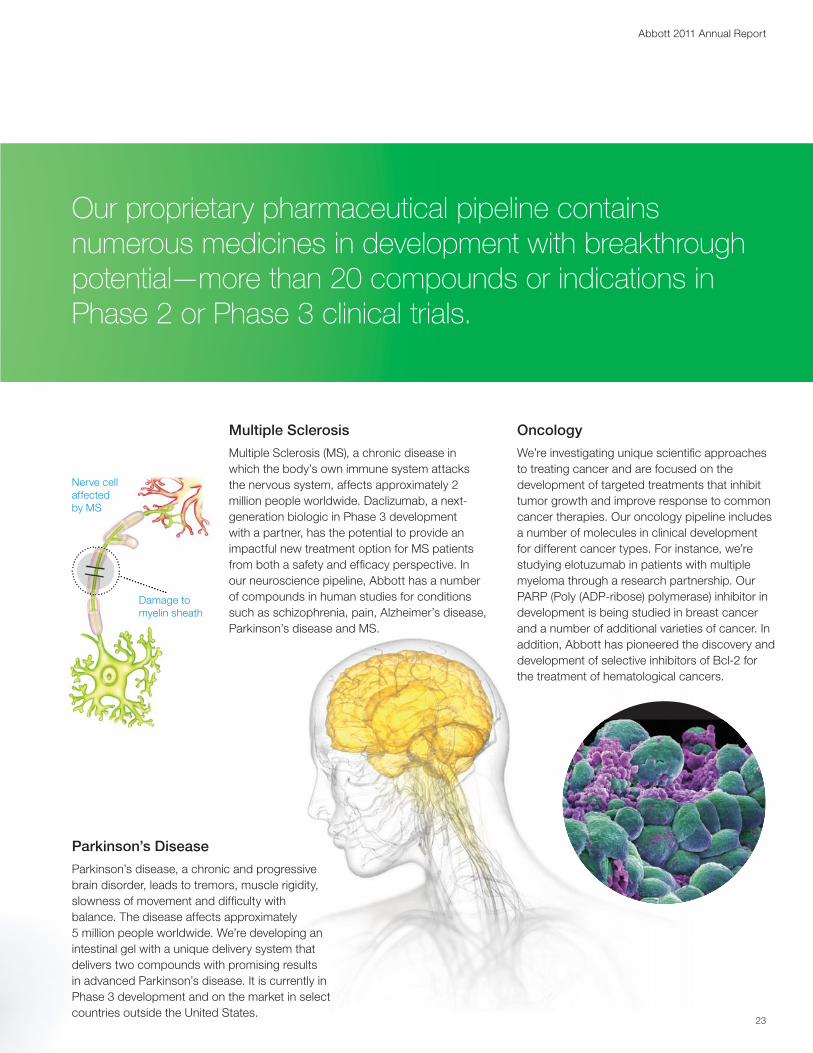
Our proprietary pharmaceutical pipeline contains numerous medicines in development with breakthrough potential—more than 20 compounds or indications in Phase 2 or Phase 3 clinical trials.
Oncology
We’re investigating unique scientifi c approaches to treating cancer and are focused on the development of targeted treatments that inhibit tumor growth and improve response to common cancer therapies. Our oncology pipeline includes a number of molecules in clinical development for different cancer types. For instance, we’re studying elotuzumab in patients with multiple myeloma through a research partnership. Our PARP (Poly (ADP-ribose) polymerase) inhibitor in development is being studied in breast cancer and a number of additional varieties of cancer. In addition, Abbott has pioneered the discovery and development of selective inhibitors of Bcl-2 for the treatment of hematological cancers.
Multiple Sclerosis
Multiple Sclerosis (MS), a chronic disease in which the body’s own immune system attacks the nervous system, affects approximately 2 million people worldwide. Daclizumab, a next-generation biologic in Phase 3 development with a partner, has the potential to provide an impactful new treatment option for MS patients from both a safety and effi cacy perspective. In our neuroscience pipeline, Abbott has a number of compounds in human studies for conditions such as schizophrenia, pain, Alzheimer’s disease, Parkinson’s disease and MS.
Parkinson’s Disease
Parkinson’s disease, a chronic and progressive brain disorder, leads to tremors, muscle rigidity, slowness of movement and diffi culty with balance. The disease affects approximately 5 million people worldwide. We’re developing an intestinal gel with a unique delivery system that delivers two compounds with promising results in advanced Parkinson’s disease. It is currently in Phase 3 development and on the market in select countries outside the United States.
Parkinson’s D
Parkinson’s diseasbrain disorder, leaslowness of movebalance. The dise5 million people wintestinal gel with delivers two compin advanced ParkiPhase 3 developmcountries outside
Damage to myelin sheath
Nerve cell affected by MS

Abbott 2011 Annual Report
24
2011 Financial ReportTable of Contents
25 Consolidated Statement of Earnings
26 Consolidated Statement of Comprehensive Income
27 Consolidated Statement of Cash Flows
28 Consolidated Balance Sheet
30 Consolidated Statement of Shareholders’ Investment
31 Notes to Consolidated Financial Statements
46 Management Report on Internal Control Over Financial Reporting
47 Reports of Independent Registered Public Accounting Firm
48 Financial Instruments and Risk Management
49 Financial Review
62 Performance Graph
63 Summary of Selected Financial Data
2011 Financial Report
Abbott 2011 Annual Report
25
Abbott 2011 Annual Report
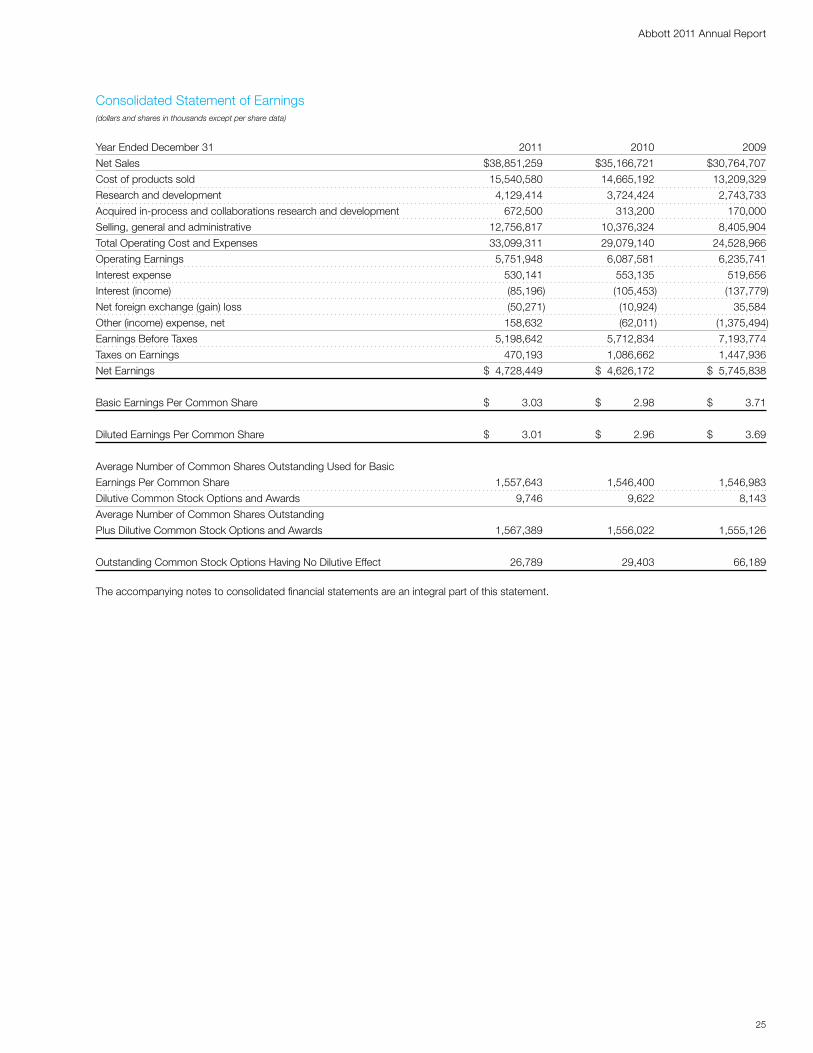
Year Ended December 31 2011 2010 2009
Net Sales $38,851,259 $35,166,721 $30,764,707
Cost of products sold 15,540,580 14,665,192 13,209,329
Research and development 4,129,414 3,724,424 2,743,733
Acquired in‑process and collaborations research and development 672,500 313,200 170,000
Selling, general and administrative 12,756,817 10,376,324 8,405,904
Total Operating Cost and Expenses 33,099,311 29,079,140 24,528,966
Operating Earnings 5,751,948 6,087,581 6,235,741
Interest expense 530,141 553,135 519,656
Interest (income) (85,196) (105,453) (137,779)
Net foreign exchange (gain) loss (50,271) (10,924) 35,584
Other (income) expense, net 158,632 (62,011) (1,375,494)
Earnings Before Taxes 5,198,642 5,712,834 7,193,774
Taxes on Earnings 470,193 1,086,662 1,447,936
Net Earnings $ 4,728,449 $ 4,626,172 $ 5,745,838
Basic Earnings Per Common Share $ 3.03 $ 2.98 $ 3.71
Diluted Earnings Per Common Share $ 3.01 $ 2.96 $ 3.69
Average Number of Common Shares Outstanding Used for Basic
Earnings Per Common Share 1,557,643 1,546,400 1,546,983
Dilutive Common Stock Options and Awards 9,746 9,622 8,143
Average Number of Common Shares Outstanding
Plus Dilutive Common Stock Options and Awards 1,567,389 1,556,022 1,555,126
Outstanding Common Stock Options Having No Dilutive Effect 26,789 29,403 66,189
The accompanying notes to consolidated financial statements are an integral part of this statement.
Consolidated Statement of Earnings(dollars and shares in thousands except per share data)
26
Abbott 2011 Annual Report
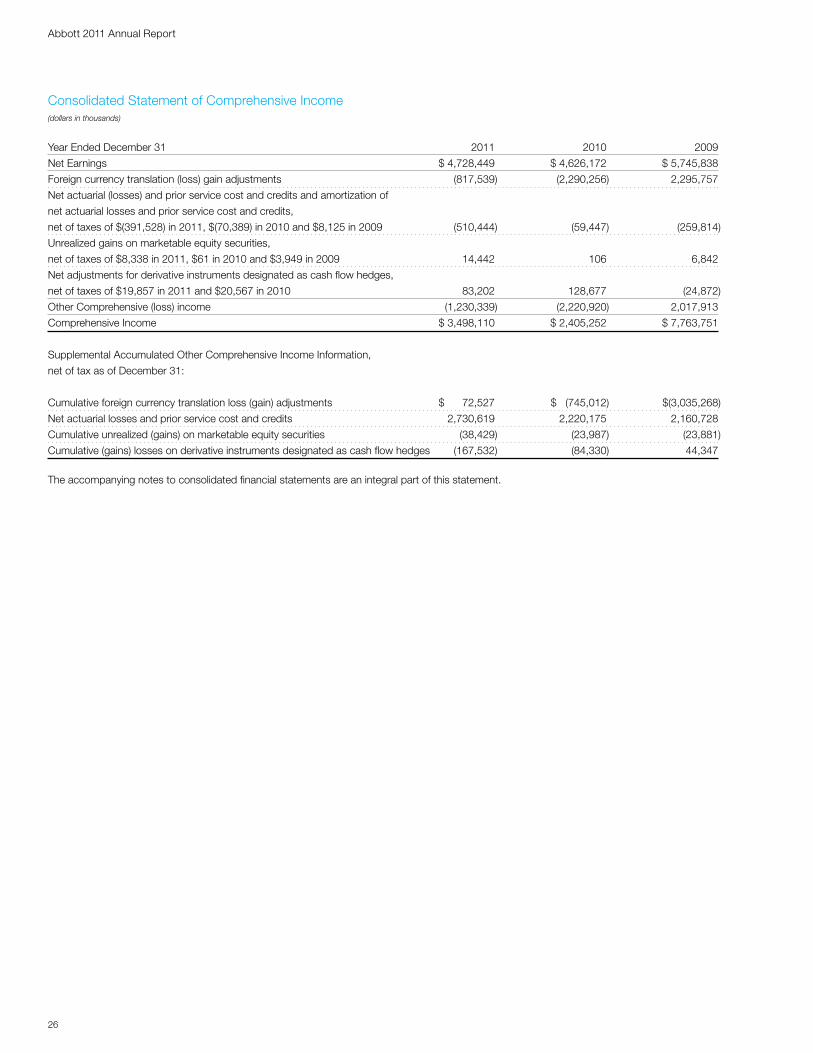
Consolidated Statement of Comprehensive Income(dollars in thousands)
Year Ended December 31 2011 2010 2009
Net Earnings $ 4,728,449 $ 4,626,172 $ 5,745,838
Foreign currency translation (loss) gain adjustments (817,539) (2,290,256) 2,295,757
Net actuarial (losses) and prior service cost and credits and amortization of
net actuarial losses and prior service cost and credits,
net of taxes of $(391,528) in 2011, $(70,389) in 2010 and $8,125 in 2009 (510,444) (59,447) (259,814)
Unrealized gains on marketable equity securities,
net of taxes of $8,338 in 2011, $61 in 2010 and $3,949 in 2009 14,442 106 6,842
Net adjustments for derivative instruments designated as cash flow hedges,
net of taxes of $19,857 in 2011 and $20,567 in 2010 83,202 128,677 (24,872)
Other Comprehensive (loss) income (1,230,339) (2,220,920) 2,017,913
Comprehensive Income $ 3,498,110 $ 2,405,252 $ 7,763,751
Supplemental Accumulated Other Comprehensive Income Information,
net of tax as of December 31:
Cumulative foreign currency translation loss (gain) adjustments $ 72,527 $ (745,012) $(3,035,268)
Net actuarial losses and prior service cost and credits 2,730,619 2,220,175 2,160,728
Cumulative unrealized (gains) on marketable equity securities (38,429) (23,987) (23,881)
Cumulative (gains) losses on derivative instruments designated as cash flow hedges (167,532) (84,330) 44,347
The accompanying notes to consolidated financial statements are an integral part of this statement.
27
Abbott 2011 Annual Report
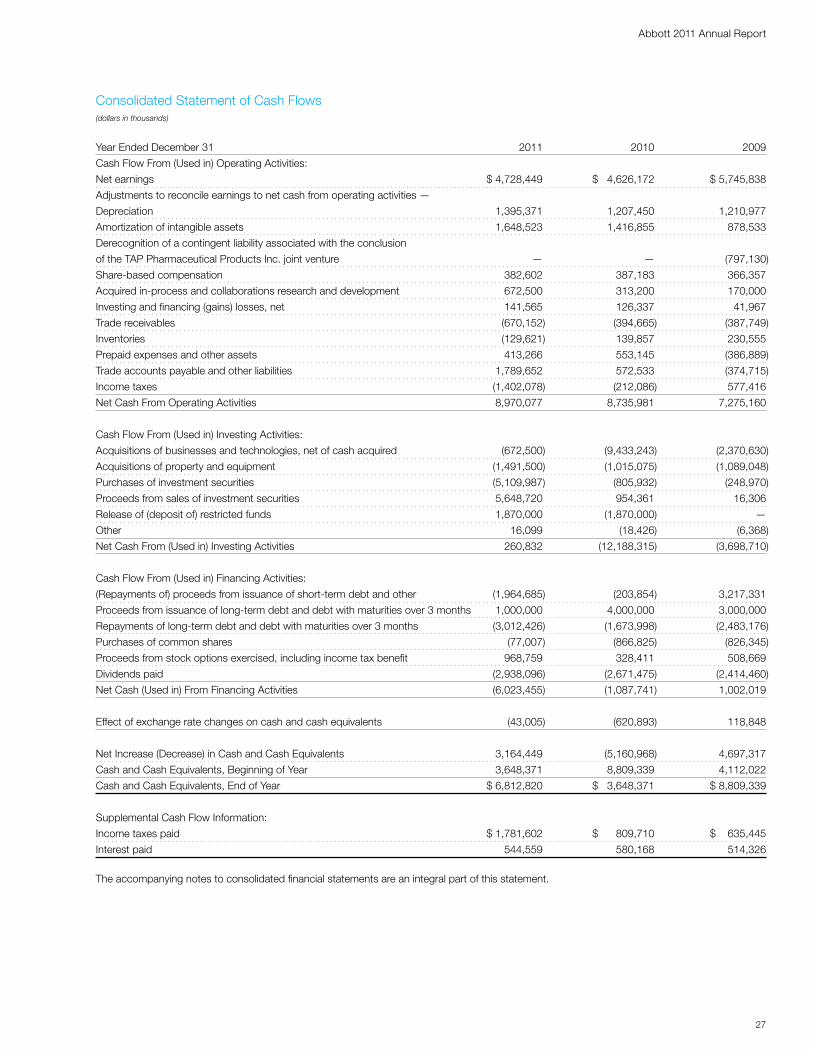
Consolidated Statement of Cash Flows(dollars in thousands)
Year Ended December 31 2011 2010 2009
Cash Flow From (Used in) Operating Activities:
Net earnings $ 4,728,449 $ 4,626,172 $ 5,745,838
Adjustments to reconcile earnings to net cash from operating activities —
Depreciation 1,395,371 1,207,450 1,210,977
Amortization of intangible assets 1,648,523 1,416,855 878,533
Derecognition of a contingent liability associated with the conclusion
of the TAP Pharmaceutical Products Inc. joint venture — — (797,130)
Share‑based compensation 382,602 387,183 366,357
Acquired in‑process and collaborations research and development 672,500 313,200 170,000
Investing and financing (gains) losses, net 141,565 126,337 41,967
Trade receivables (670,152) (394,665) (387,749)
Inventories (129,621) 139,857 230,555
Prepaid expenses and other assets 413,266 553,145 (386,889)
Trade accounts payable and other liabilities 1,789,652 572,533 (374,715)
Income taxes (1,402,078) (212,086) 577,416
Net Cash From Operating Activities 8,970,077 8,735,981 7,275,160
Cash Flow From (Used in) Investing Activities:
Acquisitions of businesses and technologies, net of cash acquired (672,500) (9,433,243) (2,370,630)
Acquisitions of property and equipment (1,491,500) (1,015,075) (1,089,048)
Purchases of investment securities (5,109,987) (805,932) (248,970)
Proceeds from sales of investment securities 5,648,720 954,361 16,306
Release of (deposit of) restricted funds 1,870,000 (1,870,000) —
Other 16,099 (18,426) (6,368)
Net Cash From (Used in) Investing Activities 260,832 (12,188,315) (3,698,710)
Cash Flow From (Used in) Financing Activities:
(Repayments of) proceeds from issuance of short‑term debt and other (1,964,685) (203,854) 3,217,331
Proceeds from issuance of long‑term debt and debt with maturities over 3 months 1,000,000 4,000,000 3,000,000
Repayments of long‑term debt and debt with maturities over 3 months (3,012,426) (1,673,998) (2,483,176)
Purchases of common shares (77,007) (866,825) (826,345)
Proceeds from stock options exercised, including income tax benefit 968,759 328,411 508,669
Dividends paid (2,938,096) (2,671,475) (2,414,460)
Net Cash (Used in) From Financing Activities (6,023,455) (1,087,741) 1,002,019
Effect of exchange rate changes on cash and cash equivalents (43,005) (620,893) 118,848
Net Increase (Decrease) in Cash and Cash Equivalents 3,164,449 (5,160,968) 4,697,317
Cash and Cash Equivalents, Beginning of Year 3,648,371 8,809,339 4,112,022
Cash and Cash Equivalents, End of Year $ 6,812,820 $ 3,648,371 $ 8,809,339
Supplemental Cash Flow Information:
Income taxes paid $ 1,781,602 $ 809,710 $ 635,445
Interest paid 544,559 580,168 514,326
The accompanying notes to consolidated financial statements are an integral part of this statement.
28
Abbott 2011 Annual Report
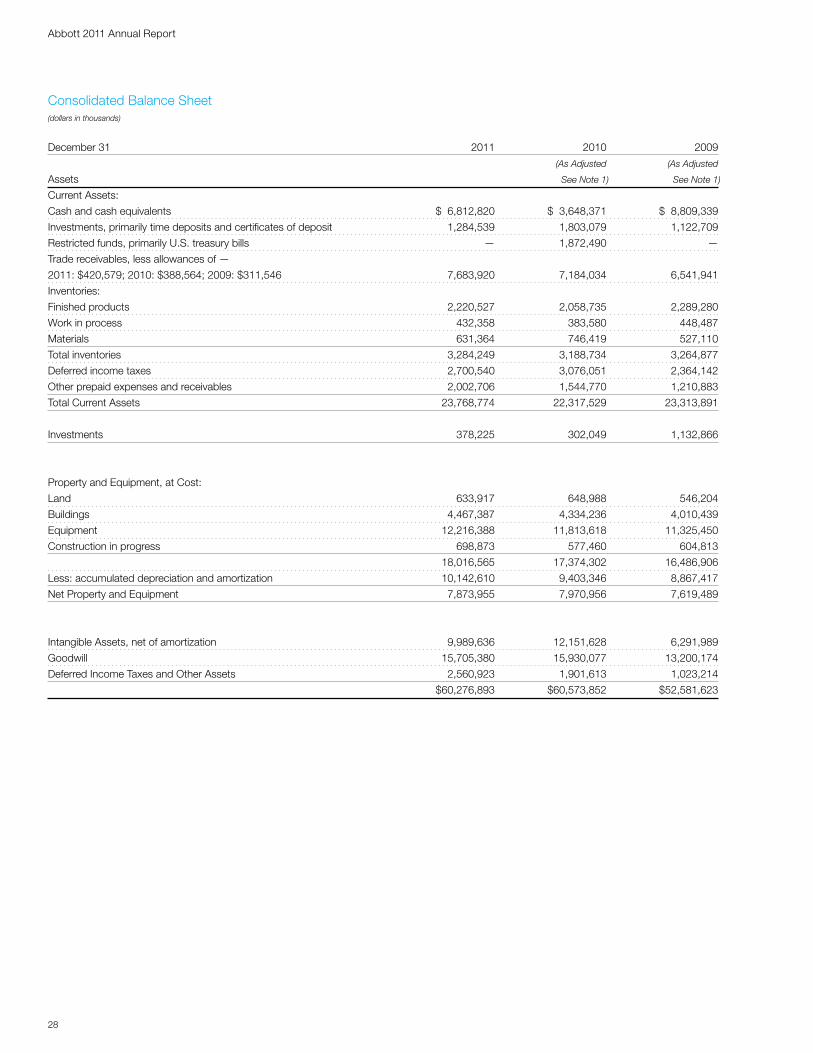
December 31 2011 2010 2009
(As Adjusted (As Adjusted
Assets See Note 1) See Note 1)
Current Assets:
Cash and cash equivalents $ 6,812,820 $ 3,648,371 $ 8,809,339
Investments, primarily time deposits and certificates of deposit 1,284,539 1,803,079 1,122,709
Restricted funds, primarily U.S. treasury bills — 1,872,490 —
Trade receivables, less allowances of —
2011: $420,579; 2010: $388,564; 2009: $311,546 7,683,920 7,184,034 6,541,941
Inventories:
Finished products 2,220,527 2,058,735 2,289,280
Work in process 432,358 383,580 448,487
Materials 631,364 746,419 527,110
Total inventories 3,284,249 3,188,734 3,264,877
Deferred income taxes 2,700,540 3,076,051 2,364,142
Other prepaid expenses and receivables 2,002,706 1,544,770 1,210,883
Total Current Assets 23,768,774 22,317,529 23,313,891
Investments 378,225 302,049 1,132,866
Property and Equipment, at Cost:
Land 633,917 648,988 546,204
Buildings 4,467,387 4,334,236 4,010,439
Equipment 12,216,388 11,813,618 11,325,450
Construction in progress 698,873 577,460 604,813
18,016,565 17,374,302 16,486,906
Less: accumulated depreciation and amortization 10,142,610 9,403,346 8,867,417
Net Property and Equipment 7,873,955 7,970,956 7,619,489
Intangible Assets, net of amortization 9,989,636 12,151,628 6,291,989
Goodwill 15,705,380 15,930,077 13,200,174
Deferred Income Taxes and Other Assets 2,560,923 1,901,613 1,023,214
$60,276,893 $60,573,852 $52,581,623
Consolidated Balance Sheet(dollars in thousands)
29
Abbott 2011 Annual Report
Consolidated Balance Sheet(dollars in thousands)
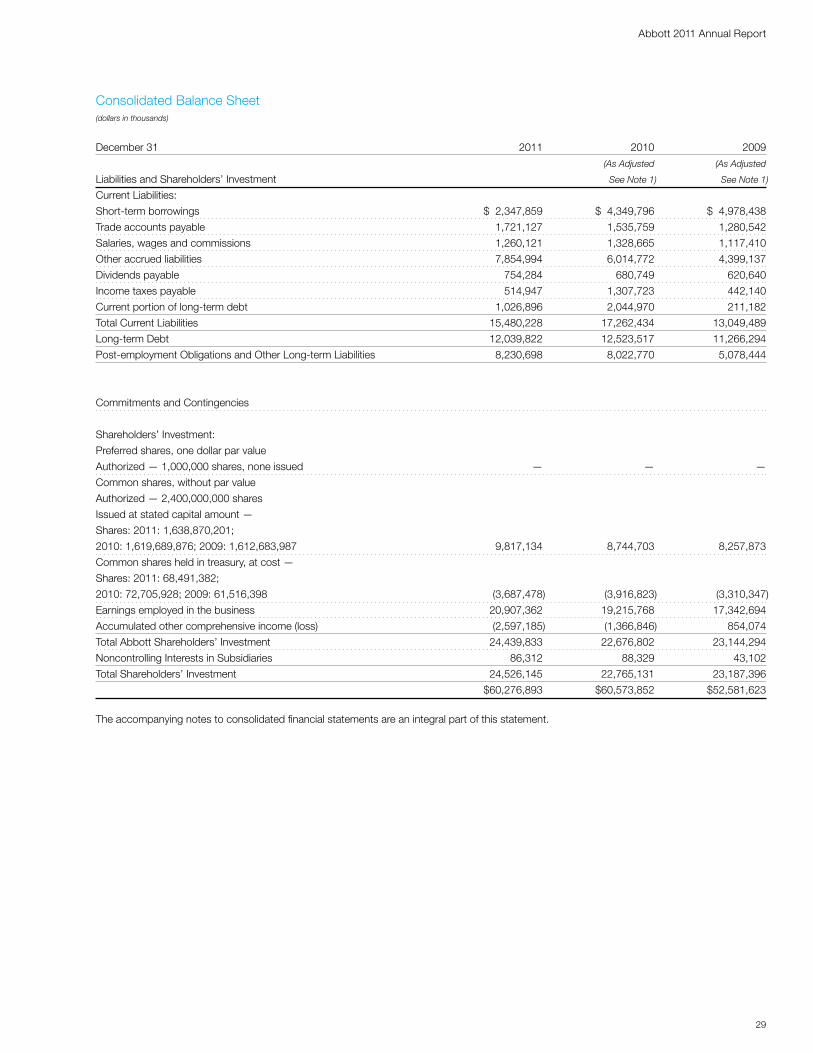
December 31 2011 2010 2009
(As Adjusted (As Adjusted
Liabilities and Shareholders’ Investment See Note 1) See Note 1)
Current Liabilities:
Short‑term borrowings $ 2,347,859 $ 4,349,796 $ 4,978,438
Trade accounts payable 1,721,127 1,535,759 1,280,542
Salaries, wages and commissions 1,260,121 1,328,665 1,117,410
Other accrued liabilities 7,854,994 6,014,772 4,399,137
Dividends payable 754,284 680,749 620,640
Income taxes payable 514,947 1,307,723 442,140
Current portion of long‑term debt 1,026,896 2,044,970 211,182
Total Current Liabilities 15,480,228 17,262,434 13,049,489
Long‑term Debt 12,039,822 12,523,517 11,266,294
Post‑employment Obligations and Other Long‑term Liabilities 8,230,698 8,022,770 5,078,444
Commitments and Contingencies
Shareholders’ Investment:
Preferred shares, one dollar par value
Authorized — 1,000,000 shares, none issued — — —
Common shares, without par value
Authorized — 2,400,000,000 shares
Issued at stated capital amount —
Shares: 2011: 1,638,870,201;
2010: 1,619,689,876; 2009: 1,612,683,987 9,817,134 8,744,703 8,257,873
Common shares held in treasury, at cost —
Shares: 2011: 68,491,382;
2010: 72,705,928; 2009: 61,516,398 (3,687,478) (3,916,823) (3,310,347)
Earnings employed in the business 20,907,362 19,215,768 17,342,694
Accumulated other comprehensive income (loss) (2,597,185) (1,366,846) 854,074
Total Abbott Shareholders’ Investment 24,439,833 22,676,802 23,144,294
Noncontrolling Interests in Subsidiaries 86,312 88,329 43,102
Total Shareholders’ Investment 24,526,145 22,765,131 23,187,396
$60,276,893 $60,573,852 $52,581,623
The accompanying notes to consolidated financial statements are an integral part of this statement.

30
Abbott 2011 Annual Report
Year Ended December 31 2011 2010 2009
(As Adjusted (As Adjusted
See Note 1) See Note 1)
Common Shares:
Beginning of Year
Shares: 2011: 1,619,689,876; 2010: 1,612,683,987; 2009: 1,601,580,899 $ 8,744,703 $ 8,257,873 $ 7,444,411
Issued under incentive stock programs
Shares: 2011: 19,180,325; 2010: 7,005,889; 2009: 11,103,088 954,148 316,071 545,724
Share‑based compensation 382,326 388,493 366,128
Issuance of restricted stock awards (264,043) (217,734) (98,390)
End of Year
Shares: 2011: 1,638,870,201; 2010: 1,619,689,876; 2009: 1,612,683,987 $ 9,817,134 $ 8,744,703 $ 8,257,873
Common Shares Held in Treasury:
Beginning of Year
Shares: 2011: 72,705,928; 2010: 61,516,398; 2009: 49,147,968 $ (3,916,823) $ (3,310,347) $ (2,626,404)
Issued under incentive stock programs
Shares: 2011: 4,638,841; 2010: 4,166,200; 2009: 2,477,853 249,876 224,237 133,042
Purchased
Shares: 2011: 424,295; 2010: 15,355,730; 2009: 14,846,283 (20,531) (830,713) (816,985)
End of Year
Shares: 2011: 68,491,382; 2010: 72,705,928; 2009: 61,516,398 $ (3,687,478) $ (3,916,823) $ (3,310,347)
Earnings Employed in the Business:
Beginning of Year, as adjusted $19,215,768 $17,342,694 $14,114,050
Net earnings 4,728,449 4,626,172 5,745,838
Cash dividends declared on common shares
(per share — 2011: $1.92; 2010: $1.76; 2009: $1.60) (3,011,631) (2,731,584) (2,476,036)
Effect of common and treasury share transactions (25,224) (21,514) (41,158)
End of Year $20,907,362 $19,215,768 $17,342,694
Accumulated Other Comprehensive Income (Loss):
Beginning of Year $ (1,366,846) $ 854,074 $ (1,163,839)
Other comprehensive income (loss) (1,230,339) (2,220,920) 2,017,913
End of Year $ (2,597,185) $ (1,366,846) $ 854,074
Noncontrolling Interests in Subsidiaries:
Beginning of Year $ 88,329 $ 43,102 $ 39,140
Noncontrolling Interests’ share of income,
business combinations, net of distributions and share repurchases (2,017) 45,227 3,962
End of Year $ 86,312 $ 88,329 $ 43,102
The accompanying notes to consolidated financial statements are an integral part of this statement.
Consolidated Statement of Shareholders’ Investment(dollars in thousands except per share data)
31
Abbott 2011 Annual Report
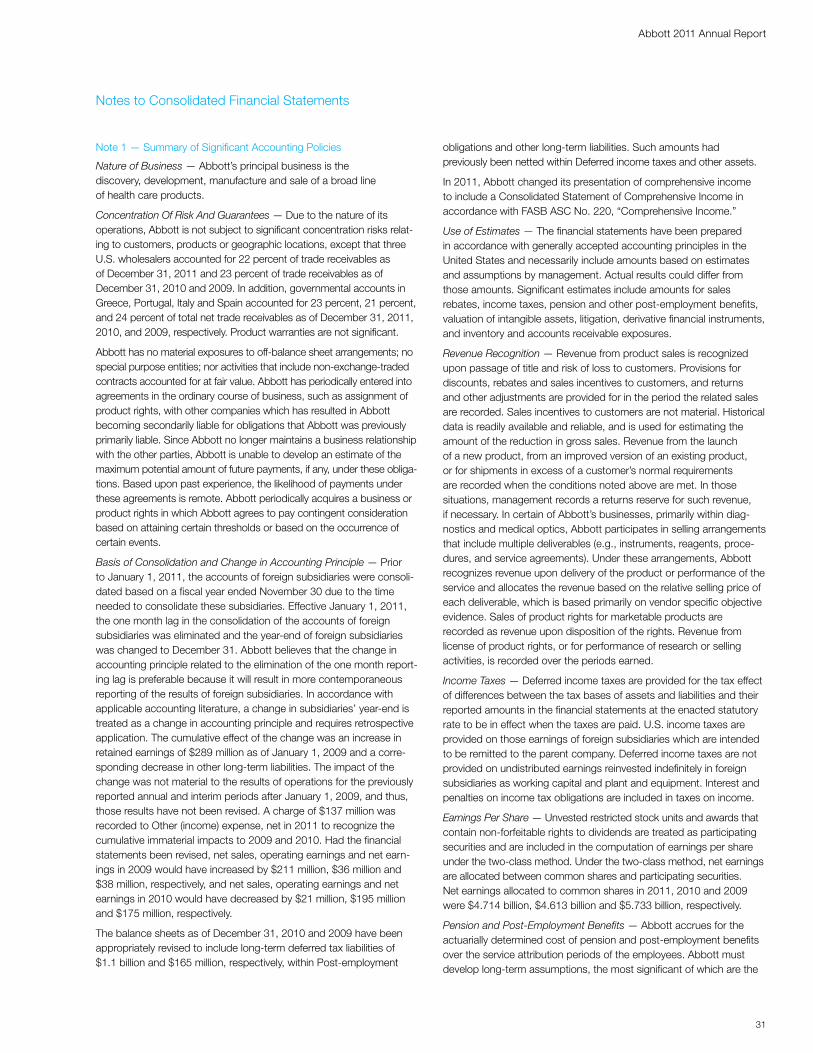
Note 1 — Summary of Significant Accounting Policies
Nature of Business — Abbott’s principal business is the discovery, development, manufacture and sale of a broad line of health care products.
Concentration Of Risk And Guarantees — Due to the nature of its operations, Abbott is not subject to significant concentration risks relat‑ing to customers, products or geographic locations, except that three U.S. wholesalers accounted for 22 percent of trade receivables as of December 31, 2011 and 23 percent of trade receivables as of December 31, 2010 and 2009. In addition, governmental accounts in Greece, Portugal, Italy and Spain accounted for 23 percent, 21 percent, and 24 percent of total net trade receivables as of December 31, 2011, 2010, and 2009, respectively. Product warranties are not significant.
Abbott has no material exposures to off‑balance sheet arrangements; no special purpose entities; nor activities that include non‑exchange‑traded contracts accounted for at fair value. Abbott has periodically entered into agreements in the ordinary course of business, such as assignment of product rights, with other companies which has resulted in Abbott becoming secondarily liable for obligations that Abbott was previously primarily liable. Since Abbott no longer maintains a business relationship with the other parties, Abbott is unable to develop an estimate of the maximum potential amount of future payments, if any, under these obliga‑tions. Based upon past experience, the likelihood of payments under these agreements is remote. Abbott periodically acquires a business or product rights in which Abbott agrees to pay contingent consideration based on attaining certain thresholds or based on the occurrence of certain events.
Basis of Consolidation and Change in Accounting Principle — Prior to January 1, 2011, the accounts of foreign subsidiaries were consoli‑dated based on a fiscal year ended November 30 due to the time needed to consolidate these subsidiaries. Effective January 1, 2011, the one month lag in the consolidation of the accounts of foreign subsidiaries was eliminated and the year‑end of foreign subsidiaries was changed to December 31. Abbott believes that the change in accounting principle related to the elimination of the one month report‑ing lag is preferable because it will result in more contemporaneous reporting of the results of foreign subsidiaries. In accordance with applicable accounting literature, a change in subsidiaries’ year‑end is treated as a change in accounting principle and requires retrospective application. The cumulative effect of the change was an increase in retained earnings of $289 million as of January 1, 2009 and a corre‑sponding decrease in other long‑term liabilities. The impact of the change was not material to the results of operations for the previously reported annual and interim periods after January 1, 2009, and thus, those results have not been revised. A charge of $137 million was recorded to Other (income) expense, net in 2011 to recognize the cumulative immaterial impacts to 2009 and 2010. Had the financial statements been revised, net sales, operating earnings and net earn‑ings in 2009 would have increased by $211 million, $36 million and $38 million, respectively, and net sales, operating earnings and net earnings in 2010 would have decreased by $21 million, $195 million and $175 million, respectively.
The balance sheets as of December 31, 2010 and 2009 have been appropriately revised to include long‑term deferred tax liabilities of $1.1 billion and $165 million, respectively, within Post‑employment
obligations and other long‑term liabilities. Such amounts had previously been netted within Deferred income taxes and other assets.
In 2011, Abbott changed its presentation of comprehensive income to include a Consolidated Statement of Comprehensive Income in accordance with FASB ASC No. 220, “Comprehensive Income.”
Use of Estimates — The financial statements have been prepared in accordance with generally accepted accounting principles in the United States and necessarily include amounts based on estimates and assumptions by management. Actual results could differ from those amounts. Significant estimates include amounts for sales rebates, income taxes, pension and other post‑employment benefits, valuation of intangible assets, litigation, derivative financial instruments, and inventory and accounts receivable exposures.
Revenue Recognition — Revenue from product sales is recognized upon passage of title and risk of loss to customers. Provisions for discounts, rebates and sales incentives to customers, and returns and other adjustments are provided for in the period the related sales are recorded. Sales incentives to customers are not material. Historical data is readily available and reliable, and is used for estimating the amount of the reduction in gross sales. Revenue from the launch of a new product, from an improved version of an existing product, or for shipments in excess of a customer’s normal requirements are recorded when the conditions noted above are met. In those situations, management records a returns reserve for such revenue, if necessary. In certain of Abbott’s businesses, primarily within diag‑nostics and medical optics, Abbott participates in selling arrangements that include multiple deliverables (e.g., instruments, reagents, proce‑dures, and service agreements). Under these arrangements, Abbott recognizes revenue upon delivery of the product or performance of the service and allocates the revenue based on the relative selling price of each deliverable, which is based primarily on vendor specific objective evidence. Sales of product rights for marketable products are recorded as revenue upon disposition of the rights. Revenue from license of product rights, or for performance of research or selling activities, is recorded over the periods earned.
Income Taxes — Deferred income taxes are provided for the tax effect of differences between the tax bases of assets and liabilities and their reported amounts in the financial statements at the enacted statutory rate to be in effect when the taxes are paid. U.S. income taxes are provided on those earnings of foreign subsidiaries which are intended to be remitted to the parent company. Deferred income taxes are not provided on undistributed earnings reinvested indefinitely in foreign subsidiaries as working capital and plant and equipment. Interest and penalties on income tax obligations are included in taxes on income.
Earnings Per Share — Unvested restricted stock units and awards that contain non‑forfeitable rights to dividends are treated as participating securities and are included in the computation of earnings per share under the two‑class method. Under the two‑class method, net earnings are allocated between common shares and participating securities. Net earnings allocated to common shares in 2011, 2010 and 2009 were $4.714 billion, $4.613 billion and $5.733 billion, respectively.
Pension and Post‑Employment Benefits — Abbott accrues for the actuarially determined cost of pension and post‑employment benefits over the service attribution periods of the employees. Abbott must develop long‑term assumptions, the most significant of which are the
Notes to Consolidated Financial Statements
32
Abbott 2011 Annual Report
health care cost trend rates, discount rates and the expected return on plan assets. Differences between the expected long‑term return on plan assets and the actual return are amortized over a five‑year period. Actuarial losses and gains are amortized over the remaining service attribution periods of the employees under the corridor method.
Fair Value Measurements — For assets and liabilities that are measured using quoted prices in active markets, total fair value is the published market price per unit multiplied by the number of units held without consideration of transaction costs. Assets and liabilities that are measured using significant other observable inputs are valued by reference to similar assets or liabilities, adjusted for contract restric‑tions and other terms specific to that asset or liability. For these items, a significant portion of fair value is derived by reference to quoted prices of similar assets or liabilities in active markets. For all remaining assets and liabilities, fair value is derived using a fair value model, such as a discounted cash flow model or Black‑Scholes model. Purchased intangible assets are recorded at fair value. The fair value of significant purchased intangible assets is based on independent appraisals. Abbott uses a discounted cash flow model to value intangible assets. The discounted cash flow model requires assumptions about the timing and amount of future net cash flows, risk, the cost of capital, terminal values and market participants. Intangible assets, goodwill and indefinite‑lived intangible assets are reviewed for impairment at least on a quarterly and annual basis, respectively.
Share‑Based Compensation — The value of stock options and restricted stock awards and units are amortized over their service period, which could be shorter than the vesting period if an employee is retirement eligible, with a charge to compensation expense.
Litigation — Abbott accounts for litigation losses in accordance with FASB ASC No. 450, “Contingencies.” Under ASC No. 450, loss contingency provisions are recorded for probable losses at manage‑ment’s best estimate of a loss, or when a best estimate cannot be made, a minimum loss contingency amount is recorded. Legal fees are recorded as incurred.
Cash, Cash Equivalents and Investments — Cash equivalents consist of time deposits and certificates of deposit with original maturities of three months or less. Investments in marketable equity securities and certain investments in debt securities are classified as available‑for‑sale and are recorded at fair value with any unrealized holding gains or losses, net of tax, included in Accumulated other comprehensive income (loss). Investments in equity securities that are not traded on public stock exchanges are recorded at cost. Investments in other debt securities are classified as held‑to‑maturity, as management has both the intent and ability to hold these securities to maturity, and are reported at cost, net of any unamortized premium or discount. Income relating to these securities is reported as interest income.
Abbott reviews the carrying value of investments each quarter to determine whether an other than temporary decline in market value exists. Abbott considers factors affecting the investee, factors affecting the industry the investee operates in and general equity market trends. Abbott considers the length of time an investment’s market value has been below carrying value and the near‑term prospects for recovery to carrying value. When Abbott determines that an other than temporary decline has occurred, the investment is written down with a charge to Other (income) expense, net.
Trade Receivable Valuations — Accounts receivable are stated at their net realizable value. The allowance against gross trade receivables reflects the best estimate of probable losses inherent in the receivables portfolio determined on the basis of historical experience, specific allowances for known troubled accounts and other currently available information. Accounts receivable are charged off after all reasonable means to collect the full amount (including litigation, where appropriate) have been exhausted.
Inventories — Inventories are stated at the lower of cost (first‑in, first‑out basis) or market. Cost includes material and conversion costs.
Property and Equipment — Depreciation and amortization are provided on a straight‑line basis over the estimated useful lives of the assets. The following table shows estimated useful lives of property and equipment:
Classification Estimated Useful Lives
Buildings 10 to 50 years (average 27 years)
Equipment 3 to 20 years (average 11 years)
Product Liability — Abbott accrues for product liability claims, on an undiscounted basis, when it is probable that a liability has been incurred and the amount of the liability can be reasonably estimated based on existing information. The liabilities are adjusted quarterly as additional information becomes available. Receivables for insurance recoveries for product liability claims are recorded as assets, on an undiscounted basis, when it is probable that a recovery will be real‑ized. Product liability losses are self‑insured.
Research and Development Costs — Internal research and develop‑ment costs are expensed as incurred. Clinical trial costs incurred by third parties are expensed as the contracted work is performed. Where contingent milestone payments are due to third parties under research and development arrangements, the milestone payment obligations are expensed when the milestone results are achieved.
Acquired In‑Process and Collaborations Research and Development (IPR&D) — The initial costs of rights to IPR&D projects obtained in an asset acquisition are expensed as IPR&D unless the project has an alternative future use. These costs include initial payments incurred prior to regulatory approval in connection with research and develop‑ment collaboration agreements that provide rights to develop, manufacture, market and/or sell pharmaceutical products. The fair value of IPR&D projects acquired in a business combination are capi‑talized and accounted for as indefinite‑lived intangible assets.
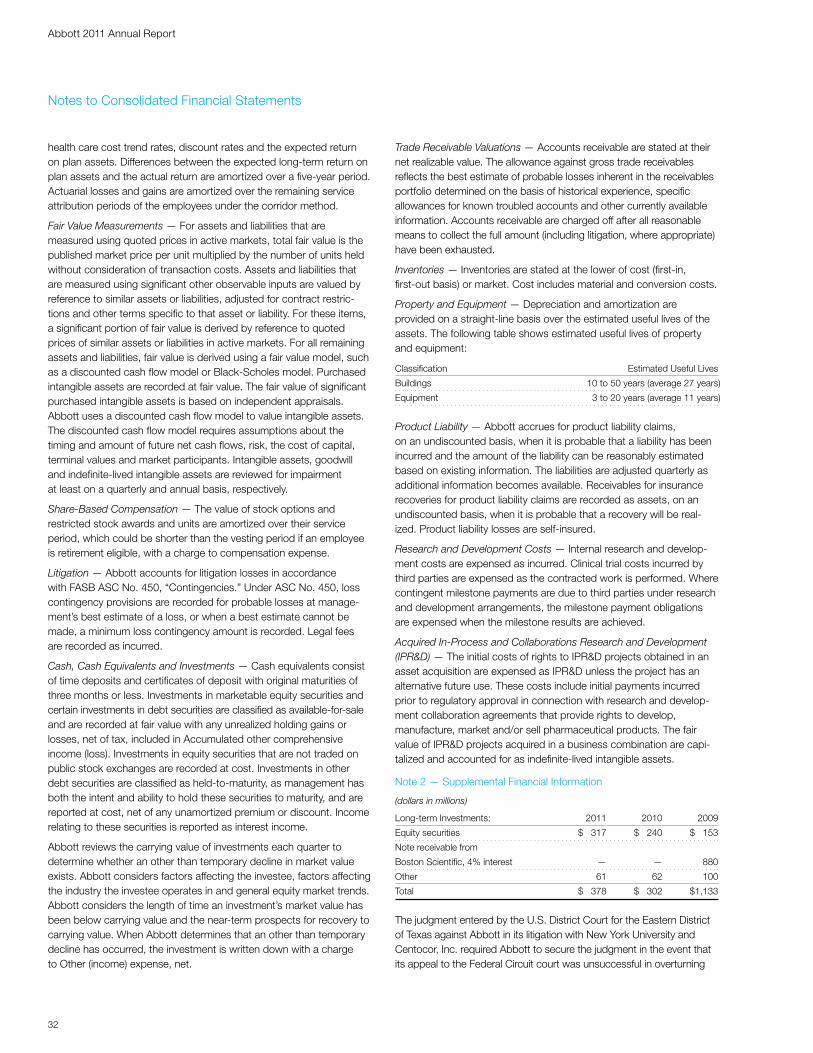
Note 2 — Supplemental Financial Information
(dollars in millions)
Long‑term Investments: 2011 2010 2009
Equity securities $ 317 $ 240 $ 153
Note receivable from
Boston Scientific, 4% interest — — 880
Other 61 62 100
Total $ 378 $ 302 $1,133
The judgment entered by the U.S. District Court for the Eastern District of Texas against Abbott in its litigation with New York University and Centocor, Inc. required Abbott to secure the judgment in the event that its appeal to the Federal Circuit court was unsuccessful in overturning
Notes to Consolidated Financial Statements
33
Abbott 2011 Annual Report
the district court’s decision. In the first quarter of 2010, Abbott depos‑ited $1.87 billion with an escrow agent and considered these assets to be restricted. On February 23, 2011, the Federal Circuit reversed the district court’s final judgment and found Centocor’s patent invalid. On April 25, 2011 Centocor petitioned the Federal Circuit to rehear and reconsider the decision. In June 2011 the Federal Circuit denied Centocor’s petition and the restrictions on the funds were lifted.
As discussed in Note 1, Other (income) expense, net, for 2011 includes a charge of $137 million to recognize the cumulative immate‑rial impacts to 2009 and 2010 relating to the change in year end for foreign subsidiaries. In addition, Other (income) expense, net, for 2011 includes $56 million of fair value adjustments and accretion in the contingent consideration related to the acquisition of Solvay’s pharmaceutical business. Other (income) expense, net, for 2009 includes the derecognition of a contingent liability of $797 million asso‑ciated with the conclusion of the TAP Pharmaceutical Products Inc. joint venture. The contingent liability was established at the conclusion of the joint venture as Abbott agreed to remit cash to Takeda if certain research and development events were not achieved on the development assets retained by Takeda. In 2009, the research and development events were achieved and the contingent liability was derecognized. In addition, Other (income) expense, net for 2009 includes a $287 million gain from the settlement reached between Abbott and Medtronic, Inc. resolving all outstanding intellectual prop‑erty litigation between the two parties and income from the recording of certain investments at fair value in connection with business acquisitions. Other (income) expense, net, for 2011, 2010 and 2009 also includes ongoing contractual payments from Takeda associated with the conclusion of the TAP joint venture.
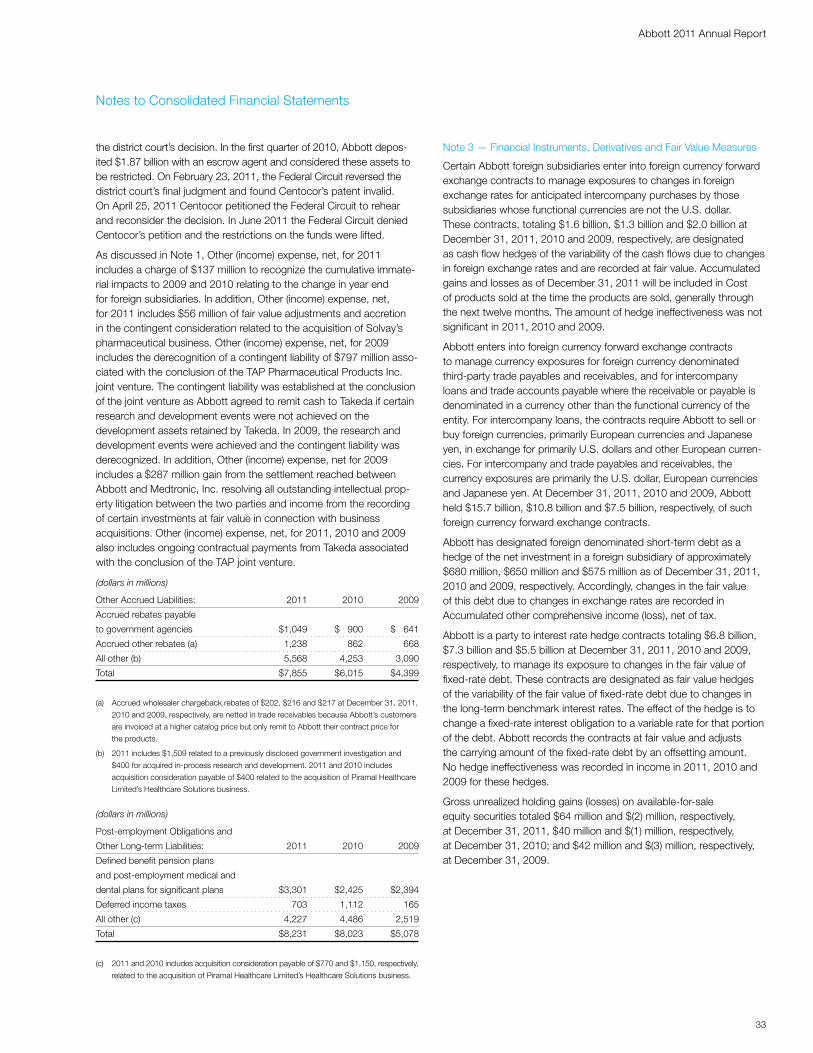
(dollars in millions)
Other Accrued Liabilities: 2011 2010 2009
Accrued rebates payable
to government agencies $1,049 $ 900 $ 641
Accrued other rebates (a) 1,238 862 668
All other (b) 5,568 4,253 3,090
Total $7,855 $6,015 $4,399
(a) Accrued wholesaler chargeback rebates of $202, $216 and $217 at December 31, 2011,
2010 and 2009, respectively, are netted in trade receivables because Abbott’s customers
are invoiced at a higher catalog price but only remit to Abbott their contract price for
the products.
(b) 2011 includes $1,509 related to a previously disclosed government investigation and
$400 for acquired in‑process research and development. 2011 and 2010 includes
acquisition consideration payable of $400 related to the acquisition of Piramal Healthcare
Limited’s Healthcare Solutions business.
(dollars in millions)
Post‑employment Obligations and
Other Long‑term Liabilities: 2011 2010 2009
Defined benefit pension plans
and post‑employment medical and
dental plans for significant plans $3,301 $2,425 $2,394
Deferred income taxes 703 1,112 165
All other (c) 4,227 4,486 2,519
Total $8,231 $8,023 $5,078
(c) 2011 and 2010 includes acquisition consideration payable of $770 and $1,150, respectively,
related to the acquisition of Piramal Healthcare Limited’s Healthcare Solutions business.
Note 3 — Financial Instruments, Derivatives and Fair Value Measures
Certain Abbott foreign subsidiaries enter into foreign currency forward exchange contracts to manage exposures to changes in foreign exchange rates for anticipated intercompany purchases by those subsidiaries whose functional currencies are not the U.S. dollar. These contracts, totaling $1.6 billion, $1.3 billion and $2.0 billion at December 31, 2011, 2010 and 2009, respectively, are designated as cash flow hedges of the variability of the cash flows due to changes in foreign exchange rates and are recorded at fair value. Accumulated gains and losses as of December 31, 2011 will be included in Cost of products sold at the time the products are sold, generally through the next twelve months. The amount of hedge ineffectiveness was not significant in 2011, 2010 and 2009.
Abbott enters into foreign currency forward exchange contracts to manage currency exposures for foreign currency denominated third‑party trade payables and receivables, and for intercompany loans and trade accounts payable where the receivable or payable is denominated in a currency other than the functional currency of the entity. For intercompany loans, the contracts require Abbott to sell or buy foreign currencies, primarily European currencies and Japanese yen, in exchange for primarily U.S. dollars and other European curren‑cies. For intercompany and trade payables and receivables, the currency exposures are primarily the U.S. dollar, European currencies and Japanese yen. At December 31, 2011, 2010 and 2009, Abbott held $15.7 billion, $10.8 billion and $7.5 billion, respectively, of such foreign currency forward exchange contracts.
Abbott has designated foreign denominated short‑term debt as a hedge of the net investment in a foreign subsidiary of approximately $680 million, $650 million and $575 million as of December 31, 2011, 2010 and 2009, respectively. Accordingly, changes in the fair value of this debt due to changes in exchange rates are recorded in Accumulated other comprehensive income (loss), net of tax.
Abbott is a party to interest rate hedge contracts totaling $6.8 billion, $7.3 billion and $5.5 billion at December 31, 2011, 2010 and 2009, respectively, to manage its exposure to changes in the fair value of fixed‑rate debt. These contracts are designated as fair value hedges of the variability of the fair value of fixed‑rate debt due to changes in the long‑term benchmark interest rates. The effect of the hedge is to change a fixed‑rate interest obligation to a variable rate for that portion of the debt. Abbott records the contracts at fair value and adjusts the carrying amount of the fixed‑rate debt by an offsetting amount. No hedge ineffectiveness was recorded in income in 2011, 2010 and 2009 for these hedges.
Gross unrealized holding gains (losses) on available‑for‑sale equity securities totaled $64 million and $(2) million, respectively, at December 31, 2011, $40 million and $(1) million, respectively, at December 31, 2010; and $42 million and $(3) million, respectively, at December 31, 2009.
Notes to Consolidated Financial Statements
34
Abbott 2011 Annual Report
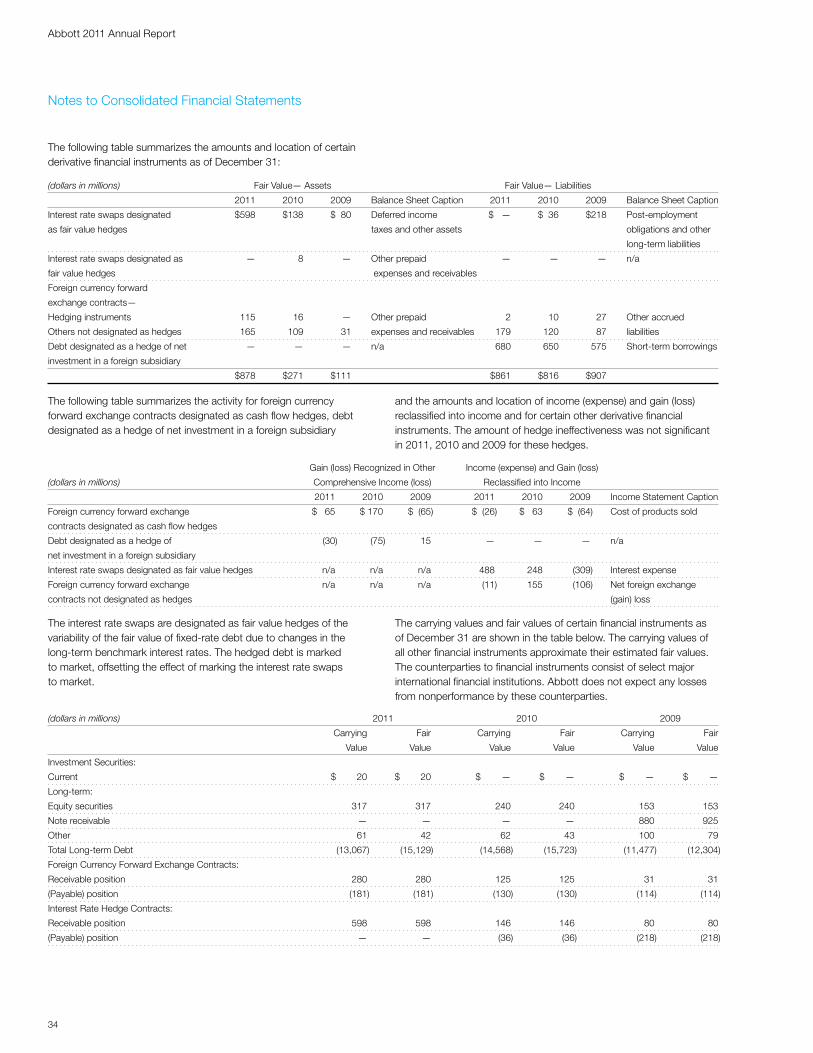
(dollars in millions) Fair Value— Assets Fair Value— Liabilities
2011 2010 2009 Balance Sheet Caption 2011 2010 2009 Balance Sheet Caption
Interest rate swaps designated $598 $138 $ 80 Deferred income $ — $ 36 $218 Post‑employment
as fair value hedges taxes and other assets obligations and other
long‑term liabilities
Interest rate swaps designated as — 8 — Other prepaid — — — n/a
fair value hedges expenses and receivables
Foreign currency forward
exchange contracts—
Hedging instruments 115 16 — Other prepaid 2 10 27 Other accrued
Others not designated as hedges 165 109 31 expenses and receivables 179 120 87 liabilities
Debt designated as a hedge of net — — — n/a 680 650 575 Short‑term borrowings
investment in a foreign subsidiary
$878 $271 $111 $861 $816 $907
Notes to Consolidated Financial Statements
The following table summarizes the amounts and location of certain derivative financial instruments as of December 31:
Gain (loss) Recognized in Other Income (expense) and Gain (loss)
(dollars in millions) Comprehensive Income (loss) Reclassified into Income
2011 2010 2009 2011 2010 2009 Income Statement Caption
Foreign currency forward exchange $ 65 $ 170 $ (65) $ (26) $ 63 $ (64) Cost of products sold
contracts designated as cash flow hedges
Debt designated as a hedge of (30) (75) 15 — — — n/a
net investment in a foreign subsidiary
Interest rate swaps designated as fair value hedges n/a n/a n/a 488 248 (309) Interest expense
Foreign currency forward exchange n/a n/a n/a (11) 155 (106) Net foreign exchange
contracts not designated as hedges (gain) loss
(dollars in millions) 2011 2010 2009
Carrying Fair Carrying Fair Carrying Fair
Value Value Value Value Value Value
Investment Securities:
Current $ 20 $ 20 $ — $ — $ — $ —
Long‑term:
Equity securities 317 317 240 240 153 153
Note receivable — — — — 880 925
Other 61 42 62 43 100 79
Total Long‑term Debt (13,067) (15,129) (14,568) (15,723) (11,477) (12,304)
Foreign Currency Forward Exchange Contracts:
Receivable position 280 280 125 125 31 31
(Payable) position (181) (181) (130) (130) (114) (114)
Interest Rate Hedge Contracts:
Receivable position 598 598 146 146 80 80
(Payable) position — — (36) (36) (218) (218)
The following table summarizes the activity for foreign currency forward exchange contracts designated as cash flow hedges, debt designated as a hedge of net investment in a foreign subsidiary
The interest rate swaps are designated as fair value hedges of the variability of the fair value of fixed‑rate debt due to changes in the long‑term benchmark interest rates. The hedged debt is marked to market, offsetting the effect of marking the interest rate swaps to market.
and the amounts and location of income (expense) and gain (loss) reclassified into income and for certain other derivative financial instruments. The amount of hedge ineffectiveness was not significant in 2011, 2010 and 2009 for these hedges.
The carrying values and fair values of certain financial instruments as of December 31 are shown in the table below. The carrying values of all other financial instruments approximate their estimated fair values. The counterparties to financial instruments consist of select major international financial institutions. Abbott does not expect any losses from nonperformance by these counterparties.
35
Abbott 2011 Annual Report
Notes to Consolidated Financial Statements
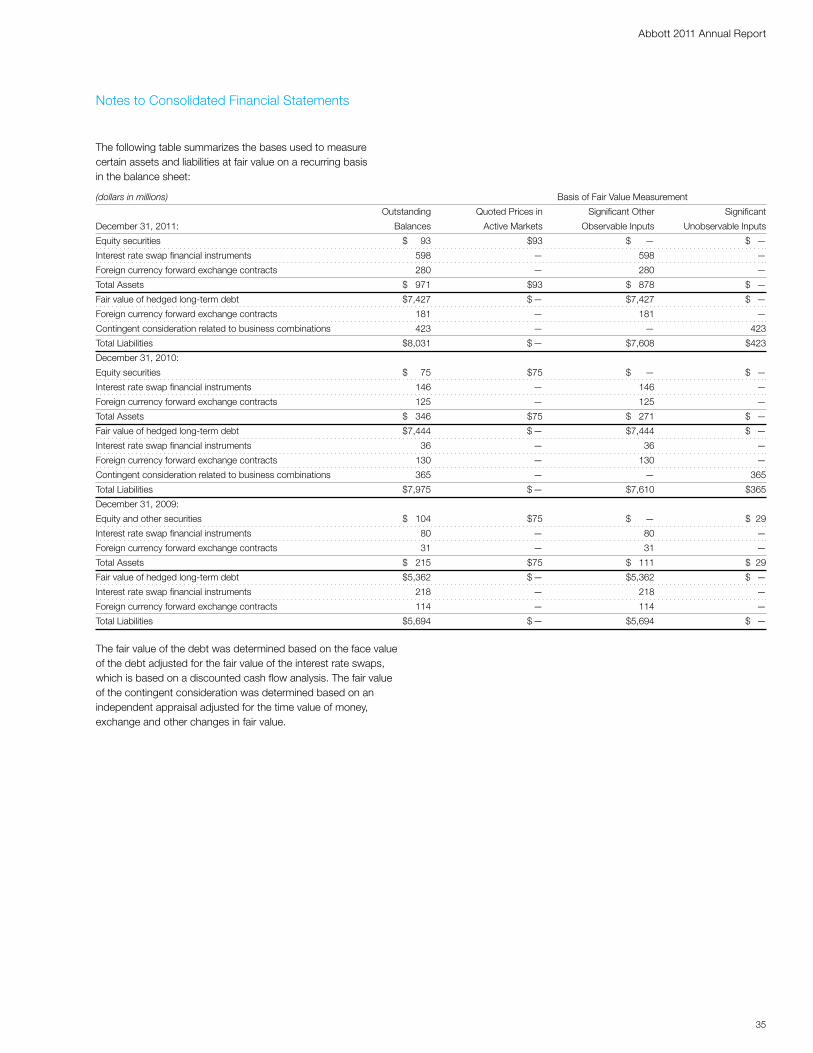
The following table summarizes the bases used to measure certain assets and liabilities at fair value on a recurring basis in the balance sheet:
(dollars in millions) Basis of Fair Value Measurement
Outstanding Quoted Prices in Significant Other Significant
December 31, 2011: Balances Active Markets Observable Inputs Unobservable Inputs
Equity securities $ 93 $93 $ — $ —
Interest rate swap financial instruments 598 — 598 —
Foreign currency forward exchange contracts 280 — 280 —
Total Assets $ 971 $93 $ 878 $ —
Fair value of hedged long‑term debt $7,427 $ — $7,427 $ —
Foreign currency forward exchange contracts 181 — 181 —
Contingent consideration related to business combinations 423 — — 423
Total Liabilities $8,031 $ — $7,608 $423
December 31, 2010:
Equity securities $ 75 $75 $ — $ —
Interest rate swap financial instruments 146 — 146 —
Foreign currency forward exchange contracts 125 — 125 —
Total Assets $ 346 $75 $ 271 $ —
Fair value of hedged long‑term debt $7,444 $ — $7,444 $ —
Interest rate swap financial instruments 36 — 36 —
Foreign currency forward exchange contracts 130 — 130 —
Contingent consideration related to business combinations 365 — — 365
Total Liabilities $7,975 $ — $7,610 $365
December 31, 2009:
Equity and other securities $ 104 $75 $ — $ 29
Interest rate swap financial instruments 80 — 80 —
Foreign currency forward exchange contracts 31 — 31 —
Total Assets $ 215 $75 $ 111 $ 29
Fair value of hedged long‑term debt $5,362 $ — $5,362 $ —
Interest rate swap financial instruments 218 — 218 —
Foreign currency forward exchange contracts 114 — 114 —
Total Liabilities $5,694 $ — $5,694 $ —
The fair value of the debt was determined based on the face value of the debt adjusted for the fair value of the interest rate swaps, which is based on a discounted cash flow analysis. The fair value of the contingent consideration was determined based on an independent appraisal adjusted for the time value of money, exchange and other changes in fair value.
36
Abbott 2011 Annual Report
Notes to Consolidated Financial Statements
(dollars in millions) Defined Benefit Plans Medical and Dental Plans
2011 2010 2009 2011 2010 2009
Service cost — benefits earned during the year $ 332 $ 288 $ 221 $ 55 $ 60 $ 45
Interest cost on projected benefit obligations 446 421 368 88 101 94
Expected return on plans’ assets (608) (571) (506) (34) (31) (24)
Settlement 40 — — — — —
Amortization of actuarial losses 163 136 52 38 38 30
Amortization of prior service cost (credits) 4 4 4 (42) (22) (22)
Total cost $ 377 $ 278 $ 139 $105 $146 $123
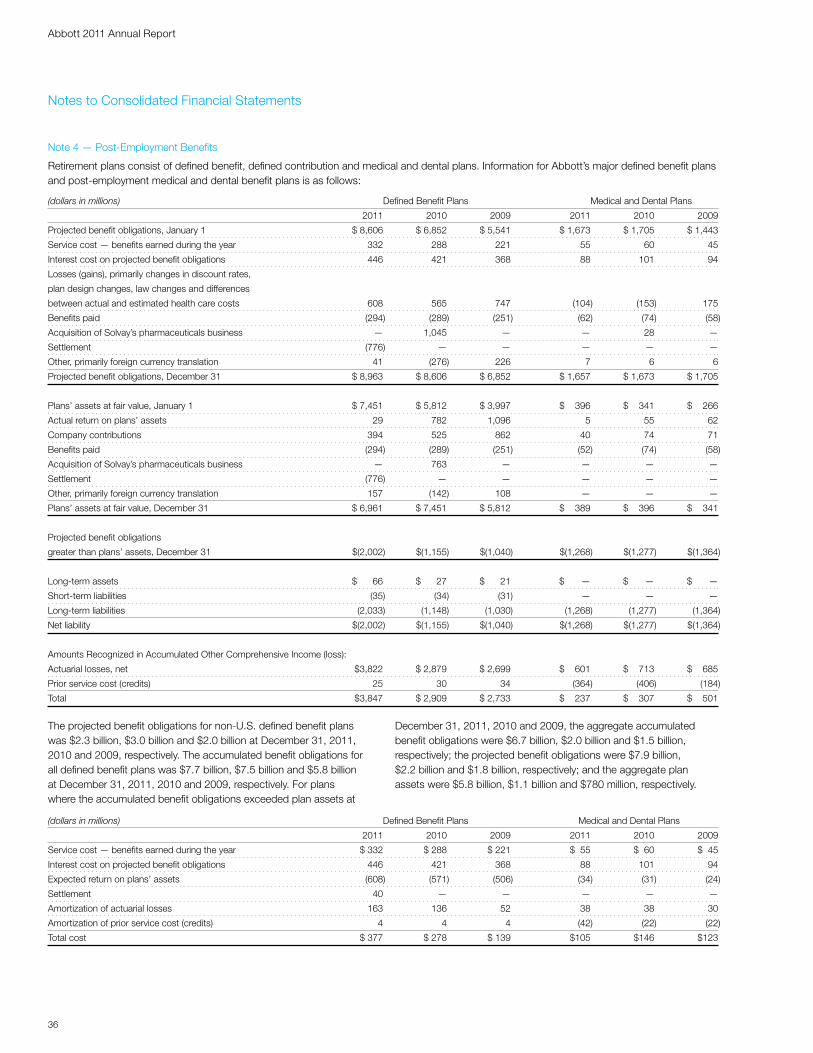
Note 4 — Post‑Employment Benefits
Retirement plans consist of defined benefit, defined contribution and medical and dental plans. Information for Abbott’s major defined benefit plans and post‑employment medical and dental benefit plans is as follows:
(dollars in millions) Defined Benefit Plans Medical and Dental Plans
2011 2010 2009 2011 2010 2009
Projected benefit obligations, January 1 $ 8,606 $ 6,852 $ 5,541 $ 1,673 $ 1,705 $ 1,443
Service cost — benefits earned during the year 332 288 221 55 60 45
Interest cost on projected benefit obligations 446 421 368 88 101 94
Losses (gains), primarily changes in discount rates,
plan design changes, law changes and differences
between actual and estimated health care costs 608 565 747 (104) (153) 175
Benefits paid (294) (289) (251) (62) (74) (58)
Acquisition of Solvay’s pharmaceuticals business — 1,045 — — 28 —
Settlement (776) — — — — —
Other, primarily foreign currency translation 41 (276) 226 7 6 6
Projected benefit obligations, December 31 $ 8,963 $ 8,606 $ 6,852 $ 1,657 $ 1,673 $ 1,705
Plans’ assets at fair value, January 1 $ 7,451 $ 5,812 $ 3,997 $ 396 $ 341 $ 266
Actual return on plans’ assets 29 782 1,096 5 55 62
Company contributions 394 525 862 40 74 71
Benefits paid (294) (289) (251) (52) (74) (58)
Acquisition of Solvay’s pharmaceuticals business — 763 — — — —
Settlement (776) — — — — —
Other, primarily foreign currency translation 157 (142) 108 — — —
Plans’ assets at fair value, December 31 $ 6,961 $ 7,451 $ 5,812 $ 389 $ 396 $ 341
Projected benefit obligations
greater than plans’ assets, December 31 $(2,002) $(1,155) $(1,040) $(1,268) $(1,277) $(1,364)
Long‑term assets $ 66 $ 27 $ 21 $ — $ — $ —
Short‑term liabilities (35) (34) (31) — — —
Long‑term liabilities (2,033) (1,148) (1,030) (1,268) (1,277) (1,364)
Net liability $(2,002) $(1,155) $(1,040) $(1,268) $(1,277) $(1,364)
Amounts Recognized in Accumulated Other Comprehensive Income (loss):
Actuarial losses, net $3,822 $ 2,879 $ 2,699 $ 601 $ 713 $ 685
Prior service cost (credits) 25 30 34 (364) (406) (184)
Total $3,847 $ 2,909 $ 2,733 $ 237 $ 307 $ 501
The projected benefit obligations for non‑U.S. defined benefit plans was $2.3 billion, $3.0 billion and $2.0 billion at December 31, 2011, 2010 and 2009, respectively. The accumulated benefit obligations for all defined benefit plans was $7.7 billion, $7.5 billion and $5.8 billion at December 31, 2011, 2010 and 2009, respectively. For plans where the accumulated benefit obligations exceeded plan assets at
December 31, 2011, 2010 and 2009, the aggregate accumulated benefit obligations were $6.7 billion, $2.0 billion and $1.5 billion, respectively; the projected benefit obligations were $7.9 billion, $2.2 billion and $1.8 billion, respectively; and the aggregate plan assets were $5.8 billion, $1.1 billion and $780 million, respectively.
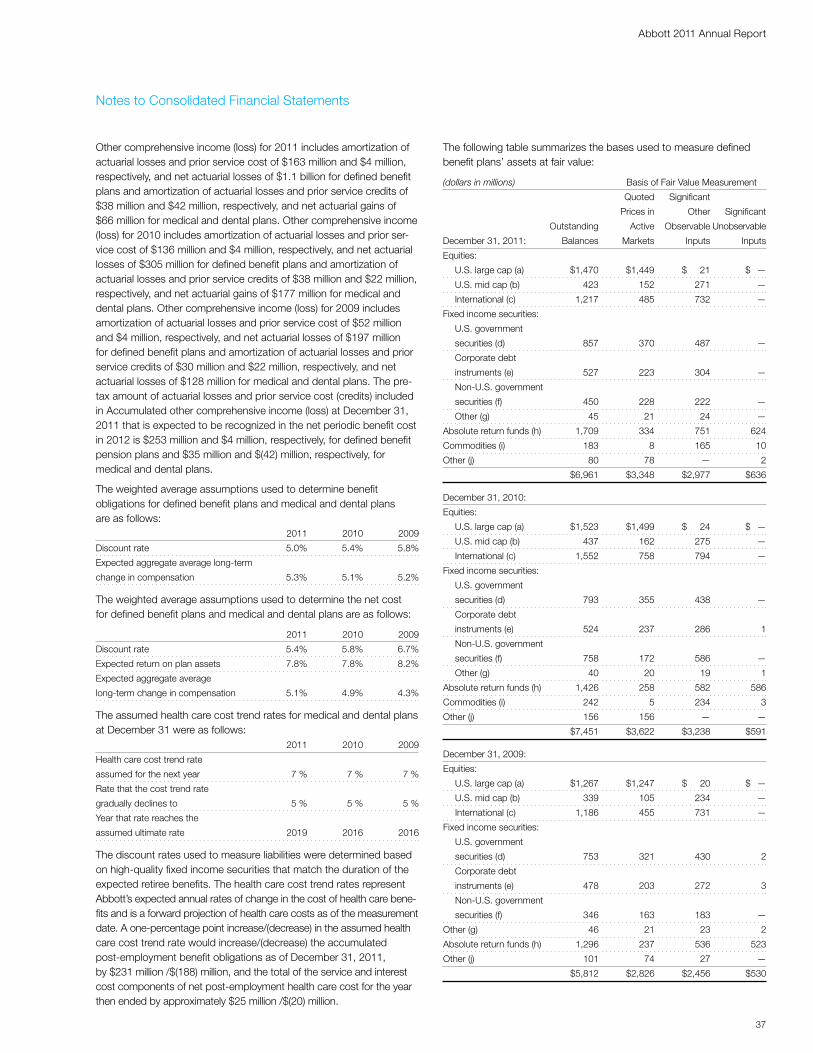
37
Abbott 2011 Annual Report
Notes to Consolidated Financial Statements
Other comprehensive income (loss) for 2011 includes amortization of actuarial losses and prior service cost of $163 million and $4 million, respectively, and net actuarial losses of $1.1 billion for defined benefit plans and amortization of actuarial losses and prior service credits of $38 million and $42 million, respectively, and net actuarial gains of $66 million for medical and dental plans. Other comprehensive income (loss) for 2010 includes amortization of actuarial losses and prior ser‑vice cost of $136 million and $4 million, respectively, and net actuarial losses of $305 million for defined benefit plans and amortization of actuarial losses and prior service credits of $38 million and $22 million, respectively, and net actuarial gains of $177 million for medical and dental plans. Other comprehensive income (loss) for 2009 includes amortization of actuarial losses and prior service cost of $52 million and $4 million, respectively, and net actuarial losses of $197 million for defined benefit plans and amortization of actuarial losses and prior service credits of $30 million and $22 million, respectively, and net actuarial losses of $128 million for medical and dental plans. The pre‑tax amount of actuarial losses and prior service cost (credits) included in Accumulated other comprehensive income (loss) at December 31, 2011 that is expected to be recognized in the net periodic benefit cost in 2012 is $253 million and $4 million, respectively, for defined benefit pension plans and $35 million and $(42) million, respectively, for medical and dental plans.
The weighted average assumptions used to determine benefit obligations for defined benefit plans and medical and dental plans are as follows: 2011 2010 2009
Discount rate 5.0% 5.4% 5.8%
Expected aggregate average long‑term
change in compensation 5.3% 5.1% 5.2%
The weighted average assumptions used to determine the net cost for defined benefit plans and medical and dental plans are as follows:
2011 2010 2009
Discount rate 5.4% 5.8% 6.7%
Expected return on plan assets 7.8% 7.8% 8.2%
Expected aggregate average
long‑term change in compensation 5.1% 4.9% 4.3%
The assumed health care cost trend rates for medical and dental plans at December 31 were as follows: 2011 2010 2009
Health care cost trend rate
assumed for the next year 7 % 7 % 7 %
Rate that the cost trend rate
gradually declines to 5 % 5 % 5 %
Year that rate reaches the
assumed ultimate rate 2019 2016 2016
The discount rates used to measure liabilities were determined based on high‑quality fixed income securities that match the duration of the expected retiree benefits. The health care cost trend rates represent Abbott’s expected annual rates of change in the cost of health care bene‑fits and is a forward projection of health care costs as of the measurement date. A one‑percentage point increase/(decrease) in the assumed health care cost trend rate would increase/(decrease) the accumulated post‑employment benefit obligations as of December 31, 2011, by $231 million /$(188) million, and the total of the service and interest cost components of net post‑employment health care cost for the year then ended by approximately $25 million /$(20) million.
The following table summarizes the bases used to measure defined benefit plans’ assets at fair value:
(dollars in millions) Basis of Fair Value Measurement
Quoted Significant
Prices in Other Significant
Outstanding Active Observable Unobservable
December 31, 2011: Balances Markets Inputs Inputs
Equities:
U.S. large cap (a) $1,470 $1,449 $ 21 $ —
U.S. mid cap (b) 423 152 271 —
International (c) 1,217 485 732 —
Fixed income securities:
U.S. government
securities (d) 857 370 487 —
Corporate debt
instruments (e) 527 223 304 —
Non‑U.S. government
securities (f) 450 228 222 —
Other (g) 45 21 24 —
Absolute return funds (h) 1,709 334 751 624
Commodities (i) 183 8 165 10
Other (j) 80 78 — 2
$6,961 $3,348 $2,977 $636
December 31, 2010:
Equities:
U.S. large cap (a) $1,523 $1,499 $ 24 $ —
U.S. mid cap (b) 437 162 275 —
International (c) 1,552 758 794 —
Fixed income securities:
U.S. government
securities (d) 793 355 438 —
Corporate debt
instruments (e) 524 237 286 1
Non‑U.S. government
securities (f) 758 172 586 —
Other (g) 40 20 19 1
Absolute return funds (h) 1,426 258 582 586
Commodities (i) 242 5 234 3
Other (j) 156 156 — —
$7,451 $3,622 $3,238 $591
December 31, 2009:
Equities:
U.S. large cap (a) $1,267 $1,247 $ 20 $ —
U.S. mid cap (b) 339 105 234 —
International (c) 1,186 455 731 —
Fixed income securities:
U.S. government
securities (d) 753 321 430 2
Corporate debt
instruments (e) 478 203 272 3
Non‑U.S. government
securities (f) 346 163 183 —
Other (g) 46 21 23 2
Absolute return funds (h) 1,296 237 536 523
Other (j) 101 74 27 —
$5,812 $2,826 $2,456 $530
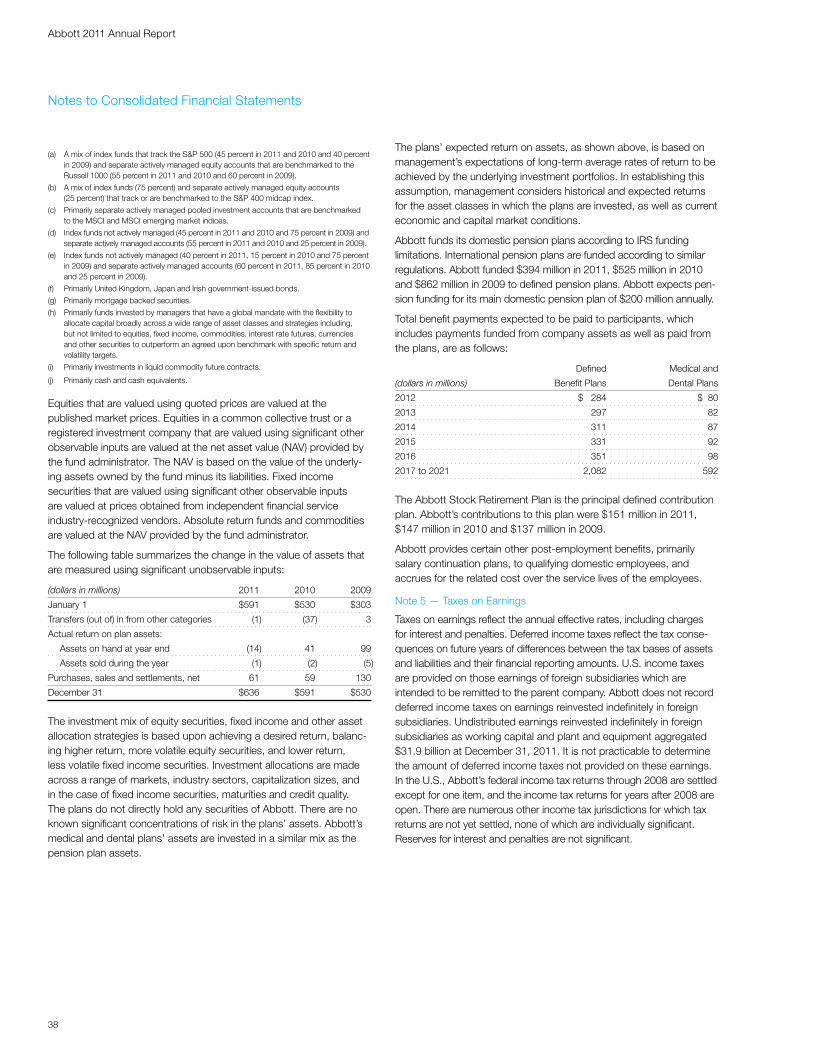
38
Abbott 2011 Annual Report
Notes to Consolidated Financial Statements
(a) A mix of index funds that track the S&P 500 (45 percent in 2011 and 2010 and 40 percent in 2009) and separate actively managed equity accounts that are benchmarked to the Russell 1000 (55 percent in 2011 and 2010 and 60 percent in 2009).
(b) A mix of index funds (75 percent) and separate actively managed equity accounts (25 percent) that track or are benchmarked to the S&P 400 midcap index.
(c) Primarily separate actively managed pooled investment accounts that are benchmarked to the MSCI and MSCI emerging market indices.
(d) Index funds not actively managed (45 percent in 2011 and 2010 and 75 percent in 2009) and separate actively managed accounts (55 percent in 2011 and 2010 and 25 percent in 2009).
(e) Index funds not actively managed (40 percent in 2011, 15 percent in 2010 and 75 percent in 2009) and separate actively managed accounts (60 percent in 2011, 85 percent in 2010 and 25 percent in 2009).
(f) Primarily United Kingdom, Japan and Irish government‑issued bonds.
(g) Primarily mortgage backed securities.
(h) Primarily funds invested by managers that have a global mandate with the flexibility to allocate capital broadly across a wide range of asset classes and strategies including, but not limited to equities, fixed income, commodities, interest rate futures, currencies and other securities to outperform an agreed upon benchmark with specific return and volatility targets.
(i) Primarily investments in liquid commodity future contracts.
(j) Primarily cash and cash equivalents.
Equities that are valued using quoted prices are valued at the published market prices. Equities in a common collective trust or a registered investment company that are valued using significant other observable inputs are valued at the net asset value (NAV) provided by the fund administrator. The NAV is based on the value of the underly‑ing assets owned by the fund minus its liabilities. Fixed income securities that are valued using significant other observable inputs are valued at prices obtained from independent financial service industry‑recognized vendors. Absolute return funds and commodities are valued at the NAV provided by the fund administrator.
The following table summarizes the change in the value of assets that are measured using significant unobservable inputs:
(dollars in millions) 2011 2010 2009
January 1 $591 $530 $303
Transfers (out of) in from other categories (1) (37) 3
Actual return on plan assets:
Assets on hand at year end (14) 41 99
Assets sold during the year (1) (2) (5)
Purchases, sales and settlements, net 61 59 130
December 31 $636 $591 $530
The investment mix of equity securities, fixed income and other asset allocation strategies is based upon achieving a desired return, balanc‑ing higher return, more volatile equity securities, and lower return, less volatile fixed income securities. Investment allocations are made across a range of markets, industry sectors, capitalization sizes, and in the case of fixed income securities, maturities and credit quality. The plans do not directly hold any securities of Abbott. There are no known significant concentrations of risk in the plans’ assets. Abbott’s medical and dental plans’ assets are invested in a similar mix as the pension plan assets.
The plans’ expected return on assets, as shown above, is based on management’s expectations of long‑term average rates of return to be achieved by the underlying investment portfolios. In establishing this assumption, management considers historical and expected returns for the asset classes in which the plans are invested, as well as current economic and capital market conditions.
Abbott funds its domestic pension plans according to IRS funding limitations. International pension plans are funded according to similar regulations. Abbott funded $394 million in 2011, $525 million in 2010 and $862 million in 2009 to defined pension plans. Abbott expects pen‑sion funding for its main domestic pension plan of $200 million annually.
Total benefit payments expected to be paid to participants, which includes payments funded from company assets as well as paid from the plans, are as follows:
Defined Medical and
(dollars in millions) Benefit Plans Dental Plans
2012 $ 284 $ 80
2013 297 82
2014 311 87
2015 331 92
2016 351 98
2017 to 2021 2,082 592
The Abbott Stock Retirement Plan is the principal defined contribution plan. Abbott’s contributions to this plan were $151 million in 2011, $147 million in 2010 and $137 million in 2009.
Abbott provides certain other post‑employment benefits, primarily salary continuation plans, to qualifying domestic employees, and accrues for the related cost over the service lives of the employees.
Note 5 — Taxes on Earnings
Taxes on earnings reflect the annual effective rates, including charges for interest and penalties. Deferred income taxes reflect the tax conse‑quences on future years of differences between the tax bases of assets and liabilities and their financial reporting amounts. U.S. income taxes are provided on those earnings of foreign subsidiaries which are intended to be remitted to the parent company. Abbott does not record deferred income taxes on earnings reinvested indefinitely in foreign subsidiaries. Undistributed earnings reinvested indefinitely in foreign subsidiaries as working capital and plant and equipment aggregated $31.9 billion at December 31, 2011. It is not practicable to determine the amount of deferred income taxes not provided on these earnings. In the U.S., Abbott’s federal income tax returns through 2008 are settled except for one item, and the income tax returns for years after 2008 are open. There are numerous other income tax jurisdictions for which tax returns are not yet settled, none of which are individually significant. Reserves for interest and penalties are not significant.
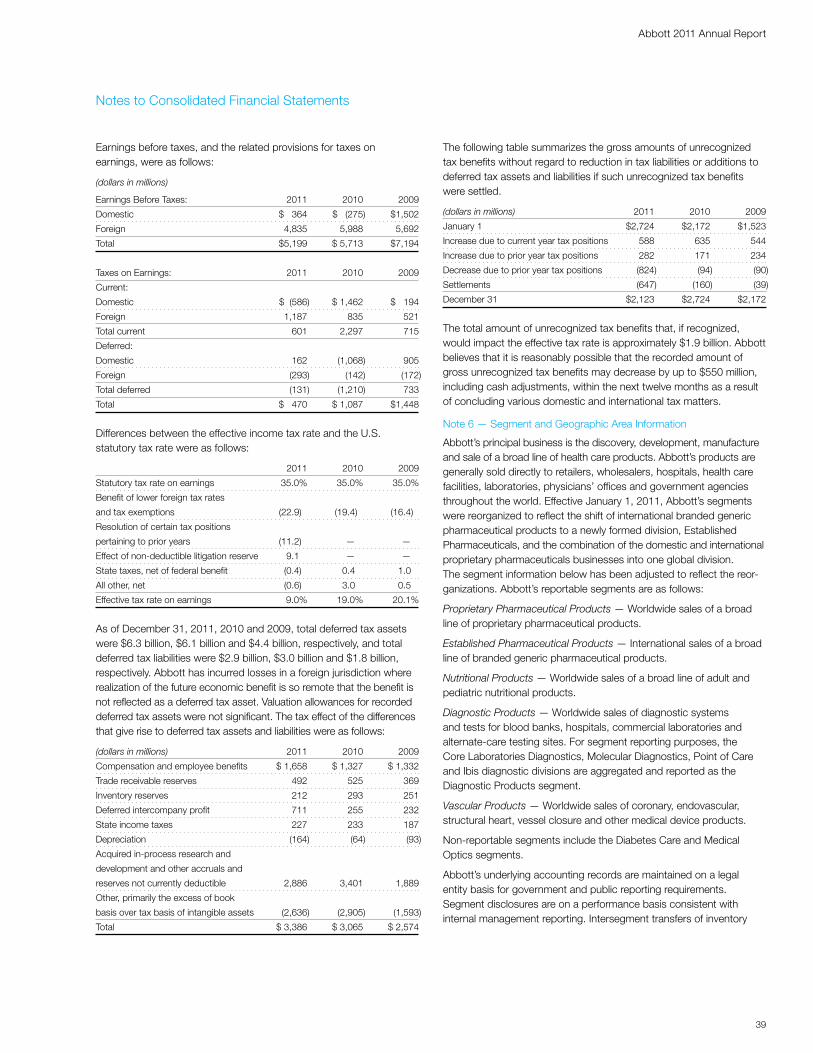
39
Abbott 2011 Annual Report
Notes to Consolidated Financial Statements
Earnings before taxes, and the related provisions for taxes on earnings, were as follows:
(dollars in millions)
Earnings Before Taxes: 2011 2010 2009
Domestic $ 364 $ (275) $1,502
Foreign 4,835 5,988 5,692
Total $5,199 $ 5,713 $7,194
Taxes on Earnings: 2011 2010 2009
Current:
Domestic $ (586) $ 1,462 $ 194
Foreign 1,187 835 521
Total current 601 2,297 715
Deferred:
Domestic 162 (1,068) 905
Foreign (293) (142) (172)
Total deferred (131) (1,210) 733
Total $ 470 $ 1,087 $1,448
Differences between the effective income tax rate and the U.S. statutory tax rate were as follows:
2011 2010 2009
Statutory tax rate on earnings 35.0% 35.0% 35.0%
Benefit of lower foreign tax rates
and tax exemptions (22.9) (19.4) (16.4)
Resolution of certain tax positions
pertaining to prior years (11.2) — —
Effect of non‑deductible litigation reserve 9.1 — —
State taxes, net of federal benefit (0.4) 0.4 1.0
All other, net (0.6) 3.0 0.5
Effective tax rate on earnings 9.0% 19.0% 20.1%
As of December 31, 2011, 2010 and 2009, total deferred tax assets were $6.3 billion, $6.1 billion and $4.4 billion, respectively, and total deferred tax liabilities were $2.9 billion, $3.0 billion and $1.8 billion, respectively. Abbott has incurred losses in a foreign jurisdiction where realization of the future economic benefit is so remote that the benefit is not reflected as a deferred tax asset. Valuation allowances for recorded deferred tax assets were not significant. The tax effect of the differences that give rise to deferred tax assets and liabilities were as follows:
(dollars in millions) 2011 2010 2009
Compensation and employee benefits $ 1,658 $ 1,327 $ 1,332
Trade receivable reserves 492 525 369
Inventory reserves 212 293 251
Deferred intercompany profit 711 255 232
State income taxes 227 233 187
Depreciation (164) (64) (93)
Acquired in‑process research and
development and other accruals and
reserves not currently deductible 2,886 3,401 1,889
Other, primarily the excess of book
basis over tax basis of intangible assets (2,636) (2,905) (1,593)
Total $ 3,386 $ 3,065 $ 2,574
The following table summarizes the gross amounts of unrecognized tax benefits without regard to reduction in tax liabilities or additions to deferred tax assets and liabilities if such unrecognized tax benefits were settled.
(dollars in millions) 2011 2010 2009
January 1 $2,724 $2,172 $1,523
Increase due to current year tax positions 588 635 544
Increase due to prior year tax positions 282 171 234
Decrease due to prior year tax positions (824) (94) (90)
Settlements (647) (160) (39)
December 31 $2,123 $2,724 $2,172
The total amount of unrecognized tax benefits that, if recognized, would impact the effective tax rate is approximately $1.9 billion. Abbott believes that it is reasonably possible that the recorded amount of gross unrecognized tax benefits may decrease by up to $550 million, including cash adjustments, within the next twelve months as a result of concluding various domestic and international tax matters.
Note 6 — Segment and Geographic Area Information
Abbott’s principal business is the discovery, development, manufacture and sale of a broad line of health care products. Abbott’s products are generally sold directly to retailers, wholesalers, hospitals, health care facilities, laboratories, physicians’ offices and government agencies throughout the world. Effective January 1, 2011, Abbott’s segments were reorganized to reflect the shift of international branded generic pharmaceutical products to a newly formed division, Established Pharmaceuticals, and the combination of the domestic and international proprietary pharmaceuticals businesses into one global division. The segment information below has been adjusted to reflect the reor‑ganizations. Abbott’s reportable segments are as follows:
Proprietary Pharmaceutical Products — Worldwide sales of a broad line of proprietary pharmaceutical products.
Established Pharmaceutical Products — International sales of a broad line of branded generic pharmaceutical products.
Nutritional Products — Worldwide sales of a broad line of adult and pediatric nutritional products.
Diagnostic Products — Worldwide sales of diagnostic systems and tests for blood banks, hospitals, commercial laboratories and alternate‑care testing sites. For segment reporting purposes, the Core Laboratories Diagnostics, Molecular Diagnostics, Point of Care and Ibis diagnostic divisions are aggregated and reported as the Diagnostic Products segment.
Vascular Products — Worldwide sales of coronary, endovascular, structural heart, vessel closure and other medical device products.
Non‑reportable segments include the Diabetes Care and Medical Optics segments.
Abbott’s underlying accounting records are maintained on a legal entity basis for government and public reporting requirements. Segment disclosures are on a performance basis consistent with internal management reporting. Intersegment transfers of inventory
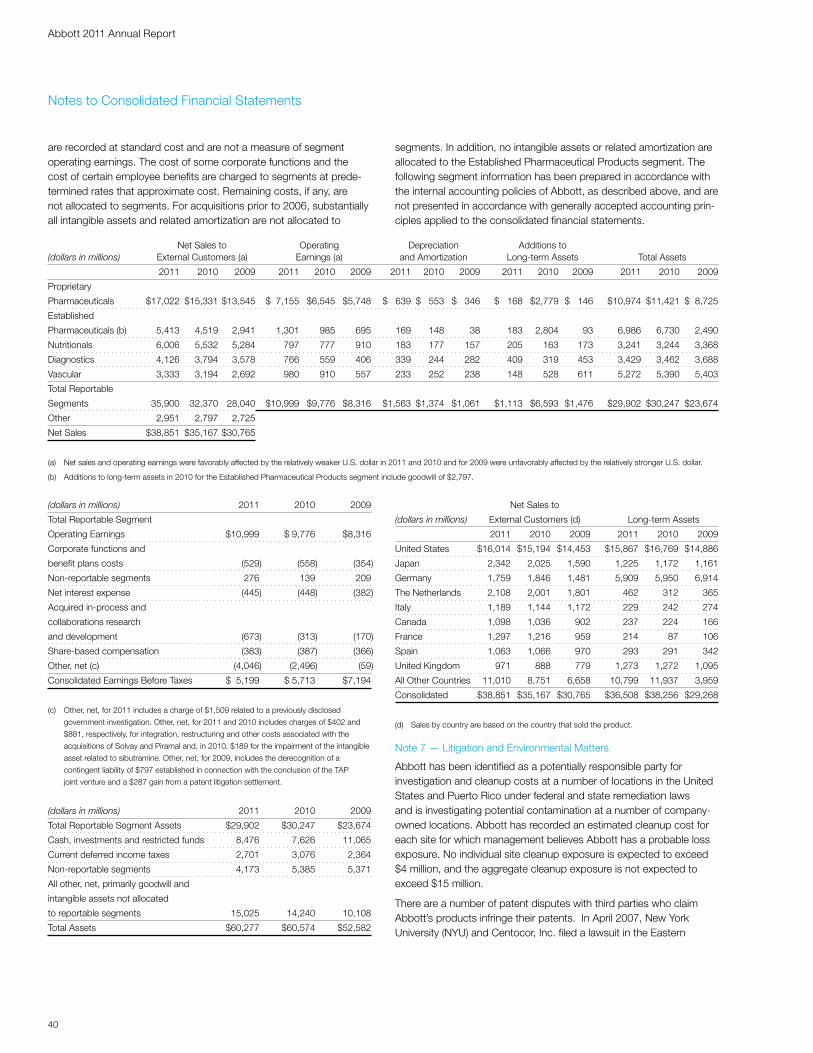
40
Abbott 2011 Annual Report
Net Sales to Operating Depreciation Additions to (dollars in millions) External Customers (a) Earnings (a) and Amortization Long‑term Assets Total Assets
2011 2010 2009 2011 2010 2009 2011 2010 2009 2011 2010 2009 2011 2010 2009
Proprietary
Pharmaceuticals $17,022 $15,331 $13,545 $ 7,155 $6,545 $5,748 $ 639 $ 553 $ 346 $ 168 $2,779 $ 146 $10,974 $11,421 $ 8,725
Established
Pharmaceuticals (b) 5,413 4,519 2,941 1,301 985 695 169 148 38 183 2,804 93 6,986 6,730 2,490
Nutritionals 6,006 5,532 5,284 797 777 910 183 177 157 205 163 173 3,241 3,244 3,368
Diagnostics 4,126 3,794 3,578 766 559 406 339 244 282 409 319 453 3,429 3,462 3,688
Vascular 3,333 3,194 2,692 980 910 557 233 252 238 148 528 611 5,272 5,390 5,403
Total Reportable
Segments 35,900 32,370 28,040 $10,999 $9,776 $8,316 $1,563 $1,374 $1,061 $1,113 $6,593 $1,476 $29,902 $30,247 $23,674
Other 2,951 2,797 2,725
Net Sales $38,851 $35,167 $30,765
(a) Net sales and operating earnings were favorably affected by the relatively weaker U.S. dollar in 2011 and 2010 and for 2009 were unfavorably affected by the relatively stronger U.S. dollar.
(b) Additions to long‑term assets in 2010 for the Established Pharmaceutical Products segment include goodwill of $2,797.
Notes to Consolidated Financial Statements
(dollars in millions) 2011 2010 2009
Total Reportable Segment
Operating Earnings $10,999 $ 9,776 $8,316
Corporate functions and
benefit plans costs (529) (558) (354)
Non‑reportable segments 276 139 209
Net interest expense (445) (448) (382)
Acquired in‑process and
collaborations research
and development (673) (313) (170)
Share‑based compensation (383) (387) (366)
Other, net (c) (4,046) (2,496) (59)
Consolidated Earnings Before Taxes $ 5,199 $ 5,713 $7,194
(c) Other, net, for 2011 includes a charge of $1,509 related to a previously disclosed
government investigation. Other, net, for 2011 and 2010 includes charges of $402 and
$881, respectively, for integration, restructuring and other costs associated with the
acquisitions of Solvay and Piramal and, in 2010, $189 for the impairment of the intangible
asset related to sibutramine. Other, net, for 2009, includes the derecognition of a
contingent liability of $797 established in connection with the conclusion of the TAP
joint venture and a $287 gain from a patent litigation settlement.
(dollars in millions) 2011 2010 2009
Total Reportable Segment Assets $29,902 $30,247 $23,674
Cash, investments and restricted funds 8,476 7,626 11,065
Current deferred income taxes 2,701 3,076 2,364
Non‑reportable segments 4,173 5,385 5,371
All other, net, primarily goodwill and
intangible assets not allocated
to reportable segments 15,025 14,240 10,108
Total Assets $60,277 $60,574 $52,582
are recorded at standard cost and are not a measure of segment operating earnings. The cost of some corporate functions and the cost of certain employee benefits are charged to segments at prede‑termined rates that approximate cost. Remaining costs, if any, are not allocated to segments. For acquisitions prior to 2006, substantially all intangible assets and related amortization are not allocated to
Net Sales to
(dollars in millions) External Customers (d) Long‑term Assets
2011 2010 2009 2011 2010 2009
United States $16,014 $15,194 $14,453 $15,867 $16,769 $14,886
Japan 2,342 2,025 1,590 1,225 1,172 1,161
Germany 1,759 1,846 1,481 5,909 5,950 6,914
The Netherlands 2,108 2,001 1,801 462 312 365
Italy 1,189 1,144 1,172 229 242 274
Canada 1,098 1,036 902 237 224 166
France 1,297 1,216 959 214 87 106
Spain 1,063 1,066 970 293 291 342
United Kingdom 971 888 779 1,273 1,272 1,095
All Other Countries 11,010 8,751 6,658 10,799 11,937 3,959
Consolidated $38,851 $35,167 $30,765 $36,508 $38,256 $29,268
(d) Sales by country are based on the country that sold the product.
Note 7 — Litigation and Environmental Matters
Abbott has been identified as a potentially responsible party for investigation and cleanup costs at a number of locations in the United States and Puerto Rico under federal and state remediation laws and is investigating potential contamination at a number of company‑owned locations. Abbott has recorded an estimated cleanup cost for each site for which management believes Abbott has a probable loss exposure. No individual site cleanup exposure is expected to exceed $4 million, and the aggregate cleanup exposure is not expected to exceed $15 million.
There are a number of patent disputes with third parties who claim Abbott’s products infringe their patents. In April 2007, New York University (NYU) and Centocor, Inc. filed a lawsuit in the Eastern
segments. In addition, no intangible assets or related amortization are allocated to the Established Pharmaceutical Products segment. The following segment information has been prepared in accordance with the internal accounting policies of Abbott, as described above, and are not presented in accordance with generally accepted accounting prin‑ciples applied to the consolidated financial statements.
41
Abbott 2011 Annual Report
Notes to Consolidated Financial Statements
District of Texas asserting that HUMIRA infringes a patent co‑owned by NYU and Centocor and exclusively licensed to Centocor. In June 2009, a jury found that Abbott had willfully infringed the patent and awarded NYU and Centocor approximately $1.67 billion in past compensatory damages. In December 2009, the district court issued a final judgment and awarded the plaintiffs an additional $175 million in prejudgment interest. On February 23, 2011, the Federal Circuit reversed the district court’s final judgment and found Centocor’s patent invalid. On April 25, 2011 Centocor petitioned the Federal Circuit to rehear and reconsider the decision. In June 2011 the Federal Circuit denied Centocor’s request to reconsider. In November 2011, Centocor, now known as Janssen Biotech, Inc., petitioned the United States Supreme Court to review the Federal Circuit’s decision. Abbott is confident in the merits of its case and, as a result, no reserves have been recorded in this case.
The United States Department of Justice, through the United States Attorney for the Western District of Virginia, is investigating Abbott’s sales and marketing activities for Depakote. The government is seek‑ing to determine whether any of these activities violated civil and/or criminal laws, including the Federal False Claims Act, the Food and Drug Cosmetic Act, and the anti‑Kickback Statute in connection with Medicare and/or Medicaid reimbursement to third parties. In addition, eight state Attorneys General Offices (Florida, Illinois, North Carolina, Ohio, Oregon, Pennsylvania, South Carolina and Texas) have formed a committee on behalf of themselves and other State Attorneys General to investigate Abbott’s sales and marketing activities for Depakote to determine whether any of these activities violated various state laws, including state consumer fraud/protection statutes. Discussions to resolve potential civil and criminal claims arising from this matter have advanced to a point where Abbott believes a loss is probable and estimable and therefore, Abbott recorded a charge of $1.5 billion in 2011. If the discussions are successfully concluded, Abbott expects the discussions to result in resolution of the Depakote‑related federal claims, as well as similar state Medicaid‑related claims, but not state consumer fraud/protection claims. However, the discus‑sions are ongoing, and until concluded, there can be no certainty about definitive resolution.
Within the next year, legal proceedings may occur that may result in a change in the estimated reserves recorded by Abbott. For its legal proceedings and environmental exposures Abbott estimates the range of possible loss to be from approximately $1.59 billion to $1.63 billion, which includes the $1.5 billion charge discussed above. The recorded reserve balance at December 31, 2011 for these proceedings and exposures was approximately $1.6 billion. These reserves represent management’s best estimate of probable loss, as defined by FASB ASC No. 450, “Contingencies.”
While it is not feasible to predict the outcome of all such proceedings and exposures with certainty, management believes that their ultimate disposition should not have a material adverse effect on Abbott’s financial position, cash flows, or results of operations except for the federal government investigation discussed in the third paragraph of this footnote, the resolution of which is expected to be material to cash flows in a given year.
In 2009, Abbott and Medtronic, Inc. reached a settlement resolving all outstanding intellectual property litigation between the two parties. Under the terms of the settlement, Medtronic paid Abbott $400 million. The settlement also includes a mutual agreement not to pursue additional litigation on current and future vascular products, subject to specific conditions and time limits. In connection with the settle‑ment, Abbott recognized a gain of $287 million which is included in Other (income) expense, net. The remaining amounts were recognized as royalty income as earned.
Note 8 — Incentive Stock Program
The 2009 Incentive Stock Program authorizes the granting of nonquali‑fied stock options, replacement stock options, restricted stock awards, restricted stock units, performance awards, foreign benefits and other share‑based awards. Stock options, replacement stock options and restricted stock awards and units comprise the majority of benefits that have been granted and are currently outstanding under this program and a prior program. In 2011, Abbott granted 1,757,339 stock options, 852,819 replacement stock options, 1,180,159 restricted stock awards and 6,793,336 restricted stock units under this program. The purchase price of shares under option must be at least equal to the fair market value of the common stock on the date of grant, and the maximum term of an option is 10 years. Options vest equally over three years except for replacement options, which vest in six months. Options granted before January 1, 2005 included a replacement feature. Except for options outstanding that have a replacement feature, options granted after December 31, 2004 do not include a replacement feature. When an employee tenders mature shares to Abbott upon exercise of a stock option, a replacement stock option may be granted equal to the amount of shares tendered. Replacement options are granted at the then current market price for a term that expires on the date of the underlying option grant. Upon a change in control of Abbott, all outstanding stock options become fully exercisable, and all terms and conditions of all restricted stock awards and units are deemed satisfied. Restricted stock awards generally vest between 3 and 5 years and for restricted stock awards that vest over 5 years, no more than one‑third of the award vests in any one year upon Abbott reaching a minimum return on equity target. Restricted stock units vest over three years and upon vesting, the recipient receives one share of Abbott stock for each vested restricted stock unit. The aggregate fair market value of restricted stock awards and units is recognized as expense over the service period. Restricted stock awards and settlement of vested restricted stock units are issued out of treasury shares. Abbott generally issues new shares for exercises of stock options. Abbott does not have a policy of purchasing its shares relating to its share‑based programs. At December 31, 2011, approximately 180 million shares were reserved for future grants. Subsequent to year‑end, the reserve was reduced by approximately 25 million shares for stock options and restricted stock awards and units granted by the Board of Directors.
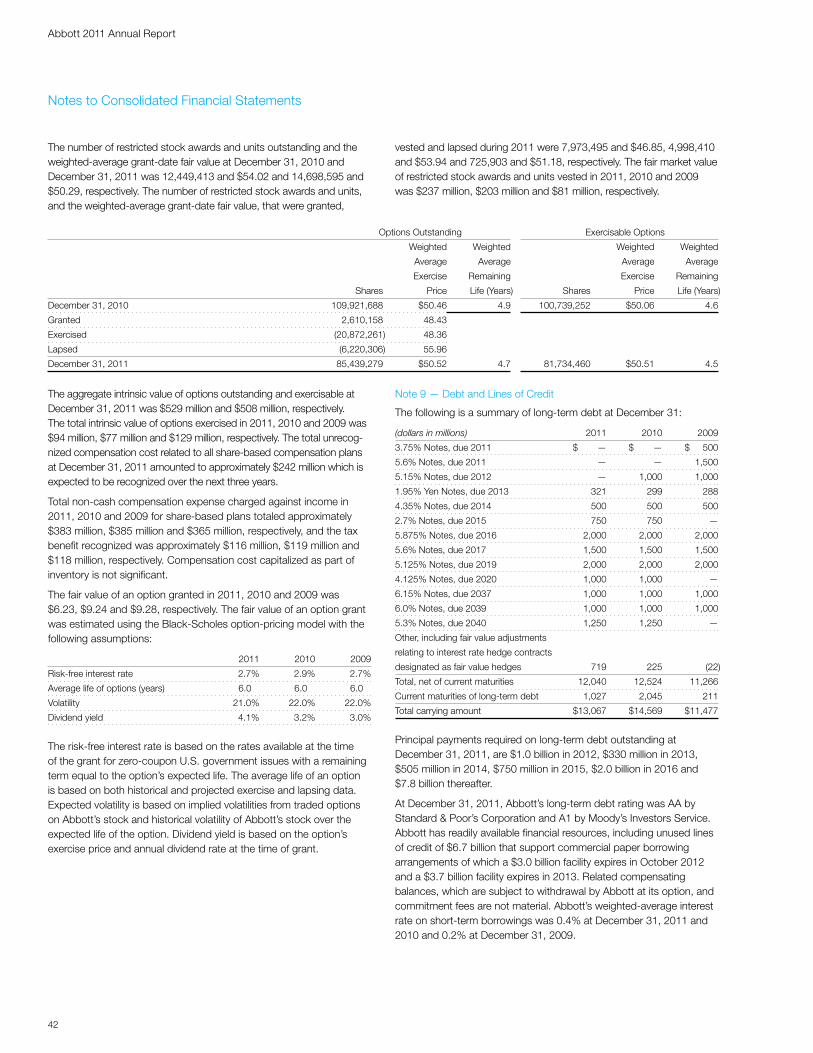
42
Abbott 2011 Annual Report
Options Outstanding Exercisable Options
Weighted Weighted Weighted Weighted
Average Average Average Average
Exercise Remaining Exercise Remaining
Shares Price Life (Years) Shares Price Life (Years)
December 31, 2010 109,921,688 $50.46 4.9 100,739,252 $50.06 4.6
Granted 2,610,158 48.43
Exercised (20,872,261) 48.36
Lapsed (6,220,306) 55.96
December 31, 2011 85,439,279 $50.52 4.7 81,734,460 $50.51 4.5
The aggregate intrinsic value of options outstanding and exercisable at December 31, 2011 was $529 million and $508 million, respectively. The total intrinsic value of options exercised in 2011, 2010 and 2009 was $94 million, $77 million and $129 million, respectively. The total unrecog‑nized compensation cost related to all share‑based compensation plans at December 31, 2011 amounted to approximately $242 million which is expected to be recognized over the next three years.
Total non‑cash compensation expense charged against income in 2011, 2010 and 2009 for share‑based plans totaled approximately $383 million, $385 million and $365 million, respectively, and the tax benefit recognized was approximately $116 million, $119 million and $118 million, respectively. Compensation cost capitalized as part of inventory is not significant.
The fair value of an option granted in 2011, 2010 and 2009 was $6.23, $9.24 and $9.28, respectively. The fair value of an option grant was estimated using the Black‑Scholes option‑pricing model with the following assumptions:
2011 2010 2009
Risk‑free interest rate 2.7% 2.9% 2.7%
Average life of options (years) 6.0 6.0 6.0
Volatility 21.0% 22.0% 22.0%
Dividend yield 4.1% 3.2% 3.0%
The risk‑free interest rate is based on the rates available at the time of the grant for zero‑coupon U.S. government issues with a remaining term equal to the option’s expected life. The average life of an option is based on both historical and projected exercise and lapsing data. Expected volatility is based on implied volatilities from traded options on Abbott’s stock and historical volatility of Abbott’s stock over the expected life of the option. Dividend yield is based on the option’s exercise price and annual dividend rate at the time of grant.
Note 9 — Debt and Lines of Credit
The following is a summary of long‑term debt at December 31:
(dollars in millions) 2011 2010 2009
3.75% Notes, due 2011 $ — $ — $ 500
5.6% Notes, due 2011 — — 1,500
5.15% Notes, due 2012 — 1,000 1,000
1.95% Yen Notes, due 2013 321 299 288
4.35% Notes, due 2014 500 500 500
2.7% Notes, due 2015 750 750 —
5.875% Notes, due 2016 2,000 2,000 2,000
5.6% Notes, due 2017 1,500 1,500 1,500
5.125% Notes, due 2019 2,000 2,000 2,000
4.125% Notes, due 2020 1,000 1,000 —
6.15% Notes, due 2037 1,000 1,000 1,000
6.0% Notes, due 2039 1,000 1,000 1,000
5.3% Notes, due 2040 1,250 1,250 —
Other, including fair value adjustments
relating to interest rate hedge contracts
designated as fair value hedges 719 225 (22)
Total, net of current maturities 12,040 12,524 11,266
Current maturities of long‑term debt 1,027 2,045 211
Total carrying amount $13,067 $14,569 $11,477
Principal payments required on long‑term debt outstanding at December 31, 2011, are $1.0 billion in 2012, $330 million in 2013, $505 million in 2014, $750 million in 2015, $2.0 billion in 2016 and $7.8 billion thereafter.
At December 31, 2011, Abbott’s long‑term debt rating was AA by Standard & Poor’s Corporation and A1 by Moody’s Investors Service. Abbott has readily available financial resources, including unused lines of credit of $6.7 billion that support commercial paper borrowing arrangements of which a $3.0 billion facility expires in October 2012 and a $3.7 billion facility expires in 2013. Related compensating balances, which are subject to withdrawal by Abbott at its option, and commitment fees are not material. Abbott’s weighted‑average interest rate on short‑term borrowings was 0.4% at December 31, 2011 and 2010 and 0.2% at December 31, 2009.
Notes to Consolidated Financial Statements
The number of restricted stock awards and units outstanding and the weighted‑average grant‑date fair value at December 31, 2010 and December 31, 2011 was 12,449,413 and $54.02 and 14,698,595 and $50.29, respectively. The number of restricted stock awards and units, and the weighted‑average grant‑date fair value, that were granted,
vested and lapsed during 2011 were 7,973,495 and $46.85, 4,998,410 and $53.94 and 725,903 and $51.18, respectively. The fair market value of restricted stock awards and units vested in 2011, 2010 and 2009 was $237 million, $203 million and $81 million, respectively.
43
Abbott 2011 Annual Report
Note 10 — Business Combinations, Technology Acquisitions and Related Transactions
On September 8, 2010, Abbott acquired Piramal Healthcare Limited’s Healthcare Solutions business, a leader in the Indian branded generics market, for $2.2 billion, in cash, plus additional payments of $400 mil‑lion annually in 2011, 2012, 2013 and 2014. Abbott recorded a $1.6 billion liability for the present value of the additional payments at the acquisition date. The acquisition was financed with cash. The allocation of the fair value of the acquisition resulted in the recording of $2.7 billion of deductible acquired intangible assets and $1.0 billion of deductible goodwill. Acquired intangible assets consist primarily of trade names, customer relationships and associ‑ated rights and are amortized over an average of 19 years.
In February 2010, Abbott acquired Solvay’s pharmaceuticals business (Solvay Pharmaceuticals) for approximately $6.1 billion, in cash, plus additional payments of up to EUR 100 million per year if certain sales milestones are met in 2011, 2012 and 2013. Contingent consideration of approximately $290 million was recorded. The acquisition of Solvay Pharmaceuticals provides Abbott with a large and complementary portfolio of pharmaceutical products and expands Abbott’s presence in key global emerging markets. Abbott acquired control of this busi‑ness on February 15, 2010 and the financial results of the acquired operations are included in these financial statements beginning on that date. Net sales for the acquired operations for 2010 were approxi‑mately $3.1 billion. Pretax loss of the acquired operations, including acquisition, integration and restructuring expenses, for 2010 was approximately $395 million. The acquisition was funded with cash and short‑term investments. The allocation of the fair value of the acquisi‑tion is shown in the table below.
(in billions of dollars)
Goodwill, non‑deductible $2.2
Acquired intangible assets, non‑deductible 4.1
Acquired in‑process research and
development, non‑deductible 0.5
Acquired net tangible assets 0.7
Deferred income taxes recorded at acquisition (1.1)
Total allocation of fair value $6.4
Acquired intangible assets consist primarily of product rights for currently marketed products and are amortized over 2 to 14 years (average of 11 years). Acquired in‑process research and development projects are accounted for as indefinite lived intangible assets until regulatory approval or discontinuation. The net tangible assets acquired consist primarily of trade accounts receivable of approxi‑mately $675 million, inventory of approximately $390 million, property and equipment of approximately $725 million, net of assumed liabili‑ties, primarily trade accounts payable, accrued compensation and other liabilities.
Had the acquisition of Solvay Pharmaceuticals taken place on January 1, 2010 and January 1, 2009, unaudited pro forma net sales, net earnings and diluted earnings per share for 2010 and 2009 would have been $35.8 billion and $34.2 billion, $4.6 billion and $5.2 billion and $2.96 and $3.36, respectively. The pro forma information includes adjustments for amortization of intangible assets and fair value
adjustments to acquisition‑date inventory as well as acquisition, inte‑gration and restructuring expenses. The pro forma financial information is not necessarily indicative of the results of operations as they would have been had the transaction been effected on the assumed date.
In March 2010, Abbott acquired STARLIMS Technologies for approxi‑mately $100 million, in cash, net of cash held by STARLIMS, providing Abbott with leading products and expertise to build its position in labo‑ratory informatics. A substantial portion of the fair value of the acquisition has been allocated to goodwill and amortizable intangible assets.
In April 2010, Abbott acquired the outstanding shares of Facet Biotech Corporation for approximately $430 million, in cash, net of cash held by Facet. The acquisition enhances Abbott’s early‑ and mid‑stage pharmaceutical pipeline, including a biologic for multiple sclerosis and compounds that complement Abbott’s oncology pro‑gram. A substantial portion of the fair value of the acquisition has been allocated to acquired in‑process research and development that is accounted for as an indefinite‑lived intangible asset until regulatory approval or discontinuation.
In February 2009, Abbott acquired the outstanding shares of Advanced Medical Optics, Inc. (AMO) for approximately $1.4 billion in cash, net of cash held by AMO. Prior to the acquisition, Abbott held a small investment in AMO. Abbott acquired AMO to take advantage of increasing demand for vision care technologies due to population growth and demographic shifts and AMO’s premier position in its field. Abbott acquired control of this business on February 25, 2009 and the financial results of the acquired operations are included in these financial statements beginning on that date. The allocation of the fair value of the acquisition resulted in non‑deductible goodwill of approxi‑mately $1.7 billion, non‑deductible definite‑lived intangible assets of approximately $900 million and net tangible assets of approximately $400 million. In addition, Abbott assumed $1.5 billion of debt. Acquired intangible assets consist of established customer relation‑ships, developed technology and trade names and are amortized over 2 to 30 years (average of 15 years). In addition, subsequent to the acquisition, Abbott repaid substantially all of the acquired debt of AMO.
In October 2009, Abbott acquired 100 percent of Visiogen, Inc. for $400 million, in cash, providing Abbott with a next‑generation accom‑modating intraocular lens (IOL) technology to address presbyopia for cataract patients. The allocation of the fair value of the acquisition resulted in non‑deductible acquired in‑process research and develop‑ment of approximately $200 million which is accounted for as an indefinite‑lived intangible asset until regulatory approval or discontinua‑tion, non‑deductible definite‑lived intangible assets of approximately $24 million and goodwill of approximately $200 million.
In October 2009, Abbott acquired Evalve, Inc. for $320 million, in cash, plus an additional payment of $90 million to be made upon completion of certain regulatory milestones. Abbott acquired Evalve to obtain a presence in the growing area of non‑surgical treatment for structural heart disease. Including a previous investment in Evalve, Abbott has acquired 100 percent of the outstanding shares of Evalve. In connection with the acquisition, the carrying amount of this invest‑ment was revalued to fair value resulting in recording $28 million of
Notes to Consolidated Financial Statements
44
Abbott 2011 Annual Report
Notes to Consolidated Financial Statements
Note 11 — Goodwill and Intangible Assets
Abbott recorded goodwill of approximately $3.4 billion in 2010 related to the acquisitions of Solvay’s pharmaceuticals business, Piramal Healthcare Limited’s Healthcare Solutions business, Facet Biotech and STARLIMS Technologies. Goodwill related to the Solvay, Piramal and Facet acquisitions was allocated to the pharmaceutical products seg‑ments. In addition, in 2010, Abbott paid $250 million to Boston Scientific as a result of the approval to market the Xience V drug‑eluting stent in Japan, resulting in an increase in goodwill in the Vascular Products segment. Abbott recorded goodwill of approximately $2.2 billion in 2009 related to the acquisitions of Advanced Medical Optics, Inc., Ibis Biosciences, Inc., Visiogen, Inc. and Evalve, Inc. Goodwill of approxi‑mately $120 million related to the Ibis acquisition was allocated to the Diagnostic Products segment and goodwill of approximately $160 mil‑lion related to the Evalve acquisition was allocated to the Vascular Products segment. Foreign currency translation and other adjustments (decreased) increased goodwill in 2011, 2010 and 2009 by $(225) mil‑lion, $(879) million and $997 million, respectively. The amount of goodwill related to reportable segments at December 31, 2011 was $6.2 billion for the Proprietary Pharmaceutical Products segment, $3.0 billion for the Established Pharmaceutical Products segment, $207 million for the Nutritional Products segment, $383 million for the Diagnostic Products segment, and $2.6 billion for the Vascular Products segment. There were no significant reductions of goodwill relating to impairments or disposal of all or a portion of a business.
The gross amount of amortizable intangible assets, primarily product rights and technology was $17.5 billion, $17.3 billion and $10.8 billion as of December 31, 2011, 2010 and 2009, respectively, and accumu‑lated amortization was $8.3 billion, $6.5 billion and $5.1 billion as of December 31, 2011, 2010 and 2009, respectively. Indefinite‑lived intangible assets, which relate to in‑process research and develop‑ment acquired in a business combination, were approximately $814 million, $1.4 billion and $610 million at December 31, 2011, 2010 and 2009, respectively. In 2011, Abbott recorded impairment charges for certain research and development assets due to changes in the projected development and regulatory timelines for the projects. $125 million related to a non‑reportable segment and $49 million related to the Other categories in Abbott’s segment reporting. Discounted cash flow analysis was used to analyze fair value and the charges are included in research and development expenses. The estimated annual amortization expense for intangible assets recorded at December 31, 2011 is approximately $1.5 billion in 2012, $1.3 billion in 2013, $1.0 billion in 2014, $800 million in 2015 and $765 million in 2016. Intangible asset amortization is included in Cost of products sold in the consolidated statement of earnings. Amortizable intangible assets are amortized over 2 to 30 years (average 10 years).
Note 12 — Restructuring Plans
In 2011 and prior years, Abbott management approved plans to realign its worldwide pharmaceutical and vascular manufacturing operations and selected domestic and international commercial and research and development operations in order to reduce costs. In 2011, 2010 and 2009, Abbott recorded charges of approximately $194 million, $56 million and $114 million, respectively, reflecting the impairment of manufacturing facilities and other assets, employee severance and other related charges. Approximately $76 million in 2011 is classified as Cost of products sold, $69 million as Research
income, which is reported as Other (income) expense, net. The alloca‑tion of the fair value of the acquisition resulted in non‑deductible definite‑lived intangible assets of approximately $140 million, non‑deductible acquired in‑process research and development of approximately $220 million which is accounted for as an indefinite‑lived intangible asset until regulatory approval or discontinuation, goodwill of approximately $100 million and deferred income taxes of approximately $110 million. Acquired intangible assets consist of developed technology and are being amortized over 11 years.
In January 2009, Abbott acquired Ibis Biosciences, Inc. (Ibis) for $175 million, in cash, to expand Abbott’s position in molecular diag‑nostics for infectious disease. Including a $40 million investment in Ibis in 2008, Abbott has acquired 100 percent of the outstanding shares of Ibis. A substantial portion of the fair value of the acquisition has been allocated to goodwill and amortizable intangible assets, and acquired in‑process research and development which is accounted for as an indefinite‑lived intangible asset until regulatory approval or discontinuation. The investment in Ibis in 2008 resulted in a charge to acquired in‑process research and development. In connection with the acquisition, the carrying amount of this investment was revalued to fair value resulting in recording $33 million of income, which is reported as Other (income) expense, net.
Except for the acquisition of Solvay Pharmaceuticals, had the above acquisitions taken place on January 1 of the previous year, consoli‑dated net sales and income would not have been significantly different from reported amounts.
In 2011, Abbott entered into a collaboration agreement for the joint development and commercialization of second‑generation oral antioxidant inflammation modulators resulting in a charge to acquired in‑process research and development of $400 million. In 2010, Abbott entered into an agreement to acquire licensing rights outside the U.S., excluding certain Asian markets, to a product in development for the treatment of chronic kidney disease resulting in a charge to acquired in‑process research and development of $238 million. In 2011, certain milestones were achieved and charges to acquired in‑process research and development of $188 million were recorded. Additional payments of approximately $200 million could be required for the achievement of certain development and regulatory milestones. In addition, equity interests of approximately $62 million each were acquired in 2011 and 2010. In 2011, Abbott entered into an agree‑ment to develop and commercialize a treatment for rheumatoid arthritis and psoriasis resulting in a charge to acquired in‑process research and development of $85 million. Additional payments totaling up to $395 million could be required for the achievement of certain development, regulatory and commercial milestones under the agree‑ment. In 2010, Abbott also entered into an agreement to develop and commercialize a product for the treatment of endometriosis resulting in a charge to acquired in‑process research and development of $75 million. Additional payments of approximately $500 million could be required for the achievement of certain development, regulatory and commercial milestones under this agreement. In 2009, Abbott acquired the global rights to a novel biologic for the treatment of chronic pain for $170 million resulting in a charge to acquired in‑process research and development.
45
Abbott 2011 Annual Report
Notes to Consolidated Financial Statements
charges will be incurred through 2012 as a result of product re‑regis‑tration timelines required under manufacturing regulations in a number of countries and product transition timelines.
Note 13 — Spin‑off of Abbott’s Proprietary Pharmaceuticals Business
In October 2011, Abbott announced a plan to separate into two publicly traded companies, one in diversified medical products and the other in research‑based pharmaceuticals. To accomplish the separation, Abbott plans to create a new company for its research‑based pharmaceuticals business which will include Abbott’s Proprietary Pharmaceutical Products segment. The transaction is expected to take the form of a tax‑free distribution to Abbott shareholders of the stock of the newly created research‑based pharmaceutical company and is expected to be completed by the end of 2012. Subsequent to the separation, the historical results of the research‑based pharmaceuticals business will be presented as discontinued operations.
Note 14 — Quarterly Results (Unaudited)
(dollars in millions except per share data) 2011 2010 2009
First Quarter
Net Sales $ 9,040.9 $7,698.4 $6,718.4
Gross Profit 5,181.9 4,363.2 3,782.4
Net Earnings 863.8 1,003.0 1,438.6
Basic Earnings Per Common Share (a) .56 .65 .93
Diluted Earnings Per Common Share (a) .55 .64 .92
Market Price Per Share‑High 49.45 56.79 57.39
Market Price Per Share‑Low 45.07 52.21 44.10
Second Quarter
Net Sales $ 9,616.3 $8,826.0 $7,494.9
Gross Profit 5,745.8 5,282.1 4,365.9
Net Earnings 1,942.8 1,291.7 1,288.1
Basic Earnings Per Common Share (a) 1.24 .83 .83
Diluted Earnings Per Common Share (a) 1.23 .83 .83
Market Price Per Share‑High 54.24 53.25 48.37
Market Price Per Share‑Low 49.05 45.26 41.27
Third Quarter
Net Sales $ 9,816.7 $8,674.5 $7,761.3
Gross Profit 5,843.4 4,933.4 4,401.2
Net Earnings 303.2 890.7 1,480.4
Basic Earnings Per Common Share (a) .19 .58 .95
Diluted Earnings Per Common Share (a) .19 .57 .95
Market Price Per Share‑High 53.60 52.86 49.69
Market Price Per Share‑Low 46.29 44.59 43.45
Fourth Quarter
Net Sales $10,377.4 $9,967.8 $8,790.1
Gross Profit 6,539.6 5,922.8 5,005.9
Net Earnings 1,618.7 1,440.8 1,538.7
Basic Earnings Per Common Share (a) 1.03 .93 .99
Diluted Earnings Per Common Share (a) 1.02 .92 .98
Market Price Per Share‑High 56.44 53.75 54.97
Market Price Per Share‑Low 48.96 46.03 48.41
(a) The sum of the quarters’ basic earnings per share for 2011, 2010 and 2009 and diluted
earnings per share for 2011 and 2009 do not add to the full year earnings per share
amounts due to rounding.
and development and $49 million as Selling, general and administrative. Approximately $56 million in 2010 is classified as Cost of products sold and $114 million in 2009 as Selling, general and administrative. The following summarizes the activity for these restructurings:
(dollars in millions)
Accrued balance at January 1, 2009 $ 105
2009 restructuring charges 114
Payments, impairments and other adjustments (74)
Accrued balance at December 31, 2009 145
2010 restructuring charges 56
Payments, impairments and other adjustments (124)
Accrued balance at December 31, 2010 77
2011 restructuring charges 194
Payments and other adjustments (94)
Accrued balance at December 31, 2011 $ 177
An additional $25 million, $13 million and $47 million were recorded in 2011, 2010 and 2009, respectively, relating to these restructurings, primarily for accelerated depreciation.
In 2010, Abbott management approved a restructuring plan primarily related to the acquisition of Solvay’s pharmaceuticals business. This plan streamlines operations, improves efficiencies and reduces costs in certain Solvay sites and functions as well as in certain Abbott and Solvay commercial organizations in various countries. Under this plan, Abbott recorded charges to Cost of products sold, Research and development and Selling, general and administrative of approximately $99 million, $152 million and $272 million, respectively. The following summarizes the activity for this restructuring:
(dollars in millions)
2010 restructuring charge $ 523
Payments, impairments and other adjustments (113)
Accrued balance at December 31, 2010 410
Payments and other adjustments (302)
Accrued balance at December 31, 2011 $ 108
An additional $102 million and $12 million were recorded in 2011 and 2010, respectively, relating to this restructuring, primarily for additional employee severance and accelerated depreciation.
In 2011 and 2008, Abbott management approved plans to streamline global manufacturing operations, reduce overall costs, and improve efficiencies in Abbott’s core diagnostic business. In 2011 a charge of $28 million was recorded in Cost of products sold. The following summarizes the activity for these restructurings:
(dollars in millions)
Accrued balance at January 1, 2009 $110
Payments and other adjustments (12)
Accrued balance at December 31, 2009 98
Payments and other adjustments (10)
Accrued balance at December 31, 2010 88
2011 restructuring charge 28
Payments and other adjustments (37)
Accrued balance at December 31, 2011 $ 79
In addition, charges of approximately $42 million, $60 million and $54 million were recorded in 2011, 2010 and 2009, primarily for accelerated depreciation and product transfer costs. Additional
46
Abbott 2011 Annual Report
Management Report on Internal Control Over Financial Reporting
The management of Abbott Laboratories is responsible for establishing and maintaining adequate internal control over financial reporting. Abbott’s internal control system was designed to provide reasonable assurance to the company’s management and board of directors regarding the prepa‑ration and fair presentation of published financial statements.
All internal control systems, no matter how well designed, have inherent limitations. Therefore, even those systems determined to be effective can provide only reasonable assurance with respect to financial statement preparation and presentation.
Abbott’s management assessed the effectiveness of the company’s internal control over financial reporting as of December 31, 2011. In making this assessment, it used the criteria set forth in Internal Control—Integrated Framework issued by the Committee of Sponsoring Organizations of the Treadway Commission. Based on our assessment, we believe that, as of December 31, 2011, the company’s internal con‑trol over financial reporting was effective based on those criteria.
Abbott’s independent registered public accounting firm has issued an audit report on their assessment of the effectiveness of the company’s internal control over financial reporting. This report appears on page 47.
Miles D. White Chairman of the Board and Chief Executive Officer
Thomas C. Freyman Executive Vice President, Finance and Chief Financial Officer
Greg W. Linder Vice President and Controller
February 21, 2012
47
Abbott 2011 Annual Report
To the Board of Directors and Shareholders of Abbott Laboratories:
We have audited the accompanying consolidated balance sheets of Abbott Laboratories and subsidiaries (the “Company”) as of December 31, 2011, 2010, and 2009, and the related consolidated statements of earnings, comprehensive income, shareholders’ investment, and cash flows for the years then ended. These financial statements are the responsibility of the Company’s management. Our responsibility is to express an opinion on these financial statements based on our audits.
We conducted our audits in accordance with the standards of the Public Company Accounting Oversight Board (United States). Those standards require that we plan and perform the audit to obtain reason‑able assurance about whether the financial statements are free of material misstatement. An audit includes examining, on a test basis, evidence supporting the amounts and disclosures in the financial statements. An audit also includes assessing the accounting principles used and significant estimates made by management, as well as evaluating the overall financial statement presentation. We believe that our audits provide a reasonable basis for our opinion.
In our opinion, such consolidated financial statements present fairly, in all material respects, the financial position of the Company as of December 31, 2011, 2010, and 2009, and the results of its operations and its cash flows for the years then ended in conformity with accounting principles generally accepted in the United States of America.
As discussed in Note 1 to the consolidated financial statements, in 2011 the Company changed the year end of its foreign subsidiaries from a November 30 fiscal year end to a December 31 calendar year end and changed its presentation of comprehensive income.
We have also audited, in accordance with the standards of the Public Company Accounting Oversight Board (United States), the Company’s internal control over financial reporting as of December 31, 2011, based on the criteria established in Internal Control‑Integrated Framework issued by the Committee of Sponsoring Organizations of the Treadway Commission and our report dated February 21, 2012 expressed an unqualified opinion on the Company’s internal control over financial reporting.
Deloitte & Touche LLPChicago, IllinoisFebruary 21, 2012
To the Board of Directors and Shareholders of Abbott Laboratories:
We have audited the internal control over financial reporting of Abbott Laboratories and subsidiaries (the “Company”) as of December 31, 2011, based on criteria established in Internal Control—Integrated Framework issued by the Committee of Sponsoring Organizations of the Treadway Commission. The Company’s management is responsi‑ble for maintaining effective internal control over financial reporting and for its assessment of the effectiveness of internal control over financial reporting, included in the accompanying Management Report on Internal Control over Financial Reporting. Our responsibility is to express an opinion on the Company’s internal control over financial reporting based on our audit.
We conducted our audit in accordance with the standards of the Public Company Accounting Oversight Board (United States). Those standards require that we plan and perform the audit to obtain reason‑able assurance about whether effective internal control over financial reporting was maintained in all material respects. Our audit included obtaining an understanding of internal control over financial reporting, assessing the risk that a material weakness exists, testing and evaluat‑ing the design and operating effectiveness of internal control based on the assessed risk, and performing such other procedures as we con‑sidered necessary in the circumstances. We believe that our audit provides a reasonable basis for our opinion.
A company’s internal control over financial reporting is a process designed by, or under the supervision of, the company’s principal executive and principal financial officers, or persons performing similar functions, and effected by the company’s board of directors, manage‑ment, and other personnel to provide reasonable assurance regarding the reliability of financial reporting and the preparation of financial state‑ments for external purposes in accordance with generally accepted accounting principles. A company’s internal control over financial reporting includes those policies and procedures that (1) pertain to the maintenance of records that, in reasonable detail, accurately and fairly reflect the transactions and dispositions of the assets of the company; (2) provide reasonable assurance that transactions are recorded as necessary to permit preparation of financial statements in accordance with generally accepted accounting principles, and that receipts and expenditures of the company are being made only in accordance with authorizations of management and directors of the company; and (3) provide reasonable assurance regarding prevention or timely detec‑tion of unauthorized acquisition, use, or disposition of the company’s assets that could have a material effect on the financial statements.
Because of the inherent limitations of internal control over financial reporting, including the possibility of collusion or improper manage‑ment override of controls, material misstatements due to error or fraud may not be prevented or detected on a timely basis. Also, projections of any evaluation of the effectiveness of the internal control over finan‑cial reporting to future periods are subject to the risk that the controls may become inadequate because of changes in conditions, or that the degree of compliance with the policies or procedures may deteriorate.
In our opinion, the Company maintained, in all material respects, effec‑tive internal control over financial reporting as of December 31, 2011, based on the criteria established in Internal Control—Integrated Framework issued by the Committee of Sponsoring Organizations of the Treadway Commission.
We have also audited, in accordance with the standards of the Public Company Accounting Oversight Board (United States), the consoli‑dated financial statements of the Company as of and for the year ended December 31, 2011 and our report dated February 21, 2012 expresses an unqualified opinion on those financial statements and includes an explanatory paragraph regarding the Company’s change to the year end of its foreign subsidiaries and change to its presenta‑tion of comprehensive income during 2011.
Deloitte & Touche LLPChicago, IllinoisFebruary 21, 2012
Reports of Independent Registered Public Accounting Firm
48
Abbott 2011 Annual Report
Market Price Sensitive Investments
Abbott holds available‑for‑sale equity securities from strategic technology acquisitions. The market value of these investments was approximately $93 million and $75 million as of December 31, 2011 and 2010, respectively. Abbott monitors these investments for other than temporary declines in market value, and charges impairment losses to income when an other than temporary decline in value occurs. A hypothetical 20 percent decrease in the share prices of these invest‑ments would decrease their fair value at December 31, 2011 by approximately $18 million. (A 20 percent decrease is believed to be a reasonably possible near‑term change in share prices.)
Non‑Publicly Traded Equity Securities
Abbott holds equity securities from strategic technology acquisitions that are not traded on public stock exchanges. The carrying value of these investments was approximately $224 million and $165 million as of December 31, 2011 and 2010, respectively. One equity invest‑ment is recorded at $124 million with no other individual investment in excess of $18 million. Abbott monitors these investments for other than temporary declines in market value, and charges impairment losses to income when an other than temporary decline in estimated value occurs.
Interest Rate Sensitive Financial Instruments
At December 31, 2011 and 2010, Abbott had interest rate hedge contracts totaling $6.8 billion and $7.3 billion, respectively, to manage its exposure to changes in the fair value of debt. The effect of these hedges is to change the fixed interest rate to a variable rate. Abbott does not use derivative financial instruments, such as interest rate swaps, to manage its exposure to changes in interest rates for its investment securities. At December 31, 2011, Abbott had $450 million of domestic commercial paper outstanding with an average annual interest rate of 0.07% with an average remaining life of 12 days. The fair value of long‑term debt at December 31, 2011 and 2010 amounted to $15.1 billion and $15.7 billion, respectively (average interest rates of 5.2%) with maturities through 2040. At December 31, 2011 and 2010,
the fair value of current and long‑term investment securities amounted to approximately $1.7 billion and $2.1 billion, respectively. A hypotheti‑cal 100‑basis point change in the interest rates would not have a material effect on cash flows, income or market values. (A 100‑basis point change is believed to be a reasonably possible near‑term change in rates.)
Foreign Currency Sensitive Financial Instruments
Certain Abbott foreign subsidiaries enter into foreign currency forward exchange contracts to manage exposures to changes in foreign exchange rates for anticipated intercompany purchases by those subsidiaries whose functional currencies are not the U.S. dollar. These contracts are designated as cash flow hedges of the variability of the cash flows due to changes in foreign currency exchange rates and are marked‑to‑market with the resulting gains or losses reflected in Accumulated other comprehensive income (loss). Gains or losses will be included in Cost of products sold at the time the products are sold, generally within the next twelve months. At December 31, 2011 and 2010, Abbott held $1.6 billion and $1.3 billion, respectively, of such contracts, which all mature in the following calendar year.
Abbott enters into foreign currency forward exchange contracts to manage its exposure to foreign currency denominated intercompany loans and trade payables and third‑party trade payables and receiv‑ables. The contracts are marked‑to‑market, and resulting gains or losses are reflected in income and are generally offset by losses or gains on the foreign currency exposure being managed. At December 31, 2011 and 2010, Abbott held $15.7 billion and $10.8 billion, respectively, of such contracts, which mature in the next twelve months.
Abbott has designated foreign denominated short‑term debt of approximately $680 million and approximately $650 million as of December 31, 2011 and 2010, respectively, as a hedge of the net investment in a foreign subsidiary. Accordingly, changes in the fair value of this debt due to changes in exchange rates are recorded in Accumulated other comprehensive income (loss), net of tax.
The following table reflects the total foreign currency forward contracts outstanding at December 31, 2011 and 2010:
2011 2010
Fair and Fair and
Weighted Carrying Weighted Carrying
Average Value Average Value
Contract Exchange Receivable/ Contract Exchange Receivable/
(dollars in millions) Amount Rate (Payable) Amount Rate (Payable)
Receive primarily U.S. Dollars
in exchange for the following currencies:
Euro $10,526 1.329 $102 $ 5,803 1.347 $ 16
British Pound 1,501 1.571 3 1,422 1.581 2
Japanese Yen 2,458 80.3 (3) 2,256 82.7 (2)
Canadian Dollar 280 1.026 (2) 538 1.021 4
All other currencies 2,544 N/A (1) 2,090 N/A (25)
Total $17,309 $ 99 $12,109 $ (5)
Financial Instruments and Risk Management
49
Abbott 2011 Annual Report
Abbott’s revenues are derived primarily from the sale of a broad line of health care products under short-term receivable arrangements. Patent protection and licenses, technological and performance features, and inclusion of Abbott’s products under a contract or by a pharmacy benefit manager most impact which products are sold; price controls, competition and rebates most impact the net selling prices of products; and foreign currency translation impacts the measurement of net sales and costs. Abbott’s primary products are prescription pharmaceuticals, nutritional products, diagnostic testing products and vascular products. Sales in international markets are approximately 60 percent of consolidated net sales.
In 2011, Abbott announced a plan to separate into two publicly traded companies, one in diversified medical products and the other in research-based pharmaceuticals. To accomplish the separation, Abbott plans to create a new company for its research-based pharmaceuticals business which will include Abbott’s Proprietary Pharmaceutical Products segment. The transaction is expected to take the form of a tax-free distribution to Abbott shareholders of the stock of the newly created research-based pharmaceutical company and is expected to be completed by the end of 2012. Subsequent to the separation, the historical results of the research-based pharma-ceuticals business will be presented as discontinued operations.
Continued robust growth of HUMIRA in a broad range of indications, the acquisitions of Solvay’s pharmaceuticals business (Solvay Pharmaceuticals) and Piramal Healthcare Limited’s Healthcare Solutions business, continued growth and market penetration by the Xience drug eluting stent franchise, the loss of patent protection for some pharmaceutical products, an ongoing government investigation of Abbott’s sales and marketing activities related to Depakote, and the challenging economic environment in many countries around the world have impacted Abbott’s sales, costs and financial position over the last three years.
Pharmaceutical research and development is focused on therapeutic areas that include immunology, oncology, neuroscience, pain manage-ment, hepatitis C (HCV), chronic kidney disease and women’s health. During the last three years, Abbott acquired the rights to various in-process pharmaceutical research and development projects including the development of second-generation oral antioxidant inflammation modulators and a product for the treatment of chronic kidney disease.
In 2003, Abbott began the worldwide launch of HUMIRA for rheuma-toid arthritis, followed by launches for five additional indications, which increased HUMIRA’s worldwide sales to $7.9 billion in 2011 compared to $6.5 billion in 2010, and $5.5 billion in 2009. Abbott forecasts low double-digit growth for worldwide HUMIRA sales in 2012. Abbott is studying additional indications for HUMIRA. Substantial research and development and selling support has been and continues to be dedicated to maximizing the worldwide potential of HUMIRA. Abbott expects generic competition for TriCor to begin in the second half of 2012. Austerity measures implemented by several European countries reduced healthcare spending and affected pharmaceutical pricing in 2010 and 2011. The 2010 healthcare reform legislation in the U.S. resulted in rebate changes beginning in 2010 and the payment of an annual fee beginning in 2011, which negatively affected Abbott’s pharmaceutical business. The impact of the austerity measures and the U.S. healthcare reform legislation is expected to continue.
In February 2010, Abbott acquired Solvay Pharmaceuticals which provided Abbott with a large and complementary portfolio of pharma-ceutical products and expanded Abbott’s presence in key global emerging markets. The acquisition added approximately $3.1 billion to Abbott’s 2010 total sales, primarily outside the U.S. In September 2010, Abbott completed the acquisition of Piramal’s Healthcare Solutions business, propelling Abbott to market leadership in the Indian pharmaceutical market and further accelerating the company’s growth in emerging markets. In 2011 and 2010, Abbott recorded approximately $345 million and $710 million, respectively, of expense related to the integration of the Solvay business and a restructuring plan announced in September 2010 to streamline operations, improve efficiencies and reduce costs primarily in certain Solvay sites and functions. The restructuring plan is further described below. In 2011, Abbott recorded a litigation charge of $1.5 billion related to ongoing settlement discussions in the U.S. government’s investigation related to Depakote.
In Abbott’s worldwide nutritional products business, favorable economic development in emerging markets and an aging population in developed markets have provided significant opportunities to lever-age strong nutritional brands and introduce innovative products.
In the fourth quarter of 2008, Abbott’s Xience V product became the market-leading drug eluting stent in the U.S. In June 2009, Xience PRIME, Abbott’s next generation drug eluting stent, received CE Mark approval and was launched in Europe in August 2009. Abbott received approval to market Xience V in Japan in January 2010 and Xience V became the market-leading drug eluting stent in Japan in the second quarter of 2010. With the U.S. launches of Xience nano and Xience PRIME in May and November 2011, respectively, and continued strong performance in Japan, China, and other international markets, Xience, which includes Xience V, PRIME and nano, ended 2011 as the market-leading drug eluting stent globally. At the same time the third party distributor of the Promus product began transitioning away from the product and that distribution agreement will end in 2012.
In 2010, the U.S. government passed health care reform legislation which included an increase in Medicaid rebate rates and the extension of the rebate to drugs provided through Medicaid managed care organizations beginning in 2010. The legislation also imposed annual fees which pharmaceutical manufacturers began paying in 2011 and medical device companies will begin paying in 2013, as well as addi-tional rebates related to the Medicare Part D “donut hole” beginning in 2011. In addition to a 2010 one-time charge of approximately $60 million to reduce deferred tax assets associated with retiree health care liabilities related to the Medicare Part D retiree drug subsidy, the legislation’s negative impact on Abbott’s performance grew from more than $200 million in 2010 to approximately $400 million in 2011 and is expected to remain at approximately $400 million in 2012.
Abbott’s short- and long-term debt totaled $15.4 billion at December 31, 2011, largely incurred to finance acquisitions. Operating cash flows in excess of capital expenditures and cash dividends have partially funded acquisitions over the last three years. At December 31, 2011, Abbott’s long-term debt rating was AA by Standard and Poor’s Corporation and A1 by Moody’s Investors Service.
Financial Review
50
Abbott 2011 Annual Report
In 2012, Abbott will focus on several key initiatives. In the proprietary pharmaceutical business, Abbott will continue maximizing the market potential for HUMIRA and other products, including AndroGel, as well as continuing to build its global presence. Pharmaceutical research and development efforts will continue to focus a significant portion of expenditures on compounds for immunology, oncology, neuroscience, pain management, HCV, chronic kidney disease and women’s health. Current research and development projects are described in the Research and Development Programs section.
In the established pharmaceutical business which includes interna-tional sales of branded generic products, Abbott will continue to focus on obtaining additional product approvals across numerous countries and expanding its presence in emerging markets. In the vascular business, Abbott will continue to focus on marketing products in the Xience franchise, obtaining regulatory review of the MitraClip device in the U.S., and increasing international MitraClip sales as well as further clinical development of ABSORB, its bioresorbable vascular scaffold (BVS) device and a further roll-out of ABSORB in CE Mark countries. In Abbott’s other segments, Abbott will focus on developing or acquiring differentiated technologies in higher growth segments of those markets.
Critical Accounting Policies
Sales Rebates – Approximately 54 percent of Abbott’s consolidated gross revenues are subject to various forms of rebates and allowances that Abbott records as reductions of revenues at the time of sale. Most of these rebates and allowances are in the Proprietary Pharmaceutical Products segment and the Nutritional Products segment. Abbott pro-vides rebates to pharmacy benefit management companies, state agencies that administer the federal Medicaid program, insurance companies that administer Medicare drug plans, state agencies that administer the Special Supplemental Nutrition Program for Women, Infants, and Children (WIC), wholesalers, group purchasing organiza-tions, and other government agencies and private entities. Rebate amounts are usually based upon the volume of purchases using con-tractual or statutory prices for a product. Factors used in the rebate calculations include the identification of which products have been sold subject to a rebate, which customer or government agency price terms apply, and the estimated lag time between sale and payment of a rebate. Using historical trends, adjusted for current changes, Abbott estimates the amount of the rebate that will be paid, and records the liability as a reduction of gross sales when Abbott records its sale of the product. Settlement of the rebate generally occurs from two to 24 months after sale. Abbott regularly analyzes the historical rebate trends and makes adjustments to reserves for changes in trends and terms of rebate programs. Rebates and chargebacks charged against gross sales in 2011, 2010 and 2009 amounted to approximately $5.5 billion, $4.9 billion and $4.4 billion, respectively, or 22.2 percent, 23.1 percent and 23.8 percent, respectively, based on gross sales of approximately $24.8 billion, $21.1 billion and $18.4 billion, respectively, subject to rebate. A one-percentage point increase in the percentage of rebates to related gross sales would decrease net sales by approximately $248 million in 2011. Abbott considers a one-percentage point increase to be a reasonably likely increase in the percentage of rebates to related gross sales. Other allowances charged against gross sales were approximately $409 million, $415 million and $414 million for
cash discounts in 2011, 2010 and 2009, respectively, and $490 mil-lion, $537 million and $456 million for returns in 2011, 2010 and 2009, respectively. Cash discounts are known within 15 to 30 days of sale, and therefore can be reliably estimated. Returns can be reliably esti-mated because Abbott’s historical returns are low, and because sales returns terms and other sales terms have remained relatively unchanged for several periods.
Management analyzes the adequacy of ending rebate accrual bal-ances each quarter. In the domestic nutritional business, management uses both internal and external data available to estimate the level of inventory in the distribution channel. Management has access to sev-eral large customers’ inventory management data, and for other customers, utilizes data from a third party that measures time on the retail shelf. These sources allow management to make reliable esti-mates of inventory in the distribution channel. Except for a transition period before or after a change in the supplier for the WIC business in a state, inventory in the distribution channel does not vary substan-tially. Management also estimates the states’ processing lag time based on claims data. In addition, internal processing time is a factor in estimating the accrual. In the WIC business, the state where the sale is made, which is the determining factor for the applicable price, is reliably determinable. Estimates are required for the amount of WIC sales within each state where Abbott has the WIC business. External data sources utilized for that estimate are participant data from the U.S. Department of Agriculture (USDA), which administers the WIC program, participant data from some of the states, and internally administered market research. The USDA has been making its data available for many years. Internal data includes historical redemption rates and pricing data. At December 31, 2011, Abbott had the exclu-sive WIC business in 23 states.
In the domestic proprietary pharmaceutical business, the most significant charges against gross sales are for Medicaid and Medicare Rebates, Pharmacy Benefit Manager Rebates and Wholesaler Chargebacks. In order to evaluate the adequacy of the ending accrual balances, management uses both internal and external data to esti-mate the level of inventory in the distribution channel and the rebate claims processing lag time. External data sources used to estimate the inventory in the distribution channel include inventory levels period-ically reported by wholesalers and third party market data purchased by Abbott. Management estimates the processing lag time based on periodic sampling of claims data. To estimate the price rebate percent-age, systems and calculations are used to track sales by product by customer and to estimate the contractual or statutory price. Abbott’s systems and calculations have developed over time as rebates have become more significant, and Abbott believes they are reliable.
Financial Review
51
Abbott 2011 Annual Report
The following table is an analysis of the four largest rebate accruals, which comprise approximately 68 percent of the consolidated rebate provisions charged against revenues in 2011. Remaining rebate provisions charged against gross sales are not significant in the determination of operating earnings.
Domestic Proprietary
Pharmaceutical Products
Domestic Medicaid Pharmacy
Nutritionals and Benefit Wholesaler
WIC Medicare Manager Charge-
(dollars in millions) Rebates Rebates Rebates backs
Balance at
January 1, 2009 $ 162 $ 295 $ 228 $ 146
Provisions 747 563 505 1,134
Payments (756) (506) (494) (1,120)
Balance at
December 31, 2009 153 352 239 160
Provisions 616 899 841 1,162
Payments (640) (617) (670) (1,163)
Balance at
December 31, 2010 129 634 410 159
Provisions 575 985 831 1,361
Payments (568) (899) (735) (1,349)
Balance at
December 31, 2011 $ 136 $ 720 $ 506 $ 171
Historically, adjustments to prior years’ rebate accruals have not been material to net income. Abbott employs various techniques to verify the accuracy of claims submitted to it, and where possible, works with the organizations submitting claims to gain insight into changes that might affect the rebate amounts. For Medicaid, Medicare and other government agency programs, the calculation of a rebate involves interpretations of relevant regulations, which are subject to challenge or change in interpretation.
Income Taxes – Abbott operates in numerous countries where its income tax returns are subject to audits and adjustments. Because Abbott operates globally, the nature of the audit items are often very complex, and the objectives of the government auditors can result in a tax on the same income in more than one country. Abbott employs internal and external tax professionals to minimize audit adjustment amounts where possible. In accordance with the accounting rules relating to the measurement of tax contingencies, in order to recognize an uncertain tax benefit, the taxpayer must be more likely than not of sustaining the position, and the measurement of the benefit is calcu-lated as the largest amount that is more than 50 percent likely to be realized upon resolution of the benefit. Application of these rules requires a significant amount of judgment. In the U.S., Abbott’s federal income tax returns through 2008 are settled except for one item, and the income tax returns for years after 2008 are open. Abbott does not record deferred income taxes on earnings reinvested indefinitely in foreign subsidiaries.
Pension and Post‑Employment Benefits – Abbott offers pension benefits and post-employment health care to many of its employees. Abbott engages outside actuaries to assist in the determination of the obligations and costs under these programs. Abbott must develop long-term assumptions, the most significant of which are the health
care cost trend rates, discount rates and the expected return on plan assets. The discount rates used to measure liabilities were determined based on high-quality fixed income securities that match the duration of the expected retiree benefits. The health care cost trend rates represent Abbott’s expected annual rates of change in the cost of health care benefits and is a forward projection of health care costs as of the measurement date. A difference between the assumed rates and the actual rates, which will not be known for decades, can be significant in relation to the obligations and the annual cost recorded for these programs. Low asset returns due to poor market conditions and low interest rates have significantly increased actuarial losses for these plans. At December 31, 2011, pretax net actuarial losses and prior service costs and (credits) recognized in Accumulated other comprehensive income (loss) for Abbott’s defined benefit plans and medical and dental plans were losses of $3.8 billion and $237 million, respectively. Actuarial losses and gains are amortized over the remain-ing service attribution periods of the employees under the corridor method, in accordance with the rules for accounting for post-employ-ment benefits. Differences between the expected long-term return on plan assets and the actual annual return are amortized over a five-year period. Note 4 to the consolidated financial statements describes the impact of a one-percentage point change in the health care cost trend rate; however, there can be no certainty that a change would be limited to only one percentage point.
Valuation of Intangible Assets – Abbott has acquired and continues to acquire significant intangible assets that Abbott records at fair value. Transactions involving the purchase or sale of intangible assets occur with some frequency between companies in the health care field and valuations are usually based on a discounted cash flow analysis. The discounted cash flow model requires assumptions about the timing and amount of future net cash flows, risk, the cost of capital, terminal values and market participants. Each of these factors can significantly affect the value of the intangible asset. Abbott engages independent valuation experts who review Abbott’s critical assump-tions and calculations for acquisitions of significant intangibles. Abbott reviews definite-lived intangible assets for impairment each quarter using an undiscounted net cash flows approach. If the undiscounted cash flows of an intangible asset are less than the carrying value of an intangible asset, the intangible asset is written down to its fair value, which is usually the discounted cash flow amount. Where cash flows cannot be identified for an individual asset, the review is applied at the lowest group level for which cash flows are identifiable. Goodwill and indefinite-lived intangible assets, which relate to in-process research and development acquired in a business combination, are reviewed for impairment annually or when an event that could result in an impairment occurs. At December 31, 2011, goodwill and intangibles amounted to $15.7 billion and $10.0 billion, respectively, and amortiza-tion expense for intangible assets amounted to $1.6 billion in 2011. There were no impairments of goodwill in 2011, 2010 or 2009. In 2011, Abbott recorded impairment charges of $174 million for certain research and development assets due to changes in the projected development and regulatory timelines for the projects.
Litigation – Abbott accounts for litigation losses in accordance with FASB Accounting Standards Codification No. 450, “Contingencies.” Under ASC No. 450, loss contingency provisions are recorded for probable losses at management’s best estimate of a loss, or when a best estimate cannot be made, a minimum loss contingency amount
Financial Review

52
Abbott 2011 Annual Report
is recorded. These estimates are often initially developed substantially earlier than the ultimate loss is known, and the estimates are refined each accounting period as additional information becomes known. Accordingly, Abbott is often initially unable to develop a best estimate of loss, and therefore the minimum amount, which could be zero, is recorded. As information becomes known, either the minimum loss amount is increased, resulting in additional loss provisions, or a best estimate can be made, also resulting in additional loss provisions. Occasionally, a best estimate amount is changed to a lower amount when events result in an expectation of a more favorable outcome than previously expected. Abbott estimates the range of possible loss to be from approximately $1.59 billion to $1.63 billion for its legal proceedings and environmental exposures. Reserves of approximately $1.6 billion have been recorded at December 31, 2011 for these proceedings and exposures. These reserves represent management’s best estimate of probable loss, as defined by FASB ASC No. 450, “Contingencies.”
Results of Operations
Sales
The following table details the components of sales growth by reportable segment for the last three years:
Total % Components of Change %
Change Price Volume Exchange
Total Net Sales
2011 vs. 2010 10.5 1.2 6.5 2.8
2010 vs. 2009 14.3 (0.1) 13.2 1.2
2009 vs. 2008 4.2 (0.1) 8.3 (4.0)
Total U.S.
2011 vs. 2010 5.4 4.4 1.0 —
2010 vs. 2009 6.8 0.7 6.1 —
2009 vs. 2008 0.4 (0.3) 0.7 —
Total International
2011 vs. 2010 14.3 (1.2) 10.6 4.9
2010 vs. 2009 20.7 (0.8) 19.3 2.2
2009 vs. 2008 7.7 0.2 15.1 (7.6)
Proprietary Pharmaceutical Products Segment
2011 vs. 2010 11.0 3.5 5.2 2.3
2010 vs. 2009 13.2 0.3 12.3 0.6
2009 vs. 2008 0.2 (0.2) 4.0 (3.6)
Established Pharmaceutical Products Segment
2011 vs. 2010 19.8 (1.7) 17.2 4.3
2010 vs. 2009 53.7 (0.3) 51.1 2.9
2009 vs. 2008 (7.6) 0.4 (1.1) (6.9)
Nutritional Products Segment
2011 vs. 2010 8.6 3.0 3.6 2.0
2010 vs. 2009 4.7 1.7 1.2 1.8
2009 vs. 2008 7.3 1.5 8.6 (2.8)
Diagnostic Products Segment
2011 vs. 2010 8.8 (1.1) 6.5 3.4
2010 vs. 2009 6.0 0.1 4.3 1.6
2009 vs. 2008 0.1 1.4 3.7 (5.0)
Vascular Products Segment
2011 vs. 2010 4.4 (4.3) 5.5 3.2
2010 vs. 2009 18.6 (4.7) 22.3 1.0
2009 vs. 2008 20.1 (2.9) 26.0 (3.0)
In 2011 and 2010, Total Net, Total U.S., Total International, Proprietary Pharmaceutical Products segment and Established Pharmaceutical Products segment sales reflect the acquisition of Solvay’s pharmaceuti-cals business on February 15, 2010 and unit growth, while the relatively weaker U.S. dollar favorably impacted international sales across all segments. Total Net, Total International and Established Pharmaceutical Products segment sales growth in 2011 also reflects the acquisition of Piramal Healthcare Limited’s Healthcare Solution business in September 2010. Total Net Sales growth in 2009 reflects unit growth and the acquisi-tion of Advanced Medical Optics, Inc. on February 25, 2009, partially offset by the negative effect of the relatively stronger U.S. dollar. Total Net, Total U.S. and Proprietary Pharmaceutical Products segment sales in 2009 also reflect decreased sales of Depakote due to generic competition. Excluding U.S. Depakote sales, Total Net sales increased 7.7 percent, Total U.S. sales increased 7.6 percent and Proprietary Pharmaceutical Products segment sales increased 7.8 percent from 2008 to 2009.
A comparison of significant product and product group sales is as follows. Percent changes are versus the prior year and are based on unrounded numbers.
Percent Percent Percent
(dollars in millions) 2011 Change 2010 Change 2009 Change
Proprietary Pharmaceuticals —
Total U.S.
Proprietary sales $9,455 8 $8,744 12 $7,794 (8)
HUMIRA 3,427 19 2,872 14 2,520 12
TRILIPIX/TriCor 1,372 1 1,355 1 1,337 —
Niaspan 976 5 927 8 855 9
AndroGel 874 35 649 n/m — —
Lupron 540 12 483 (11) 540 43
Synthroid 522 16 451 9 415 (5)
Kaletra 326 (10) 363 (19) 447 (13)
Total International
Proprietary sales 7,567 15 6,587 15 5,751 14
HUMIRA 4,505 23 3,676 24 2,969 31
Kaletra 844 (5) 892 (3) 920 (4)
Lupron 270 2 265 2 260 (5)
Total Established
Pharmaceuticals — 5,413 20 4,519 54 2,941 (8)
Clarithromycin 542 4 521 (11) 587 (8)
TriCor and Lipanthyl
(fenofibrate) 320 29 248 n/m 22 5
Creon 296 58 187 n/m — —
Serc 233 30 180 n/m — —
Duphaston 223 64 136 n/m — —
Synthroid 116 12 104 20 87 (3)
Nutritionals —
U.S. Pediatric Nutritionals 1,268 5 1,208 (7) 1,306 3
International Pediatric
Nutritionals 1,926 15 1,676 9 1,543 12
U.S. Adult Nutritionals 1,368 2 1,345 6 1,269 9
International Adult
Nutritionals 1,427 13 1,268 15 1,106 3
Diagnostics —
Immunochemistry 3,150 8 2,904 4 2,798 (2)
Vascular Products —
Coronary Stents 2,078 4 2,007 24 1,618 35
n/m – Percent change is not meaningful
Financial Review

53
Abbott 2011 Annual Report
The increases in U.S. Proprietary product sales in 2011 and 2010 are primarily due to increased sales of HUMIRA and the acquisition of Solvay Pharmaceuticals in February 2010, partially offset by decreased sales of Depakote and Zemplar. U.S. Proprietary product sales in 2009 were impacted by decreased sales of Depakote due to generic com-petition, partially offset by increased sales of HUMIRA and the addition of Lupron sales from the conclusion of the TAP joint venture in April 2008. U.S. sales of Depakote were $148 million, $161 million and $331 million in 2011, 2010 and 2009, respectively. Worldwide sales of Kaletra in all three years were negatively affected by market competi-tion. International Proprietary product sales in all three years were favorably impacted by increased sales of HUMIRA. The increases in Established Pharmaceutical sales in 2011 and 2010 are primarily due to the acquisitions of Solvay Pharmaceuticals and Piramal and growth in emerging markets. U.S. Pediatric Nutritionals sales in 2011 and 2010 were affected by the voluntary recall of certain Similac-brand powder infant formulas in September 2010 and the subsequent recovery in market share in 2011. International Pediatric and Adult Nutritionals sales increases over the three years were due primarily to volume growth in developing countries. International Proprietary Pharmaceuticals, International Adult Nutritionals and Immunochemistry sales in 2011 and 2010 were positively impacted by the effect of the relatively weaker U.S. dollar and were negatively impacted in 2009 by the effect of the relatively stronger U.S. dollar. Abbott has periodically sold product rights to non-strategic products and has recorded the related gains in net sales in accordance with Abbott’s revenue recogni-tion policies as discussed in Note 1 to the consolidated financial statements. Related net sales were approximately $58 million and $120 million in 2010 and 2009, respectively, while there were no significant sales in 2011.
The expiration of licenses, patent protection and generic competition can affect the future revenues and operating income of Abbott. There are currently no significant patent or license expirations in the next three years. Under a license agreement for TriCor 145 mg, generic competition is not expected before July 2012. Under a license agree-ment for Trilipix 45 mg and 135 mg, generic competition may begin in January 2014 except that under certain circumstances the license may commence as early as July 2013. Under an agreement relating to Abbott’s niacin products and acquired with the Kos Pharmaceuticals acquisition, Niaspan may become subject to generic competition in September 2013. AndroGel 1% sales are expected to be impacted by generic competition in 2015.
Operating Earnings
Gross profit margins were 60.0 percent of net sales in 2011, 58.3 per-cent in 2010 and 57.1 percent in 2009. The increase in the gross profit margin in 2011 was due, in part, to improved margins in the estab-lished pharmaceutical, diagnostics and diabetes businesses and was partially offset by the unfavorable effect of exchange on the profit margin ratio. The increase in the gross profit margin in 2010 was due, in part, to improved margins in the established pharmaceutical, vascular, diabetes, diagnostics and nutritional businesses and the favorable effect of exchange on the gross profit margin ratio. The decrease in the gross profit margin in 2009 was due, in part, to the negative impact from lower sales of Depakote and the unfavorable effect of exchange on the gross profit margin ratio; partially offset by improved margins in the vascular and diagnostics businesses.
In the U.S., states receive price rebates from manufacturers of infant formula under the federally subsidized Special Supplemental Nutrition Program for Women, Infants, and Children. There are also rebate programs for pharmaceutical products. These rebate programs continue to have a negative effect on the gross profit margins of the Nutritional, Proprietary Pharmaceutical and Established Pharmaceutical Products segments.
Research and development expense was $4.129 billion in 2011, $3.724 billion in 2010 and $2.744 billion in 2009 and represented increases of 10.9 percent in 2011, 35.7 percent in 2010 and 2.0 per-cent in 2009. Excluding charges related to the Solvay restructurings announced in September 2010, research and development expense increased 29.4 percent in 2010 and 6.2 percent in 2011. The 2010 increase, exclusive of the effects of the restructuring charges, reflects the acquisitions of Solvay’s pharmaceuticals business in February 2010 and Facet Biotech in April 2010. The increase in 2009 reflects the favorable effect of exchange rates which reduced research and development expense in 2009. Excluding the effect of exchange, research and development expenses increased 3.4 percent in 2009. The increases in 2011, 2010 and 2009 also reflect continued pipeline spending, including programs in vascular devices, biologics, neuroscience, oncology and hepatitis C. The majority of research and development expenditures are concentrated on pharmaceutical products. $2.8 billion of Abbott’s 2011 research and development expenses related to Abbott’s pharmaceutical products, of which $2.2 billion was directly allocated to the Proprietary Pharmaceutical Products segment. In 2011, research and development expenditures totaled $403 million for the Vascular Products segment, $325 million for the Diagnostics Products segment, $251 million for the Established Pharmaceutical Products segment and $165 million for the Nutritional Products segment.
Selling, general and administrative expenses increased 22.9 percent in 2011, increased 23.4 percent in 2010 and decreased 0.4 percent in 2009. The U.S. Department of Justice through the United States Attorney for the Western District of Virginia is investigating Abbott’s sales and marketing activities for Depakote. In 2011, Abbott recorded a litigation charge of $1.5 billion related to ongoing settlement discussions in this investigation. Excluding the litigation charge and Solvay-related restructuring and integration costs, selling, general and administrative expenses increased 6.7 percent in 2011. Excluding charges related to Solvay restructuring and integration projects, selling, general and administrative expenses in 2010 increased 18.2 percent. This increase, exclusive of the effects of the restructuring and integra-tion charges, reflects the acquisitions of Solvay’s pharmaceuticals business in 2010 and Advanced Medical Optics, Inc. in 2009 and higher provisions for litigation in 2010. The 2009 decrease reflects the favorable effect of exchange rates which was offset by expenses relating to the acquisition of Advanced Medical Optics, Inc. and the settlement of litigation. Excluding the effects of the charges and exchange, selling, general and administrative expenses increased 0.9 percent in 2009. The remaining increases in selling, general and administrative expenses over the three year period were due primarily to increased selling and marketing support for new and existing prod-ucts, including continued spending for HUMIRA, inflation, and in 2010, the impact of the pharmaceutical fee imposed by U.S. healthcare reform legislation.
Financial Review
54
Abbott 2011 Annual Report
Restructurings
In 2011 and prior years, Abbott management approved plans to realign its worldwide pharmaceutical and vascular manufacturing operations and selected domestic and international commercial and research and development operations in order to reduce costs. In 2011, 2010 and 2009, Abbott recorded charges of approximately $194 million, $56 million and $114 million, respectively, reflecting the impairment of manufacturing facilities and other assets, employee severance and other related charges. Approximately $76 million in 2011 is classified as Cost of products sold, $69 million as Research and development and $49 million as Selling, general and administra-tive. Approximately $56 million in 2010 is classified as Cost of products sold and $114 million in 2009 as Selling, general and admin-istrative. The following summarizes the activity for these restructurings:
(dollars in millions)
Accrued balance at January 1, 2009 $ 105
2009 restructuring charges 114
Payments, impairments and other adjustments (74)
Accrued balance at December 31, 2009 145
2010 restructuring charges 56
Payments, impairments and other adjustments (124)
Accrued balance at December 31, 2010 77
2011 restructuring charges 194
Payments and other adjustments (94)
Accrued balance at December 31, 2011 $ 177
An additional $25 million, $13 million and $47 million were recorded in 2011, 2010 and 2009, respectively, relating to these restructurings, primarily for accelerated depreciation.
In 2010, Abbott management approved a restructuring plan primarily related to the acquisition of Solvay’s pharmaceuticals business. This plan streamlines operations, improves efficiencies and reduces costs in certain Solvay sites and functions as well as in certain Abbott and Solvay commercial organizations in various countries. Under this plan, Abbott recorded charges to Cost of products sold, Research and development and Selling, general and administrative of approximately $99 million, $152 million and $272 million, respectively. The following summarizes the activity for this restructuring:
(dollars in millions)
2010 restructuring charge $ 523
Payments, impairments and other adjustments (113)
Accrued balance at December 31, 2010 410
Payments and other adjustments (302)
Accrued balance at December 31, 2011 $ 108
An additional $102 million and $12 million were recorded in 2011 and 2010, respectively, relating to this restructuring, primarily for additional employee severance and accelerated depreciation.
In 2011 and 2008, Abbott management approved plans to streamline global manufacturing operations, reduce overall costs, and improve efficiencies in Abbott’s core diagnostic business. In 2011 a charge of $28 million was recorded in Cost of products sold. The following summarizes the activity for these restructurings:
(dollars in millions)
Accrued balance at January 1, 2009 $110
Payments and other adjustments (12)
Accrued balance at December 31, 2009 98
Payments and other adjustments (10)
Accrued balance at December 31, 2010 88
2011 restructuring charge 28
Payments and other adjustments (37)
Accrued balance at December 31, 2011 $ 79
In addition, charges of approximately $42 million, $60 million and $54 million were recorded in 2011, 2010 and 2009, primarily for accel-erated depreciation and product transfer costs. Additional charges will be incurred through 2012 as a result of product re-registration timelines required under manufacturing regulations in a number of countries and product transition timelines.
Interest expense and Interest (income)
In 2011, interest expense decreased due to lower debt levels and interest income decreased as a result of lower rates. In 2010, interest expense increased due primarily to increased debt levels. In 2009, interest expense decreased primarily as a result of lower interest rates, partially offset by increased debt levels related to the acquisition of Advanced Medical Optics, Inc. Interest income decreased in 2010 due to lower investment balances and decreased in 2009 due to lower interest rates.
Change in Accounting Principle and Other (income) expense, net
Prior to January 1, 2011, the accounts of foreign subsidiaries were consolidated based on a fiscal year ended November 30 due to the time needed to consolidate these subsidiaries. Effective January 1, 2011, the one month lag in the consolidation of the accounts of foreign subsidiaries was eliminated and the year-end of foreign subsid-iaries was changed to December 31. Abbott believes that the change in accounting principle related to the elimination of the one month reporting lag is preferable because it will result in more contemporane-ous reporting of the results of foreign subsidiaries. In accordance with applicable accounting literature, a change in subsidiaries’ year-end is treated as a change in accounting principle and requires retrospective application. The cumulative effect of the change was an increase in retained earnings of $289 million as of January 1, 2009 and a corre-sponding decrease in other long-term liabilities. The impact of the change was not material to the results of operations for the previously reported annual and interim periods after January 1, 2009, and thus, those results have not been revised. A charge of $137 million was recorded to Other (income) expense, net in 2011 to recognize the cumulative immaterial impacts to 2009 and 2010. Had the financial statements been revised, net sales, operating earnings and net earn-ings in 2009 would have increased by $211 million, $36 million and $38 million, respectively, and net sales, operating earnings and net earnings in 2010 would have decreased by $21 million, $195 million and $175 million, respectively.
Financial Review
55
Abbott 2011 Annual Report
Other (income) expense, net, for 2011 includes $56 million of fair value adjustments and accretion in the contingent consideration related to the acquisition of Solvay’s pharmaceutical business. Other (income) expense, net, for 2009 includes the derecognition of a contingent liability of $797 million associated with the conclusion of the TAP Pharmaceutical Products Inc. joint venture. The contingent liability was established at the conclusion of the joint venture as Abbott agreed to remit cash to Takeda if certain research and development events were not achieved on the development assets retained by Takeda. In 2009, the research and development events were achieved and the contin-gent liability was derecognized. In addition, Other (income) expense, net for 2009 includes a $287 million gain from the settlement reached between Abbott and Medtronic, Inc. resolving all outstanding intellec-tual property litigation between the two parties and income from the recording of certain investments at fair value in connection with business acquisitions. Other (income) expense, net, for 2011, 2010 and 2009 also includes ongoing contractual payments from Takeda associated with the conclusion of the TAP joint venture.
Taxes on Earnings
The income tax rates on earnings were 9.0 percent in 2011, 19.0 per-cent in 2010 and 20.1 percent in 2009. Taxes on earnings in 2011 reflect the effect of the tax rate applied to a litigation reserve and the recognition of $580 million of tax benefits as a result of the favorable resolution of various tax positions pertaining to prior years, which also decreased the gross amount of unrecognized tax benefits by approxi-mately $1.3 billion. Exclusive of these discrete items, the effective rates are lower than the U.S. federal statutory rate of 35 percent due primar-ily to the benefit of lower foreign tax rates and tax exemptions that reduced the tax rates by 22.9, 19.4, and 16.4 percentage points in 2011, 2010 and 2009, respectively. The tax rate reductions are primar-ily derived from operations in Puerto Rico, Switzerland, Ireland and Singapore where Abbott benefits from a combination of favorable stat-utory tax rules, tax rulings, grants, and exemptions. See Note 5 to the consolidated financial statements for a full reconciliation of the effective tax rate to the U.S. federal statutory rate.
As a result of the Patient Protection and Affordable Care Act and the Health Care and Education Reconciliation Act which were signed into law in 2010, Abbott recorded a charge of approximately $60 million in 2010 to reduce deferred tax assets associated with retiree health care liabilities related to the Medicare Part D retiree drug subsidy. The tax rate in 2009 was affected by a higher tax rate applied to the derecog-nition of a contingent liability associated with the conclusion of the TAP Pharmaceutical Products Inc. joint venture and the Medtronic intellectual property litigation settlement.
In October 2010, Puerto Rico enacted legislation that assesses a tax beginning in 2011 on certain products manufactured in Puerto Rico. This excise tax is recorded in Cost of products sold although the tax is creditable for U.S. income tax purposes.
Research and Development Programs
Abbott currently has numerous pharmaceutical, medical and nutritional products in development.
Research and Development Process
In the Proprietary Pharmaceuticals segment, the research and devel-opment process generally begins with discovery research which focuses on the identification of a molecule that has a desired effect against a given disease. If preclinical testing of an identified compound proves successful, the compound moves into clinical development which generally includes the following phases:
• PhaseI–involvesthefirsthumantestsinasmallnumberofhealthyvolunteers to assess tolerability and potential dosing.
• PhaseII–teststhemolecule’sefficacyagainstthedisease in a small group of patients.
• PhaseIII–testsamoleculethatdemonstratesfavorableresults in the earlier phases in a significantly larger patient population to further demonstrate efficacy and safety based on regulatory criteria.
The clinical trials from all of the development phases provide the data required to prepare and submit a New Drug Application (NDA), a Biological License Application (BLA) or other submission for regulatory approval to the U.S. Food and Drug Administration (FDA) or similar government agencies outside the U.S. The specific requirements (e.g., scope of clinical trials) for obtaining regulatory approval vary across different countries and geographic regions.
The research and development process from discovery through a new drug launch typically takes 8 - 12 years and can be even longer. There is a significant amount of uncertainty inherent in the research and development of new pharmaceutical products and there is no guarantee when, or if, a molecule will receive the regulatory approval required to launch a new drug or indication.
In addition to the development of new products and new formulations, proprietary pharmaceutical research and development projects also may include Phase IV trials, sometimes called post-marketing studies. For such projects, clinical trials are designed and conducted to collect additional data regarding, among other parameters, the benefits and risks of an approved drug.
In the Established Pharmaceuticals segment, the research and devel-opment process focuses on the geographic expansion and continuous improvement of the segment’s existing products to provide Improved Therapeutic Benefits (ITBs) to patients and customers. As Established Pharmaceuticals does not actively pursue primary research, develop-ment usually begins with work on existing products or after the acquisition of an advanced stage licensing opportunity.
Depending upon the product, the phases of development may include:
• Drugproductdevelopment
• PhaseIbioequivalencestudiestocompareafutureEstablishedPharmaceutical’s brand with an already marketed compound with the same active pharmaceutical ingredient (API).
• PhaseIIstudiestotesttheefficacyofanITBinasmallgroup of patients.
• PhaseIIIstudiestobroadenthetestingtoawiderpopulationthatreflects the actual medical use.
The specific requirements (e.g. scope of clinical trials) for obtaining regu-latory approval vary across different countries and geographic regions. The process may range from one year for a bioequivalence study project to 6 or more years for complex formulations and new indications.
Financial Review
56
Abbott 2011 Annual Report
In addition to the development of new ITBs, development projects may also include Phase IV studies similar to the post-marketing studies described above for proprietary pharmaceuticals.
In the Diagnostics segment, the phases of the research and development process include:
• Discoverywhichfocusesonidentificationofaproductthatwilladdress a specific therapeutic area, platform, or unmet clinical need,
• Concept/Feasibilityduringwhichthematerialsandmanufacturingprocesses are evaluated, testing may include product characteriza-tion and analysis is performed to confirm clinical utility, and
• Developmentduringwhichextensivetestingisperformedto demonstrate that the product meets specified design requirements and that the design specifications conform to user needs and intended uses.
As with pharmaceutical products, the regulatory requirements for diagnostic products vary across different countries and geographic regions. In the U.S., the FDA classifies diagnostic products into classes (I, II, or III) and the classification determines the regulatory process for approval. While the Diagnostics segment has products in all three classes, the vast majority of its products are categorized as Class I or Class II. Submission of a separate regulatory filing is not required for Class I products. Class II devices typically require pre-market notification to the FDA through a regulatory filing known as a 510(k) submission. Most Class III products are subject to the FDA’s Pre-Marketing Approval (PMA) requirements. Other Class III products, such as those used to screen blood, require the submission and approval of a BLA.
In the EU, diagnostic products are also categorized into different cate-gories and the regulatory process, which is governed by the European In Vitro Diagnostic Medical Device Directive, depends upon the cate-gory. Certain product categories require review and approval by an independent company, known as a Notified Body, before the manufac-turer can affix a CE mark to the product to show compliance with the Directive. Other products only require a self-certification process.
In the Vascular segment, the research and development process begins with research on a specific technology that is evaluated for feasibility and commercial viability. If the research program passes that hurdle, it moves forward into development. The development process includes evaluation and selection of a product design, completion of clinical trials to test the product’s safety and efficacy, and validation of the manufacturing process to demonstrate its repeatability and ability to consistently meet pre-determined specifications.
Similar to the diagnostic products discussed above, in the U.S., vascular products are classified as Class I, II, or III. Most of Abbott’s vascular products are classified as Class II devices that follow the 510(k) regulatory process or Class III devices that are subject to the PMA process.
In the EU, vascular products are also categorized into different classes and the regulatory process, which is governed by the European Medical Device Directive, varies by class. Each product must bear a CE mark to show compliance with the Directive. Some products require submission of a design dossier to the appropriate regulatory authority for review and approval prior to CE marking of the device. For other products, the company is required to prepare a technical file
which includes testing results and clinical evaluations but can self- certify its ability to apply the CE mark to the product. Outside the U.S. and the EU, the regulatory requirements vary across different countries and regions.
After approval and commercial launch of some vascular products, post-market trials may be conducted either due to a conditional requirement of the regulatory market approval or with the objective of proving product superiority.
In the Nutritional segment, the research and development process generally focuses on identifying and developing ingredients and products that address the nutritional needs of particular populations (e.g., infants, athletes) or patients (e.g., people with diabetes). Depending upon the country and/or region, if claims regarding a product’s efficacy will be made, clinical studies typically must be conducted. Most other product development, such as a product form change from liquid to powder, generally does not necessitate clinical studies.
In the U.S., the FDA requires that it be notified of proposed new formulations and formulation or packaging changes related to infant formula products. Prior to the launch of an infant formula or product packaging change, the company is required to obtain the FDA’s confirmation that it has no objections to the proposed product or packaging. For other nutrition products, notification or pre-approval from the FDA is not required unless the product includes a new food additive. In some countries, regulatory approval may be required for certain nutritional products, including infant formula and medical nutritional products.
Areas of Focus
Abbott’s significant areas of therapeutic focus include the following:
Proprietary Pharmaceutical Products –
Immunology – Projects are ongoing to identify new mechanisms with the potential to treat an array of immune-mediated diseases. Projects include early stage work in oral DMARD therapies and a number of biologic candidates. ABT-122 and ABT-981 are both dual variable domain immunoglobulins in Phase I clinical trials with potential to be disease modifying anti-arthritic drugs.
Additional indications of HUMIRA have registration submissions under review, including ankylosing spondylitis in China where the registration filing was submitted in September 2011 and pediatric Crohn’s disease where the European Union (EU) registration was submitted in October 2011 and the U.S. submission is expected in mid-2012. Global regula-tory applications for ulcerative colitis were submitted in early 2011. Phase III trials are ongoing for ulcerative colitis in Japan, uveitis in the U.S., EU and Japan, peripheral and axial spondyloarthritis in the U.S. and EU, and hidradenitis suppurativa in the U.S. and EU. Approval for juvenile idiopathic arthritis was obtained in July 2011 for Japan.
Neuroscience/Pain – Abbott is focused on the development of compounds that target receptors in the brain that help regulate neuro-logical functions to address conditions such as Alzheimer’s disease, schizophrenia, pain, Parkinson’s disease and multiple sclerosis (MS). These efforts include four compounds directed toward the treatment of Alzheimer’s disease. Abbott expects ABT-126 to start Phase IIb studies in the first half of 2012, ABT-354 to enter Phase IIa in late 2012 or early 2013, ABT-363 to complete Phase I in late 2012, and ABT-957
Financial Review
57
Abbott 2011 Annual Report
Financial Review
to start Phase I in the first half of 2012. Daclizumab, a next-generation antibody, is in ongoing Phase III clinical trials for relapsing remitting MS. ABT-652 is under development for the treatment of multiple pain indica-tions with Phase IIb clinical trials expected to start in June 2012. Duopa is completing its U.S. Phase III program for Parkinson’s disease and a registration is expected to be submitted in the second half of 2012.
Oncology – Abbott is focused on the development of targeted treatments that inhibit tumor growth and improve response to common cancer therapies. Abbott has new molecular entities in development for more than a dozen types of cancer including:
• ABT-888,aPARP-inhibitor,forwhichPhaseIIevaluationisongoing for a number of specific tumor types.
• Elotuzumabunderacollaborationagreementacquiredaspartofthe Facet Biotech acquisition in 2010. Abbott began Phase III devel-opment of elotuzumab for the treatment of multiple myeloma with its partner in June 2011.
• ABT-199,anext-generationBcl-2inhibitorcurrentlyinPhaseIdevelopment being studied for chronic lymphocytic leukemia (CLL) and non-Hodgkin’s lymphoma (NHL).
Hepatitis C – Abbott’s antiviral program is focused on developing treat-ments for hepatitis C (HCV) and development is ongoing for ABT-450, part of the Enanta collaboration, polymerase inhibitor ABT-333, and ABT-267, a NS5A inhibitor.
Women’s Health – In 2010, Abbott entered into a collaboration agreement with Neurocrine to develop and commercialize elagolix, an oral gonadotropin-releasing hormone (GnRH) antagonist, for the treatment of endometriosis-related pain and fibroids. A Phase III study in endometriosis is expected to begin in mid-2012 and a Phase IIa study for uterine fibroids was initiated in November 2011.
Chronic Kidney Disease – In 2010, Abbott entered into an agreement with Reata Pharmaceuticals for ex-U.S. rights, excluding certain Asian markets, to bardoxolone, an investigational treatment for chronic kid-ney disease (CKD). A global Phase III trial was initiated in June 2011. A global Phase IIb study was initiated for atrasentan in June 2011.
In 2011, new formulations of Abbott’s existing pharmaceutical prod-ucts were approved, including Lupron 6-month depot in June and 3-month depot in August in the U.S. A new strength for Creon was approved in the U.S. in June and AndroGel 1.62% was approved in April in the U.S. Work is also continuing on numerous early-stage programs, including the biologic acquired from Pangenetics for chronic pain in late 2009, a cMet antibody for cancer in partnership with Pierre Fabre SA, and other programs across all of Abbott’s therapeutic areas of focus.
Established Pharmaceuticals - Abbott is currently working on active ITB plans for about 20 - 30 key brands. Depending on the product, the development activities focus on new markets, formulations, combinations, or indications.
Vascular – Ongoing projects in the pipeline include:
• Xience Xpedition, our next-generation drug-eluting stent (DES) with enhanced deliverability and an expanded size matrix. It utilizes the Xience PRIME stent, everolimus and biocompatible coating
technology but incorporates new catheter technology for improved deliverability. Submission of the product for CE Mark and U.S. approval is projected to occur in 2012.
• ABSORB, a bioresorbable vascular scaffold (BVS) device for the treatment of coronary artery disease that is gradually resorbed into the vessel wall. In 2011 Abbott released five-year data from its ABSORB clinical trial, which showed efficacy and safety results consistent with the four-year data. In 2010, Abbott initiated the ABSORB EXTEND clinical trial which will enroll up to 1,000 patients with more complex coronary artery disease. In 2011 after receiving CE Mark approval for ABSORB, Abbott initiated a randomized, controlled clinical trial to further study the device in an expanded population in Europe. A global trial, including the U.S. and other geographies, is planned for later in 2012.
• MitraClip device for the treatment of mitral regurgitation – Abbott’s MitraClip system which is on the market in Europe is currently under review for approval by the FDA. An amended filing to the FDA was submitted in December 2011.
• Coronaryandendovascularcoreproductprojects,includingnewcoronary and endovascular guide wires, and the Absolute Pro and Omnilink Elite stent for iliac indication in the U.S., are at various stages of development and/or undergoing regulatory approvals.
Medical Optics – Abbott is expanding its proprietary laser platforms into new vision correction applications, including laser refractive cata-ract surgery. Abbott has also developed a new diagnostic instrument and laser treatment planning software which is designed to improve visual outcomes. This instrument and software received CE Mark in November 2011 and will be launched in Europe in the second quarter of 2012. A PMA filing for U.S. regulatory approval is targeted for sub-mission in the second quarter of 2012. A PMA filing for an ophthalmic viscoelastic for the U.S. market was submitted to the FDA in February 2011 and is currently under review. Abbott is also developing new products for patients undergoing cataract surgery, including: the Synchrony intraocular lens (IOL) designed to mimic the eye’s natural ability to change focus and deliver improved vision at all distances; advanced IOLs that address astigmatism as well as presbyopia; IOL insertion systems that improve surgeon efficiency and enable implan-tation through smaller incision sizes; and feature enhancements to phacoemulsification systems.
Molecular Diagnostics – Numerous new molecular diagnostic prod-ucts, including oncology and infectious disease assays as well as a new instrument system, are currently under development. Abbott’s companion diagnostic test for an ALK gene rearrangement test for non-small-cell lung cancer was launched in the U.S. in 2011 and is currently in clinical trials and undergoing regulatory review in numerous other countries. In 2011, an assay to aid in the management of HCV-infected patients undergoing antiviral therapy received U.S. regulatory approval and additional assays to detect the presence of HIV virus and CMV viral load as well as a test to detect hepatitis B drug resistance in patients received CE Mark.
Core Laboratory Diagnostics – Abbott is researching dozens of novel biomarkers focusing on areas such as infectious disease, oncology, cardiac and neuroscience disorders and also has several next-genera-tion instrument systems in development.
58
Abbott 2011 Annual Report
Financial Review
Diabetes Care – Abbott submitted its FreeStyle InsuLinx blood glucose monitoring system that includes new features designed to support the insulin-using patient for regulatory approval in the U.S. in June 2011. After receiving CE Mark for this system in May 2011 and Health Canada approval in October 2011, Abbott is continuing to provide R&D support as the product is launched in additional markets. Development is also continuing on an updated hospital blood glucose monitoring system for which filings for approval are projected to be submitted in the U.S. and Europe during the first half of 2013. Abbott is also developing a next-generation monitoring system under the Precision product platform. Abbott anticipates submitting filings for approval in various markets in 2013.
Nutrition – Abbott is focusing its research and development spend on six benefit platforms that span the pediatric, adult and performance nutrition areas: immunity, cognition, lean body mass, inflammation, metabolism and tolerance. Numerous new products that build on advances in these benefit platforms are currently under development and are expected to be launched in 2012.
Given the diversity of Abbott’s business, its intention to remain a broad-based healthcare company and the numerous sources for potential future growth, no individual project is expected to be material to cash flows or results of operations over the next five years. Factors considered included research and development expenses projected to be incurred for the project (compound or device) over the next year relative to Abbott’s total research and development expenses as well as qualitative factors, such as marketplace perceptions and impact of a new product on Abbott’s overall market position. There were no delays in Abbott’s 2011 research and development activities that are expected to have a material impact on operations.
While the aggregate cost to complete the numerous pharmaceutical and medical device projects currently in development is expected to be material, the total cost to complete will depend upon Abbott’s ability to successfully complete each project, the rate at which each project advances, and the ultimate timing for completion. Given the potential for significant delays and the high rate of failure inherent in the research and development of new pharmaceutical and medical device products and technologies, it is not possible to accurately esti-mate the total cost to complete all projects currently in development. However, Abbott plans to continue to manage its portfolio of projects to achieve research and development spend equal to approximately 9.5 percent to 10 percent of sales each year. Abbott does not regularly accumulate or make management decisions based on the total expenses incurred for a particular development phase in a given period.
Generally, Abbott seeks to obtain various forms of exclusivity for each product in development. Abbott obtains patent protection, where available, in all significant markets and/or countries for each product in development. Additionally, Abbott also seeks to obtain other forms of legal or regulatory exclusivity that would protect the product upon approval. These forms of regulatory exclusivity have a variety of terms, from 3, 5 to 7 years in the United States, and up to 10 years in the European Union. This regulatory exclusivity is granted upon the approval of each development project. In certain instances, regulatory exclusivity may protect a product where patent protection is no longer available or for a period of time in excess of patent protection. The availability of and length of such regulatory exclusivity is based, in part, on the length of the regulatory review process and can only be
determined upon product approval. It is not possible to estimate for each product in development the total period of exclusivity that will be obtained if regulatory approval is obtained.
Generally, upon approval, products in development may be entitled to exclusivity. Abbott seeks patent protection, where available, in all significant markets and/or countries for each product in development. In the United States, the expiration date for patents filed on or after June 8, 1995 is 20 years after the filing date. Given that patents relating to pharmaceutical products are often obtained early in the development process and given the amount of time needed to complete clinical trials and other development activities required for regulatory approval, the length of time between product launch and patent expiration may be significantly less than 20 years if a product in development ultimately obtains regulatory approval. The Drug Price Competition and Patent Term Restoration Act of 1984 (commonly known as the Hatch-Waxman Act) permits a patent holder to seek a patent extension commonly called a patent term restoration for patents on products (or processes for making the product) regulated by the Federal Food, Drug and Cosmetic Act. The calculation of the patent extension is roughly based on 50 percent of the period of time extending from the filing of an Investigational New Drug application to the submission of the NDA, plus 100 percent of the time period from NDA submission to regulatory approval. The extension, however, cannot exceed 5 years and the remaining patent term after regulatory approval cannot exceed 14 years. Only one patent related to the first commercial marketing of a newly approved pharmaceutical product is eligible for a patent term restoration.
Additionally, products may be entitled to obtain other forms of legal or regulatory exclusivity upon approval. These forms of regulatory exclusivity have a variety of terms in the United States and are variable in other jurisdictions. In the United States, when the FDA approves a new chemical entity that it has not previously approved alone or in combination with other chemical entities, the product is granted 5 years of regulatory exclusivity. The FDA may grant 3 years of market exclusivity for an NDA, including supplementary applications, if the application contains reports of new clinical investigations that have not previously been relied upon by the FDA. If the FDA grants pediatric exclusivity, the longest existing exclusivity (patent or regulatory) related to the product would be extended by 6 months. If the FDA designates a product as an orphan drug that is either used to treat conditions that afflict a relatively small population or for which there is not a reasonable expectation that the research and development costs will be recov-ered, the FDA may grant 7 years of exclusivity.
This regulatory exclusivity is granted upon the approval of each devel-opment project. In certain instances, regulatory exclusivity may protect a product where patent protection is no longer available or for a period of time in excess of patent protection. It is not possible to estimate for each product in development the total period of exclusivity that will be obtained if regulatory approval is obtained. However, given the length of time required to complete clinical development of a pharmaceutical product, the minimum and maximum periods of exclusivity that might be achieved in any individual case would not be expected to exceed 3 and 14 years, respectively. These estimates do not consider other factors, such as the difficulty of recreating the manufacturing process for a particular product or other proprietary knowledge that may provide some level of additional protection against generic incursion.
59
Abbott 2011 Annual Report
necessarily indicative of the results of operations as they would have been had the transaction been effected on the assumed date.
In March 2010, Abbott acquired STARLIMS Technologies for approxi-mately $100 million, in cash, net of cash held by STARLIMS, providing Abbott with leading products and expertise to build its position in labo-ratory informatics. A substantial portion of the fair value of the acquisition has been allocated to goodwill and amortizable intangible assets.
In April 2010, Abbott acquired the outstanding shares of Facet Biotech Corporation for approximately $430 million, in cash, net of cash held by Facet. The acquisition enhances Abbott’s early- and mid-stage pharmaceutical pipeline, including a biologic for multiple sclerosis and compounds that complement Abbott’s oncology program. A substantial portion of the fair value of the acquisition has been allocated to acquired in-process research and development that is accounted for as an indefi-nite-lived intangible asset until regulatory approval or discontinuation.
In February 2009, Abbott acquired the outstanding shares of Advanced Medical Optics, Inc. (AMO) for approximately $1.4 billion, in cash, net of cash held by AMO. Prior to the acquisition, Abbott held a small invest-ment in AMO. Abbott acquired AMO to take advantage of increasing demand for vision care technologies due to population growth and demographic shifts and AMO’s premier position in its field. Abbott acquired control of this business on February 25, 2009 and the financial results of the acquired operations are included in these financial state-ments beginning on that date. The allocation of the fair value of the acquisition resulted in non-deductible goodwill of approximately $1.7 bil-lion, non-deductible definite-lived intangible assets of approximately $900 million and net tangible assets of approximately $400 million. In addition, Abbott assumed $1.5 billion of debt. Acquired intangible assets consist of established customer relationships, developed technology and trade names and are amortized over 2 to 30 years (average of 15 years). In addition, subsequent to the acquisition, Abbott repaid substantially all of the acquired debt of AMO.
In October 2009, Abbott acquired 100 percent of Visiogen, Inc. for $400 million, in cash, providing Abbott with a next-generation accom-modating intraocular lens (IOL) technology to address presbyopia for cataract patients. The allocation of the fair value of the acquisition resulted in non-deductible acquired in-process research and develop-ment of approximately $200 million which is accounted for as an indefinite-lived intangible asset until regulatory approval or discontinua-tion, non-deductible definite-lived intangible assets of approximately $24 million and goodwill of approximately $200 million.
In October 2009, Abbott acquired Evalve, Inc. for $320 million, in cash, plus an additional payment of $90 million to be made upon completion of certain regulatory milestones. Abbott acquired Evalve to obtain a presence in the growing area of non-surgical treatment for structural heart disease. Including a previous investment in Evalve, Abbott has acquired 100 percent of the outstanding shares of Evalve. In connection with the acquisition, the carrying amount of this investment was revalued to fair value resulting in recording $28 million of income, which is reported as Other (income) expense, net. The allocation of the fair value of the acquisition resulted in non-deductible definite-lived intangible assets of approximately $140 million, non-deductible acquired in-pro-cess research and development of approximately $220 million which is accounted for as an indefinite-lived intangible asset until regulatory approval or discontinuation, goodwill of approximately $100 million and
Business Combinations, Technology Acquisitions and Related Transactions
On September 8, 2010, Abbott acquired Piramal Healthcare Limited’s Healthcare Solutions business, a leader in the Indian branded generics market, for $2.2 billion, in cash, plus additional payments of $400 million annually in 2011, 2012, 2013 and 2014. Abbott recorded a $1.6 billion liability for the present value of the additional payments at the acquisition date. The acquisition was financed with cash. The allocation of the fair value of the acquisition resulted in the recording of $2.7 billion of deductible acquired intangible assets and $1.0 billion of deductible goodwill. Acquired intangible assets consist primarily of trade names, customer relationships and associated rights and are amortized over an average of 19 years.
In February 2010, Abbott acquired Solvay’s pharmaceuticals business (Solvay Pharmaceuticals) for approximately $6.1 billion, in cash, plus additional payments of up to EUR 100 million per year if certain sales milestones are met in 2011, 2012 and 2013. Contingent consideration of approximately $290 million was recorded. The acquisition of Solvay Pharmaceuticals provides Abbott with a large and complementary portfolio of pharmaceutical products and expands Abbott’s presence in key global emerging markets. Abbott acquired control of this busi-ness on February 15, 2010 and the financial results of the acquired operations are included in these financial statements beginning on that date. Net sales for the acquired operations for 2010 were approxi-mately $3.1 billion. Pretax loss of the acquired operations, including acquisition, integration and restructuring expenses, for 2010 was approximately $395 million. The acquisition was funded with cash and short-term investments. The allocation of the fair value of the acquisi-tion is shown in the table below
(in billions of dollars)
Goodwill, non-deductible $ 2.2
Acquired intangible assets, non-deductible 4.1
Acquired in-process research and
development, non-deductible 0.5
Acquired net tangible assets 0.7
Deferred income taxes recorded at acquisition (1.1)
Total allocation of fair value $ 6.4
Acquired intangible assets consist primarily of product rights for currently marketed products and are amortized over 2 to 14 years (average of 11 years). Acquired in-process research and development projects are accounted for as indefinite lived intangible assets until regulatory approval or discontinuation. The net tangible assets acquired consist primarily of trade accounts receivable of approxi-mately $675 million, inventory of approximately $390 million, property and equipment of approximately $725 million, net of assumed liabili-ties, primarily trade accounts payable, accrued compensation and other liabilities.
Had the acquisition of Solvay Pharmaceuticals taken place on January 1, 2010 and January 1, 2009, unaudited pro forma net sales, net earnings and diluted earnings per share for 2010 and 2009 would have been $35.8 billion and $34.2 billion, $4.6 billion and $5.2 billion and $2.96 and $3.36, respectively. The pro forma information includes adjustments for amortization of intangible assets and fair value adjust-ments to acquisition-date inventory as well as acquisition, integration and restructuring expenses. The pro forma financial information is not
Financial Review
60
Abbott 2011 Annual Report
Financial Review
pressure on government-reimbursed cataract procedures in Europe and on the global LASIK surgery business as well as longer regulatory approval timelines for products currently under development could result in a valuation in the future where the fair value of the Medical Optics unit has declined below its carrying value, thereby triggering the requirement to estimate the implied fair value of the goodwill and measure for impairment.
Financial Condition
Cash Flow
Net cash from operating activities amounted to $9.0 billion, $8.7 billion and $7.3 billion in 2011, 2010 and 2009, respectively. Trade accounts payable and other liabilities in Net cash from operating activities in 2011 includes the non-cash impact of a litigation reserve of $1.5 billion and Income taxes payable includes $580 million of tax benefits related to the favorable resolution of various tax positions pertaining to prior years. While substantially all of Abbott’s cash and cash equivalents at December 31, 2011, 2010 and 2009 is considered reinvested indefi-nitely in foreign subsidiaries, Abbott does not expect such reinvestment to affect its liquidity and capital resources. If these funds were needed for operations in the U.S., Abbott would be required to accrue and pay U.S. income taxes to repatriate these funds. Abbott believes that it has sufficient sources of liquidity to support its assumption that the disclosed amount of undistributed earnings at December 31, 2011 can be consid-ered to be reinvested indefinitely. Abbott funded $394 million in 2011, $525 million in 2010 and $862 million in 2009 to defined pension plans. Abbott expects pension funding for its main domestic pension plan of $200 million annually. Abbott expects annual cash flow from operating activities to continue to exceed Abbott’s capital expenditures and cash dividends.
For 2010, the reductions in cash and cash equivalents due to the effect of exchange rate changes was primarily driven by the impact of changes in the value of the U.S. dollar compared to the euro on non-dollar denominated cash and cash equivalents. While future fluc-tuations in the strength of the U.S. dollar against foreign currencies could have a substantial effect on the dollar value of Abbott’s cash and cash equivalents, such fluctuations are not expected to materially impact Abbott’s liquidity.
As discussed above, the United States Department of Justice, through the United States Attorney for the Western District of Virginia, is inves-tigating Abbott’s sales and marketing activities for Depakote. Abbott recorded a non-cash charge of $1.5 billion in 2011 related to this investigation. However, the discussions to resolve potential civil and criminal claims related to this matter are ongoing, and until concluded, there can be no certainty about definitive resolution. The ultimate resolution of this matter in any reporting period is expected to have a material impact on Abbott’s cash flows for that year.
Debt and Capital
At December 31, 2011, Abbott’s long-term debt rating was AA by Standard & Poor’s Corporation and A1 by Moody’s Investors Service. Abbott has readily available financial resources, including unused lines of credit of $6.7 billion that support commercial paper borrowing arrangements of which a $3.0 billion facility expires in October 2012 and a $3.7 billion facility expires in 2013. Related compensating bal-ances, which are subject to withdrawal by Abbott at its option, and commitment fees are not material.
deferred income taxes of approximately $110 million. Acquired intangi-ble assets consist of developed technology and are being amortized over 11 years.
In January 2009, Abbott acquired Ibis Biosciences, Inc. (Ibis) for $175 million, in cash, to expand Abbott’s position in molecular diag-nostics for infectious disease. Including a $40 million investment in Ibis in 2008, Abbott has acquired 100 percent of the outstanding shares of Ibis. A substantial portion of the fair value of the acquisition has been allocated to goodwill and amortizable intangible assets, and acquired in-process research and development which is accounted for as an indefinite-lived intangible asset until regulatory approval or discontinuation. The investment in Ibis in 2008 resulted in a charge to acquired in-process research and development. In connection with the acquisition, the carrying amount of this investment was revalued to fair value resulting in recording $33 million of income, which is reported as Other (income) expense, net.
Except for the acquisition of Solvay Pharmaceuticals, had the above acquisitions taken place on January 1 of the previous year, consoli-dated net sales and income would not have been significantly different from reported amounts.
In 2011, Abbott entered into a collaboration agreement for the joint development and commercialization of second-generation oral antioxi-dant inflammation modulators resulting in a charge to acquired in-process research and development of $400 million. In 2010, Abbott entered into an agreement to acquire licensing rights outside the U.S., excluding certain Asian markets, to a product in development for the treatment of chronic kidney disease resulting in a charge to acquired in-process research and development of $238 million. In 2011, certain milestones were achieved and charges to acquired in-process research and development of $188 million were recorded. Additional payments of approximately $200 million could be required for the achievement of certain development and regulatory milestones. In addition, equity interests of approximately $62 million each were acquired in 2011 and 2010. In 2011, Abbott entered into an agree-ment to develop and commercialize a treatment for rheumatoid arthritis and psoriasis resulting in a charge to acquired in-process research and development of $85 million. Additional payments totaling up to $395 million could be required for the achievement of certain development, regulatory and commercial milestones under the agree-ment. In 2010, Abbott also entered into an agreement to develop and commercialize a product for the treatment of endometriosis resulting in a charge to acquired in-process research and development of $75 million. Additional payments of approximately $500 million could be required for the achievement of certain development, regulatory and commercial milestones under this agreement. In 2009, Abbott acquired the global rights to a novel biologic for the treatment of chronic pain for $170 million resulting in a charge to acquired in-process research and development.
Goodwill
At December 31, 2011, goodwill recorded as a result of business combinations totaled $15.7 billion. Goodwill is reviewed for impairment annually or when an event that could result in an impairment occurs. The results of the last impairment test indicated that the fair value of each reporting unit was substantially in excess of its carrying value except for the Medical Optics unit. While the fair value of the Medical Optics business exceeds its carrying value, extended economic
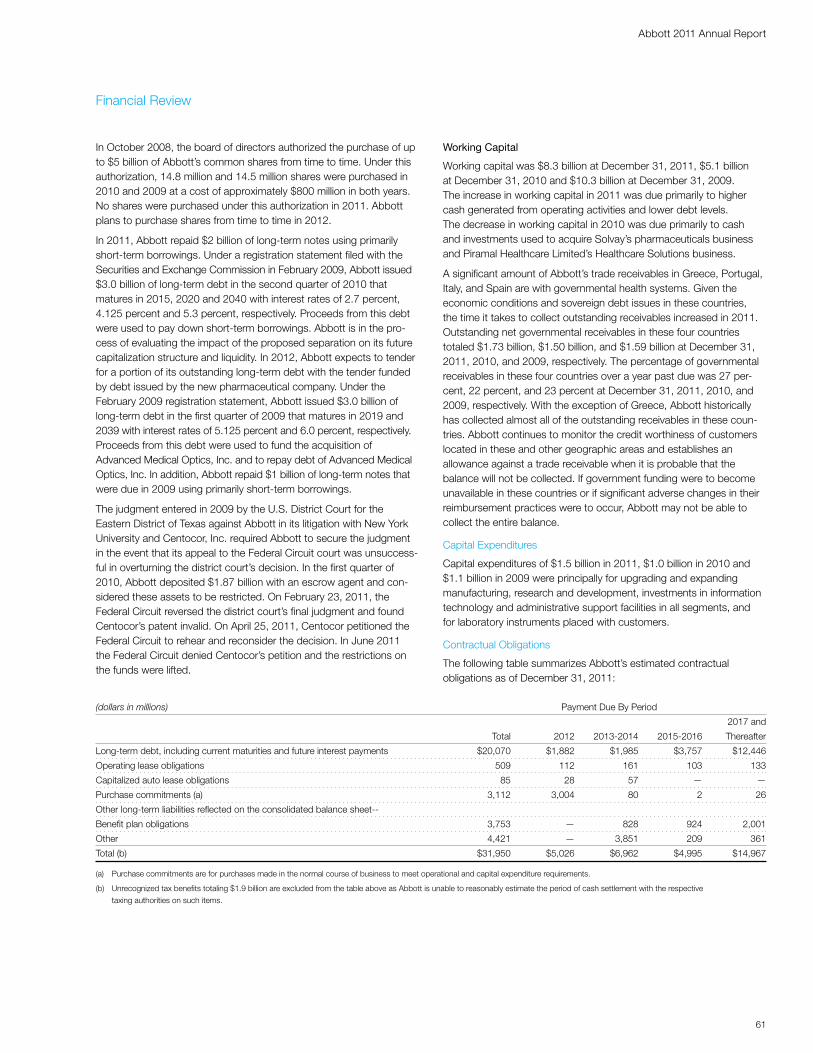
61
Abbott 2011 Annual Report
Financial Review
Working Capital
Working capital was $8.3 billion at December 31, 2011, $5.1 billion at December 31, 2010 and $10.3 billion at December 31, 2009. The increase in working capital in 2011 was due primarily to higher cash generated from operating activities and lower debt levels. The decrease in working capital in 2010 was due primarily to cash and investments used to acquire Solvay’s pharmaceuticals business and Piramal Healthcare Limited’s Healthcare Solutions business.
A significant amount of Abbott’s trade receivables in Greece, Portugal, Italy, and Spain are with governmental health systems. Given the economic conditions and sovereign debt issues in these countries, the time it takes to collect outstanding receivables increased in 2011. Outstanding net governmental receivables in these four countries totaled $1.73 billion, $1.50 billion, and $1.59 billion at December 31, 2011, 2010, and 2009, respectively. The percentage of governmental receivables in these four countries over a year past due was 27 per-cent, 22 percent, and 23 percent at December 31, 2011, 2010, and 2009, respectively. With the exception of Greece, Abbott historically has collected almost all of the outstanding receivables in these coun-tries. Abbott continues to monitor the credit worthiness of customers located in these and other geographic areas and establishes an allowance against a trade receivable when it is probable that the balance will not be collected. If government funding were to become unavailable in these countries or if significant adverse changes in their reimbursement practices were to occur, Abbott may not be able to collect the entire balance.
Capital Expenditures
Capital expenditures of $1.5 billion in 2011, $1.0 billion in 2010 and $1.1 billion in 2009 were principally for upgrading and expanding manufacturing, research and development, investments in information technology and administrative support facilities in all segments, and for laboratory instruments placed with customers.
Contractual Obligations
The following table summarizes Abbott’s estimated contractual obligations as of December 31, 2011:
In October 2008, the board of directors authorized the purchase of up to $5 billion of Abbott’s common shares from time to time. Under this authorization, 14.8 million and 14.5 million shares were purchased in 2010 and 2009 at a cost of approximately $800 million in both years. No shares were purchased under this authorization in 2011. Abbott plans to purchase shares from time to time in 2012.
In 2011, Abbott repaid $2 billion of long-term notes using primarily short-term borrowings. Under a registration statement filed with the Securities and Exchange Commission in February 2009, Abbott issued $3.0 billion of long-term debt in the second quarter of 2010 that matures in 2015, 2020 and 2040 with interest rates of 2.7 percent, 4.125 percent and 5.3 percent, respectively. Proceeds from this debt were used to pay down short-term borrowings. Abbott is in the pro-cess of evaluating the impact of the proposed separation on its future capitalization structure and liquidity. In 2012, Abbott expects to tender for a portion of its outstanding long-term debt with the tender funded by debt issued by the new pharmaceutical company. Under the February 2009 registration statement, Abbott issued $3.0 billion of long-term debt in the first quarter of 2009 that matures in 2019 and 2039 with interest rates of 5.125 percent and 6.0 percent, respectively. Proceeds from this debt were used to fund the acquisition of Advanced Medical Optics, Inc. and to repay debt of Advanced Medical Optics, Inc. In addition, Abbott repaid $1 billion of long-term notes that were due in 2009 using primarily short-term borrowings.
The judgment entered in 2009 by the U.S. District Court for the Eastern District of Texas against Abbott in its litigation with New York University and Centocor, Inc. required Abbott to secure the judgment in the event that its appeal to the Federal Circuit court was unsuccess-ful in overturning the district court’s decision. In the first quarter of 2010, Abbott deposited $1.87 billion with an escrow agent and con-sidered these assets to be restricted. On February 23, 2011, the Federal Circuit reversed the district court’s final judgment and found Centocor’s patent invalid. On April 25, 2011, Centocor petitioned the Federal Circuit to rehear and reconsider the decision. In June 2011 the Federal Circuit denied Centocor’s petition and the restrictions on the funds were lifted.
(dollars in millions) Payment Due By Period
2017 and
Total 2012 2013-2014 2015-2016 Thereafter
Long-term debt, including current maturities and future interest payments $20,070 $1,882 $1,985 $3,757 $12,446
Operating lease obligations 509 112 161 103 133
Capitalized auto lease obligations 85 28 57 — —
Purchase commitments (a) 3,112 3,004 80 2 26
Other long-term liabilities reflected on the consolidated balance sheet--
Benefit plan obligations 3,753 — 828 924 2,001
Other 4,421 — 3,851 209 361
Total (b) $31,950 $5,026 $6,962 $4,995 $14,967
(a) Purchase commitments are for purchases made in the normal course of business to meet operational and capital expenditure requirements.
(b) Unrecognized tax benefits totaling $1.9 billion are excluded from the table above as Abbott is unable to reasonably estimate the period of cash settlement with the respective
taxing authorities on such items.
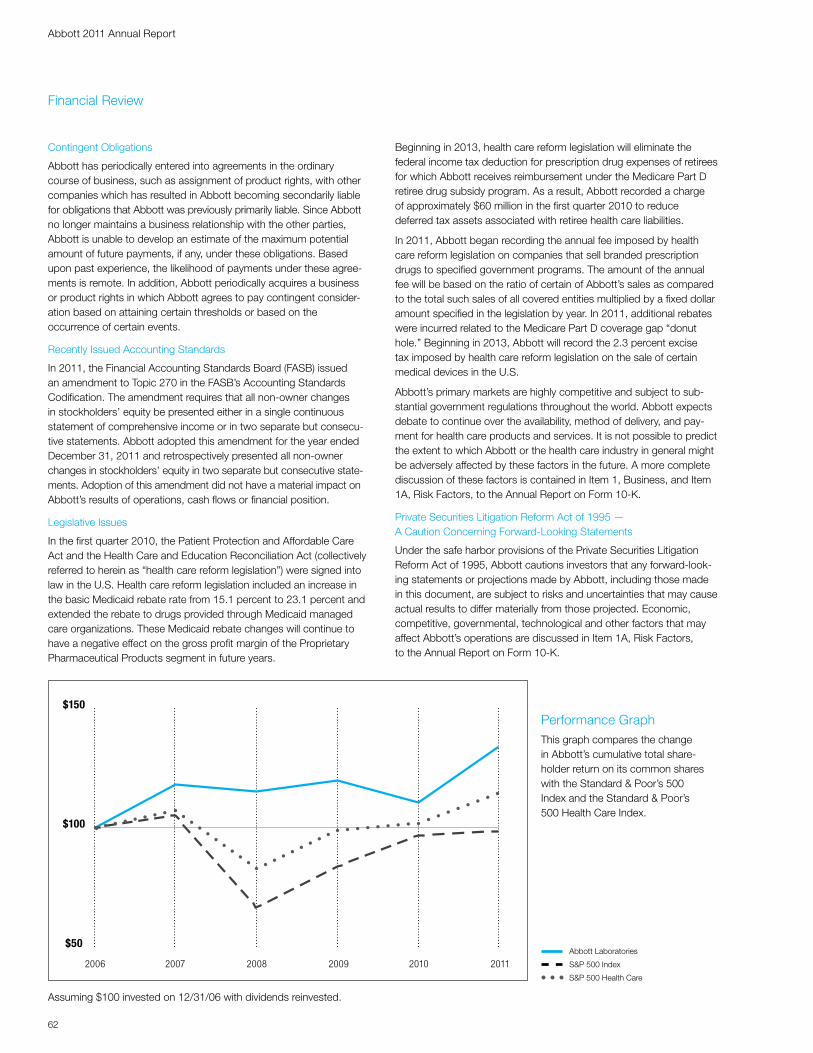
62
Abbott 2011 Annual Report
Financial Review
Beginning in 2013, health care reform legislation will eliminate the federal income tax deduction for prescription drug expenses of retirees for which Abbott receives reimbursement under the Medicare Part D retiree drug subsidy program. As a result, Abbott recorded a charge of approximately $60 million in the first quarter 2010 to reduce deferred tax assets associated with retiree health care liabilities.
In 2011, Abbott began recording the annual fee imposed by health care reform legislation on companies that sell branded prescription drugs to specified government programs. The amount of the annual fee will be based on the ratio of certain of Abbott’s sales as compared to the total such sales of all covered entities multiplied by a fixed dollar amount specified in the legislation by year. In 2011, additional rebates were incurred related to the Medicare Part D coverage gap “donut hole.” Beginning in 2013, Abbott will record the 2.3 percent excise tax imposed by health care reform legislation on the sale of certain medical devices in the U.S.
Abbott’s primary markets are highly competitive and subject to sub-stantial government regulations throughout the world. Abbott expects debate to continue over the availability, method of delivery, and pay-ment for health care products and services. It is not possible to predict the extent to which Abbott or the health care industry in general might be adversely affected by these factors in the future. A more complete discussion of these factors is contained in Item 1, Business, and Item 1A, Risk Factors, to the Annual Report on Form 10-K.
Private Securities Litigation Reform Act of 1995 — A Caution Concerning Forward-Looking Statements
Under the safe harbor provisions of the Private Securities Litigation Reform Act of 1995, Abbott cautions investors that any forward-look-ing statements or projections made by Abbott, including those made in this document, are subject to risks and uncertainties that may cause actual results to differ materially from those projected. Economic, competitive, governmental, technological and other factors that may affect Abbott’s operations are discussed in Item 1A, Risk Factors, to the Annual Report on Form 10-K.
Contingent Obligations
Abbott has periodically entered into agreements in the ordinary course of business, such as assignment of product rights, with other companies which has resulted in Abbott becoming secondarily liable for obligations that Abbott was previously primarily liable. Since Abbott no longer maintains a business relationship with the other parties, Abbott is unable to develop an estimate of the maximum potential amount of future payments, if any, under these obligations. Based upon past experience, the likelihood of payments under these agree-ments is remote. In addition, Abbott periodically acquires a business or product rights in which Abbott agrees to pay contingent consider-ation based on attaining certain thresholds or based on the occurrence of certain events.
Recently Issued Accounting Standards
In 2011, the Financial Accounting Standards Board (FASB) issued an amendment to Topic 270 in the FASB’s Accounting Standards Codification. The amendment requires that all non-owner changes in stockholders’ equity be presented either in a single continuous statement of comprehensive income or in two separate but consecu-tive statements. Abbott adopted this amendment for the year ended December 31, 2011 and retrospectively presented all non-owner changes in stockholders’ equity in two separate but consecutive state-ments. Adoption of this amendment did not have a material impact on Abbott’s results of operations, cash flows or financial position.
Legislative Issues
In the first quarter 2010, the Patient Protection and Affordable Care Act and the Health Care and Education Reconciliation Act (collectively referred to herein as “health care reform legislation”) were signed into law in the U.S. Health care reform legislation included an increase in the basic Medicaid rebate rate from 15.1 percent to 23.1 percent and extended the rebate to drugs provided through Medicaid managed care organizations. These Medicaid rebate changes will continue to have a negative effect on the gross profit margin of the Proprietary Pharmaceutical Products segment in future years.
Assuming $100 invested on 12/31/06 with dividends reinvested.
Abbott Laboratories
S&P 500 Index
S&P 500 Health Care
2006 20082007 2009 2010 2011
$150
$100
$50
Performance GraphThis graph compares the change in Abbott’s cumulative total share-holder return on its common shares with the Standard & Poor’s 500 Index and the Standard & Poor’s 500 Health Care Index.
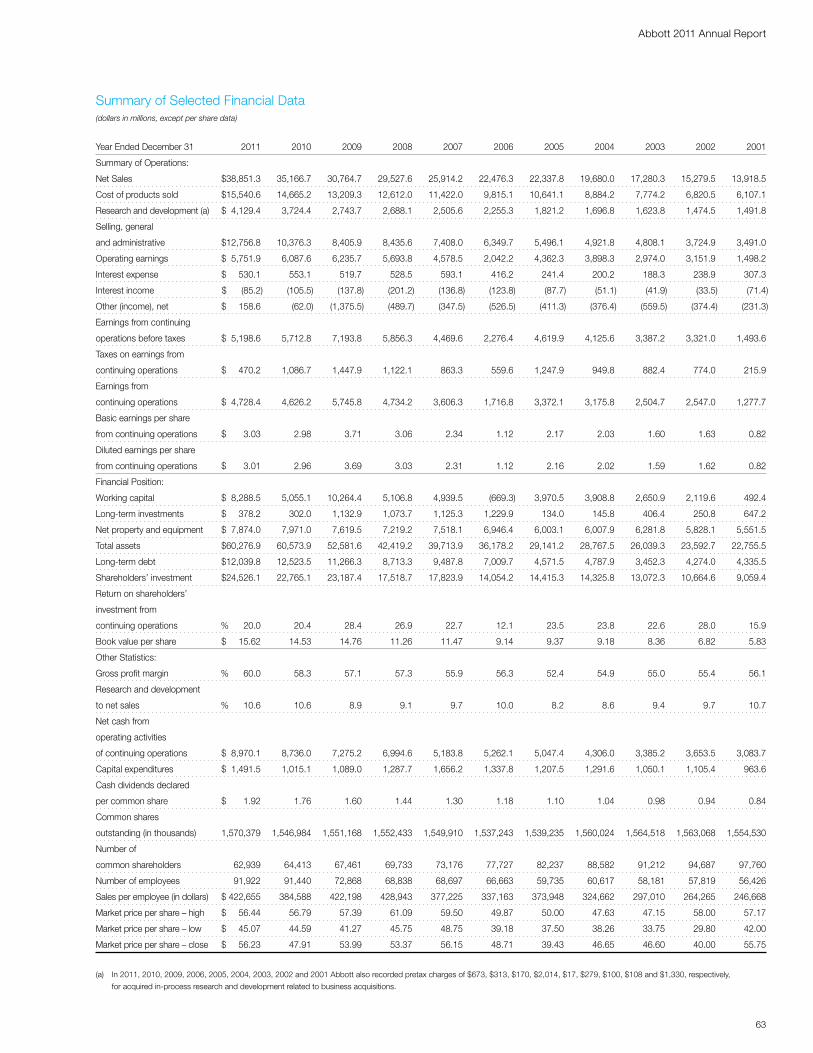
63
Abbott 2011 Annual Report
Year Ended December 31 2011 2010 2009 2008 2007 2006 2005 2004 2003 2002 2001
Summary of Operations:
Net Sales $38,851.3 35,166.7 30,764.7 29,527.6 25,914.2 22,476.3 22,337.8 19,680.0 17,280.3 15,279.5 13,918.5
Cost of products sold $15,540.6 14,665.2 13,209.3 12,612.0 11,422.0 9,815.1 10,641.1 8,884.2 7,774.2 6,820.5 6,107.1
Research and development (a) $ 4,129.4 3,724.4 2,743.7 2,688.1 2,505.6 2,255.3 1,821.2 1,696.8 1,623.8 1,474.5 1,491.8
Selling, general
and administrative $12,756.8 10,376.3 8,405.9 8,435.6 7,408.0 6,349.7 5,496.1 4,921.8 4,808.1 3,724.9 3,491.0
Operating earnings $ 5,751.9 6,087.6 6,235.7 5,693.8 4,578.5 2,042.2 4,362.3 3,898.3 2,974.0 3,151.9 1,498.2
Interest expense $ 530.1 553.1 519.7 528.5 593.1 416.2 241.4 200.2 188.3 238.9 307.3
Interest income $ (85.2) (105.5) (137.8) (201.2) (136.8) (123.8) (87.7) (51.1) (41.9) (33.5) (71.4)
Other (income), net $ 158.6 (62.0) (1,375.5) (489.7) (347.5) (526.5) (411.3) (376.4) (559.5) (374.4) (231.3)
Earnings from continuing
operations before taxes $ 5,198.6 5,712.8 7,193.8 5,856.3 4,469.6 2,276.4 4,619.9 4,125.6 3,387.2 3,321.0 1,493.6
Taxes on earnings from
continuing operations $ 470.2 1,086.7 1,447.9 1,122.1 863.3 559.6 1,247.9 949.8 882.4 774.0 215.9
Earnings from
continuing operations $ 4,728.4 4,626.2 5,745.8 4,734.2 3,606.3 1,716.8 3,372.1 3,175.8 2,504.7 2,547.0 1,277.7
Basic earnings per share
from continuing operations $ 3.03 2.98 3.71 3.06 2.34 1.12 2.17 2.03 1.60 1.63 0.82
Diluted earnings per share
from continuing operations $ 3.01 2.96 3.69 3.03 2.31 1.12 2.16 2.02 1.59 1.62 0.82
Financial Position:
Working capital $ 8,288.5 5,055.1 10,264.4 5,106.8 4,939.5 (669.3) 3,970.5 3,908.8 2,650.9 2,119.6 492.4
Long-term investments $ 378.2 302.0 1,132.9 1,073.7 1,125.3 1,229.9 134.0 145.8 406.4 250.8 647.2
Net property and equipment $ 7,874.0 7,971.0 7,619.5 7,219.2 7,518.1 6,946.4 6,003.1 6,007.9 6,281.8 5,828.1 5,551.5
Total assets $60,276.9 60,573.9 52,581.6 42,419.2 39,713.9 36,178.2 29,141.2 28,767.5 26,039.3 23,592.7 22,755.5
Long-term debt $12,039.8 12,523.5 11,266.3 8,713.3 9,487.8 7,009.7 4,571.5 4,787.9 3,452.3 4,274.0 4,335.5
Shareholders’ investment $24,526.1 22,765.1 23,187.4 17,518.7 17,823.9 14,054.2 14,415.3 14,325.8 13,072.3 10,664.6 9,059.4
Return on shareholders’
investment from
continuing operations % 20.0 20.4 28.4 26.9 22.7 12.1 23.5 23.8 22.6 28.0 15.9
Book value per share $ 15.62 14.53 14.76 11.26 11.47 9.14 9.37 9.18 8.36 6.82 5.83
Other Statistics:
Gross profit margin % 60.0 58.3 57.1 57.3 55.9 56.3 52.4 54.9 55.0 55.4 56.1
Research and development
to net sales % 10.6 10.6 8.9 9.1 9.7 10.0 8.2 8.6 9.4 9.7 10.7
Net cash from
operating activities
of continuing operations $ 8,970.1 8,736.0 7,275.2 6,994.6 5,183.8 5,262.1 5,047.4 4,306.0 3,385.2 3,653.5 3,083.7
Capital expenditures $ 1,491.5 1,015.1 1,089.0 1,287.7 1,656.2 1,337.8 1,207.5 1,291.6 1,050.1 1,105.4 963.6
Cash dividends declared
per common share $ 1.92 1.76 1.60 1.44 1.30 1.18 1.10 1.04 0.98 0.94 0.84
Common shares
outstanding (in thousands) 1,570,379 1,546,984 1,551,168 1,552,433 1,549,910 1,537,243 1,539,235 1,560,024 1,564,518 1,563,068 1,554,530
Number of
common shareholders 62,939 64,413 67,461 69,733 73,176 77,727 82,237 88,582 91,212 94,687 97,760
Number of employees 91,922 91,440 72,868 68,838 68,697 66,663 59,735 60,617 58,181 57,819 56,426
Sales per employee (in dollars) $ 422,655 384,588 422,198 428,943 377,225 337,163 373,948 324,662 297,010 264,265 246,668
Market price per share – high $ 56.44 56.79 57.39 61.09 59.50 49.87 50.00 47.63 47.15 58.00 57.17
Market price per share – low $ 45.07 44.59 41.27 45.75 48.75 39.18 37.50 38.26 33.75 29.80 42.00
Market price per share – close $ 56.23 47.91 53.99 53.37 56.15 48.71 39.43 46.65 46.60 40.00 55.75
(a) In 2011, 2010, 2009, 2006, 2005, 2004, 2003, 2002 and 2001 Abbott also recorded pretax charges of $673, $313, $170, $2,014, $17, $279, $100, $108 and $1,330, respectively,
for acquired in-process research and development related to business acquisitions.
Summary of Selected Financial Data(dollars in millions, except per share data)
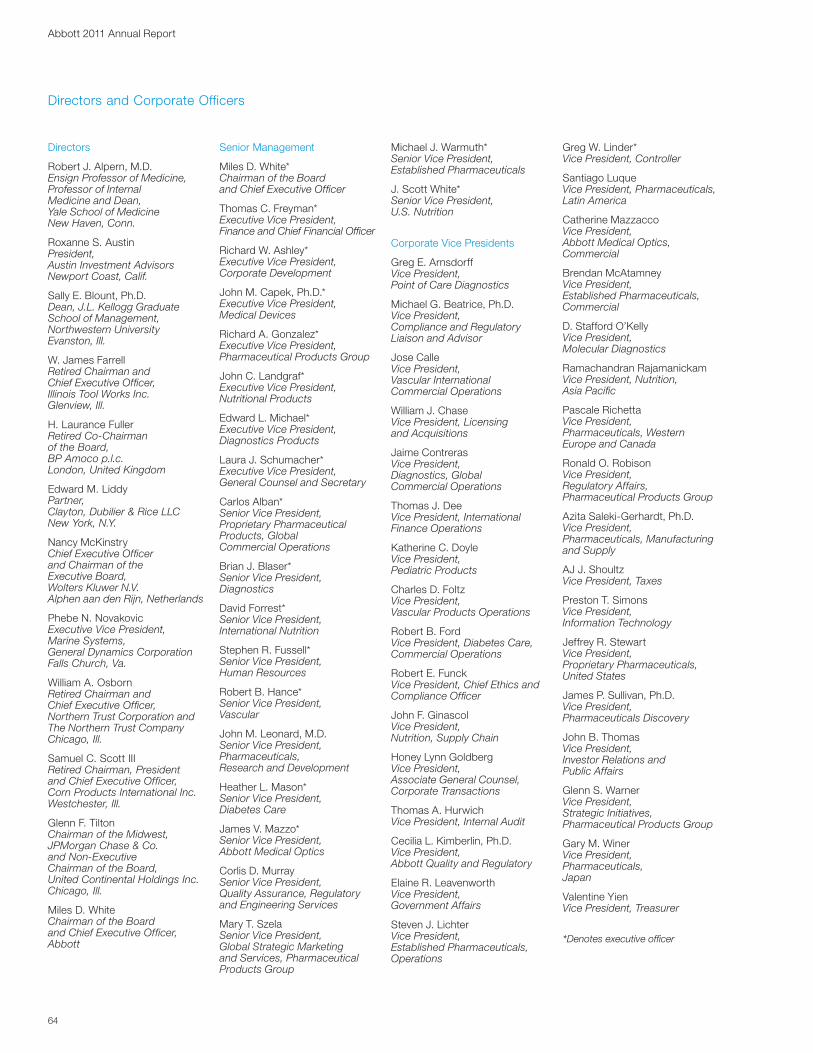
Abbott 2011 Annual Report
64
Directors and Corporate Officers
Directors
Robert J. Alpern, M.D. Ensign Professor of Medicine, Professor of Internal Medicine and Dean, Yale School of Medicine New Haven, Conn.
Roxanne S. AustinPresident,Austin Investment Advisors Newport Coast, Calif.
Sally E. Blount, Ph.D. Dean, J.L. Kellogg Graduate School of Management, Northwestern University Evanston, Ill.
W. James Farrell Retired Chairman and Chief Executive Offi cer, Illinois Tool Works Inc.Glenview, Ill.
H. Laurance FullerRetired Co-Chairman of the Board, BP Amoco p.l.c. London, United Kingdom
Edward M. LiddyPartner,Clayton, Dubilier & Rice LLCNew York, N.Y.
Nancy McKinstry Chief Executive Offi cer and Chairman of the Executive Board, Wolters Kluwer N.V.Alphen aan den Rijn, Netherlands
Phebe N. NovakovicExecutive Vice President, Marine Systems,General Dynamics CorporationFalls Church, Va.
William A. OsbornRetired Chairman and Chief Executive Offi cer, Northern Trust Corporation and The Northern Trust Company Chicago, Ill.
Samuel C. Scott IIIRetired Chairman, President and Chief Executive Officer,Corn Products International Inc.Westchester, Ill.
Glenn F. TiltonChairman of the Midwest,JPMorgan Chase & Co. and Non-Executive Chairman of the Board, United Continental Holdings Inc. Chicago, Ill.
Miles D. WhiteChairman of the Boardand Chief Executive Officer,Abbott
Senior Management
Miles D. White* Chairman of the Board and Chief Executive Offi cer
Thomas C. Freyman* Executive Vice President, Finance and Chief Financial Offi cer
Richard W. Ashley* Executive Vice President, Corporate Development
John M. Capek, Ph.D.* Executive Vice President, Medical Devices
Richard A. Gonzalez* Executive Vice President, Pharmaceutical Products Group
John C. Landgraf* Executive Vice President, Nutritional Products
Edward L. Michael* Executive Vice President, Diagnostics Products
Laura J. Schumacher* Executive Vice President, General Counsel and Secretary
Carlos Alban* Senior Vice President, Proprietary Pharmaceutical Products, Global Commercial Operations
Brian J. Blaser* Senior Vice President, Diagnostics
David Forrest* Senior Vice President, International Nutrition
Stephen R. Fussell* Senior Vice President, Human Resources
Robert B. Hance* Senior Vice President, Vascular
John M. Leonard, M.D. Senior Vice President, Pharmaceuticals, Research and Development
Heather L. Mason* Senior Vice President, Diabetes Care
James V. Mazzo* Senior Vice President, Abbott Medical Optics
Corlis D. Murray Senior Vice President, Quality Assurance, Regulatory and Engineering Services
Mary T. Szela Senior Vice President, Global Strategic Marketing and Services, Pharmaceutical Products Group
Michael J. Warmuth* Senior Vice President, Established Pharmaceuticals
J. Scott White* Senior Vice President, U.S. Nutrition
Corporate Vice Presidents
Greg E. Arnsdorff Vice President, Point of Care Diagnostics
Michael G. Beatrice, Ph.D. Vice President, Compliance and Regulatory Liaison and Advisor
Jose Calle Vice President, Vascular International Commercial Operations
William J. Chase Vice President, Licensing and Acquisitions
Jaime Contreras Vice President, Diagnostics, Global Commercial Operations
Thomas J. Dee Vice President, International Finance Operations
Katherine C. Doyle Vice President, Pediatric Products
Charles D. Foltz Vice President, Vascular Products Operations
Robert B. Ford Vice President, Diabetes Care, Commercial Operations
Robert E. Funck Vice President, Chief Ethics and Compliance Offi cer
John F. Ginascol Vice President, Nutrition, Supply Chain
Honey Lynn Goldberg Vice President, Associate General Counsel, Corporate Transactions
Thomas A. Hurwich Vice President, Internal Audit
Cecilia L. Kimberlin, Ph.D. Vice President, Abbott Quality and Regulatory
Elaine R. Leavenworth Vice President, Government Affairs
Steven J. Lichter Vice President, Established Pharmaceuticals, Operations
Greg W. Linder* Vice President, Controller
Santiago Luque Vice President, Pharmaceuticals, Latin America
Catherine Mazzacco Vice President, Abbott Medical Optics, Commercial
Brendan McAtamney Vice President, Established Pharmaceuticals, Commercial
D. Stafford O’Kelly Vice President, Molecular Diagnostics
Ramachandran Rajamanickam Vice President, Nutrition, Asia Pacifi c
Pascale Richetta Vice President, Pharmaceuticals, Western Europe and Canada
Ronald O. Robison Vice President, Regulatory Affairs, Pharmaceutical Products Group
Azita Saleki-Gerhardt, Ph.D. Vice President, Pharmaceuticals, Manufacturing and Supply
AJ J. Shoultz Vice President, Taxes
Preston T. Simons Vice President, Information Technology
Jeffrey R. Stewart Vice President, Proprietary Pharmaceuticals, United States
James P. Sullivan, Ph.D. Vice President, Pharmaceuticals Discovery
John B. Thomas Vice President, Investor Relations and Public Affairs
Glenn S. Warner Vice President, Strategic Initiatives, Pharmaceutical Products Group
Gary M. Winer Vice President, Pharmaceuticals, Japan
Valentine Yien Vice President, Treasurer
*Denotes executive offi cer
Some statements in this annual report may be forward-looking statements for purposes of the Private Securities Litigation Reform Act of 1995. Abbott cautions that these forward-looking statements are subject to risks and uncertainties that may cause actual results to differ materially from those indicated in the forward-looking statements. Economic, competitive, governmental, technological and other factors that may affect Abbott’s operations are discussed in Item 1A, “Risk Factors,” in our Securities and Exchange Commission 2011 Form 10-K and are incorporated by reference. We undertake no obligation to release publicly any revisions to forward-looking statements as the result of subsequent events or developments.
Abbott trademarks and products in-licensed by Abbott are shown in italics in the text of this report. The illustrations on pages 14, 15, 22 and 23 are artist’s renditions. © 2012 Abbott Laboratories
The Abbott 2011 Annual Report was printed with the use of renewable wind power resulting in nearly zero carbon emissions, keeping 19,875 pounds of CO2 from the atmosphere. This amount of wind-generated electricity is equivalent to 17,244 miles not driven in an automobile or 1,352 trees planted. The Abbott Annual Report cover and text is printed on recycled paper that contains a minimum of 10% post-consumer (PCW) fi ber and the fi nancial pages on 30% post-consumer (PCW) fi ber.
Stock Listing
The ticker symbol for Abbott’s common stock is ABT. The principal market for Abbott’s common shares is the New York Stock Exchange. Shares are also listed on the Chicago Stock Exchange and traded on various regional and electronic exchanges. Outside the United States, Abbott’s shares are listed on the London Stock Exchangeand the Swiss Stock Exchange.
Quarterly Dividend Dates
Dividends are expected to be declared and paid on the following schedule in 2012, pending approval by the board of directors:
Quarter Declared Record Paid
First 2/17 4/13 5/15
Second 6/8 7/13 8/15
Third 9/14 10/15 11/15
Fourth 12/14 1/15/13 2/15/13
Tax Information for Shareholders
Abbott is an Illinois High Impact Business and is located in a U.S. federal Foreign Trade Sub-Zone (Sub-Zone 22F). Dividends may be eligible for a subtraction from base income for Illinois incometax purposes.
If you have any questions, please contactyour tax advisor.
Dividend Reinvestment Plan
The Abbott Dividend Reinvestment Plan offers registered shareholders an opportunity to purchase additional shares, commission-free, through automatic dividend reinvestment and/or optional cash investments. Interestedpersons may contact the transfer agent, call Abbott’s Investor Newslineor write Abbott Shareholder Services.
Dividend Direct Deposit
Shareholders may have quarterly dividendsdeposited directly into a checking or savings account at any fi nancial institutionthat participates in the Automated Clearing House system. For more information, please contact the transfer agent, call the Investor Newsline or write Abbott Shareholder Services.
Direct Registration System
In August 2008, Abbott implemented a Direct Registration System (DRS) forall registered shareholder transactions. Shareholders will be sent a statement in lieu of a physical stock certifi cate for Abbott Laboratories stock. Please contact the transfer agent with any questions.
Annual Meeting
The annual meeting of shareholders will be held at 9 a.m. on Friday, April 27, 2012, at Abbott’s corporate headquarters. Questions regarding the annual meeting may be directed to the Corporate Secretary.
A copy of Abbott’s 2011 Form 10-K Annual Report, as fi led with the Securities and Exchange Commission, is available on the Abbott Web site at www.abbott.com or by contacting the Investor Newsline.
CEO and CFO Certifi cations
In 2011, Abbott’s chief executive offi cer (CEO) provided to the New York Stock Exchange the annual CEO certifi cation regarding Abbott’s compliance with theNew York Stock Exchange’s corporate governance listing standards. In addition, Abbott’s CEO and chief fi nancial offi cer fi led with the U.S. Securities and Exchange Commission all required certifi cations regarding the quality of Abbott’s public disclosures in its fi scal 2011 reports.
Investor Newsline(847) 937-7300
Investor RelationsDept. 362, AP6D2
Shareholder ServicesDept. 312, AP6D2
Corporate SecretaryDept. 364, AP6D2
Abbott100 Abbott Park RoadAbbott Park, IL 60064-6400 U.S.A.(847) 937-6100
Web Site
www.abbott.com
Abbott Online Annual Report
www.abbott.com/annualreport
Global Citizenship Report
Visit www.abbott.com/citizenship to readAbbott’s current global citizenship report.
Transfer Agent and Registrar
ComputershareP.O. Box 43078Providence, RI 02940-3078(888) 332-2268www.computershare.com
Shareholder Information
Shareholders with questions about their accounts may contact the transfer agent, call the Investor Newsline or write Abbott Shareholder Services.
Individuals who would like to receive additional information or have questions regarding Abbott’s business activities may call the Investor Newsline, write Abbott Investor Relations or visit Abbott’s Web site.
Shareholder and Corporate Information

Abbott100 Abbott Park Road, Abbott Park, IL 60064-6400 U.S.A.(847) 937-6100 www.abbott.com