Abans Finance PLC Annual Report 2017/18 · Abans Finance PLC | Annual Report 2017/18 | 04 Overview...
140
Abans Finance PLC Annual Report 2017/18
Transcript of Abans Finance PLC Annual Report 2017/18 · Abans Finance PLC | Annual Report 2017/18 | 04 Overview...

Abans Finance PLCAnnual Report 2017/18

CONTENTS
Overview
About Us 1Financial Highlights 2Chairman’s Message 4Managing Director/CEO's Message 5 Management Discussion and Analysis
Economic Overview 6AFPLC Performance in Year 2017/18 7Future Strategic Outlook 11Financial Review 12Stakeholder Analysis 16External Capital Formation Investors Capital 17 Customer Capital 22 Employee Capital 22 Social and Environmental Capital 24 Corporate Stewardship
Board of Directors 25Chairman’s Statement of Corporate Governance 27Corporate Governance 28Audit Committee Report 49Related Party Transactions Review Committee Report 50Remuneration Committee Report 51Nomination Committee Report 52Integrated Risk Management Committee Report 53Risk Management Report 54 Financial Information
Report of the Board of Directors 59Directors’ Responsibility for Financial Reporting 64Directors’ Statement of Internal Control over Financial Reporting 65Managing Director's and Chief Financial Officer's Responsibility for Financial Reporting 66Independent Auditors’ Report 67 Financial Reports
Statement of Comprehensive Income 71Statement of Financial Position 72Statement of Changes in Equity 73Statement of Cash Flows 74Notes to the Financial Statements 75 Supplementary Information
Value Addition 127Capital Adequacy 128Ten Year Summary 129Branch Network 131Glossary of Terms 133Notice of Meeting 136 Corporate Information Inner Back Cover

ABOUT US......
OUR VISIONBe the Soundest and Most Trusted Financial Solutions Provider in the Industry.
OUR MISSIONPower of the consumer through innovative products, personalized service and a wide range of financial solutions by maximizing the synergies of the Abans Group, thereby creating wealthy fuelling growth and adding to stakeholder value.
ORGANIZATIONAL PROFILE
Abans Finance PLC was incorporated on 08 April 2005 under the companies Act No. 17 of 1982 and was re-registered under the new companies Act No.7 of 2007, on 15 June 2009. The company’s journey of just over 13 years has been an eventful one, where the Company has endured challenges and emerged a strong, resilient force in the sector. Over the 13 years in operation, the Company has grown to be a large subsidiary of the prestigious Abans Group and contributed favorably towards the overall strategic goals of the Group .The Abans Group of Companies, is one of the most respected diversified business conglomerates in Sri Lanka having a history of more than four decades and multiple companies in sectors that cover travel, hospitality, tourism, logistics and fashion.
The Company commenced business initially as a registered Finance Leasing establishment under the Finance Leasing Act No.56 of 2000 on 19 April 2006 and thereafter obtained finance company license in terms of the Finance Companies Act No.78 of 1988 with an initial stated capital of Rs. 382 million on 27 August 2007. The Company was listed on the Colombo Stock Exchange in year 2011.
The Company currently operates with ten Branches, nine Customer Centers and four Kiosks. Comprehensive range of financial services encompassing acceptance of Fixed Deposits, maintenance of Saving Deposits and provision of Finance Leases, Mortgage Loans, Business Loans, Personal Loans and other Credit Facilities have been designed to cater to varied needs of our customers.

Abans Finance PLC | Annual Report 2017/18 | 02
Over
view
Man
agem
ent D
iscu
ssio
n an
d An
alys
isCo
rpor
ate
Stew
ards
hip
Fina
ncia
l Inf
orm
atio
nSu
pple
men
tary
Inf
orm
atio
n
FINANCIAL HIGHLIGHTS
Financial Performance (Rs. '000) 2017/18 2016/17 Change Income 1,917,671 1,620,506 18.34% Net Interest Income 897,991 871,034 3.09% Net Fee and Commission Income 42,167 19,367 117.73% Total Operating Income 960,526 912,119 5.31% Profit Before Taxation 132,949 197,406 (32.65%) Taxation 38,086 63,842 (40.34%) Profit After Taxation 94,864 133,564 (28.98%) Financial Position at the Year End (Rs. '000) Total Assets 8,957,424 7,486,207 19.65% Loans and Advances to Customers 6,928,118 5,825,642 18.92% Public Deposits 6,615,159 5,550,553 19.18% Borrowings 218,381 213,739 2.17% Shareholders' Funds 1,567,628 1,210,266 29.53% Profitability Return on Assets (%) 1.15% 1.96% (81) bps Return on Equity (%) 6.83% 14.64% (781) bps Net Interest Margin (%) 10.92% 12.78% (185) bps Cost to Income Ratio (%) 56.83% 51.53% 529 bps Investor Information Earnings Per Share (Rs.) 1.44 2.36 (38.85%) Price to Earnings Ratio (Times) 14.76 8.76 68.42% Net Asset Values Per Share (Rs.) 23.55 21.82 7.94% Market Value Per Share (Rs.) 21.30 24.10 (11.62%) Market Capitalization (Rs. Mn) 1,418 1,337 6.06% Regulatory Ratios Capital Adequacy - Core Capital Ratio (%) (Minimum - 5%) 21.00% 19.41% 159 bps - Total Risk Weighted Capital Ratio (%) (Minimum - 10%) 21.00% 19.37% 163 bps Statutory Liquid Asset Ratio (%) 23.32% 21.80% 152 bps Capital Funds to Total Deposit Liabilities (%) (Minimum - 10%) 23.70% 21.81% 189 bps

Over
view
Man
agem
ent D
iscu
ssio
n an
d An
alys
isCo
rpor
ate
Stew
ards
hip
Fina
ncia
l Inf
orm
atio
nSu
pple
men
tary
Inf
orm
atio
n
Abans Finance PLC | Annual Report 2017/18 | 03
FINANCIAL HIGHLIGHTS [Contd.]
-
500
1,000
1,500
2,000
2,500
2013/14 2014/15 2015/16 2016/17 2017/18
Rs. M
n
Gross Income Vs Net Interest Income
Gross Income Net Interest Income
0
50
100
150
200
250
2013/14 2014/15 2015/16 2016/17 2017/18
Rs. M
n
Profits After Tax
Profit After Tax Income tax
-
200
400
600
800
1,000
1,200
1,400
1,600
1,800
2013/14 2014/15 2015/16 2016/17 2017/18
Rs. M
n
Shareholders' Funds
- 1,000 2,000 3,000 4,000 5,000 6,000 7,000 8,000 9,000
10,000
2013/14 2014/15 2015/16 2016/17 2017/18
Rs. M
n
Total Assets Vs Portfolio
Total Assets Value of Loans and Advances
Abans Finance PLC | Annual Report 2017/18 | 04
Over
view
Man
agem
ent D
iscu
ssio
n an
d An
alys
isCo
rpor
ate
Stew
ards
hip
Fina
ncia
l Inf
orm
atio
nSu
pple
men
tary
Inf
orm
atio
n
CHAIRMAN’S MESSAGE
Dear Stakeholder,
It is with great pleasure that I present to you the Annual Report and Audited Financial Statement for the year ended 31 March 2018 of Abance Finance PLC.
The Global Economy
The Global growth was projected to rise to 3.6 % in 2017 reflecting a global upswing in economic activities. The growth in the advanced economies stood at an estimated rate of 2.3 % led by substantial growth in the Euro area and to a lesser degree in the United States and Japan. However, the global economic outlook seems to be subjected to downside risks due to numerous factors in terms of financial stress, increased protec-tionism and increasing geopolitical tension in the coming years. Thus, the need to increase long term productivity and improve living standards is vital.
The Sri Lankan Economy and the NBFI Sector
The Sri Lankan economy recorded a moderate GDP growth rate of 3.1 % in 2017, compared to that of 4.5 % in 2016. The adverse weather condition which impacted negatively on real economic activity was the main reason behind this slowdown.
The total asset base of the NBFI sector grew moderately by Rs. 143 billion during the year reaching Rs. 1,355 billion by the year end 2017, at a growth rate of 11.8 %, compared to the 21.7 % growth reported in 2016. One of the main reasons behind this slow down is Government curtailing credit growth with further tightening of Loan to Value Ratio that was effective at the beginning of 2017. The adverse weather condition is another main reason which adversely affected the asset growth of the sector.
The gross Non Performing Loan ratio increased to 5.9 % in 2017 from 5.3 % reported in 2016 due to the increase in gross NPLs and decline in the growth of the loan portfolio. The total loan loss provisions increased by Rs. 7.4 billion to Rs. 42.2 billion due to the increase in the specific provisions made for Non Performing Loans. The provision coverage ratio declined to 64 % in 2017, compared to 65.7 % in 2016. As a result, Net Non Performing Loan ratio increased to 1.5 % in 2017 from the reported ratio of 1.2% in 2016, showing signs of deterioration in the asset quality of the sector. However, with appropriate risk mitigation techniques, credit risk of the sector remained at manageable levels.
Performance of Your Company
The growth in Net Interest Income was only 3 % and increased from Rs. 871.03 million in 2016/17 to Rs. 897.99 million in 2017/18. However, the Gross Interest Income grew to Rs. 1.71 billion in 2017/18 from Rs. 1.49 billion reflecting a growth rate of 15 %.Profit before Taxation stood at Rs. 132.9 million in 2017/18 compared to that of Rs. 197.4 million in 2016/17 indicating a negative growth of 33 %. One major reason behind this negative growth was the provision for impairment. The Company has adopted a more conservative Impairment methodology during the year and the charge for the year from impairment of Loans & Advances amounted to Rs. 223.1 million compared to that of 189.3 million in year 2016/17 which as a percentage is an increase of 18 %.
Total asset base grew by 20 % in the year 2017/18 whereas the total Loans and Advances grew by 18.9 % in the year 2017/18.
Compliance for Greater Governance
During the year under review, the Board focused more on improving its effectiveness towards governance while introducing comprehensive evaluations mechanisms and adopting stringent policies on Corporate Governance. Going forward, the Company would ensure that there will be a continuous commitment to improve on transparency, accountability and reporting.
Appreciation
The Managing Director / CEO, Mr. Roshan Nanayakkara and his management team are to be commended for their continuous efforts in making the Company a more profitable one despite economic headwinds and competitive challenges in the environ-ment in which we do business. Going forward, finance companies are likely to face strategic challenges with increase in regulatory capital requirements. Competitors are likely to take steps to diversify and control costs as margins would diminish. AFPLC is reviewing these changes and its own strategic responses.
I am confident that the Board and Management will be successful in positioning the company appropriately in changing circumstances and that it will sustain its growth trajectory over the long term.
I would like to take this opportunity to thank my fellow Directors, the CEO, the Management Team and our parent company, Abans PLC, for their invaluable contribution to the success of the Company.
We foresee success in the coming years, and look forward to our stakeholders continued support which would give us added comfort in the years ahead.
Rusi PestonjeeChairman
Colombo,Sri Lanka25 June 2018

Over
view
Man
agem
ent D
iscu
ssio
n an
d An
alys
isCo
rpor
ate
Stew
ards
hip
Fina
ncia
l Inf
orm
atio
nSu
pple
men
tary
Inf
orm
atio
n
Abans Finance PLC | Annual Report 2017/18 | 05
MANAGING DIRECTOR / CEO’S MESSAGE
It is my pleasure to present to you the Annual Report and Financial Statements for the year ended 31 March 2018.
Performance of Non Bank Financial Institutions
Licensed Finance Companies and Specialized Leasing Companies (LFCs and SLCs) Sector performance moderated during the year with low credit growth, declining profitability and increase in non-performing loans. The sector expanded in 2017, with an asset growth of 11.8 %, representing 7.9 % of Sri Lanka’s financial system. The sector remained strong, with capital maintained at healthy levels along with adequate liquidity buffers well above the regulatory minimum levels. The sector exhibits a shift in funding mix, as increased assets were mainly funded through deposits while borrowings of the sector declined compared to the high growth recorded during the previous year. The Central Bank continued to take prudent measures to maintain the stability of the sector with much consideration on reviving the companies with weak financial positions. (Central Bank of Sri Lanka, Annual Report 2017, page 260)
Operating Results of the Company
The Company’s Total Asset Base (YOY) grew by 20% from Rs.7.4 billion on 31 March 2017 to Rs.8.9 billion in 31 March 2018. The Income earning Asset Base (YOY) grew by 18.9% from Rs. 5.8 billion on 31 March 2017 to Rs. 6.9 billion in 31 March 2018. The Total Gross Interest Income recorded a 15% growth amounting to Rs. 1.7 billion compared to Rs. 1.49 billion in the previous year. However, the Net Interest Income eroded with high Interest Expense with an increase of 30% amounting to Rs. 0.8 billion compared to Rs. 0.6 billion in the prior year. As such the Net Interest Income grew only by 3%.
The Company adopted a more conservative Impairment Method-ology under the guidance of External Auditors. Allowances for impairment charges for loans and advances increased from Rs. 189 million in prior year to Rs. 223 million.
During the year, the authorized share capital was increased by Rs.277 million by the issue of 11 million ordinary shares, Rs.25/= each by way of a Rights issue.
Risk Measures and Growth Strategies
The Company continues to focus on all identified risks ensuring effective controls are in place. As a control measure the Company expanded the Call Center in focusing follow up of collections. The Company also launched a pioneering and novel mobile device based application for its Marketing Officers and Collection Officers, with the objective of initiating a Lease or a Personal Loan and improving the Collection process in the field. This mobile application named “AFiMobile” aims to assist the Company Officers to capture customer information and collect rental payments on the go.
The Company is also in the process of migrating to a new plat form of IT to help leverage and manage growth of its Vehicle Leasing business and Fixed Deposit & Savings Mobilization.
Appreciation
With a deep sense of gratitude, I would like to place on record my thanks and appreciation to the Chairman and the Board of Directors for their continuous guidance and contribution. I would also wish to extend my gratitude to the CBSL officers for their regulatory guidance and to say thank you to our external auditors, fund providers and all other stake holders who helped us in numerous ways in our path to success. I sincerely thank all staff and management team for their dedication, commitment and diligent execution of tasks assigned.
Roshan NanayakkaraManaging Director/CEO
Colombo, Sri Lanka25 June 2018

Abans Finance PLC | Annual Report 2017/18 | 06
Over
view
Man
agem
ent D
iscu
ssio
n an
d An
alys
isCo
rpor
ate
Stew
ards
hip
Fina
ncia
l Inf
orm
atio
nSu
pple
men
tary
Inf
orm
atio
n
MANAGEMENT DISCUSSION AND ANALYSIS
Economic Overview
The Sri Lankan economy grew at a moderate pace of 3.1 % in 2017, compared to the growth of 4.5 % in 2016, amidst the challenges arising from both domestic and external fronts. The main reason for this slowdown was the prevailing high interest rates and the adverse weather conditions which were reflected in the continued negative impact on real economic activity.
In terms of industry growth, the agricultural sector recorded a contraction of 8%, while the industrial and services sectors, too, recorded a slowdown in growth. The 3.9% growth of the industrial sector was supported by manufacturing, construction, and mining and quarrying. However, the slowdown was attributed to the contraction in the construction industry when compared with previous years. The main reason for the slowdown in growth in the services sector was due to reduced activities from public administration and defence, while the 3.2% growth realised is attributed to the growth in financial services activities, wholesale and retail trade, and other personal services activities.
Moreover, the business surveys conducted by the Central Bank also indicated subdued business conditions during the year. Meanwhile, investment expenditure grew at a slower pace compared to the previous year whereas consumption expendi-ture, which witnessed some slowdown in the previous year, accelerated in 2017. Even though exports grew at a higher rate benefitting from the stronger recovery of some of the Sri Lanka’s major export destinations such as the US and Europe, the substantial increase in imports resulted in a further deterioration of the net external demand.
Meanwhile, the domestic savings grew at a slower rate while the net primary income from the rest of the world continued to contract during the year. Further, net current transfers from rest of the world moderated reflecting the slowdown in workers’ remittances partly due to geopolitical tensions and uncertainties in some regions including the Middle East. Reflecting these developments, growth in national savings moderated during the year and the resources gap broadened due to the relatively high growth in investment. (Source: CBSL Annual Report 2017)
Financial Sector Performance
Financial sector showed improved performance as the supportive prudent measures continued to preserve stability of the financial system in 2017. The improved performance of the
financial sector was broad-based and mainly contributed by the banks, other deposit taking financial institutions and contractual savings institutions. The banking sector continued to expand with improved business operations and risk management practices with the implementation of timely and appropriate regulatory measures during the year. Asset growth of the banking sector remained high though it gradually moderated during the second half of the year responding to the tight monetary policy stance and the resultant high market interest rates.
NBFI Sector
The Licensed Finance Companies (LFCs) and Specialised Leasing Companies (SLCs) sector performance moderated during the year with low credit growth, declining profitability and increase in non-performing loans. The slowdown in the sector was mainly due to fiscal and macro prudent policy measures taken to curtail importation of motor vehicles, moderate economic growth and natural calamities such as floods and drought conditions that prevailed in 2017. Nevertheless, the key performance indicators of the sector, including capital, liquidity and profitability, continued to be positive. The Central Bank initiated key prudent fiscal measures with much consideration on reviving the companies with weak financial positions. Necessary actions have been taken to cease or limit finance business operations of weak finance companies to safeguard depositors and the long term stability of the financial sector. Healthy growth was recorded by the contractual savings institutions, dominated by the Employees’ Provident Fund (EPF) and the Employees’ Trust Fund (ETF), providing reasonable returns for their members. Other sub sectors of the financial sector, which include the insurance sector, the primary dealers in government securities and the unit trust sector, recorded positive business performance during the period, without major stability concerns.
The sector expanded in 2017, with an asset growth of 11.8%, representing 7.9 % of Sri Lanka’s financial system. The total assets base of the sector grew moderately by Rs. 143 billion during the year reaching Rs. 1,355 billion by end 2017, at a growth rate of 11.8 %, compared to the 21.7 % growth reported in 2016. The assets base of the sector mainly consisted of loans and advances and accounted for 78 % of the total assets which contributed to 66 % of the assets growth. Finance leases accounted for 50 % of the loans and advances followed by other secured loans which accounted for 40 %.
Composition of Assets and Liabilities of the LFCs and SLCs Sector
2016 (a) 2017 (b) Change (%) Item Rs. bn Share Rs. bn Share 2016 2017 (%) (%) (a) (b) Assets Loans and Advances (net) 962.7 79.4 1,057.1 78.0 21.0 9.8 Investments 111.7 9.2 118.1 8.7 12.1 5.7 Other 137.5 11.3 179.8 13.3 36.6 30.8 Liabilities Total Deposits 530.7 43.8 686.7 50.7 10.4 29.4 Total Borrowings 438.7 36.2 396.0 29.2 39.6 -9.7 Capital Elements 146.1 12.1 169.7 12.5 18.7 16.1 Other 96.4 8.0 102.6 7.6 23.5 6.4
Total Assets/Liabilities 1,211.9 100.0 1,355.0 100.0 21.7 11.8
(a) Revised Source: Central Bank of Sri Lanka (b) Provisional

Over
view
Man
agem
ent D
iscu
ssio
n an
d An
alys
isCo
rpor
ate
Stew
ards
hip
Fina
ncia
l Inf
orm
atio
nSu
pple
men
tary
Inf
orm
atio
n
Abans Finance PLC | Annual Report 2017/18 | 07
MANAGEMENT DISCUSSION AND ANALYSIS [Contd.]
Customer deposits became the major portion of liabilities in 2017 and accounted for 50.7 % of the total liabilities of the sector. Sector borrowings and capital accounted for 29.2% and 12.5 %, respectively. The sector exhibited a shift in the funding mix as the expansion was largely funded through the customer deposit mobilisation. The deposits grew by 29.4 % to Rs. 686.7 billion in 2017, compared to the growth of 10.4 % in 2016. Time deposits grew by 29.2 % compared to the growth of 11.1 % in the year 2016 and savings deposits grew by 35.3 % compared to the negative growth of 1.7 % recorded in the previous year. Neverthe-less, time deposits accounted for a major share of total deposits, representing 95.5 %. The sector borrowings indicated a negative growth of 9.7 % to Rs. 396.0 billion in 2017, compared with the high growth of borrowings of 39.6% experienced during 2016. The increasing reliance on deposits were mainly attributed to the declining trend of deposit interest rates.
Gross non-performing loans (NPLs) portfolio increased to Rs. 65.9 billion by Rs. 12.9 billion in 2017 (24 %) mainly due to the floods that occurred during the first half of 2017, nationwide drought and slowing down of the economy. The gross NPL ratio increased to 5.9 % in 2017 from 5.3 % reported in 2016 due to the increase in gross NPLs and decline in the growth of the loan portfolio. The total loan loss provisions increased by Rs. 7.4 billion to Rs. 42.2 % in 2016. As a result, net NPL ratio increased to 1.5 % in 2017 from the reported ratio of 1.2 % in 2016, showing signs of deterioration in the asset quality of the sector. However, with appropriate risk mitigation techniques, credit risk of the sector remained at manageable levels.
The net interest income of the sector increased at a slower rate than in 2016, recording a growth of 11.5 % to Rs. 102.7 billion. This was mainly due to the increase in interest expenses by 33.1%, compared to the growth of interest income only by 22.6 %. As a result, net interest margin of the sector (net interest income as a percentage of average assets) declined marginally to 7.7 % in 2017 from 7.9% in 2016. Non-interest income increased by 20.3% mainly due to the increase in default charges and other service charges, while non-interest expenses also increased by 21.9 %, affecting adversely towards sector profitability, mainly due to the increase in staff costs. The loan loss provisions made against NPLs, which was Rs. 13.5 billion increased by Rs.6 billion during 2017, when compared to the provision of Rs.7.6 billion made in 2016 which also affected the profitability in 2017.
Accordingly, the sector posted a profit after tax of Rs. 25.8 billion, an 18.0 % decline compared to the profit of Rs. 31.5 billion recorded in the year 2016, mainly due to increased funding cost and higher loan loss provisions.
AFPLC Performance during the year 2017/18Amidst a challenging operating environment, Abans Finance PLC was able to manage its market share, mitigate the adverse impact of the challenging environment and maintain operating performance at a favorable level through market oriented strategic initiatives.
Product: Finance Lease, Other Loans and Advances
Company was able to maintain a diversified lending portfolio in order to mitigate the credit risk and reach extended customer base. Finance Leases, Business Loans, and other Loans and Advances were the main lending product lines serviced by the Company during the Financial Year 2017/18. In terms of new accommodations, the Company extended a total of Rs.4.3 billion worth of disbursements during the year 2017/18, an increase of 19 % from the previous year’s disbursements.
The increase in lending volume was the aim of improving the size of lending portfolio in order to facilitate top line growth.
The value of the Total Lending portfolio increased from Rs.6.2 billion in 2016/17 to Rs.7.4 billion in 2017/18, an increase of 19.2 %. The increase in the lending portfolio was by way of a restructured credit approval process coupled with a sound recovery process.
A closer analysis of the lending portfolio outstanding as at end March 2018 reveals that from an ‘asset type’ classification (for Finance Leases, Other Loans and Advances) the Company advances portfolio is predominantly exposed towards ‘Motor Bikes’ and ‘Business Loans’ which as at end March 2018 accounted for 58.80 % and 11.25 % of the lending portfolio value respectively.
From a sector wise classification, the portfolio concentrations are predominant in the service sector, a percentage of 73.2 %. Emerging trend of tourism industry and increasing trend of service sector to the Sri Lankan economy were the leading factors of this composition. A sector wise graphical presentation is as given below.
0%1%2%3%4%5%6%7%8%
010203040506070
2012 2013 2014 2015 2016 2017
Rs.B
n
Non - Performing Loans and Provision Coverage of the LFCs/SLCs Sector
Gross NPL (Left Axis) Gross NPL Ratio (Right Axis) Net NPL Ratio (Right Axis)
0
1000
2000
3000
4000
5000
6000
7000
8000
2013/14 2014/15 2015/16 2016/17 2017/18
Rs.
Mn
Lending Portfolio & New Lending
Lending Portfolio New Lending
Source: Central Bank of Sri Lanka

Over
view
Man
agem
ent D
iscu
ssio
n an
d An
alys
isCo
rpor
ate
Stew
ards
hip
Fina
ncia
l Inf
orm
atio
nSu
pple
men
tary
Inf
orm
atio
n
Abans Finance PLC | Annual Report 2017/18 | 08
MANAGEMENT DISCUSSION AND ANALYSIS [Contd.]
Credit Distribution and Centralized Approvals
The Company has established a Credit Approval Committee chaired by Chief Executive Officer accompanied by other Heads of Operations to review credit quality, to accelerate the granting cycle, to mitigate risk, to avoid discrepancies & finally to deliver a high value added product.
The Credit approval cycle consists of a seven stage centralised approach which could be depicted as follows.
Marketing Strategies for product Portfolio
As an emerging business entity AFPLC has to face severe competition from market giants in the finance sector. Hence Company has to adopt strong marketing strategies towards building trustworthiness, awareness and deliver a quality assured service.
During the year under review, the Company extended three-wheeler leasing facilities for Bajaj three-wheelers at competitive rates by entering in to an agreement with David Pieris Motor Company. Increasing trends of women motorcycle riders and difficulties in public transportation system in rural areas have been identified as strengths for promoting two wheeler financing facilities in rural areas.
Further, the Company reviewed its products against the competi-tor offerings and considered the following as being vital when strategising its market offerings in relation to the competition.
3.8%73.2%
23.0%
Portfolio Outstanding as 31 March 2018 - Sector Analysis
Trading & Manufacturing Services Others
Post Credit oring M
Application ocessing P
Credit Appraisal Determin Credit Terms & Process Documentation
Life Cycle
2. Application Processing
7. Post CreditMonitoring
6. Disbursement
5. Determine Credit Terms &Process Documentation
3. Credit Appraisal
4. Credit Approval &Underwriting
Lending LifeCycle
1. Marketing for LeaseFacility
1. Number of units leased / hired per month in terms of gaining supplier favouration 2. Service efficiencies 3. Number of Direct Branches / Customer Centres and KIOSKs 4. Nature of vendor relationship 5. Minimum required down payment 6. Upfront charges collected 7. Effective Interest Rate 8. Specialization and knowledge of staff
Competitive Landscape
The narrowing of interest spreads caused by competitive rivalry could lead to lower profitability amongst licensed finance companies. However, access to low cost financing, constant innovation in leasing products and effective promotions may provide a competitive advantage to capable NBFIs who would be able to not only sustain but experience growth in their profitability. In addition, due to the narrow product line in the leasing portfolios, diversification may enable NBFIs to increase their profitability.
Core competitive value propositions are shifting from the factor of interest rate to certain other considerations such as service sufficiency, accessibility, convenience and brand recall amongst the competition. Further, emerging changes in socio- economic factors tend to enhance the level of market demand for motor bikes, registered vehicles, permit vehicles and hybrid vehicles.
Channel Expansion & Branch Performance
As an emerging Company in the market, our product portfolio is not much wider as the other companies operating in this sector. However we intend to initiate our strategies to enhance the value of our customers living condition with limited but attractive range of products. AFPLC aims to increase its products breadth to include a wider range of asset/liability products. The following table provides a comparative of AFPLC products with some of the larger peers in the NBFI sector.
Abans Finance Other Large Peers Leasing and Hire Purchase ■ ■ Fixed Deposits/Savings ■ ■ Loans/Advances/ Others ■ ■ Currency Related Services ■ Micro Finance/ Development Financing ■ Real Estate ■ Islamic Finance ■ Pawning/Gold Loans ■ Factoring/Working Capital ■ Trade Finance ■ Margin Trading ■ Payment Card ■ Wealth Management ■ Debt Instruments ■

Over
view
Man
agem
ent D
iscu
ssio
n an
d An
alys
isCo
rpor
ate
Stew
ards
hip
Fina
ncia
l Inf
orm
atio
nSu
pple
men
tary
Inf
orm
atio
n
Abans Finance PLC | Annual Report 2017/18 | 09
MANAGEMENT DISCUSSION AND ANALYSIS [Contd.]
Delivery Channels
Delivery channels used by AFPLC are currently limited to Branches, Customer centres & KIOSKs. Tabulated below are the delivery channel platforms used by AFPLC in comparison to larger peers.
Place / Channel positioning is a critical success factor in the industry which will determine the success or the failure of the geographical expansion strategy of the Company. Therefore channel placement would be done on a solid rationale which can justify the channel choice made by the Company. Channel positioning generates a definite competitive edge for a financial institute since this affects the overall business model of the entity in terms of market penetration and customer convenience. Choice of channels will have to be made by considering both organizational aspects as well as customer aspects. Current distribution of the channel network of AFPLC can be summa-rized as follows.
Company Branches Customer Mini/Micro Mobile / Tele Electronic ATM Centres Branches / Propaganda Based Web Based KIOSKs Vehicles Abans Finance ■ ■ ■
Other Large Peers ■ ■ ■ ■ ■ ■ ■
Channel Performance Analysis
Channel Location Channel Province District No of Age of Channel Category Staff (Years)
1 Colombo Head Office Western Colombo 163* 13.15
2 Kurunegala Branch North Western Kurunegala 13 10.13
3 Dambulla Branch Central Matale 16 9.78
4 Badulla Branch Uva Badulla 11 9.74
5 Anuradhapura Branch North Central Anuradhapura 16 9.70
6 Galle Branch Southern Galle 14 9.53
7 Gampaha Branch Western Gampaha 14 8.71
8 Jaffna Branch Northern Jaffna 9 7.73
9 Rathnapura Branch Sabaragamuwa Rathnapura 10 7.58
10 Kandy Branch Central Kandy 22 6.60
11 Kaduruwela Customer Centre North Central Polonnaruwa 6 2.83
12 Embilipitiya Customer Centre Sabaragamuwa Rathnapura 6 2.83
13 Ampara Customer Centre Eastern Ampara 15 2.72
14 Batticaloa Customer Centre Eastern Batticaloa 10 2.72
15 Puttalam Customer Centre North Western Puttalam 7 2.72
16 Matara Customer Centre Southern Matara 6 2.56
17 Thissamaharama Customer Centre Southern Matara 7 2.56
18 Trincomalee Customer Centre Eastern Trincomalee 6 2.43
19 Vavuniya Customer Centre Northern Vavuniya 7 2.43
21 Kadawatha KIOSK Western Gampaha 2 6.28
20 Ja-ela KIOSK Western Gampaha 3 6.27
22 Moratuwa KIOSK Western Colombo 2 6.19
23 Piliyandala KIOSK Western Colombo 5 6.19
*Include Corporate and Back Office support functions

Over
view
Man
agem
ent D
iscu
ssio
n an
d An
alys
isCo
rpor
ate
Stew
ards
hip
Fina
ncia
l Inf
orm
atio
nSu
pple
men
tary
Inf
orm
atio
n
Abans Finance PLC | Annual Report 2017/18 | 10
MANAGEMENT DISCUSSION AND ANALYSIS [Contd.]
The customer preference for a specific channel would primarily depend on factors favoured by the customer in terms of conve-nience and confidence. The Company has taken consideration of these factors in the future branch roll out plan. Currently, AFPLC has introduced KIOSKs in strategic locations across the country in order to serve a wider range of customers. AFPLC has also received beneficial synergy spill overs from the brand recognition strength of the Parent Company (Abans PLC).
System Model of Abans Finance PLC
Information & Communication Technology
Our IT platform enables us to provide more customer conve-nience, customer centric and speedier service. Company has identified that rivalry against competitors requires a strongly powered technological advantage that would enable a more effective service to our customers.
AFPLC took a major leap in its Digital Transformation journey during the year 2017/18. Following are some key Projects which were launched:
* Document Management System
This Solution is used to track, manage and store documents and reduce paper.
* Disaster Recovery Site
* Business Continuity Plan
The other Projects launched during the year include the following:
* Cloud based Intranet
* Migration of Staff Emails to the Cloud
* New Collaboration Platform for Staff
* VPN Links with the Branches upgraded
* Upgraded Information Systems Security Policy
Infrastructure
Branch infrastructure has been upgraded to improve the customer reach and service quality to cover all parts of the Island. We have also focused on improving the Security Policies in order to strengthen the Security and Controls on vital information assets. Enhancements have been carried out in the areas of Risk Management and Compliance as well.
* AFiMOBILE - Mobile App for Lending and Collections
This is a pioneering Mobile Application for the Marketing Officers and Recovery Officers, with the objective of initiating a Lease or a Personal Loan and improving the Recovery Process in the field.
* SkyBank - New Core Information System
With the current Core System being saddled with a lot of issues and nearing end of life, a new Web based Core Information System is taking its place module by module. The new System offers a lot of new features including a Digital Banking Front-end for the Customers.
* New Interactive Website
Apart from easy navigation and user friendly interfaces, the new Website offers a host of interactive features such as dynamic loan calculator, inquiry submission tool, interactive branch map, etc.
and reduce paper.
Abans Finance Newly Launched website
Over
view
Man
agem
ent D
iscu
ssio
n an
d An
alys
isCo
rpor
ate
Stew
ards
hip
Fina
ncia
l Inf
orm
atio
nSu
pple
men
tary
Inf
orm
atio
n
Abans Finance PLC | Annual Report 2017/18 | 11
MANAGEMENT DISCUSSION AND ANALYSIS [Contd.]
Future Strategic OutlookFUTURE STRATEGIC DIRECTION
Analysis of Strategic Position - Abans Finance PLC
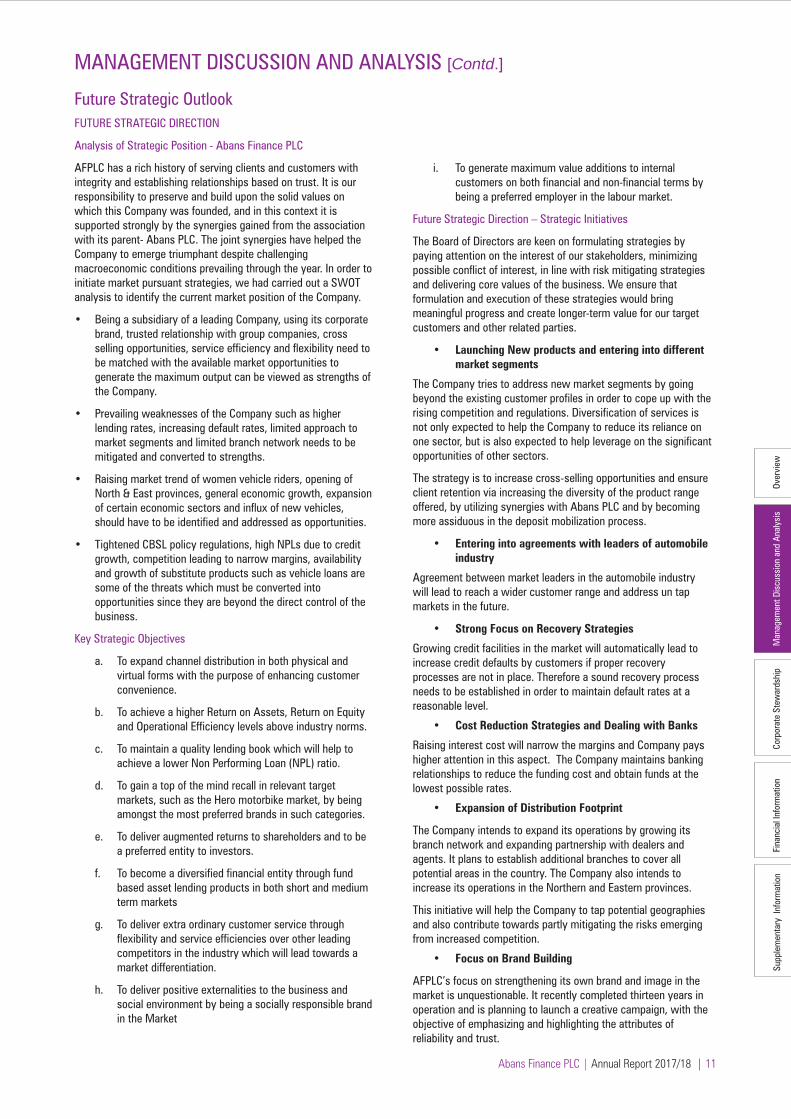
AFPLC has a rich history of serving clients and customers with integrity and establishing relationships based on trust. It is our responsibility to preserve and build upon the solid values on which this Company was founded, and in this context it is supported strongly by the synergies gained from the association with its parent- Abans PLC. The joint synergies have helped the Company to emerge triumphant despite challenging macroeconomic conditions prevailing through the year. In order to initiate market pursuant strategies, we had carried out a SWOT analysis to identify the current market position of the Company.
• Being a subsidiary of a leading Company, using its corporate brand, trusted relationship with group companies, cross selling opportunities, service efficiency and flexibility need to be matched with the available market opportunities to generate the maximum output can be viewed as strengths of the Company.
• Prevailing weaknesses of the Company such as higher lending rates, increasing default rates, limited approach to market segments and limited branch network needs to be mitigated and converted to strengths.
• Raising market trend of women vehicle riders, opening of North & East provinces, general economic growth, expansion of certain economic sectors and influx of new vehicles, should have to be identified and addressed as opportunities.
• Tightened CBSL policy regulations, high NPLs due to credit growth, competition leading to narrow margins, availability and growth of substitute products such as vehicle loans are some of the threats which must be converted into opportunities since they are beyond the direct control of the business.
Key Strategic Objectives
a. To expand channel distribution in both physical and virtual forms with the purpose of enhancing customer convenience.
b. To achieve a higher Return on Assets, Return on Equity and Operational Efficiency levels above industry norms.
c. To maintain a quality lending book which will help to achieve a lower Non Performing Loan (NPL) ratio.
d. To gain a top of the mind recall in relevant target markets, such as the Hero motorbike market, by being amongst the most preferred brands in such categories.
e. To deliver augmented returns to shareholders and to be a preferred entity to investors.
f. To become a diversified financial entity through fund based asset lending products in both short and medium term markets
g. To deliver extra ordinary customer service through flexibility and service efficiencies over other leading competitors in the industry which will lead towards a market differentiation.
h. To deliver positive externalities to the business and social environment by being a socially responsible brand in the Market
i. To generate maximum value additions to internal customers on both financial and non-financial terms by being a preferred employer in the labour market.
Future Strategic Direction – Strategic Initiatives
The Board of Directors are keen on formulating strategies by paying attention on the interest of our stakeholders, minimizing possible conflict of interest, in line with risk mitigating strategies and delivering core values of the business. We ensure that formulation and execution of these strategies would bring meaningful progress and create longer-term value for our target customers and other related parties.
• Launching New products and entering into different market segments
The Company tries to address new market segments by going beyond the existing customer profiles in order to cope up with the rising competition and regulations. Diversification of services is not only expected to help the Company to reduce its reliance on one sector, but is also expected to help leverage on the significant opportunities of other sectors.
The strategy is to increase cross-selling opportunities and ensure client retention via increasing the diversity of the product range offered, by utilizing synergies with Abans PLC and by becoming more assiduous in the deposit mobilization process.
• Entering into agreements with leaders of automobile industry
Agreement between market leaders in the automobile industry will lead to reach a wider customer range and address un tap markets in the future.
• Strong Focus on Recovery Strategies
Growing credit facilities in the market will automatically lead to increase credit defaults by customers if proper recovery processes are not in place. Therefore a sound recovery process needs to be established in order to maintain default rates at a reasonable level.
• Cost Reduction Strategies and Dealing with Banks
Raising interest cost will narrow the margins and Company pays higher attention in this aspect. The Company maintains banking relationships to reduce the funding cost and obtain funds at the lowest possible rates.
• Expansion of Distribution Footprint
The Company intends to expand its operations by growing its branch network and expanding partnership with dealers and agents. It plans to establish additional branches to cover all potential areas in the country. The Company also intends to increase its operations in the Northern and Eastern provinces.
This initiative will help the Company to tap potential geographies and also contribute towards partly mitigating the risks emerging from increased competition.
• Focus on Brand Building AFPLC’s focus on strengthening its own brand and image in the market is unquestionable. It recently completed thirteen years in operation and is planning to launch a creative campaign, with the objective of emphasizing and highlighting the attributes of reliability and trust.

Over
view
Man
agem
ent D
iscu
ssio
n an
d An
alys
isCo
rpor
ate
Stew
ards
hip
Fina
ncia
l Inf
orm
atio
nSu
pple
men
tary
Inf
orm
atio
n
Abans Finance PLC | Annual Report 2017/18 | 12
MANAGEMENT DISCUSSION AND ANALYSIS [Contd.]
• Attracting Human Skills
Hiring talented individuals is critical to the Company’s success. The Company aims to be more forward looking. We need to understand our future direction as well as the changes happening in the market. In this context, the Company would adopt more rigorous systems of identifying the talent that it would need in the future.
• Leveraging Technology to Extend Reach and Control Costs
Since its inception, the Company has successfully used technolo-gy to gain a competitive advantage in view of intense competition in the sector. Over the next three years, the Company plans to concentrate its technological initiatives in key areas and make more use of Business Intelligence tools.
Financial ReviewTotal Gross Revenue
Total aggregate Gross Revenue increased from Rs.1,620 million in 2016/17 to reach Rs. 1,918 million in 2017/18, recording an increase of 18.34 %. The components of gross revenue consist of items of income that are ‘Interest based’ and ‘Non Interest based’.
Interest based items of revenue consist of interest income earned from Finance leases, Hire Purchase, Loans and Advances and interests earned from money market investments. Non Interest based sources of Income consist of Fee and Commission Income, Net Gain/ (Loss) from Trading and Other Operating Income. The growth in total revenue is mainly due to the growth in Interest based income streams.
Abans Finance PLC being a Licensed Finance Company derives most of its income from interest earned on its Finance Lease and Loan Portfolio. The proportion of Interest Income to Total Income was 89.25 % in 2017/18 as against 92.23 % in 2016/17.
Interest Income
Total interest income for the year 2017/18 was recorded at Rs. 1,712 million, a growth of 14.51% from the previous year. As stated, interest income was mainly derived from asset financing products such as Finance Lease, and Loan Portfolio. Apart from lending products, interest income on Held to Maturity Financial Assets and Placements with Banks were other main contributors of interest income.
A component analysis of interest income indicates that asset financing products such as finance leases and loans accounted for 91.23 % of total interest income in year 2017/18 (year 2016/17 -90.89 %).
-
200
400
600
800
1,000
1,200
1,400
1,600
1,800
2013/14 2014/15 2015/16 2016/17 2017/18
Rs.M
n
Aggregate Gross Revenue
Interest Based Income Non Interest Based Income
-
200
400
600
800
1,000
1,200
1,400
1,600
1,800
2013/14 2014/15 2015/16 2016/17 2017/18
Rs.M
n
Interest Income Components
Other Financial Assets
Loans and AdvancesHire Purchases
Finance Leases

Over
view
Man
agem
ent D
iscu
ssio
n an
d An
alys
isCo
rpor
ate
Stew
ards
hip
Fina
ncia
l Inf
orm
atio
nSu
pple
men
tary
Inf
orm
atio
n
Abans Finance PLC | Annual Report 2017/18 | 13
MANAGEMENT DISCUSSION AND ANALYSIS [Contd.]
Interest Expenses
Interest Expenses increased to Rs. 814 million in 2017/18 from Rs.624 million in 2016/17 which is an increase of 30.46%.
The components of Interest costs indicate that Interest Expense Due to Customers accounted for 96.82 % of total Interest Cost for year 2017/18 compared to 97.1% in 2016/17.
Net Interest Income / Net Interest Margin (NIM)
Net Interest Income increased from Rs. 871.03 million in 2016/17 to reach Rs. 897.99 million in 2017/18, an increase of 3 %. The NIM settled at 12.15% as at end March 2018, a decline from the achieved NIM of 14.09% in 2016/17.
Non Interest Based Income
Non Interest based income grew from Rs. 125.8 million as at end 2016/17 to reach Rs. 206.0 million as at March 2018, an increase of 63.78%. The objective of increasing fee based income lies in the fact that it provides a cushion for supporting an increase in operational costs. Attempts are being made to provide value added services to clients with a view in enabling the Company to increase its fee based income streams.
Cost to Income Ratio
The Cost to Income ratio increased to 56.83 % during the year under review from 51.53 % recorded in the year 2016/17. The increase in operational costs was 16.13%. (2016/17-26.14%), attributed in the main towards the increase in personnel cost.
Personnel Cost increased from Rs.217.08 million in 2016/17 to Rs. 256.39 million in 2017/18, an increase of 18.11%, Increases stemming from higher personnel expenses was triggered by increase in new recruitments and staff training initiatives.
Other Operating Expenses increased from Rs.234.28 million in 2016/17 to Rs.265.78 million in 2017/18, an increase of 13.45%.
-
100
200
300
400
500
600
700
800
900
2013/14 2014/15 2015/16 2016/17 2017/18
Rs.M
n
Interest Expenses
Debt Instrument and others
Due to banks
Due to customers
0%
2%
4%
6%
8%
10%
12%
14%
16%
-
100
200
300
400
500
600
700
800
900
1,000
2013/14 2014/15 2015/16 2016/17 2017/18
Rs.M
n
Net Interest Income (Rs.Mn) & Net Interest Margin (%)
Net Interest Income Net Interest Margin
-20%
0%
20%
40%
60%
80%
100%
120%
140%
-
50
100
150
200
250
2013/14 2014/15 2015/16 2016/17 2017/18
Rs.M
n
Non Interest Based Income (Rs. Mn) and Growth Rate (%)
Non Interest Based Income Growth
0%
10%
20%
30%
40%
50%
60%
70%
80%
90%
-
100
200
300
400
500
600
2013/14 2014/15 2015/16 2016/17 2017/18
Rs.M
n
Operational Expenses (Rs. Mn) & Cost to Income Ratio (%)
Total Operating Cost Cost to Income Ratio

Over
view
Man
agem
ent D
iscu
ssio
n an
d An
alys
isCo
rpor
ate
Stew
ards
hip
Fina
ncia
l Inf
orm
atio
nSu
pple
men
tary
Inf
orm
atio
n
Abans Finance PLC | Annual Report 2017/18 | 14
MANAGEMENT DISCUSSION AND ANALYSIS [Contd.]
Profitability
The Profit before Tax for the year 2017/18 reached a total of Rs. 132.95 million and the Profit after Tax was Rs. 94.86 million in comparison to the Rs. 197.41 million and Rs. 133.56 million recorded respectively in 2016/17. The decline in profitability has adversely impacted profitability ratios for the year; the Company has recorded Return on Total Assets (ROTA) and Return on Average Equity (ROAE) of 1.15% and 6.83%.
Based on the taxation charge made in the accounts the effective tax rate of the Company was 29% for 2017/18 as against 32% for financial year 2016/17.
0%
10%
20%
30%
40%
50%
60%
70%
-
50
100
150
200
250
2013/14 2014/15 2015/16 2016/17 2017/18
Rs.
Mn
PBT, PAT & Effective Tax Rate
PBT PAT Effective Tax Rate
0%2%4%6%8%
10%12%14%16%18%
2013/14 2014/15 2015/16 2016/17 2017/18
ROTA & ROAE (%)
ROTA ROAE
-200%
-100%
0%
100%
200%
300%
400%
500%
600%
700%
800%
-
0.50
1.00
1.50
2.00
2.50
3.00
2013/14 2014/15 2015/16 2016/17 2017/18
Rs.
Earnings Per Share
EPS Growth
Earnings Per Share (EPS)
The EPS for the year 2017/18 was Rs.1.44 per Ordinary Share in Issue compared to the EPS of Rs.2.36 reported in 2016/17.
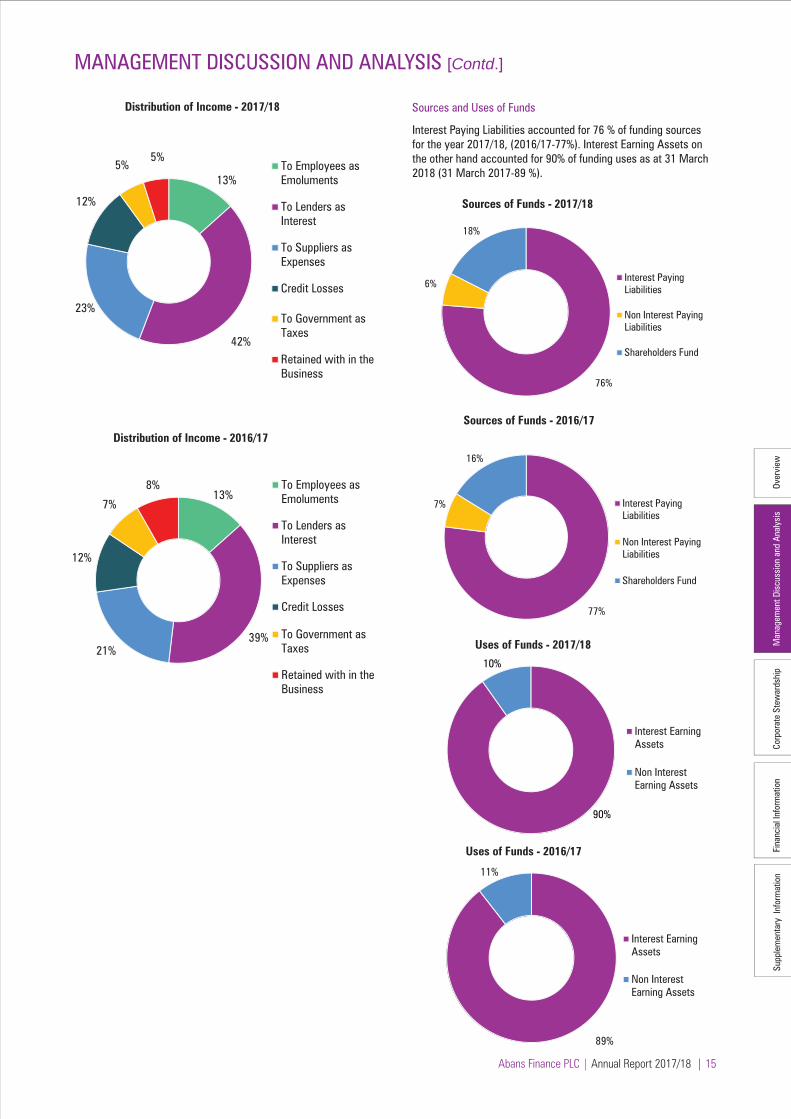
Sources and Distribution of Income
Interest Income represented 89% of Total Income for the year 2017/18 as against 92% for the year 2016/17. In terms of distribution of income, interest costs absorbed 42% of Total Income (2016/17- 39 %) and 23 % distributed among the suppliers as expenses. (2016/17- 21%)
89%
11%
Sources of Income - 2017/18
Interest Income
Other Income
92%
8%
Sources of Income - 2016/17
InterestIncome
Other Income
Over
view
Man
agem
ent D
iscu
ssio
n an
d An
alys
isCo
rpor
ate
Stew
ards
hip
Fina
ncia
l Inf
orm
atio
nSu
pple
men
tary
Inf
orm
atio
n
Abans Finance PLC | Annual Report 2017/18 | 15
MANAGEMENT DISCUSSION AND ANALYSIS [Contd.]
Sources and Uses of Funds
Interest Paying Liabilities accounted for 76 % of funding sources for the year 2017/18, (2016/17-77%). Interest Earning Assets on the other hand accounted for 90% of funding uses as at 31 March 2018 (31 March 2017-89 %).13%
42%
23%
12%
5%5%
Distribution of Income - 2017/18
To Employees asEmoluments
To Lenders asInterest
To Suppliers asExpenses
Credit Losses
To Government asTaxes
Retained with in theBusiness
13%
39%21%
12%
7%
8%
Distribution of Income - 2016/17
To Employees asEmoluments
To Lenders asInterest
To Suppliers asExpenses
Credit Losses
To Government asTaxes
Retained with in theBusiness
76%
6%
18%
Sources of Funds - 2017/18
Interest PayingLiabilities
Non Interest PayingLiabilities
Shareholders Fund
77%
7%
16%
Sources of Funds - 2016/17
Interest PayingLiabilities
Non Interest PayingLiabilities
Shareholders Fund
90%
10%
Uses of Funds - 2017/18
Interest EarningAssets
Non InterestEarning Assets
89%
11%
Uses of Funds - 2016/17
Interest EarningAssets
Non InterestEarning Assets

Over
view
Man
agem
ent D
iscu
ssio
n an
d An
alys
isCo
rpor
ate
Stew
ards
hip
Fina
ncia
l Inf
orm
atio
nSu
pple
men
tary
Inf
orm
atio
n
Abans Finance PLC | Annual Report 2017/18 | 16
MANAGEMENT DISCUSSION AND ANALYSIS [Contd.]
Stakeholders AnalysisEngaging Stakeholders
As a financial services provider, Stakeholders’ engagement processes are considered key to our growth as we recognize that stakeholder concerns provide guidance to our next strategic goal. It is a key input to our strategic planning process as it enables evaluation of our strengths & weaknesses in a systematic manner using feedback from our key stakeholders.
The schematic diagram below summarises how we engage with our valued stakeholder groups.
Stakeholder
Balancing Profitability and sustainable growth
Annual General Meeting
Annually Return on Investment
To deliver returns on investment by strengthening governance to support future growth momentum
Extra Ordinay General Meeting
Whenever necessary
Development of Shareholder communication
To establish strong internal processes and policies
Official Website
Annual Reports
Regularly
Annually
Continuous engagement
Shareholder
Customer complaint handling
Customer Surveys Regularly Promotional Compaign
Quality customer service
Customer complaints handling mechanism
Regularly Customer care service
Handling customer complaints
Call Centre & Official web-site
Regularly
Customers
Career Development Annual Get together Annually Organized peridically
Work Life Balance Training Procedures Monthly Continuous Training
Promotions and Job Oppartunities
Department Head Involvement with the employees
Monthly Job Enrichment
Internal Promotion
Employees
Reporting to CSE and Central Bank to ensure compliance
Meetings with Regulatory Bodies
Industry Forums
Compliance with the requlatory requirements
Whenever required Strengthening relationships with public and professional institutions
Regulators
Employment Opportunities
Community Development
Sponsorships
Feedback Comments
Call Centre
Ongoing Funding towards sponsorships
Responses given by the management & staff
Society &Environment
SustainableBusinessObjective
EngagementMechanism
Frequency ofEngagement
Our Responses /Achievements

Over
view
Man
agem
ent D
iscu
ssio
n an
d An
alys
isCo
rpor
ate
Stew
ards
hip
Fina
ncia
l Inf
orm
atio
nSu
pple
men
tary
Inf
orm
atio
n
Abans Finance PLC | Annual Report 2017/18 | 17
MANAGEMENT DISCUSSION AND ANALYSIS [Contd.]
External Capital FormationExternal sources of capital comprise of Investor Capital, Customer Capital, Employee Capital, Social Capital and Environmental Capital that are generated through external relationships with stakeholders and commercial partnering with our customers. These are the sources that the Company uses to raise capital and deliver value to its key stakeholders.
Investor Capital
The return generated by the Company by using its Investors’ Funds with a view to maximizing and delivering value.
Market Capitalisation
The Stated Capital of the Company as at the end of the year under review was Rs. 1,121.41 million. This capital was accumulated and increased by way of a rights issue of Rs. 277 million (11.09 million No. of shares) made during the year. The market capitaliza-tion and share price of the Company as at 31 March 2018 was 114.78 million and Rs. 21.30 respectively. Further the Company continued to be listed on the Diri Savi Board of the Colombo Stock Exchange from year 2011 onwards.
Market Price of the Shares
According to Colombo Stock Exchange, the Company recorded a highest market price of Rs. 37.50 and a lowest of Rs. 21.00 during the financial year of 2017/2018. The changes of market price in comparison to the previous year are given below.
Market Price 2017/18 2016/17 Rs. Rs.
Highest 37.50 69.90
Lowest 21.00 23.00
Price as at 31 March 21.30 24.10
Earnings
The Basic Earnings per Share (EPS) of Rs. 1.44 has been achieved by the Company during the year and is 64% lower than the previous year’s Basic Earnings per Share of Rs. 2.36
Net Assets Value per Share (NAV)
The Company has achieved a 23% growth in Net Assets during the year from Rs. 1,210.3 million in 2016/17 to Rs. 1,567.6 million 2017/18. The Net Assets per Share reached the mark of Rs. 23.55 as at 31 March 2018.
0%
20%
40%
60%
80%
100%
120%
-
5.00
10.00
15.00
20.00
25.00
30.00
35.00
2013/14 2014/15 2015/16 2016/17 2017/18
Rs.
Net Asset Value per Share (NAV)
NAV Growth
Over
view
Man
agem
ent D
iscu
ssio
n an
d An
alys
isCo
rpor
ate
Stew
ards
hip
Fina
ncia
l Inf
orm
atio
nSu
pple
men
tary
Inf
orm
atio
n
Abans Finance PLC | Annual Report 2017/18 | 18
MANAGEMENT DISCUSSION AND ANALYSIS [Contd.]
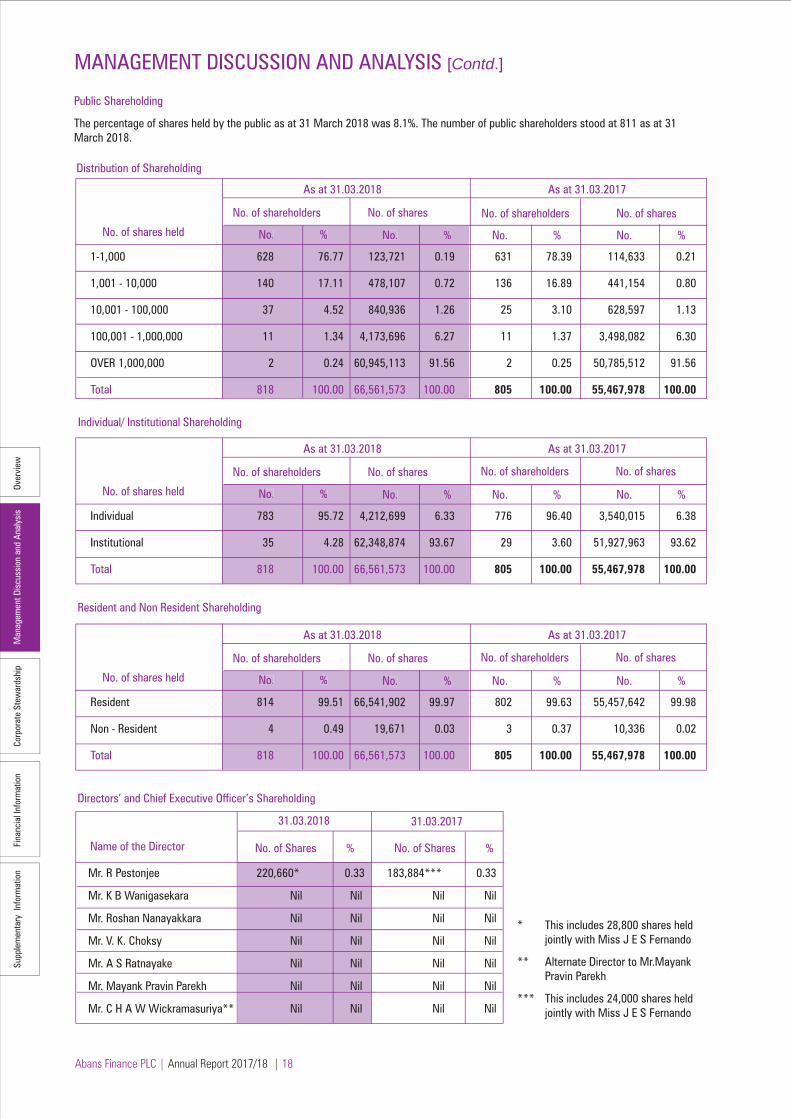
Public Shareholding
The percentage of shares held by the public as at 31 March 2018 was 8.1%. The number of public shareholders stood at 811 as at 31 March 2018.
No. of shares held
631 78.39 114,633 0.21
136 16.89 441,154 0.80
25 3.10 628,597 1.13
11 1.37 3,498,082 6.30
2 0.25 50,785,512 91.56
805 100.00 55,467,978 100.00
No. of shareholders
No. % No. % No. % No. %
No. of shares No. of shareholders No. of shares
As at 31.03.2018 As at 31.03.2017
No. % No. %
1-1,000 628 76.77 123,721 0.19
1,001 - 10,000 140 17.11 478,107 0.72
10,001 - 100,000 37 4.52 840,936 1.26
100,001 - 1,000,000 11 1.34 4,173,696 6.27
OVER 1,000,000 2 0.24 60,945,113 91.56
Total 818 100.00 66,561,573 100.00
No. of shares held
776 96.40 3,540,015 6.38
29 3.60 51,927,963 93.62
805 100.00 55,467,978 100.00
No. of shareholders
No. % No. % No. % No. %
No. of shares No. of shareholders No. of shares
As at 31.03.2018 As at 31.03.2017
No. % No. %
Individual 783 95.72 4,212,699 6.33
Institutional 35 4.28 62,348,874 93.67
Total 818 100.00 66,561,573 100.00
Individual/ Institutional Shareholding
Resident and Non Resident Shareholding
Directors’ and Chief Executive Officer’s Shareholding
No. of shares held
802 99.63 55,457,642 99.98
3 0.37 10,336 0.02
805 100.00 55,467,978 100.00
No. of shareholders
No. % No. % No. % No. %
No. of shares No. of shareholders No. of shares
As at 31.03.2018 As at 31.03.2017
No. % No. %
Resident 814 99.51 66,541,902 99.97
Non - Resident 4 0.49 19,671 0.03
Total 818 100.00 66,561,573 100.00
Name of the Director No. of Shares
31.03.2018 31.03.2017
% No. of Shares %
Mr. R Pestonjee 220,660* 0.33 183,884*** 0.33
Mr. K B Wanigasekara Nil Nil Nil Nil
Mr. Roshan Nanayakkara Nil Nil Nil Nil
Mr. V. K. Choksy Nil Nil Nil Nil
Mr. A S Ratnayake Nil Nil Nil Nil
Mr. Mayank Pravin Parekh Nil Nil Nil Nil
Mr. C H A W Wickramasuriya** Nil Nil Nil Nil
* This includes 28,800 shares held jointly with Miss J E S Fernando
** Alternate Director to Mr.Mayank Pravin Parekh
*** This includes 24,000 shares held jointly with Miss J E S Fernando
Distribution of Shareholding

Over
view
Man
agem
ent D
iscu
ssio
n an
d An
alys
isCo
rpor
ate
Stew
ards
hip
Fina
ncia
l Inf
orm
atio
nSu
pple
men
tary
Inf
orm
atio
n
Abans Finance PLC | Annual Report 2017/18 | 19
MANAGEMENT DISCUSSION AND ANALYSIS [Contd.]
Twenty Major Shareholders of the Company
NAME OF THESHAREHOLDER
31 March 2018
Abans PLC 39,717,534 71.60
Ironwood Investment Holding (Pvt) Limited 11,067,978 19.95
Mr. P N Pestonjee 759,600 1.37
Able Investments (Pvt) Limited 672,431 1.21
Mr. K Kunenthiran 389,014 0.70
Mrs. C V Sumanadasa 370,000 0.67
Mrs. S C Henagama Gamage 370,000 0.67
Mr. B Pestonjee 256,800 0.46
Mr. R Pestonjee ** 183,884 0.33
Mrs. S Dubash 160,353 0.29
A B Cold Storage (Pvt) Ltd 120,000 0.22
Cleantech (Pvt) Ltd 120,000 0.22
AB Securitas (Pvt) Ltd 120,000 0.22
Mr. J S A Perera & Mrs. R N Perera 68,316 0.12
Mrs. A Pestonjee 66,667 0.12
Mrs. H I Salgado 66,600 0.12
Mr. G C Goonetilleke 48,105 0.09
Nation Lanka Capital Ltd/K L G Uday 32,300 0.06
Miss. M F F Safina 30,624 0.06
Mr. R E Rambukwella 30,517 0.06
54,650,723 98.53
OTHERS 817,255 1.47
TOTAL 55,467,978 100.00
NO. OF SHARES (%)
NAME OF THESHAREHOLDER
31 March 2017
NO. OF SHARES (%)
Abans PLC 33,063,877 49.67
Ironwood Investment Holding (Pvt) Limited 27,881,236 41.89
Mr. P N Pestonjee 911,520 1.37
Able Investments (Pvt) Limited 806,917 1.21
Mr. K Kunenthiran 466,816 0.70
Mrs. C V Sumanadasa 444,000 0.67
Mrs. S C Henagama Gamage 444,000 0.67
Mr. B Pestonjee 308,160 0.46
Mr. R Pestonjee * 220,660 0.33
Mrs. S Dubash 192,423 0.29
A B Cold Storage (Pvt) Ltd 144,000 0.22
Cleantech (Pvt) Ltd 144,000 0.22
AB Securitas (Pvt) Ltd 144,000 0.22
Mrs. A Pestonjee 80,000 0.12
Mrs. H I Salgado 66,600 0.10
Mr. G C Goonetilleke 48,105 0.07
Nation Lanka Capital Ltd/K L G Uday 38,004 0.06
Mr. R E Rambukwella 37,120 0.06
Miss. M F F Safina 36,748 0.06
Dr. K. Poologasundram 36,000 0.05
65,514,186 98.43
OTHERS 1,047,387 1.57
TOTAL 66,561,573 100.00
* This includes 28,800 shares held jointly with Miss. J. E. S. Fernando**This includes 24,000 shares held jointly with Miss. J. E. S. Fernando

Over
view
Man
agem
ent D
iscu
ssio
n an
d An
alys
isCo
rpor
ate
Stew
ards
hip
Fina
ncia
l Inf
orm
atio
nSu
pple
men
tary
Inf
orm
atio
n
Abans Finance PLC | Annual Report 2017/18 | 20
MANAGEMENT DISCUSSION AND ANALYSIS [Contd.]
Compliance report in terms of section 7.6- Contents of the Annual Report in terms of the Listing Rules of the Colombo Stock Exchange
The table below summarises the Company’s degree of compliance with section 7.6 of the Listing Rules issued by the Colombo Stock Exchange.
Rule No. Disclosure Requirements Section Reference Page No.
7.6 (i) Names of persons, who during the financial year were Report of the Board of Directors. 61 Directors of the Entity.
7.6 (ii) Principal activities of the entity and its subsidiaries during Company does not have any Subsidiary. Refer Notes 75 the year and any changes therein. to the Financial Statements (Note 1.2)
7.6 (iii) The names and the number of shares held by the 20 Management Discussion and Analysis - External Capital 19 largest holders of voting and non- voting share and the Formation - Investor Capital. percentage of such shares held. 7.6 (iv) The Public Holding percentage. Management Discussion and Analysis - External Capital 18 Formation - Investor Capital.
7.6 (v) A Statement of each Directors’ holding and Chief Executive Management Discussion and Analysis - External Capital 18 Officer’s holding in shares of the Entity at the beginning and Formation - Investor Capital end of the financial year.
7.6 (vi) Information pertaining to material foreseeable risk Risk Management Report. 54 factors of the Entity.
7.6 (vii) Details of material issues pertaining to employees and Management Discussion and Analysis -External Capital 22-24 industrial relations of the Entity. Formation -Employee Capital, Social and Environment Capital.
7.6 (viii) Extents, locations, valuations and the number Supplemenotry Information - Details of Freehold Land. 128 of buildings of the Entity’s land holdings and investment properties. 7.6 (ix) Number of shares representing the Entity’s Stated Capital. Notes to the Financial Statements -Note 34 105
7.6 (x) A distribution schedule of the number of holders in Management Discussion and Analysis - External Capital 18 each class of equity securities, and the percentage of Formation - Investor Capital their total holdings.
7.6 (xi) Ratios and Market Price Information
- Dividend per Share Company has not declared any dividend for the year N/A under review and hence it is not applicable - Dividend Pay Out
- Net Asset Value per Share Management Discussion and Analysis - External Capital 17 Formation - Investor Capital - Market Value Per Share 7.6 (xii) Significant changes in the Entity’s or its subsidiaries' Not Applicable N/A fixed assets and the market value of land, if the value differs substantially from the book value.
7.6 (xiii) Details of funds raised through Public Issues, Right Issues Report of the Board of Directors-Equity and Reserves 60 and Private Placement during the year. & Issue of Ordinary shares during the year.
7.6 (xiv) Information in respect of Employee Share Option / The Company does not have an Employee Share N/A Purchase Scheme Option / Purchase Scheme.
7.6 (xv) Disclosures pertaining to Corporate Governance practices Corporate Governance Report (Section - Two & Three) 20 & in terms of Rules 7.10.3, 7.10.5 c and 7.10.6.c of section and this report satisfies the requirements. 40-48 7 of the Rules.
7.6 (xvi) Related Party transactions exceeding 10% of the Equity Note No. 45 to the Financial Statements and "Directors 62 & or 5% of the Total Assets whichever is lower. Interest in contracts and Related Party Transactions" under 124-129 report of the Board of Directors discloses the transactions with related parties.


Over
view
Man
agem
ent D
iscu
ssio
n an
d An
alys
isCo
rpor
ate
Stew
ards
hip
Fina
ncia
l Inf
orm
atio
nSu
pple
men
tary
Inf
orm
atio
n
MANAGEMENT DISCUSSION AND ANALYSIS [Contd.]
Customer Capital
The Company’s major business activities comprise of lending and acceptance of deposits. Lending portfolio consists mainly of Finance Leases, Hire Purchase, Mortgage Loans, Revolving Loans, Business Loans and Personal Loans. Company also offers tailor-made financial solutions which cater to diverse needs of a pool of customers. Further Deposits include Term and Saving Deposits.
PRODUCT PORTFOLIO
Finance Leasing
A Finance Lease is a contractual agreement where the owner (Lessor) of the equipment /asset, transfers the right to use the equipment/asset to the user (lessee) for an agreed period of time in return for a periodic rental. The entire risks incidental to the usage of the asset is transferred to the lessee, who has to bear the cost of insurance, maintenance and repairs. The lessor agrees to transfer the title of the equipment/asset to the lessee at the end of the lease period, once all rentals are paid.Abans Finance PLC has focused more on the provision of Finance Leases for two wheelers and three wheelers. In this regard, Abans Group as a supplier is making a massive contribution.
Two Wheeler Leasing
Abans Finance has been able to penetrate the market on two wheelers from the time of the introduction of the Hero motorcy-cle product. The Company is confident that with the additional features designed for the leasing product and the utilization of Hero Two Wheeler Network of the Abans Group, the Company can further strengthen the product performance significantly in the future.
Four Wheeler Leasing
The Company also provides special packages with flexible payment schemes to suit the customer requirements which include, Finance Leases for brand-new and reconditioned Motor Vehicles and Plant and Machinery.
Three Wheeler Leasing
The Company offers the easiest and most convenient way to lease brand new & registered three wheelers. Loans
The Company has a different range of loan products to cater to various customer needs. The loan portfolio consists of following loans.
• Personal Loans• Mortgage Loans• Revolving Loans• Business Loans
* Personal Loans
Personal Loans are focused on Individuals who are in need of financial support for their personal needs. This is a specific predetermined market segment of the Company.
* Mortgage Loans
The terms of a Mortgage Loan include a specific payment period and interest rate. The borrower (mortgagor) gives the lender (mortgagee) a lien over the property as collateral for the loan. The mortgagor's lien on the property expires when the mortgage is paid in full.
* Revolving Loans
A flexible loan scheme provided on the security of property where the borrower has the option to make capital repayments on a staggered basis whereas the interest is paid on a regular basis. The borrower also has the option to obtain additional funds as and when capital repayments are made on the facility depending on the terms and conditions.
* Business Loans
Business Loans are granted to Individuals with Business Registration or business entities within a specific pre-determined market segment to meet the financial requirements with particular attention to operational cash flow needs.
Deposits
The Company promotes Fixed and Saving Deposits as its major funding source. Upward movement in interest rates in line with increased policy rates have made a significant impact in the deposit base. The Company had re-priced interest rates on its deposits on several occasions during the year under review, to remain competitive in the market.
CUSTOMER SATISFACTION
The Company continuously monitors and provides solutions on customer complaints, queries and customer requests. Abans Finance encourages its customers to provide their feedback and suggestions on the service that the Company provided to them. All customer feedback and complaints received are forwarded to relevant departments for immediate solutions.
Employee Capital
A key driver of the organization’s success is Human Capital and with increasing importance being placed on understanding its role. It is a significant asset an organization has as business models become centered on people, intellectual capital and technology. Further, the shape of the future of the organization and current performance is attached to employee’s talent, skills, personal attributes and creativity. We take responsibility to build a healthy culture which motivates employees to learn and grow with opportunities and prosper in their chosen career path. We give opportunities for employees to become essential building blocks for creating value. With the high complexity and the current challenging business environment, it requires us to take a proactive approach in order to derive a dynamic, people-driven organization.
Workforce
In order to accommodate rapid growth in operations with 09 branches and 09 Centers across the country, we have a total workforce of 370. Out of the total workforce, 74 % are under permanent cadre, whilst the balance 21 % come under the probation cardre and 5 % are on contract.
- 5,000 10,000 15,000 20,000 25,000 30,000 35,000 40,000 45,000
2017/18
2016/17
2015/16
2014/15
2013/14
Composition of Customer Base
Leasing Hire Purchase Loans Deposit
No. of customers
Abans Finance PLC | Annual Report 2017/18 | 22

Over
view
Man
agem
ent D
iscu
ssio
n an
d An
alys
isCo
rpor
ate
Stew
ards
hip
Fina
ncia
l Inf
orm
atio
nSu
pple
men
tary
Inf
orm
atio
n
Abans Finance PLC | Annual Report 2017/18 | 23
MANAGEMENT DISCUSSION AND ANALYSIS [Contd.]
Type of Employment Male Female Total
Permanent 156 118 274
Probationers 50 27 77
Contract 6 13 19
Total 212 158 370
Workforce by Gender, Age & Grade
In order to ensure equality the Company always tries to give equal opportunity to female employees. The current composition of male and female workforce is 57% and 43% respectively.The Company always tries to attract young employees for executive & below grades whilst well experienced middle aged employees are selected for management & above grades.
Grade Male Female Total Senior Management 7 1 8 Management 43 7 50 Executive 119 103 222 Trainee Executive 33 34 67 Other 10 13 23 Total 212 158 370
Age Analysis
Age Group Male Female Total Below 21 years 5 9 14 21-30 years 126 114 240 31-40 years 44 20 64 41-50 years 25 7 32 Above 51 years 12 8 20 Total 212 158 370
Composition of Work Force by Gender & LocationBelow tabulation shows how our workforce is located by province.
Province Male Female Total Central 29 27 56 Eastern 16 12 28 North Central 17 5 22 North Western 14 7 21 Nothern 9 7 16 Sabaragamuwa 9 7 16 Southern 20 7 27 Uva 8 3 11 Western 90 83 173 Total 212 158 370
Recruitment 2017/18
Our talent management strategies are geared to ensure that people with the right skills and capabilities are in the right roles by recruiting the right people for the right job positions to enhance the positive direction of the Company’s future. Further to support career development, we widened the scope of the professional development program. We are passionate about our employees and we continue to follow policies and practices that are in strict conformity with all relevant labor statutes.
Our recruitment process encourages the applicants who have the requisite qualification and experience. We short list and select applicants on clear criteria and guidelines as set within the job description.
In the year under the review, we recruited 89 employees to our workforce. Out of the new recruitments, 52 % were for male employees.
Gender & Grade Male Female Total Senior Management 1 1 2 Management 4 0 4 Executive 13 3 16 Trainee Executive 25 28 53 Other 3 11 14 Total 46 43 89 As a Percentage 51.69 48.31 100.00
Rewards & Recognition
Retention of talented skilled work force is a pillar to the sustainability of any successful business. Rewards & Recogni-tion is a critical element in the HR Process which ensures retention of quality workforce. The Company’s Rewards & Recognition process is aimed at identifying talented workforce and rewarding them in a timely manner. The employee evaluation process is transparent, in order to ensure that each employee knows that they are rewarded based on their performance.
The Company tries to actively engage all its employees in achieving the set strategic goals while rewarding & motivating them. Work Life balance is always considered an ultimate objective of HR functions.
Performance Evaluations are carried out annually and all incentives and rewards are determined on performance merits ascertained during the evaluation. In addition front line staff is incentivized based on the achievement of given targets.To assess the need for improvements, HR department carries out a comprehensive review of the benefit structure. Main benefits offered by the Company are as follows.
• Salary Increments and market adjustments• Performance based incentives• Bonus (Based on the Company profits)• Staff Loans at concessionary rates• Medical Insurance• Study Leave
Training & Development
Training helps to enhance the productivity, quality improvement, safety, reduction of turnover and learning time and ability to maintain an effective Work Force. We deploy targeted people strategies aimed at motivating and retaining people by providing compelling opportunities for both personal and professional development. With the changes of the business scope, behavior or change in the market, employee should be trained to improve individual skills and maintain the performance level of an organization.
We invest in training and development programs to improve team morale, confidence and hone the skills, to strengthen human relations, addressing the weaknesses of the employees, promote productivity with quality standards, and enhance the Company profile.

Over
view
Man
agem
ent D
iscu
ssio
n an
d An
alys
isCo
rpor
ate
Stew
ards
hip
Fina
ncia
l Inf
orm
atio
nSu
pple
men
tary
Inf
orm
atio
n
MANAGEMENT DISCUSSION AND ANALYSIS [Contd.]
- Adopting practices that will benefit the resource efficiency, lower energy consumption, emissions and waste minimization.
- Retaining customers who have contributed positively to the environment.
- Making our employees feel that they work in an environmental-friendly Company. In order to positively display the employers’ contribution, Abans Group of Companies has a waste management and water efficiency system in a sister Company.
Community
As a responsible corporate citizen, the Company has understood its corporate responsibility towards the public. Some of the key community activities of the Company are providing training and development opportunities to young school leavers and undergraduates. These trainings have empowered these students to obtain employment in corporate entities and become successful citizens.
Company has also trained and developed the university students enabling them to achieve the industry requirements and assist them to enhance their career prospects. The Company, as part of its obligations has identified the importance in practical training and has assisted them to fulfill their training requirements while giving them priority as and when job opportunities arise within the Company.
Annually, the Company conducts, Training Need Analysis based on annual performance appraisal and developments. Both internal and external trainings are arranged based on the requirement.
In-house training or internal training provide on the job, internal seminars or conferences. Also internal training has the potential to positively impact employee learning and development. For these programs we make use of the experience and expertise of our team members for training sessions to share their experience gained. External training includes programs carried out by the professional institutions, the regulators etc.
Social & Environmental Capital
The Company operates within its social internal environment that simply includes: customs, beliefs, practices and behaviours within the confines of the environment. The organizational values of Abans Finance PLC ensure that they always encourage their customers and employees through community development that contribute to the society and the environment.
Work Place
Company is in a position of ensuring that the entire business is conducted in accordance with professional, ethical and legal standards. Management of Abans Finance helps in creating the working environment which fits with the Company culture and becomes more comfortable to the entire staff.
Health & Safety
The Company provides and ensures to maintain a clean, healthy and safe working environment. Further Abans Finance conforms to the safety working practices in achieving Company’s goals and objectives. We involve with our employees and make them aware, so that everyone develops positive attitudes and behaviors for their safety.
Market Place
Customers
Customer satisfaction is a key indicator of how likely the same customer will obtain another service in the future. Abans Finance always ensures that its customers are satisfied to an extent where they come back to receive the same or a different service provided by the Company.
The business of finance is always competitive. Companies repeatedly compete for good customers. Therefore, the Company always ensures customer satisfaction is a key differentiator in the business the Company operates.
Environment
Abans Finance has recognized the importance of minimizing a direct environmental impact of its business activities and in this context the Company continuously focuses on improving environmental friendly business practises. We monitor and ensure the impact on the environment by;
Abans Finance PLC | Annual Report 2017/18 | 24

Over
view
Man
agem
ent D
iscu
ssio
n an
d An
alys
isCo
rpor
ate
Stew
ards
hip
Fina
ncia
l Inf
orm
atio
nSu
pple
men
tary
Inf
orm
atio
n
Abans Finance PLC | Annual Report 2017/18 | 25
BOARD OF DIRECTORS
MR. RUSI PESTONJEE (CHAIRMAN)NON-EXECUTIVE DIRECTOR
Appointed as a Director and Chairman with effect from 01 January 2012. A member of the Remuneration Committee and the Chairman of the Nomination Committee of the company.
A Director of Abans PLC. (Formally Abans (Pvt) Ltd). He is an alumnus of the executive management programmes at the Indian School of Business, focusing on strategy and managing family businesses. He supports relationship building with key interna-tional partners and has been instrumental in implementing several new strategic growth initiatives. He also holds directorships within Abans Group of Companies.
MR.ROSHAN ANTHONY NANAYAKKARAMANAGING DIRECTOR
Assumed duties as Chief Executive Officer on 02 May 2016 and appointed to Abans Finance PLC Board as Managing Director/-CEO on 27 September 2017.
He is a member of the Related Party Transaction Review Committee and Integrated Risk Management Committee of the Company.
Mr.Roshan Anthony Nanayakkara’s career spans over 30 years in Banking and Finance sector, having held several key positions in the fields of Credit, Marketing, Financial Planning and Risk Management. He started his career in Credit and his senior positions include Chief Executive Officer of Siyapatha Finance PLC. Head of Risk and Financial Planning at Senkadagla Finance PLC and Assistant General Manager –Leasing at Nations Trust Bank PLC.
Mr. Nanayakkara holds a Master of Business Administration degree from University of Western Sydney, Australia, Executive Diploma in Business Administration from University of Colombo and a Diploma in Credit Management from the Institute of Bankers of Sri Lanka.
MR. AJITH S. RATNAYAKEFCA, FCMA (UK), ACCA, CMA, FCMI, FCMA, CGMAINDEPENDENT NON-EXECUTIVE DIRECTOR
Appointed to the Board on 16 May 2014. Chairman of the Audit Committee and the Related Party Transactions Review Commit-tee. He is also a member of the Remuneration Committee.
Mr. Ajith S. Ratnayake is the founder Director General of the Sri Lanka Accounting and Auditing Standards Monitoring Board (SLAASMB), where he served for 15 years. He was responsible for setting up its monitoring process for financial reporting and auditing of public interest entities in Sri Lanka and building its technical capacity.
As the Director General of SLAASMB, he served in the Advisory Council of the International Forum of Audit Regulators (IFIAR), Consultative Advisory Committees of the International Auditing and Assurance Standards Board (IAASB) and the Ethics Standards Board for Accountants (IESBA), Intergovernmental Group of Experts on International Standards on Accounting and Reporting (ISAR) serviced by the United Nations Conference on Trade and Development (UNCTAD), and in the working group on Commercial Forests of the International Valuations Standards Council (IVSC).
Prior to setting up SLAASMB, Mr. Ratnayake served in a number of private sector enterprises in Sri Lanka and in multinational companies abroad in diverse positions, including as CEO and CFO, over a period of more than 15 years after qualifying as a Chartered Accountant. In his last assignment before SLAASMB, he headed the setting up of the Finance Division of a joint venture Vodafone (UK) established in Fiji. He has extensive experience and expertise in revival of underperforming enterprises and in acting as a catalyst for growth in profitability.
Abans Finance PLC | Annual Report 2017/18 | 26
Over
view
Man
agem
ent D
iscu
ssio
n an
d An
alys
isCo
rpor
ate
Stew
ards
hip
Fina
ncia
l Inf
orm
atio
nSu
pple
men
tary
Inf
orm
atio
n
BOARD OF DIRECTORS [Contd.]
MR.VISHTASP KAIRSHASP CHOKSY(SENIOR DIRECTOR)INDEPENDENT NON-EXECUTIVE DIRECTOR
Appointed to the Board on 15 March 2011. He became the senior Director with effect from 01 January 2012 in terms of the Finance Companies (Corporate Governance) Direction No 3 of 2008.
The Chairman of the Remuneration Committee of the Company, a member of the Audit Committee and the Nomination Committee. Provides specialised legal advice to the company on key business-related issues.
An Attorney- at- Law by profession. Possesses twenty-five years of legal practice and has been specializing in Civil Law with particular emphasis in Commercial, Business and Industrial Law.
MR. MAYANK PAREKHNON-EXECUTIVE DIRECTOR
Appointed to the Board on 14 December 2016.Chairman of the Integrated Risk Management Committee (w.e.f 16 December 2016) and a member of the Remuneration Committee (w.e.f 16 December 2016) and the Related Party Transaction Review Committee (w.e.f 14 December 2016)
Mayank Parekh is the founder of Grange Partners (2012), a private investment holding company based in Singapore focused on making venture and growth capital investments in the SME sector across Southeast Asia. From 2007 to 2012, Mr. Parekh was a General Partner/Managing Director with Southern Capital Group (SCG), a private equity fund based in Singapore focused on middle market leveraged buyouts pan-Asia. The firm adopts an activist value-add approach and Mayank led the portfolio management function; he was on the Board of several portfolio companies, including holding Chairman Positions. Prior to joining SCG, Mr. Parekh spent 11 years with McKinsey & Company across three offices, namely Chicago, Johannesburg and Singapore. He joined McKinsey post-MBA in 1996 and was elected a Partner in 2001. At McKinsey, Mayank was the Managing Partner of the Singapore Office; prior to that, he held the position of Managing Partner, Corporate Finance Practice, Southeast Asia.
Mr. Parekh earned his MBA in Finance from the University of Chicago, Graduate School of Business in 1996 and his Bachelor of Arts in Economics and Psychology from Hamilton College in 1989.
MR. CHANAKA WICKRAMASURIYA (CFA)NON-EXECUTIVE DIRECTOR (ALTERNATE TO MR. MAYANK PAREKH)
Appointed to the Board on 14 December 2016. An alternate director to Mr.Mayank Parekh.
Mr. Chanaka Wickramasuriya is currently joint Managing Partner at Ironwood Capital Partners. He has a long track record in Private Equity as a Partner with Aureos Capital and LR Global Lanka. From 2009 to 2011 he was a Partner at Aureos Capital, where he oversaw the development and functioning of the overall Global Portfolio Management process. During this time, he was also seconded to the Aureos’ China office and oversaw portfolio management and investment in 4 transactions. From 2000 to 2006 he was a Partner based at Aureos’ Colombo office where he worked on investment transactions, exits, and sat as a Board Representative for 10 transactions in Sri Lanka. From 2006 to 2009 he functioned as Country Head of Fitch Ratings in Colombo, and has also worked as Head of Research for a local stock broking firm. Chanaka was also the Managing Partner of LR Global Lanka Private Equity Fund.
Mr. Chanaka Wickramasuriya graduated Summa Cum Laude with a BSc in Electrical Engineering from The Rutgers College of Engineering and is also a Chartered Financial Analyst (CFA).

Over
view
Man
agem
ent D
iscu
ssio
n an
d An
alys
isCo
rpor
ate
Stew
ards
hip
Fina
ncia
l Inf
orm
atio
nSu
pple
men
tary
Inf
orm
atio
n
Abans Finance PLC | Annual Report 2017/18 | 27
CHAIRMAN’S STATEMENT ON CORPORATE GOVERNANCE
Dear Stakeholder,
It is my pleasure to present the Corporate Governance Report on behalf of the members of the Board of Abans Finance PLC for the year ended 31 March 2018.This report gives details of our progress, achievements, challenges and areas which we seek to improve. The Board firmly believes that a robust governance structure is vital for effective management of the Company.
We continue to adopt all mandatory guidelines on corporate governance such as Finance Companies (Corporate Governance) Direction No.3 of 2008 as amended, Listing Rules of the Colombo Stock Exchange and in addition, voluntarily adopted Code of Best Practice on Corporate Governance 2013 issued jointly by the Institute of Chartered Accountants of Sri Lanka and the Securities and Exchange Commission of Sri Lanka.
At Abans Finance PLC, we believe that building a sound Corporate Culture is vital to establish good governance practices. We are confident that such a culture will enhance the success of the business and realise long term shareholder value by enhancing the trust of our depositors whilst safeguarding the interest of our stakeholders. The Company is committed to high standards of Corporate Governance and business integrity, which are essential in maintaining the trust of its investors and other stakeholders.
During the year under review, the Board focused more on improving its effectiveness towards governance and conducted an independent evaluation on the Board’s effectiveness. This encompasses the effectiveness of the Board as a whole, and the effectiveness of each Sub-Committee of the Board.
I wish to extend my appreciation to the members of the Board who have been supportive and committed in their efforts in implementing a good governance culture within the Company. Their contribution at meetings of the Board as well as at the Sub-Committees of the Board in sustaining transparent governance practices is immense. Going forward, we will ensure that we continuously commit to further improve on transparency, accountability and reporting.
The Corporate Governance Report on pages 28 to 48 contains comprehensive governance arrangements as required under the regulations and details on the extent of the Company’s compli-ance with the provisions set out in the regulations.
Rusi PestonjeeChairman / Non-Executive Director25 June 2018

Over
view
Man
agem
ent D
iscu
ssio
n an
d An
alys
isCo
rpor
ate
Stew
ards
hip
Fina
ncia
l Inf
orm
atio
nSu
pple
men
tary
Inf
orm
atio
n
Abans Finance PLC | Annual Report 2017/18 | 28
CORPORATE GOVERNANCE
Introduction
Corporate governance is a system by which a Company is directed, controlled and managed. A good corporate governance framework guides the Company to drive towards progress with implementation of relevant strategies. Good corporate governance has as its objectives the maintenance of a high level of governance that will foster a culture of integrity, values and rewards for the stakeholders. The creation of long term stakeholder value is a key towards an effective governance framework.
The Board of Directors of the Company under the leadership of the Chairman is responsible for the Governance of the Company. The development of an effective corporate governance framework is a priority on the agenda of the Board. The Board of Directors is committed to review and improve systems within the Company in order to maintain accountability and transparency.
The Company operates with an effective Corporate Governance Framework. The framework has been designed based on the provisions of the Finance Companies (Corporate Governance) Direction No.3 of 2008 as amended, Code of Best Practice on Corporate Governance 2013 issued jointly by the Institute of Chartered Accountants of Sri Lanka and the Securities and Exchange Commission of Sri Lanka and the Listing Rules of the Colombo Stock Exchange.
Board Composition and Balance
Strong governance is dependent upon a Board of Directors that is cohesive, independent in nature, fully engaged and committed to the role and, as a result, operates effectively. The Board reflects a balance between financial, sector specific and general business skills, with a highly experienced team that leads the business in both executive and non-executive roles. The major role of the Board includes overseeing the risk profile of the Company, monitoring the integrity of its business and control mechanisms, ensuring expert management and maximizing the interest of all stakeholders.
The Board of Directors currently has five members; Two Non Independent Non Executive Directors including the Chairman, Two Independent Non Executive Directors one of whom is designated as the Senior Director and an Executive Director who is the Managing Director. The Board comprises of individuals with appropriate abilities, skills and competencies. Each Director provides the Company the knowledge, experience and skills for effective performance of the Board and they allocate adequate time to discharge their responsibilities. A list of the individual Directors and their profiles including dates of appointment to the Board and their Committee memberships are set out in the Directors’ profile on pages 25 to 26 of this report.
Division of Responsibilities - Chairman and Chief Executive Officer (CEO)
The role of Chairman and CEO is segregated and there are clear and documented divisions of accountability and responsibility. The Chairman is accountable to shareholders for the effectiveness of the Board and this builds a sustainable business through consistent, profitable growth, while taking account of the interests of wider stakeholders. The Chairman leads the Board and chairs its meetings, having agreed on a balanced agenda covering business performance, strategy, risk, compliance and people. He ensures that the Directors receive accurate, timely and relevant information for deliberations and high-quality decision-making.
The CEO is the apex executive-in-charge of the day to day management of the Company’s operations and business and accountable to the Board. This includes developing business strategies for the approval of the Board and timely and effective implementation of such strategies whilst managing relevant risks. The CEO provides the leadership and environment within the Company to implement the Board’s policies and the achievement of the Company’s objectives.
Appointment, Resignation and Re-election
The Directors are elected by the shareholders at the Annual General Meeting (AGM) except for casual vacancies arising during the year filled by the Board of Directors until the next AGM (Article 26 (5) of the Article of Association addresses this). Accordingly, all Directors are subject to election by shareholders at the first AGM following their appointment, and to re-election thereafter at intervals of no more than three years in compliance with the Code of Best Practice on Corporate Governance 2013. Directors who are nominated for re-election submit affidavits and declarations and obtain prior approval from the Director, SNBFI of Central Bank of Sri Lanka in compliance with the Finance Companies (Assessment of Fitness and Propriety of Directors and Officers performing executive functions) Direction No. 03 of 2011.
During the year under review Mr. K B Wanigasekara has relinquished the office as the Managing Director of the Company and resigned from the Board with effect from 27 September 2017. Further Mr. R. A. Nanayakkara, the Chief Executive Officer of the Company was appointed as the Managing Director on the same date. Currently, Mr. R. A. Nanayakkara is functioning as the Chief Executive Officer/ Managing Director of the Company.
Two Directors, Mr. V. K. Choksy, Mr. Ajith S. Ratnayake, who retired by rotation in conformity with section A.8 of the Code of Best Practice on Corporate Governance 2013 was re-elected at Annual General Meeting (AGM). In addition, Mr. M. P. Parekh and Mr. C. H. A. W. Wickramasuriya (Alternate Director to M. P. Parekh) was re-elected at the last AGM in conformity with Article 26 (05) of the Articles of Association and in terms of Section 4 (10) of the Finance Companies (Corporate Governance) Direction No. 03 of 2008.
Determination of Independence of Non-Executive Directors
The Board evaluates annually whether each of the Non-Executive Director is independent. The Non-Executive Directors submit declarations on their independence in terms of rule 7.10.2(b) of the Listing Rules of the Colombo Stock Exchange to facilitate the Board to decide on their independence. The Board further considers criteria for independence set out in the Finance Companies (Corporate Governance) Direction No. 03 of 2008, Listing Rules of the Colombo Stock Exchange and Code of Best practice on Corporate Governance – 2013.The Board has concluded that Mr. V. K. Choksy and Mr. A. S. Ratnayake are independent and Mr. M. P. Parekh and Mr. R. Pestonjee are non-independent.
20%
80%
Executive Vs. Non - Executive Directors
Executive Non-Executive
50%
50%
Non Executive Directors - Independent Vs. Non Independent
Independent Non-Independent
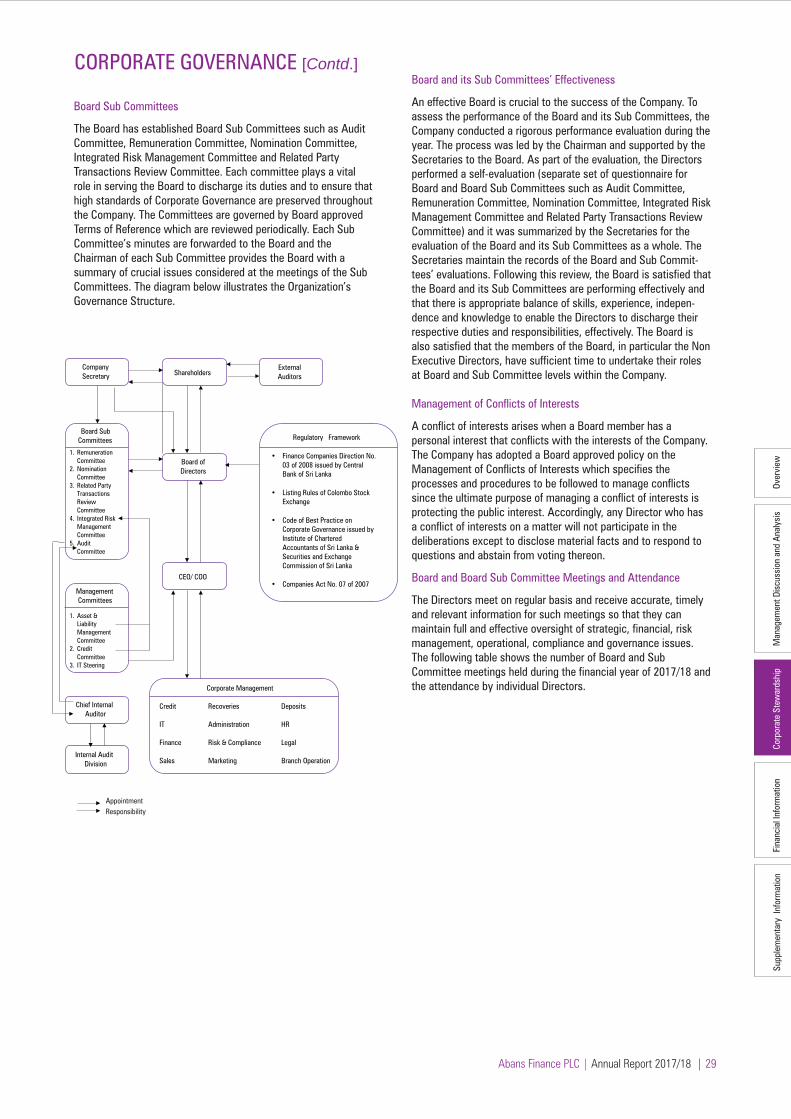
Over
view
Man
agem
ent D
iscu
ssio
n an
d An
alys
isCo
rpor
ate
Stew
ards
hip
Fina
ncia
l Inf
orm
atio
nSu
pple
men
tary
Inf
orm
atio
n
Abans Finance PLC | Annual Report 2017/18 | 29
Board of Directors
Company Secretary
Shareholders
External Auditors
CEO/ COO
Chief Internal Auditor
Internal Audit Division
Board Sub Committees
1. Remuneration Committee
2. Nomination Committee
3. Related Party Transactions Review Committee
4. Integrated Risk Management Committee
5. Audit Committee
Management Committees
1. Asset & Liability Management Committee
2. Credit Committee
3. IT Steering
Corporate Management Credit Recoveries Deposits IT Administration HR Finance Risk & Compliance Legal Sales Marketing Branch Operation
Regulatory Framework
• Finance Companies Direction No. 03 of 2008 issued by Central Bank of Sri Lanka
• Listing Rules of Colombo Stock
Exchange • Code of Best Practice on
Corporate Governance issued by Institute of Chartered Accountants of Sri Lanka & Securities and Exchange Commission of Sri Lanka
• Companies Act No. 07 of 2007
AppointmentResponsibility
CORPORATE GOVERNANCE [Contd.]
Board Sub Committees
The Board has established Board Sub Committees such as Audit Committee, Remuneration Committee, Nomination Committee, Integrated Risk Management Committee and Related Party Transactions Review Committee. Each committee plays a vital role in serving the Board to discharge its duties and to ensure that high standards of Corporate Governance are preserved throughout the Company. The Committees are governed by Board approved Terms of Reference which are reviewed periodically. Each Sub Committee’s minutes are forwarded to the Board and the Chairman of each Sub Committee provides the Board with a summary of crucial issues considered at the meetings of the Sub Committees. The diagram below illustrates the Organization’s Governance Structure.
Board and its Sub Committees’ Effectiveness
An effective Board is crucial to the success of the Company. To assess the performance of the Board and its Sub Committees, the Company conducted a rigorous performance evaluation during the year. The process was led by the Chairman and supported by the Secretaries to the Board. As part of the evaluation, the Directors performed a self-evaluation (separate set of questionnaire for Board and Board Sub Committees such as Audit Committee, Remuneration Committee, Nomination Committee, Integrated Risk Management Committee and Related Party Transactions Review Committee) and it was summarized by the Secretaries for the evaluation of the Board and its Sub Committees as a whole. The Secretaries maintain the records of the Board and Sub Commit-tees’ evaluations. Following this review, the Board is satisfied that the Board and its Sub Committees are performing effectively and that there is appropriate balance of skills, experience, indepen-dence and knowledge to enable the Directors to discharge their respective duties and responsibilities, effectively. The Board is also satisfied that the members of the Board, in particular the Non Executive Directors, have sufficient time to undertake their roles at Board and Sub Committee levels within the Company.
Management of Conflicts of Interests
A conflict of interests arises when a Board member has a personal interest that conflicts with the interests of the Company. The Company has adopted a Board approved policy on the Management of Conflicts of Interests which specifies the processes and procedures to be followed to manage conflicts since the ultimate purpose of managing a conflict of interests is protecting the public interest. Accordingly, any Director who has a conflict of interests on a matter will not participate in the deliberations except to disclose material facts and to respond to questions and abstain from voting thereon.
Board and Board Sub Committee Meetings and Attendance
The Directors meet on regular basis and receive accurate, timely and relevant information for such meetings so that they can maintain full and effective oversight of strategic, financial, risk management, operational, compliance and governance issues. The following table shows the number of Board and Sub Committee meetings held during the financial year of 2017/18 and the attendance by individual Directors.
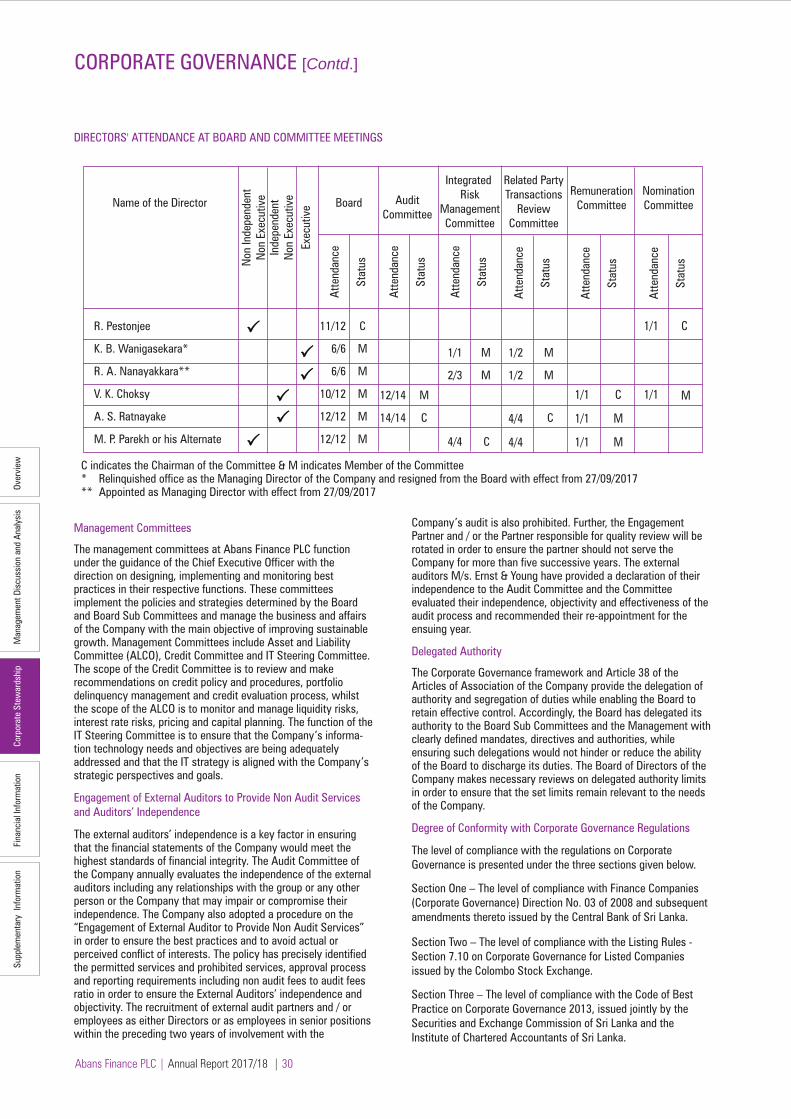
Over
view
Man
agem
ent D
iscu
ssio
n an
d An
alys
isCo
rpor
ate
Stew
ards
hip
Fina
ncia
l Inf
orm
atio
nSu
pple
men
tary
Inf
orm
atio
n
Abans Finance PLC | Annual Report 2017/18 | 30
Company’s audit is also prohibited. Further, the Engagement Partner and / or the Partner responsible for quality review will be rotated in order to ensure the partner should not serve the Company for more than five successive years. The external auditors M/s. Ernst & Young have provided a declaration of their independence to the Audit Committee and the Committee evaluated their independence, objectivity and effectiveness of the audit process and recommended their re-appointment for the ensuing year.
Delegated Authority
The Corporate Governance framework and Article 38 of the Articles of Association of the Company provide the delegation of authority and segregation of duties while enabling the Board to retain effective control. Accordingly, the Board has delegated its authority to the Board Sub Committees and the Management with clearly defined mandates, directives and authorities, while ensuring such delegations would not hinder or reduce the ability of the Board to discharge its duties. The Board of Directors of the Company makes necessary reviews on delegated authority limits in order to ensure that the set limits remain relevant to the needs of the Company.
Degree of Conformity with Corporate Governance Regulations
The level of compliance with the regulations on Corporate Governance is presented under the three sections given below.
Section One – The level of compliance with Finance Companies (Corporate Governance) Direction No. 03 of 2008 and subsequent amendments thereto issued by the Central Bank of Sri Lanka.
Section Two – The level of compliance with the Listing Rules - Section 7.10 on Corporate Governance for Listed Companies issued by the Colombo Stock Exchange.
Section Three – The level of compliance with the Code of Best Practice on Corporate Governance 2013, issued jointly by the Securities and Exchange Commission of Sri Lanka and the Institute of Chartered Accountants of Sri Lanka.
Management Committees
The management committees at Abans Finance PLC function under the guidance of the Chief Executive Officer with the direction on designing, implementing and monitoring best practices in their respective functions. These committees implement the policies and strategies determined by the Board and Board Sub Committees and manage the business and affairs of the Company with the main objective of improving sustainable growth. Management Committees include Asset and Liability Committee (ALCO), Credit Committee and IT Steering Committee. The scope of the Credit Committee is to review and make recommendations on credit policy and procedures, portfolio delinquency management and credit evaluation process, whilst the scope of the ALCO is to monitor and manage liquidity risks, interest rate risks, pricing and capital planning. The function of the IT Steering Committee is to ensure that the Company’s informa-tion technology needs and objectives are being adequately addressed and that the IT strategy is aligned with the Company’s strategic perspectives and goals.
Engagement of External Auditors to Provide Non Audit Services and Auditors’ Independence
The external auditors’ independence is a key factor in ensuring that the financial statements of the Company would meet the highest standards of financial integrity. The Audit Committee of the Company annually evaluates the independence of the external auditors including any relationships with the group or any other person or the Company that may impair or compromise their independence. The Company also adopted a procedure on the “Engagement of External Auditor to Provide Non Audit Services” in order to ensure the best practices and to avoid actual or perceived conflict of interests. The policy has precisely identified the permitted services and prohibited services, approval process and reporting requirements including non audit fees to audit fees ratio in order to ensure the External Auditors’ independence and objectivity. The recruitment of external audit partners and / or employees as either Directors or as employees in senior positions within the preceding two years of involvement with the
CORPORATE GOVERNANCE [Contd.]
R. Pestonjee
K. B. Wanigasekara*
R. A. Nanayakkara**
V. K. Choksy
A. S. Ratnayake
M. P. Parekh or his Alternate
11/12
6/6
6/6
10/12
12/12
12/12
1/1
2/3
4/4 C
1/2
1/2
4/4
4/4
1/1
1/1
1/1
C
M
M
1/1 M
1/1 C
M
M
C
M
M
12/14
14/14
M
C
C
M
M
M
M
M
Name of the Director Board AuditCommittee
Integrated Risk
ManagementCommittee
Related PartyTransactions
ReviewCommittee
RemunerationCommittee
NominationCommittee
Atte
ndan
ce
Stat
us
Atte
ndan
ce
Stat
us
Atte
ndan
ce
Stat
us
Atte
ndan
ce
Stat
us
Atte
ndan
ce
Stat
us
Atte
ndan
ce
Stat
usNon
Inde
pend
ent
Non
Exe
cutiv
eIn
depe
nden
tN
on E
xecu
tive
Exec
utiv
e
DIRECTORS' ATTENDANCE AT BOARD AND COMMITTEE MEETINGS
C indicates the Chairman of the Committee & M indicates Member of the Committee * Relinquished office as the Managing Director of the Company and resigned from the Board with effect from 27/09/2017 ** Appointed as Managing Director with effect from 27/09/2017

Over
view
Man
agem
ent D
iscu
ssio
n an
d An
alys
isCo
rpor
ate
Stew
ards
hip
Fina
ncia
l Inf
orm
atio
nSu
pple
men
tary
Inf
orm
atio
n
Abans Finance PLC | Annual Report 2017/18 | 31
Section One - Finance Companies (Corporate Governance) Direction No. 03 of 2008 and subsequent amendments thereto on Corporate Governance for Licensed Finance Companies in Sri Lanka
The Central Bank of Sri Lanka issued the Direction on Corporate Governance in order to improve and sustain the Corporate Governance process-es and practices of the Licensed Finance Companies in Sri Lanka. This Direction is identified as the Finance Companies (Corporate Governance) Direction No. 03 of 2008 and the amendments are referred to as Finance Companies (Corporate Governance – Amendment) Direction No. 04 of 2008 and Finance Companies (Corporate Governance – Amendment) Direction No. 06 of 2013.The above Directions comprise of nine fundamental principles, namely the responsibilities of the Board, Meetings of the Board, Composition of the Board, Criteria to assess the fitness and propriety of Directors, Management functions delegated by the Board, The Chairman and the Chief Executive Officer, Board appointed Committees, Related party transactions and Disclosures.
The Company's level of compliance with the Corporate Governance Directions is tabulated below.
CORPORATE GOVERNANCE [Contd.]
Section Rule Status of Compliance
2. THE RESPONSIBILITIES OF THE BOARD OF DIRECTORS
2 (1) Strengthening the safety and soundness of the Company
(a) Approve, oversee and communicate the Board approved strategic objectives and corporate values have been strategic objectives and corporate values. derived from the Company’s vision and mission and it has been communicated throughout the Company. (b) Approve the overall business strategy, including The strategic plan for 2018/19 to 2020/21 is currently at the final the overall risk policy and risk management. stage. The strategic plan includes the overall risk management policy, procedures and mechanisms with measureable goals.
The business strategy is reviewed by the Board on a regular basis with management updates at Board meetings on the execution of the agreed strategy.
(c) Identifying and managing risk. Integrated Risk Management Committee (IRMC) of the Company identifies risks related to credit, market, liquidity and operations and ensures that appropriate actions are taken to manage risks. Further, IRMC reports to the Board of Directors. The Risk Management Report on pages 54 to 58 provides further information.
(d) Communication policy with all stakeholders. A Board approved communication policy is in place and ensures the effective internal and external communication of corporate information with all stakeholders including depositors, creditors, shareholders and borrowers of the Company.
(e) Reviewing the adequacy and the integrity of the The Internal Auditors of the Company on the instructions of the Audit internal control system and management Committee have reviewed the integrity of the Company’s internal information system. control system and the management information system. The Board of Directors of the Company confirmed the adequacy of the management information submitted for regular Board Meetings.
(f) Identifying and designating Key Management The Board of Directors identified and designated the Key Management Personnel. Personnel as Members of the Board including Managing Director, Chief Executive Officer, Chief Operating Officer, Chief Financial Officer, Head of Recoveries, Head of Deposits, Head of Branches, Head of Marketing, Head of Information Technology, Acting Compliance Officer and Manager - IT.
(g) Defining authority and responsibilities of the The Board of Directors of the Company has defined the duties and Board and Key Management Personnel. responsibilities of the Key Management Personnel. Article 28 of the Company’s Articles of Association contains provisions pertaining to the authority of the Board of Directors and the Board of Directors has approved delegated authority limits applicable to Management and staff.

Over
view
Man
agem
ent D
iscu
ssio
n an
d An
alys
isCo
rpor
ate
Stew
ards
hip
Fina
ncia
l Inf
orm
atio
nSu
pple
men
tary
Inf
orm
atio
n
Abans Finance PLC | Annual Report 2017/18 | 32
CORPORATE GOVERNANCE [Contd.]
Section Rule Status of Compliance
(h) Oversight of affairs of the Company by Key Oversight of the affairs of the Company by its Key Management Management Personnel. Personnel takes place at the Board meetings and Board Sub-Committee meetings and Key Management Personnel make regular presentations to the Board / Board Sub-Committees on matters under their purview.
(i) Periodically assess the effectiveness of its The Board has delegated the functions of selection, nomination and governance practices, including: election of Directors and appointment of Key Management Personnel to the Nomination Committee which is a Board Sub-Committee.
i) selection, nomination, and election of The extent of compliance with this requirement is disclosed on page directors and appointment of KMP. No 29 under "Management of Conflicts of Interests"
ii) management of conflicts of interests. The Board and the Board Sub Committees have a formal self evaluation process annually in order to identify and rectify the weaknesses. iii) determination of weaknesses and implementation of changes where necessary.
(j) Succession plan for Key Management Personnel. The Company has a Board approved one to one succession plan in place for the Key Management Personnel and the Board currently reviews the same in order to accommodate changes in the Key Management Personnel that took place during the recent past.
(k) Regular meetings with the Key Management Key Management Personnel participate in discussions at the Board Personnel. and its Sub-Committee meetings when the need arises to explain matters relating to their areas of responsibility.
(l) Understanding Regulatory environment. The Board of Directors closely monitors regulatory compliances at monthly Board meetings by means of a regular monthly board paper on compliance. Further, the Acting Compliance Officer presents changes to the regulatory environment from time to time and any other necessary information to the Board.
(m) Hiring and oversight of External Auditors. Hiring of external auditors is carried out by the Board with the recom mendation of the Audit Committee and it is approved by shareholders at the Annual General Meeting (AGM).
2 (2) Appointment of the Chairman and the Chief The Board has appointed the Chairman and the Chief Executive Officer Executive Officer and define and approve functions (CEO) and there is a clear division of the functions and responsibilities and responsibilities. of the Chairman and CEO. 2 (3) Directors’ ability to seek independent professional The Directors are able to obtain independent professional advice advice. as and when necessary at the expense of the Company and a Board approved procedure is in place. However, no such instances have occurred during the year.
2 (4) Dealing with conflicts of interests. The extent of compliance with this requirement is disclosed on page No 29 under "Management of Conflicts of Interests" 2 (5) Formal schedule of matters specifically reserved A Board approved formal schedule of matters specifically reserved for for Board Decisions. Board decisions is in place which ensures that the direction and control of the Company is firmly under the authority of the Board.
2 (6) Situation on insolvency. No such situation has arisen during the year and we do not visualize such situations in the foreseeable future.
2 (7) Publish corporate governance report in the Annual Annual corporate governance report has been published in the Annual Report. Report 2017/18. This report from pages 28 to 48 satisfies this requirement.
2 (8) Annual self-assessment by the Directors and The extent of compliance with this requirement is disclosed on page maintenance of such records. No. 29 under "Board and its Sub Committees’ effectiveness".

Over
view
Man
agem
ent D
iscu
ssio
n an
d An
alys
isCo
rpor
ate
Stew
ards
hip
Fina
ncia
l Inf
orm
atio
nSu
pple
men
tary
Inf
orm
atio
n
Abans Finance PLC | Annual Report 2017/18 | 33
CORPORATE GOVERNANCE [Contd.]
Section Rule Status of Compliance
3. MEETINGS OF THE BOARD
3 (1) Regular Board meetings and circulation of written The Board has conducted 12 meetings during the year. The consent of or electronic resolutions. the Board is usually obtained at meetings with due notice given with Board papers. Consent obtained by circulation has been kept at minimal.
3 (2) Arrangements for Directors to include matters and A formal procedure has been implemented to enable all Directors to proposals in the agenda. include matters and proposals in the agenda for regular Board meetings.
3 (3) Notice of meetings. An annual calendar of Board meetings has been issued at the beginning of the year. It was ensured that prior notice of at least 7 days was given to Board members. There were no special meetings held during the period.
3 (4) Directors’ attendance at Board meetings. All Directors have attended at least two thirds of the meetings and non-attendance of consecutive three meetings did not arise. Refer page 30 for details on Directors’ attendance at Board meetings.
3 (5) Appointment of a Company Secretary to handle the The Board has appointed Varners International (Pvt.) Ltd., Level 14, secretarial services to the Board. World Trade Centre (West Tower), Colombo – 01 as Secretaries to the Company. The Company Secretaries advise the Board and ensure that matters concerning the Companies Act, Board procedures and other applicable rules and regulations are followed.
3 (6) Responsibility of preparation of agenda for a Board The Chairman has delegated to the Company Secretaries the function meeting. of preparing the Agenda for Board Meetings and for circulation to the Board.
3 (7) Directors’ access to advice and services of the A formal procedure has been implemented and all Directors have Company Secretaries. access to the Company Secretaries for advice and services where necessary.
3 (8) Maintenance of Board minutes. The Company Secretaries maintain and circulate the minutes to Board members and provide certified copies of the Minutes at any time at the request of any director of the Company. A formal procedure is in place to enable directors to inspect the minutes.
3 (9) Recording of Minutes of Board meetings in The Company Secretaries record the contributions made by each sufficient detail. member and the decisions / resolutions made in sufficient detail to satisfy the requirements of the direction.
4. COMPOSITION OF THE BOARD
4 (1) The number of Directors. The extent of compliance with this requirement is disclosed on page No. 28 under "Board Composition and Balance".
4 (2) Period of service of a Director. The extent of compliance with this requirement is disclosed on page No. 28 under "Board Composition and Balance"
4 (3) Board balance. The extent of compliance with this requirement is disclosed on page No. 28 under "Board Composition and Balance".
4 (4) Independent Non-Executive Directors and the The extent of compliance with this requirement is disclosed on page criteria for independence. No. 28 under "Board Composition and Balance" and on page No. 28 under “Determination of independence of Non-Executive Directors”
4 (5) Appointment of Alternate Directors. No alternate directors were appointed to represent any Independent Director. However, Mr. C. H. A. W. Wickramasuriya functions as an Alternate Director to Mr. M. P. Parekh, Non Executive (Non Independent) Director of the Company.
4 (6) Skills and experience of Non-Executive Directors. Appointments to the Board are made with the recommendation of the Nomination Committee.

Over
view
Man
agem
ent D
iscu
ssio
n an
d An
alys
isCo
rpor
ate
Stew
ards
hip
Fina
ncia
l Inf
orm
atio
nSu
pple
men
tary
Inf
orm
atio
n
Abans Finance PLC | Annual Report 2017/18 | 34
CORPORATE GOVERNANCE [Contd.]
Section Rule Status of Compliance
The Directors are eminent persons with the required knowledge, expertise and experience to bring an independent judgment and their profiles are given on pages 25 to 26.
4 (7) More than half the quorum of Non-Executive Directors All Board meetings held during the Financial Year were duly constituted in Board meetings. with one half of the number of Directors present and one half of the number of Directors constituting the quorum being non-executive Directors.
4 (8) Express identification of the Independent Please refer the profiles of Board of Directors on pages 25 to 26 and Non-Executive Directors in corporate communications report of Board of Directors on pages 59 to 63. and disclosing the details of Directors.
4 (9) Procedure for the appointment of new Directors and The new appointments to the Board are based on the for the orderly succession of appointments to the recommendations made by the Nomination Committee and there is Board. a procedure in place for the succession of appointments to the Board.
4 (10) Directors appointed to fill a casual vacancy to The extent of compliance with this requirement is disclosed on page be re-elected at the first general meeting No. 28 under "Appointment, Resignation and Re-election of Directors" after their appointment.
4 (11) Communication of reasons for removal or Appointment, removal or resignations of Directors are informed to resignation of Directors. shareholders, with immediate notification to the Colombo Stock Exchange (CSE). Prior approval is obtained from the Central Bank of Sri Lanka (CBSL) on such circumstances.
5. CRITERIA TO ASSESS THE FITNESS AND THE PROPRIETY OF DIRECTORS
5 (1) The age of a Director shall not exceed 70 years. All the Directors were below the age of 70 years during the year under review.
5 (2) Directors shall not hold office as a Director of more All Directors other than Mr. M. P. Parekh (Non Independent Non Executive than 20 Companies / Societies / Corporate bodies Director) hold Directorates in less than 20 Companies. Mr. M. P. Parekh including Associate and Subsidiary Companies. who held Directorates in 20 Companies as at 31 December 2017 has increased his Directorates to 23 Companies as at 31 March 2018. He has indicated that he will reduce his Directorates to 20 before the end of 30 September 2018.
6. DELEGATION OF FUNCTIONS
6 (1) Delegation of work to the Management. The extent of compliance with this requirement is disclosed on page No. 30 under "Delegated Authority". 6 (2) Periodical evaluations of the delegation process. The extent of compliance with this requirement is disclosed on page No. 30 under "Delegated Authority".
7. THE CHAIRMAN AND THE CHIEF EXECUTIVE OFFICER
7 (1) Division of responsibilities of the Chairman and The roles of Chairman and Chief Executive Officer were held by two Chief Executive Officer. (02) individuals separately.
7 (2) Chairman preferably an Independent Non-Executive Chairman of the Company is a Non Independent Non-Executive Director and if not appoint a Senior Director. Director. Since the Chairman is not an Independent Non-Executive Director, the Board has designated Mr. V. K. Choksy, Independent Non-Executive Director as the Senior Director and the terms of reference have been documented. The designation of the Senior Director has been disclosed by the Company in the Annual Report on Page 26. 7 (3) Disclosure of the identity of the Chairman and the The Board has adopted a formal procedure to identify and disclose the Chief Executive Officer and any relationship with relationships between the CEO and the Chairman and among other the Board Members. Directors. Accordingly, the Board has declared that there are no material relationships [including financial, business, family or other material / relevant relationship(s)] between the Chairman and Chief Executive Officer and among the members of the Board which will impair their respective roles. Details of the Chairman and Chief Executive Officer are disclosed in the “Corporate Information” of the Annual Report.
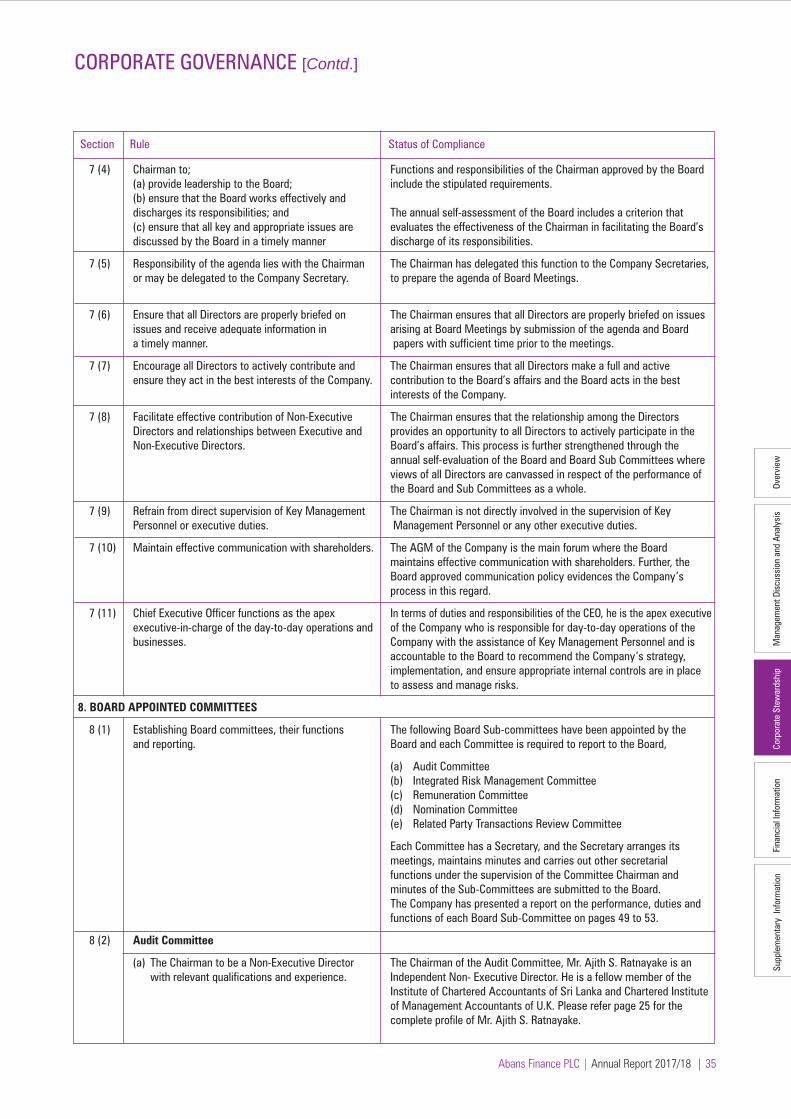
Over
view
Man
agem
ent D
iscu
ssio
n an
d An
alys
isCo
rpor
ate
Stew
ards
hip
Fina
ncia
l Inf
orm
atio
nSu
pple
men
tary
Inf
orm
atio
n
Abans Finance PLC | Annual Report 2017/18 | 35
CORPORATE GOVERNANCE [Contd.]
Section Rule Status of Compliance
7 (4) Chairman to; Functions and responsibilities of the Chairman approved by the Board (a) provide leadership to the Board; include the stipulated requirements. (b) ensure that the Board works effectively and discharges its responsibilities; and The annual self-assessment of the Board includes a criterion that (c) ensure that all key and appropriate issues are evaluates the effectiveness of the Chairman in facilitating the Board’s discussed by the Board in a timely manner discharge of its responsibilities.
7 (5) Responsibility of the agenda lies with the Chairman The Chairman has delegated this function to the Company Secretaries, or may be delegated to the Company Secretary. to prepare the agenda of Board Meetings.
7 (6) Ensure that all Directors are properly briefed on The Chairman ensures that all Directors are properly briefed on issues issues and receive adequate information in arising at Board Meetings by submission of the agenda and Board a timely manner. papers with sufficient time prior to the meetings.
7 (7) Encourage all Directors to actively contribute and The Chairman ensures that all Directors make a full and active ensure they act in the best interests of the Company. contribution to the Board’s affairs and the Board acts in the best interests of the Company.
7 (8) Facilitate effective contribution of Non-Executive The Chairman ensures that the relationship among the Directors Directors and relationships between Executive and provides an opportunity to all Directors to actively participate in the Non-Executive Directors. Board’s affairs. This process is further strengthened through the annual self-evaluation of the Board and Board Sub Committees where views of all Directors are canvassed in respect of the performance of the Board and Sub Committees as a whole.
7 (9) Refrain from direct supervision of Key Management The Chairman is not directly involved in the supervision of Key Personnel or executive duties. Management Personnel or any other executive duties.
7 (10) Maintain effective communication with shareholders. The AGM of the Company is the main forum where the Board maintains effective communication with shareholders. Further, the Board approved communication policy evidences the Company’s process in this regard.
7 (11) Chief Executive Officer functions as the apex In terms of duties and responsibilities of the CEO, he is the apex executive executive-in-charge of the day-to-day operations and of the Company who is responsible for day-to-day operations of the businesses. Company with the assistance of Key Management Personnel and is accountable to the Board to recommend the Company’s strategy, implementation, and ensure appropriate internal controls are in place to assess and manage risks.
8. BOARD APPOINTED COMMITTEES
8 (1) Establishing Board committees, their functions The following Board Sub-committees have been appointed by the and reporting. Board and each Committee is required to report to the Board,
(a) Audit Committee (b) Integrated Risk Management Committee (c) Remuneration Committee (d) Nomination Committee (e) Related Party Transactions Review Committee
Each Committee has a Secretary, and the Secretary arranges its meetings, maintains minutes and carries out other secretarial functions under the supervision of the Committee Chairman and minutes of the Sub-Committees are submitted to the Board. The Company has presented a report on the performance, duties and functions of each Board Sub-Committee on pages 49 to 53.
8 (2) Audit Committee
(a) The Chairman to be a Non-Executive Director The Chairman of the Audit Committee, Mr. Ajith S. Ratnayake is an with relevant qualifications and experience. Independent Non- Executive Director. He is a fellow member of the Institute of Chartered Accountants of Sri Lanka and Chartered Institute of Management Accountants of U.K. Please refer page 25 for the complete profile of Mr. Ajith S. Ratnayake.

Over
view
Man
agem
ent D
iscu
ssio
n an
d An
alys
isCo
rpor
ate
Stew
ards
hip
Fina
ncia
l Inf
orm
atio
nSu
pple
men
tary
Inf
orm
atio
n
Abans Finance PLC | Annual Report 2017/18 | 36
CORPORATE GOVERNANCE [Contd.]
Section Rule Status of Compliance
(b) All members of the Committee to be All members of the Audit Committee are Non-Executive Directors. Non-Executive Directors. (c) Functions of the Committee include; The Audit Committee has recommended,
(i) The appointment of the External Auditors. i. the re-appointment of M/s. Ernst & Young, Chartered Accountants as External Auditors for Audit Services;
(ii) The implementation of the Central Bank ii. the implementation of guidelines issued by the Central Bank of Guidelines. Sri Lanka to auditors from time to time;
(iii) The application of the relevant accounting iii. the application of Accounting Standards in consultation with standards; and the Chief Financial Officer and External Auditors.
(iv) The service period, audit fee and any iv. the service period, audit fees, resignation or dismissal of an resignation or dismissal of the Auditor; auditor, re-engaging the audit partner in line with the regulatory requirements. No resignation or dismissal of the auditor has taken place during the year under review.
(d) Review and monitor the External Auditors’ The extent of compliance with this requirement is disclosed on page independence, objectivity and effectiveness No. 30 under "Engagement of External Auditor to Provide Non Audit of the audit processes. Services and Auditors’ Independence".
(e) Develop and implement a policy on the The extent of compliance with this requirement is disclosed on page engagement of an External Auditor to provide No. 30 under "Engagement of External Auditor to Provide Non Audit non-audit services while considering; Services and Auditors’ Independence".
(i) skills and experience of the Auditor
(ii) threat to the independence
(iii) Fee for the non-audit services and independence
(f) Determines the nature and the scope of the The Audit Committee met with External Auditors, M/s. Ernst and External Audit. Young and discussed the Audit Plan, nature and scope before the commencement of the Audit.
(g) Review the financial information of the Company. The Audit Committee periodically reviews the financial information in order to monitor major judgmental areas, changes in accounting policies, significant audit judgments in the financial statements, going concern assumption and compliance with Accounting Standards and other legal requirements. The Audit Committee reviews and recommends the Interim Financial Statements and Audited Financial Statements before submission thereof to the Board.
(h) Meeting of External Auditors to discuss issues The Audit Committee has met the External Auditors thrice, without Key and problems of Interim and Final audits in the Management Personnel during the year under review. absence of Key Management Personnel (if necessary) (i) Reviewing of the External Auditors’ management The Audit Committee has reviewed the Management Letter issued by letter and the response thereto. the External Auditors with the responses of the Management.
(j) Review of the Internal Audit Function, The Audit Committee has reviewed the information provided in the risk based audit plan and concluded that scope, functions and resources of - Review scope, function and resources the Internal Audit Dept. are sufficient to carry out its functions. - Review of Internal Audit Program The Audit Committee has reviewed and approved the Internal Audit Program. - Review of Internal Audit Department The Audit Committee has carried out a performance appraisal of the Internal Audit Division. - Recommendations on Internal Audit Functions The Audit Committee has recommended and with the approval of the Board appointed M/s.BDO Partners to conduct Information Systems Audits.

Over
view
Man
agem
ent D
iscu
ssio
n an
d An
alys
isCo
rpor
ate
Stew
ards
hip
Fina
ncia
l Inf
orm
atio
nSu
pple
men
tary
Inf
orm
atio
n
Abans Finance PLC | Annual Report 2017/18 | 37
CORPORATE GOVERNANCE [Contd.]
Section Rule Status of Compliance
- Appraise the resignation of Senior staff of Internal Circumstances to this effect have not arisen during the year under Audit and any outsourced service providers. review.
- Independence of Internal Audit Functions. The Committee ensured the independence of the Internal Audit Function.
(k) Consideration about the internal investigations The need for an internal investigation on major findings has not arisen and management’s responses. during the year.
(l) Attendees of Audit Committee meeting with The Committee met -thrice with the External Auditors without the Corporate Management and External Auditors. presence of the Executive Directors and Key Management Personnel. Chief Financial Officer and Chief Internal Auditor normally attend the meetings. The Managing Director and CEO and other members of the Key Management Personnel also attend meetings by invitation.
(m) Explicit authority, adequate resources, access to The Audit Committee is empowered by Board approved terms of information and obtain external professional advice reference which set out the authority and responsibility of the Committee. wherever necessary.
(n) Regular meetings. The Audit Committee met 14 times during the financial year under review. Please refer page 30 for details of the attendance of the Committee members.
(o) Disclosures in the Annual Report. The “Audit Committee report” on page 49 includes the details of activities of the Audit Committee. Please refer page 30 for details of attendance of the Committee members.
(p) Maintain minutes of meetings. The Company Secretaries act as the Secretary to the Audit Committee and maintain the minutes of the meetings.
(q) Whistle Blower Policy. On the recommendation of the Audit Committee, the Board has adopted a Whistle Blower policy for employees, in confidence to report violations of laws, rules, regulations or unethical conduct to the Audit Committee.
8 (3) Integrated Risk Management
(a) The composition of IRMC. The Integrated Risk Management Committee is chaired by a Non - Executive Director and comprises of Managing Director and CEO and Other Key Management Personnel who supervise the broad risk categories such as Credit, Market, Liquidity, Operational and Strategic risks.
(b) Periodical risk assessment. The Committee has a process to assess risks, such as Credit, Market, Operational and Liquidity through appropriate risk indicators and management information.
(c) Review the adequacy and effectiveness of Asset and Liability Committee and Credit Committee review the Management level Committees to manage risk. adequacy and effectiveness in addressing the specific risks and managing risks. However, the Committee is in the process of reviewing the effectiveness of the Asset and Liability Committee and Credit Committee.
(d) Corrective action to mitigate the risk. The risk indicators introduced have been reviewed and corrective action has been taken to mitigate risks. Further, the Company is in the process of reviewing the risk limits to identify the factors which have exceeded the specified limits.
(e) Frequency of meetings. The Committee has met four times on a quarterly basis during the year.
(f) Actions against the officers responsible for No such matters have arisen during the year. Further, the Committee is failure to identify risks and take prompt in the process of documenting the formal procedure. corrective actions.

Over
view
Man
agem
ent D
iscu
ssio
n an
d An
alys
isCo
rpor
ate
Stew
ards
hip
Fina
ncia
l Inf
orm
atio
nSu
pple
men
tary
Inf
orm
atio
n
Abans Finance PLC | Annual Report 2017/18 | 38
CORPORATE GOVERNANCE [Contd.]
Section Rule Status of Compliance
(g) Risk assessment report to the Board. For the quarter ended 30 June 2017 and 30 September 2017, the Company has circulated minutes of Integrated Risk Management Committee to the Board of Directors. The company has submitted IRMC reports for the quarter ended 31 December 2017 and 31 March 2018 in compliance with the Direction and will continue to submit risk assessment reports to the Board within the specified time frame.
(h) Establishment of a compliance function. A Compliance Officer selected from Key Management Personnel has been appointed to carry out the Compliance function. The Compliance Unit reviews the Company’s compliance with laws, regulations, guidelines and rules on a regular basis and reports non-compliances, if any, to the Board. The Audit Committee reviews adequacy of the Internal Control mechanism of the Company in order to maintain the independence and objectivity of the Internal Audit function.
9. RELATED PARTY TRANSACTIONS
9 (2) Avoid conflicts of interest that arise from The Board has approved a Related Party Transactions Policy where the transactions of the Company with related parties. categories of persons considered as “Related Parties” have been identified. Further, the Company is not involved in any transactions, which gives favorable treatment to such parties.
9 (3) Related party transactions. The Related Party transactions policy of the Company addresses all the transactions with related parties irrespective of their nature and value. Related Party Transactions Review Committee further ensures that the transactions with related parties are on an arm’s length basis.
9 (4) Monitoring of related party transactions defined The Company has established a Board approved documented as more favorable treatment including, procedure to monitor the Related Party Transactions in order to avoid more favourable treatment to such parties.
(a) Granting accommodation in excess of prudent The Company is in the process of implementing, monitoring and percentage of regulatory capital. reporting the process through the IT system.
(b) Charging lower rate than the best rate on accommodation and paying upper rate compared to unrelated counterparty.
(c) Allowing preferential treatment compared to unrelated parties in the normal course of business.
(d) Providing or obtaining services without proper evaluation. (f) Maintaining reporting lines and information flows that may give benefits to related parties other than performance of legitimate duties.
10. DISCLOSURES
10 (1) Publish Interim and Annual Financial Statements The audited financial statements and periodical financial statements based on applicable accounting standards and were prepared in accordance with the formats prescribed by regulatory published in Sinhala, Tamil and English newspapers. and supervisory authorities and applicable accounting standards, and have been published in an abridged form in Sinhala, Tamil and English newspapers.
10 (2) The Board shall ensure that at least the following disclosures are made in the Annual Report;
(a) A statement to the effect that the annual Audited Compliance with applicable Accounting Standards and regulatory Financial Statements have been prepared in requirements has been reported under “Statement of Directors’ line with applicable accounting standards and responsibility for Financial Reporting” on page 64. regulatory requirements, inclusive of specific disclosures.

Over
view
Man
agem
ent D
iscu
ssio
n an
d An
alys
isCo
rpor
ate
Stew
ards
hip
Fina
ncia
l Inf
orm
atio
nSu
pple
men
tary
Inf
orm
atio
n
Abans Finance PLC | Annual Report 2017/18 | 39
CORPORATE GOVERNANCE [Contd.]
Section Rule Status of Compliance
(b) A report by the Board on the Finance Company’s Directors’ Statement on the Internal Control system over financial internal control mechanism. reporting is given on page 65.
(c) The External Auditors’ certification on the The Company has obtained an assurance report from the External effectiveness of the internal control mechanism. Auditors on the effectiveness of the Internal Control Mechanism.
(d) Details of Directors and the transactions with This is disclosed under “Report of the Board of Directors” on pages the Finance Company. 59 to 63. (e) Fees / remuneration paid by the Finance Fees and remuneration paid is disclosed under note No. 12 to the Company to the Directors in aggregate. Financial Statements. (f) Total net accommodation and the net The details of the net accommodation of each related party and as a accommodation outstanding to the related percentage of the Company’s capital funds are as follows parties as a percentage of the capital funds. Name of the Related Party Outstanding as at 31/03/2018 Percentage of capital funds
Abans Tours (Pvt) Ltd 28,413,929 1.81% Abans Transport (Pvt) Ltd 18,084,697 1.15%
(g) The aggregate values of remuneration paid and The aggregate value of remuneration paid to KMPs (as defined by the value of transactions with the CBSL) is Rs. 51,122,278/-. Key Management Personnel. The aggregate value of transactions of the Company with KMPs (as defined by CBSL), Loans and Advances –Rs. 21,151,201/- Deposits – Rs. 6,312,067/-
(h) A report confirming compliance with prudential This is disclosed under “Report of the Board of Directors” on pages requirements, regulations, laws and 59 to 63. internal controls.
(i) Non-Compliance reporting. There are no significant lapses which require to be disclosed to the public.
(j) The External Auditors’ certification of compliance The Company has obtained a certificate from the External Auditors of with the corporate governance direction. the compliance with the corporate governance direction.

Over
view
Man
agem
ent D
iscu
ssio
n an
d An
alys
isCo
rpor
ate
Stew
ards
hip
Fina
ncia
l Inf
orm
atio
nSu
pple
men
tary
Inf
orm
atio
n
Abans Finance PLC | Annual Report 2017/18 | 40
Section Two - Listing Rules - Section 7.10 on Corporate Governance for Listed Companies issued by the Colombo Stock Exchange
The Listing Rules – Section 7.10 of the Colombo Stock Exchange (CSE) mandates listed companies to publish a table in the Annual Report, confirming that as at the date of the Annual Report they comply with the Corporate Governance rules. The rule addresses areas such as Non-Executive Directors, Independent Directors and Disclosures relating to Directors, Remuneration Committee and Audit Committee.
The Company's level of compliance with the Listing Rules (Section 7.10) is tabulated below.
CORPORATE GOVERNANCE [Contd.]
Section Rule Status of Compliance
7.10.1 NON EXECUTIVE DIRECTORS
7.10.1 (a) Two or one third of the Directors, whichever is The extent of compliance with this requirement is disclosed on page higher, should be Non-Executive Directors. No. 28 under "Board Composition and balance".
7.10.1 (b) The total number of Directors is to be calculated The Board comprised of five Directors as at the conclusion of the based on the number as at the conclusion of the immediately preceding Annual General Meeting. Mr. R. A. Nanayakkara immediately preceding Annual General Meeting. was appointed at the Annual General Meeting held on 27 September 2017 with the resignation of Mr. K. B. Wanigasekara.
7.10.1 (c) Any change occurring to this ratio shall be rectified The cessation and the appointment of Directors as disclosed in 7.10.1. within ninety (90) days from the date of the change. (b) comply with the requirement.
7.10.2 INDEPENDENT DIRECTORS
7.10.2 (a) Two or one third of Non-Executive Directors, The extent of compliance with this requirement is disclosed on page whichever is higher, should be independent. No. 28 under "Board Composition and balance"
7.10.2 (b) Each Non-Executive Director should submit a The extent of compliance with this requirement is disclosed on page declaration of independence / non-independence No. 28 under "Determination of Independence of Non-Executive in the prescribed format. Directors"
7.10.3 DISCLOSURES RELATING TO DIRECTORS
7.10.3 (a) The Board shall make determination of Independence The extent of compliance with this requirement is disclosed on page / Non Independence annually and names of No. 28 under "Determination of Independence of Non-Executive Independent Directors should be disclosed in the Directors" Annual Report.
7.10.3 (b) In the event a Director does not qualify as No such determination was required since all Independent Directors independent as per the rules on Corporate have qualified as independent as per the said rules. Governance but if the Board is of the opinion that the Director is nevertheless independent, it shall specify the basis of the determination in the Annual Report.
7.10.3 (c) A brief resume of each Director should be published Please refer pages 25 to 26 for the profiles of the Board of Directors to the in the Annual Report including the areas of expertise. Annual Report.
7.10.3 (d) A brief resume of any new Director appointed to the The resume of Mr. R. A. Nanayakkara was published in Colombo Stock Board should be provided to the Exchange for Exchange website on 27 September 2017 upon his appointment as Dissemination to the public. Managing Director.
7.10.4 CRITERIA FOR DETERMINATION OF INDEPENDENCE OF DIRECTORS
7.10.4 Requirements for meeting criteria to be independent. All Independent Directors of the Company met the criteria for (a-h) independence specified in this rule.
7.10.5 REMUNERATION COMMITTEE
7.10.5 (a) A listed company shall have a Remuneration Remuneration Committee comprised of three Directors and out of Committee. The remuneration committee shall comprise; which two of them are Independent Non Executive Directors. of a minimum of two Independent Non-Executive Refer the Remuneration Committee Report on page 51. Directors or of Non-Executive Directors a majority of whom shall be independent, whichever shall be higher.
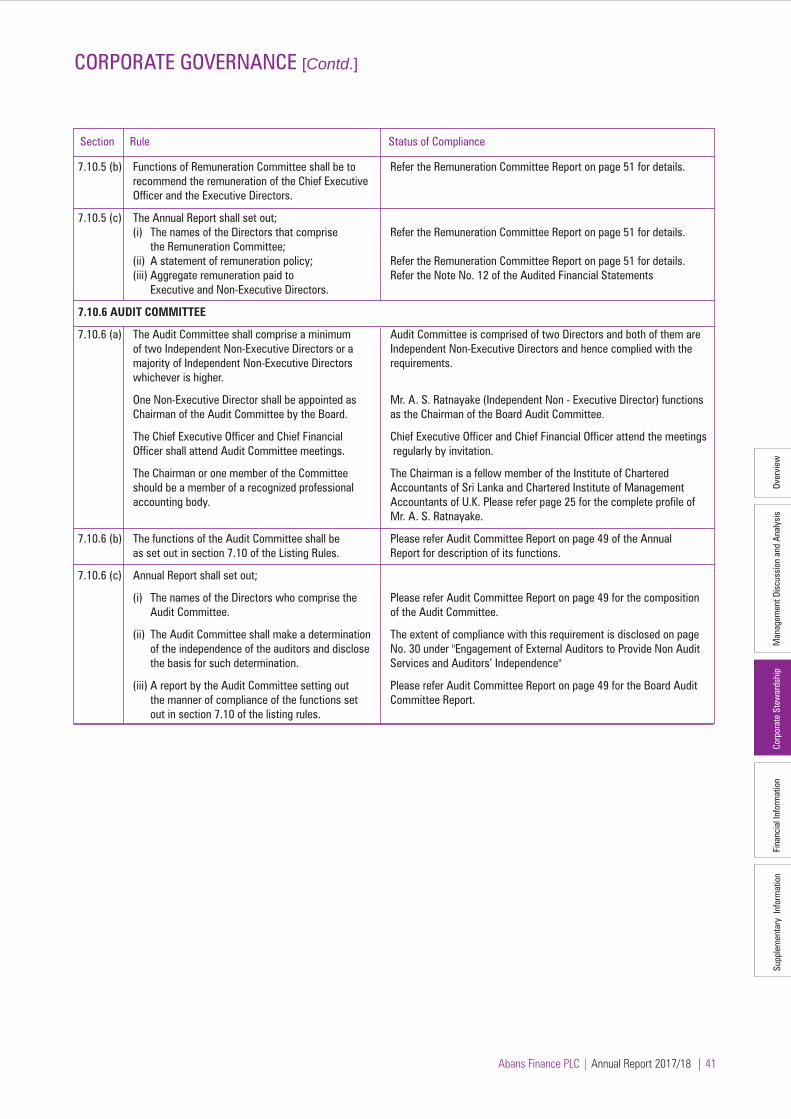
Over
view
Man
agem
ent D
iscu
ssio
n an
d An
alys
isCo
rpor
ate
Stew
ards
hip
Fina
ncia
l Inf
orm
atio
nSu
pple
men
tary
Inf
orm
atio
n
Abans Finance PLC | Annual Report 2017/18 | 41
CORPORATE GOVERNANCE [Contd.]
Section Rule Status of Compliance
7.10.5 (b) Functions of Remuneration Committee shall be to Refer the Remuneration Committee Report on page 51 for details. recommend the remuneration of the Chief Executive Officer and the Executive Directors.
7.10.5 (c) The Annual Report shall set out; (i) The names of the Directors that comprise Refer the Remuneration Committee Report on page 51 for details. the Remuneration Committee; (ii) A statement of remuneration policy; Refer the Remuneration Committee Report on page 51 for details. (iii) Aggregate remuneration paid to Refer the Note No. 12 of the Audited Financial Statements Executive and Non-Executive Directors.
7.10.6 AUDIT COMMITTEE
7.10.6 (a) The Audit Committee shall comprise a minimum Audit Committee is comprised of two Directors and both of them are of two Independent Non-Executive Directors or a Independent Non-Executive Directors and hence complied with the majority of Independent Non-Executive Directors requirements. whichever is higher.
One Non-Executive Director shall be appointed as Mr. A. S. Ratnayake (Independent Non - Executive Director) functions Chairman of the Audit Committee by the Board. as the Chairman of the Board Audit Committee.
The Chief Executive Officer and Chief Financial Chief Executive Officer and Chief Financial Officer attend the meetings Officer shall attend Audit Committee meetings. regularly by invitation.
The Chairman or one member of the Committee The Chairman is a fellow member of the Institute of Chartered should be a member of a recognized professional Accountants of Sri Lanka and Chartered Institute of Management accounting body. Accountants of U.K. Please refer page 25 for the complete profile of Mr. A. S. Ratnayake.
7.10.6 (b) The functions of the Audit Committee shall be Please refer Audit Committee Report on page 49 of the Annual as set out in section 7.10 of the Listing Rules. Report for description of its functions.
7.10.6 (c) Annual Report shall set out;
(i) The names of the Directors who comprise the Please refer Audit Committee Report on page 49 for the composition Audit Committee. of the Audit Committee.
(ii) The Audit Committee shall make a determination The extent of compliance with this requirement is disclosed on page of the independence of the auditors and disclose No. 30 under "Engagement of External Auditors to Provide Non Audit the basis for such determination. Services and Auditors’ Independence"
(iii) A report by the Audit Committee setting out Please refer Audit Committee Report on page 49 for the Board Audit the manner of compliance of the functions set Committee Report. out in section 7.10 of the listing rules.

Over
view
Man
agem
ent D
iscu
ssio
n an
d An
alys
isCo
rpor
ate
Stew
ards
hip
Fina
ncia
l Inf
orm
atio
nSu
pple
men
tary
Inf
orm
atio
n
Abans Finance PLC | Annual Report 2017/18 | 42
Section Three - Code of Best Practice on Corporate Governance 2013, issued jointly by the Securities and Exchange Commission of Sri Lanka and the Institute of Chartered Accountants of Sri Lanka
The Code of Best Practice on Corporate Governance 2013, comprises seven fundamental principles such as Directors, Directors’ Remuneration, Relations with Shareholders, Accountability and Audit, Institutional Investors, Other Investors and Sustainability Reporting.
The Company's adherence with aforementioned is tabulated below.
CORPORATE GOVERNANCE [Contd.]
Section Rule Status of Compliance
A. DIRECTORS
A.1 The Board -
The Company should be headed by an effective Board of Directors, which should direct, lead and control the Company. The Board comprises of professionals with required professional competence, skills and experience to lead and control the Company. The Board gives leadership in setting the strategic direction and creates a sound environment for the successful functioning of the Company.
A.1.1. Board meetings – The Board should meet at least once in every quarter. The Board usually meets monthly and special meetings are convened wherever necessary. During the year, the Board met 12 times. Please refer page 30 for the details of attendance at Board meetings held during the year.
A.1.2 Board’s responsibilities – The Board engages in providing direction in formulating strategic - Formulation and implementation of a sound direction for the development of strategy which is aimed at the long business strategy. term success of the Company.
Finalization of the Strategic Plan for 2018/19 to 2020/21 is currently at the final stage and the Board reviews performance on a regular basis.s
- CEO, Executive Directors and Senior Management The Managing Director and CEO and other Key Management Personnel team possess the skills, experience and knowledge. possess extensive skills, knowledge, competencies and experience.
- CEO and Key Management Personnel (KMP) The Company has a Board approved one to one succession plan in succession planning. place for the Key Management Personnel and the Board reviews the same in order to accommodate changes in the Key Management Personnel that took place during the recent past.
- Implementing security and integrity of information, The Board ensures that an effective system is in place to secure the internal controls, business continuity and risk integrity of information, internal controls and risk management. The management. Audit Committee and the IRMC on behalf of the Board monitor the integrity of financial information, the robustness of financial control and system of risk management of the Company.
- Ensuring compliance with laws, regulations and The Board has established a separate Compliance function to ensure ethical standards. that the Company has complied with the relevant laws, regulations, ethical standards and other regulatory frameworks.
- Ensuring all stakeholder interests are considered The Board considers the stakeholder interests in the decision making in corporate decisions. process.
- Recognizing sustainable business development. The Board recognizes the importance of sustainable development in corporate strategy and business development.
- Ensuring that the Company’s values and standards The Company’s accounting policies are reviewed annually by the Audit are set with emphasis on adopting appropriate Committee so as to be updated with new developments, changing Accounting Policies. business requirements and best practices.
- Fulfilling other Board functions is vital, given the The Board has attempted to fulfill the obligations towards all scale, nature and the complexity of the organization. stakeholders during the year.
A.1.3 Compliance with laws and access to independent The Board collectively and individually recognizes its duty to comply professional advice. with the laws prevailing in the country. The Board ensures that policies and procedures are in place to comply with applicable laws and regulations.
The Board has approved a procedure to seek Independent Professional advice by Directors at the expense of the Company. No such advice has been taken during the year under review.

Over
view
Man
agem
ent D
iscu
ssio
n an
d An
alys
isCo
rpor
ate
Stew
ards
hip
Fina
ncia
l Inf
orm
atio
nSu
pple
men
tary
Inf
orm
atio
n
Abans Finance PLC | Annual Report 2017/18 | 43
CORPORATE GOVERNANCE [Contd.]
Section Rule Status of Compliance
A.1.4 All Directors should have access to the services A Board approved policy is in place to enable all Directors to have and advice of the Company Secretary. access to the Company Secretaries. Directors are authorized to access the Company Secretaries to obtain advice and services as and when required on any matter relating to the Board procedures and all applicable rules and regulations.
A.1.5 Independent judgment of Directors. All Directors exercise independent judgment in the decisions made by the Board on issues of strategy, performance, resources and conduct of business.
A.1.6 Every Director should dedicate adequate time and All Directors of the Company have dedicated adequate time and effort to the matters of the Board and the Company. attention to the affairs of the Company. The Company circulates Board papers and relevant information with adequate notice in order for them to review before the Board / Board Sub Committee meetings. The number of Board / Board Sub Committee meetings held and attendance is presented on page 30.
A.1.7 Every Director should receive appropriate training. Every Director is provided appropriate induction with regard to the affairs, rules and regulations of the Company and subsequent training on latest trends and issues facing the Company and the industry in general
A.2 Chairman and Chief Executive Officer –
There should be a clear division of responsibilities at the head of the Company, which will ensure the balance of power and authority, so that no one individual has unfettered powers of decision.
A.2.1. If CEO and Chairman is one person justification Since CEO’s and Chairman’s roles are segregated, a specific disclosure in the Annual Report. is not made.
A.3 Chairman’s Role –
The Chairman’s role in preserving good corporate governance is crucial. As the person responsible for running of the Board, the Chairman should preserve order and facilitate the effective discharge of the Board functions.
A.3.1 Chairman’s role. The Chairman conducts Board procedures in a proper manner and ensures that Board members discharge their responsibility effectively to make a contribution to Board’s affairs. Agenda for meetings and matters to be taken up at Board Meetings are duly scheduled.
A.4 Financial Acumen –
The Board should ensure the availability of those with sufficient financial acumen and knowledge to offer guidance on matters of finance within the Board.
A.4.1 Financial Acumen. The Board is comprised with sufficient number of directors with financial acumen who provide guidance to the Board on matters relating to finance. Please refer pages 25 to 26 of the Annual Report for the profile of the Directors.
A.5 Board Balance –
It is preferable for the Board to have a balance of Executive and Non-Executive Directors such that no individual or small group can dominate the Board’s decision taking.
A.5.1 Board should include at least two Non- Executive The extent of compliance with this requirement is disclosed in page Directors or one-third of total Directors, whichever No. 28 under "Board Composition and balance" is higher.
A.5.2 Two or one-third of Non- Executive Directors The extent of compliance with this requirement is disclosed in page whichever is higher should be independent. No. 28 under "Board Composition and balance"
A.5.3 Evaluation of independence of Non- Executive Directors. A.5.4 Signed declaration of Independence by the The extent of compliance with this requirement is disclosed in page Non- Executive Directors. No. 28 under "Determination of Independence of Non-Executive
Directors" A.5.5 Determination of the independence and non-independence of each Non- Executive Directors annually.
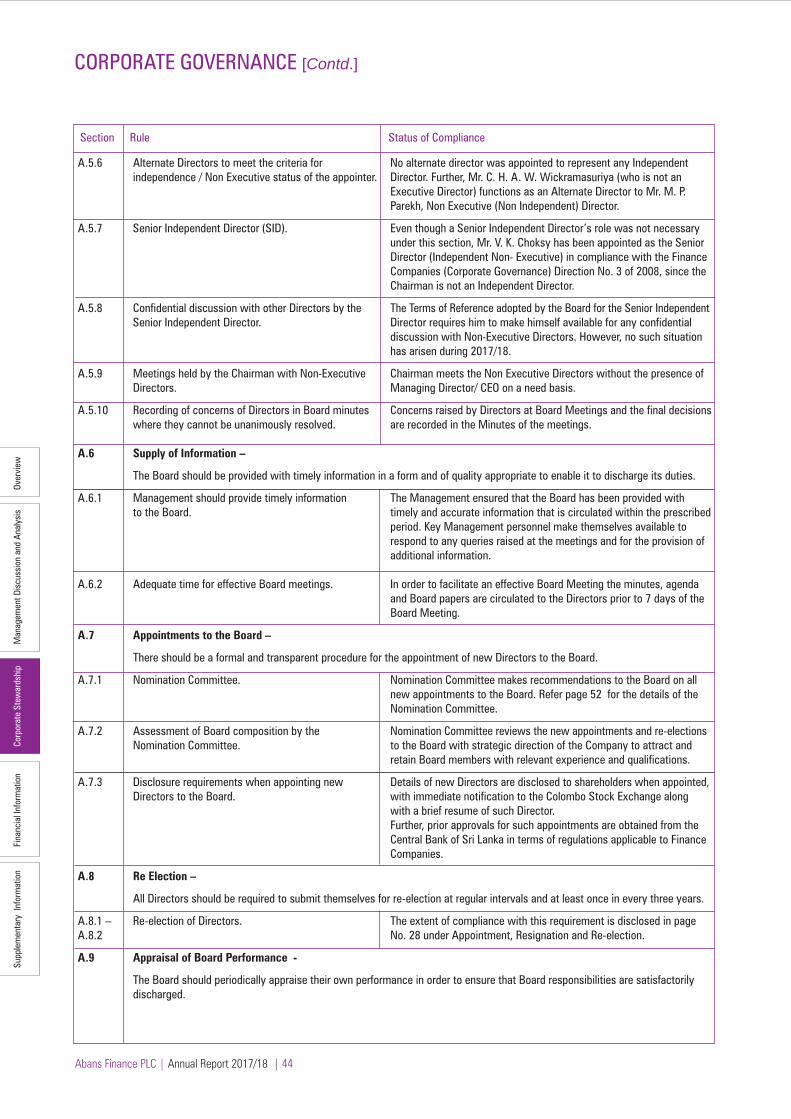
Over
view
Man
agem
ent D
iscu
ssio
n an
d An
alys
isCo
rpor
ate
Stew
ards
hip
Fina
ncia
l Inf
orm
atio
nSu
pple
men
tary
Inf
orm
atio
n
Abans Finance PLC | Annual Report 2017/18 | 44
CORPORATE GOVERNANCE [Contd.]
Section Rule Status of Compliance
A.5.6 Alternate Directors to meet the criteria for No alternate director was appointed to represent any Independent independence / Non Executive status of the appointer. Director. Further, Mr. C. H. A. W. Wickramasuriya (who is not an Executive Director) functions as an Alternate Director to Mr. M. P. Parekh, Non Executive (Non Independent) Director.
A.5.7 Senior Independent Director (SID). Even though a Senior Independent Director’s role was not necessary under this section, Mr. V. K. Choksy has been appointed as the Senior Director (Independent Non- Executive) in compliance with the Finance Companies (Corporate Governance) Direction No. 3 of 2008, since the Chairman is not an Independent Director.
A.5.8 Confidential discussion with other Directors by the The Terms of Reference adopted by the Board for the Senior Independent Senior Independent Director. Director requires him to make himself available for any confidential discussion with Non-Executive Directors. However, no such situation has arisen during 2017/18.
A.5.9 Meetings held by the Chairman with Non-Executive Chairman meets the Non Executive Directors without the presence of Directors. Managing Director/ CEO on a need basis.
A.5.10 Recording of concerns of Directors in Board minutes Concerns raised by Directors at Board Meetings and the final decisions where they cannot be unanimously resolved. are recorded in the Minutes of the meetings. A.6 Supply of Information –
The Board should be provided with timely information in a form and of quality appropriate to enable it to discharge its duties.
A.6.1 Management should provide timely information The Management ensured that the Board has been provided with to the Board. timely and accurate information that is circulated within the prescribed period. Key Management personnel make themselves available to respond to any queries raised at the meetings and for the provision of additional information.
A.6.2 Adequate time for effective Board meetings. In order to facilitate an effective Board Meeting the minutes, agenda and Board papers are circulated to the Directors prior to 7 days of the Board Meeting.
A.7 Appointments to the Board –
There should be a formal and transparent procedure for the appointment of new Directors to the Board.
A.7.1 Nomination Committee. Nomination Committee makes recommendations to the Board on all new appointments to the Board. Refer page 52 for the details of the Nomination Committee.
A.7.2 Assessment of Board composition by the Nomination Committee reviews the new appointments and re-elections Nomination Committee. to the Board with strategic direction of the Company to attract and retain Board members with relevant experience and qualifications.
A.7.3 Disclosure requirements when appointing new Details of new Directors are disclosed to shareholders when appointed, Directors to the Board. with immediate notification to the Colombo Stock Exchange along with a brief resume of such Director. Further, prior approvals for such appointments are obtained from the Central Bank of Sri Lanka in terms of regulations applicable to Finance Companies.
A.8 Re Election –
All Directors should be required to submit themselves for re-election at regular intervals and at least once in every three years.
A.8.1 – Re-election of Directors. The extent of compliance with this requirement is disclosed in page A.8.2 No. 28 under Appointment, Resignation and Re-election.
A.9 Appraisal of Board Performance -
The Board should periodically appraise their own performance in order to ensure that Board responsibilities are satisfactorily discharged.

Over
view
Man
agem
ent D
iscu
ssio
n an
d An
alys
isCo
rpor
ate
Stew
ards
hip
Fina
ncia
l Inf
orm
atio
nSu
pple
men
tary
Inf
orm
atio
n
Abans Finance PLC | Annual Report 2017/18 | 45
Over
view
CORPORATE GOVERNANCE [Contd.]
Section Rule Status of Compliance
A.9.1– Appraisal of Board Performance. The extent of compliance with this requirement is disclosed in page A.9.3 No. 29 under "Board and its Sub Committees’ effectiveness".
Annual self-evaluation by the Board members and of its committees.
Disclosure of evaluation process.
A.10 Disclosure of information in respect of Directors
Shareholders should be kept advised of relevant details in respect of Directors.
A.10.1 Annual Report disclosure in respect of Directors Profiles of the Board of Directors are given on pages 25 to 26. (Name, Qualifications, etc.)
A.11 Appraisal of Chief Executive Officer (CEO)
The Board should require at least annually to assess the performance of the CEO.
A.11.1 Targets for CEO at the commencement of each fiscal year. CEO’s performance targets are aligned with business strategies of the Company. Targets are set at the beginning of every financial year by the Board which is in line with the short, medium and long term objectives of the Company.
A.11.2 Evaluation of the performance at the end of each fiscal At the end of each financial year the Board evaluates the set targets year. and the actual performance.
B. DIRECTORS’ REMUNERATION
B.1 Remuneration procedure The Company has a formal and transparent procedure for developing policy on executive remuneration and for fixing the remuneration packages of individual Directors. No Director should be involved in deciding his / her remuneration.
B.1.1 Setting up of Remuneration Committee. The Committee determines the compensation and benefits of the Executive Directors and ensures no director is involved in determining his own remuneration. Further, the Committee is responsible for deciding the overall remuneration structure of the Company.
B.1.2 Composition of Remuneration Committee. The Remuneration Committee is comprised of Non-Executive Directors. Refer the Remuneration Committee report on page 51.
B.1.3 Disclosure in the Annual Report about the The Remuneration Committee report is given on page 51. Remuneration Committee members.
B.1.4 Remuneration of Non-Executive Directors. The Non-Executive Directors (Independent) receive fees for attending meetings of the Board and Board Sub-committees.
B.1.5 Remuneration Committee consult Chairman / CEO The Committee consults Chairman/ CEO when recommending the and other Executive Directors and access to the remuneration of other Executive Directors and also has access to professional advice. professional advice when deemed necessary.
B.2 The level and make up of Remuneration
Level of remuneration of both Executive and Non-Executive Directors should be sufficient to attract and retain the Directors’ to run the company successfully. A proportion of Executive Director’s remuneration should be structured to link rewards to corporate and individual performance.
B.2.1 – Level and make up of remuneration of Executive The Remuneration Committee gives due consideration to the B.2.9 Directors including performance element in pay provisions of these sections and arrives at final recommendations as structure. specified.
- Remuneration packages in line with industry practices. The Remuneration Committee ensures that remuneration packages are in line with the industry practices.

Over
view
Man
agem
ent D
iscu
ssio
n an
d An
alys
isCo
rpor
ate
Stew
ards
hip
Fina
ncia
l Inf
orm
atio
nSu
pple
men
tary
Inf
orm
atio
n
Abans Finance PLC | Annual Report 2017/18 | 46
CORPORATE GOVERNANCE [Contd.]
Section Rule Status of Compliance
- Executive share option. The Company does not have an executive share option scheme
- Non Executive Directors’ remuneration. The Non-Executive Directors (Independent) receive a fee for attending meetings of the Board and additional fee whenever they serve on Board Sub-committees.
B.3 Disclosure of Remuneration
Annual Report of the Company should contain a statement of remuneration policy and details of remuneration of the Board as a whole.
B.3.1 Disclosure in the Annual report about the. Please refer the Remuneration Committee report on page No. 51 (a) Remuneration Committee members. and Note No. 12 to the Financial Statements. (b) statement of remuneration policy. (c) aggregate remuneration paid.
C. RELATIONS WITH SHAREHOLDERS
C.1 Constructive use of the Annual General Meeting (AGM) and Conduct of General Meetings. Board should use the AGM to communicate with shareholders and should encourage their participation.
C.1.1 Use of proxy votes. The Company has recorded all proxy votes for each resolution prior to the General Meeting.
C.1.2 Separate resolutions for separate issues. Separate resolutions are placed before shareholders for business transactions at the AGM.
C.1.3 Arrangement made by the Chairman of Board that The Chairman of the Board ensures that the Chairmen of the Board all Chairmen of sub-committees make themselves sub-committees are present at the AGM unless under exceptional available at the AGM. circumstances.
C.1.4 Adequate notice for the AGM to the shareholders. Annual Report including Financial Statements and the notice of the meeting are sent to shareholders at least 15 working days prior to the date of the AGM.
C.1.5 Procedure of voting at general meeting. A summary of the procedure is set out in the Proxy form itself sent to each shareholder.C.2 Communication with Shareholders
The Board should implement effective communication with shareholders.
C.2.1 Channel to reach all shareholders to disseminate The Board approved communication policy addresses this matter. timely information.
C.2.2 Disclose the policy and methodology of The Annual General Meeting of the Company is the main forum where communication with shareholders. the Board maintains effective communication with the shareholders. Hence all shareholders are encouraged to participate at the AGM. Further, the Company’s website, corporate disclosures and other news releases to the Colombo Stock Exchange function as additional communication channels.
C.2.3 Implementation of the methodology. Refer the comment on principle C.2.2
C.2.4 Disclose a contact person in relation to Shareholders may contact the Chief Financial Officer for queries, if any. communications.C.2.5 Awareness of Directors on major issues and The Company Secretaries maintain records of all correspondence concerns of shareholders. received from shareholders and direct the same to appropriate channels for resolution.
C.2.6 Identify a contact person in relation to The Company Secretaries can be contacted for any queries of shareholders’ matters. shareholders, whose details are given below, Varners International (Pvt.) Ltd., Corporate Secretaries, Level 14, West Tower, World Trade Centre, Echelon Square, Colombo – 01.
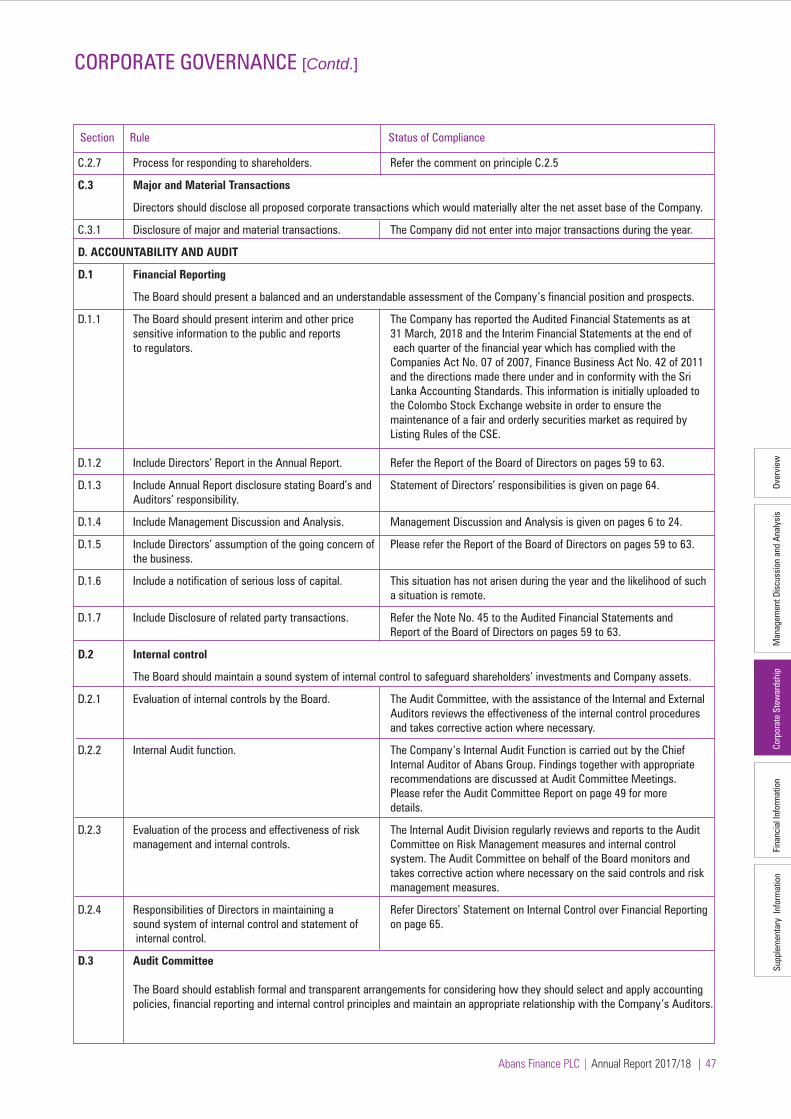
Over
view
Man
agem
ent D
iscu
ssio
n an
d An
alys
isCo
rpor
ate
Stew
ards
hip
Fina
ncia
l Inf
orm
atio
nSu
pple
men
tary
Inf
orm
atio
n
Abans Finance PLC | Annual Report 2017/18 | 47
CORPORATE GOVERNANCE [Contd.]
Section Rule Status of Compliance
C.2.7 Process for responding to shareholders. Refer the comment on principle C.2.5
C.3 Major and Material Transactions
Directors should disclose all proposed corporate transactions which would materially alter the net asset base of the Company.
C.3.1 Disclosure of major and material transactions. The Company did not enter into major transactions during the year.
D. ACCOUNTABILITY AND AUDIT
D.1 Financial Reporting
The Board should present a balanced and an understandable assessment of the Company’s financial position and prospects.
D.1.1 The Board should present interim and other price The Company has reported the Audited Financial Statements as at sensitive information to the public and reports 31 March, 2018 and the Interim Financial Statements at the end of to regulators. each quarter of the financial year which has complied with the Companies Act No. 07 of 2007, Finance Business Act No. 42 of 2011 and the directions made there under and in conformity with the Sri Lanka Accounting Standards. This information is initially uploaded to the Colombo Stock Exchange website in order to ensure the maintenance of a fair and orderly securities market as required by Listing Rules of the CSE.
D.1.2 Include Directors’ Report in the Annual Report. Refer the Report of the Board of Directors on pages 59 to 63.
D.1.3 Include Annual Report disclosure stating Board’s and Statement of Directors’ responsibilities is given on page 64. Auditors’ responsibility.
D.1.4 Include Management Discussion and Analysis. Management Discussion and Analysis is given on pages 6 to 24.
D.1.5 Include Directors’ assumption of the going concern of Please refer the Report of the Board of Directors on pages 59 to 63. the business.
D.1.6 Include a notification of serious loss of capital. This situation has not arisen during the year and the likelihood of such a situation is remote.
D.1.7 Include Disclosure of related party transactions. Refer the Note No. 45 to the Audited Financial Statements and Report of the Board of Directors on pages 59 to 63.
D.2 Internal control
The Board should maintain a sound system of internal control to safeguard shareholders’ investments and Company assets.
D.2.1 Evaluation of internal controls by the Board. The Audit Committee, with the assistance of the Internal and External Auditors reviews the effectiveness of the internal control procedures and takes corrective action where necessary.
D.2.2 Internal Audit function. The Company’s Internal Audit Function is carried out by the Chief Internal Auditor of Abans Group. Findings together with appropriate recommendations are discussed at Audit Committee Meetings. Please refer the Audit Committee Report on page 49 for more details.
D.2.3 Evaluation of the process and effectiveness of risk The Internal Audit Division regularly reviews and reports to the Audit management and internal controls. Committee on Risk Management measures and internal control system. The Audit Committee on behalf of the Board monitors and takes corrective action where necessary on the said controls and risk management measures.
D.2.4 Responsibilities of Directors in maintaining a Refer Directors’ Statement on Internal Control over Financial Reporting sound system of internal control and statement of on page 65. internal control.
D.3 Audit Committee
The Board should establish formal and transparent arrangements for considering how they should select and apply accounting policies, financial reporting and internal control principles and maintain an appropriate relationship with the Company’s Auditors.

Over
view
Man
agem
ent D
iscu
ssio
n an
d An
alys
isCo
rpor
ate
Stew
ards
hip
Fina
ncia
l Inf
orm
atio
nSu
pple
men
tary
Inf
orm
atio
n
Abans Finance PLC | Annual Report 2017/18 | 48
CORPORATE GOVERNANCE [Contd.]
Section Rule Status of Compliance
D.3.1 Composition of the Audit Committee. The Audit Committee comprises two Independent Non-Executive Directors. Please refer Audit Committee Report on page 49.
D.3.2 Reviewing the scope and results of the audit and its The extent of compliance with this requirement is disclosed on page effectiveness and independence and objectivity of No. 49 under "Audit Committee Report" the Auditors. D.3.3 Terms of reference of the Audit Committee. The Audit Committee is guided by the Terms of Reference approved by the Board which outlines its authority and responsibility.
D.3.4 Disclosure made in the Annual Report about Refer the Audit Committee Report on page 49. the Audit Committee.
D.4 Code of Business Conduct and Ethics
The Company must adopt a Code of Business Conduct and Ethics for Directors and members of the Senior Management team. Any non-compliance with the said Code should be promptly disclosed.
D.4.1 Code of business conduct and ethics. The Company has in place a code of conduct and ethics which is applicable to Directors and Employees.
D.4.2 Chairman’s confirmations for any violation of code Refer the Chairman’s Statement on Corporate Governance on page of conduct and ethics. 27.
D.5 Corporate Governance disclosures
The Board should include this in the Annual Report setting out the manner and extent for it to be complied.
D.5.1 Disclosure of corporate governance compliance. This requirement is met through presentation of this report.
E. INSTITUTIONAL INVESTORS
E.1 Shareholder Voting
Institutional shareholders are required to make considered use of their votes and encouraged to ensure that their voting intentions are translated into practice.
E.1.1 Regular dialogue to be maintained with shareholders Annual General Meeting is a forum to have an effective dialogue with and Chairman to communicate shareholders views shareholders. to the Board.
E.2 Evaluation of Governance disclosure
Institutional investors are encouraged to give due weight to all relevant factors in the Board structure and composition.
F. OTHER INVESTORS
F.1 Investing / Divesting Decisions
F.1 Individual shareholders’ investment decisions. Individual shareholders investing directly in the Company are encouraged to seek independent advice on their investment holding or divesting decisions.
F.2 Shareholder VotingF.2 Individual shareholder voting. Individual shareholders are encouraged to participate at the Annual General Meeting and to exercise their voting rights. Notices of the meetings are dispatched to all shareholders within the prescribed time period.G. SUSTAINABILITY REPORTINGG.1.1 Economic Sustainability. Refer Pages 12 to 15 to the Annual ReportG.1.2 The Environment. Refer Page 24 to the Annual ReportG.1.3 Labour Practice. Refer Pages 22 to 24 to the Annual ReportG.1.4 Society. Refer Page 24 to the Annual ReportG.1.5 Product Responsibility. Refer Page 22 to the Annual ReportG.1.6 Stakeholder identification, engagement and effective communication. Refer Page 16 to the Annual ReportG.1.7 Sustainable reporting and disclosure should be formalized. Refer Pages 6 to 24 to the Annual Report

Over
view
Man
agem
ent D
iscu
ssio
n an
d An
alys
isCo
rpor
ate
Stew
ards
hip
Fina
ncia
l Inf
orm
atio
nSu
pple
men
tary
Inf
orm
atio
n
Abans Finance PLC | Annual Report 2017/18 | 49
AUDIT COMMITTEE REPORT
TERMS OF REFEENCE
The Audit Committee assists the Board of Directors in its general oversight of financial reporting, internal control and internal audit functions. Recommendations of the Audit Committee are discussed and appropriate measures are taken by the manage-ment or the Board on a continuous basis. The Company has derived the requirements relating to the terms of reference of the Audit Committee from the Finance Companies (Corporate Governance) Direction No.03 of 2008 issued by the Monetary Board of the Central Bank of Sri Lanka, Listing Rules of the Colombo Stock Exchange and the Code of Best Practice on Corporate Governance issued jointly by The Institute of Chartered Accountants of Sri Lanka and the Securities and Exchange Commission of Sri Lanka.
COMPOSITION OF THE AUDIT COMMITTEE
The Composition of the Audit Committee is as follows;
• Mr.Ajith.S. Ratnayake- Chairman, Independent Non-Executive Director
• Mr.V.K.Choksy- Independent Non-Executive Director and Senior Director The Chairman of the Committee is the retired founder Director General of the Sri Lanka Accounting and Auditing Standards Monitoring Board. He is a fellow member of the Institute of Chartered Accountants of Sri Lanka, fellow member of the Chartered Institute of Management Accountants (UK) and a fellow member of the Association of Chartered Certified Accountants.
RESPONSIBILITIES OF THE AUDIT COMMITTEE
Responsibilities include;
- Overseeing the internal control systems and reviewing their effectiveness.
- Reviewing and monitoring the systems adopted by the management to control impairment of receivables.
- Reviewing and monitoring the effectiveness of the internal audit function.
- Review of accounting policies, practices and the financial statements.
- Monitoring the integrity of the financial statements.
- Advising the Board on appointment of the External Auditors and the remuneration of the External Auditors.
MEETINGS
The Audit Committee met Fourteen times during the year. The attendance of committee members at meetings is given below.
Name of the Directors No. of Meetings held No. of Meetings Attended
Mr. A. S. Ratnayake 14 14
Mr. V.K. Choksy 14 12
The Managing Director, Chief Operating Officer, Chief Internal Auditor, Chief Financial Officer, Manager Risk and Compliance/ Compliance Officer, Head of Recoveries, and other officers attended meetings by invitation based on the items under discussion during the year under review. The Audit Committee met the external auditors without the presence of the manage-ment on two occasions during the year to facilitate their independence and maintenance of the scope of the audit. The Committee also met the internal auditors without the presence of the management.
FINANCIAL REPORTING
The Audit Committee assists the Board of Directors in its oversight on the preparation and presentation of the financial statements in order to show a true and fair view of the financial position and performance in compliance with Sri Lanka Account-ing Standards (SLFRSs). In accordance with the mandates mentioned above, committee reviews the following.
- The adequacy and the effectiveness of the internal control systems and procedures to provide reasonable assurance that all transactions are monitored and recorded in the books of account.
- The Company’s financial statements and accounting policies and practices.
- Effectiveness of the financial reporting systems in place to ensure reliability of the information provided to the stakeholders.- The processes by which the Company ensures compliance with Sri Lanka Accounting Standards (SLFRSs) relating to financial reporting.- The Annual Financial Statements for the year and the Interim Financial Statements.
RISK AND INTERNAL CONTROLThe Committee reviews the effectiveness of the Company‘s internal control systems over financial reporting and other relevant operations. The Committee also recommended systems and procedures to reduce risks identified.
INTERNAL AUDIT
The Internal Audit plan of the Company was reviewed and approved by the Committee. The Committee regularly reviews the internal audit reports and their findings. Detailed discussions are conducted with the management at committee meetings to improve procedures to prevent or reduce recurrence of adverse findings.
EXTERNAL AUDIT
The Audit Committee monitors and reviews the external auditors’ independence, and the objectivity and effectiveness of the audit process considering relevant regulatory requirements.
The Committee obtained a declaration of independence from the external auditors, and assessed their independence. Non-audit services provided by the external auditors were reviewed by the Committee to ensure that they are not likely to impair the independence and objectivity of the external auditors.The Committee met the external auditors to discuss the audit plan, progress of audit, the results of the audit. Meetings were held both with and without the presence of management.
ETHICS AND GOOD GOVERNANCE
The Company’s Whistle Blowing Policy serves as a mechanism to manage risks pertaining to corporate fraud. There is a provision under this policy for any staff member, who has a legitimate concern on an existing potential “wrong doing” committed by any person within the Company, to bring such concerns in confidence to the notice of the Chairman of the Audit Committee. A process is also in place for such concerns to be investigated, while maintaining identity of the whistle-blower confidential. The Committee is empowered under their Terms of Reference to monitor this procedure.
On behalf of the Audit Committee
Ajith S. RatnayakeChairman- Audit Committee25 June 2018
Ajith S. Ratnayake

Over
view
Man
agem
ent D
iscu
ssio
n an
d An
alys
isCo
rpor
ate
Stew
ards
hip
Fina
ncia
l Inf
orm
atio
nSu
pple
men
tary
Inf
orm
atio
n
Abans Finance PLC | Annual Report 2017/18 | 50
RELATED PARTY TRANSACTIONS REVIEW COMMITTE REPORT
Introduction
The Related Party Transactions Review Committee was formed by the Board of Directors in compliance with section 9 of the Listing Rules of the Colombo Stock Exchange.
Composition of the Committee
The Committee comprised of the following members of the Board.
Mr. A. S. Ratnayake - Independent Director (Chairman of the Committee) Mr. M. P. Parekh* - Non-Executive Director Mr. R. A. Nanayakkara** – Managing Director Mr. K. B. Wanigasekara*** - Managing Director
* Mr. C. H. A. W. Wickramasuriya - Alternate Director to Mr. M. P. Parekh, attends meetings of the Committee as his alternate.
** Appointed to the Board of Abans Finance PLC and as a Member of the Committee with effect from 27 September 2017.
***Ceased to be a member of the Board and as Member of the Committee with effect from 27 September, 2017
Varners International (Pvt) Ltd., Secretaries of the Company function as the Secretary of the Related Party Transactions Review Committee.
The Role of the Committee
The Committee is entrusted with the responsibility to assist the Board
(a) to ensure that every related party transaction is conducted in a manner that will protect the Company from conflict of interest which may arise between the Company and its Related Parties;
(b) that the interest of shareholders as a whole are taken into account by the Company when entering into transactions with Related Parties;
(c) to ensure proper review and approval is obtained from the Committee either prior to the transaction being entered into or if the transaction is expressed to be conditional on such approval, prior to the completion of the transaction;
(d) to recommend the Board of Directors to obtain the shareholder approval by way of special resolution prior to the concerned transaction being entered into in conformity with Section 9.1 and 9.4 of the Listing Rules;
(e) to ensure that the objective and the economic and commercial substance of the Related Party Transactions should take precedence over the legal form and technicality, and
(f) to monitor disclosure of transactions between the Company and any of its Related Party/ies as required in compliance with legal and / or regulatory requirements stipulated by the Listing Rules of the Colombo Stock Exchange, Central Bank of Sri Lanka and Sri Lanka Financial Reporting Standards.
Meetings
The quorum for a meeting is two Directors and both of them should be Non-Executive. The Committee met four times in the financial year under review and the attendance of the Directors at the meetings is given on page 30 of the Annual Report. The minutes of the meeting were reported to the Board of Directors.
Review of Related Party Transactions
The Committee reviewed the systems in place to report related party transactions to the Committee and advised the management on improvements required. The Committee reviewed related party transactions reported by the management in compliance with its terms of reference. No related party transactions which required approval of shareholders by way of a Special Resolution in terms of section 9.4.1 or those which required immediate disclosure in terms of section 9.3.1 were reported to the Committee by the Management during the year.
For and on behalf of Related Party Transactions Review Committee
Ajith S. Ratnayake Chairman - Related Party Transactions Review Committee 25 June 2018
Ajith S. Ratnayake

Over
view
Man
agem
ent D
iscu
ssio
n an
d An
alys
isCo
rpor
ate
Stew
ards
hip
Fina
ncia
l Inf
orm
atio
nSu
pple
men
tary
Inf
orm
atio
n
Abans Finance PLC | Annual Report 2017/18 | 51
REMUNERATION COMMITTEE REPORT
THE COMPOSITION
The Remuneration Committee comprises three Non-Executive Directors, of whom two including the Chairman are Independent Directors. Details of the members of the committee during the year are as follows.
Mr. V. K. ChoksyChairmanIndependent Non Executive Director/ Senior Director
Mr. Ajith S. RatnayakeIndependent Non-Executive Director
Mr. Mayank ParekhNon-Executive Director
Brief profiles of the members are given on pages 25 to 26 of the Annual Report. The Chief Executive Officer (CEO) who is the apex executive-in-charge of the day to day management of the Company attends meetings and participates in the Committee meetings by invitation. The CEO takes part in all deliberations except when his own performance and remuneration is discussed. The Company Secretaries functions as the Secretary to the Committee.
THE ROLE OF THE COMMITTEE
The Committee is entrusted with the responsibility of evaluating, assessing and recommending to the Board of Directors on any matters that may affect the remuneration structure of the company including the following;
- The determination of remuneration and other benefits of Key Management Personnel and the establishment of performance parameters. - The determination of the remuneration of the CEO and the Independent Non - Executive Directors while ensuring that no Director is involved in setting his own remuneration.
- To introduce policies and parameters of the remuneration structure for all staff members of the Company and monitor the implementation thereof.
- Review of information related to remuneration of staff members from time to time in order to ensure that the remuneration payable by the company is on par or above the industry norms and align remuneration to market rates to ensure the retention of the Key Management Personnel.
- Recruitments and promotions of staff at management level are also considered and recommended based on proposals submitted by the CEO following a formal process of evaluation.
- Approval of annual increments, profit share bonus and incentives.
REMUNERATION POLICY
The company’s rewarding strategies and remuneration structures are designed to attract, motivate and retain high competent staff at all levels of the organization. Accordingly salaries and other benefits are reviewed periodically taking into account the performance of the employee and comparison with the group companies. The qualifications, competence and experience are considered in determining the remuneration. Further the employees who are directly related to the performance of the company are rewarded with a variable payment based on the performance that he or she demonstrates.
Principles that strengthen the Company’s remuneration strategy:
- The reward focus is on the creation of an appropriate balance between the fixed and variable pay.
- Individual performance appraisals identify talents at all levels of the organization, enabling fair and competitive remuneration.
- There is no discrimination against employees based on diversity or physical differences.
- Remuneration is commensurate with each employee’s expertise and contribution and it is aligned with the business performance and long term shareholders’ returns.
MEETINGS
The committee held one meeting during the financial year. The attendance by members is given in the Corporate Governance Report on page 30 of the Annual Report.
The proceedings of the Committee meetings have been reported to the Board of Directors during the year.
DIRECTORS' REMUNERATION
The total of Directors’ remuneration paid during the year under review is set out in Note 12 to the Financial Statements. This comprises fees for all the committees of the company that Directors serves on.
COMMITTEE EVALUATION
The Committee completed an evaluation process with self-as-sessment of members in March 2017, which was forwarded to the Board and the Board was satisfied with the performance of the Committee.
V.K. ChoksyChairman – Remuneration Committee25 June 2018

Over
view
Man
agem
ent D
iscu
ssio
n an
d An
alys
isCo
rpor
ate
Stew
ards
hip
Fina
ncia
l Inf
orm
atio
nSu
pple
men
tary
Inf
orm
atio
n
Abans Finance PLC | Annual Report 2017/18 | 52
NOMINATION COMMITTEE REPORT
The Nomination Committee comprises of two Non-Executive Directors appointed by the Board of Directors of the Company. The following Directors served on the Nomination Committee during the year under review,
Mr. Rusi Pestonjee - Chairman of the Committee (Non - Executive Director)
Mr. V. K. Choksy - Independent Non-Executive Director / Senior Director
Brief profiles of the members of the Committee are given at pages 25 to 26 of the Annual Report. The Company Secretary functions as the secretary to the committee.
COMMITTEE’S ROLES AND RESPONSIBILITIES
The Committee is entrusted with the board approved terms of reference and its role and responsibilities are in conformity with the provisions stipulated in the Code of Best Practice on Corporate Governance - 2013 issued jointly by the Institute of Chartered Accountants of Sri Lanka and the Securities and Exchange Commission of Sri Lanka.
The Nomination Committee is responsible for reviewing the composition of the Board to ensure that the Board is properly constituted and balanced in terms of skills, experience and diversity. In addition, the Committee is also entrusted with the following responsibilities,
• Recommending to the Board on appointments of new Directors and ensuring the implementation of the approved procedure in selecting such Directors;
• Recommending the re-appointment of existing Directors of the Board of Directors, taking into account the performance and contribution made by such Directors towards the overall discharge of responsibilities of the Board and Board-Sub Committees;
• Ensuring that the Directors fulfill the fit and proper criteria to hold office in conformity with Finance Companies (Assessment of Fitness and Propriety of Directors and Officers Performing Executive Functions) Direction No. 03 of 2011 and other applicable statutes;
• Reviewing criteria such as qualifications, experience and key attributes required for eligibility to be considered for appointment of Directors;
• Assessing from time to time the requirements of additional and / or new expertise and the succession arrangements for retiring Directors with a view to providing advice and recommendations to the Board on any such appointment.
MEETINGS & MINUTES
The Committee held one meeting during the year and the attendance of Committee Members at each of these meetings is given in page 30 to the Annual Report. The Committee reports to the Board of Directors on its activities and the minutes of the meetings are tabled at the Meetings of the Board of Directors.
Rusi PestonjeeChairman - Nomination Committee25 June 2018

Over
view
Man
agem
ent D
iscu
ssio
n an
d An
alys
isCo
rpor
ate
Stew
ards
hip
Fina
ncia
l Inf
orm
atio
nSu
pple
men
tary
Inf
orm
atio
n
Abans Finance PLC | Annual Report 2017/18 | 53
INTEGRATED RISK MANAGEMENT REPORT
The Integrated Risk Management Committee (IRMC) is a Board Sub-Committee established in conformity with Section 8 of the Finance Companies (Corporate Governance) Direction No. 03 of 2008 with the Board approved Terms of Reference. The IRMC is entrusted with the responsibility to assist the Board to oversee the Risk Management framework of the Company, set the risk appetite and to determine the appropriate tolerable limits, monitor the limits continuously for effective risk management and to overlook the Compliance Function of the Company.
COMPOSITION OF THE COMMITTEE
The Committee comprised of the following members,
Board representatives are,
• Mr. Mayank Pravin Parekh (Alternate C. H. A. W. Wickramasuriya) - Chairman (Non Independent Non Executive Director)
• Mr. Kithsiri Wanigasekara - Managing Director (Retired w.e.f 27 September 2017)
Management representatives are,
• Mr. Roshan Nanayakkara - Managing Director/ CEO (Appointed as Managing Director w.e.f. 27 September 2017)
• Mr. J. A. P. Fernando - Chief Operating Officer
• Mr. Aruna Somasiri - Head of Recoveries
• Mr. Gemunu Gunawardena - Head of Deposits
• Ms. Ivon Brohier - Chief Financial Officer
• Mr. Bathiya Samaraweera - Head of Marketing
• Mr. Gayan Wickramasinghe - Head of IT
• Mr. Manura Rajakaruna - Manager-IT
• Ms. Mahika Rajakaruna - Acting Compliance Officer
COMMITTEE MEETINGS
The Committee meets on an approximately quarterly basis and the attendance of the Directors at the meetings is given on Page 30 of the Annual Report. The discussions and conclusions reached at the meetings are recorded in minutes and circulated to the Board of Directors for information and advice.
DUTIES AND RESPONSIBILITES OF THE COMMITTEE
The main responsibility of the Committee is to assess risks faced by the company such as Credit Risk, Market Risk, Liquidity Risk, Operational Risk and Strategic Risk. In fulfilling its duties, the Committee covers the following areas,
• Review the quality of the Credit Portfolio including delinquency monitoring and Credit Concentration Management.
• Review the Funding Concentration Risks and the available Contingency Funding Plans.
• Review financial performance and the Capital Adequacy of the Company.
• Review the Asset and Liability Management Policy including the specific risk limits and monitoring the compliance.
• Review progress on operational risk throughout the Company.
• Review of Business Continuity and Disaster Recovery Plan related issues.
• Assess adequacy and effectiveness of Management Committees, namely Credit Committee and Asset and Liability Committee (ALCO)
• Review the Company’s Compliance with laws and regulations.
• Propose appropriate measures for corrective action as part of the risk mitigation process.
COMMITTEE EVALUATION
The committee completed the evaluation process with self assessment in 2018 March which deemed to be satisfactory.
On behalf of the Integrated Risk Management Committee,
C. H. A. W. Wickramasuriya (Alternate to Mayank Parekh) Chairman - Integrated Risk Management Committee
25 June 2018
g
C. H. A. W. Wickramasur

Over
view
Man
agem
ent D
iscu
ssio
n an
d An
alys
isCo
rpor
ate
Stew
ards
hip
Fina
ncia
l Inf
orm
atio
nSu
pple
men
tary
Inf
orm
atio
n
Abans Finance PLC | Annual Report 2017/18 | 54
RISK MANAGEMENT REPORT
OVERVIEW
Effective risk management is at the core of Abans Finance PLC’s value creation model as we accept risk in the normal course of business. Our stability and profitability are determined by how we manage risk. Significant resources are devoted to this critical function to ensure that it is well articulated, communicated and understood by all employees of the Company as it is a shared responsibility.
A disciplined risk management culture and framework facilitates oversight of and accountability for risk at all levels of the company and across all risk types. The Board determines the risk appetite based on current and anticipated exposures and views on the economy in normal and stressed conditions. In effect, the risk appetite is designed to measure the magnitude of market volatility and stress which the company can withstand, while meeting its financial goals and regulatory requirements. This enables the risk function to set, monitor and enforce appropriate risk limits.
RISK GOVERNANCE
We believe that an effective Risk Management begins with effective risk governance. The Company has an established risk governance structure with an active and engaged Board of Directors supported by an experienced management team. The following figure illustrates the risk governance structure of the Company.
The risk management function serves to enable the business risk owners and executive management to carry out their respective responsibilities for the execution of risk framework. The ultimate risk oversight responsibilities remain at the Board level and the Board of Directors, either directly or through Integrated Risk Management Committee (IRMC) ensures that decision-making is aligned with the Company’s strategies. The Board receives regular updates on key risks indicators of the Company.
The IRMC plays a catalytic role in formulating and recommending relevant policy framework to the Board in conformity with the Directions issued by the regulator on Risk Management to ensure the safety and financial soundness of the Company. IRMC is entrusted with the responsibility by the Board to have in place a well structured and effective risk policy and framework. The IRMC is supported by the Credit Committee, Asset and Liability Management Committee and an independent Risk & Compliance Management Division.
The Credit Committee is entrusted to implement credit policies approved by the Board while reviewing and making recommendations periodically, that arise in day to day high value credit decisions, managing of portfolio delinquency and establishing strategies to improve the quality of credit disbursements.
The Asset and Liability Committee is engaged in Liquidity Risk Management, Interest Rate Risk Management, Capital Planning, Product Pricing, Settings of appropriate Margins and conducting reviews on shock analysis, stress testing and sensitivity analysis and reporting the identified concerns to IRMC and / or Board.
Independent Risk & Compliance Management Division is entrusted with independent oversight function, assisting in identifying and managing risks, monitoring the status of remedial actions and monitoring the compliance with risk limits and reporting.
Three lines of defence
The Company’s three lines of defence model helps to oversee risks and provide an independent assurance.
CREDIT RISK
Credit Risk is the risk of loss resulting from the failure of a borrower or counterparty to honour its financial or contractual obligations to the Company. Credit Risk arises in the Company’s direct lending operations, and investment activities where counterparties have repayment or other obligations to the Company. The Credit Risk Management of lending operations and investment activities are the responsibilities of the Credit Committee and the Asset & Liability Committee, the two key Management Committees. The Board of Directors monitors the performance of these management committees with the assistance of the Integrated Risk Management Committee.
The Board of Directors approves the Company’s Credit Risk framework, which provides the overall structure that supports effective governance of the Company’s Credit Risk. The Company’s Credit Policy, Credit Risk Appetite and the Credit Risk framework set expectations for the conduct of the Credit Risk Management activities and behaviour throughout the organization. This ensures,
• A consistent and effective execution of Credit Risk Management activities across the Company• A strong Credit Risk Management culture• A performance that is in line with strategic objectives• Compliance with regulatory requirements in relation to lending activities
Take and manage risk - Primarily responsible for riskmanagement of the Company by managing the risk-reward trade-off within the scope of risk tolerance and policies. The process of assessing, evaluating and measuring risk is ongoing and itergrated into day-to-day activities of the business. This process includes implementing the Company’s risk management framework, identifying issues and taking remedial action where required.
Set risk policy and monitor- The risk management function is primarily accountable for setting the Company’s risk management framework and policy, providing oversight and independent reporting. This function doesn’t have the business line responsibilities and provide an independent overview of the effectiveness of risk management by the first line of defence.
Validate - Provides an independent assessment of the adequacy and effectiveness of the overall risk management framework and risk governance structures, and reports to the Audit Committee.
Business Units Oversight Function
st Line of Defence
IndependentAssurance
1 nd Lineof Defence2 rd Line
of Defence3
Business / Divisional Heads“Risk Owners”
Board of Directors
IRMCCredit
CommitteeALCO Risk Mgt.
Division
Ultimate Risk Management oversight responsibility
Engage in risk assessments at regularly frequency Own management of risk treatments such as avoid, accept, transfer, mitigate and/ or exploit Report on risk exposure/actions in business area
Establish risk policies and tolerances Reviews and reports on significant risk exposures Controls risk functions and infrastructure
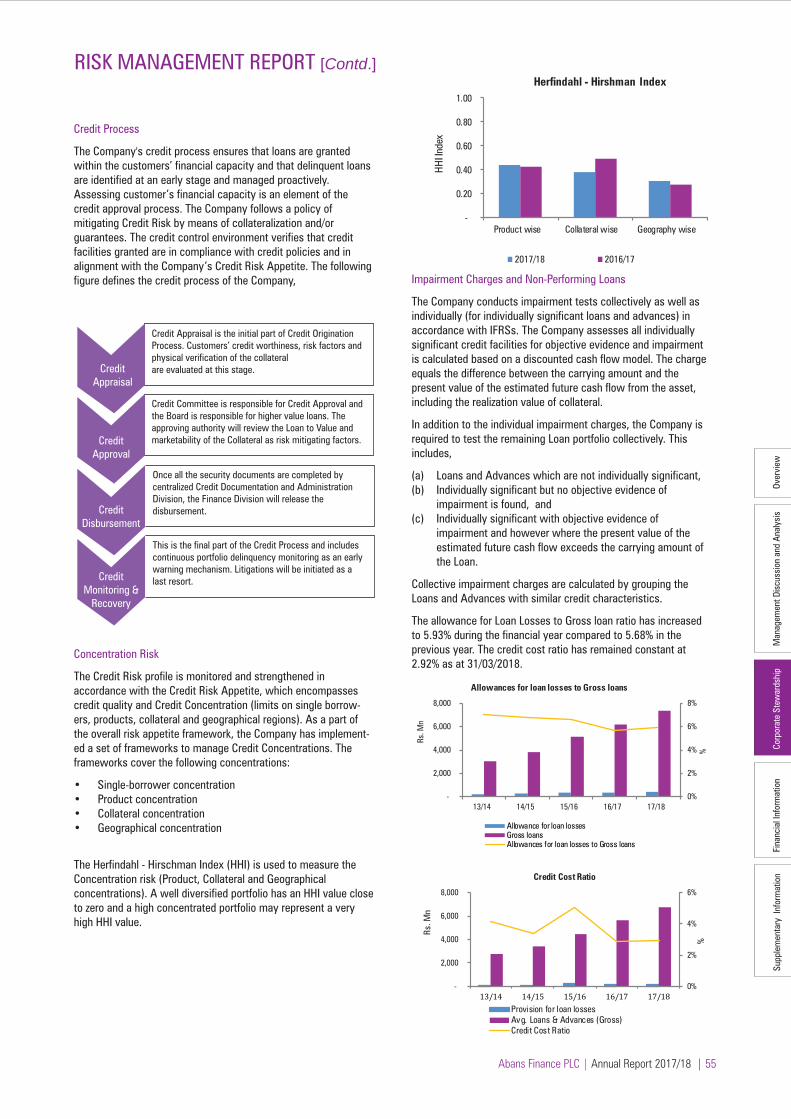
Over
view
Man
agem
ent D
iscu
ssio
n an
d An
alys
isCo
rpor
ate
Stew
ards
hip
Fina
ncia
l Inf
orm
atio
nSu
pple
men
tary
Inf
orm
atio
n
Abans Finance PLC | Annual Report 2017/18 | 55
RISK MANAGEMENT REPORT [Contd.]
Credit Process
The Company's credit process ensures that loans are granted within the customers’ financial capacity and that delinquent loans are identified at an early stage and managed proactively. Assessing customer’s financial capacity is an element of the credit approval process. The Company follows a policy of mitigating Credit Risk by means of collateralization and/or guarantees. The credit control environment verifies that credit facilities granted are in compliance with credit policies and in alignment with the Company’s Credit Risk Appetite. The following figure defines the credit process of the Company,
Concentration Risk
The Credit Risk profile is monitored and strengthened in accordance with the Credit Risk Appetite, which encompasses credit quality and Credit Concentration (limits on single borrow-ers, products, collateral and geographical regions). As a part of the overall risk appetite framework, the Company has implement-ed a set of frameworks to manage Credit Concentrations. The frameworks cover the following concentrations:
• Single-borrower concentration• Product concentration• Collateral concentration• Geographical concentration
The Herfindahl - Hirschman Index (HHI) is used to measure the Concentration risk (Product, Collateral and Geographical concentrations). A well diversified portfolio has an HHI value close to zero and a high concentrated portfolio may represent a very high HHI value.
Credit Appraisal is the initial part of Credit Origination Process. Customers’ credit worthiness, risk factors and physical verification of the collateralare evaluated at this stage.
Credit Committee is responsible for Credit Approval and the Board is responsible for higher value loans. The approving authority will review the Loan to Value and marketability of the Collateral as risk mitigating factors.
Once all the security documents are completed by centralized Credit Documentation and Administration Division, the Finance Division will release the disbursement.
This is the final part of the Credit Process and includes continuous portfolio delinquency monitoring as an early warning mechanism. Litigations will be initiated as a last resort.
CreditAppraisal
CreditApproval
CreditDisbursement
CreditMonitoring &
Recovery
0%
2%
4%
6%
8%
-
2,000
4,000
6,000
8,000
13/14 14/15 15/16 16/17 17/18
%
Rs. M
n
Allowances for loan losses to Gross loans
Allowance for loan lossesGross loansAllowances for loan losses to Gross loans
0%
2%
4%
6%
-
2,000
4,000
6,000
8,000
13/14 14/15 15/16 16/17 17/18
%
Rs. M
n
Credit Cost Ratio
Provision for loan lossesAvg. Loans & Advances (Gross)Credit Cost Ratio
-
0.20
0.40
0.60
0.80
1.00
Product wise Collateral wise Geography wise
HHI I
ndex
Herfindahl - Hirshman Index
2017/18 2016/17
Impairment Charges and Non-Performing Loans
The Company conducts impairment tests collectively as well as individually (for individually significant loans and advances) in accordance with IFRSs. The Company assesses all individually significant credit facilities for objective evidence and impairment is calculated based on a discounted cash flow model. The charge equals the difference between the carrying amount and the present value of the estimated future cash flow from the asset, including the realization value of collateral.
In addition to the individual impairment charges, the Company is required to test the remaining Loan portfolio collectively. This includes, (a) Loans and Advances which are not individually significant, (b) Individually significant but no objective evidence of impairment is found, and (c) Individually significant with objective evidence of impairment and however where the present value of the estimated future cash flow exceeds the carrying amount of the Loan.
Collective impairment charges are calculated by grouping the Loans and Advances with similar credit characteristics.
The allowance for Loan Losses to Gross loan ratio has increased to 5.93% during the financial year compared to 5.68% in the previous year. The credit cost ratio has remained constant at 2.92% as at 31/03/2018.

Over
view
Man
agem
ent D
iscu
ssio
n an
d An
alys
isCo
rpor
ate
Stew
ards
hip
Fina
ncia
l Inf
orm
atio
nSu
pple
men
tary
Inf
orm
atio
n
Abans Finance PLC | Annual Report 2017/18 | 56
RISK MANAGEMENT REPORT [Contd.]
Stress Testing for Credit Risk
The Company conducts a regular stress test to assess the impact to Capital Adequacy Ratio (Core Capital Ratio) due to increase in impairment charges with identified stress scenarios, in order to ensure that the Company operates with adequate capital. Stress tests were carried out by the company to gauge the potential impact of the following hypothetical stress scenarios,
Increase in Allowance for Loan Losses to Gross loans Ratio
Capital Adequacy Ratio (Core) as at 31.03.2018 - 21.00%
Scenario Magnitude of Shock Adjusted the Shock Capital Adequacy Ratio (Core)
1 1% 20.65% 2 2% 19.84% 3 3% 19.01%
Allowance for Loan Losses to Gross Loans Ratio as at 31/03/2018 is 5.93%
Top 20 customers falling into delinquent category
Capital Adequacy Ratio (Core) as at 31.03.2018 - 21.00%
Scenario Magnitude of Shock Adjusted the Shock Capital Adequacy Ratio (Core) 1 Top 5 12.60% 2 Top 10 9.64% 3 Top 20 6.24%
LIQUIDITY RISK
Liquidity risk is the risk that the Company is unable to meet its financial obligations in a timely manner at reasonable prices. Financial obligations include liabilities to depositors, payments due to suppliers, settlement of borrowings and lending and investment commitments. An effective liquidity risk management is crucial to maintain the confidence of depositors and counterparties, manage the funding cost and to enable the core businesses to continue the generation of revenue even under adverse circumstances.
The objective of liquidity risk management is to ensure that sufficient funding is available at all times irrespective of cyclical fluctuations in the market. The company analyzes periodical liquidity requirements with the assistance of the ALCO in order to ensure satisfactory liquidity status at all times. The ALCO uses the Statutory Liquid Asset Ratio, Net Loans to Total Assets Ratio, Deposit Renewal Ratio and Funding Mix to evaluate the liquidity position on a regular basis. ALCO also considers the Funding / Deposits concentration risk on a regular basis. During the year under review, the Company maintained a pool of high liquid, unencumbered assets that can be readily sold or pledged to secure any borrowings.
70%
75%
80%
85%
-
2,000
4,000
6,000
8,000
10,000
Mar-17 June-17 Sep-17 Dec-17 Mar-18
%Rs. M
n
Net Loans to Total Assets Ratio
Net Loans Total Assets Net Loans to Asset Ratio
0%
10%
20%
30%
-
500
1,000
1,500
2,000
Mar-17 Jun-17 Sep-17 Dec-17 Mar-18
%
Rs. M
n
Liquid Assets
Liquid Assets Liquid Asset Ratio
0%
20%
40%
60%
80%
100%
%
Deposit Renewal Ratio
2.60%
78.74%
18.66%
Funding Mix - 2017/18
Funding Mix
Due to Banks
Due to Customers
Equity
3.06%
79.58%
17.35%
Funding Mix - 2016/17
Due to Banks
Due to Customers
Equity

Over
view
Man
agem
ent D
iscu
ssio
n an
d An
alys
isCo
rpor
ate
Stew
ards
hip
Fina
ncia
l Inf
orm
atio
nSu
pple
men
tary
Inf
orm
atio
n
Abans Finance PLC | Annual Report 2017/18 | 57
RISK MANAGEMENT REPORT [Contd.]
Unexpected fall in Deposit Base
Statutory Liquid Asset Ratio (AFPLC) - 23.32%
Scenario Magnitude of the Stress Adjusted Stress Adjusted Shock (Fall in Deposit Liquid Asset Ratio Liquid Asset Base by) Ratio with Contingent Funds
1 5.0% 18.97% 22.14% 2 7.5% 16.77% 20.04% 3 10.0% 14.46% 17.82%
Unexpected fall in the Deposit Renewal Ratio (over next 3 months)
Statutory Liquid Asset Ratio (AFPLC) - 23.32%
Scenario Magnitude of the Stress Adjusted Stress Adjusted Shock (Fall in Liquid Asset Ratio Liquid Asset Renewal Ratio by) Ratio with Contingent Funds %
1 75% 17.99% 21.21% 2 50% 12.26% 15.71% 3 25% 5.66% 9.38%
MARKET RISK
Market risk refers to the risk to an institution resulting from movements in market prices, in particular, changes in interest rates, foreign exchange rates, equity and commodity prices. The company is exposed to Market risk that may arise as a result of values of assets and liabilities or revenues being adversely affected by changes in market conditions. This includes interest rates, equity prices and commodity prices (vehicle / collateral prices).
Interest Rate Risk
Interest rate risk management in finance business has assumed such importance during the last decades in relation to the interest rate volatility. Interest rate risk is the risk that changes in market rates which will adversely affect the financial institution's net worth and earnings. The Company’s major line of business is the financial intermediation function and the impact of interest rate risk is mainly on interest earnings.
The Asset and Liability Committee (ALCO) monitors and reviews the Company’s net interest income that ultimately affects the performance in financial terms. For the purpose of proper mitigation of risks in this area, ALCO takes into account the proper maintenance of the interest spread and net interest margin for the Company, principally through minimizing of gaps between rate sensitive assets and rate sensitive liabilities.
The change in interest rates in the market place from time to time requires the Company to assess its assets and liabilities portfolio with particular attention in re-pricing the both. In order to ensure that the interest spread and net interest margin are maintained, ALCO conducts monthly reviews and re-prices the assets and liabilities, where necessary.
(1,000)
-
1,000
2,000
3,000
4,000
< 3Months
3-12Months
1-3 Years 3-5 Years > 5 Years
Rs. M
n
Maturity Gap as at 31.03.2018
Total Assets Total Liabilities
Maturity Gap Cumulative Gap
(1,000)
-
1,000
2,000
3,000
< 3 Months 3-12Months
1-3 Years 3-5 Years > 5 Years
Rs. M
n
Maturity Gap as at 31.03.2017
Total Assets Total Liabilities
Maturity Gap Cumulative Gap
Contingency Funding Plan
The Company maintains a Contingency Funding Plan (CFP) that specifies the approach for analyzing and responding to actual and potential liquidity requirements. The CFP outlines an appropriate governance structure for the management and monitoring of liquidity events (company specific triggers as well as systemic triggers), processes for effective internal and external communication, Severity Levels and Reponses including identification of potential counter measures to be considered at various stages of an event.
Integrated Risk Management Committee and the Board of Directors continuously review the liquidity position of the Company and contingency funding sources. Liquidity Gap
The company assesses on a continuous basis the vulnerability of liquidity and solvency related issues that arise mainly due to mismatches in its assets and liabilities. ALCO monitors the Maturity Gap Statement on a monthly basis to reduce the mis-matches as much as possible in each of the time frames. Maturity Gap represents the ratio of assets to liabilities maturing or having a scheduled amortization in a given time frame. This Gap represents the estimated cash flows of the month end Financial Position.
Stress Testing for Liquidity Risk
Liquidity stress testing is one of the key tools for measuring liquidity risk and evaluating the Company’s short-term liquidity position. We use stress testing to evaluate the impact of sudden and severe stress events on our liquidity position. This helps ALCO to assess and determine the buffers against potential liquidity shocks. Stress testing were carried out by the company to determine the potential impact of the following hypothetical stress scenarios,

Over
view
Man
agem
ent D
iscu
ssio
n an
d An
alys
isCo
rpor
ate
Stew
ards
hip
Fina
ncia
l Inf
orm
atio
nSu
pple
men
tary
Inf
orm
atio
n
Abans Finance PLC | Annual Report 2017/18 | 58
RISK MANAGEMENT REPORT [Contd.]
OPERATIONAL RISK
Operational risk is the risk of loss, whether direct or indirect, to which the Company is exposed due to inadequate or failed internal processes or systems, human error, or external events. Operational risk includes legal and regulatory risk, business process and change risk, fiduciary or disclosure breaches, technology failure, financial crime and environmental risk. It exists in some form in every Company’s business and function. Operational risk cannot only result in financial loss, but also regulatory sanctions and damage to the Company’s reputation. The Company is very successful in managing operational risk with the view to safeguarding client assets and preserving shareholder value.
The Company has developed policies, processes and assessment methodologies to ensure that operational risk is appropriately identified and managed with effective controls. The governing principles include the three lines of defence model which helps to ensure proper accountability and clearly define the roles and responsibilities for operational risk management. The individual business units are accountable for management and control of the significant operational risks to which they are exposed.
The Company has a governance and organizational structure through which operational risk is managed. As pre-requisite to management of Operational Risk the Company defined the areas of responsibility for key management including segregation of duties between key functions. The system has as its priorities to find out errors/frauds or other aspects on mismanagement, to prevent errors or frauds or other related aspects, monitoring of operational procedures, assisting in resolving issues for the purpose of control, guiding human resources in the execution of businesses and providing a favourable business environment with good governance. Further, an independent Internal Audit Division is responsible for verification of significant risks are identified
and assessed, and for testing controls to ensure that overall risk is at an acceptable level. The Internal Audit Division is also responsible for auditing and assessing the Company’s operational risk management framework and its design and effectiveness.
STRATEGIC RISK
Strategic risk is the risk that the Company’s business strategies are ineffective, being poorly executed, or insufficiently resilient to changes in the business environment. The Board of Directors is ultimately responsible for oversight of strategic risk, by adopting a strategic planning process and approving, on a regular basis. The Key Management Team meets regularly to evaluate the effectiveness of the Company’s strategic plan, and consider amendments, if any, are required and recommends to the Board for final approval. The Company’s three year strategic plan is in the final stage and it describes the overall business plan for the next three years with clearly defined risk limits.
REPUTATIONAL RISK
Reputational risk is the risk of negative publicity about the Company’s conduct, business practices, whether true or not, will adversely affect its revenue, operations or customer base, or require costly litigation or other defensive measures. Negative publicity about Company’s practices may involve any aspect of its operations, but usually relates to questions of business ethics and integrity, or quality of products and services. Reputational risk is managed and controlled throughout the Company by codes of conduct, governance practices and risk management programs, policies, procedures and training. All Directors, Officers and employees have a responsibility to conduct their activities in accordance with the guidelines for business conduct, and in a manner that minimizes reputational risk.
(1,000)
-
1,000
2,000
3,000
4,000
< 3Months
3-12Months
1-3 Years 3-5 Years > 5 Years
Rs. M
n
Reprising Gap - 2017/18
Rate Sensitive AssetsRate Sensitive LiabilitiesReprising Gap
(1,000)
-
1,000
2,000
3,000
< 3Months
3-12Months
1-3 Years 3-5 Years > 5 Years
Rs. M
n
Reprising Gap - 2016/17
Rate Sensitive AssetsRate Sensitive LiabilitiesReprising Gap

Over
view
Man
agem
ent D
iscu
ssio
n an
d An
alys
isCo
rpor
ate
Stew
ards
hip
Fina
ncia
l Inf
orm
atio
nSu
pple
men
tary
Inf
orm
atio
n
Abans Finance PLC | Annual Report 2017/18 | 59
REPORT OF THE BOARD OF DIRECTORSGENERAL
The Directors of Abans Finance PLC are pleased to present to the shareholders the report of the Directors together with the Audited Financial Statements for the year ended 31 March 2018 and the Independent Auditor’s Report on those Financial Statements in conformity with the requirements of the Companies Act No. 7 of 2007 and the Finance Business Act No. 42 of 2011 and the directions issued there under.
The Company was incorporated as a Public Company in terms of the Companies Act No. 17 of 1982 and was subsequently re-registered as per the requirements of the Companies Act No. 7 of 2007 on 15 June 2009. The Company registration No. is PB-1015-PQ. The Ordinary Shares of the Company are listed on the Colombo Stock Exchange. The Registered Office is at No. 498, Galle Road, Colombo 03 and the Head Office/ principal place of business is located at No. 456, R. A. De Mel Mawatha, Colombo 03.
PRINCIPAL ACTIVITIES
The principal business activity of the Company is the conduct of finance business as defined in the Finance Business Act No. 42 of 2011 and includes the acceptance of Deposits, granting Finance Leasing, Hire Purchase, Mortgage Loans, Personal Loans & Real Estate and Capital Market Operations.
REVIEW OF PERFORMANCE FOR 2017/2018
The Chairman’s Message, Chief Executive Officer’s Review along with the Management Discussion and Analysis highlight the financial performance, financial position and the state of affairs of the Company during the year under review.
FINANCIAL STATEMENTS
The Financial Statements are prepared in accordance with the Sri Lanka Accounting Standards (SLFRSs). The Financial Statements are duly certified by the Chief Financial Officer, recommended by the Audit Committee for the approval by the Board of Directors and approved by the Board of Directors and signed on behalf of the Board by the Chairman and Managing Director in accordance with the Companies Act No. 7 of 2007.
DIRECTORS’ RESPONSIBILITY FOR FINANCIAL REPORTING
The Statement of the Directors’ Responsibilities for Financial Statements is given on page 64.
INDEPENDENT AUDITOR’S REPORT
The Company’s External Auditors M/s. Ernst & Young performed the audit of the Financial Statements for the year ended 31 March 2018 and their report as required by Section 168 (1)(c) of the Companies Act is provided together with the Audited Financial Statements.
SIGNIFICANT ACCOUNTING POLICIES AND CHANGES DURING THE YEAR
The significant accounting policies adopted in the preparation of the Financial Statements are given in the Audited Financial
GOING CONCERN
The Board of Directors has reasonable expectation that the Company has adequate resources to continue the business activities in the foreseeable future. Therefore, the Company has adopted a “Going Concern” basis in preparing its Financial Statements.
ACCOUNTING PERIOD
The financial reporting period reflects the information from 01 April 2017 to 31 March 2018.
FINANCIAL PERFORMANCE
The Company’s Profit before Taxation amounted to Rs. 132,949,426/- (after deducting Value Added Tax on Financial Services of Rs. 58,654,511/-) in comparison to Rs. 197,406,328/ - in 2016/17. After deducting Rs.38,085,738/- (Rs. 63,842,188/- in 2016/17) for Taxation, the Profit after Tax for the year amounted to Rs. 94,863,688 /-(Rs.133, 564,140/-in2016/17).This represents net profit dropped by 32% compared to the previous financial year. Details are given in the Statement of Comprehensive Income on page 71 of the Financial Statements.
PROFIT APPROPRIATIONS
A summary of the financial results of the Company for the years ended 31 March 2017 and 31 March 2018 are given below;
Description 2017/18 (Rs) 2016/17 (Rs)
Profit before Taxation from Operations 132,949,426 197,406,328 Provision for Income Tax (38,085,738) (63,842,188) Profit for the Year 94,863,688 133,564,140
Transfer to Statutory Reserve Fund (18,972,738) (26,712,829) Retained Profit Brought Forward From the Previous Year 276,925,848 169,597,476
Direct Cost on Right Issue (631,142) (785,447)
Direct Cost on Private Placement - (1,279,995) Dividend Paid (13,312,315) -
Other Comprehensive Income Net of Tax (897,936) 2,542,503 Retained Earnings Carried Forward 337,975,406 276,925,848
TOTAL OPERATING INCOME
The Total Operating Income of the Company for 2017/18 was Rs. 960,525,877/- compared to Rs. 912,119,367/- in 2016/17. An analysis of the Income is given on page 71 of the Financial Statements.

Abans Finance PLC | Annual Report 2017/18 | 60
Over
view
Man
agem
ent D
iscu
ssio
n an
d An
alys
isCo
rpor
ate
Stew
ards
hip
Fina
ncia
l Inf
orm
atio
nSu
pple
men
tary
Inf
orm
atio
n
REPORT OF THE BOARD OF DIRECTORS [Contd.]
EQUITY AND RESERVES
The stated capital and reserves were Rs.1,567,627,928/- as at 31 March 2018 (Rs.1,210,265,757/- as at 31 March 2017). The Equity and Reserves of the Company as at the end of each of the following years were follows;
Description 2017/18 (Rs) 2016/17 (Rs)
Stated Capital * 1,121,412,955 844,073,080 Statutory Reserve 108,239,567 89,266,829 Retained Earnings 337,975,406 276,925,848 Total Shareholders’ Funds 1,567,627,928 1,210,265,757
* The movement in the Stated Capital during the Financial Year under review is as follows;
Description Stated Capital (Rs)
As at the beginning of the year (01 April 2017) 844,073,080
Rights Issue of Shares (Listed in May 2017) 277,339,875
As at the end of the Year (31 March 2018) 1,121,412,955
ISSUE OF ORDINARY SHARES DURING THE FINANCIAL YEAR
(a) Issue of Shares by way of Rights Issue
The Company issued 11,093,595 ordinary shares by way of a Rights Issue in the proportion of One (01) Ordinary Share for every Five (05) Ordinary Shares held in the capital of the Company at a consideration of Rupees Twenty Five (Rs.25/-) per share amounting to a total consideration of Rupees Two Hundred and Seventy Seven Million Three Hundred and Thirty Nine Thousand Eight Hundred and Seventy Five (Rs. 277,339,875/-). The Ordinary Resolution pertaining to the above issue was approved by the shareholders at an Extraordinary General Meeting held on 05 April 2017 and the allotment for cash considerations was completed on 09 May 2017 (listed on 23 May 2017). The status of the utilization of the proceeds as at 31 March 2018 is as follows,
Continuous Disclosure regarding status of utilization of funds raised via Rights Issue (Listed on May 2017)Rights Issue proceeds utilization as at 31 March 2018
Objective Amount Proposed Amount Percentage Amount Percentage Clarification as per allocated as date of allocated of total utilized Utilized if funds are Circular per utilization from proceeds Rs. against not fully Circular in as per proceeds in (B) allocation utilized Rs. Circular Rs. (B/A) including where the funds are invested
To expand the lending activities of the Company 275,839,875 1st & 2nd 276,708,733 99.77% 276,708,733 100% - Quarter 2017/18
Expences relating to the rights issue 1,500,000 1st Quarter 631,142 0.23% 631,142 100% - 2017/18
277,339,875 - 277,339,875 100% 277,339,875 - -

Over
view
Man
agem
ent D
iscu
ssio
n an
d An
alys
isCo
rpor
ate
Stew
ards
hip
Fina
ncia
l Inf
orm
atio
nSu
pple
men
tary
Inf
orm
atio
n
Abans Finance PLC | Annual Report 2017/18 | 61
(b) Issue of Shares by way of Private Placement
The Special Resolution pertaining to the issue of 11,067,978 Ordinary Shares by way of a Private Placement to Ironwood Investment Holding (Private) Limited at a consideration of Rupees Twenty Five (Rs.25/-) per share amounting to a total consideration of Rupees Two Hundred and Seventy Six Million Six Hundred and Ninety Nine Thousand and Four Hundred and
Fifty (Rs. 276,699,450/-), was approved by the shareholders at an Extraordinary General Meeting held on 30 September 2016 and the allotment of shares to Ironwood Investment Holding (Private) Limited for cash consideration was completed during the financial year under review. The status of the utilisation of the proceeds as at 31 March 2017 is as follows,
PROPERTY, PLANT AND EQUIPMENT
Capital Expenditure incurred on Property, Plant and Equipment amounted to Rs. 27,690,516/- in 2017/18 (Rs. 26,179,254/- in 2016/17). Details applicable to Capital Expenditure are given in Note 27 to the Financial Statements.
BOARD OF DIRECTORS
In terms of the Articles of Association of the Company, the Board of Directors, as at 31 March 2018 consisted of five Directors including the Chairman and the Managing Director. The list of Directors who held office as at the end of the financial year is as follows.
Name of the Director Independent/ Executive/ Non-Independent Non-Executive
Mr. R. Pestonjee Non-Independent Non-Executive Mr. V.K. Choksy Independent Non-Executive Mr. Mayank Parekh (Alternate Director - Mr. C. H. A. W. Wickramasuriya) Non-Independent Non-Executive Mr. Ajith S. Ratnayake Independent Non-Executive Mr. K. B. Wanigasekara (Retired w.e.f.27/09/2017) Non-Independent Executive Mr. R. A. Nanayakkara (Appointed w.e.f.27/09/2017) Non-Independent Executive
RE – ELECTION OF DIRECTORS
All Directors nominated for re-election have submitted declarations and affidavits in terms of the Finance Companies (Assessment of Fitness and Propriety of Directors and Officers Performing Executive Functions) Direction No.3 of 2011 issued by the Central Bank of Sri Lanka.
In terms of section A.8 of the Code of Best Practice on Corporate Governance 2013, Mr. Rusi Pestonjee will retire at the Annual General Meeting and being eligible offer himself for re-election with the unanimous support of the other Directors.
RESIGNATION AND APPOINTMENT OF DIRECTORS
Mr. Kithsiri Wanigasekara relinquished office as the Managing Director of the Company and resigned from the Board at the Annual General Meeting held on 27 September 2017. The resolution pertaining to the appointment of Mr. Roshan Nanayakkara was approved by the Shareholders at the same Annual General Meeting. Accordingly, Mr. Roshan Nanayakkara has assumed duties as the Managing Director / Chief Executive Officer with effect from 27 September 2017.
MEETINGS OF THE BOARD OF DIRECTORS AND BOARD SUB COMMITTEES
Details of Directors’ meetings and Board Sub Committee meetings are given in the Corporate Governance Report.
BOARD SUB COMMITTEES
There are Five permanent committees of the Board, namely, Audit Committee, Related Party Transactions Review Committee, Integrated Risk Management Committee, Remuneration Committee and Nomination Committee. The details of themembers are as follows;
REPORT OF THE BOARD OF DIRECTORS [Contd.]
Objective Amount Proposed Amount Percentage Amount Percentage Clarification as per allocated as date of allocated of total utilized Utilized if funds are Circular per utilization from proceeds Rs. against not fully Circular in as per proceeds in (B) allocation utilized Rs. Circular Rs. (B/A) including where the funds are invested
To expand the lending activities of the Company 246,669,450 3rd Quarter 246,699,450 89% 246,699,450 100% - 2016/17 Invest in IT Systems Remaining (Hardware & funds are Software) invested 30,000,000 3rd Quarter 30,000,000 11% 23,553,284 79% in Placements 2016/17 with Banks
276,699,450 276,699,450 100% 270,252,734
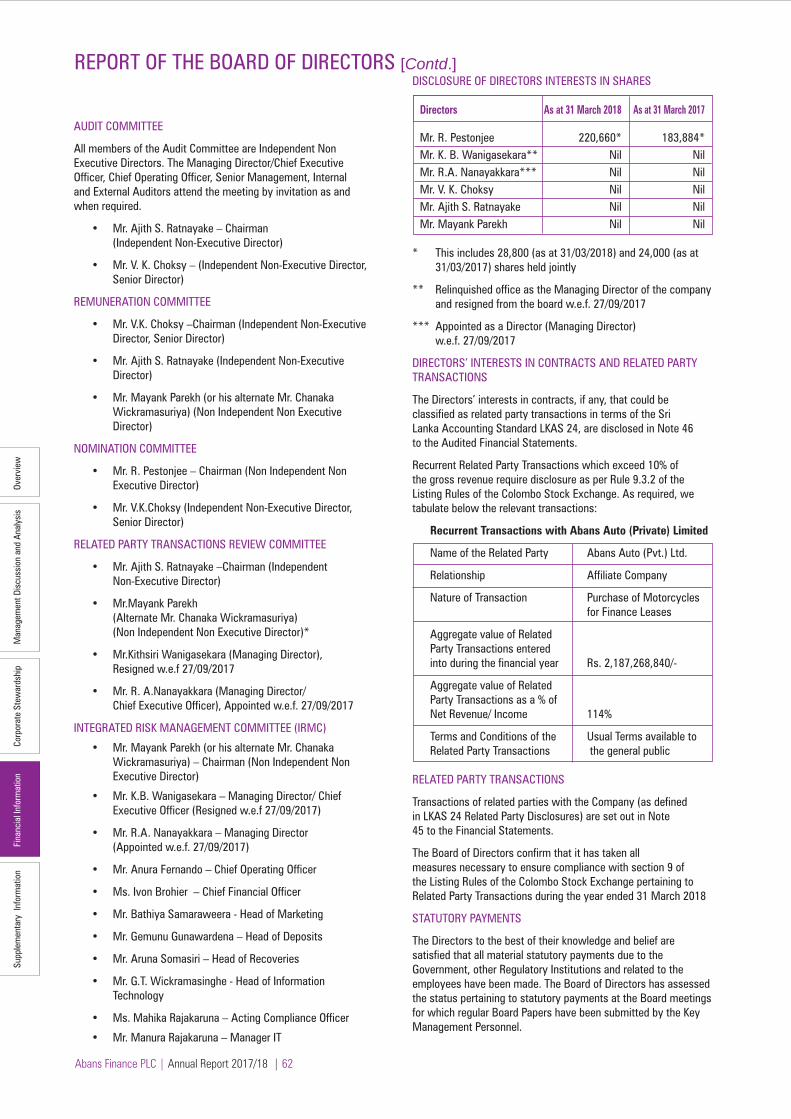
Over
view
Man
agem
ent D
iscu
ssio
n an
d An
alys
isCo
rpor
ate
Stew
ards
hip
Fina
ncia
l Inf
orm
atio
nSu
pple
men
tary
Inf
orm
atio
n
Abans Finance PLC | Annual Report 2017/18 | 62
AUDIT COMMITTEE
All members of the Audit Committee are Independent Non Executive Directors. The Managing Director/Chief Executive Officer, Chief Operating Officer, Senior Management, Internal and External Auditors attend the meeting by invitation as and when required.
• Mr. Ajith S. Ratnayake – Chairman (Independent Non-Executive Director) • Mr. V. K. Choksy – (Independent Non-Executive Director, Senior Director)
REMUNERATION COMMITTEE
• Mr. V.K. Choksy –Chairman (Independent Non-Executive Director, Senior Director)
• Mr. Ajith S. Ratnayake (Independent Non-Executive Director)
• Mr. Mayank Parekh (or his alternate Mr. Chanaka Wickramasuriya) (Non Independent Non Executive Director)
NOMINATION COMMITTEE
• Mr. R. Pestonjee – Chairman (Non Independent Non Executive Director)
• Mr. V.K.Choksy (Independent Non-Executive Director, Senior Director)
RELATED PARTY TRANSACTIONS REVIEW COMMITTEE
• Mr. Ajith S. Ratnayake –Chairman (Independent Non-Executive Director)
• Mr.Mayank Parekh (Alternate Mr. Chanaka Wickramasuriya) (Non Independent Non Executive Director)*
• Mr.Kithsiri Wanigasekara (Managing Director), Resigned w.e.f 27/09/2017
• Mr. R. A.Nanayakkara (Managing Director/ Chief Executive Officer), Appointed w.e.f. 27/09/2017
INTEGRATED RISK MANAGEMENT COMMITTEE (IRMC)
• Mr. Mayank Parekh (or his alternate Mr. Chanaka Wickramasuriya) – Chairman (Non Independent Non Executive Director)
• Mr. K.B. Wanigasekara – Managing Director/ Chief Executive Officer (Resigned w.e.f 27/09/2017)
• Mr. R.A. Nanayakkara – Managing Director (Appointed w.e.f. 27/09/2017)
• Mr. Anura Fernando – Chief Operating Officer
• Ms. Ivon Brohier – Chief Financial Officer
• Mr. Bathiya Samaraweera - Head of Marketing
• Mr. Gemunu Gunawardena – Head of Deposits
• Mr. Aruna Somasiri – Head of Recoveries
• Mr. G.T. Wickramasinghe - Head of Information Technology
• Ms. Mahika Rajakaruna – Acting Compliance Officer
• Mr. Manura Rajakaruna – Manager IT
DISCLOSURE OF DIRECTORS INTERESTS IN SHARES
Directors As at 31 March 2018 As at 31 March 2017
Mr. R. Pestonjee 220,660* 183,884* Mr. K. B. Wanigasekara** Nil Nil Mr. R.A. Nanayakkara*** Nil Nil Mr. V. K. Choksy Nil Nil Mr. Ajith S. Ratnayake Nil Nil Mr. Mayank Parekh Nil Nil
* This includes 28,800 (as at 31/03/2018) and 24,000 (as at 31/03/2017) shares held jointly
** Relinquished office as the Managing Director of the company and resigned from the board w.e.f. 27/09/2017
*** Appointed as a Director (Managing Director) w.e.f. 27/09/2017
DIRECTORS’ INTERESTS IN CONTRACTS AND RELATED PARTY TRANSACTIONS
The Directors’ interests in contracts, if any, that could be classified as related party transactions in terms of the Sri Lanka Accounting Standard LKAS 24, are disclosed in Note 46 to the Audited Financial Statements.
Recurrent Related Party Transactions which exceed 10% of the gross revenue require disclosure as per Rule 9.3.2 of the Listing Rules of the Colombo Stock Exchange. As required, we tabulate below the relevant transactions:
Recurrent Transactions with Abans Auto (Private) Limited
Name of the Related Party Abans Auto (Pvt.) Ltd.
Relationship Affiliate Company
Nature of Transaction Purchase of Motorcycles for Finance Leases
Aggregate value of Related Party Transactions entered into during the financial year Rs. 2,187,268,840/-
Aggregate value of Related Party Transactions as a % of Net Revenue/ Income 114%
Terms and Conditions of the Usual Terms available to Related Party Transactions the general public
RELATED PARTY TRANSACTIONS
Transactions of related parties with the Company (as defined in LKAS 24 Related Party Disclosures) are set out in Note 45 to the Financial Statements.
The Board of Directors confirm that it has taken all measures necessary to ensure compliance with section 9 of the Listing Rules of the Colombo Stock Exchange pertaining to Related Party Transactions during the year ended 31 March 2018
STATUTORY PAYMENTS
The Directors to the best of their knowledge and belief are satisfied that all material statutory payments due to the Government, other Regulatory Institutions and related to the employees have been made. The Board of Directors has assessed the status pertaining to statutory payments at the Board meetings for which regular Board Papers have been submitted by the Key Management Personnel.
REPORT OF THE BOARD OF DIRECTORS [Contd.]

Over
view
Man
agem
ent D
iscu
ssio
n an
d An
alys
isCo
rpor
ate
Stew
ards
hip
Fina
ncia
l Inf
orm
atio
nSu
pple
men
tary
Inf
orm
atio
n
Abans Finance PLC | Annual Report 2017/18 | 63
APPOINTMENT OF AUDITORS
The Company’s Auditors during the year under review were M/s. Ernst & Young, Chartered Accountants. The retiring auditors M/s. Ernst & Young have expressed their willingness to continue in office and a resolution to re-appoint them as Auditors and authorizing the Directors to fix their remuneration will be proposed at the Annual General Meeting. The Audit Committee has recommended the re-appointment of the Auditors.
SYSTEM OF INTERNAL CONTROL
The Board of Directors ensures that an effective and robust internal controls procedure is in place to safeguard the Company’s Assets. The Board appointed Audit Committee reviews the adequacy and the integrity of the internal control systems relating to compliance and risk management.
Further, the Board has issued a Statement on the Internal Controls for Financial Reporting and an Assurance Report from External Auditors in terms of the Finance Companies (Corporate Governance) Direction No. 3 of 2008 has also been obtained.
CORPORATE GOVERNANCE
The Board of Directors places heavy emphasis in maintaining an effective Corporate Governance frame work within the Company. The report on Corporate Governance covers the extent of compliance in Corporate Governance.
OUTSTANDING LITIGATION
The Directors are of the opinion that pending litigation against the Company will not have any material impact on the financial position of the Company.
EVENTS OCCURRING AFTER THE REPORTING PERIOD
No circumstances have arisen after the reporting period which require adjustments to or disclosures in the Financial Statements
NOTICE OF THE ANNUAL GENERAL MEETING
The Twelfth Annual General Meeting of the Company will be held at the Organization of Professional Associations of Sri Lanka, No. 275 /75, Professor Stanley Wijesundara Mawatha, Colombo 7 on Friday, 21 September 2018 at 9.30 am.
For and on behalf of the Board of Directors,
Varners International (Pvt.) Ltd.Corporate SecretariesLevel 14, West Tower, World Trade Centre, Echelon Square, Colombo 125 June 2018
REPORT OF THE BOARD OF DIRECTORS [Contd.]

Over
view
Man
agem
ent D
iscu
ssio
n an
d An
alys
isCo
rpor
ate
Stew
ards
hip
Fina
ncia
l Inf
orm
atio
nSu
pple
men
tary
Inf
orm
atio
n
Abans Finance PLC | Annual Report 2017/18 |64
DIRECTORS’ RESPONSIBILITY FOR FINANCIAL REPORTING
The responsibilities of the Directors of Abans Finance PLC in relation to the preparation of Financial Statements as at 31 March 2018 are set out in this Statement.
The Financial Statements comprise the Statement of Financial Position as at the end of the period, the Statement of Comprehen-sive Income for the period, the Statement of Changes in Equity for the period and the Statement of Cash Flows for the period and Notes comprising a Summary of Significant Accounting Policies and other Explanatory Information.
The Directors are responsible to oversee the preparation of Financial Statements with a view to ensure that the Financial Statements comply with the provisions of the Sri Lanka Account-ing and Auditing Standards Act No. 15 of 1995, and provide additional disclosures as required by the Companies Act No. 7 of 2007, the continuing listing requirements of the Colombo Stock Exchange and the Corporate Governance Code for Licensed Finance Companies issued by the Central Bank of Sri Lanka (CBSL)
The Directors are responsible for overseeing the preparation of Financial Statements with a view to ensure that the Company prepares Financial Statements which present fairly the financial position, financial performance and cash flows of the entity. The application of Sri Lanka Accounting Standards (SLFRSs & LKASs), with additional disclosure when necessary, is presumed to result in Financial Statements that achieve a fair presentation.
The Directors are required to oversee the preparation of Financial Statements with a view to ensure that all applicable Accounting Standards are followed as relevant in preparing the Financial Statements. This includes;
• Appropriate selection and application of accounting policies; and • Judgments and estimates being made on an appropriate basis.
The Directors are responsible for overseeing the keeping of books of accounts with a view to ensure that proper accounting records which appropriately record and explain the Company’s transac-tions are maintained.
SLFRSs require that the Company prepare Financial Statements on a going concern basis unless the management either intents to liquidate the entity or cease trading, or has no realistic alternative but to do so. The Directors have made an assessment and have concluded that the going concern basis is appropriate.
The Directors have overseen the maintenance of a system of internal control. The system of internal control comprise internal checks, internal audits and the whole system of financial and other controls required to carry on its business in an orderly manner, safeguard assets, prevent and detect fraud and other irregularities and secure as far as practicable accuracy and reliability of records. The details relating to the system of internal control are provided in the Statement of Internal Control, Report of the Integrated Risk Management Committee, Report of the Audit Committee and the Report of the Directors. The Directors obtained an Assurance Report from the External Auditors on the Statement of Internal Control.
The Board of Directors accepts responsibility for having monitored the process of preparation and presentation of the financial statements of the Company with a view to ensure integrity and objectivity of the Financial Statements presented in this Annual Report.
The Financial Statements of the Company have been certified by the Chief Financial Officer of the Company, the officer responsible for their preparation as required by the section 151 (2) (b) and they have also been signed by two Directors of the Company as required by the section 151 (1) (c) of the Companies Act.
The Directors, to the best of their knowledge and belief are satisfied that all statutory payments which were due and payable by the Company as at the date of the Statement of Financial Position have been paid or, where relevant, provided for.
The External Auditors, M/s Ernst & Young, Chartered Accountants were given access to all accounting records and other documents of the Company to carry out the audit as they considered appropriate to form their opinion on the Financial Statements.
Section 189 of the Companies Act No. 7 of 2007 states that a person exercising powers or performing duties as a Director of a company-
• Shall not act in a manner which is reckless or grossly negligent; and • Shall exercise the degree of skill and care that may reasonably be expected of a person of his knowledge and experience.
Section 190 (1) of the said Act states:
Subject to the provisions of subsection (2), a Director of a company may rely on reports, statements, and financial data and other information prepared or supplied, and on professional or expert advice given by any of the following persons:
- an employee of the company;
- a professional adviser or expert in relation to matters which the Director believes to be within the person’s professional or expert competence; Any other Director or committee of directors in which the director did not serve, in relation to matters within the Director’s or Committee’s designated authority.
Sub section (2) of that section states that provisions of subsec-tion (1) shall apply to a Director, if, and only if, the Director:
- Acts in good faith;
- Makes proper inquiry where the need for Inquiry is indicated by the circumstances; and
- Has no knowledge that such reliance is unwarranted.
The Directors of the Company are of the view that they have discharged their responsibilities accordingly, and as set out in this Statement.
By order of the board,
Varners International (Pvt.) Ltd.Corporate Secretaries,Level 14, West Tower, World Trade Centre,Echelon Square, Colombo 01.
25 June 2018

Over
view
Man
agem
ent D
iscu
ssio
n an
d An
alys
isCo
rpor
ate
Stew
ards
hip
Fina
ncia
l Inf
orm
atio
nSu
pple
men
tary
Inf
orm
atio
n
Abans Finance PLC | Annual Report 2017/18 | 65
DIRECTORS’ STATEMENT ON INTERNAL CONTROL OVER FINANCIAL REPORTING
The Board of Directors (“Board”) of Abans Finance PLC presents this report on Internal Control over Financial Reporting, in compliance with Section 10(2) (b) of Finance Companies Corporate Governance Direction No. 03 of 2008.
The Board of Directors (“Board”) is responsible for ensuring the adequacy and effectiveness of the internal control mechanism in place at Abans Finance PLC. (“Company”)
The Board has established an ongoing process for identifying, evaluating and managing the significant risks faced by the Company and this process includes the system of Internal Control over Financial Reporting. The process is regularly reviewed by the Board. The Board is of the view that the system of Internal Control over Financial Reporting in place, is sound and adequate to provide reasonable assurance regarding the reliability of Financial Reporting, and that the preparation of Financial Statements for external purpose is in accordance with relevant accounting principles and regulatory requirements.
Board’s policies and procedures pertaining to internal control over financial reporting, have been documented. The implementation of such policies and procedures is carried out with the assistance of the management. In assessing the Internal Control System over Financial Reporting, identified officers of the Company collated all procedures and controls that are connected with significant accounts and disclosures of the Financial Statements of the Company. These in turn are being observed and checked by the Internal Audit Department of the Company for suitability of design and effectiveness on an on-going basis.
KEY INTERNAL CONTROL PROCESSES
The key processes that have been established in reviewing the adequacy and integrity of the system of internal controls include the following:
• Establishment of various Committees of Board to assist the Board with a view of ensuring the effectiveness of the Company’s daily operations and such operations conform to Company’s corporate objectives, strategies and the annual budget as well as policies and business directions approved by the Board.
• The Internal Audit Division of the Company checks for compliance with policies and procedures and the effectiveness of the internal control systems and highlights significant findings in respect of any non- compliance. All Departments and Branches are subjected to audits, the frequency of which is determined by the level of risk assessed by the internal audit, to provide an independent and objective report on operational and management activities of these departments and branches. The Internal Audit Department submits the Annual Audit Plan for review and approval of the Audit Committee and the findings of the audits are submitted to the Board Audit Committee for review at their periodic meetings.
• The Board Audit Committee of the Company reviews internal control issues identified by the Internal Audit Department, the External Auditors, Regulatory Authorities and the Management; and evaluates the adequacy and effectiveness of the risk management and internal control systems. It also reviews the internal audit function with particular emphasis on the scope of audits and quality of the same. Further details of the activities undertaken by the Board Audit Committee of the Company are set out in the Board Audit Committee Report.
• In order to assess the internal control systems, all procedures and controls which are connected with significant accounts and disclosures of the Financial Statements of the Company are being continuously reviewed and updated by identified officers of the Company. The Internal Audit Department verifies the suitability of design and effectiveness of such procedures and controls, on an ongoing basis.
The comments made by External Auditors in connection with internal control system over financial reporting in previous years were reviewed during the year and appropriate steps have been taken to rectify them. Company will be adopting the new Sri Lanka Financial Reporting Standards, which will be effective from the year 2018. Processes applied to adopt the said accounting standards were identified during the year 2017 /2018 based on the feedback received from the external auditors, internal audit department, regulators and the Board Audit Committee and are in place in order to comply with recognition, classification, measurement and disclosure requirements of the new accounting standards. Continuous monitoring is in progress and steps are being taken to make improvements to the Processes where required, to enhance effectiveness and efficiency.
The Board has taken into consideration the requirements of the Sri Lanka Accounting Standard SLFRS - 9 (Financial Instruments) which is effective from 1st January 2018 by replacing the Sri Lanka Accounting Standard – LKAS 39 (Financial Instruments: Recognition and Measurement). This will have a significant impact on the calculation of impairment on financial instruments as it uses forward looking ‘expected credit loss model’ compared to the previously applied ‘incurred credit loss model’ under LKAS 39. The Company has obtained the services of an External Consultant for SLFRS 9 implementation. The Board will continu-ously strengthen the processes required for validation and compliance with SLFRS 9 with the support of the External Consultant.
CONFIRMATION
Based on the above processes, the Board confirms that the Financial Reporting System of the Company has been designed to provide reasonable assurance regarding the reliability of Financial Reporting and the preparation of Financial Statements for external purposes and has been done in accordance with Sri Lanka Accounting Standards.
EXTERNAL AUDITORS ASSURANCE REPORT
The external auditor, Messrs Ernst & Young, have reviewed the above Directors’ Statement on Internal Control for the year ended 31 March 2018 and reported to the Board that nothing has come to their attention that causes them to believe that the statement is inconsistent with their understanding of the process adopted by the Board in the review of the design and effectiveness of the internal control system of the Company.
By order of the Board,
Chairman Director
Chairman- Audit Committee25 June 2018
y
Chairman
Chairman- Audit Committee

Over
view
Man
agem
ent D
iscu
ssio
n an
d An
alys
isCo
rpor
ate
Stew
ards
hip
Fina
ncia
l Inf
orm
atio
nSu
pple
men
tary
Inf
orm
atio
n
Abans Finance PLC | Annual Report 2017/18 | 66
MANAGING DIRECTOR’S AND CHIEF FINANCIAL OFFICER’S RESPONSIBILITY FOR FINANCIAL REPORTING
The Financial Statements of Abans Finance PLC as at 31 March 2018, are prepared and presented in conformity with the requirements of the following:
- Sri Lanka Accounting Standards issued by the Institute of Chartered Accountants of Sri Lanka
- Companies Act No. 7 of 2007
- Sri Lanka Accounting and Auditing Standards Act No. 15 of 1995
- Finance Business Act No. 42 of 2011 and amendments thereto and Directions, Determinations and Guidelines issued by the Central Bank of Sri Lanka and effective for the financial year ended 31 March 2018
- Listing rules of the Colombo Stock Exchange
- Code of Best Practice on Corporate Governance issued jointly by the Institute of Chartered Accountants of Sri Lanka and the Securities and Exchange Commission of Sri Lanka.
The Formats used in the preparation of Financial Statements and disclosures made comply with the specified formats prescribed by the Central Bank of Sri Lanka.
The Significant Accounting Policies used in the preparation of the Financial Statements are appropriate and are consistently applied by the Company. There are no material departures from the prescribed accounting standards in there adoption. Comparative information has been amended wherever necessary to comply with the current presentation and material departures, if any, has been disclosed and explained.
Significant Accounting Policies and Estimates that involved a high degree of judgment and complexity were discussed with External Auditors and the Audit Committee. The Board of Directors and the management of the Company accept responsibility for the integrity and objectivity of these Financial Statements. These estimates and judgments relating to the Financial Statements were made on a prudent and reasonable basis; in order that the Financial Statements reflect a true and fair manner, the form and substance of transactions and that the Company’s state of affairs is reasonably presented. To ensure this, the Company has taken proper and sufficient care in installing a system of internal controls and accounting records, for safe guarding assets and for preventing and detecting frauds as well as other irregularities, which is reviewed, evaluated and updated on an ongoing basis. Our Internal Audit Division has conducted periodic audits to provide a reasonable assurance that the established policies and procedures of the Company were consistently followed. However, there are inherent limitations that should be recognized in weighing the assurances provided by any system of internal controls and accounting.
The Financial Statements of the Company were audited by M/s. Ernst & Young Chartered Accountants, the Independent External Auditors and their report is given on pages 67 to 70 to the Annual Report.
The Audit Committee of the Company met periodically with the Internal Audit team and the independent External Auditor to review their audit plans, assess the manner in which these auditors are performing their responsibilities and to discuss their reports on internal controls and financial reporting issues. Audit Committee also reviewed the quality of Accounting Policies and
their adherence to statutory and regulatory requirements, the details of which are given in the Board Audit Committee report on page 49 of this Annual Report. To ensure complete independence, the External Auditors and the Internal Auditor have full and free access to the members of the Audit Committee to discuss any matter of substance.
The Audit Committee approves the Audit and Non Audit Services provided by External Auditors, M/s Ernst & Young, in order to ensure that the provision of such services does not impair independence of the External Auditors.
We confirm to the best of our knowledge;
- The Company has complied with all applicable laws, regulations and prudential requirements and there is no material non – compliance
- There are no material litigations that are pending against the Company
- All taxes, duties, levies and all statutory payments of the Company and all contributions, levies and taxes paid on behalf of and in respect of the employees of the Company as at the Statement of Financial Position date have been paid off and where relevant provided for.
Ivon BrohierChief Financial Officer
Roshan NanayakkaraManaging Director/Chief Executive Officer
25 June 2018
h N kk
on Brohier

Over
view
Man
agem
ent D
iscu
ssio
n an
d An
alys
isCo
rpor
ate
Stew
ards
hip
Fina
ncia
l Inf
orm
atio
nSu
pple
men
tary
Inf
orm
atio
n
Abans Finance PLC | Annual Report 2017/18 | 67
Partners : W R H Fernando FCA FCMA M P D Cooray FCA FCMA R N de Saram ACA FCMA Ms. N A De Silva FCA Ms. Y A De Silva FCA W K B S P Fernando FCA FCMA Ms. K R M Fernando FCA ACMA Ms. L K H L Fonseka FCA A P A Gunasekera FCA FCMA A Herath FCA D K Hulangamuwa FCA FCMA LLB (Lond) H M A Jayesinghe FCA FCMA Ms. A A Ludowyke FCA FCMA Ms. G G S Manatunga FCA Ms. P V K N Sajeewani FCA N M Suliman ACA ACMA B E Wijesuriya FCA FCMA
Principal : T P M Ruberu FCMA FCCA
A member Firm of Ernst & Young Global Limited
INDEPENDENT AUDITORS’ REPORTTO THE SHAREHOLDERS OF ABANS FINANCE PLC
Report on the audit of the financial statements
Opinion
We have audited the financial statements of Abans Finance PLC (“the Company”), which comprise the statement of financial position as at 31 March 2018, and the statement of comprehensive income, statement of changes in equity and statement of cash flows for the year then ended, and notes to the financial statements, including a summary of significant accounting policies.
In our opinion, the accompanying financial statements gives a true and fair view of the financial position of the Company as at 31 March 2018, and of its financial performance and its cash flows for the year then ended in accordance with Sri Lanka Accounting Standards.
Basis for opinion
We conducted our audit in accordance with Sri Lanka Auditing Standards (SLAuSs). Our responsibilities under those standards are further described in the Auditor’s responsibilities for the audit of the financial statements section of our report. We are independent of the Company in accordance with the Code of Ethics issued by CA Sri Lanka (Code of Ethics) and we have fulfilled our other ethical responsibilities in accordance with the Code of Ethics. We believe that the audit evidence we have obtained is sufficient and appropriate to provide a basis for our opinion.
Key audit matters
Key audit matters are those matters that, in our professional judgment, were of most significance in the audit of the financial statements of the current period. These matters were addressed in the context of the audit of the financial statements as a whole, and in forming our opinion thereon, and we do not provide a separate opinion on these matters. For each matter below, our description of how our audit addressed the matter is provided in that context.
We have fulfilled the responsibilities described in the Auditor’s responsibilities for the audit of the financial statements section of our report, including in relation to these matters. Accordingly, our audit included the performance of procedures designed to respond to our assessment of the risks of material misstatement of the financial statements. The results of our audit procedures, including the procedures performed to address the matters below, provide the basis for our audit opinion on the accompanying financial statements.
Ernst & YounChartered Accountants201 De Saram PlaceP. O. Box 101Colombo 10Sri Lanka
Building a betterworking world
Tel : +94 11 2463500Fax Gen : +94 11 2697369 Tax : +94 11 [email protected]

Over
view
Man
agem
ent D
iscu
ssio
n an
d An
alys
isCo
rpor
ate
Stew
ards
hip
Fina
ncia
l Inf
orm
atio
nSu
pple
men
tary
Inf
orm
atio
n
Abans Finance PLC | Annual Report 2017/18 | 68
Building a betterworking world
Key Audit Matter
Allowance for impairment of loans & leases
As at 31 March 2018, loans & advances and receivables from lease & hire purchase (net of impairment) amounted to Rs. 2.43Bn and Rs. 4.49Bn respectively. These collectively contributed 77 % to the Company’s total assets.
The allowance for impairment (both specific and collective) of these financial assets is estimated by management. The estimation involves a complex calculation. Assumptions used by management in this calculation are inherently judgmental. Note 9.3 to the financial statements more fully describes the sensitivity of key assumptions.
We considered the estimation of allowance for impairment as a Key Audit Matter due to sensitivity of reported results (on financial performance) to this allowance and the inherent uncertainty involved in its estimation.
How our audit addressed the key audit matter
To assess the reasonableness of the allowance for impair-ment, our audit procedures (among others) included the following:
- We understood & evaluated the key internal controls over estimation of the allowance for impairment including those over identifying occurrence of loss events;
- We test - checked the underlying calculations and data used in such calculations on a sample basis;
- In addition to the above, focused procedures were performed as follows:
• Specific allowance for impairment:
For a sample of non – performing loans & leases, management’s forecasts of cash flows were test – checked to historical patterns of customer repayment. Among other procedures, forecast cash flows arising from collateral (or other source (s) of expected recovery) were verified to source documents;
• Collective allowance for impairment:
For loss rates used by management, we assessed the appropriateness of the loss emergence period including consistency with historical loss experience.
- We assessed the adequacy of the related financial statement disclosures as set out in note(s) 19 and 20

Over
view
Man
agem
ent D
iscu
ssio
n an
d An
alys
isCo
rpor
ate
Stew
ards
hip
Fina
ncia
l Inf
orm
atio
nSu
pple
men
tary
Inf
orm
atio
n
Abans Finance PLC | Annual Report 2017/18 | 69
Building a betterworking world
Other information included in the 2018 Annual Report
Other information consists of the information included in the Annual Report, other than the financial statements and our auditor’s report thereon. Management is responsible for the other information.
Our opinion on the financial statements does not cover the other information and we do not express any form of assurance conclusion thereon.
In connection with our audit of the financial statements, our responsibility is to read the other information and, in doing so, consider whether the other information is materially inconsistent with the financial statements or our knowledge obtained in the audit or otherwise appears to be materially misstated. If, based on the work we have performed, we conclude that there is a material misstatement of this other information, we are required to report that fact. We have nothing to report in this regard.
Responsibilities of management and those charged with governance for the Financial Statements
Management is responsible for the preparation of financial statements that give a true and fair view in accordance with Sri Lanka Accounting Standards, and for such internal control as management determines is necessary to enable the preparation of financial statements that are free from material misstatement, whether due to fraud or error.
In preparing the financial statements, management is responsible for assessing the company’s ability to continue as a going concern, disclosing, as applicable, matters related to going concern and using the going concern basis of accounting unless management either intends to liquidate the company or to cease operations, or has no realistic alternative but to do so.
Those charged with governance are responsible for overseeing the Company’s financial reporting process.
Auditor’s responsibilities for the audit of the financial statements
Our objectives are to obtain reasonable assurance about whether the financial statements as a whole are free from material misstatement, whether due to fraud or error, and to issue an auditor’s report that includes our opinion. Reasonable assurance is a high level of assurance, but is not a guarantee that an audit conducted in accordance with SLAuSs will always detect a material misstatement when it exists. Misstatements can arise from fraud or error and are considered material if, individually or in the aggregate, they could reasonably be expected to influence the economic decisions of users taken on the basis of these financial statements.
As part of an audit in accordance with SLAuSs, we exercise professional judgment and maintain professional skepticism throughout the audit. We also:
1. Identify and assess the risks of material misstatement of the financial statements, whether due to fraud or error, design and perform audit procedures responsive to those risks, and obtain audit evidence that is sufficient and appropriate to provide a basis for our opinion. The risk of not detecting a material misstatement resulting from fraud is higher than for one resulting from error, as fraud may involve collusion, forgery, intentional omissions, misrepresentations, or the override of internal control.
2. Obtain an understanding of internal control relevant to the audit in order to design audit procedures that are appropriate in the circumstances, but not for the purpose of expressing an opinion on the effectiveness of the Company’s internal controls.
3. Evaluate the appropriateness of accounting policies used and the reasonableness of accounting estimates and related disclosures made by management.
4. Conclude on the appropriateness of management’s use of the going concern basis of accounting and, based on the audit evidence obtained, whether a material uncertainty exists related to events or conditions that may cast significant doubt on the Company’s ability to continue as a going concern. If we conclude that a material uncertainty exists, we are required to draw attention in our auditor’s report to the related disclosures in the financial statements or, if such disclosures are inadequate, to modify our opinion. Our conclusions are based on the audit evidence obtained up to the date of our auditor’s report. However, future events or conditions may cause the Company to cease to continue as a going concern.
5. Evaluate the overall presentation, structure and content of the financial statements, including the disclosures, and whether the financial statements represent the underlying transactions and events in a manner that achieves fair presentation.

Over
view
Man
agem
ent D
iscu
ssio
n an
d An
alys
isCo
rpor
ate
Stew
ards
hip
Fina
ncia
l Inf
orm
atio
nSu
pple
men
tary
Inf
orm
atio
n
Abans Finance PLC | Annual Report 2017/18 | 70
Building a betterworking world
We communicate with those charged with governance regarding, among other matters, the planned scope and timing of the audit and significant audit findings, including any significant deficiencies in internal control that we identify during our audit.
We also provide those charged with governance with a statement that we have complied with ethical requirements in accordance with the Code of Ethics regarding independence, and to communicate with them all relationships and other matters that may reasonably be thought to bear on our independence, and where applicable, related safeguards.
From the matters communicated with those charged with governance, we determine those matters that were of most significance in the audit of the financial statements of the current period and are therefore the key audit matters. We describe these matters in our auditor’s report unless law or regulation precludes public disclosure about the matter or when, in extremely rare circumstances, we determine that a matter should not be communicated in our report because the adverse consequences of doing so would reasonably be expected to outweigh the public interest benefits of such communication.
Report on Other Legal and Regulatory Requirements
As required by section 163 (2) of the Companies Act No. 07 of 2007, we have obtained all the information and explanations that were required for the audit and, as far as appears from our examination, proper accounting records have been kept by the Company.
CA Sri Lanka membership number of the engagement partner responsible for signing this independent auditor’s report is 1864.
25 June 2018Colombo

Over
view
Man
agem
ent D
iscu
ssio
n an
d An
alys
isCo
rpor
ate
Stew
ards
hip
Fina
ncia
l Inf
orm
atio
nSu
pple
men
tary
Inf
orm
atio
n
STATEMENT OF COMPREHENSIVE INCOME
Abans Finance PLC | Annual Report 2017/18 | 71
Year ended 31 March 2018 Notes 2018 2017 Rs. Rs.
Income 5 1,917,670,594 1,620,506,380
Interest Income 5.1 1,711,585,707 1,494,673,696 Interest Expenses 5.2 (813,594,238) (623,639,761)
Net Interest Income 897,991,469 871,033,935 Fee and Commission Income 6.1 185,717,691 104,114,176 Fee and Commission Expenses 6.2 (143,550,479) (84,747,252)Net Fee and Commission Income 42,167,212 19,366,924 Net Gain/(loss) from Trading 7 1,676,964 948,394 Other Operating Income (net) 8 18,690,232 20,770,114 Total Operating Income 960,525,877 912,119,367 Impairment (Charges) / Reversal for loans and other losses Individual 9.1 (19,689,954) (21,441,585) Collective 9.2 (203,412,165) (167,927,808) Net Operating Income 737,423,758 722,749,974 Operating Expenses Personnel Costs 10 (256,394,681) (217,088,659)Depreciation & Amortization 11 (23,644,486) (18,660,549)Other Operating Expenses 12 (265,780,655) (234,275,675) Operating Profit before Value Added Tax on Financial Services 191,603,937 252,725,091 VAT & NBT on Financial Services (58,654,511) (55,318,763) Profit before Taxation from Operations 132,949,426 197,406,328 Provision for Income Taxation 13.1 (38,085,738) (63,842,188)
Profit for the Year 94,863,688 133,564,140 Other Comprehensive Income (OCI) Items that will not be reclassified to profit or loss
Actuarial Gains/(Losses) on Defined Benefit Plan 33.1 (1,247,133) 3,531,254 Deferred Tax effect of above 13.1 349,197 (988,751) (897,936) 2,542,503 Other Comprehensive Loss for the Year, Net of Tax (897,936) 2,542,503
Total Comprehensive Income for the Year 93,965,752 136,106,643
Earnings Per Share : Basic / Diluted (Rs.) 14 1.44 2.36
Accounting Policies and Notes from pages 75 to 126 form an integral part of these Financial Statements.
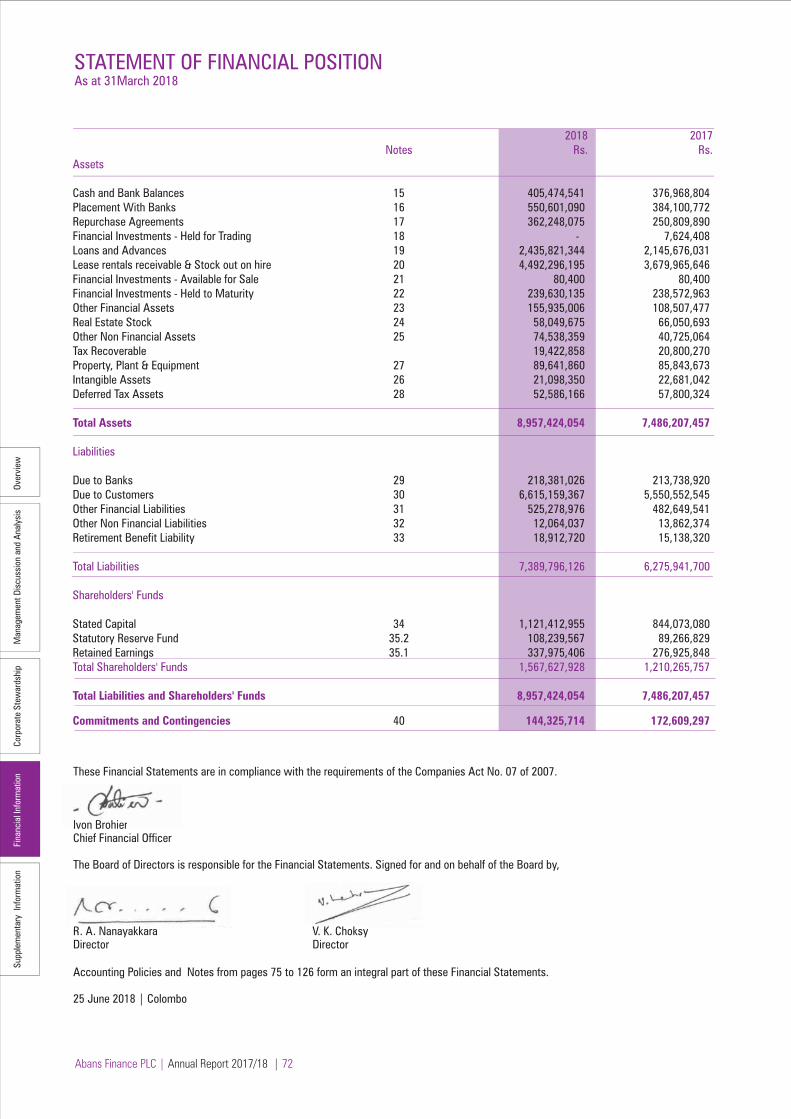
Over
view
Man
agem
ent D
iscu
ssio
n an
d An
alys
isCo
rpor
ate
Stew
ards
hip
Fina
ncia
l Inf
orm
atio
nSu
pple
men
tary
Inf
orm
atio
n
Abans Finance PLC | Annual Report 2017/18 | 72
STATEMENT OF FINANCIAL POSITIONAs at 31March 2018
These Financial Statements are in compliance with the requirements of the Companies Act No. 07 of 2007.
Ivon BrohierChief Financial Officer
The Board of Directors is responsible for the Financial Statements. Signed for and on behalf of the Board by,
R. A. Nanayakkara V. K. ChoksyDirector Director Accounting Policies and Notes from pages 75 to 126 form an integral part of these Financial Statements.
25 June 2018 | Colombo
2018 2017 Notes Rs. Rs.Assets Cash and Bank Balances 15 405,474,541 376,968,804 Placement With Banks 16 550,601,090 384,100,772 Repurchase Agreements 17 362,248,075 250,809,890 Financial Investments - Held for Trading 18 - 7,624,408 Loans and Advances 19 2,435,821,344 2,145,676,031 Lease rentals receivable & Stock out on hire 20 4,492,296,195 3,679,965,646 Financial Investments - Available for Sale 21 80,400 80,400 Financial Investments - Held to Maturity 22 239,630,135 238,572,963 Other Financial Assets 23 155,935,006 108,507,477 Real Estate Stock 24 58,049,675 66,050,693 Other Non Financial Assets 25 74,538,359 40,725,064 Tax Recoverable 19,422,858 20,800,270 Property, Plant & Equipment 27 89,641,860 85,843,673 Intangible Assets 26 21,098,350 22,681,042 Deferred Tax Assets 28 52,586,166 57,800,324
Total Assets 8,957,424,054 7,486,207,457
Liabilities Due to Banks 29 218,381,026 213,738,920 Due to Customers 30 6,615,159,367 5,550,552,545 Other Financial Liabilities 31 525,278,976 482,649,541 Other Non Financial Liabilities 32 12,064,037 13,862,374 Retirement Benefit Liability 33 18,912,720 15,138,320
Total Liabilities 7,389,796,126 6,275,941,700 Shareholders' Funds Stated Capital 34 1,121,412,955 844,073,080 Statutory Reserve Fund 35.2 108,239,567 89,266,829 Retained Earnings 35.1 337,975,406 276,925,848 Total Shareholders' Funds 1,567,627,928 1,210,265,757 Total Liabilities and Shareholders' Funds 8,957,424,054 7,486,207,457 Commitments and Contingencies 40 144,325,714 172,609,297
V K Ch k
R A N kk
Ivon Brohier

Over
view
Man
agem
ent D
iscu
ssio
n an
d An
alys
isCo
rpor
ate
Stew
ards
hip
Fina
ncia
l Inf
orm
atio
nSu
pple
men
tary
Inf
orm
atio
n
Abans Finance PLC | Annual Report 2017/18 | 73
STATEMENT OF CHANGES IN EQUITYYear ended 31March 2018
Stated Statutory Reserve on Retained Total Capital Reserve Available for Sale Earnings Financial Instruments Rs. Rs. Rs. Rs. Rs. (Note 34) (Note 35.2) (Note 35.1)
Balance as at 1 April 2016 382,373,630 62,554,000 - 169,597,476 614,525,106
Issue of Shares 461,699,450 - - - 461,699,450
Direct Cost on Right Issue - - - (785,447) (785,447) Direct Cost on Private Placement - - - (1,279,995) (1,279,995) Net profit for the year - - - 133,564,140 133,564,140 Other Comprehensive Income net of tax - - - 2,542,503 2,542,503 Transfer to Statutory Reserve - 26,712,829 - (26,712,829) - Balance as at 31 March 2017 844,073,080 89,266,829 - 276,925,848 1,210,265,757 Issue of Shares 277,339,875 - - - 277,339,875 Direct Cost on Right Issue - - - (631,142) (631,142) Dividend Paid - - - (13,312,315) (13,312,315) Net profit for the year - - - 94,863,688 94,863,688 Other Comprehensive Income net of tax - - - (897,936) (897,936) Transfer to Statutory Reserve - 18,972,738 - (18,972,738) - Balances as at 31 March 2018 1,121,412,955 108,239,567 - 337,975,406 1,567,627,928 Accounting Policies and Notes from pages 75 to 126 form an integral part of these Financial Statements.

Over
view
Man
agem
ent D
iscu
ssio
n an
d An
alys
isCo
rpor
ate
Stew
ards
hip
Fina
ncia
l Inf
orm
atio
nSu
pple
men
tary
Inf
orm
atio
n
Abans Finance PLC | Annual Report 2017/18 | 74
STATEMENT OF CASH FLOWSYear ended 31 March 2018
Notes 2018 2017Cash Flows From / (Used in) Operating Activities Rs. Rs. Profit before Income Tax Expense 132,949,426 197,406,328 Adjustments for Depreciation 27.2 20,670,196 16,146,846 Amortization of Intangible Assets 26 2,974,290 2,513,703 Impairment Provision 9 223,102,119 189,369,393 Diminution/(Appreciation) in Value of Investments 7 (1,561,557) (674,167) Loss/(Profit) from Sale of Investments 7 168,046 - Loss/(Profit) from Sale of Unit Trust 8 - (2,142,786) Loss/(Profit) on Disposal of Property & Equipment 8 (1,182,865) - Provision/(Reversal) for Defined Benefit Plans 10 5,667,867 4,466,536 Dividend Received (283,453) (274,227)
Operating Profit before Working Capital Changes 382,504,069 406,811,625
(Increase)/Decrease in Real Estate Stock 8,001,017 17,015,788 (Increase)/Decrease in Loans and Advances (342,668,574) (1,017,572,990) (Increase)/Decrease in Lease Rentals Receivable & Stock out on hire (845,544,301) (83,841,030) (Increase)/Decrease in Other Financial Assets (184,792,632) (163,503,724) (Increase)/Decrease in Other Non Financial Assets (33,813,296) 57,169,761 Increase/(Decrease) in Amounts Due to Customers 1,064,606,822 1,011,190,324 Increase/(Decrease) in Other Financial Liabilities 42,629,434 (354,375,970) Increase/(Decrease) in Other Non Financial Liabilities (1,798,337) 5,775,853
Cash Generated from Operations 89,124,202 (121,330,364)
Retirement Benefit Liabilities Paid 33 (3,140,600) (1,046,300) Taxes Paid (31,135,695) (138,357,828)
Net Cash From/(Used in) Operating Activities 54,847,906 (260,734,492) Cash Flows from / (Used in) Investing Activities Acquisition of Property, Plant & Equipment 27 (27,690,516) (26,179,254) Acquisition of Intangible Assets 26 (1,391,598) (9,585,849) Proceeds from Sales of Property , Plant & Equipment 4,391,000 - Acquisition of Financial Investment held - for - trading - (35,000) Proceeds from Sale of Financial investments held -for- trading 9,022,642 - Cash Flow from /(Used in) Fixed Deposits (300,874,398) (3,710) Sale/(Purchase) of Financial Investments- Held to Maturity (1,057,171) (216,903,150) Sale of Financial Investments- Unit Trust - 102,142,786 Purchase of Financial Investments- Unit Trust - (100,000,000) Dividend Received 283,453 274,227
Net Cash Flows from/(Used in) Investing Activities (317,316,588) (250,289,950)
Cash Flows from / (Used in) Financing Activities Net Cash Outflow from Securitized Borrowings and other bank facilities (91,666,666) (104,971,953) Cash Flow from Debt Instruments Issued and Other Borrowings 29.2 100,000,000 250,000,000 Net Cash Flow from Issue of Shares 276,708,733 459,634,008 Dividend Paid (13,312,315) -
Net Cash Flows from/(Used in) Financing Activities 271,729,752 604,662,054 Net Increase in Cash and Cash Equivalents 9,261,070 93,637,612 Cash and Cash Equivalents at the beginning of the year 999,476,642 905,839,030
Cash and Cash Equivalents at the end of the year 15.1 1,008,737,712 999,476,642 Accounting Policies and Notes from pages 75 to 126 form an integral part of these Financial Statements.

Over
view
Man
agem
ent D
iscu
ssio
n an
d An
alys
isCo
rpor
ate
Stew
ards
hip
Fina
ncia
l Inf
orm
atio
nSu
pple
men
tary
Inf
orm
atio
n
Abans Finance PLC | Annual Report 2017/18 | 75
NOTES TO THE FINANCIAL STATEMENTSYear ended 31 March 2018
1. CORPORATE INFORMATION
1.1 General
Abans Finance PLC is a domiciled, public limited liability company incorporated in Sri Lanka on 08 April 2005 under the Companies Act No. 17 of 1982, The Company was reregistered under the Companies Act No.7 of 2007 on 15 June 2009.It is a Licensed Finance Company registered under the Finance Business Act No.42 of 2011.The Company was listed on the Colombo Stock Exchange in 2011.
The registered office of the Company is located at No. 498, Galle Road, Colombo 03 and the principal place of business is situated at No. 456, R.A. De Mel Mawatha, Colombo 03.
1.2 Principal Activities and Nature of Operations
The Company provides a comprehensive range of financial services encompassing Acceptance of Fixed Deposits, Maintenance of saving Deposits, Providing Finance Leases, Hire Purchase, Mortgage Loans, Personal Loans and Other Credit Facilities. The Company also deals in Real Eestate and Real Estate related Services.
1.3 Parent Enterprise and Ultimate Parent Enterprise
The Company’s parent company is Abans PLC and the ultimate parent company is Abans International (Pvt) Limited which are incorporated in Sri Lanka.
1.4 Date of Authorization for Issue
The Financial Statements of Abans Finance PLC for the year ended 31 March 2018 was authorized for issue in accordance with a resolution of the Board of Directors on 25 June 2018.
1.5 Directors' Responsibility Statement
The Board of Directors is responsible for the preparation and presentation of these Financial Statements as per the provisions of the Companies Act No.07 of 2007 and the Sri Lanka Accounting Standards comprising LKASs and SLFRSs (hereafter “SLFRS”).
2. BASIS OF PREPARATION
2.1 Statement of Compliance
The Financial Statements of the Company (Statement of Financial Position and Statement of Comprehensive Income, Statement of Changes in Equity, Statement of Cash Flows together with Accounting Policies and Notes) as at 31 March 2018 are prepared in accordance with Sri Lanka Accounting Standards comprising of SLFRSs and LKASs (hereafter referred as SLFRSs), as laid down by the Institute of Chartered Accountants of Sri Lanka and in compliance with the requirements of the Companies Act No. 07 of 2007.
2.2 Basis of Measurement
The Financial Statements have been prepared on the historical cost basis, except for Financial Investments held for trading and Available-for-sale financial assets which are measured at fair value and Defined Benefit Obligations which are measured at present value using the projected unit credit method in the Statement of Financial position.
2.3 Functional and Presentation Currency
The Financial Statements of the Company are presented in Sri Lankan Rupees, which is also the Company’s functional and presentation currency. (except otherwise indicated).
2.4 Presentation of financial statements
The Company presents its Statement of Financial Position broadly grouped by nature and listed in an order that reflects their relative liquidity and maturity pattern. An analysis regarding recovery or settlement within 12 months after the reporting date (current) and more than 12 months after the reporting date (non–current) is presented in note 39.
2.5 Materiality & Aggregation
In compliance with LKAS 01 on Presentation of Financial Statements, each material class of similar items is presented separately in the Financial Statements. Items of dissimilar nature or functions too are presented separately, if they are material.
Financial assets and financial liabilities are offset and the net amount reported in the Statement of Financial position only when there is a legally enforceable right to offset the recognized amounts and there is an intention to settle on a net basis, or to realize the assets and settle the liability simultaneously. Income and expenses are not offset in the Income Statement unless required or permitted by any accounting standard or interpretation, and as specifically disclosed in the accounting policies.
2.6 Comparative Information
The accounting policies have been consistently applied by the company with those of the previous financial year in accordance with LKAS 01 Presentation of Financial Statements.
The comparative information is re-classified wherever necessary to conform to the current year’s presentation. Note 46
2.7 Events after Reporting Date
All material events after the reporting date have been considered and appropriate disclosures are made in Note 41 to the Financial Statements.
2.8 Statement of Cash Flows
The Statement of Cash flows is prepared using the indirect method, as stipulated in LKAS 7-“Statement of Cash Flows”. Cash and cash equivalents comprise cash in hand; cash at bank, bank overdraft and Investments with short maturities i.e. three months or less from the date of acquisition are also treated as cash equivalents.
3. SIGNIFICANT ACCOUNTING JUDGMENTS, ESTIMATES AND ASSUMPTIONS
The preparation of Financial Statements requires the application of certain critical accounting and assumptions relative to the future. Further, it requires management to make judgments, estimates and assumptions that affect

Over
view
Man
agem
ent D
iscu
ssio
n an
d An
alys
isCo
rpor
ate
Stew
ards
hip
Fina
ncia
l Inf
orm
atio
nSu
pple
men
tary
Inf
orm
atio
n
Abans Finance PLC | Annual Report 2017/18 | 76
NOTES TO THE FINANCIAL STATEMENTS [Contd.] Year ended 31 March 2018
the reported amounts of revenues, expenses, assets and liabilities, and the disclosure of contingent liabilities, at the end of the reporting period. However, uncertainty about these assumptions and estimates could result in outcomes that require a material adjustment to the carrying amount of the asset or liability affected in future periods.
a) Estimates and Assumptions
The key assumptions concerning the future and other key sources of estimation at the reporting date, that have a significant risk of causing a material adjustment to the carrying amounts of assets and liabilities within the next financial year, are described below. The Company based these assumptions and estimates on parameters available at the time Financial Statements were prepared. Existing circumstances and assumptions about future developments, these may change due to market changes or circumstances arising beyond the control of the Company. Such changes are taken in to consideration in the assumptions when they occur.
I. Going Concern
The Directors have made an assessment of the company’s ability to continue as a going concern and are satisfied that it has the resources to continue in business for the foreseeable future. Furthermore, board is not aware of any material uncertainties that may cast significant doubt upon the company’s ability to continue as a going concern and they do not intend either to liquidate or to cease operations of the company. Therefore, the Financial Statements continue to be prepared on the going concern basis.
II. Defined Benefit Plans
The cost of defined benefit pension plan is determined using actuarial valuations. An actuarial valuation involves making various assumptions which may differ from actual developments in the future. These include the determination of the discount rate, future salary increases, mortality rates and future pension increases. Due to the complexity of the valuation, the underlying assumptions and their long term nature, a defined benefit obligation is highly sensitive to changes in these assumptions. All assumptions are reviewed at each reporting date as disclosed in Note 33.
In determining the appropriate discount rate, management considers the interest rates of Sri Lanka Government Bonds with extrapolated maturities corresponding to the expected duration of the defined benefit obligation. The mortality rate is based on publicly available mortality tables. Future salary increases are based on expected future inflation rates and expected future salary increase rate of the Company.
III. Impairment losses on Loans and Advances (Finance Leases ,Hire Purchases, Mortgage Loans, Revolving Loans and Business/Personal Loans)
The Company reviews their individually significant loans and advances at each date of statement of financial position to assess whether an impairment loss should be recorded in the income statement. In particular, management’s judgment is required in the estimation of the amount and timing of future cash flows when determining the impairment loss. These estimates are
based on assumptions about a number of factors and actual results may differ, resulting in future changes to the impairment allowance.
Loans and advances that have been assessed individually and found to be not impaired and all individually insignificant loans and advances are then assessed collectively, in groups of assets with similar risk characteristics, to determine whether provision should be made due to incurred loss events for which there is objective evidence, but the effects of which are not yet evident. The collective assessment takes in to account data from the loan portfolio (such as asset type, past due status, etc.), and judgements on the effect of concentrations of risks and economic data (including levels of unemployment, inflation, interest rates, exchange rates).
IV. Impairment of Financial Investments - Available for Sale Financial Assets
The Company reviews its debt securities classified as available for sale investments at each reporting date to assess whether they are impaired. This requires similar judgement as applied to the individual assessment of loans and advances. The Company also records impairment charges on available for sale equity investments when there has been a significant or prolonged decline in the fair value below their cost. The determination of what is ‘significant’ or ‘ prolonged’ requires judgement. In making this judgement, the Company evaluates, among other factors, historical share price movements and duration and extent to which the fair value of an investment is less than its cost.
V. Fair Value of Financial Instruments
The determination of fair value of financial assets and financial liabilities recorded on the Statement of Financial Position for which there is no observable market price are determined using a variety of valuation techniques that include the use of mathematical models. The valuation of financial instrument is described in Note 37 to the Financial Statements. The Company measures fair value using the fair value hierarchy that reflects the significance of input used in making measurements. The fair value hierarchy is also given in Note 37.1 to the Financial Statements.
VI. Useful life of Property, Plant and Equipment and Intangible Assets
The Company reviews the assets’ residual values, useful lives and methods of depreciation and amortisation of Property, Plant, Equipments and Intangible Assets at each reporting date. Judgment by the management is exercised in the estimation of these values, rates, methods and hence they are subject to uncertainty.
VII. Taxation
The Company is subject to income tax and judgement is required to determine the total provision for current, deferred and other taxes due to the uncertainties that exist with respect to the interpretation of the applicable tax laws, at the time of preparation of these Financial Statements.

Over
view
Man
agem
ent D
iscu
ssio
n an
d An
alys
isCo
rpor
ate
Stew
ards
hip
Fina
ncia
l Inf
orm
atio
nSu
pple
men
tary
Inf
orm
atio
n
Abans Finance PLC | Annual Report 2017/18 | 77
NOTES TO THE FINANCIAL STATEMENTS [Contd.] Year ended 31 March 2018
Further, deferred tax assets are recognised in respect of tax losses to the extent that it is probable that future taxable profit will be available against which the losses can be utilised. Judgement is required to determine the amount of deferred tax assets that can be recognised, based upon the likely timing and level of future taxable profits, together with future tax-planning strategies.
VIII. Provisions, Commitments and Contingencies
All discernible risks are accounted for in determining the amount of all known liabilities.
Contingent liabilities are possible obligations whose existence will be confirmed only by uncertain future events or present obligations where the transfer of economic benefit is not probable or cannot be reliably measured. Contingent liabilities are not recognised in the Statement of Financial Position but are disclosed unless they are remote. Refer Note 40 for more details on Commitments and Contingencies.
4. SUMMARY OF SIGNIFICANT ACCOUNTING POLICIES
4.1 Cash and Cash Equivalents
The Cash Flow statement is prepared using the indirect method, as stipulated in LKAS 7-“Statement of Cash Flows” Where by operating, investing and financial activities are separately recognised.
For the purpose of the Statement of Cash Flow, cash and cash equivalents as referred to in the cash flow statement comprises cash in hand, non–restricted current account balances with Company’s on demand (net of unfavourable balances) or with an original maturity of three months or less and placements with banks (less than three months) Details of Cash and Cash Equivalents are given in note 15.
4.2 Financial Assets
4.2.1 Financial Assets – Initial Recognition and Subsequent Measurement
Financial Assets within the scope of LKAS 39 are classified as Loans and Advances, Lease Rental Receivables, Financial Investments Held-to-Maturity, Financial Investments Available-for-sale, Financial Investments Held for Trading as appropriate. The Company determines the classification of its financial assets at initial recognition.
(i) Date of recognition
All Financial Assets are initially recognized on the trade date, i.e., the date that the company becomes a party to the contractual provisions of the instrument. This includes ’regular way trades’: purchases or sales of financial assets that require delivery of assets within the time frame generally established by regulation or convention in the market place. Those trades are initially recognized on the settlement date.
(ii) Initial measurement of Financial Assets
The classification of financial instruments at initial recognition depends on their purpose and characteristics and the management’s intention in acquiring them. All Financial Assets are measured initially at their fair value plus transaction costs, except in the case of financial assets recorded at fair value through profit or loss.
(iii) Financial Assets Held for Trading
Financial assets held for trading are recorded in the statement of financial position at fair value. Changes in fair value are recognized in ‘Net Trading Income’. Dividend income is recorded in ‘Net trading income’ according to the terms of the contract, or when the right to the payment has been established.
(iv) Available for Sale Financial Assets
Available for sale investments include non-quoted equity securities. Equity investments classified as available for sale are those which are neither classified as held for trading nor designated at fair value through profit or loss.
Dividends earned whilst holding available for sale financial investments are recognised in the income statement as ‘Other operating income’ when the right of the payment has been established.
The Company has measured its non-quoted equity investments classified as available for sale financial instruments at Fair Value.
(v) Held- to- Maturity Financial Investments
Held to maturity financial investments are non–derivative financial assets with fixed or determinable payments and fixed maturities, which the company has the intention and ability to hold to maturity. Subsequent to initial recognition, held to maturity financial investments are measured at amortised cost using the Effective Interest Rate less impairment.
Amortised cost is calculated by taking into account any discount or premium on acquisition and fees that are an integral part of the Effective Interest Rate.
The amortisation is included in ‘Interest income’ in the income statement. The losses arising from impairment of such investments are recognised in the income statement line ‘Impairment (Charges) / Reversal for loans and other losses’.
If the company was to sell or reclassify more than an insignificant amount of held to maturity investments before maturity (other than in certain specific circum- stances), the entire category would be tainted and would have to be reclassified as available for sale. Furthermore, the company would be prohibited from classifying any financial asset as held to maturity during the following two years.
(vi) Loans and Advances to customers and Lease Rental Receivables from customers
Loans and advances to customers and Lease Rental Receivables from customers include non–derivative financial assets with fixed or determinable payments that are not quoted in an active market, other than:
• Those that the company intends to sell immediately or in the near term and those that the company, upon initial recognition, designates as at fair value through profit or loss. • Those that the company, upon initial recognition, designates as available for sale. • Those for which the company may not recover substantially all of its initial investment, other than because of credit deterioration.

Over
view
Man
agem
ent D
iscu
ssio
n an
d An
alys
isCo
rpor
ate
Stew
ards
hip
Fina
ncia
l Inf
orm
atio
nSu
pple
men
tary
Inf
orm
atio
n
Abans Finance PLC | Annual Report 2017/18 | 78
NOTES TO THE FINANCIAL STATEMENTS [Contd.] Year ended 31 March 2018
After initial measurement, amounts ‘loans and advances to customers and Lease Rental Receivables from customers are subsequently measured at amortised cost using the Effective Interest Rate, less allowance for impairment. Amortised cost is calculated by taking into account any discount or premium on acquisition and fees and costs that are an integral part of the Effective Interest Rate. The amortisation is included in ‘Interest income’ in the income statement. The losses arising from impairment are recognised in the income statement in “Impairment (Charges) / Reversal for loans and other losses”.
4.2.2 ‘Day 1’ difference
When the transaction price differs from the fair value of other observable current market transactions in the same instrument, or based on a valuation technique whose variables include only data from observable markets, the Company immediately recognises the difference between the transaction price and fair value (a ‘Day 1’ profit or loss) in the Income Statement over the tenor of the financial instrument using the effective interest rate method.
4.2.3 Reclassification of Financial Assets
Reclassifications are recorded at fair value at the date of reclassification, which becomes the new amortised cost, if the basis of measurement of the reclassified category is amortized cost.
For a financial asset reclassified out of the ‘available for sale’ category, any previous gain or loss on that asset that has been recognised in equity is amortised to profit or loss over the remaining life of the investment using the Effective Interest Rate. Any difference between the new amortised cost and the expected cash flows is also amortised over the remaining life of the asset using the Effective Interest Rate. If the asset is subsequently determined to be impaired, then the amount recorded in equity is recycled to the income statement.
The Company may reclassify a non–derivative trading asset out of the ‘held for trading’ category and into the ‘loans and receivables’ category if it meets the definition of loans and receivables and the Company has the intention and ability to hold the financial asset for the foreseeable future or until maturity. If a financial asset is reclassified, and if the Company subsequently increases its estimates of future cash receipts as a result of increased recoverability of those cash receipts, the effect of that increase is recognised as an adjustment to the Effective Interest Rate from the date of the change in estimate.
Reclassification is at the election of management, and is determined on an instrument by instrument basis. The Company does not reclassify any financial instrument into the fair value through profit or loss category after initial recognition.
4.2.4 Derecognition of Financial Assets
A financial asset (or, where applicable a part of a financial asset or part of a group of similar financial assets) is derecognised when:
• The rights to receive cash flows from the asset have expired. • The company has transferred its rights to receive cash flows from the asset or has assumed an obligation to pay the received cash flows in full without material delay to a third party under a ‘pass-through’ arrangement and either:
- The company has transferred substantially all the risks and rewards of the asset or - The company has neither transferred nor retained substantially all the risks and rewards of the asset, but has transferred control of the asset.
When the company has transferred its rights to receive cash flows from an asset or has entered into a pass–through arrangement, and has neither transferred nor retained substantially all of the risks and rewards of the asset nor transferred control of the asset, the asset is recognised to the extent of the company’s continuing involvement in the asset. In that case, the company also recognises an associated liability. The transferred asset and the associated liability are measured on a basis that reflects the rights and obligations that the Company has retained. Continuing involvement that takes the form of a guarantee over the transferred asset is measured at the lower of the original carrying amount of the asset and the maximum amount of consideration that the company could be required to repay.
4.2.5 Impairment of Financial Assets
The company assesses at each reporting date, whether there is any objective evidence that a financial asset or a group of financial assets is impaired. A financial asset or a group of financial assets is deemed to be impaired if and only if, there is objective evidence of impairment as a result of one or more events that have occurred after the initial recognition of the asset (an ‘incurred loss event’) and that loss event (or events) has an impact on the estimated future cash flows of the financial asset or the group of financial assets that can be reliably estimated.
Evidence of impairment may include: indications that the borrower or a group of borrowers are experiencing significant financial difficulty; the probability that they will enter bankruptcy or other financial reorganisation default or delinquency in interest or principal payments; and where observable data indicates that there is measurable decrease in the estimated future cash flows, such as changes in arrears or economic conditions that correlate with defaults.
i. Loans and Advances to customers, Lease Rental Receivable from customers and Stock Out on Hire to Customers
Losses for impaired loans are recognised promptly when there is objective evidence that impairment of a loan or portfolio of loans has occurred. Impairment allowances are calculated on individual loans and for groups of loans, this is done collectively. Impairment losses are recorded as charges to the income statement. The carrying amount of impaired loans on the statement of financial position is reduced through the use of impairment allowance accounts. Losses expected from future events are not recognised.
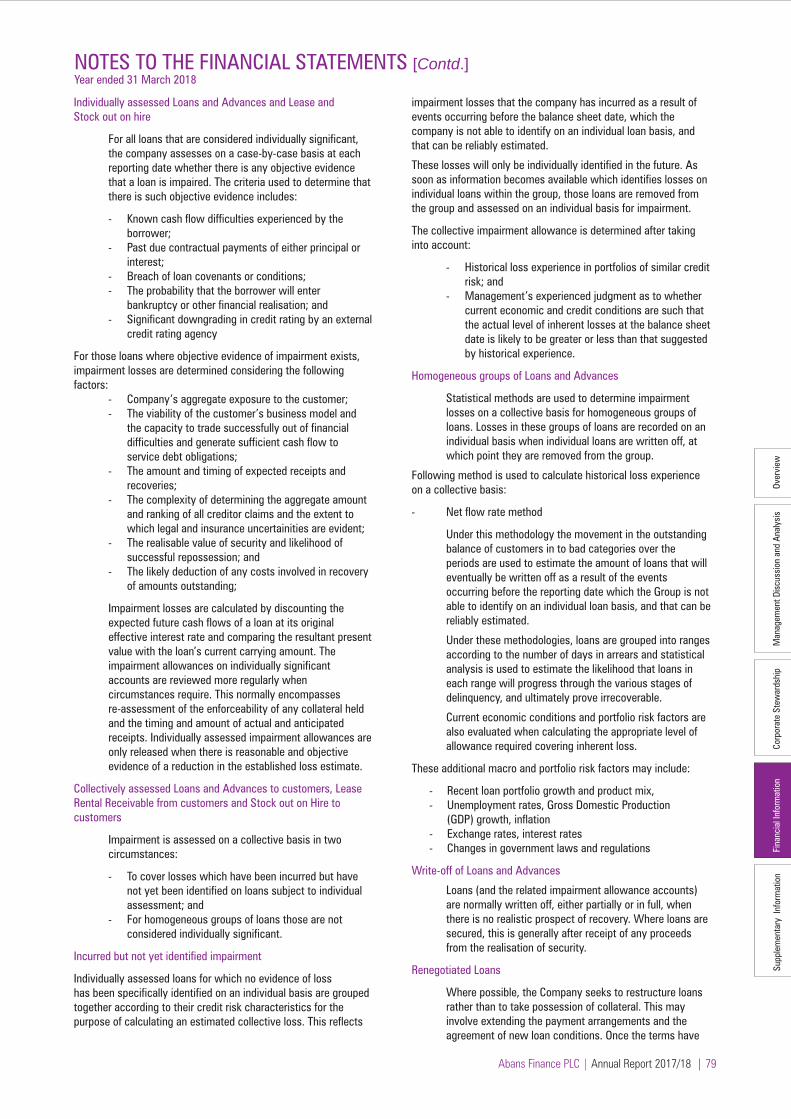
Over
view
Man
agem
ent D
iscu
ssio
n an
d An
alys
isCo
rpor
ate
Stew
ards
hip
Fina
ncia
l Inf
orm
atio
nSu
pple
men
tary
Inf
orm
atio
n
Abans Finance PLC | Annual Report 2017/18 | 79
NOTES TO THE FINANCIAL STATEMENTS [Contd.] Year ended 31 March 2018
Individually assessed Loans and Advances and Lease and Stock out on hire
For all loans that are considered individually significant, the company assesses on a case-by-case basis at each reporting date whether there is any objective evidence that a loan is impaired. The criteria used to determine that there is such objective evidence includes:
- Known cash flow difficulties experienced by the borrower; - Past due contractual payments of either principal or interest; - Breach of loan covenants or conditions; - The probability that the borrower will enter bankruptcy or other financial realisation; and - Significant downgrading in credit rating by an external credit rating agency
For those loans where objective evidence of impairment exists, impairment losses are determined considering the following factors: - Company’s aggregate exposure to the customer; - The viability of the customer’s business model and the capacity to trade successfully out of financial difficulties and generate sufficient cash flow to service debt obligations; - The amount and timing of expected receipts and recoveries; - The complexity of determining the aggregate amount and ranking of all creditor claims and the extent to which legal and insurance uncertainities are evident; - The realisable value of security and likelihood of successful repossession; and - The likely deduction of any costs involved in recovery of amounts outstanding; Impairment losses are calculated by discounting the expected future cash flows of a loan at its original effective interest rate and comparing the resultant present value with the loan’s current carrying amount. The impairment allowances on individually significant accounts are reviewed more regularly when circumstances require. This normally encompasses re-assessment of the enforceability of any collateral held and the timing and amount of actual and anticipated receipts. Individually assessed impairment allowances are only released when there is reasonable and objective evidence of a reduction in the established loss estimate.
Collectively assessed Loans and Advances to customers, Lease Rental Receivable from customers and Stock out on Hire to customers
Impairment is assessed on a collective basis in two circumstances:
- To cover losses which have been incurred but have not yet been identified on loans subject to individual assessment; and - For homogeneous groups of loans those are not considered individually significant.
Incurred but not yet identified impairment
Individually assessed loans for which no evidence of loss has been specifically identified on an individual basis are grouped together according to their credit risk characteristics for the purpose of calculating an estimated collective loss. This reflects
impairment losses that the company has incurred as a result of events occurring before the balance sheet date, which the company is not able to identify on an individual loan basis, and that can be reliably estimated.
These losses will only be individually identified in the future. As soon as information becomes available which identifies losses on individual loans within the group, those loans are removed from the group and assessed on an individual basis for impairment.
The collective impairment allowance is determined after taking into account:
- Historical loss experience in portfolios of similar credit risk; and - Management’s experienced judgment as to whether current economic and credit conditions are such that the actual level of inherent losses at the balance sheet date is likely to be greater or less than that suggested by historical experience.
Homogeneous groups of Loans and Advances
Statistical methods are used to determine impairment losses on a collective basis for homogeneous groups of loans. Losses in these groups of loans are recorded on an individual basis when individual loans are written off, at which point they are removed from the group. Following method is used to calculate historical loss experience on a collective basis:
- Net flow rate method
Under this methodology the movement in the outstanding balance of customers in to bad categories over the periods are used to estimate the amount of loans that will eventually be written off as a result of the events occurring before the reporting date which the Group is not able to identify on an individual loan basis, and that can be reliably estimated. Under these methodologies, loans are grouped into ranges according to the number of days in arrears and statistical analysis is used to estimate the likelihood that loans in each range will progress through the various stages of delinquency, and ultimately prove irrecoverable.
Current economic conditions and portfolio risk factors are also evaluated when calculating the appropriate level of allowance required covering inherent loss.
These additional macro and portfolio risk factors may include:
- Recent loan portfolio growth and product mix, - Unemployment rates, Gross Domestic Production (GDP) growth, inflation - Exchange rates, interest rates - Changes in government laws and regulations
Write-off of Loans and Advances
Loans (and the related impairment allowance accounts) are normally written off, either partially or in full, when there is no realistic prospect of recovery. Where loans are secured, this is generally after receipt of any proceeds from the realisation of security.
Renegotiated Loans
Where possible, the Company seeks to restructure loans rather than to take possession of collateral. This may involve extending the payment arrangements and the agreement of new loan conditions. Once the terms have

Over
view
Man
agem
ent D
iscu
ssio
n an
d An
alys
isCo
rpor
ate
Stew
ards
hip
Fina
ncia
l Inf
orm
atio
nSu
pple
men
tary
Inf
orm
atio
n
Abans Finance PLC | Annual Report 2017/18 | 80
NOTES TO THE FINANCIAL STATEMENTS [Contd.] Year ended 31 March 2018
been renegotiated, any impairment is measured using the original Effective Interest Rate (EIR) as calculated before the modification of terms and the loan is no longer considered past due. Management continually reviews renegotiated loans to ensure that all criteria are met and that future payments are likely to occur. The loans continue to be subject to an individual or collective impairment assessment, calculated using the loan’s original EIR.
Reversals of impairment
If the amount of an impairment loss decreases in a subsequent period, and the decrease can be related objectively to an event occurring after the impairment was recognised, the excess is written back by reducing the loan impairment allowance account accordingly. The write-back is recognised in the statement of comprehen- -sive income.
ii. Available for Sale Financial Investments
For available for sale financial investments, the Company assesses at each reporting date whether there is objective evidence that an investment is impaired. In the case of debt instruments classified as available for sale, the company assesses individually whether there is objective evidence of impairment.
However, the amount recorded for impairment is the cumulative loss measured as the difference between the amortised cost and the current fair value, less any impairment loss on that investment previously recognised in the income statement. Future interest income is based on the reduced carrying amount and is accrued using the rate of interest used to discount the future cash flows for the purpose of measuring the impairment loss. The interest income is recorded as part of ‘Interest income’. If, in a subsequent period, the fair value of a debt instrument increases and the increase can be objectively related to a credit event occurring after the impairment loss was recognised in the income statement, the impairment loss is reversed through the income statement. Impairment losses recognized in profit or loss for an investment in an equity instrument classified as available for sale shall not be reversed through profit or loss.
In the case of equity investments classified as available for sale, objective evidence would also include a ‘significant’ or ‘prolonged’ decline in the fair value of the investment below its cost. Where there is evidence of impairment, the cumulative loss measured as the difference between the acquisition cost and the current fair value, less any impairment loss on that investment previously recognised in the income statement is removed from equity and recognised in the income statement. Impairment losses on equity investments are not reversed through the income statement; increases in the fair value after impairment are recognised in other comprehensive income.
iii. Held-to-Maturity Financial Assets
An impairment loss in respect of held-to-maturity financial assets measured at amortised cost is calculated as the difference between its carrying amount and the present value of estimated future cash flows discounted at the asset’s original Effective Interest Rate and is recognized in profit or loss. Interest on impaired assets continues to be
recognized through the unwinding of discount. When a subsequent event caused the amount of impairment loss to decrease, the decrease in impairment loss is reversed through profit or loss.
4.2.6 Collateral valuation
The Company seeks to use collateral, where possible, to mitigate its risks on financial assets. The collateral comes in various forms such as cash, securities, letters of credit/guarantees, real estate, receivables, and other non-financial assets. The fair value of collateral is generally assessed, at a minimum, at inception and based on the guidelines issued by the Central Bank of Sri Lanka.
Non-financial collateral, such as real estate, is valued based on data provided by third parties such as independent valuers and other independent sources.
4.2.7 Collateral Repossessed
The Company’s policy is to determine whether a repossessed asset is best used for its internal operations or should be sold. Assets determined to be useful for the internal operations are transferred to their relevant asset category at the lower of their repossessed value or the carrying value of the original secured asset.
4.2.8 Other Financial Assets
Other Financial Assets includes the Other Receivables and Refundable Deposits. Refundable Deposits are initially recorded at Fair value and subsequently measured and amortized cost.
4.2.9 Real Estate Stock
Real Estate stock comprises all costs of purchase, cost of conversion and other costs incurred in bringing the real estate to its saleable condition. Purchase Cost - Land Cost with Legal Charges Cost of Conversion - Actual Development Costs
Real Estate stocks are valued at the lower of cost and net realisable value, after making due allowances for slow moving items. Net realisable value is the price at which the real estate stocks can be sold in the ordinary course of business less estimated cost necessary to make the sale.
4.3 Non - Financial Assets
4.3.1 Property, Plant and Equipment
Property, plant & equipment are tangible items that are held for servicing, or for administrative purposes,and are expected to be used during more than one year. Property, Plant & Equipment are recognised if it is probable that future economic benefits associated with the asset will flow to the entity and the cost of the asset can be measured reliably in accordance with LKAS 16 on Property, Plant & Equipment. Initially property and equipment are measured at cost.
Basis of Recognition and Measurement
- Cost Model
An item of property, plant & equipment that qualifies or recognition as an asset is initially measured at its costs. Costs include expenditure that is directly attributable to the acquisition of the asset and cost is incurred subsequently to add to or replace a part of it.

Over
view
Man
agem
ent D
iscu
ssio
n an
d An
alys
isCo
rpor
ate
Stew
ards
hip
Fina
ncia
l Inf
orm
atio
nSu
pple
men
tary
Inf
orm
atio
n
Abans Finance PLC | Annual Report 2017/18 | 81
NOTES TO THE FINANCIAL STATEMENTS [Contd.] Year ended 31 March 2018
The cost of self-constructed assets includes the cost of materials and direct labour, any other costs directly attrib- utable to bringing the asset to working condition for its intended use and the costs of dismantling and removing the items and restoring at the site on which they are located and capitalized borrowing costs. When parts of property, plant & equipment have different useful lives, they are accounted for as separate items (major components) of property, plant & equipment. The Company applies the cost model to property, plant & equipment and records at cost of purchase or construction together with any incidental expense thereon less accumulated depreciation and any accumulated impairment losses.
Changes in the expected useful life are accounted by changing the depreciation period or method, as appropriate, and treated as changes in accounting estimates.
Subsequent Cost
The subsequent cost of replacing a component of an item of property, plant and equipment is recognised in the carrying amount of the item if it is probable that the future economic benefits embodied within that part will flow to the Company and its cost canbe reliably measured. The costs of the day to day servicing property, plant and equipment are charged to the Statement of Comprehensive Income.
Repairs and Maintenance
Repairs and maintenance are charged to the profit or loss during the financial period in which they are incurred. The cost of major renovations is included in the carrying amount of the assets when it is probable that future economic benefits in excess of the most recently assessed standard of performance of the existing assets will flow to the Company and the renovation replaces an identifiable part of the asset. Major renovations are depreciated during the remaining useful life of the related asset.
Depreciation
The provision for depreciation is calculated by using the straight line method over the useful life of the assets on cost or valuation of the Property & Equipment other than freehold land, commencing from when the assets are available for use. The rates of depreciations are given below;
Asset Category Rate of Depreciation (per annum)
• Furniture & Fittings 12.5% - 33.33% • Office Equipment 12.5% • Motor Vehicle 12.5% • Computer Equipment 25%
The asset’s residual values, useful lives and methods of depreciation are reviewed, and adjusted if appropriate, at each financial year end.
De-recognition
Property and equipment is derecognised on disposal or when no future economic benefits are expected from its use. Any gain or loss arising on derecognition of the asset (calculated as the difference between the net disposal
proceeds and the carrying amount of the asset) is recognised in ‘Other Operating Income' in the income statement in the year the asset is derecognised.
Upon disposal, any revaluation reserve relating to the particular asset being sold is transferred to retained earnings.
4.3.2 Intangible Assets
The Company’s intangible assets include the value of computer software. Basis of Recognition
An intangible asset is recognised only when its cost can be measured reliably and it is probable that the expected future economic benefits that are attributable to it will flow to the company in accordance with the Sri Lanka Accounting Standard LKAS 38 on Intangible Assets.
Intangible assets acquired separately are measured on initial recognition at cost. The cost of intangible assets acquired in a business combination is their fair value as at the date of acquisition. Following initial recognition, intangible assets are carried at cost less any accumulated amortisation and accumulated impairment losses if any. Subsequent Expenditure
Subsequent expenditure on Intangible Asset is capitalized only when it increases the future economic benefits embodied in the specific asset to which it relates. All other expenditure is expensed as incurred. Useful Economic life, Amortization and Impairment
The useful lives of intangible assets are assessed to be either finite or indefinite. Intangible assets with finite lives are amortised over the useful economic life. The amortisa- - tion period and the amortisation method for an intangible asset with a finite useful life are reviewed at least at each financial year–end. Changes in the expected useful life or the expected pattern of consumption of future economic benefits embodied in the asset are accounted for by changing the amortisation period or method, as approprate, and they are treated as changes in accounting estimates. The amortisation expense on intangible assets with finite lives is recognised in the income statement in the expense category consistent with the function of the intangible asset.
Amortization
Amortisation is calculated using the straight–line method to write down the cost of intangible assets to their residual values over their estimated useful lives as follows;
Asset Category Useful life
• Computer software 10 Years
The residual value of the intangible asset is zero.
The unamortised balances of Intangible assets with finite lives are reviewed for impairment whenever there is an indication for impairment and recognised in profit or loss to the extent that they are no longer probable of being recovered from the expected future benefits.
Derecognition
Intangible assets are derecognised on disposal or when no future economic benefits are expected from their use. Any

Over
view
Man
agem
ent D
iscu
ssio
n an
d An
alys
isCo
rpor
ate
Stew
ards
hip
Fina
ncia
l Inf
orm
atio
nSu
pple
men
tary
Inf
orm
atio
n
Abans Finance PLC | Annual Report 2017/18 | 82
NOTES TO THE FINANCIAL STATEMENTS [Contd.] Year ended 31 March 2018
gain or loss arising on derecognition of the asset, (Calculated as the difference between the net disposal proceeds and the carrying amount of the asset) is recognised in the profit or loss in the year the asset is derecognised.
4.3.3 Impairment of Non–Financial Assets
The Company assesses at each reporting date whether there is an indication that an asset may be impaired. If any indication exists, or when annual impairment testing for an asset is required, the company estimates the asset’s recoverable amount. An asset’s recoverable amount is the higher of an asset’s or Cash Generating unit’s (CGU) fair value less costs to sell and its value in use. Where the carrying amount of an asset or CGU exceeds its recoverable amount, the asset is considered impaired and is written down to its recoverable amount.
In assessing value in use, the estimated future cash flows are discounted to their present value using a pre–tax discount rate that reflects current market assessments of the time value of money and the risks specific to the asset. In determining fair value less costs to sell, an appropriate valuation model is used. These calculations are corroborated by valuation multiples, quoted share prices for publicly traded subsidiaries or other available fair value indicators.
4.4 Finance and Operating Lease
The determination of whether an arrangement is a lease or it contains a lease, is based on the substance of the arrangement and requires an assessment of whether the fulfilment of the arrangement is dependent on the use of a specific asset or assets and the arrangement conveys a right to use the asset.
Finance Lease
Agreements which transfer to counterparties substantially all the risks and rewards incidental to the ownership of assets, but not necessarily legal title, are classified as finance leases. When the Company is a lessor under finance leases the amounts due under the leases, after deduction of unearned charges, are included in ‘Lease rentals receivables and stock out on hire. The finance income receivable is recognised in ‘Net Interest Income’ over the periods of the leases so as to give a constant rate of return on the net investment in the leases. When the company is a lessee under finance leases, the leased assets are capitalised and included in ‘Property, plant and equipment’ and the corresponding liability to the lessor is included in ‘Due to Banks’. A finance lease and its corresponding liability are recognised initially at the fair value of the asset or, if lower, the present value of the minimum lease payments. Finance charges payable are recognised in ‘Net Interest Income’ over the period of the lease based on the interest rate implicit in the lease so as to give a constant rate of interest on the remaining balance of the liability.
Operating Lease
All other leases are classified as operating leases. When acting as lessor, the Company includes the assets subject to operating leases in ‘Property, plant and equipment’ and accounts for them accordingly. Impairment losses are
recognised to the extent that residual values are not fully recoverable and the carrying value of the assets is thereby impaired. When the Company is the lessee, leased assets are not recognised on the Statement of Financial Position. Rentals payable and receivable under operating leases are accounted for on a straight-line basis over the periods of the leases and are included in ‘other operating expenses’ and ‘other operating income’, respectively.
4.5 Taxes
Income tax expense consists of current and deferred tax. Income tax expense is recognized in the Statement of Comprehensive Income.
4.5.1 Current Taxes
Current tax assets and liabilities consist of amounts expected to be recovered from or paid to the Commissioner General of Inland Revenue in respect of the current as well as prior years. The tax rates and tax laws used to compute the amount are those that are enacted or subsequently enacted at the end of the reporting period. Accordingly, provision for taxation is made on the basis of the profit for the year as adjusted for taxation purpose in accordance with the provision of the Inland Revenue Act No. 10 of 2006 and the amendment there to, at the rates specified in Note 13 to the Financial Statements.
Current tax relating to items recognised directly in equity is recognised in equity and not in the Statement of Comprehensive Income.
4.5.2 Deferred Taxation
Deferred tax is provided, using the liability method, on temporary differences at the reporting date between the tax bases of assets and liabilities and their carrying amounts for financial reporting purposes.
Deferred tax liabilities are recognised for all taxable temporary differences except where the deferred income tax liability arises from the initial recognition of an asset or liability in a transaction that is not a business combination and, at the time of the transaction, affects neither the accounting profit nor taxable profit or loss.
Deferred income tax assets are recognised for all deductible temporary differences, carry-forward of unused tax assets and unused tax losses, to the extent that it is probable that taxable profit will be available against which the deductible temporary differences, and the carry forward of unused tax assets and unused tax losses can be utilised except where the deferred income tax asset relating to the deductible temporary difference arises from the initial recognition of an asset or liability in a transac- -tion that is not a business combination and, at the time of the transaction, affects neither the accounting profit nor taxable profit or loss.
The carrying amount of deferred income tax assets is reviewed at each reporting date and reduced to the extent that it is no longer probable that sufficient taxable profit will be available to allow all or part of the deferred income tax asset to be utilised.
Deferred income tax assets and liabilities are measured at the tax rates that are expected to apply to the year when the asset is realised or the liability is settled, based on tax rates (and tax laws) that have been enacted or substantively enacted at the reporting date.

Over
view
Man
agem
ent D
iscu
ssio
n an
d An
alys
isCo
rpor
ate
Stew
ards
hip
Fina
ncia
l Inf
orm
atio
nSu
pple
men
tary
Inf
orm
atio
n
Abans Finance PLC | Annual Report 2017/18 | 83
NOTES TO THE FINANCIAL STATEMENTS [Contd.] Year ended 31 March 2018
Deferred income tax relating to items recognised directly in equity is recognised in equity and not in the Statement of Comprehensive Income.
4.5.3 Value AddedTax (VAT) on Financial Services
VAT on Financial Services is calculated in accordance with Value Added Tax Act No 14 of 2002 and subsequent amendments thereto. The base for the computation of Value Added Tax on Financial Services is the accounting profit before VAT and income tax adjusted for the economic depreciation and emoluments of employees computed on prescribed rate.
4.5.4 Economic Service Charge (ESC)
As per provisions of the Economic Service Charge (ESC) Act No. 13 of 2006 and subsequent amendments thereto, ESC is payable on aggregate turnover of the Company at 0.5% and is deductible from income tax payable. Unclaimed ESC, if any, can be carried forward and set-off against the income tax payable in the three subsequent years.
ESC is not payable on turnover on which income tax is payable.
4.5.5 Nation Building Tax (NBT) on Financial Services
NBT on financial services is calculated in accordance with Nation Building Tax (NBT) Act, No 9 of 2009 and subsequent amendments thereto with effect from 01st January 2014.NBT on financial services is calculated as 2% of the value addition used for the purpose of VAT on Financial Services.
4.5.6 WithholdingTax on Dividends
Withholding tax on dividends distributed by the Company withholding tax that arise from the distribution of dividends of the Company is recognised at the time of liability to pay the related dividend is recognized. At present, the rate of 10% is deducted at source.
4.6 Financial Liabilities
Initial recognition and measurement
Financial instruments issued by the Company that are not designated as fair value through profit or loss, are classified as other financial liabilities, where the substance of the contractual arrangement results in the Company having an obligation either to deliver cash or another financial asset for a fixed number of own equity shares.
The Company recognizes financial liabilities in the Statement of Financial Position when the Company becomes a party to the contractual provisions of the financial liability.
After initial measurement, other financial liabilities are subsequently measured at amortized cost using the Effective Interest Rate. Amortised cost is calculated by taking into account any discount or premium on the issue and costs that are an integral part of the Effective Interest Rate.
Derecognition of Financial Liabilities
A financial liability is derecognised when the obligation under the liability is discharged or cancelled or expires.
Where an existing financial liability is replaced by another from the same lender on substantially different terms, or the terms of an existing liability are substantially modified, such an exchange or modification is treated as a derecognition of the original liability and the recognition of a new liability. The difference between the carrying value of the original financial liability and the consideration paid is recognised in profit or loss.
Other Financial Liabilities Other Financial labilities including Due to Customer (Deposits), Due to Banks, Debt issued and other borrowed funds are initially measured at fair value less transaction cost that are directly attribuable to the acquisition and subsequently measured at amortised cost using the Effective Interest Rate method.
Amortised cost is calculated by taking in to account any discount or premium on the issue and costs that are an integral part of the Effective Interest Rate.
Borrowings
Borrowings obtained by the Company that are not designated at fair value through profit or loss, are classified as liabilities under ‘Borrowings’, where the substance of the contractual arrangement results in the Company having an obligation either to deliver cash or another financial asset to the holder, or to satisfy the obligation other than by the exchange of a fixed amount of cash or another financial asset for a fixed number of own equity instruments.
After initial measurement, borrowings are subsequently measured at amortised cost using the Effective Interest Rate. Amortised cost is calculated by taking into account any discount or premium on the issue and costs that are an integral part of the Effective Interest Rate.
4.7 Provisions
Provisions are recognized when the Company has a present obligation (legal or constructive) as a result of a past event, where it is probable that an outflow of resources embodying economic benefits will be required to settle the obligation and a reliable estimate can be made of the amount of the obligationin accordance with Sri Lanka Accounting Standard– LKAS 37 on ‘provision, contingent liabilities and contingent assets’.
The amount recognised is the best estimate of the consideration required to settle the present obligation at the reporting date, taking into account the risks and uncertainties surrounding the obligations at that date.
When the Company expects some or all of a provision to be reimbursed, the reimbursement is recognised as a separate asset but only when the reimbursement is virtually certain.
The expense relating to any provision is presented in the income statement net of any reimbursement. If the effect of the time value of money is material, provisions are determined by discounting the expected future cash flows at a pre-tax rate that reflects current market assessments of the time value of money and, where appropriate, the risks specific to the liability. Where discounting is used, the increase in the provision due to the passage of time is recognized as an interest expense.

Over
view
Man
agem
ent D
iscu
ssio
n an
d An
alys
isCo
rpor
ate
Stew
ards
hip
Fina
ncia
l Inf
orm
atio
nSu
pple
men
tary
Inf
orm
atio
n
Abans Finance PLC | Annual Report 2017/18 | 84
NOTES TO THE FINANCIAL STATEMENTS [Contd.] Year ended 31 March 2018
4.8 Retirement Benefit Obligations
(i) Defined Benefit Plan – Gratuity
All the employees of the Company are eligible for gratuity under the Payment of Gratuity Act No. 12 of 1983, at the rate of one half of the Gross Salary applicable to the last month of the financial year in which the employment is terminated or resigned, for each year of completed service, for those who have served in excess of 5 years.
The Company measures the present value of the promised retirement benefits for gratuity, which is a defined benefit plan with the advice of an independent professional actuary using the Projected Unit Credit Method (PUC) as required by LKAS19, Employee Benefits. The item is stated under Defined Benefit Liability in the Statement of financial position.
Recognition of Actuarial Gains and Losses Actuarial gains and losses are recognized in Other Comprehensive Income in the year in which they arise.
Interest Cost
Interest cost is the expected increase due to interest during the period in the present value of the planned liabilities because the benefits are one year closer to settlement.
Recognition of Past Service Cost (Applicable only when a plan has been changed)
Past Service Costs are recognized as an expense on a straight line basis over the average period until the benefits become vested. If the benefits have already been vested, immediately following the introduction of, or changes to the plan, past service costs are recognized immediately.
Funding Arrangements
The Gratuity liability is not externally funded.
(ii) Defined Contribution Plan
The Company also contributes defined contribution plans. The contribution payable to a defined contribution plan is in proportion to the services rendered to the Company by the employees and is recorded as an expense under ‘Personnel expenses’. Unpaid contributions are recorded as a liability.
The Company contributes to the following Schemes:
- Employees’ Provident Fund
The Company and employees contribute 12% and 8% respectively of the employee’s monthly gross salary (excluding overtime) to the Provident Fund.
- Employees’ Trust Fund
The Company contributes 3% of the employee’s monthly gross salary excluding overtime to the Employees’ Trust Fund maintained by the Employees Trust Fund Board.
4.9 Recognition of Income and Expenses
Revenue is recognised to the extent that it is probable that the economic benefits will flow to the company and the
revenue can be reliably measured. The following specific recognition criteria must also be met before revenue is recognised.
4.9.1 Interest and Similar Income and Expenses
For all financial instruments measured at amortised cost, interest bearing financial assets classified as available for sale and financial instruments designated at fair value through profit or loss, interest income or expense is recorded using the Effective Interest Rate.
Effective Interest Rate is the rate that exactly discounts estimated future cash payments or receipts through the expected life of the financial instrument or a shorter period, where appropriate, to the net carrying amount of the financial asset or financial liability.
The calculation takes into account all contractual terms of the financial instrument (for example, prepayment options) and includes any fees or incremental costs that are directly attributable to the instrument and are an integral part of the Effective Interest Rate, but not future credit losses. The carrying amount of the financial asset or financial liability is adjusted if the company revises its estimates of payments or receipts. The adjusted carrying amount is calculated based on the original Effective Interest Rate and the change in carrying amount is recorded as ’Interest and similar income’ for financial assets or ‘Interest and similar expense’ for financial liabilities. However, for a reclassified financial asset for which the Company subsequently increases its estimates of future cash receipts as a result of increased recover ability of those cash receipts, the effect of that increase is recognised as an adjustment to the Effective Interest Rate from the date of the change in estimate.
When the carrying amount of a financial asset or a group of similar financial assets has been reduced due to an impairment loss, interest income continues to be recognised using the rate of interest used to discount the future cash flows for the purpose of measuring the impairment loss.
4.9.2 Interest Income on Overdue Rentals
Interest from overdue rentals has been accounted for on cash received basis. 4.9.3 Fee and Commission Income
The company earns fee and commission income from a diverse range of services it provides to its customers. Fees earned for the provision of services over a certain period of time are accrued over that period. These fees include Credit Related Fees & commission, Service Charge, Transfer Fees and Other Fees income. Loan commitment fees for loans that are likely to be drawn down and other credit related fees are deferred (together with any incremental costs) and recognised as an adjustment to the Effective Interest Rate on the loan. When it is unlikely that a loan will be drawn down, the loan commitment fees are recognised over the commitment period on a straight line basis. 4.9.4 Dividend Income
Dividend Income is recognised when the right to receive the payment is established.

Over
view
Man
agem
ent D
iscu
ssio
n an
d An
alys
isCo
rpor
ate
Stew
ards
hip
Fina
ncia
l Inf
orm
atio
nSu
pple
men
tary
Inf
orm
atio
n
Abans Finance PLC | Annual Report 2017/18 | 85
NOTES TO THE FINANCIAL STATEMENTS [Contd.] Year ended 31 March 2018
4.9.5 Income from Government Securities and Securities purchased under Re-Sale Agreement
Discounts/ Premium on Treasury bills & Treasury bonds are amortised over the period to reflect a constant periodic rate of return. The coupon interest on treasury bonds is recognised on an accrual basis. The interest income on securities purchased under resale agreement is recognised in the Income Statement on an accrual basis over the period of the agreement.
4.9.6 Commission on Insurance
Commission on Insurance has been accounted for on cash received basis.
4.9.7 Net Trading Income
Net trading income includes all gains and losses from changes in fair value and related dividends for financial assets and financial liabilities ‘held for trading’ other than interest income.
4.9.8 Recovery of Bad Debts Written Off
Recovery of amounts written off as bad and doubtful debts is recognised on a cash basis.
4.9.9 Personnel Costs
Short term employee benefit obligations are measured on an undiscounted basis and are expensed as the related service is provided. A liability is recognized for the amount expected to be paid under short term cash bonus or profit-sharing plans if the Company has a present legal or constructive obligation to pay this amount as a result of past service provided by the employee and the obligation can be estimated reliably.
4.9.10 Other Operating Expenses
Other operating expenses are recognized in the Statement of Comprehensive Income on the basis of a direct association between the cost incurred and the earnings of the specific items of the income. All the expenditure incurred in the running business and in maintaining the property, plant and equipment in a state of efficiency has been charged to the Statement of Comprehensive Income in arriving at the profit of the year.
4.9.11 Dividends on Ordinary Shares
Dividends on ordinary shares are recognised as a liability and deducted from equity when they are approved by the Company’s shareholders. Interim dividends are deducted from equity when they are declared and no longer at the discretion of the Company. Dividends for the year that are approved after the reporting date are disclosed as an event after the reporting date.
4.10 Segment Reporting
The Company’s segmental reporting is based on the following operating segments identified based on products and services;
- Leasing - Hire Purchase - Term Loans - Others
A segment is a distinguishable component of a Company that is engaged in providing products and services. (Business segment, which is subject to risks and rewards that are different from those of other segments).
Segment results, assets and liabilities include items directly attributable to a segment as well as those that can be allocated on a reasonable basis.
The accounting policies adopted for segment reporting are those accounting policies adopted for preparing the financial statements of the Company.
4.11 Regulatory Provisions
(a) Statutory Reserve Fund
The statutory reserve fund is maintained as required by Finance Companies (Capital Funds) Direction No.1 of 2003 issued by Central Bank of Sri Lanka. As per the said Direction, every Registered Finance Company shall maintain a reserve fund, out of the net profit for each year after provisions for taxation and bad and doubtful debts. Accordingly 20% of the net profit for the year transferred to Reserve Fund as required by Section 3(b) ii of the said Direction.
(b) Deposit Insurance and Liquidity Support Scheme In terms of the Finance Company’s Act Direction No 2 of 2010 “Insurance of Deposit Liabilities” issued on 27 September 2010 and subsequent amendments there to all Registered Finance Companies are required to insure their deposit liabilities in the Deposit Insurance Scheme operated by the Monetary Board in terms of Sri Lanka Deposit Insurance Scheme Regulations No 1 of 2010 issued under Sections 32E of the Monetary Law Act with effect from 1 October 2010. The said scheme was renamed as the “Sri Lanka Deposit Insurance and Liquidity Support Scheme” as per the Sri Lanka Deposit Insurance and Liquidity Support Scheme Regulation No 1 of 2013.
Deposits to be insured include demand, time and savings deposit liabilities and exclude the following;
a) Deposit liabilities to member institutions b) Deposit liabilities to Government of Sri Lanka c) Deposit liabilities to Directors, Key Management Personnel and other related parties as defined in Banking Act Direction No 11 of 2007 on Corporate Governance of Licensed Commercial Banks
Over
view
Man
agem
ent D
iscu
ssio
n an
d An
alys
isCo
rpor
ate
Stew
ards
hip
Fina
ncia
l Inf
orm
atio
nSu
pple
men
tary
Inf
orm
atio
n
Abans Finance PLC | Annual Report 2017/18 | 86
NOTES TO THE FINANCIAL STATEMENTS [Contd.] Year ended 31 March 2018
d) Deposit liabilities held as collateral against any accommodation granted e) Deposit liabilities falling within the meaning of abandoned property in terms of the Banking Act and dormant deposits in terms of the Finance Companies Act funds of which have been transferred to Central Bank of Sri Lanka
Registered Finance Companies are required to pay a premium of 0.10% on eligible deposit liabilities if the Bank maintains a capital adequacy ratio of 14% or above as at the end of the immediately preceding financial year and a premium of 0.125% on eligible deposit liabilities for all other Licensed Commercial Banks calculated on the total amount of eligible deposits as at the end of the quarter within a period of 15 days from the end of the quarter.
(c) Crop Insurance Levy (CIL)
In terms Section 15 of the Finance Act No 12 of 2013 all institutions under the purview of Banking Act No 30 of 1988, Finance Companies Act No 78 of 1988 and Regulation of Insurance Industry Act No 43 of 2000 are required to pay 1% of the profit after tax as Crop Insurance Levy to the National Insurance Trust Fund Board effective from 01 April 2013.
4.12 SRI LANKA ACCOUNTING STANDARDS ISSUED BUT NOT EFFECTIVE AS AT REPORTING DATE SLFRS 16- Leases
SLFRS 16 sets out the principles for the recognition, measurement, presentation and disclosure of leases for both parties to a contract, i.e. the customer (‘lessee’) and the supplier (‘lessor’). SLFRS 16 will replace Sri Lanka Accounting Standard – LKAS 17 (Leases) and related interpretations. SLFRS 16 introduces a single lessee accounting model for lessee, eliminating the present classification of leases in LKAS 17 as either operating leases or finance leases.
The new standard requires a lessee to:
Recognize assets and liabilities for all leases with a term of more than 12 months, unless the underlying asset is of low value.
Present depreciation of lease assets separately, from interest on lease liabilities in the income statement.
SLFRS 16 substantially carries forward the lessor accounting requirement in LKAS 17. Accordingly, a lessor continues to classify its leases as operating leases or finance leases, and to account for those two types of leases differently.
SLFRS 16 will become effective on 01 January 2019. The impact on the implementation of the above Standard has not been quantified yet.
4.13 SRI LANKA ACCOUNTING STANDARDS EFFECTIVE FROM JANUARY 2018
The following Sri Lanka Accounting Standards have been issued by the Institute of Chartered Accountants of Sri Lanka which are effective from 01 January 2018. The Company intends to adopt these standards, if applicable, when they become effective.
SLFRS 15 -Revenue from Contracts with Customers
The objective of this Standard is to establish the principles that an entity shall apply to report useful information to users of Financial Statements about the nature, amount, timing and uncertainty of revenue and cash flows arising from contracts with customers.
SLFRS 15 introduces a five step approach for revenue recognition from contracts with customers and replaces all other currently applicable revenue Standards and interpretations.
The Company carried out an initial impact analysis with the assistance of an external consultant during the year ended 31 March 2018. According to the above analysis, the Company does not have any material impact from the adoption of SLFRS 15 in the Financial Year 2017/2018.
SLFRS 9 - Financial Instruments
Sri Lanka Accounting Standard - SLFRS 9 “Financial Instruments” will replace Sri Lanka Accounting Standard - LKAS 39 “Financial Instruments - Recognition and Measurement” for annual periods beginning on or after 01 January 2018 with early adoption permitted.
The initial assessment and analysis stage was completed for impairment in 2017, and the classification and measurement phase is being finalized.
The Company performed the diagnostic phase (Preliminary Impact Assessment exercise) and implementation phase (solution development) on SLFRS 9 Financial Instruments.
The Company has undertaken a significant analysis of how SLFRS 9 should be implemented and has taken tentative accounting policy decisions.
Classification & Measurement
From a classification and measurement perspective, the new standard will require all financial assets, except equity instruments and derivatives, to be assessed based on a combination of the entity’s business model for managing the assets and the instruments’ contractual cash flow characteristics.
Business Model Assessment
Company determines its business model at the level that best reflects how it manages the financial assets to achieve its objectives. The Company’s business model is not assessed on an instrument by instrument basis, but at a higher level of aggregated portfolios and is based on observable factors such as:
• How the performance of the business model and the financial asset held within that business model are evaluated and reported to the entity’s key manage- -ment personnel. • The risks that affects the performance of the business model (and the financial asset held within that business model) and, in particular, the way those risks are managed. • How managers of the business are compensated (for example, whether the compensation is based on the fair value of the assets managed or on the contractual cash flow collected). • The expected frequency, value and timing of sales are also important aspect of Company’s assessment.

Over
view
Man
agem
ent D
iscu
ssio
n an
d An
alys
isCo
rpor
ate
Stew
ards
hip
Fina
ncia
l Inf
orm
atio
nSu
pple
men
tary
Inf
orm
atio
n
Abans Finance PLC | Annual Report 2017/18 | 87
Stage 3: Loan considered to be credit Impaired/ contains objective evidence of incurred losses records an allowance for the LTECL. Stage 3 assessment will be performed Individually/Collectively.
Significant Increase in Credit Risk
The Company continuously monitors all assets subject to ECL, in order to determine whether an instrument or a portfolio of instruments is subject to 12mECL or LTECL, the Company assess whether there has been a significant increase in credit risk since initial recognition. The Company considers an exposure to have a significant increase in credit risk when either the facility exceeds 30 days past due or at the point of reschedulement.
Individually Significant Assessment and Not Impaired Individually
Company will individually assess all significant customer exposures to identify whether there are any indicators of impairment. Individual assessment will be performed for all the customers with Objective evidence of incurred losses (under Stage 3). Loans which are individually significant but not impaired will be assessed collectively for impairment either under Stage 1 or Stage 2 based on the criteria whether there have been significant credit deterioration since origination.
While establishing significant credit deterioration Company will consider the following criteria:
- Other changes in the rates or terms of an existing financial instrument that would be significantly different if the instrument was newly originated
- Significant changes in external market indicators of credit risk for a particular financial instrument or similar financial instrument
- Other Information related to the borrower, such as changes in the price of a borrower’s debt/equity instrument
- An actual/expected internal credit rating downgrade for the borrower or decrease in behavioural score used to assess credit risk internally
- Existing or forecast adverse changes in business, financial or economic condition that are expected to cause significant change in the borrower’s ability to meet it’s obligation
- An Actual or expected significant change in the operating results of the borrower in relating to actual/expected decline in revenue, Increase in operating risk, Working capital deficiency, Decrease in Asset quality, Increase in gearing, liquidity management problems
- Significant increase in credit risk on other financial instruments of the same borrower
- An Actual or expected significant adverse change in the regulatory, economic or technological environment of the borrower that result in a significant change in the borrower’s ability to meet the debt obligation
NOTES TO THE FINANCIAL STATEMENTS [Contd.] Year ended 31 March 2018
The business model assessment is based on reasonably expected scenarios without taking ‘Worst case’ or ‘Stress Case’ scenarios in to account. If cash flows after initial recognition are realized in a way that is different from the Company’s original expectation, the Company does not change the classification of the remaining financial assets held in that business model, but incorporates such information when assessing newly originated or newly purchased financial assets.
Contractual Cash Flow Characteristic Test
As the second test of the classification process, the Company assesses the contractual terms of the financial assets to identify whether they meet Solely the Payment of Principle & Interest (SPPI).
‘Principle’ for the purpose of this test is defined as the fair value of the financial asset at initial recognition and may change over the life of the financial asset (for example, if there are repayments of principle or amortization of the premium/discount).
The most significant elements of interest within a lending arrangement are typically the consideration for the time value of money and credit risk. To make SPPI assessment, the Company applies judgment and considers relevant factors such as currency in which the financial asset is denominated and the period for which the interest rate is set.
In contrast to contractual exposures that introduce a more than demonisms exposure to risk or volatility in the contractual cash flows that are unrelated to a basic lending arrangement do not give rise to contractual cash flows that are solely the payment of principle and interest on the amount outstanding. In such cases the financial asset is required to be measured at FVPL.
Impairment of Financial Assets
Overview of Expected Credit Loss Principle (ECL)
SLFRS 9 will principally change the Company’s loan loss provision method by replacing LKAS 39 Financial Instrument Recognition & Measurement’s incurred loss approach with a forward looking ECL Approach.
ECL allowance will be based on credit losses expected to arise over the life of the asset (Lifetime expected credit loss or LTECL), unless there has been no significant increase in credit risk since origination in which case the loss allowance will be 12 month expected credit loss (12mECL).
12mECL is the portion of LTECL that represent the ECL that results from default events on a financial instrument that are possible within 12 months after the reporting date.
Stage 1: When loans are first recognized, the Company recognizes an allowance based on 12mECL. Stage 1 loans also includes the facilities where the credit risk has improved and the loans have been reclassified from Stage 2. Assessment of Stage 1 will be performed collectively.
Stage 2: When a loan has shown a significant increase in credit risk since origination, the Company records an allowance for the LTECL. Stage 2 loans also include facilities, where the credit risk has improved and the loan has been reclassified from stage 2. Assessment of stage 2 will be performed.

Over
view
Man
agem
ent D
iscu
ssio
n an
d An
alys
isCo
rpor
ate
Stew
ards
hip
Fina
ncia
l Inf
orm
atio
nSu
pple
men
tary
Inf
orm
atio
n
Abans Finance PLC | Annual Report 2017/18 | 88
NOTES TO THE FINANCIAL STATEMENTS [Contd.] Year ended 31 March 2018
Grouping financial assets measured on a collective basis As explained above, the Company calculates ECL either on a collective or individual basis. Asset classes where Company calculates ECL on an Individual basis includes All Individually significant Assets which are belong to stage 3. All assets which belong stage 1 & 2 will be assessed collectively for Impairment.
Company groups these exposures for smaller homogeneous exposures, based on a combination of internal and external characteristics such as product type, customer type, days past due etc.
The Calculation of ECL
The Company calculates ECL based on 3 probability weighted scenarios to measure expected cash shortfalls, discounted at an approximation to the EIR.
A cash shortfall is the difference between the cash flows that are due to an entity in accordance with the contract and the cash flows that the entity expects to receive.
The mechanics of the ECL calculation are outlined below and the key elements are as follows:
• PD: The Probability of Default is an estimate of the likelihood of default over a given time horizon. A default may only happen at a certain time over the assessed period, if the facility has not been previously derecognized and is still in the portfolio
• EAD: Exposure At Default is the estimate of the exposure at a future default date, taking in to account expected changes in the exposure after the reporting date, including repayments of the principle and interest, whether scheduled by contract to otherwise, expected draw downs on committed facilities.
• LGD: Loss Given Default is an estimate of the loss arising in the case where a default occurs at a given time. It is based on the difference between the contractual cash flows due and those that the lenders would expect to receive, including realization of any collateral. It is usually expressed as a % of the EAD.
When estimating the ECL, Company considers 3 scenarios (Base Case, Best Case & Worst Case). Each of these scenarios associated with different loss rates. For all products Company considers the maximum period of which the credit losses are determined is the contractual life of a financial instrument. Forward Looking Information
In its ECL model Company relies on broad range qualitative/quantitative forward looking information as economic input such as:
Quantitative Qualitative
GDP Growth Government Policies
Inflation Status of the Industry Business
Unemployment Regulatory Impact
Interest Rates
Exchange Rates
Transition process of the Company
The Company is in the process of finalising the quantification of impairment performed as of 31 March 2017 based on the requirements of SLFRS 09.
4.14 AMENDMENTS TO EXISTING ACCOUNTING STANDARDS EFFECTIVE FROM JANUARY 2017
Amendments to existing Accounting Standards with effect from 01 January 2017 as published by the Institute of Chartered Accountants of Sri Lanka did not have any impact on the Financial Statements of the Company other than those disclosed below.
LKAS 7 - Statement of Cash Flows
The amendment requires an entity to disclose information that enables users of financial statements to evaluate changes in liabilities arising from financing activities, including both changes arising from cash flows and non-cash changes.
Accordingly an entity shall disclose the following changes in liabilities arising from financing activities:
• Changes from financing cash flows
• Changes arising from obtaining or losing control of subsidiaries or other businesses
• The effect of changes in foreign exchange rates
• Changes in fair values and
• Other changes
Necessary disclosures have been given under Note 29 to the Financial Statements.
LKAS 12 - Income Taxes
When an entity assesses whether taxable profits will be available against which it can utilize a deductible temporary difference, the entity shall consider whether tax law restricts the sources of taxable profits against which it may make deductions on the reversal of that deductible temporary difference. If tax law imposes no such restrictions, entity may assess the deductible temporary difference in combination with all of its other deductible temporary differences.
Over
view
Man
agem
ent D
iscu
ssio
n an
d An
alys
isCo
rpor
ate
Stew
ards
hip
Fina
ncia
l Inf
orm
atio
nSu
pple
men
tary
Inf
orm
atio
n
Abans Finance PLC | Annual Report 2017/18 | 89
NOTES TO THE FINANCIAL STATEMENTS [Contd.] Year ended 31 March 2018
However, if tax law restricts the utilization of losses to deduction against income of a specific type, a deductible temporary difference is assessed in combination only with other deductible temporary differences of the appropriate type.
Further the amendment requires an entity to compare the deductible temporary differences with future taxable profit that excludes tax deductions resulting from the reversal of those deductible temporary differences, when evaluating whether the entity will have sufficient taxable profit in future periods. This comparison shows the extent to which the future taxable profit is sufficient for the entity to deduct the amounts resulting from the reversal of those deductible temporary differences.
According to the amendment introduced through Inland Revenue Act, the estimate of probable future taxable profit may include the recovery of some of an entity’s assets for more than their carrying amount if there is sufficient evidence that it is probable that the entity will achieve this.
The Company did not have a material impact from the above amendment during the year ended 31 March 2018.

Over
view
Man
agem
ent D
iscu
ssio
n an
d An
alys
isCo
rpor
ate
Stew
ards
hip
Fina
ncia
l Inf
orm
atio
nSu
pple
men
tary
Inf
orm
atio
n
Abans Finance PLC | Annual Report 2017/18 | 90
NOTES TO THE FINANCIAL STATEMENTS [Contd.] Year ended 31 March 2018
5 . INCOME 2018 2017 Rs. Rs.
Interest Income 1,711,585,707 1,494,673,696 Fee & Commission Income 185,717,691 104,114,176 Net Gain/(Loss) from Trading 1,676,964 948,394 Other Operating Income 18,690,232 20,770,114
Total Income 1,917,670,594 1,620,506,380
5.1 Interest Income Loans and Advances 519,241,077 453,946,296 Lease Rentals Receivable & Stock out on hire 1,047,044,191 924,623,165 Financial Investments - Held to Maturity & Repurchase Agreements 76,205,802 52,571,244 Other Financial Assets 11,604,992 11,566,438 Placement with Banks 57,489,645 51,966,553
Total Interest Income 1,711,585,707 1,494,673,696
Interest Income on Loans and Advances and Lease Rentals Receivable & Stock out on hire includes interest income accrued on impaired Financial Assets amounting to Rs.33,947,010/- (2016/17 -Rs.14,695,267/-). 5.2 Interest Expenses Due to Banks 25,862,725 17,909,634 Due to Customers 787,731,513 605,501,131 Debt Instruments Issued and Other Borrowed Funds - 228,996
Total Interest Expenses 813,594,238 623,639,761
Notional Tax Credit for Withholding Tax on Government Securities on Secondary Market Transactions The Inland Revenue Act No.10 of 2007, provided that a company which derives interest income from the secondary market transactions in Government Securities ( on or after April 1, 2002 ) would be entitled to a notional tax credit ( being one ninth of the net interest income ) provided such interest income forms part of the statutory income of the Company for that year of assessment. Accordingly the net interest income earned from the secondary market transactions in Government Securities for the year, has been grossed up in the Financial Statement & the resulting notional Tax credit amounts to Rs.12,410,922/- (2017 - Rs.5,257,125/-)
6. NET FEE AND COMMISSION INCOME 2018 2017 Rs. Rs.
6.1 Fee and Commission Income Credit Related Fees and Commissions 28,420,361 16,584,089 Service Charge 149,980,969 82,777,943 Transfer Fees 6,701,763 4,089,167 Other Fees 614,598 662,977
Total Fee and Commission Income 185,717,691 104,114,176
6.2 Fee and Commission Expenses Brokerage Fees 143,550,479 84,747,252
Total Fee and Commission Expenses 143,550,479 84,747,252 6.3 Net Fee and Commission Income 42,167,212 19,366,924 7. NET GAIN/(LOSS) FROM TRADING 2018 2017 Rs. Rs. Dividend Income from Financial Investments - Held for Trading 283,453 274,227 Appreciation/ (Depreciation) in Market Value of Financial Investments - Held for Trading 1,561,557 674,167 Profit /(Loss) on sale of Financial Investments - Held for Trading (168,046) -
1,676,964 948,394

Over
view
Man
agem
ent D
iscu
ssio
n an
d An
alys
isCo
rpor
ate
Stew
ards
hip
Fina
ncia
l Inf
orm
atio
nSu
pple
men
tary
Inf
orm
atio
n
Abans Finance PLC | Annual Report 2017/18 | 91
NOTES TO THE FINANCIAL STATEMENTS [Contd.] Year ended 31 March 2018
8. OTHER OPERATING INCOME 2018 2017 Rs. Rs. Income from Sale of Available - for-Sale Financial Investments - 2,142,786 Profit/(loss) on disposal of Property & Equipment 1,182,865 - Bad Debt Recoveries 12,974,722 9,077,411 Rent Income 2,877,416 3,292,892 Others 1,655,229 6,257,025
Total Other Operating Income 18,690,232 20,770,114
2018 20179. IMPAIREMENT CHARGES/ (REVERSAL) FOR LOANS AND OTHER LOSSES Rs. Rs. 9.1 Individual Loans and Advances 21,668,084 10,742,981 Lease Rentals Receivable & Stock Out on Hire 22,157,800 (15,785,057) Other Debtors (24,135,930) 26,483,661
19,689,954 21,441,585
9.2 Collective Loans and Advances 30,850,997 49,700,823 Lease Rentals Receivable & Stock Out on Hire 11,060,134 15,912,220 Other Debtors 161,501,034 102,314,765 203,412,165 167,927,808
Total Impairment charges/ (Reversal) for Loans and Advances 223,102,119 189,369,393 9.3 Sensitivity of Assumptions in Collective Impairment The following table demonstrates the sensitivity to a reasonably possible change in the key assumption (LGD and PD) employed with all other variables held constant with regard to Collective Impairment as at 31 March 2018. Increase/(Decrease) Overall Impact to the Percentage Profit and Loss in Rs.
Increase/ Decrease in Percentage LGD 10% 10,875,505 -10% (10,875,505) Increase/ Decrease in Percentage PD 10% 19,504,372 -10% (9,454,882) 10. PERSONNEL COSTS 2018 2017 Rs. Rs. Salaries and Bonus 185,360,613 159,818,313 Employer’s Contribution to EPF 19,642,827 16,943,581 Employer’s Contribution to ETF 4,910,707 4,248,395 Gratuity Charge/ (Reversals) for the Year (Note 33.1) 5,667,867 4,466,536 Other Allowances & Staff Related Expenses 40,812,667 31,611,834
256,394,681 217,088,659 11. DEPRECIATION & AMORTIZATION 2018 2017 Rs. Rs.
Depreciation of Property Plant & Equipment 20,670,196 16,146,846 Amortization of intangible assets 2,974,290 2,513,703
23,644,486 18,660,549

Over
view
Man
agem
ent D
iscu
ssio
n an
d An
alys
isCo
rpor
ate
Stew
ards
hip
Fina
ncia
l Inf
orm
atio
nSu
pple
men
tary
Inf
orm
atio
n
Abans Finance PLC | Annual Report 2017/18 | 92
NOTES TO THE FINANCIAL STATEMENTS [Contd.] Year ended 31 March 2018
12. OTHER OPERATING EXPENSES 2018 2017 Rs. Rs. Directors' Emoluments 11,342,750 10,900,600 Auditors Remuneration - Audit 1,044,150 876,500 - Non Audit 900,000 300,000 Professional & Legal Expenses 14,127,605 6,486,716 Office Administration & Establishment Expenses 141,732,264 130,593,126 Advertising & Business Promotion Expenses 38,665,917 35,374,417 Deposit Insurance premium 8,170,756 7,228,136 Others 49,797,213 42,516,180
265,780,655 234,275,675
13. TAXATION 2018 2017 Rs. Rs. 13.1 The major components of income tax expense for the years ended 31 March are as follows.
(A) Statement of Profit or Loss Current Income Tax
Income Tax for the year 32,522,382 61,211,726
Deferred Tax Deferred Taxation Charge/ (Reversal) (Refer Note 28) 5,563,356 2,630,462
38,085,738 63,842,188
(B) Other Comprehensive Income Deferred Tax Deferred Taxation Charge/ (Reversal) (Refer Note 28) (349,197) 988,751 (349,197) 988,751
(C) Total Tax Expense for the year 37,736,541 64,830,939

Over
view
Man
agem
ent D
iscu
ssio
n an
d An
alys
isCo
rpor
ate
Stew
ards
hip
Fina
ncia
l Inf
orm
atio
nSu
pple
men
tary
Inf
orm
atio
n
Abans Finance PLC | Annual Report 2017/18 | 93
NOTES TO THE FINANCIAL STATEMENTS [Contd.] Year ended 31 March 2018
13.2 Reconciliation of Accounting Profit and Taxable Income A reconciliation between the tax expense and the accounting profit multiplied by government of Sri Lanka’s tax rate for the Years ended 31 March 2018 and 2017 is as follows. 2018 2017 Rs. Rs. Accounting Profit Before Income Taxation 132,949,426 197,406,328 Adjustments Capital Portion of Leasing Rental Due 1,630,462,901 1,469,478,702 Non-taxable Income/ Losses (494,099) (3,091,181) Disallowable Expenses 239,416,256 247,852,138 Allowable Expenses (2,091,534,833) (1,693,032,679) Total Statutory Income (89,200,349) 218,613,308 Claim on Carried Forward Tax Losses 205,351,711 - Taxable Income 116,151,362 218,613,308 Income Tax Rate (%) 28% 28% Income Tax 32,522,382 61,211,726 Deferred Taxation Charge/(Reversal) (Note 28) 5,563,356 2,630,462 Total Tax Expense (Note 13.1 (A)) 38,085,738 63,842,188 Effective Tax Rate 29% 32%
14. EARNINGS PER ORDINARY SHARE The Company presents basic and diluted Earnings per Share (EPS) data for its ordinary shares. Basic earnings per share is calculated by dividing the profit or loss attributable to ordinary equity share holders of the Company by the weighted average number of ordinary shares outstanding during the year.Diluted EPS is determined by adjusting both the profit attributable to the ordinary equity share holders and the weighted average number of ordinary shares outstanding, for the effects of all dilutive potential ordinary shares if any.
14.1 Earnings per Share: Basic / Diluted 2018 2017 Rs. Rs. Amount used as the numerator Profit after tax for the year attributable to equity holders (Rs) 94,863,688 133,564,140 No. of ordinary shares used as the denominator Weighted average number of ordinary shares (Note 14.1.1) 65,733,693 56,627,011 Basic / diluted earnings per ordinary share (Rs) 1.44 2.36
Outstanding No. of Shares Weighted Average No. of Shares 2018 2017 2018 201714.1.1 Weighted Average Number of Ordinary Shares for Basic / Diluted EPS Number of shares in issue as at 01 April 55,467,978 37,000,000 55,467,978 37,000,000 Add : Number of shares issued under rights issue 2016/2017 - 7,400,000 - 7,400,000 Add : Number of shares issued under private placement 2016/2017 - 11,067,978 - 11,067,978 55,467,978 55,467,978 55,467,978 55,467,978 Add : Number of shares issued under rights issue 2017/2018 11,093,595 - 9,106,682 - Add : Bonus element on number of shares issued under rights issue 2017/2018 - - 1,159,033 1,159,033 Number of shares in issue / weighted average number of shares as at 31 March 66,561,573 55,467,978 65,733,693 56,627,011

Over
view
Man
agem
ent D
iscu
ssio
n an
d An
alys
isCo
rpor
ate
Stew
ards
hip
Fina
ncia
l Inf
orm
atio
nSu
pple
men
tary
Inf
orm
atio
n
Abans Finance PLC | Annual Report 2017/18 | 94
NOTES TO THE FINANCIAL STATEMENTS [Contd.] Year ended 31 March 2018
15. CASH AND BANK BALANCES 2018 2017 Rs. Rs.
Cash in Hand 58,406,720 42,315,367 Balances with Banks 347,067,821 334,653,437 405,474,541 376,968,804 15.1 Cash and Cash Equivalents in the Cash Flow Statement Cash and Bank Balances 405,474,541 376,968,804 Bank Overdrafts (8,658,861) (12,350,088) Treasury Bills and Repurchase Agreements 362,248,075 250,809,890 Placement with Banks 249,673,957 384,048,036 Total Cash and Cash Equivalents for the purpose of Cash Flow Statements 1,008,737,712 999,476,642
16. PLACEMENT WITH BANKS 2018 2017 Rs. Rs.
Fixed Deposit Investments 550,601,090 384,100,772 550,601,090 384,100,772
Fixed Deposit Investments include Investments amounting to Rs.34,000,000/- that have been Pledged for facilities obtained from Banks. 17. SECURITIES PURCHASED UNDER REPURCHASE AGREEMENT 2018 2017 Rs. Rs.
Repurchased Agreements 362,248,075 250,809,890 362,248,075 250,809,890
18. FINANCIAL ASSETS- HELD FOR TRADING 2018 2017 Rs. Rs. Quoted equities (Note 18.1) - 7,624,408 - 7,624,408

Over
view
Man
agem
ent D
iscu
ssio
n an
d An
alys
isCo
rpor
ate
Stew
ards
hip
Fina
ncia
l Inf
orm
atio
nSu
pple
men
tary
Inf
orm
atio
n
Abans Finance PLC | Annual Report 2017/18 | 95
NOTES TO THE FINANCIAL STATEMENTS [Contd.] Year ended 31 March 2018
18.1 DEALING SECURITIES Quoted Shares Rs. Rs. Rs. Rs. Plantations Hotels & Travels Mahaweli Reach Hotels PLC - - - 9,400 365,104 178,600 Renuka City Hotel PLC - - - 1,300 394,136 382,850 - - - 10,700 759,240 561,450 Diversified Holdings John Keells Holdings PLC - - - 2,720 490,343 375,088 - - - 2,720 490,343 375,088 Power & Energy Lanka IOC PLC - - - 15,000 649,191 435,000 - - - 15,000 649,191 435,000 Banking & Finance Sampath Bank PLC - - - 4,361 1,036,175 1,129,499 Seylan Bank PLC - Voting - - - 1,000 102,131 87,000 Seylan Bank PLC - Non Voting - - - 12,000 673,660 656,400 Hatton National Bank PLC - - - 1,525 248,806 302,597 First Capital Holdings PLC - - - 1,952 78,757 39,235 Central Finance Company PLC - - - 2,067 239,149 178,175 DFCC Bank - - - 1,000 213,262 114,000 Nations Trust Bank PLC - - - 2,000 183,027 148,000 Union Bank PLC - - - 7,000 189,600 99,400 Commercial Bank Of Ceylon PLC - - - 514 57,740 52,993 Pan Asia Banking Corporation PLC - - - 7,500 159,486 115,500 - - - 40,919 3,181,793 2,922,800 Telecommunication Sri Lanka Telecom PLC - - - 4,190 239,386 139,527 - - - 4,190 239,386 139,527 Manufacturing Singer Sri Lanka - - - 500 60,672 69,950 Tokyo Cement Company (Lanka) PLC -Non Voting - - - 16,375 640,367 867,875 Tokyo Cement Company (Lanka) PLC - Voting - - - 10,000 444,928 610,000 - - - 26,875 1,145,967 1,547,825 Hospitals Lanka Hospital Corporation PLC - - - 3,000 157,343 184,500 - - - 3,000 157,343 184,500 Investment Ceylon Investment PLC - - - 1,009 108,300 40,360 Access Engineering Ltd - - - 4,000 150,264 95,200 Ceylon Guardian Investment Trust PLC - - - 505 102,687 45,501 - - - 5,514 361,251 181,061 Automobiles United Motors Lanka PLC - - - 500 53,088 39,000 - - - 500 53,088 39,000 Beverage Food & Tobacco Stores Supplies Hemas Holdings PLC - - - 2,333 117,502 253,597 Piramal Glass Ceylon Plc - - - 100,000 465,152 560,000 - - - 102,333 582,654 813,597 Insurance Peoples' Insurance PLC - - - 23,200 348,000 424,560 - - - 23,200 348,000 424,560 Total - - - 234,951 7,968,257 7,624,408
No. of Shares
Cost Market Value Cost Market ValueNo. of Shares
2018 2017
Rs. Rs.
- - - - - - - - -
- - - - - -
- - - - - -
- - - - - -
- - - - - - - - - - - - - - - - - -
- - - - - - - - - - - - - - -
- - -
- - - - - - - - - - - -
- - - - - -
- - - - - - - - - - - -
- - - - - -
- - - - - - - - -
- - -
- - -
- - -
No. of Shares
Cost Market Value
2018

Over
view
Man
agem
ent D
iscu
ssio
n an
d An
alys
isCo
rpor
ate
Stew
ards
hip
Fina
ncia
l Inf
orm
atio
nSu
pple
men
tary
Inf
orm
atio
n
Abans Finance PLC | Annual Report 2017/18 | 96
19. LOANS AND ADVANCES 2018 2017 Rs. Rs. Real Estate Loans 2,994,278 3,313,673 Mortgage Loans 586,369,059 405,840,872 Personnel Loans 301,743,047 113,901,642 Loans against Fixed Deposits 145,764,194 164,754,856 Staff Loans 41,841,032 28,408,286 Revolving Loans 133,301,535 170,837,388 Business Loans 815,306,787 393,506,492 Other Loans 563,414,822 967,502,971 2,590,734,754 2,248,066,180 Less : Allowance for Impairment Losses (Note 19.1) (154,913,410) (102,390,149) Net Loans and Advances 2,435,821,344 2,145,676,031
19.1 Allowance for Impairment Losses 2018 2017 Rs. Rs.
As at 01 April 102,390,149 61,273,426 Charge / (Reversal) for the year 52,523,261 60,443,804 Amounts written off - (19,327,081) As at 31 March 154,913,410 102,390,149 Individual Impairment 39,812,532 18,144,449 Collective Impairment 115,100,878 84,245,700 154,913,410 102,390,149 Gross amount of loans individually determined to be impaired, before deducting the individually assessed impairment allowance 182,269,548 61,937,004 20. LEASE RENTALS RECEIVABLE & STOCK OUT ON HIRE 2018 2017 Rs. Rs. Gross rentals receivables - Lease Rentals 6,221,315,557 5,050,089,722 - Amounts Receivable from Hirers 39,912,328 78,079,436 6,261,227,885 5,128,169,158
Less: Unearned Income (1,481,675,613) (1,192,323,653) Net rentals receivables 4,779,552,272 3,935,845,505
Less : Rental Received In Advance (16,512) (16,512) Less : Suspended VAT (5,333,626) (7,171,161) 4,774,202,134 3,928,657,832
Less : Allowance for Impairment Losses (Note 20.1) (281,905,939) (248,692,186)
Total net rentals receivable (Note 20.2, 20.3) 4,492,296,195 3,679,965,646
Lease & hirers receivables include receivables amounting to Rs. 766,811,112 that have been Pledged for facilities obtained from Banks.
NOTES TO THE FINANCIAL STATEMENTS [Contd.] Year ended 31 March 2018

Over
view
Man
agem
ent D
iscu
ssio
n an
d An
alys
isCo
rpor
ate
Stew
ards
hip
Fina
ncia
l Inf
orm
atio
nSu
pple
men
tary
Inf
orm
atio
n
Abans Finance PLC | Annual Report 2017/18 | 97
NOTES TO THE FINANCIAL STATEMENTS [Contd.] Year ended 31 March 2018
20. LEASE RENTALS RECEIVABLE & STOCK OUT ON HIRE (Contd…) 20.1 Allowance for Impairment Losses 2018 2017 Rs. Rs. As at 01 April 248,692,186 276,780,949 Charge / (Reversal) for the year 33,213,752 127,163 Amounts written off - (28,215,926) As at 31 March 281,905,938 248,692,186 Individual Impairment 40,045,920 17,888,120 Collective Impairment 241,860,019 230,804,066 281,905,939 248,692,186 Gross amount of lease and hire purchase rental receivables individually determined to be impaired, before deducting the individually assessed impairment allowance 92,080,129 52,440,345 20.2 As at 31st March 2018 Within One Year 1-5 Years Over 5 Years Total Rs. Rs. Rs. Rs. Gross rentals receivables - Lease Rentals 3,349,447,344 2,871,712,521 155,692 6,221,315,557 - Amounts Receivable from Hirers 36,105,909 3,806,419 - 39,912,328 3,385,553,253 2,875,518,940 155,692 6,261,227,885 Less: Unearned Income (627,475,860) (854,133,936) (65,816) (1,481,675,613) Net rentals receivables 2,758,077,393 2,021,385,004 89,876 4,779,552,272 Less : Rental Received In Advance (16,512) Less : Suspended VAT (5,333,626) 4,774,202,134 Less : Allowance for Impairment Losses (281,905,939) Total net rentals receivable 4,492,296,195 Within one year 1 - 5 years Over 5 years Total20.3 As at 31st March 2017 Rs. Rs. Rs. Rs. Gross rentals receivables - Lease Rentals 2,805,275,780 2,244,813,942 - 5,050,089,722 - Amounts Receivable from Hirers 65,384,569 12,694,867 - 78,079,436 2,870,660,349 2,257,508,809 - 5,128,169,158 Less: Unearned Income (730,522,043) (461,801,610) - (1,192,323,653) Net rentals receivables 2,140,138,306 1,795,707,199 - 3,935,845,505 Less : Rental Received In Advance (16,512) Less : Suspended VAT (7,171,161) 3,928,657,832 Less : Allowance for Impairment Losses (248,692,186) Total net rentals receivable 3,679,965,646

Over
view
Man
agem
ent D
iscu
ssio
n an
d An
alys
isCo
rpor
ate
Stew
ards
hip
Fina
ncia
l Inf
orm
atio
nSu
pple
men
tary
Inf
orm
atio
n
Abans Finance PLC | Annual Report 2017/18 | 98
21. FINANCIAL INVESTMENTS - AVAILABLE FOR SALE 2018 2017 Rs. Rs.
Credit Information Bureau-Unquoted Equities * 80,400 80,400 80,400 80,400 * Cost is assumed to be the best approximation for the fair value of unquoted equity shares due to the absence of most recent exit prices.
22. FINANCIAL INVESTMENTS - HELD TO MATURITY 2018 2017 Rs. Rs. Government of Sri Lanka Treasury Bills 216,714,891 216,321,780 Government of Sri Lanka Treasury Bonds 22,915,244 22,251,183 239,630,135 238,572,963
23. OTHER FINANCIAL ASSETS 2018 2017 Rs. Rs. Other Receivables 200,260,699 150,009,839 Deposit 15,409,628 13,682,034 Due From Related Parties 14,734,680 21,011,870 230,405,007 184,703,743 Less : Allowance for Impairment Losses (Note 23.1) (74,470,001) (76,196,266) 155,935,006 108,507,477 23.1 Allowance for Impairment Losses Balance at the Beginning 76,196,266 167,657,318 Charge / (Reversal) for the year 137,365,104 128,798,427 Amounts written off (139,091,369) (220,259,479) Balance at the end of the year 74,470,001 76,196,266 Individual Impairment 1,213,834 25,349,764 Collective Impairment 73,256,167 50,846,502 74,470,001 76,196,266 Gross amount of loans individually determined to be impaired, before deducting the individually assessed impairment allowance 3,658,939 27,904,052 24. REAL ESTATE STOCK 2018 2017 Rs. Rs.
Real Estate Stocks 58,049,675 66,050,693 58,049,675 66,050,693
25. OTHER NON FINANCIAL ASSETS 2018 2017 Rs. Rs. Advances 35,446,356 15,831,344 Pre-paid Staff Cost 22,429,909 9,710,210 Other Receivables 212,630 212,630 Pre Paid Rent Deposit 4,139,456 5,376,261 Pre-Paid Expenses 12,310,008 9,594,619 74,538,359 40,725,064
NOTES TO THE FINANCIAL STATEMENTS [Contd.] Year ended 31 March 2018

Over
view
Man
agem
ent D
iscu
ssio
n an
d An
alys
isCo
rpor
ate
Stew
ards
hip
Fina
ncia
l Inf
orm
atio
nSu
pple
men
tary
Inf
orm
atio
n
Abans Finance PLC | Annual Report 2017/18 | 99
26. INTANGIBLE ASSETS 2018 2017 Rs. Rs. Cost Cost as at 01 April 53,967,404 44,381,555 Additions 1,391,598 9,585,849 As at 31 March 55,359,002 53,967,404
Amortisation & Impairment: As at 01 April 31,286,362 28,772,659 Amortisation Charge for the year 2,974,290 2,513,703 As at 31 March 34,260,652 31,286,362
Net book value: As at 31 March 21,098,350 22,681,042
Nature and Amortization Method Intangible Assets represent acquisition of computer software from third parties. These software are amortized over the estimated useful life of 10 years on a straight line basis. During the financial year, the Company acquired intangible assets (Computer Software) to the aggregate value of Rs.1,391,597 (2016/2017 - Rs.9,585,849).
27. PROPERTY, PLANT AND EQUIPMENT
27.1 Gross Carrying Amounts Balance Additions/ Disposals Balance As at Transfers As at 01.04.2017 31.03.2018 Cost Rs. Rs. Rs. Rs. Freehold Assets Land 28,094,075 - (3,153,982) 24,940,093 Furniture & Fittings 53,046,579 11,572,278 (45,030) 64,573,827 Office Equipment 21,930,506 4,045,369 (130,852) 25,845,023 Motor Vehicles 3,325,613 - - 3,325,613 Computer Hardware 45,654,654 12,072,870 - 57,727,524 Total Value of Depreciable Assets 152,051,427 27,690,517 (3,329,864) 176,412,080 Balance Charge Disposals Balance As at for the As at27.2 Depreciation 01.04.2017 Period 31.03.2018 Rs. Rs. Rs. Rs. Freehold Assets Furniture & Fittings 29,342,812 8,063,720 (45,030) 37,361,502 Office Equipment 9,650,975 2,443,025 (62,700) 12,031,300 Motor Vehicles 3,325,613 - - 3,325,613 Computer Hardware 23,888,354 10,163,451 - 34,051,805 66,207,754 20,670,196 (107,730) 86,770,220
NOTES TO THE FINANCIAL STATEMENTS [Contd.] Year ended 31 March 2018
Computer Software

Over
view
Man
agem
ent D
iscu
ssio
n an
d An
alys
isCo
rpor
ate
Stew
ards
hip
Fina
ncia
l Inf
orm
atio
nSu
pple
men
tary
Inf
orm
atio
n
Abans Finance PLC | Annual Report 2017/18 | 100
27.3 Net Book Values 2018 2017 Rs. Rs. At Cost Land 24,940,093 28,094,075 Furniture & Fittings 27,212,325 23,703,767 Office Equipment 13,813,723 12,279,531 Motor Vehicles - - Computer Hardware 23,675,719 21,766,300 Total Carrying Amount of Property, Plant & Equipment 89,641,860 85,843,673
27.4 The useful lives of the assets are estimated as follows; 2018 2017 Furniture & Fittings 3 - 8 Years 3 - 8 Years Office Equipment 8 Years 8 Years Motor Vehicles 8 Years 8 Years Computer Equipment 4 years 4 years 27.5 During the Financial year, the Company acquired Property, Plant & Equipment to the aggregate value of Rs. 27,690,516/- (2016/17- Rs.26,179,255/-) 27.6 Cost of fully depreciated assets of the company as at 31 March 2018 is Rs. 41,040,777/- (2016/17 - Rs. 34,591,434/-).
NOTES TO THE FINANCIAL STATEMENTS [Contd.] Year ended 31 March 2018

Over
view
Man
agem
ent D
iscu
ssio
n an
d An
alys
isCo
rpor
ate
Stew
ards
hip
Fina
ncia
l Inf
orm
atio
nSu
pple
men
tary
Inf
orm
atio
n
Abans Finance PLC | Annual Report 2017/18 | 101
NOTES TO THE FINANCIAL STATEMENTS [Contd.] Year ended 31 March 2018
28. D
EFER
RED
TAXA
TION
Defe
rred
Tax
Asse
ts, L
iabi
litie
s an
d In
com
e Ta
x re
late
s to
the
follo
win
gs
Sa
tem
ent o
f
Reco
gnin
zed
in S
tate
men
t of
Rec
ogni
zed
in S
tate
men
t of
F
inan
cial
Pos
ition
Oth
er C
ompr
ehen
sive
Inco
me
Prof
it or
Los
s
20
18
2017
20
18
2017
20
18
2017
Rs
. Rs
. Rs
. Rs
. Rs
. Rs
.
Defe
rred
Tax
Liab
ility
Capi
tal A
llow
ance
s fo
r Tax
Pur
pose
s
-Pro
perty
Pla
nt &
Equ
ipm
ent
10,2
68,5
83
8,9
00,8
67
- -
1,36
7,71
6 3
,493
,043
-Lea
sed
Asse
t 10
8,54
7,21
7 15
,953
,999
-
- 9
2,59
3,21
9 15
,953
,999
Defin
e Be
nefit
Pla
n- O
ther
Com
preh
ensi
ve In
com
e
- 55
8,54
0 (5
58,5
40)
558,
540
- -
11
8,81
5,80
0
25,4
13,4
05
(558
,540
) 55
8,54
0 93
,960
,935
19
,447
,042
De
ferre
d Ta
x As
sets
Capi
tal A
llow
ance
s fo
r Tax
Pur
pose
s
-Lea
sed
Asse
t -
- -
- -
31,0
99,8
22
De
fined
Ben
efit
Plan
s- In
com
e St
atem
ent
(5,5
04,9
04)
(4,7
97,2
69)
- -
(707
,635
) (9
57,6
66)
Defin
e Be
nefit
Pla
n- O
ther
Com
preh
ensi
ve In
com
e 2
09,3
43
- 2
09,3
43
430,
211
- -
Pr
ovis
ion
for I
mpa
irmen
t on
Fina
ncia
l Ass
ets
(1
08,6
07,9
25)
(78,
416,
461)
-
- (3
0,19
1,46
5)
(46,
958,
736)
Br
ough
t For
war
d Ta
x Lo
sses
(5
7,49
8,47
9)
- -
- (5
7,49
8,47
9)
-
(171
,401
,966
) (8
3,21
3,72
9)
209,
343
430,
211
(88,
397,
579)
(1
6,81
6,58
0)
De
fferre
d in
com
e ta
x ch
arge
/ (re
vers
al)
- -
(349
,197
) 98
8,75
1 5,
563,
356
2,63
0,46
2
N
et D
effe
rred
Tax
Liab
ility
/ (A
sset
) (5
2,58
6,16
6)
(57,
800,
324)
29.
DUE
TO B
ANKS
20
18
2017
Rs
. Rs
.
Bank
Ove
rdra
fts
8,65
8,86
1
12,3
50,0
88
Se
curit
ised
Bor
row
ings
and
Oth
er B
ank
Faci
litie
s (N
ote
29.2
(a),
29.2
(b))
2
09,7
22,1
65
201
,388
,832
To
tal
218
,381
,026
2
13,7
38,9
20

Over
view
Man
agem
ent D
iscu
ssio
n an
d An
alys
isCo
rpor
ate
Stew
ards
hip
Fina
ncia
l Inf
orm
atio
nSu
pple
men
tary
Inf
orm
atio
n
Abans Finance PLC | Annual Report 2017/18 | 102
NOTES TO THE FINANCIAL STATEMENTS [Contd.] Year ended 31 March 2018
29.
DUE
TO B
ANKS
(Con
td…
)
29.1
Due
to B
anks
Amou
nt
repa
yable
wi
thin
1 ye
ar
Amou
nt
repa
yable
aft
er 1
year
Total
Amou
nt
repa
yable
wi
thin
1 ye
ar
Amou
nt
repa
yable
aft
er 1
year
Total
Rs.
Rs.
Rs.
Rs.
Rs.
Rs.
Secu
ritis
ed B
orro
wing
s an
d Ot
her B
ank
Faci
litie
s10
3,333
,333
10
6,388
,832
20
9,722
,165
83
,333,3
33
118,0
55,49
9
201,3
88,83
2
103,3
33,33
3
106,3
88,83
220
9,722
,165
83
,333,3
33
118,0
55,49
9
201,3
88,83
2
29.2
(a)
As at
Loan
sInt
eres
t As
at
Perio
dSe
curit
y01
.04.
2017
Obtai
ned
Reco
gnize
dCa
pital
Inter
est
31.0
3.20
18Rs
.Rs
.Rs
.Rs
.Rs
.Rs
.Di
rect
Ban
k Bo
rrowi
ngs
Term
Loan
sTe
rm Lo
an 02
Unio
n Ba
nk of
Colo
mbo
PLC
201,3
88,83
2
- 20
,182,4
95
83,33
3,333
20
,182,4
95
118,0
55,49
8
36 M
onth
sLe
ase
Portf
olio
Term
Loan
Sey
lan B
ank P
LC-
100,0
00,00
05,5
36,32
9
8,333
,333
5,5
36,32
8
91,66
6,667
60
Mon
ths
Leas
e Po
rtfoli
o20
1,388
,832
10
0,000
,000
25,71
8,824
91
,666,6
66
25,71
8,823
20
9,722
,165
29.2
(b)
As at
Loan
sInt
eres
t As
at
Perio
dSe
curit
y01
.04.
2016
Obtai
ned
Reco
gnize
dCa
pital
Inter
est
31.0
3.20
17Rs
.Rs
.Rs
.Rs
.Rs
.Rs
.Di
rect
Ban
k Bo
rrowi
ngs
Term
Loan
sTe
rm Lo
an B
ank o
f Cey
lon49
2,203
-
- 48
6,112
6,0
91
- 48
Mon
ths
Term
Loan
01 U
nion
Bank
of C
olom
bo P
LC15
,757,9
50
- 32
4,377
15
,757,9
50
324,3
77
- 48
Mon
ths
Term
Loan
Sam
path
Ban
k PLC
9,000
,000
-
453,6
70
9,000
,000
45
3,670
-
50 M
onth
sTe
rm Lo
an 02
Unio
n Ba
nk of
Colo
mbo
PLC
- 25
0,000
,000
16
,698,3
82
48,61
1,111
16
,698,4
39
201,3
88,83
2
36 M
onth
sLe
ase
Portf
olio
25,25
0,154
25
0,000
,000
17
,476,4
30
73,85
5,173
17
,482,5
79
201,3
88,83
2
2017
2018
Repa
ymen
ts
Repa
ymen
ts
Secu
ritis
ed B
orro
wing
s an
d Ot
her B
ank
Facil
ities
Secu
ritis
ed B
orro
wing
s an
d Ot
her B
ank
Facil
ities
Leas
e &
Hire
Purc
hase
Portf
olio
103,3
33,33
310
6,388
,832
209,7
22,16
510
3,333
,333
106,3
88,83
220
9,722
,165
Amou
ntre
paya
blewi
thin
1ye
ar
Amou
ntre
paya
bleaftff
er1
year
Total
Rs.
Rs.
Rs.
2018
Asat
31.0
3.20
18Rs
.
118,0
55,49
891
,666,6
6720
9,722
,165

Over
view
Man
agem
ent D
iscu
ssio
n an
d An
alys
isCo
rpor
ate
Stew
ards
hip
Fina
ncia
l Inf
orm
atio
nSu
pple
men
tary
Inf
orm
atio
n
Abans Finance PLC | Annual Report 2017/18 | 103
NOTES TO THE FINANCIAL STATEMENTS [Contd.] Year ended 31 March 2018
2018 201730. DUE TO CUSTOMERS Rs. Rs.
Fixed Deposits 6,583,032,884 5,527,707,069 Savings Deposits 32,126,483 22,845,476 6,615,159,367 5,550,552,545
31. OTHER FINANCIAL LIABILITIES 2018 2017 Rs. Rs. Trade Payables - Related Parties (31.1) 146,161,587 218,443,576 Non Trade Payables - Related Parties (31.2) 1,764,979 1,012,476 Trade Payables - Other Parties 133,005,500 32,953,866 Accrued Expenses 244,346,910 230,239,623 525,278,976 482,649,541
31.1 Trade Payables to Related Parties Relationship Abans PLC Ultimate Parent Company 2,549,551 1,590,488 Abans Auto (Pvt)Ltd Affiliate Company 143,612,036 216,853,088 146,161,587 218,443,576
31.2 Non Trade Payables to Related Parties Relationship Abans PLC Ultimate Parent Company 941,649 - Abans Retail (Pvt) Ltd Affiliate Company 211,224 - Abans Graphics (Pvt) Ltd Affiliate Company 61,582 - Abans Environmental Services Affiliate Company 184,425 201,825 ABS Gardner Dixon Hall International (Pvt) Ltd Affiliate Company 4,317 - AB Securitas (Pvt) Ltd Affiliate Company 256,197 697,951 AB Logistics (Pvt) Ltd Affiliate Company 835 - ABS Courier (Pvt) Ltd Affiliate Company 104,750 112,700 1,764,979 1,012,476
32. OTHER NON FINANCIAL LIABILITIES 2018 2017 Rs. Rs.
VAT on Financial Services 4,881,309 4,547,099 VAT Payable 300,661 1,785,335 Others 6,882,067 7,529,940 12,064,037 13,862,374 33. RETIREMENT BENEFIT OBLIGATIONS 2018 2017 Retirement Benefit Obligations - Gratuity Rs. Rs. Balance at the beginning of the year 15,138,320 15,249,338 Current Service Cost 3,775,577 2,754,035 Payments made during the year (3,140,600) (1,046,300) Interest Charged/(Reversed) for the year 1,892,290 1,712,501 (Gain)/loss arising from changes in the assumption 1,247,133 (3,531,254) Balance at the end of the year 18,912,720 15,138,320
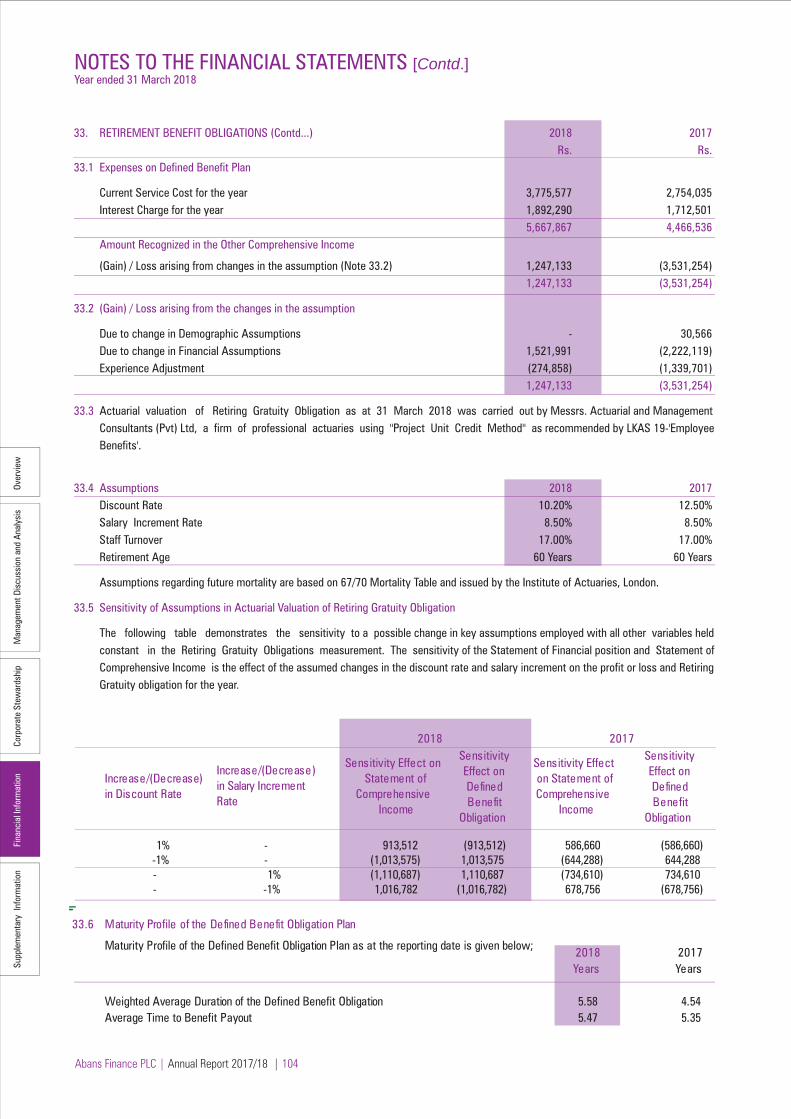
Over
view
Man
agem
ent D
iscu
ssio
n an
d An
alys
isCo
rpor
ate
Stew
ards
hip
Fina
ncia
l Inf
orm
atio
nSu
pple
men
tary
Inf
orm
atio
n
Abans Finance PLC | Annual Report 2017/18 | 104
NOTES TO THE FINANCIAL STATEMENTS [Contd.] Year ended 31 March 2018
33. RETIREMENT BENEFIT OBLIGATIONS (Contd...) 2018 2017 Rs. Rs. 33.1 Expenses on Defined Benefit Plan Current Service Cost for the year 3,775,577 2,754,035 Interest Charge for the year 1,892,290 1,712,501 5,667,867 4,466,536 Amount Recognized in the Other Comprehensive Income
(Gain) / Loss arising from changes in the assumption (Note 33.2) 1,247,133 (3,531,254) 1,247,133 (3,531,254)
33.2 (Gain) / Loss arising from the changes in the assumption Due to change in Demographic Assumptions - 30,566 Due to change in Financial Assumptions 1,521,991 (2,222,119) Experience Adjustment (274,858) (1,339,701) 1,247,133 (3,531,254)
33.3 Actuarial valuation of Retiring Gratuity Obligation as at 31 March 2018 was carried out by Messrs. Actuarial and Management Consultants (Pvt) Ltd, a firm of professional actuaries using "Project Unit Credit Method'' as recommended by LKAS 19-'Employee Benefits'. 33.4 Assumptions 2018 2017 Discount Rate 10.20% 12.50% Salary Increment Rate 8.50% 8.50% Staff Turnover 17.00% 17.00% Retirement Age 60 Years 60 Years Assumptions regarding future mortality are based on 67/70 Mortality Table and issued by the Institute of Actuaries, London. 33.5 Sensitivity of Assumptions in Actuarial Valuation of Retiring Gratuity Obligation The following table demonstrates the sensitivity to a possible change in key assumptions employed with all other variables held constant in the Retiring Gratuity Obligations measurement. The sensitivity of the Statement of Financial position and Statement of Comprehensive Income is the effect of the assumed changes in the discount rate and salary increment on the profit or loss and Retiring Gratuity obligation for the year.
Increase/(Decrease)in Discount Rate
Increase/(Decrease) in Salary Increment Rate
Sensitivity Effect on Statement of
Comprehensive Income
Sensitivity Effect on Defined Benefit
Obligation
Sensitivity Effect on Statement of Comprehensive
Income
Sensitivity Effect on Defined Benefit
Obligation
1% - 913,512 (913,512) 586,660 (586,660) -1% - (1,013,575) 1,013,575 (644,288) 644,288 - 1% (1,110,687) 1,110,687 (734,610) 734,610 - -1% 1,016,782 (1,016,782) 678,756 (678,756)
33.6 Maturity Profile of the Defined Benefit Obligation Plan
Maturity Profile of the Defined Benefit Obligation Plan as at the reporting date is given below; 2018 2017Years Years
Weighted Average Duration of the Defined Benefit Obligation 5.58 4.54Average Time to Benefit Payout 5.47 5.35
20172018

Over
view
Man
agem
ent D
iscu
ssio
n an
d An
alys
isCo
rpor
ate
Stew
ards
hip
Fina
ncia
l Inf
orm
atio
nSu
pple
men
tary
Inf
orm
atio
n
Abans Finance PLC | Annual Report 2017/18 | 105
NOTES TO THE FINANCIAL STATEMENTS [Contd.] Year ended 31 March 2018
33. RETIREMENT BENEFIT OBLIGATIONS (Contd...) 33.7 Distribution of Defined Benefit Obligation Over Future Lifetime The following table demonstrates distribution of the future working lifetime of the Defined Benefit Obligation as at the reporting period. 2018 2017 Rs. Rs. Less than 1 year 2,855,665 3,944,830 Between 1-5 years 8,330,035 6,416,140 Between 5-10 years 3,957,007 2,793,136 Over 10 years 3,770,013 1,984,214 18,912,720 15,138,319
34. STATED CAPITAL 34.1 Issued and Fully No. of Shares Rs. No. of Shares Rs. Paid-Ordinary shares At the beginning of the year 55,467,978 844,073,080 37,000,000 382,373,630 Issued during the year -Right Issue 11,093,595 277,339,875 7,400,000 185,000,000 -Private Placement - - 11,067,978 276,699,450 At the end of the year 66,561,573 1,121,412,955 55,467,978 844,073,080 During the year, the authorised share capital was increased by Rs.277,339,875 by the issue of 11,093,595 ordinary shares by of Rs.25/= each by way of Right issue.
34.2 Rights of Shareholders The holders of ordinary shares confer their right to r eceive dividends as declared from time to time and are entitled to one vote per share at the meeting. All shares rank equally with regard to the Company's residual assets.
35. RETAINED EARNINGS AND OTHER RESERVES 2018 201735.1 Retained Earnings Rs. Rs. As at 01 April 276,925,848 169,597,476 Dividend Paid (13,312,315) - Profit /(Loss) for the Year 94,863,688 133,564,140 Other Comprehensive Income net of tax (897,936) 2,542,503 Transfers to Statutory Reserve Fund (18,972,738) (26,712,829) Direct Cost on Right Issue (631,142) (785,447) Direct Cost on Private Placement - (1,279,995) As at 31 March 337,975,406 276,925,848 Retained Earnings represents the undistributed earnings held by the Company to be used in the Company's operations. This could be used to absorb future possible losses or dividends payable.
35.2 Other Reserves Statutory Reserve Total Rs. Rs. As at 01 April 2017 89,266,829 89,266,829 Transfers to/(from) during the year 18,972,738 18,972,738 As at 31 March 2018 108,239,567 108,239,567 35.2.1 Statutory Reserve Fund The statutory reserve fund is maintained as required by Finance Companies (Capital Funds) Direction No.1 of 2003 issued by Central Bnak of Sri Lanka. As per the said Direction, every Registered Finance Company shall maintain a reserve fund, out of the net profit for each year after provisions for taxation and bad and doubtful debts. Accordingly 20% of the net profit for the year transferred to Reserve Fund as required by Section 3(b) ii of the said Direction.
2018 2017
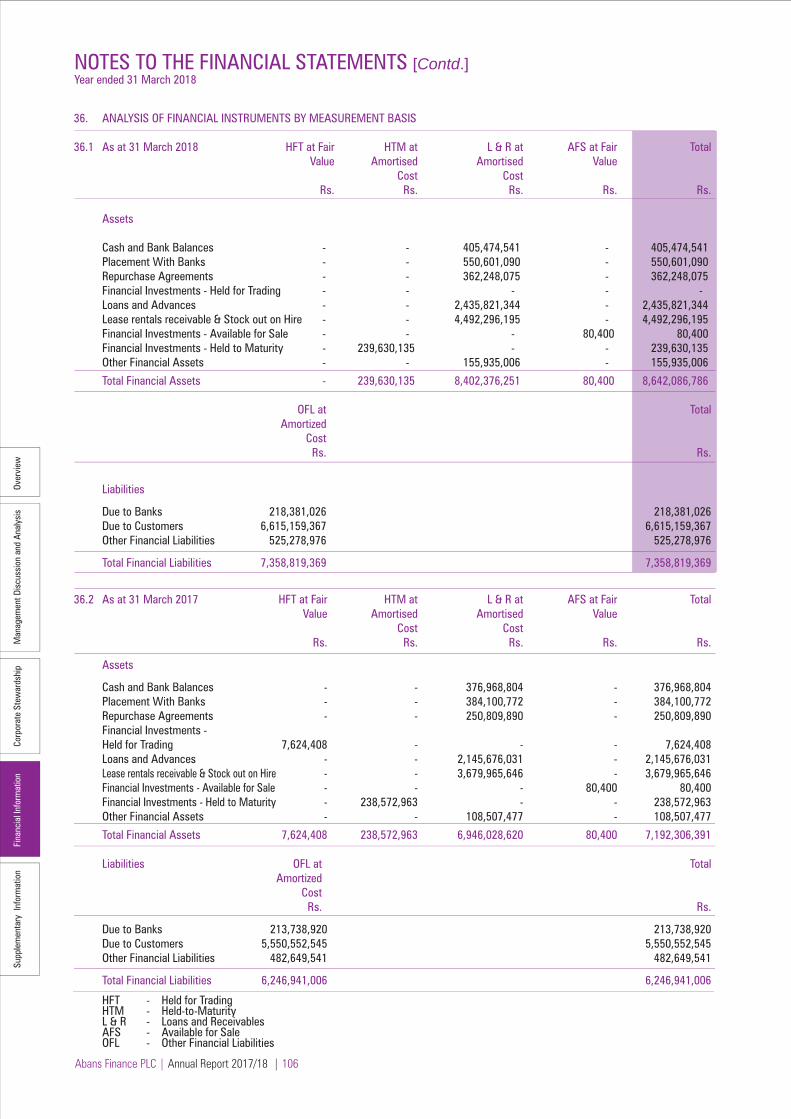
Over
view
Man
agem
ent D
iscu
ssio
n an
d An
alys
isCo
rpor
ate
Stew
ards
hip
Fina
ncia
l Inf
orm
atio
nSu
pple
men
tary
Inf
orm
atio
n
Abans Finance PLC | Annual Report 2017/18 | 106
36. ANALYSIS OF FINANCIAL INSTRUMENTS BY MEASUREMENT BASIS 36.1 As at 31 March 2018 HFT at Fair HTM at L & R at AFS at Fair Total Value Amortised Amortised Value Cost Cost Rs. Rs. Rs. Rs. Rs. Assets Cash and Bank Balances - - 405,474,541 - 405,474,541 Placement With Banks - - 550,601,090 - 550,601,090 Repurchase Agreements - - 362,248,075 - 362,248,075 Financial Investments - Held for Trading - - - - - Loans and Advances - - 2,435,821,344 - 2,435,821,344 Lease rentals receivable & Stock out on Hire - - 4,492,296,195 - 4,492,296,195 Financial Investments - Available for Sale - - - 80,400 80,400 Financial Investments - Held to Maturity - 239,630,135 - - 239,630,135 Other Financial Assets - - 155,935,006 - 155,935,006
Total Financial Assets - 239,630,135 8,402,376,251 80,400 8,642,086,786 OFL at Total Amortized Cost Rs. Rs.
Liabilities Due to Banks 218,381,026 218,381,026 Due to Customers 6,615,159,367 6,615,159,367 Other Financial Liabilities 525,278,976 525,278,976
Total Financial Liabilities 7,358,819,369 7,358,819,369
36.2 As at 31 March 2017 HFT at Fair HTM at L & R at AFS at Fair Total Value Amortised Amortised Value Cost Cost Rs. Rs. Rs. Rs. Rs. Assets Cash and Bank Balances - - 376,968,804 - 376,968,804 Placement With Banks - - 384,100,772 - 384,100,772 Repurchase Agreements - - 250,809,890 - 250,809,890 Financial Investments - Held for Trading 7,624,408 - - - 7,624,408 Loans and Advances - - 2,145,676,031 - 2,145,676,031 Lease rentals receivable & Stock out on Hire - - 3,679,965,646 - 3,679,965,646 Financial Investments - Available for Sale - - - 80,400 80,400 Financial Investments - Held to Maturity - 238,572,963 - - 238,572,963 Other Financial Assets - - 108,507,477 - 108,507,477
Total Financial Assets 7,624,408 238,572,963 6,946,028,620 80,400 7,192,306,391 Liabilities OFL at Total Amortized Cost Rs. Rs.
Due to Banks 213,738,920 213,738,920 Due to Customers 5,550,552,545 5,550,552,545 Other Financial Liabilities 482,649,541 482,649,541
Total Financial Liabilities 6,246,941,006 6,246,941,006
HFT - Held for Trading HTM - Held-to-Maturity L & R - Loans and Receivables AFS - Available for Sale OFL - Other Financial Liabilities
NOTES TO THE FINANCIAL STATEMENTS [Contd.] Year ended 31 March 2018

Over
view
Man
agem
ent D
iscu
ssio
n an
d An
alys
isCo
rpor
ate
Stew
ards
hip
Fina
ncia
l Inf
orm
atio
nSu
pple
men
tary
Inf
orm
atio
n
Abans Finance PLC | Annual Report 2017/18 | 107
NOTES TO THE FINANCIAL STATEMENTS [Contd.] Year ended 31 March 2018
37. FAIR VALUE OF FINANCIAL INSTRUMENTS
Financial Instruments Recorded at Fair Value The following is a description of how fair values are determined for financial instruments that are recorded at fair value using valuation techniques. These incorporate the Company’s estimate of assumptions that a market participant would make when valuing the financial instruments.
37.1 Determination of Fair Value and Fair Value Hierarchy
The Company uses the following hierarchy for determining and disclosing the fair value of financial instruments by Valuation techniques.
Level 1 : Quoted (unadjusted) prices in active markets for identical assets or liabilities in the active Market. Level 2 : Valuation technique using observerable inputs : Quoted prices for similar assets and liabilities in active markets or quoted prices for identical or similar assets and liabilities in active markets and are valued using models where all significant inputs are observable.
Level 3: Valuation techniques with significant unobservable inputs: assets and liabilities valued using valuation techniques where one or more significant inputs are unobservable.
Assets and Liabilities Measured at Fair Value - Fair Value Hierarchy The following table shows an analysis of financial instruments recorded at fair value by level of the fair value hierarchy in to which the fair value measurement is categorized.
As at 31 March 2018 Level 1 Level 2 Level 3 Total Rs. Rs. Rs. Rs. Financial Assets Financial Investments - Held for Trading Quoted equities - - - - Financial Investments - Available for Sale Unquoted equities - - 80,400 80,400 Total Financial Assets - - 80,400 80,400 As at 31 March 2017 Level 1 Level 2 Level 3 Total Rs. Rs. Rs. Rs. Financial Assets Financial Investments - Held for Trading Quoted equities 7,624,408 - - 7,624,408 Financial Investments - Available for Sale Unquoted equities - - 80,400 80,400 Total Financial Assets 7,624,408 - 80,400 7,704,808 There were no financial liabilities recorded at fair value as at 31 March 2017 & 2018. There were no transfers between Level 1 and Level 2 during 2017 & 2018.

Over
view
Man
agem
ent D
iscu
ssio
n an
d An
alys
isCo
rpor
ate
Stew
ards
hip
Fina
ncia
l Inf
orm
atio
nSu
pple
men
tary
Inf
orm
atio
n
Abans Finance PLC | Annual Report 2017/18 | 108
NOTES TO THE FINANCIAL STATEMENTS [Contd.] Year ended 31 March 2018
Fair
Value
201
820
17Fa
ir Va
lueFa
ir Va
lue
2
018
37.
FAIR
VAL
UE O
F FI
NAN
CIAL
INST
RUM
ENTS
(Con
td...
)
37.2
F
air V
alue
of F
inan
cial
Ass
ets
and
Liab
ilitie
s N
ot C
arrie
d at
Fai
r Val
ue
Set o
ut b
elow
is th
e co
mpa
rison
, by
clas
s, o
f the
car
ryin
g am
ount
s of
fair
valu
es o
f the
com
pany
's fin
anci
al in
stru
men
ts th
at a
re n
ot c
arrie
d at
Fai
r Val
ue in
the
Fina
ncia
l Sta
tem
ents
.
This
tabl
e do
es n
ot in
clud
e th
e Fa
ir Va
lues
of N
on- F
inan
cial
Ass
ets
and
Non
- Fin
anci
al L
iabi
litie
s.
Carry
ing
Amou
nt
Leve
l 01
Leve
l 02
Leve
l 03
Tota
l Ca
rryin
g Am
ount
Le
vel 0
1 Le
vel 0
2 Le
vel 0
3 To
tal
Rs.
Rs.
Rs.
Rs.
Rs.
Rs.
Rs.
Rs.
Rs.
Rs.
Fi
nanc
ial A
sset
s
Lo
ans
and
Adva
nces
2,
435,
821,
344
-
2,
019,
393,
934
-
2,
019,
393,
934
2
,145
,676
,031
-
1
,916
,636
,928
-
1
,916
,636
,928
Leas
e re
ntal
s re
ceiv
able
&
Sto
ck o
ut o
n Hi
re
4,4
92,2
96,1
95
-
3,4
45,9
27,7
36
-
3,44
5,92
7,73
6
3,6
79,9
65,6
46
-
3,3
69,1
88,7
48
-
3,36
9,18
8,74
8
Fina
ncia
l Inv
estm
ents
- Hel
d to
Mat
urity
23
9,63
0,13
5
-
240
,556
,351
-
24
0,55
6,35
1
238,
572,
963
-
2
36,8
53,5
01
-
236,
853,
501
7,1
67,7
47,6
74
-
5,7
05,8
78,0
21
-
5,70
5,87
8,02
1
6,0
64,2
14,6
40
-
5,5
22,6
79,1
77
-
5,5
22,6
79,1
77
Fi
nanc
ial L
iabi
litie
s
Due
to C
usto
mer
s 6,
615,
159,
367
-
6,
934,
668,
510
-
6,
934,
668,
510
5,
550,
552,
545
-
5
,835
,968
,390
-
5
,835
,968
,390
6,61
5,15
9,36
7
-
6,93
4,66
8,51
0
-
6,93
4,66
8,51
0
5,5
50,5
52,5
45
-
5,8
35,9
68,3
90
-
5,8
35,9
68,3
90
The
follo
win
g de
scrib
es th
e m
etho
dolo
gies
and
ass
umpt
ions
use
d to
det
erm
ine
the
fair
valu
es fo
r tho
se F
inan
cial
Ass
ets
& Li
abili
ties
whi
ch a
re n
ot a
lread
y re
cord
ed a
t fai
r val
ue in
the
Fina
ncia
l Sta
tem
ents
.
Fi
xed
Rate
Fin
anci
al In
stru
men
ts
Ca
rryin
g am
ount
s ar
e co
nsid
ered
as
fair
valu
es fo
r sho
rt te
rm c
redi
t fac
ilitie
s. A
ll cr
edit
faci
litie
s w
ith fi
xed
inte
rest
rate
s w
ere
fair
valu
ed u
sing
mar
ket r
ates
at w
hich
fres
h cr
edit
faci
litie
s w
ere
gran
ted
durin
g th
e la
st m
onth
of t
he re
porti
ng y
ear.
Conv
erse
ly, fi
xed
depo
sits
with
rem
aini
ng te
nors
abo
ve o
ne y
ear a
nd in
tere
st p
aid
at m
atur
ity w
ere
disc
ount
ed u
sing
cur
rent
mar
ket r
ates
offe
red
to c
usto
mer
s du
ring
the
last
mon
th o
f the
repo
rting
yea
r.
Asse
ts &
Lia
bilit
ies
for w
hich
Fai
r Val
ue A
ppro
xim
ates
Car
ryin
g Va
lue
Th
e Fo
llow
ing
is a
list
of f
inan
cial
inve
stm
ents
who
se c
arry
ing
amou
nt is
a re
ason
able
app
roxi
mat
ion
of fa
ir va
lue.
Bec
ause
for e
xam
ple,
they
are
sho
rt-te
rm in
nat
ure
or re
pric
e to
cur
rent
mar
ket r
ates
fre
quen
tly:
As
sets
Liab
ilitie
s
Ca
sh a
nd B
ank
Bala
nces
Due
to B
anks
Pl
acem
ent W
ith B
anks
Due
to C
usto
mer
s Sa
ving
s
Re
purc
hase
Agr
eem
ents
Debt
Inst
rum
ents
Issu
ed a
nd O
ther
bor
row
ed F
unds
Othe
r Fin
anci
al A
sset
s
Othe
r Fin
anci
al L
iabi
litie
s
Recl
assi
ficat
ion
of fi
nanc
ial a
sset
s
Th
ere
have
bee
n no
recl
assi
ficat
ions
dur
ing
2017
& 2
018.

Over
view
Man
agem
ent D
iscu
ssio
n an
d An
alys
isCo
rpor
ate
Stew
ards
hip
Fina
ncia
l Inf
orm
atio
nSu
pple
men
tary
Inf
orm
atio
n
Abans Finance PLC | Annual Report 2017/18 | 109
NOTES TO THE FINANCIAL STATEMENTS [Contd.] Year ended 31 March 2018
38. RISK MANAGEMENT DISCLOSURES 38.1 Introduction Risk is inherent in a financial business and such risks are managed through a process of ongoing identification, measurement and monitoring, subject to risk limits and other controls. This process of risk management is critical to the Company’s continuing profitability and each individual within the Company is accountable for the risk exposures relating to his or her responsibilities. The Company is exposed to credit risk, interest rate risk, liquidity risk, operational risk, the latter being subdivided into regulatory & compliance risk, reputation risk and environmental risk. The independent risk control process does not include business risks such as changes in the environment, technology and industry. The Company's policy is to monitor those business risks through the Company’s strategic planning process. 38.2 Risk Management Structure The Board is primarily responsible for risk management initiatives. Integrated Risk Management Committee (IRMC), which is a sub-committee of the Board has been established and delegated risk management responsibilities. This Committee plays a vital role in establishing best practices in relation to risk policies and practices within the company. The quantum and level of risks that the Company is willing to accept is decided at the IRMC level, and the decisions made by this Committee are communicated to the Board of Directors. The Board ratifies the risk policies and risk tolerance levels agreed at the Integrated Risk Management Committee meetings.
The Committee fulfils the requirement set out in the Finance Companies Direction No. 3 of 2008 on Corporate Governance issued by Central Bank of Sri Lanka (CBSL) under Finance Business Act No. 42 of 2011.
The Committee currently consists of 2 Directors; Managing Director and one Non Executive Director. Chief Executive Officer, Cheif Operating Officer, Chief Financial Officer / Accountant, Head of Sales, Head of Recoveries, Head of Branches, Manager - Risk & Compliance, Manager - IT and Manager - Corporate Affairs were also co-opted to the Committee. IRMC is supported by two sub committees such as Assets and Liabilities Committee (ALCO) and Credit Committee (CC). ALCO is entrusted with the identification and managing of Market Risk and Liquidity Risk where as CC is responsible for managing Assets Quality and credit policy of the Company. The Company’s policy is to ensure that risk management processes throughout the Company are audited by the Internal Audit function, which examines both the adequacy of the procedures and the Company’s compliance with the procedures. Internal Audit division discusses the results of all assessments with management, and reports its findings and recommendations to the Board Audit Committee. 38.3 Risk measurement & Reporting System and Risk Mitigation The positioning map of each risk component is placed within the risk grid. Tolerance levels are set by using sustainable measurements and these are discussed at risk management meetings. The risk console indicates the severity of each component of risk.
38.4 Credit Risk Credit risk refers to the risk that borrowers will default on any type of debt by failing to disruption to cash flows, and increased collection costs. The loss may be complete or partial and can arise in a number of circumstances to make payments they are obligated to do. The risk of loss of principal or loss of a financial reward stems from a borrower's failure to repay a loan or otherwise meet a contractual obligation. The risk is primarily that of the lender and includes lost principal and interest. Credit risk is closely tied to the potential return, the most notable being that the yields on portfolios correlate strongly to their perceived credit risk. The strategy of Company is not to eliminate risk, but to maintain the same within pre-determined acceptance levels. The Company manages and controls credit risk by setting limits on the amount of risk it is willing to accept for individual counterparties and for geographical and industry concentrations, and by monitoring exposures in relation to such limits.
38.4.1 Impairment Assessment For accounting purposes, the Company uses an incurred loss model for the recognition of losses on impaired financial assets. This means that losses can only be recognised when objective evidence of a specific loss event has been observed. Triggering events include the following:
- Significant financial difficulty of the customer - A breach of contract such as a default of payment - Where the Company grants the customer a concession due to the customer experiencing financial difficulty - It becomes probable that the customer will enter bankruptcy or encounter other financial difficulties - Observable data that suggests that there is a decrease in the estimated future cash flows from the loans
Over
view
Man
agem
ent D
iscu
ssio
n an
d An
alys
isCo
rpor
ate
Stew
ards
hip
Fina
ncia
l Inf
orm
atio
nSu
pple
men
tary
Inf
orm
atio
n
Abans Finance PLC | Annual Report 2017/18 | 110
NOTES TO THE FINANCIAL STATEMENTS [Contd.] Year ended 31 March 2018
Individually assessed allowances The Company determines the allowances appropriate for each individually significant Loans and Receivables on an individual basis, includ-ing any overdue payments of interests, credit rating down grades, or infringement of the original terms of the contract. Items considered when determining allowance amounts include the sustainability of the counterparty’s business plan, its ability to improve performance if it is in a financial difficulty, projected receipts and the expected payout should bankruptcy ensue, the availability of other financial support, the realizable value of collateral and the timing of the expected cash flows. Impairment allowances are evaluated at each reporting date, unless unforeseen circumstances require more careful attention.
Collectively assessed allowances Allowances are assessed collectively for losses on loans that are not individually significant and for individually significant loans and advances that have been assessed individually and found not to be impaired. Allowances are evaluated separately at each reporting date with each portfolio. The collective assessment is made for groups of assets with similar risk characteristics, in order to determine whether provision should be made due to incurred loss events for which there is objective evidence, but the effects of which are not yet evident in the individual loans assessments. The collective assessment takes account of data from the loan portfolio (such as historical losses on the portfolio, levels of arrears, credit utilization, loan to collateral ratios and expected receipts and recoveries once impaired) or economic data (such as current economic conditions, unemployment levels and local or industry–specific problems).

Over
view
Man
agem
ent D
iscu
ssio
n an
d An
alys
isCo
rpor
ate
Stew
ards
hip
Fina
ncia
l Inf
orm
atio
nSu
pple
men
tary
Inf
orm
atio
n
Abans Finance PLC | Annual Report 2017/18 | 111
NOTES TO THE FINANCIAL STATEMENTS [Contd.] Year ended 31 March 2018
38.
RISK
MAN
AGEM
ENT
DISC
LOSU
RES
(Con
td…
)
38.4
CR
EDIT
RIS
K (C
ontd
...)
38
.4.2
Max
imum
Exp
osur
e to
Cre
dit r
isk
The
follo
win
g ta
ble
show
s th
e m
axim
um e
xpos
ure
to c
redi
t ris
k by
cla
ss o
f Fin
anci
al A
sset
and
the
valu
e of
Fin
anci
al A
sset
s co
vere
d by
the
colla
tera
l.
Ty
pe o
f Col
late
ral
Max
imum
F
air V
alue
of C
olla
tera
l Hel
d
Tota
l N
et
Ex
posu
re to
Ca
sh /
Nea
r Pr
oper
ty
Mov
eabl
e Ot
her*
* Co
llate
ral
Expo
sure
to
As a
t 31
Mar
ch 2
018
Cred
it Ri
sk
Cash
M
ortg
ages
As
sets
*
Valu
e Cr
edit
Risk
Ca
sh a
nd B
ank
Bala
nces
(Exc
ludi
ng c
ash
in h
and)
3
47,0
67,8
21
-
-
-
-
-
347,
067,
821
Pl
acem
ent W
ith B
anks
5
50,6
01,0
90
-
-
-
-
-
550,
601,
090
Re
purc
hase
Agr
eem
ents
3
62,2
48,0
75
-
-
-
-
-
362,
248,
075
Fi
nanc
ial I
nves
tmen
ts -
Held
for T
radi
ng
-
-
-
-
-
-
-
Loan
s an
d Ad
vanc
es
2,5
90,7
34,7
54
345,
764,
194
71
2,20
4,65
2
738
,862
,291
2,
994,
278
1,
799,
825,
415
79
0,90
9,33
9
Leas
e re
ntal
s re
ceiv
able
&
Sto
ck o
ut o
n hi
re
4,7
74,2
02,1
34
-
-
4,37
8,02
0,43
2
-
4,37
8,02
0,43
2
396,
181,
702
Fi
nanc
ial I
nves
tmen
ts -
Avai
labl
e fo
r Sal
e 8
0,40
0
-
-
-
-
-
80,4
00
Fina
ncia
l Inv
estm
ents
- He
ld to
Mat
urity
2
39,6
30,1
35
-
-
-
-
-
239,
630,
135
Ot
her F
inan
cial
Ass
ets
155
,935
,006
-
-
-
-
155,
935,
006
9,02
0,49
9,41
5
345,
764,
194
7
12,2
04,6
52
5,1
16,8
82,7
23
2,99
4,27
8
6,1
77,8
45,8
47
2,8
42,6
53,5
68
Type
of C
olla
tera
l M
axiu
m
F
air V
alue
of C
olla
tera
l Hel
d
Tota
l N
et
Ex
posu
re to
Ca
sh /
Nea
r Pr
oper
ty
Mov
eabl
e Ot
her*
* Co
llate
ral
Expo
sure
to
As a
t 31
Mar
ch 2
017
Cred
it Ri
sk
Cash
M
ortg
ages
As
sets
*
Valu
e Cr
edit
Risk
Ca
sh a
nd B
ank
Bala
nces
(Exc
ludi
ng c
ash
in h
and)
3
34,6
53,4
37
-
-
-
-
-
334,
653,
437
Pl
acem
ent W
ith B
anks
3
84,1
00,7
72
-
-
-
-
-
384,
100,
772
Re
purc
hase
Agr
eem
ents
2
50,8
09,8
90
-
-
-
-
-
250,
809,
890
Fi
nanc
ial I
nves
tmen
ts -
Held
for T
radi
ng
7,6
24,4
08
-
-
-
-
-
7,62
4,40
8
Loan
s an
d Ad
vanc
es
2,2
48,0
66,1
80
164,
754,
856
538,
541,
871
1,15
3,94
9,89
0 3,
313,
673
1,86
0,56
0,29
0
387,
505,
890
Le
ase
rent
als
rece
ivab
le &
Stoc
k ou
t on
Hire
3
,928
,657
,832
-
-
3,
694,
689,
732
-
3,69
4,68
9,73
2
233,
968,
100
Fi
nanc
ial I
nves
tmen
ts -
Avai
labl
e fo
r Sal
e 8
0,40
0
-
-
-
-
-
80,4
00
Fina
ncia
l Inv
estm
ents
- He
ld to
Mat
urity
2
38,5
72,9
63
-
-
-
-
-
238,
572,
963
Ot
her F
inan
cial
Ass
ets
108
,507
,477
-
-
-
-
-
10
8,50
7,47
7
7,
501,
073,
359
1
64,7
54,8
56
538,
541,
871
4
,848
,639
,622
3
,313
,673
5
,555
,250
,022
1
,945
,823
,337
*
Mov
able
ass
ets
incl
udes
abs
olut
e ow
ners
hip/
mor
tgag
e ov
er m
otor
veh
icle
s an
d M
achi
nerie
s &
Equi
pmen
ts.
**
Oth
er c
olla
tera
l inc
lude
s se
cure
d by
con
sum
er d
urab
les
& tit
le d
eed
trans
fers
(Rea
l Est
ate
Loan
s).
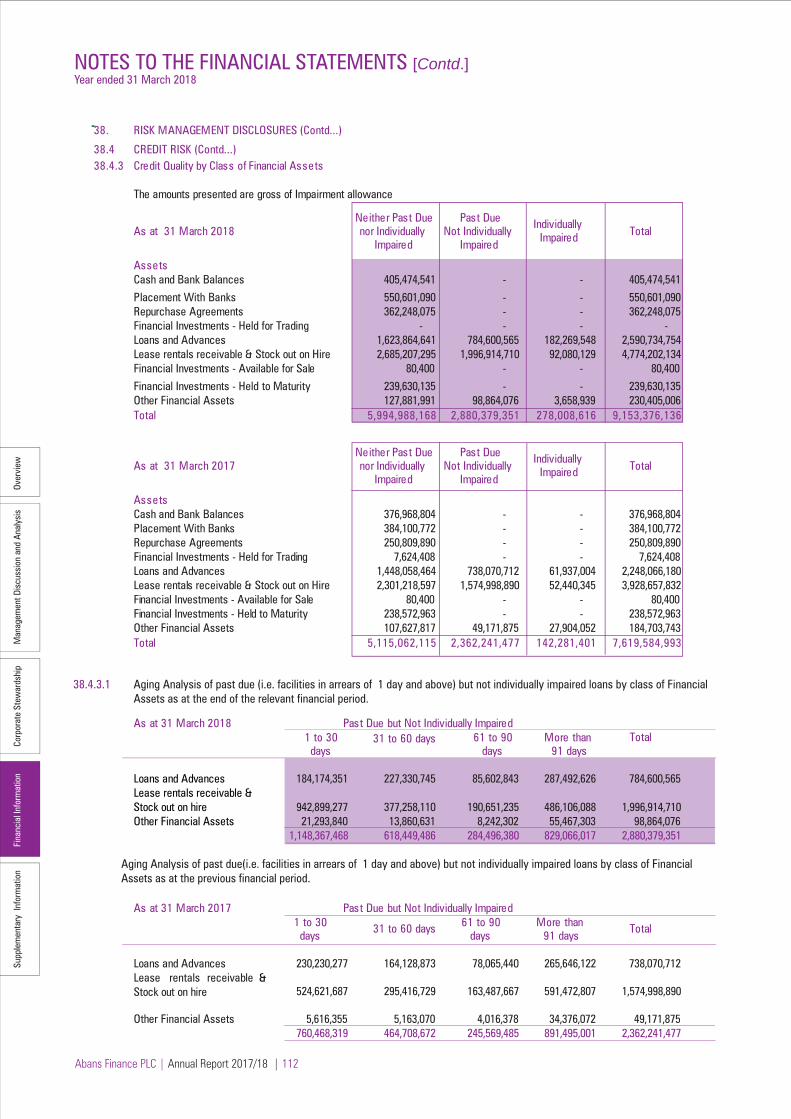
Over
view
Man
agem
ent D
iscu
ssio
n an
d An
alys
isCo
rpor
ate
Stew
ards
hip
Fina
ncia
l Inf
orm
atio
nSu
pple
men
tary
Inf
orm
atio
n
Abans Finance PLC | Annual Report 2017/18 | 112
NOTES TO THE FINANCIAL STATEMENTS [Contd.] Year ended 31 March 2018
38. RISK MANAGEMENT DISCLOSURES (Contd...)
38.4 CREDIT RISK (Contd...)38.4.3 Credit Quality by Class of Financial Assets
The amounts presented are gross of Impairment allowance
As at 31 March 2018Neither Past Due nor Individually
Impaired
Past Due Not Individually
Impaired
Individually Impaired Total
AssetsCash and Bank Balances 405,474,541 - - 405,474,541
Placement With Banks 550,601,090 - - 550,601,090 Repurchase Agreements 362,248,075 - - 362,248,075 Financial Investments - Held for Trading - - - - Loans and Advances 1,623,864,641 784,600,565 182,269,548 2,590,734,754 Lease rentals receivable & Stock out on Hire 2,685,207,295 1,996,914,710 92,080,129 4,774,202,134 Financial Investments - Available for Sale 80,400 - - 80,400
Financial Investments - Held to Maturity 239,630,135 - - 239,630,135 Other Financial Assets 127,881,991 98,864,076 3,658,939 230,405,006 Total 5,994,988,168 2,880,379,351 278,008,616 9,153,376,136
As at 31 March 2017Neither Past Due nor Individually
Impaired
Past Due Not Individually
Impaired
Individually Impaired Total
AssetsCash and Bank Balances 376,968,804 - - 376,968,804 Placement With Banks 384,100,772 - - 384,100,772 Repurchase Agreements 250,809,890 - - 250,809,890 Financial Investments - Held for Trading 7,624,408 - - 7,624,408 Loans and Advances 1,448,058,464 738,070,712 61,937,004 2,248,066,180 Lease rentals receivable & Stock out on Hire 2,301,218,597 1,574,998,890 52,440,345 3,928,657,832 Financial Investments - Available for Sale 80,400 - - 80,400 Financial Investments - Held to Maturity 238,572,963 - - 238,572,963 Other Financial Assets 107,627,817 49,171,875 27,904,052 184,703,743 Total 5,115,062,115 2,362,241,477 142,281,401 7,619,584,993
As at 31 March 20181 to 30
days 31 to 60 days 61 to 90
daysMore than
91 daysTotal
Loans and Advances 184,174,351 227,330,745 85,602,843 287,492,626 784,600,565
942,899,277 377,258,110 190,651,235 486,106,088 1,996,914,710 Other Financial Assets 21,293,840 13,860,631 8,242,302 55,467,303 98,864,076
1,148,367,468 618,449,486 284,496,380 829,066,017 2,880,379,351
As at 31 March 20171 to 30
days 31 to 60 days 61 to 90
daysMore than
91 daysTotal
Loans and Advances 230,230,277 164,128,873 78,065,440 265,646,122 738,070,712
524,621,687 295,416,729 163,487,667 591,472,807 1,574,998,890
Other Financial Assets 5,616,355 5,163,070 4,016,378 34,376,072 49,171,875 760,468,319 464,708,672 245,569,485 891,495,001 2,362,241,477
Past Due but Not Individually Impaired
Lease rentals receivable &Stock out on hire
Past Due but Not Individually Impaired
Lease rentals receivable & Stock out on hire
38.4.3.1 Aging Analysis of past due (i.e. facilities in arrears of 1 day and above) but not individually impaired loans by class of Financial Assets as at the end of the relevant financial period.
Aging Analysis of past due(i.e. facilities in arrears of 1 day and above) but not individually impaired loans by class of Financial Assets as at the previous financial period.

Over
view
Man
agem
ent D
iscu
ssio
n an
d An
alys
isCo
rpor
ate
Stew
ards
hip
Fina
ncia
l Inf
orm
atio
nSu
pple
men
tary
Inf
orm
atio
n
Abans Finance PLC | Annual Report 2017/18 | 113
NOTES TO THE FINANCIAL STATEMENTS [Contd.] Year ended 31 March 2018
38.
RISK
MAN
AGEM
ENT
DISC
LOSU
RES
(Con
td...
)
38
.4
CRED
IT R
ISK
(Con
td.)
38.4
.4
Anal
ysis
of R
isk
Conc
entra
tion
Th
e fo
llow
ing
tabl
e sh
ows
the
risk
conc
entra
tion
by s
ecto
r for
the
Fina
ncia
l Ass
ets
com
pone
nts
of th
e St
atem
ent o
f Fin
anci
al P
ositi
on.
As
at 3
1 M
arch
201
8
Cash
and
Secu
ritie
s Fi
nanc
ial
Bank
Pur
chas
ed
Inve
stm
ents
Leas
e re
ntals
Fi
nanc
ial
Fina
ncia
l
Purp
ose
wise
Bre
akdo
wn
Balan
ces
Plac
emen
t with
Un
der
Held
for
Loan
s an
d re
ceiva
ble
& In
vest
men
ts
Inve
sten
ts
Othe
r To
tal
Ba
nks
Repu
rcha
se
Trad
ing
Adva
nces
St
ock
out
Avai
lable
for
Held
to
Fina
ncia
l Fi
nanc
ial
Agre
emen
t
on
hire
Sa
le M
atur
ity
Asse
ts
Asse
ts
Rs
. Rs
. Rs
. Rs
. Rs
. Rs
. Rs
. Rs
. Rs
. Rs
.
Agric
ultu
re
- -
- -
5,81
3,59
0 2
,486
,914
-
- -
8,30
0,50
4
Man
ufac
turin
g -
- -
- 13
,429
,399
14
,225
,025
-
- -
27,6
54,4
24
Cons
truct
ion
- -
- -
223
,355
,601
28
,697
,661
-
- -
252,
053,
262
Fi
nanc
ial S
ervi
ces
405,
474,
541
550
,601
,090
-
- 12
,613
,593
1
,067
,655
80
,400
-
- 96
9,83
7,28
1
Trad
ing
- -
- -
58,9
61,8
37
9,11
0,87
9 -
- -
68,0
72,7
16
Gove
rnm
ent
- -
362,
248,
075
- -
- -
239,
630,
135
- 6
01,8
78,2
10
Hote
ls
- -
- -
514,
593
1,91
3,74
4 -
- -
2,4
28,3
36
Serv
ices
-
- -
- 69
6,88
7,61
2 4,
295,
546,
491
- -
- 4,
992,
434,
103
Ot
hers
-
- -
- 1,
424,
245,
119
139,
247,
826
- -
155,
935,
006
1,7
19,4
27,9
50
Tota
l 4
05,4
74,5
41
550,
601,
090
362,
248,
075
- 2,
435,
821,
344
4,49
2,29
6,19
5 80
,400
23
9,63
0,13
5 1
55,9
35,0
06
8,6
42,0
86,7
86
Secu
ritie
s Fi
nanc
ial
Cash
and
Purc
hase
d In
vest
men
ts
Le
ase
rent
als
Fina
ncia
l Fi
nanc
ial
Pu
rpos
e w
ise B
reak
dow
n Ba
nk
Plac
emen
t with
Un
der
Held
for
Loan
s an
d re
ceiva
ble
& In
vest
men
ts
Inve
sten
ts
Othe
r To
tal
Balan
ces
Bank
s Re
purc
hase
Tr
adin
g Ad
vanc
es
Stoc
k ou
t Av
ailab
le fo
r He
ld to
Fi
nanc
ial
Fina
ncia
l
Ag
reem
ent
on h
ire
Sale
Mat
urity
As
sets
As
sets
Rs.
Rs.
Rs.
Rs.
Rs.
Rs.
Rs.
Rs.
Rs.
Rs.
Ag
ricul
ture
-
- -
- 9,
353,
520
8,14
0,11
0 -
- -
17,4
93,6
30
Man
ufac
turin
g -
- -
1,54
7,82
5 1
8,26
3,45
7 21
,418
,890
-
- -
41,2
30,1
72
Cons
truct
ion
- -
- -
64,
300,
958
38,8
36,9
39
- -
- 10
3,13
7,89
7
Fina
ncia
l Ser
vice
s 3
76,9
68,8
04
384
,100
,772
-
2,92
2,80
0 12
,914
,651
2,
102,
489
80,4
00
- -
779,
089,
915
Tr
adin
g -
- -
39,0
00
68,7
12,6
64
13,
340,
777
- -
- 82
,092
,441
Go
vern
men
t -
- 25
0,80
9,89
0 -
- -
- 2
38,5
72,9
63
- 48
9,38
2,85
3
Hote
ls
- -
- 56
1,45
0 2,
116,
412
2,30
0,83
9 -
- -
4,97
8,70
1
Serv
ices
-
- -
1,18
3,58
7 85
3,33
8,32
8 3,
375,
019,
441
- -
- 4
,229
,541
,356
Ot
hers
-
- -
1,36
9,74
6 1,
116,
676,
042
218
,806
,161
-
- 10
8,50
7,47
7 1
,445
,359
,425
To
tal
376,
968,
804
384,
100,
772
250,
809,
890
7,62
4,40
8 2,
145,
676,
031
3,67
9,96
5,64
6 8
0,40
0 2
38,5
72,9
63
108
,507
,477
7
,192
,306
,391
As a
t 31
Mar
ch 2
017

Over
view
Man
agem
ent D
iscu
ssio
n an
d An
alys
isCo
rpor
ate
Stew
ards
hip
Fina
ncia
l Inf
orm
atio
nSu
pple
men
tary
Inf
orm
atio
n
Abans Finance PLC | Annual Report 2017/18 | 114
NOTES TO THE FINANCIAL STATEMENTS [Contd.] Year ended 31 March 2018
38. RISK MANAGEMENT DISCLOSURES (Contd...) 38.5 INTEREST RATE RISK Interest rate risk is a key constitute of the market risk exposure of the Company due to adverse and unanticipated movements in future interest rate which arises from core business activities; granting of credit facilities, accepting deposits and issuing debt instruments. Interest rate risk arises from the possibility that changes in interest rates will affect future cash flows and / or the fair values of financial instruments. Several factors give rise to interest rate risk; among these are term structure risk, which arises due to the mismatches in the maturities of assets and liabilities; basis risk which is the threat to income arises due to differences in the bases of interest rates. Excessive movements in market interest rate could result in severe volatility to company’s net interest income and net interest margin. Company’s exposure to interest rate risk is primarily associated with factors such as; - Reprising risk arising from a fixed rate borrowing portfolio where reprising frequency is different to that of the lending portfolio. - Yield curve risk arising from unanticipated shifts of the market yield curve. Assets and Liabilities Committee of the company is having the primary responsibility of managing the Interest Rate Risk. Interest rate risk is managed principally through minimizing interest rate sensitive asset liability gaps. In order to ensure interest rate margin and spreads are maintained, the Company conducts periodic reviews and re-prices its assets accordingly. 38.5.1 Interest Rate Sensitivity 38.5.1.1 The following table demonstrates the sensitivity to a reasonably possible change in interest rates, with all other variables held constant, of the Company's Profit or Loss and Equity.
Rs. Million Increase Sensitivity of Sensitivity of (Decrease) Profit or Loss Equity Borrowings/ Advance in basis points
2018 2018 2018 +100/ (-100) (2.01) / 2.01 (2.98) /2.98 Long Term Loans linked to AWPLR -LKR 2017 2017 2017
+100/ (-100) (1.41) / 1.41 (2.48) / 2.48
The base ratio considered in the Interset Rate Sensitivity Analysis is the AWPLR. Since 46% of total borrowings (excluding Due to Customers) are linked to AWPLR, the above Sensitivity ratio indicates the impact on Profit or Loss and Equity.

Over
view
Man
agem
ent D
iscu
ssio
n an
d An
alys
isCo
rpor
ate
Stew
ards
hip
Fina
ncia
l Inf
orm
atio
nSu
pple
men
tary
Inf
orm
atio
n
Abans Finance PLC | Annual Report 2017/18 | 115
NOTES TO THE FINANCIAL STATEMENTS [Contd.] Year ended 31 March 2018
38.
RISK
MAN
AGEM
ENT
DISC
LOSU
RES
(Con
td...
)
38
.5
INTE
REST
RAT
E RI
SK (
Cont
d...)
38
.5.2
In
tere
st R
ate
Risk
The
tabl
e be
low
ana
lyse
s th
e co
mpa
ny's
inte
rest
rate
risk
exp
osur
e on
Non
-trad
ing
Fina
ncia
l Ass
ets
& Li
abili
ties.
The
Com
pany
's As
sets
& L
iabi
litie
s ar
e in
clud
ed a
t car
ryin
g am
ount
cat
egor
ized
by th
e ea
rlier
of c
ontra
ctua
l rep
risin
g or
mat
urity
dat
es a
s at
the
end
of th
e re
leva
nt fi
nanc
ial p
erio
d.
Up to
03
Mon
ths
03-1
2 M
onth
s 01
-03
Year
s 03
-05
Year
s Ov
er 0
5 Ye
ars
Non
inte
rest
To
tal a
s at
be
arin
g 31
.03.
2018
AS
SETS
Rs
. Rs
. Rs
. Rs
. Rs
. Rs
. Rs
.
Ca
sh a
nd B
ank
Bala
nces
30
8,45
3,19
9 -
-
- -
97
,021
,342
4
05,4
74,5
41
Plac
emen
t with
Ban
ks
249
,673
,965
30
0,92
7,12
5 -
-
- -
550,
601,
090
Se
curit
ies
Purc
hase
d un
der
Re
purc
hase
Agr
eem
ent
362,
248,
075
-
- -
- -
362,
248,
075
Lo
ans
and
Adva
nces
71
9,31
0,73
1 1,
017,
147,
861
596,
602,
864
93,
720,
873
9,03
9,01
4 -
2,43
5,82
1,34
4
Leas
e re
ntal
s re
ceiv
able
&
St
ock
out o
n Hi
re
1,11
1,85
2,13
9 1
,478
,274
,878
1,
739,
581,
483
162,
503,
122
84,5
74
- 4
,492
,296
,195
Fi
nanc
ial I
nves
tmen
ts
Av
aila
ble
for S
ale
- -
- -
- 80
,400
80
,400
Fi
nanc
ial I
nves
tmen
ts
He
ld to
Mat
urity
2
16,7
14,8
91
3,18
1,75
1 6
,809
,827
12
,923
,665
-
- 2
39,6
30,1
35
Othe
r Fin
anci
al A
sset
s -
- -
- -
155
,935
,006
1
55,9
35,0
06
TO
TAL
ASSE
TS
2,9
68,2
53,0
00
2,79
9,53
1,61
5 2,
342,
994,
174
269,
147,
660
9,12
3,58
8 2
53,0
36,7
48
8,6
42,0
86,7
86
LIAB
ILIT
IES
Due
to B
anks
34
,492
,194
77
,500
,000
7
4,72
2,16
5
31,6
66,6
67
-
-
218,
381,
026
Du
e to
Cus
tom
ers
1,7
03,9
12,1
97
3,61
4,02
7,59
5
1,09
0,86
2,15
2
206
,357
,423
-
-
6
,615
,159
,367
Othe
r Fin
anci
al L
iabi
litie
s -
-
-
-
-
5
25,2
78,9
76
525
,278
,976
TO
TAL
LIAB
ILIT
IES
1
,738
,404
,391
3,
691,
527,
595
1
,165
,584
,317
23
8,02
4,09
0
-
525,
278,
976
7,
358,
819,
369
TO
TAL
INTE
REST
SEN
SITI
VITY
GAP
1,
229,
848,
609
(8
91,9
95,9
80)
1,17
7,40
9,85
7
31,1
23,5
70
9,1
23,5
88
(272
,242
,228
) 1
,283
,267
,417

Over
view
Man
agem
ent D
iscu
ssio
n an
d An
alys
isCo
rpor
ate
Stew
ards
hip
Fina
ncia
l Inf
orm
atio
nSu
pple
men
tary
Inf
orm
atio
n
Abans Finance PLC | Annual Report 2017/18 | 116
NOTES TO THE FINANCIAL STATEMENTS [Contd.] Year ended 31 March 2018
38.
RISK
MAN
AGEM
ENT
DISC
LOSU
RES
(Con
td...
)
38
.5
INTE
REST
RAT
E RI
SK (
Cont
d...)
38
.5.2
.1 I
nter
est R
ate
Risk
The
tabl
e be
low
ana
lyse
s th
e co
mpa
ny's
inte
rest
rate
risk
exp
osur
e on
Non
-trad
ing
Fina
ncia
l Ass
ets
& Li
abili
ties.
The
Com
pany
's As
sets
& L
iabi
litie
s ar
e in
clud
ed a
t car
ryin
g am
ount
cat
egor
ized
by th
e ea
rlier
of c
ontra
ctua
l rep
risin
g or
mat
urity
dat
es a
s at
the
end
of th
e pr
evio
us fi
nanc
ial p
erio
d.
Up to
03
Mon
ths
03-1
2 M
onth
s 01
-03
Year
s 03
-05
Year
s Ov
er 0
5 Ye
ars
Non
inte
rest
To
tal a
s at
be
arin
g 31
.03.
2017
AS
SETS
Rs
. Rs
. Rs
. Rs
. Rs
. Rs
. Rs
.
Ca
sh a
nd B
ank
Bala
nces
28
1,96
3,50
4 -
- -
- 95
,005
,300
3
76,9
68,8
04
Plac
emen
t with
Ban
ks
384
,048
,045
52
,727
-
- -
- 38
4,10
0,77
2
Secu
ritie
s Pu
rcha
sed
unde
r
Repu
rcha
se A
gree
men
t -
250,
809,
890
- -
- -
250,
809,
890
Lo
ans
and
Adva
nces
61
9,21
9,42
3 71
2,00
6,39
4 75
4,54
5,18
2 5
4,86
3,97
9 5,
041,
053
- 2,
145,
676,
031
Le
ase
rent
als
rece
ivab
le &
Stoc
k ou
t on
Hire
92
8,02
5,31
8 1
,342
,912
,059
1,
278,
980,
503
126,
697,
428
3,35
0,33
8 -
3,6
79,9
65,6
46
Fina
ncia
l Inv
estm
ents
Avai
labl
e fo
r Sal
e -
- -
- -
80,4
00
80,4
00
Fina
ncia
l Inv
estm
ents
Held
to M
atur
ity
- 21
6,32
1,78
0 3
,150
,104
19
,101
,079
-
- 2
38,5
72,9
63
Othe
r Fin
anci
al A
sset
s -
- -
- -
108
,507
,477
1
08,5
07,4
77
TO
TAL
ASSE
TS
2,2
13,2
56,2
90
2,52
2,10
2,85
0 2,
036,
675,
789
200,
662,
486
8,39
1,39
1 2
03,5
93,1
77
7,1
84,6
81,9
83
LIAB
ILIT
IES
Due
to B
anks
26
,238
,920
69
,444
,445
1
18,0
55,5
55
- -
-
21
3,73
8,92
0
Due
to C
usto
mer
s 1
,842
,797
,336
2,
522,
776,
498
1,07
6,82
8,41
8 1
08,1
50,2
93
-
-
5,5
50,5
52,5
45
Othe
r Fin
anci
al L
iabi
litie
s -
- -
- -
4
82,6
49,5
41
482
,649
,541
TO
TAL
LIAB
ILIT
IES
1
,869
,036
,256
2,
592,
220,
943
1,1
94,8
83,9
73
108,
150,
293
-
482,
649,
541
6,24
6,94
1,00
6
TO
TAL
INTE
REST
SEN
SITI
VITY
GAP
34
4,22
0,03
4 (7
0,11
8,09
3)
841,
791,
816
92
,512
,193
8,
391,
391
(279
,056
,364
) 9
37,7
40,9
77

Over
view
Man
agem
ent D
iscu
ssio
n an
d An
alys
isCo
rpor
ate
Stew
ards
hip
Fina
ncia
l Inf
orm
atio
nSu
pple
men
tary
Inf
orm
atio
n
Abans Finance PLC | Annual Report 2017/18 | 117
NOTES TO THE FINANCIAL STATEMENTS [Contd.] Year ended 31 March 2018
38. RISK MANAGEMENT DISCLOSURES (Contd...) 38.6 LIQUIDITY RISK Liquidity risk refers to the availability of sufficient cash balances to meet the demand on deposits and new lending targets as well as provide a flow of net liquid assets to meet contractual borrowings and other commitments. Liquidity risk is financial risk due to uncertain liquidity. An institution might lose liquidity if it experiences sudden unexpected cash outflows, or some other event causes counterparties to avoid trading with or lending to the institution. A firm is also exposed to liquidity risk if markets on which it depends are subject to loss of liquidity. The Company’s primary objective in liquidity risk management is to ensure adequate funding for its businesses throughout market cycles, including periods of financial stress. To achieve this objective the asset and liability management committee (ALCO) analyses and monitors liquidity risk, and maintains an adequate margin of safety in liquid assets. The Company maintains a portfolio of highly marketable and diverse assets that are assumed to be easily liquidated in the event of an unforeseen interruption of cash flow. The Company also has committed lines of credit that it can access to meet liquidity needs. In addition, the Company maintains the liquidity ratio prescribed by Central Bank of Sri Lanka.
38.6.1 Statutory Liquid Asset Ratio
As per the requirements of Finance companies (Liquid Assets) Direction No.4 of 2013 the Company has to maintain minimum liquid assets comprises of 10% of Time Deposits and Certificates of Deposits at the close of the business on such day and 15% of Savings Deposits at the close of the business on such day. In addition to the above, with effect from 01st July, 2014 the company needs to maintain 10% on Borrowings which are not included in the Tier –II capital base and borrowings which are not secured by mortgage of any assets. Further the Company has to maintain liquid assets in the form of Sri Lanka Government Securities not less than 7.5% of average month end total deposit liabilities and the above said borrowings of twelve months of the preceding financial year. The company maintained a healthy statutory liquid asset ratio throughout the year. The Company considers cash balances, Favorable Balances held with Commercial Banks on demand deposits, Placement with banks in the form of Time Deposits and Savings, Investment in Treasury Bills, Securities Purchased under Repurchase Agreement are considered as Liquid Assets for the purpose Statutory Liquid Asset Ratio calculation. Statutory Liquid Asset Ratio 2018 2017
Maximum 28.49% 29.31%
Minimum 19.25% 14.24%
Average 23.54% 23.62%
Closing 23.32% 21.81%
38.6.2 Advances to Deposits Ratio
The Company stresses the importance of maintaining an adequate Customer Deposit Base such as Time and Savings Deposits as sources of funds to finance Loans and Advances. They are monitored using the Advances to Deposits ratio which comprises accommodations to customers as a percentage of customer deposits. Advances to Deposits Ratio
2018 2017
Maximum 113.43% 109.53% Minimum 104.66% 97.76% Average 107.67% 102.68% Closing 104.73% 104.96%

Over
view
Man
agem
ent D
iscu
ssio
n an
d An
alys
isCo
rpor
ate
Stew
ards
hip
Fina
ncia
l Inf
orm
atio
nSu
pple
men
tary
Inf
orm
atio
n
Abans Finance PLC | Annual Report 2017/18 | 118
NOTES TO THE FINANCIAL STATEMENTS [Contd.] Year ended 31 March 2018
38.
RISK
MAN
AGEM
ENT
DISC
LOSU
RES
(Con
td...
)
38
.6.3
Co
ntra
ctua
l Mat
uriti
es o
f Und
isco
unte
d Ca
sh F
low
s of
Fin
anci
al A
sset
s &
Fina
ncia
l Lia
bilit
ies
38.6
.3.1
The
tabl
e be
low
ana
lyse
s th
e m
atur
ity p
rofil
e of
the
undi
scou
nted
cas
h flo
ws
of th
e Co
mpa
ny's
Fina
ncia
l Ass
ets
& Li
abili
ties
as a
t the
end
of r
elev
ant f
inan
cial
per
iod.
On D
eman
d
Up to
03
03-1
2 Ye
ars
0
1-03
Yea
rs
0
3-05
Yea
rs
Ove
r 05
Tot
al a
s at
M
onth
s
Year
s 31
.03.
2018
Rs.
Rs.
Rs.
Rs.
Rs.
Rs.
Rs.
AS
SETS
Ca
sh a
nd B
ank
Bala
nces
40
5,47
4,54
1 -
- -
- -
405
,474
,541
Pl
acem
ent w
ith B
anks
2
7,55
1,86
1 23
2,79
4,60
0 32
3,17
9,00
0 -
- -
583,
525,
461
Se
curit
ies
Purc
hase
d un
der
Re
purc
hase
Agr
eem
ent
212,
198,
793
151,
301,
849
- -
- -
363,
500,
642
Lo
ans
and
Adva
nces
27
0,95
1,08
5 57
6,46
5,76
7 1,
304,
074,
623
838,
366,
564
164,
136,
335
16,
277,
971
3,17
0,27
2,34
5
Leas
e re
ntal
s re
ceiv
able
&
St
ock
out o
n Hi
re
480,
270,
543
873
,925
,576
2,
031,
357,
134
2.60
0,18
7,87
5 27
5,25
0,11
6 1
55,6
92
6,2
61,1
46,9
36
Fina
ncia
l Inv
estm
ents
Avai
labl
e fo
r Sal
e -
- -
- -
80,4
00
80,4
00
Fina
ncia
l Inv
estm
ents
Held
to M
atur
ity
- 22
1,40
3,43
3 3
,165
,200
8,
000,
000
13,6
05,5
00
- 2
46,1
74,1
33
Othe
r Fin
anci
al A
sset
s 3
,404
,789
1
39,2
77,2
16
1,9
26,9
16
2,26
4,92
6 9,
061,
158
- 1
55,9
35,0
06
TOTA
L FI
NAN
CIAL
ASS
ETS
1,3
99,8
51,6
12
2,19
5,16
8,44
1 3,
663,
702,
873
3,44
8,81
9,36
5 46
2,05
3,10
9 1
6,51
4,06
3 1
1,18
6,10
9,46
4
LI
ABIL
ITIE
S &
EQUI
TY
Du
e to
Ban
ks
8,65
8,86
1 32
,451
,744
9
2,46
5,50
0 90
,650
,937
3
5,39
3,79
0
- 25
9,62
0,83
2
Due
to C
usto
mer
s 1
74,0
07,5
69
1,54
3,05
7,27
0 3,
786,
565,
290
1,1
70,5
59,3
15
247,
116,
696
-
6,9
21,3
06,1
40
Othe
r Fin
anci
al L
iabi
litie
s -
525
,278
,976
-
- -
-
525
,278
,976
TO
TAL
FIN
ANCI
AL L
IABI
LITI
ES
182
,666
,430
2,
100,
787,
990
3,8
79,0
30,7
90
1,26
1,21
0,25
2 28
2,51
0,48
6
- 7,
706,
205,
948
1,21
7,18
5,18
2 94
,380
,451
(2
15,3
27,9
17)
2,18
7,60
9,11
3 17
9,54
2,62
3 1
6,51
4,06
3 3
,479
,903
,516

Over
view
Man
agem
ent D
iscu
ssio
n an
d An
alys
isCo
rpor
ate
Stew
ards
hip
Fina
ncia
l Inf
orm
atio
nSu
pple
men
tary
Inf
orm
atio
n
Abans Finance PLC | Annual Report 2017/18 | 119
NOTES TO THE FINANCIAL STATEMENTS [Contd.] Year ended 31 March 2018
38.
RISK
MAN
AGEM
ENT
DISC
LOSU
RES
(Con
td...
)
38
.6.3
Co
ntra
ctua
l Mat
uriti
es o
f Und
isco
unte
d Ca
sh F
low
s of
Fin
anci
al A
sset
s &
Fina
ncia
l Lia
bilit
ies
38.6
.3.2
The
tabl
e be
low
ana
lyse
s th
e m
atur
ity p
rofil
e of
the
undi
scou
nted
cas
h flo
ws
of th
e Co
mpa
ny's
Fina
ncia
l Ass
ets
& Li
abili
ties
as a
t the
end
of p
revi
ous
finan
cial
per
iod.
On D
eman
d Up
to 0
3 03
-12
Year
s 01
-03
Year
s 03
-05
Year
s Ov
er 0
5 To
tal a
s at
M
onth
s
Year
s 31
.03.
2017
Rs.
Rs.
Rs.
Rs.
Rs.
Rs.
Rs.
AS
SETS
Ca
sh a
nd B
ank
Bala
nces
37
6,96
8,80
4 -
- -
- -
376
,968
,804
Pl
acem
ent w
ith B
anks
3
5,30
1,13
0 35
4,08
4,75
4 56
,298
-
- -
389,
442,
182
Se
curit
ies
Purc
hase
d un
der
Re
purc
hase
Agr
eem
ent
- -
276
,873
,626
-
- -
276,
873,
626
Fi
nanc
ial I
nves
tmen
ts -
Held
for T
radi
ng
7,62
4,40
8 -
- -
- -
7,62
4,40
8
Loan
s an
d Ad
vanc
es
213,
663,
189
489,
143,
368
920,
296,
880
1,09
2,18
0,44
0 10
1,37
7,42
0 8
,868
,958
2,
834,
530,
255
Le
ase
rent
als
rece
ivab
le &
Stoc
k ou
t on
Hire
42
9,89
3,24
3 7
02,6
58,0
53
1,80
3,26
7,91
3 1,
977,
295,
411
209,
086,
391
5,9
70,7
60
5,1
28,1
71,7
72
Fina
ncia
l Inv
estm
ents
Avai
labl
e fo
r Sal
e -
- -
- -
80,4
00
80,4
00
Fina
ncia
l Inv
estm
ents
Held
to M
atur
ity
- -
221
,415
,805
3,
165,
200
21,6
05,5
00
- 2
46,1
86,5
05
Othe
r Fin
anci
al A
sset
s -
108
,507
,477
-
- -
- 1
08,5
07,4
77
TO
TAL
FIN
ANCI
AL A
SSET
S 1
,063
,450
,774
1,
663,
393,
653
3,22
1,91
0,52
2 3,
072,
641,
051
332,
069,
312
14,
920,
118
9,3
68,3
85,4
29
LI
ABIL
ITIE
S &
EQUI
TY
Du
e to
Ban
ks
12,3
50,0
88
18,0
05,0
43
85,
692,
420
129,
104,
122
-
- 24
5,15
1,67
3
Due
to C
usto
mer
s 3
71,3
51,0
90
1,48
6,87
7,63
0 2,
631,
955,
350
1,1
40,8
35,7
12
117,
369,
730
-
5,7
48,3
89,5
12
Othe
r Fin
anci
al L
iabi
litie
s -
482
,649
,541
-
- -
-
482
,649
,541
TO
TAL
FIN
ANCI
AL L
IABI
LITI
ES
383
,701
,179
1,
987,
532,
214
2,7
17,6
47,7
69
1,26
9,93
9,83
4 11
7,36
9,73
0
- 6,
476,
190,
726
679,
749,
595
(324
,138
,561
) 50
4,26
2,75
3 1,
802,
701,
217
214,
699,
582
14,
920,
118
2,8
92,1
94,7
03
38.7
Op
erat
iona
l Ris
k
An o
pera
tiona
l ris
k is
the
risk
aris
ing
from
exe
cutio
n of
a c
ompa
ny's
busi
ness
func
tions
. The
con
cept
of o
pera
tiona
l ris
k is
bro
ad a
nd fo
cuse
s on
the
risks
aris
ing
from
the
peop
le,
syst
ems
and
proc
esse
s th
roug
h w
hich
a c
ompa
ny o
pera
tes.
It a
lso
incl
udes
oth
er c
ateg
orie
s s
uch
as fr
aud
risks
, reg
ulat
ory
and
com
plia
nce
risks
, rep
utat
ion
and
phys
ical
or
envi
ronm
enta
l ris
ks.

Over
view
Man
agem
ent D
iscu
ssio
n an
d An
alys
isCo
rpor
ate
Stew
ards
hip
Fina
ncia
l Inf
orm
atio
nSu
pple
men
tary
Inf
orm
atio
n
Abans Finance PLC | Annual Report 2017/18 | 120
NOTES TO THE FINANCIAL STATEMENTS [Contd.] Year ended 31 March 2018
39.
MAT
URIT
Y AN
ALYS
IS (C
ONTR
ACTU
AL)
39
.1
An a
naly
sis
of th
e To
tal A
sset
s em
ploy
ed a
nd T
otal
Lia
bilit
ies
at th
e ye
ar e
nd, b
ased
on
the
rem
aini
ng a
t the
dat
e of
the
Stat
emen
t of F
inan
cial
Pos
ition
to th
e re
spec
tive
cont
ract
ual m
atur
ity d
ates
are
give
n be
low
.
On D
eman
d Le
ss th
an
03-1
2 Ye
ars
01-0
3 Ye
ars
03-0
5 Ye
ars
Over
05
Tota
l as
at
03
Mon
ths
Ye
ars
31.0
3.20
18
Rs
. Rs
. Rs
. Rs
. Rs
. Rs
. Rs
.
AS
SETS
Ca
sh a
nd B
ank
Bala
nces
40
5,47
4,54
1 -
- -
- -
405,
474,
541
Pl
acem
ent W
ith B
anks
25
,176
,498
22
4,49
7,46
7 30
0,92
7,12
5 -
- -
550,
601,
090
Se
curit
ies
Purc
hase
d un
der
Re
purc
hase
Agr
eem
ent
212,
118,
596
150,
129,
479
- -
- -
362,
248,
075
Lo
ans
and
Adva
nces
25
6,43
4,36
4 46
2,87
6,36
8 1,
017,
147,
861
596,
602,
864
93,7
20,8
73
9,03
9,01
4 2,
435,
821,
344
Le
ase
rent
als
rece
ivab
le &
St
ock
out o
n Hi
re
446,
671,
205
665,
180,
933
1,47
8,27
4,87
8 1,
739,
581,
483
162,
503,
122
84,5
74
4,49
2,29
6,19
5
Fina
ncia
l Inv
estm
ents
Avai
labl
e fo
r Sal
e -
- -
- -
80,4
00
80,4
00
Fina
ncia
l Inv
estm
ents
He
ld to
Mat
urity
-
216,
714,
891
3,18
1,75
1 6,
809,
827
12,9
23,6
65
- 23
9,63
0,13
5
Othe
r Fin
anci
al A
sset
s 3,
404,
789
139,
277,
216
1,92
6,91
6 2,
264,
926
9,06
1,15
8 -
155,
935,
006
Re
al E
stat
e St
ock
- 5,
733,
860
20,7
65,0
00
31,5
50,8
15
- -
58,0
49,6
75
Othe
r Non
Fin
anci
al A
sset
s -
32,0
31,8
58
8,68
2,38
5 5,
704,
483
12,2
64,0
35
15,8
55,5
98
74,5
38,3
59
Tax
Reco
vera
ble
- -
19,4
22,8
58
- -
- 19
,422
,858
Pr
oper
ty, P
lant
& E
quip
men
t -
5,61
8,92
5 14
,994
,108
27
,010
,097
8,
304,
048
33,7
14,6
82
89,6
41,8
60
Inta
ngib
le A
sset
s -
743
,572
2,
230,
717
5,9
48,5
80
5,9
48,5
80
6,22
6,90
1 2
1,09
8,35
0
Defe
rred
Tax
Asse
ts
- -
- 52
,586
,166
-
- 52
,586
,166
TO
TAL
ASSE
TS
1,34
9,27
9,99
3 1,
902,
804,
569
2,86
7,55
3,60
1 2,
468,
059,
241
304,
725,
481
65,0
01,1
69
8,95
7,42
4,05
4
LI
ABIL
ITIE
S
Du
e to
Ban
ks
8,65
8,86
1 25
,833
,333
77
,500
,000
74
,722
,165
31
,666
,667
-
218,
381,
026
Du
e to
Cus
tom
ers
174,
571,
946
1,52
9,34
0,25
1 3,
614,
027,
595
1,09
0,86
2,15
2 20
6,35
7,42
3 -
6,61
5,15
9,36
7
Othe
r Fin
anci
al L
ibili
ties
- 5
25,2
78,9
76
- -
- -
525,
278,
976
Ot
her N
on F
inan
cial
Lia
bilit
ies
- 12
,064
,037
-
- -
- 12
,064
,037
Re
tirem
ent B
enef
it Li
abili
ty
- -
2,85
5,66
5 4,
815,
035
3,51
5,00
0 7,
727,
020
18,9
12,7
20
TO
TAL
LIAB
ILIT
IES
183,
230,
807
2,09
2,51
6,59
7 3,
694,
383,
260
1,17
0,39
9,35
2 24
1,53
9,09
0 7,
727,
020
7,38
9,79
6,12
6

Over
view
Man
agem
ent D
iscu
ssio
n an
d An
alys
isCo
rpor
ate
Stew
ards
hip
Fina
ncia
l Inf
orm
atio
nSu
pple
men
tary
Inf
orm
atio
n
Abans Finance PLC | Annual Report 2017/18 | 121
NOTES TO THE FINANCIAL STATEMENTS [Contd.] Year ended 31 March 2018
39.
RISK
MAN
AGEM
ENT
DISC
LOSU
RES
(Con
td...
)
39
.2
An a
naly
sis
of th
e To
tal A
sset
s em
ploy
ed a
nd T
otal
Lia
bilit
ies
at th
e ye
ar e
nd, b
ased
on
the
rem
aini
ng a
t the
end
of t
he p
revi
ous
finan
cial
per
iod
to th
e re
spec
tive
cont
ract
ual m
atur
ity d
ates
are
give
n be
low
On
Dem
and
Less
than
03
-12
Mon
ths
01-0
3 Ye
ars
03-0
5 Ye
ars
Over
05
Tota
l as
at
03
Mon
ths
Ye
ars
31.0
3.20
17
Rs
. Rs
. Rs
. Rs
. Rs
. Rs
. Rs
.
AS
SETS
Ca
sh a
nd B
ank
Bala
nces
37
6,96
8,80
4 -
- -
- -
376,
968,
804
Pl
acem
ent W
ith B
anks
35
,301
,130
34
8,74
6,91
5 52
,727
-
- -
384,
100,
772
Se
curit
ies
Purc
hase
d un
der
Re
purc
hase
Agr
eem
ent
- -
250,
809,
890
- -
- 25
0,80
9,89
0
Fina
ncia
l Inv
estm
ents
- He
ld fo
r Tra
ding
7,
624,
408
- -
- -
- 7,
624,
408
Lo
ans
and
Adva
nces
19
7,79
5,36
9 42
1,42
4,05
4 71
2,00
6,39
4 75
4,54
5,18
2 54
,863
,979
5,
041,
053
2,14
5,67
6,03
1
Leas
e re
ntal
s re
ceiv
able
&
St
ock
out o
n Hi
re
370,
612,
889
557,
412,
429
1,34
2,91
2,05
9 1,
278,
980,
503
126,
697,
428
3,35
0,33
8 3,
679,
965,
646
Fi
nanc
ial I
nves
tmen
ts -
Av
aila
ble
for S
ale
- -
- -
- 80
,400
80
,400
Fi
nanc
ial I
nves
tmen
ts -
He
ld to
Mat
urity
-
- 21
6,32
1,78
0 3,
150,
104
19,1
01,0
79
- 23
8,57
2,96
3
Othe
r Fin
anci
al A
sset
s -
108,
507,
477
- -
- -
108,
507,
477
Re
al E
stat
e St
ock
- -
12,1
66,8
78
32,5
32,5
00
21,3
51,3
15
- 66
,050
,693
Ot
her N
on F
inan
cial
Ass
ets
- 17
,415
,422
19
,654
,641
3,
318,
000
337,
000
- 40
,725
,064
Ta
x Re
cove
rabl
e -
- 20
,800
,270
-
- -
20,8
00,2
70
Prop
erty
, Pla
nt &
Equ
ipm
ent
- 4,
443,
823
12,6
39,5
97
25,4
95,7
13
8,82
3,72
8 34
,440
,811
85
,843
,673
In
tang
ible
Ass
ets
- 70
8,78
3 2,
126,
348
5,67
0,26
0 5,
670,
260
8,50
5,39
2 22
,681
,042
De
ferre
d Ta
x As
sets
-
- -
57,8
00,3
24
- -
57,8
00,3
24
TO
TAL
ASSE
TS
988,
302,
600
1,45
8,65
8,90
3 2,
589,
490,
584
2,16
1,49
2,58
6 23
6,84
4,79
0 51
,417
,994
7,
486,
207,
457
LI
ABIL
ITIE
S
Due
to B
anks
12
,350
,088
13
,888
,832
69
,444
,445
11
8,05
5,55
5 -
- 21
3,73
8,92
0
Due
to C
usto
mer
s 37
1,03
8,55
1 1,
471,
758,
785
2,52
2,77
6,49
8 1,
076,
828,
418
108,
150,
293
- 5,
550,
552,
545
Ot
her F
inan
cial
Lia
bilit
ies
- 48
2,64
9,54
1 -
- -
- 48
2,64
9,54
1
Othe
r Non
Fin
anci
al L
ibili
ties
- 13
,862
,374
-
- -
- 13
,862
,374
Re
tirem
ent B
enef
it Li
abili
ty
- -
3,94
4,83
0 2,
901,
140
3,51
5,00
0 4,
777,
350
15,1
38,3
20
TOTA
L LI
ABIL
ITIE
S 38
3,38
8,63
9 1,
982,
159,
532
2,59
6,16
5,77
3 1,
197,
785,
113
111,
665,
293
4,77
7,35
0 6,
275,
941,
700
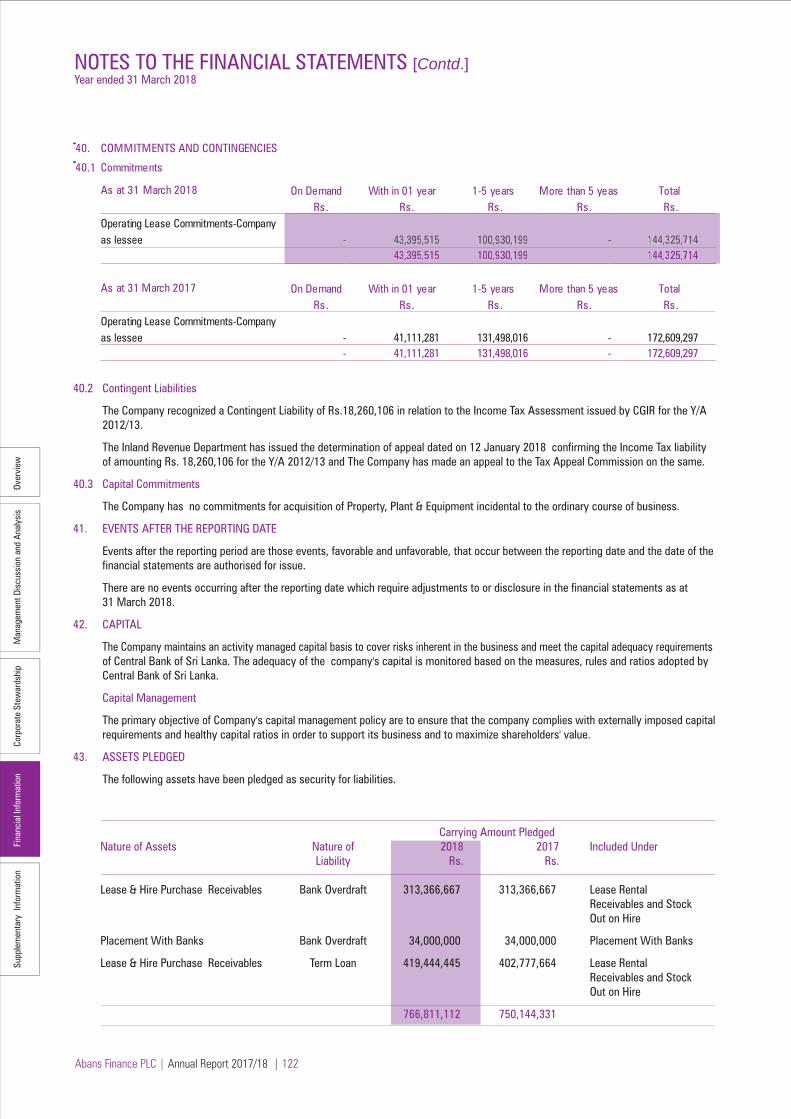
Over
view
Man
agem
ent D
iscu
ssio
n an
d An
alys
isCo
rpor
ate
Stew
ards
hip
Fina
ncia
l Inf
orm
atio
nSu
pple
men
tary
Inf
orm
atio
n
Abans Finance PLC | Annual Report 2017/18 | 122
NOTES TO THE FINANCIAL STATEMENTS [Contd.] Year ended 31 March 2018
40. COMMITMENTS AND CONTINGENCIES
40.1 Commitments
As at 31 March 2018 On Demand With in 01 year 1-5 years More than 5 yeas TotalRs. Rs. Rs. Rs. Rs.
- 43,395,515 100,930,199 - 144,325,714 - 43,395,515 100,930,199 - 144,325,714
As at 31 March 2017 On Demand With in 01 year 1-5 years More than 5 yeas TotalRs. Rs. Rs. Rs. Rs.
- 41,111,281 131,498,016 - 172,609,297 - 41,111,281 131,498,016 - 172,609,297
Operating Lease Commitments-Company as lessee
Operating Lease Commitments-Company as lessee
40.2 Contingent Liabilities
The Company recognized a Contingent Liability of Rs.18,260,106 in relation to the Income Tax Assessment issued by CGIR for the Y/A 2012/13.
The Inland Revenue Department has issued the determination of appeal dated on 12 January 2018 confirming the Income Tax liability of amounting Rs. 18,260,106 for the Y/A 2012/13 and The Company has made an appeal to the Tax Appeal Commission on the same. 40.3 Capital Commitments The Company has no commitments for acquisition of Property, Plant & Equipment incidental to the ordinary course of business. 41. EVENTS AFTER THE REPORTING DATE Events after the reporting period are those events, favorable and unfavorable, that occur between the reporting date and the date of the financial statements are authorised for issue. There are no events occurring after the reporting date which require adjustments to or disclosure in the financial statements as at 31 March 2018.
42. CAPITAL The Company maintains an activity managed capital basis to cover risks inherent in the business and meet the capital adequacy requirements of Central Bank of Sri Lanka. The adequacy of the company's capital is monitored based on the measures, rules and ratios adopted by Central Bank of Sri Lanka. Capital Management The primary objective of Company's capital management policy are to ensure that the company complies with externally imposed capital requirements and healthy capital ratios in order to support its business and to maximize shareholders' value. 43. ASSETS PLEDGED
The following assets have been pledged as security for liabilities.
Carrying Amount Pledged Nature of Assets Nature of 2018 2017 Included Under Liability Rs. Rs. Lease & Hire Purchase Receivables Bank Overdraft 313,366,667 313,366,667 Lease Rental Receivables and Stock Out on Hire
Placement With Banks Bank Overdraft 34,000,000 34,000,000 Placement With Banks Lease & Hire Purchase Receivables Term Loan 419,444,445 402,777,664 Lease Rental Receivables and Stock Out on Hire
766,811,112 750,144,331
- 43,395,515 100,930,199 - 144,325,714- 43,395,515 100,930,199 - 144,325,714

Over
view
Man
agem
ent D
iscu
ssio
n an
d An
alys
isCo
rpor
ate
Stew
ards
hip
Fina
ncia
l Inf
orm
atio
nSu
pple
men
tary
Inf
orm
atio
n
Abans Finance PLC | Annual Report 2017/18 | 123
NOTES TO THE FINANCIAL STATEMENTS [Contd.] Year ended 31 March 2018NOTES TO THE FINANCIAL STATEMENTS [Contd.] Year ended 31 March 2018
44.
FINA
NCIA
L RE
PORT
ING
BY S
EGM
ENT
Lea
sing
H
ire P
urch
ase
Team
Loa
ns
O
ther
s
To
tal
2018
20
17
2018
20
17
2018
20
17
2018
20
17
2018
20
17
Rs
. Rs
. Rs
. Rs
. Rs
. Rs
. Rs
. Rs
. Rs
. Rs
.
In
tere
st In
com
e 1
,042
,219
,905
90
4,57
6,21
1
4,82
4,28
7
20,0
46,9
54
519,
241,
078
45
3,94
6,29
6
145,
300,
438
11
6,10
4,23
5
1,71
1,58
5,70
7
1,49
4,67
3,69
6
Fee
Base
d In
com
e &
Ot
hers
1
78,4
62,9
64
87,4
68,3
21
349,
736
65
9,38
5
6,90
4,99
1
15,9
86,4
70
2,92
4,82
0
3,96
4,38
2
188,
642,
511
10
8,07
8,55
8
Unal
loca
ted
Inco
me
-
-
-
-
-
-
17,4
42,3
76
17,7
54,1
26
17,4
42,3
76
17,
754,
126
To
tal R
even
ue
1,2
20,6
82,8
69
992
,044
,532
5,
174,
023
20
,706
,339
52
6,14
6,06
9
469
,932
,766
1
65,6
67,6
34
137,
822,
743
1,
917,
670,
594
1
,620
,506
,380
Inte
rest
Exp
ense
s (4
42,7
01,5
00)
(355
,219
,827
) (3
,419
,295
) (7
,539
,007
) (2
50,1
02,2
72)
(166
,229
,062
) (1
17,3
71,1
71)
(94,
651,
865)
(8
13,5
94,2
38)
(623
,639
,761
)
Fee
Base
d Ex
pens
es
&
Othe
rs
(109
,785
,662
) (5
7,82
3,13
6)
-
-
(83,
910)
(2
15,7
08)
(33,
680,
907)
(2
6,70
8,40
8)
(143
,550
,479
) (8
4,74
7,25
2)
Impa
irmen
t Rev
ersa
l /
(P
rovi
sion
) (3
3,43
0,77
0)
(11,
746,
867)
21
2,83
6
11,6
19,7
04
(52,
519,
081)
(6
0,44
3,80
4)
(137
,365
,104
) (1
28,7
98,4
27)
(223
,102
,119
) (1
89,3
69,3
93)
Ne
t Ope
ratin
g In
com
e 6
34,7
64,9
36
567,
254,
703
1,
967,
564
24
,787
,037
22
3,44
0,80
6
243,
044,
191
(1
22,7
49,5
49)
(112
,335
,957
) 73
7,42
3,75
8
722,
749,
974
Un
allo
cate
d Ex
pens
es
(604
,474
,332
) (5
25,3
43,6
46)
Pr
ofits
/ (Lo
ss) b
efor
e Ta
x
13
2,94
9,42
6
197
,406
,328
Inco
me
Tax
expe
nses
(3
8,08
5,73
8)
(63,
842,
188)
Ne
t Pro
fit /(
Loss
) for
the
perio
d
9
4,86
3,68
8
133
,564
,140
Ot
her C
ompr
ehen
sive
Inco
me
(8
97,9
36)
2,54
2,50
3
Total
Com
prehe
nsive
Inco
me fo
r the
Year
93,9
65,7
52
136,
106,
643
Se
gmen
t Ass
ets
4,4
73,1
90,1
20
3,63
6,43
5,38
8
19,1
06,0
75
43,5
30,2
58
2,43
5,82
1,34
4
2,14
5,67
6,03
1
1,21
0,52
8,97
6
939
,534
,318
8
,138
,646
,515
6,
765,
175,
995
Un
allo
cate
d As
sets
81
8,77
7,53
9
721,
031,
462
To
tal A
sset
s 4
,473
,190
,120
3,
636,
435,
388
19
,106
,075
43
,530
,258
2,
435,
821,
344
2,
145,
676,
031
1,
210,
528,
976
9
39,5
34,3
18
8,95
7,42
4,05
4
7,48
6,20
7,45
7
Unal
loca
ted
Liab
ilitie
s
7,
389,
796,
126
6,
275,
941,
700
To
tal L
iabi
litie
s
7,
389,
796,
126
6,
275,
941,
700

Over
view
Man
agem
ent D
iscu
ssio
n an
d An
alys
isCo
rpor
ate
Stew
ards
hip
Fina
ncia
l Inf
orm
atio
nSu
pple
men
tary
Inf
orm
atio
n
Abans Finance PLC | Annual Report 2017/18 | 124
NOTES TO THE FINANCIAL STATEMENTS [Contd.] Year ended 31 March 2018
Compensation to Key Management Personnel 2018 2017 Rs. Rs.
Short Term Employee Benefits 19,206,890 24,630,698 Post-employment benefits 1,685,700 2,000,000
20,892,590 24,630,698 Other transactions with Key Management Personnel 2018 2017 Rs. Rs.
Fixed Deposits accepted during the year 40,300,000 2,310,130 Fixed Deposits held at the beginning of the year 493,126 1,231,212 Consultancy Fee paid during the year 2,594,592 4,450,600
In addition to the above, the Company has also provided non-cash benefits such as vehicle & fuel allowance to Key Management Personnel in line with the approved employment benefits of the Company. Loans and advances granted No loans or advances were given to Key Managerial Personnel and their close family members during the year.(2016/17- Nil).
45. RELATED PARTY TRANSACTIONS The Company carried out transactions with key management and their related concerns and other related entities in the ordinary course of its business on an arm’s length basis at commercial rates with the parties who are defined as Sri Lanka Accounting Standard No.24 Related party disclosure, details of which are reported below. such transactions is based on the assessment of risk and pricing model of the Company and is comparable with what is applied to transactions between the Company and its unrelated customers. Outstanding balances as at the year-end are unsecured, interest free, and due on demand. There have been no guarantees provided or received for any related party receivables or payables. Details of related party transactions during the year are as follows: 45.1 The Parent Abans PLC owns 49.67% (2017- 71.60%) shareholding of the Company. 45.2 The Ultimate Parent Abans International (Pvt) Ltd is the ultimate parent of Abans Finance PLC. 45.3 Transactions with Key Management Personnel According to Sri Lanka Accounting Standard-LKAS 24 (Related Party Disclosures), Key Management Personnel (KMP) are those having authority and responsibility for planning, directing and controlling the activities of the entity. According to the above definition a person cannot be considered as a KMP unless such person has both the authority and responsibility to carry out all of the three activities mentioned in the above definition (i.e. planning, directing and controlling the activities of the entity). Such KMPs include the Board of Directors of the Company and Chief Executive Officer (CEO). Other related parties include CFMs of the KMPs who are family members who may be expected to influence or be influenced by that KMP in their dealings with the entity.

Over
view
Man
agem
ent D
iscu
ssio
n an
d An
alys
isCo
rpor
ate
Stew
ards
hip
Fina
ncia
l Inf
orm
atio
nSu
pple
men
tary
Inf
orm
atio
n
Abans Finance PLC | Annual Report 2017/18 | 125
NOTES TO THE FINANCIAL STATEMENTS [Contd.] Year ended 31 March 2018
**Ot
her R
elate
d Pa
rties
inclu
de th
e foll
owing
com
panie
s
Aban
s Gra
phics
(Pvt
) Ltd
Ab
ans R
etail
(Pvt
) Ltd
Aban
s Mar
ketin
g (P
vt) L
td
Aban
s Elec
trica
ls PL
C (S
ervic
e Dep
artm
ent)
Ab
ans O
ffice
Aut
omat
ion (P
vt) L
td
AB C
reat
ion (P
vt) L
td
Ad
d Ou
tdoo
r Adv
ertis
ing (P
vt) L
td
ABS
Gard
iner D
ixon H
all In
tern
ation
al (P
vt) L
td
Ad
vant
age T
echn
ologie
s (Pv
t) Lt
d
Ab
ans E
nviro
nmen
t Ser
vices
(Pvt
) Ltd
AB Lo
gistic
s (Pv
t) Lt
d
AB S
ecur
itas (
Pvt)
Ltd
AB
S Co
urier
(Pvt
) Ltd
Ironw
ood
Inves
tmen
ts H
olding
s (Pv
t) Lt
d"O
ther
Rela
ted
Parti
es ar
e com
panie
s con
trolle
d / j
ointly
cont
rolle
d / s
ignific
antly
influ
ence
d by
Key
Man
agem
ent P
erso
nnel.
45.
RELA
TED
PART
Y TR
ANSA
CTIO
NS
(Con
td..)
45.4
Tr
ansa
ctio
ns w
ith e
ntiti
es th
at a
re c
ontro
lled,
join
tly c
ontro
lled
or s
igni
fican
tly in
fluen
ced
by K
ey M
anag
emen
t Pe
rson
nel o
r the
ir cl
ose
mem
ber o
f fam
ily, o
r sha
reho
lder
s w
ho h
ave
eith
er c
ontro
l,
si
gnifi
cant
influ
ence
s or
join
t con
trol o
ver e
ntity
.
Ab
ans P
LC
A
bans
Aut
o (Pv
t) Lt
d.
A
bans
Tour
s (Pv
t) Lt
d.
Aban
s Tra
nspo
rt (P
vt) L
td.
P
aren
t Com
pany
Affi
late C
ompa
ny
Affi
late C
ompa
ny
A
ffilat
e Com
pany
Oth
er R
elate
Par
ties*
*
Tot
al
20
18
2017
20
18
2017
20
18
2017
20
18
2017
20
18
2017
20
18
2017
Na
ture
of Tr
ansa
ction
Rs
. Rs
. Rs
. Rs
. Rs
. Rs
. Rs
. Rs
. Rs
. Rs
. Rs
. Rs
.
Fix
ed D
epos
its A
ccep
ted
du
ring
the
year
-
-
- -
- -
- -
21,0
00,0
00
266,
000,
000
21
,000
,000
26
6,00
0,00
0
Fixed
Depos
its hel
d at th
e end
of the
year
-
- -
-
149
,597
,908
35
0,14
8,23
2
149
,597
,908
3
50,1
48,2
32
As a
t 1 A
pril
19,4
21,3
82
20,5
93,2
49
(216
,853
,088
) (1
33,9
17,4
75)
50,
679,
120
-
18,1
26,2
80
- (1
,012
,476
) (4
07,7
55)
(129
,638
,783
) (1
13,7
31,9
81)
Pu
rcha
se of
Mot
or
Bi
kes -
Leas
e Gra
nting
-
-
(2,18
7,268
,840)
(2,0
96,1
01,7
72)
- -
- -
- - (
2187
,268
,840
) (2
,096
,101
,772
)
Colle
ction
s mad
e on
be
half o
f Aba
ns Fi
nanc
e 2
16,7
97,1
62
1,39
1,49
1,58
7 -
- -
- -
- -
- 21
6,79
7,16
2
1,3
91,4
91,5
87
Expe
nse o
n coll
ectio
n
com
miss
ion
(17,
402,
300)
(1
5,57
5,55
5)
- -
- -
- -
- -
(17,
402,
300)
(1
5,57
5,55
5)
Supp
ort S
ervic
es E
xpen
ses
- -
- -
- -
- -
(15,
012,
665)
(3
,480
,410
) (1
5,01
2,66
5)
(3,4
80,4
10)
Re
nt In
com
e Rec
ogniz
ed &
Expe
nse R
ecov
eries
4
,824
,426
9,
938,
041
- -
- -
- -
(844
,898
) (9
03,0
61)
3,97
9,52
8 9
,034
,980
Rent
Expe
nse P
aid
- -
-
- -
- -
- 63
3,67
3 1
,310
,816
63
3,67
3 1
,310
,816
Settl
emen
ts P
aid/(R
eceiv
ed)
(212
,397,1
89)
(1,38
7,025
,941)
2
,260
,509
,892
2
,013
,166
,159
-
- -
- 15
,413
,036
2,
467,
934
2,06
3,52
5,73
9 6
28,6
08,1
52
Facil
ities G
rant
ed an
d
Inter
est A
ccru
ed
- -
- -
4,41
7,89
6 55
,607
,635
2,
832,
428
20
,005
,047
-
- 7,
250,
324
75,
612,
682
Se
ttleme
nts re
ceived
for th
e faci
lities
- -
- -
(26,
683,
086)
(4
,928
,515
) (2
,874
,011
) (1
,878
,767
) -
- (2
9,55
7,09
7)
(6,8
07,2
82)
As
at 3
1 M
arch
11
,243
,480
19
,421
,382
(1
43,6
12,0
36)
(216
,853
,088
) 28
,413
,929
50
,679
,120
18
,084
,697
18
,126
,280
(8
23,3
30)
(1,0
12,4
76)
(86,
693,
258)
(1
29,6
38,7
83)
2018
20
17
Inc
luded
in
Rs.
Rs.
Lo
ans a
nd A
dvan
ces
11,7
32,0
99
10,8
28,2
84
Leas
e ren
tals
rece
ivable
& S
tock
out o
n hire
34,7
66,5
28
57,
977,
116
Ot
her F
inanc
ial A
sset
s
14
,734
,680
2
1,01
1,87
0
Othe
r Fina
ncial
Liab
ilities
(1
47,9
26,5
65)
(219
,456
,053
)
(8
6,69
3,25
8)
(129
,638
,783
)

Over
view
Man
agem
ent D
iscu
ssio
n an
d An
alys
isCo
rpor
ate
Stew
ards
hip
Fina
ncia
l Inf
orm
atio
nSu
pple
men
tary
Inf
orm
atio
n
Abans Finance PLC | Annual Report 2017/18 | 126
NOTES TO THE FINANCIAL STATEMENTS [Contd.] Year ended 31 March 2018
46. COMPARATIVE INFORMATION The following comparative figures have been reclassified in the Statement of Financial Position (2016/2017) to comply with the current year classification.
Other Financial Liabilities Previous Year Reclassified Current Year Classification Classification Trade Payables - Related Parties 218,443,576 - 218,443,576 Non Trade Payables - Related Parties - 1,012,476 1,012,476 Trade Payables - Other Parties 32,953,866 - 32,953,866 Accrued Expenses 231,252,099 (1,012,476) 230,239,623
482,649,541 - 482,649,541 Non Trade Payables to Related Parties Relationship Abans Environmental Services Affiliate Company - 201,825 201,825 AB Securitas (Pvt) Ltd Affiliate Company - 697,951 697,951 ABS Courier (Pvt) Ltd Affiliate Company - 112,700 112,700
- 1,012,476 1,012,476

Over
view
Man
agem
ent D
iscu
ssio
n an
d An
alys
isCo
rpor
ate
Stew
ards
hip
Fina
ncia
l Inf
orm
atio
nSu
pple
men
tary
Inf
orm
atio
n
Abans Finance PLC | Annual Report 2017/18 | 127
VALUE ADDITION
Financial Value Addition
For the year ended 31 March 2018 % 2017 % Rs.'000 Rs.'000 Value Added
Income earned by providing Financial Services 1,915,994 1,619,558 Cost of Services (1,222,925) (942,663) Value added by financial services 693,068 676,895 Net gain / (loss) from trading 1,677 948 Impairment (223,102) (189,369) Total Value Added 471,643 488,474 Value Allocated
Employees as Remuneration 256,395 54 217,089 44 Government as Taxes 96,740 21 119,161 24 Shareholders as Dividends 13,312 3 - - Retained within the Business
- As depreciation & amortization 23,644 5 18,661 4 - As reserves 81,551 17 133,564 27
Total Value Allocated 471,643 100 488,474 100
For the year Ended 31 March 2018 2017 Rs’000 Rs’000
Shareholders’ Funds 1,567,628 1,210,266 Accumulated Provision for Impairment chargers 511,289 427,279 2,078,917 1,637,544 Profit Attributable to: Shareholders 94,864 133,564 Add-Impairment Provision. 223,102 189,369 317,966 322,934 Economic Cost (Average treasury bill rate +2% Risk Premium) 11.75% 12.42% Economic Cost 244,273 203,383 Economic Value Addition 73,693 119,551
Economic Value Added (EVA)
Responsibility towards Economic Value Addition is the core of the business strategy that adds value to our stake holders comprising equity holders, customers, employees and finally the entire community.
-
50,000
100,000
150,000
200,000
250,000
2013/14 2014/15 2015/16 2016/17 2017/18
Rs. M
n
Economic Value Addition
Economic Value Addition
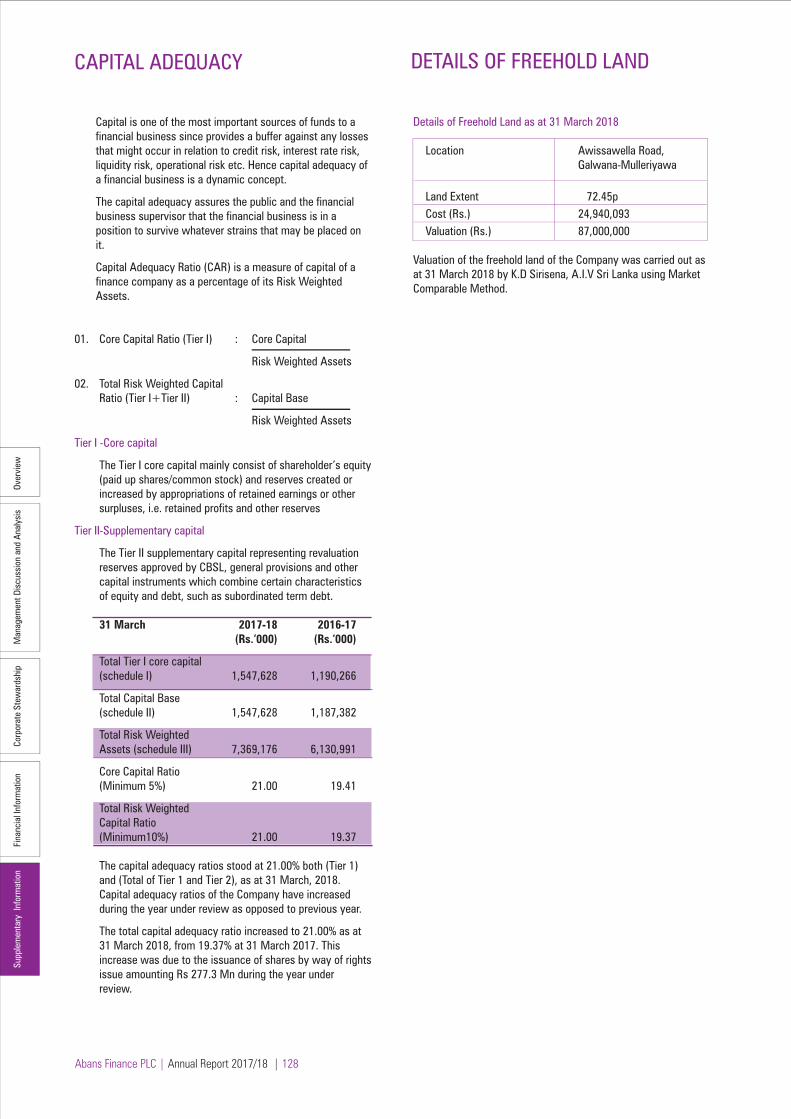
Abans Finance PLC | Annual Report 2017/18 | 128
Over
view
Man
agem
ent D
iscu
ssio
n an
d An
alys
isCo
rpor
ate
Stew
ards
hip
Fina
ncia
l Inf
orm
atio
nSu
pple
men
tary
Inf
orm
atio
n
CAPITAL ADEQUACY DETAILS OF FREEHOLD LAND
Capital is one of the most important sources of funds to a financial business since provides a buffer against any losses that might occur in relation to credit risk, interest rate risk, liquidity risk, operational risk etc. Hence capital adequacy of a financial business is a dynamic concept.
The capital adequacy assures the public and the financial business supervisor that the financial business is in a position to survive whatever strains that may be placed on it.
Capital Adequacy Ratio (CAR) is a measure of capital of a finance company as a percentage of its Risk Weighted Assets.
01. Core Capital Ratio (Tier I) : Core Capital
Risk Weighted Assets
02. Total Risk Weighted Capital Ratio (Tier I+Tier II) : Capital Base Risk Weighted Assets
Tier I -Core capital
The Tier I core capital mainly consist of shareholder’s equity (paid up shares/common stock) and reserves created or increased by appropriations of retained earnings or other surpluses, i.e. retained profits and other reserves
Tier II-Supplementary capital
The Tier II supplementary capital representing revaluation reserves approved by CBSL, general provisions and other capital instruments which combine certain characteristics of equity and debt, such as subordinated term debt.
31 March 2017-18 2016-17 (Rs.‘000) (Rs.‘000) Total Tier I core capital (schedule I) 1,547,628 1,190,266
Total Capital Base (schedule II) 1,547,628 1,187,382
Total Risk Weighted Assets (schedule III) 7,369,176 6,130,991
Core Capital Ratio (Minimum 5%) 21.00 19.41
Total Risk Weighted Capital Ratio (Minimum10%) 21.00 19.37
The capital adequacy ratios stood at 21.00% both (Tier 1) and (Total of Tier 1 and Tier 2), as at 31 March, 2018. Capital adequacy ratios of the Company have increased during the year under review as opposed to previous year.
The total capital adequacy ratio increased to 21.00% as at 31 March 2018, from 19.37% at 31 March 2017. This increase was due to the issuance of shares by way of rights issue amounting Rs 277.3 Mn during the year under review.
Details of Freehold Land as at 31 March 2018
Location Awissawella Road, Galwana-Mulleriyawa
Land Extent 72.45p Cost (Rs.) 24,940,093 Valuation (Rs.) 87,000,000
Valuation of the freehold land of the Company was carried out as at 31 March 2018 by K.D Sirisena, A.I.V Sri Lanka using Market Comparable Method.
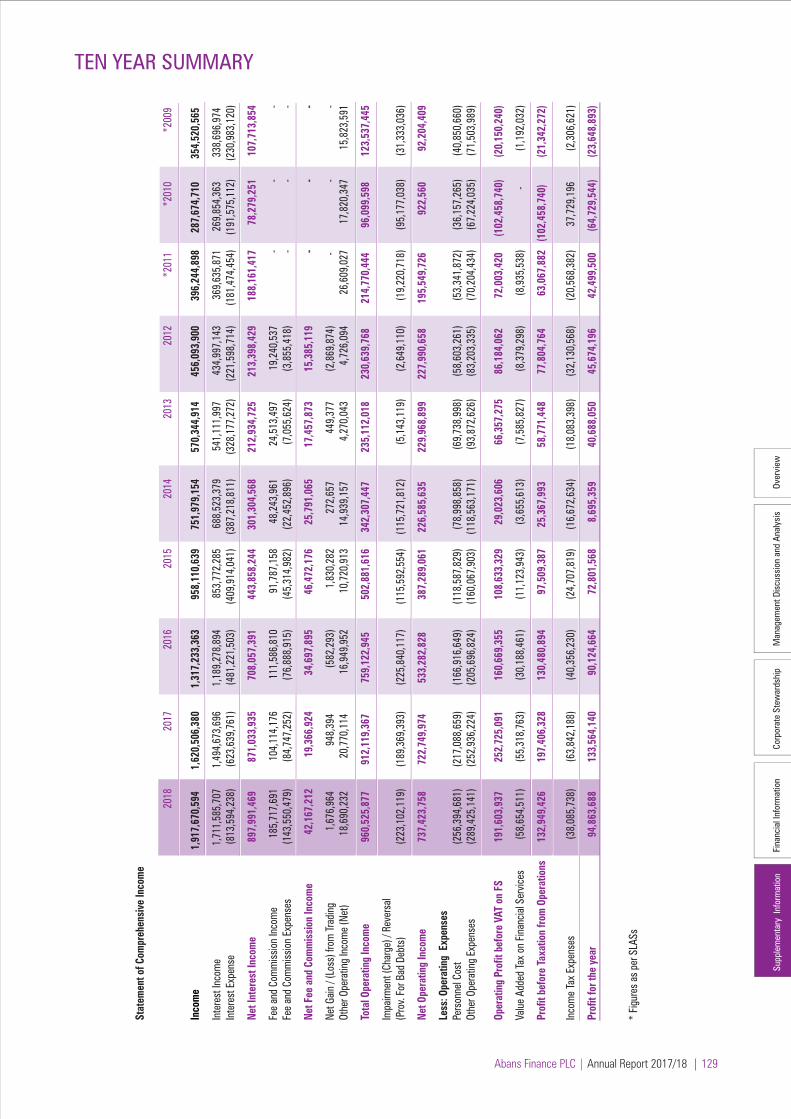
Over
view
Man
agem
ent D
iscu
ssio
n an
d An
alys
isCo
rpor
ate
Stew
ards
hip
Fina
ncia
l Inf
orm
atio
nSu
pple
men
tary
Inf
orm
atio
n
Abans Finance PLC | Annual Report 2017/18 | 129
TEN YEAR SUMMARY
Stat
emen
t of C
ompr
ehen
sive
Inco
me
2018
20
17
2016
20
15
2014
20
13
2012
*2
011
*2
010
*
2009
Inco
me
1,9
17,6
70,5
94
1,6
20,5
06,3
80
1,31
7,23
3,36
3 95
8,11
0,63
9 75
1,97
9,15
4 57
0,34
4,91
4
456,
093,
900
396
,244
,898
28
7,67
4,71
0
354,
520,
565
Inte
rest
Inco
me
1,7
11,5
85,7
07
1,49
4,67
3,69
6 1
,189
,278
,894
85
3,77
2,28
5 6
88,5
23,3
79
541
,111
,997
4
34,9
97,1
43
369,
635,
871
269
,854
,363
3
38,6
96,9
74
Inte
rest
Exp
ense
(8
13,5
94,2
38)
(623
,639
,761
) (4
81,2
21,5
03)
(409
,914
,041
) (3
87,2
18,8
11)
(328
,177
,272
) (2
21,5
98,7
14)
(181
,474
,454
) (1
91,5
75,1
12)
(230
,983
,120
)
Net I
nter
est I
ncom
e 89
7,99
1,46
9
871,
033,
935
708
,057
,391
44
3,85
8,24
4 30
1,30
4,56
8 21
2,93
4,72
5
213,
398,
429
188,
161,
417
78,2
79,2
51
10
7,71
3,85
4
Fee
and
Com
miss
ion
Inco
me
185
,717
,691
10
4,11
4,17
6 1
11,5
86,8
10
91,7
87,1
58
48,
243,
961
24,5
13,4
97
19,2
40,5
37
- -
- Fe
e an
d Co
mm
issio
n Ex
pens
es
(143
,550
,479
) (8
4,74
7,25
2)
(76,
888,
915)
(4
5,31
4,98
2)
(22,
452,
896)
(7
,055
,624
) (3
,855
,418
) -
- -
Net F
ee a
nd C
omm
issi
on In
com
e 42
,167
,212
19
,366
,924
34
,697
,895
46
,472
,176
25
,791
,065
1
7,45
7,87
3
15,3
85,1
19
- -
-
Net G
ain /
(Los
s) fr
om Tr
adin
g 1,
676,
964
94
8,39
4
(582
,293
) 1,
830,
282
272,
657
44
9,37
7
(2,8
69,8
74)
-
- -
Othe
r Ope
ratin
g In
com
e (N
et)
18,6
90,2
32
20,7
70,1
14
16,9
49,9
52
10,7
20,9
13
14,9
39,1
57
4,27
0,04
3
4,72
6,09
4 2
6,60
9,02
7 17
,820
,347
15
,823
,591
Tota
l Ope
ratin
g In
com
e 96
0,52
5,87
7
912,
119,
367
75
9,12
2,94
5
502,
881,
616
342,
307,
447
23
5,11
2,01
8
230,
639,
768
21
4,77
0,44
4
96,0
99,5
98
123
,537
,445
Impa
irmen
t (Ch
arge
) / R
ever
sal
(Pro
v. Fo
r Bad
Deb
ts)
(223
,102
,119
) (1
89,3
69,3
93)
(225
,840
,117
) (1
15,5
92,5
54)
(115
,721
,812
) (5
,143
,119
) (2
,649
,110
) (
19,2
20,7
18)
(95,
177,
038)
(3
1,33
3,03
6)
Net O
pera
ting
Inco
me
737,
423,
758
72
2,74
9,97
4
533,
282,
828
38
7,28
9,06
1 22
6,58
5,63
5
229,
968,
899
2
27,9
90,6
58
195
,549
,726
9
22,5
60
92,
204,
409
Le
ss: O
pera
ting
Exp
ense
s
Pe
rson
nel C
ost
(256
,394
,681
) (2
17,0
88,6
59)
(166
,916
,649
) (1
18,5
87,8
29)
(78,
998,
858)
(6
9,73
8,99
8)
(58,
603,
261)
(5
3,34
1,87
2)
(36,
157,
265)
(4
0,85
0,66
0)
Othe
r Ope
ratin
g Ex
pens
es
(289
,425
,141
) (2
52,9
36,2
24)
(205
,696
,824
) (1
60,0
67,9
03)
(118
,563
,171
) (9
3,87
2,62
6)
(83,
203,
335)
(7
0,20
4,43
4)
(67,
224,
035)
(7
1,50
3,98
9)
Op
erat
ing
Prof
it be
fore
VAT
on
FS
191
,603
,937
25
2,72
5,09
1 16
0,66
9,35
5 10
8,63
3,32
9 29
,023
,606
66
,357
,275
86
,184
,062
7
2,00
3,42
0
(102
,458
,740
) (2
0,15
0,24
0)
Value
Add
ed Ta
x on
Fin
ancia
l Ser
vices
(5
8,65
4,51
1)
(55,
318,
763)
(3
0,18
8,46
1)
(11,
123,
943)
(3
,655
,613
) (7
,585
,827
) (8
,379
,298
) (8
,935
,538
) -
(1
,192
,032
)
Prof
it be
fore
Tax
atio
n fro
m O
pera
tions
13
2,94
9,42
6
197,
406,
328
130,
480,
894
97,5
09,3
87
25,3
67,9
93
58,7
71,4
48
77,8
04,7
64
63,
067,
882
(102
,458
,740
)
(21,
342,
272)
Inco
me
Tax
Expe
nses
(3
8,08
5,73
8)
(63,
842,
188)
(4
0,35
6,23
0)
(24,
707,
819)
(1
6,67
2,63
4)
(18,
083,
398)
(3
2,13
0,56
8)
(20,
568,
382)
37
,729
,196
(2
,306
,621
)
Prof
it fo
r the
yea
r 94
,863
,688
13
3,56
4,14
0 90
,124
,664
72
,801
,568
8
,695
,359
40
,688
,050
45
,674
,196
42
,499
,500
(6
4,72
9,54
4)
(23,
648,
893)
* Fig
ures
as
per S
LASs
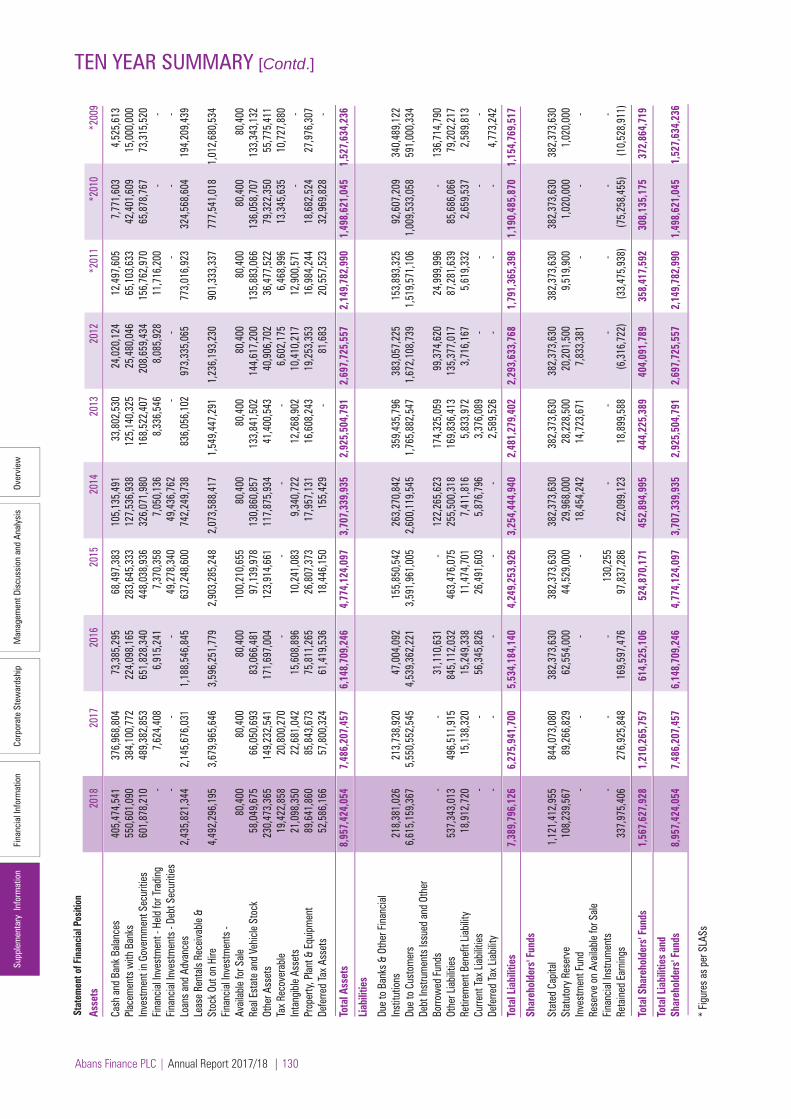
Over
view
Man
agem
ent D
iscu
ssio
n an
d An
alys
isCo
rpor
ate
Stew
ards
hip
Fina
ncia
l Inf
orm
atio
nSu
pple
men
tary
Inf
orm
atio
n
Abans Finance PLC | Annual Report 2017/18 | 130
TEN YEAR SUMMARY [Contd.] As
sets
20
18
2017
20
16
2015
20
14
2013
20
12
*201
1 *2
010
*200
9
Ca
sh a
nd B
ank B
alanc
es
405
,474
,541
3
76,9
68,8
04
73,
385,
295
6
8,49
7,38
3
105
,135
,491
3
3,80
2,53
0 2
4,02
0,12
4 1
2,49
7,60
5
7,7
71,6
03
4,5
25,6
13
Plac
emen
ts w
ith B
anks
5
50,6
01,0
90
384
,100
,772
2
24,0
98,1
65
283
,645
,333
1
27,5
36,9
38
125
,140
,325
2
5,48
0,04
6 6
5,10
3,63
3
42,
401,
609
1
5,00
0,00
0 In
vest
men
t in
Gove
rnm
ent S
ecur
ities
6
01,8
78,2
10
489
,382
,853
6
51,8
28,3
40
448
,038
,936
3
26,0
71,9
80
168
,522
,407
2
08,6
59,4
34
156
,762
,970
6
5,87
8,76
7
73,
315,
520
Finan
cial In
vest
men
t - H
eld fo
r Tra
ding
-
7,6
24,4
08
6,9
15,2
41
7,3
70,3
58
7,0
50,1
36
8,3
36,5
46
8,0
85,9
28
11,
716,
200
-
-
Fin
ancia
l Inve
stm
ents
- De
bt S
ecur
ities
-
-
-
49,
278,
340
4
9,43
6,76
2
-
-
-
-
-
Loan
s an
d Ad
vanc
es
2,4
35,8
21,3
44
2,1
45,6
76,0
31
1,1
88,5
46,8
45
637
,248
,600
7
42,2
49,7
38
836
,056
,102
9
73,3
35,0
65
773
,016
,923
3
24,5
68,6
04
194
,209
,439
Le
ase
Rent
als R
eceiv
able
& St
ock O
ut o
n Hi
re
4,4
92,2
96,1
95
3,6
79,9
65,6
46
3,5
96,2
51,7
79
2,9
03,2
85,2
48
2,0
73,5
88,4
17
1,5
49,4
47,2
91
1,2
36,1
93,2
30
901
,333
,337
7
77,5
41,0
18
1,0
12,6
80,5
34
Finan
cial In
vest
men
ts -
Avail
able
for S
ale
80,
400
80,
400
8
0,40
0
100
,210
,655
8
0,40
0
80,
400
8
0,40
0
80,
400
8
0,40
0
80,
400
Real
Esta
te a
nd V
ehicl
e St
ock
58,
049,
675
66,
050,
693
8
3,06
6,48
1
97,
139,
978
1
30,8
60,8
57
133
,841
,502
1
44,6
17,2
00
135
,883
,066
1
36,0
58,7
07
133
,343
,132
Ot
her A
sset
s 2
30,4
73,3
65
149
,232
,541
1
71,6
97,0
04
123
,914
,661
1
17,8
75,9
34
41,
400,
543
4
0,90
6,70
2
36,
477,
522
7
9,32
2,35
0
55,
775,
411
Tax
Reco
vera
ble
19,
422,
858
20,
800,
270
-
-
-
-
6
,602
,175
6
,468
,996
1
3,34
5,63
5
10,
727,
880
Inta
ngib
le As
sets
2
1,09
8,35
0 2
2,68
1,04
2
15,
608,
896
1
0,24
1,08
3
9,3
40,7
22
12,
268,
902
1
0,41
0,21
7
12,
900,
571
-
-
Pr
oper
ty, P
lant &
Equ
ipm
ent
89,
641,
860
85,
843,
673
7
5,81
1,26
5
26,
807,
373
1
7,95
7,13
1
16,
608,
243
1
9,25
3,35
3
16,
984,
244
1
8,68
2,52
4
27,
976,
307
Defe
rred
Tax
Asse
ts
52,
586,
166
57,
800,
324
6
1,41
9,53
6
18,
446,
150
1
55,4
29
-
81,
683
2
0,55
7,52
3
32,
969,
828
-
Tota
l Ass
ets
8,9
57,4
24,0
54
7,4
86,2
07,4
57
6,1
48,7
09,2
46
4,7
74,1
24,0
97
3,7
07,3
39,9
35
2,9
25,5
04,7
91
2,6
97,7
25,5
57
2,1
49,7
82,9
90
1,4
98,6
21,0
45
1,5
27,6
34,2
36
Liab
ilitie
s
Du
e to
Ban
ks &
Oth
er F
inan
cial
Inst
itutio
ns
218
,381
,026
2
13,7
38,9
20
47,
004,
092
1
55,8
50,5
42
263
,270
,842
3
59,4
35,7
96
383
,057
,225
1
53,8
93,3
25
92,
607,
209
3
40,4
89,1
22
Due
to C
usto
mer
s 6
,615
,159
,367
5
,550
,552
,545
4
,539
,362
,221
3
,591
,961
,005
2
,600
,119
,545
1
,765
,882
,547
1
,672
,108
,739
1
,519
,571
,106
1
,009
,533
,058
5
91,0
00,3
34
Debt
Inst
rum
ents
Issu
ed a
nd O
ther
Bo
rrow
ed F
unds
-
-
31,
110,
631
-
1
22,2
65,6
23
174
,325
,059
9
9,37
4,62
0
24,
999,
996
-
1
36,7
14,7
90
Othe
r Liab
ilities
5
37,3
43,0
13
496
,511
,915
8
45,1
12,0
32
463
,476
,075
2
55,5
00,3
18
169
,836
,413
1
35,3
77,0
17
87,
281,
639
8
5,68
6,06
6
79,
202,
217
Retir
emen
t Ben
efit
Liabi
lity
18,
912,
720
15,
138,
320
1
5,24
9,33
8
11,
474,
701
7
,411
,816
5
,833
,972
3
,716
,167
5
,619
,332
2
,659
,537
2
,589
,813
Cu
rrent
Tax
Liabi
lities
-
-
56,
345,
826
2
6,49
1,60
3
5,8
76,7
96
3,3
76,0
89
-
-
-
-
Defe
rred
Tax
Liabi
lity
- -
-
-
-
2
,589
,526
-
-
-
4
,773
,242
Tota
l Lia
bilit
ies
7,3
89,7
96,1
26
6,2
75,9
41,7
00
5,5
34,1
84,1
40
4,2
49,2
53,9
26
3,2
54,4
44,9
40
2,4
81,2
79,4
02
2,2
93,6
33,7
68
1,7
91,3
65,3
98
1,1
90,4
85,8
70
1,1
54,7
69,5
17
Shar
ehol
ders
' Fun
ds
St
ated
Cap
ital
1,1
21,4
12,9
55
844
,073
,080
3
82,3
73,6
30
382
,373
,630
3
82,3
73,6
30
382
,373
,630
3
82,3
73,6
30
382
,373
,630
3
82,3
73,6
30
382
,373
,630
St
atut
ory
Rese
rve
108
,239
,567
8
9,26
6,82
9
62,
554,
000
4
4,52
9,00
0
29,
968,
000
2
8,22
8,50
0
20,
201,
500
9
,519
,900
1
,020
,000
1
,020
,000
In
vest
men
t Fun
d -
-
-
-
18,
454,
242
1
4,72
3,67
1
7,8
33,3
81
-
-
-
Rese
rve
on A
vaila
ble fo
r Sale
Finan
cial In
stru
men
ts
- -
-
1
30,2
55
-
-
-
-
-
-
Reta
ined
Ear
ning
s 3
37,9
75,4
06
276
,925
,848
1
69,5
97,4
76
97,
837,
286
2
2,09
9,12
3
18,
899,
588
(6
,316
,722
) (3
3,47
5,93
8)
(75,
258,
455)
(1
0,52
8,91
1)
Tota
l Sha
reho
lder
s' Fu
nds
1,5
67,6
27,9
28
1,2
10,2
65,7
57
614
,525
,106
5
24,8
70,1
71
452
,894
,995
4
44,2
25,3
89
404
,091
,789
3
58,4
17,5
92
308
,135
,175
3
72,8
64,7
19
Tota
l Lia
bilit
ies
and
Shar
ehol
ders
' Fun
ds
8,9
57,4
24,0
54
7,4
86,2
07,4
57
6,1
48,7
09,2
46
4,7
74,1
24,0
97
3,7
07,3
39,9
35
2,9
25,5
04,7
91
2,6
97,7
25,5
57
2,1
49,7
82,9
90
1,4
98,6
21,0
45
1,5
27,6
34,2
36
* Fig
ures
as
per S
LASs
Stat
emen
t of F
inan
cial
Pos
ition

Over
view
Man
agem
ent D
iscu
ssio
n an
d An
alys
isCo
rpor
ate
Stew
ards
hip
Fina
ncia
l Inf
orm
atio
nSu
pple
men
tary
Inf
orm
atio
n
Abans Finance PLC | Annual Report 2017/18 | 131
BRANCH NETWORK
Bar
nch
Cate
gory
Ad
dres
s Te
lepho
ne N
umbe
r Fa
x Nu
mber
E-
mail A
ddre
ss
Name
of th
e Bra
nch M
anag
er/
Bran
ch C
ode
Offic
er in
Cha
rge
1
Colom
bo
Head
Offic
e/ Br
anch
No
456,
R.A.
De M
el M
awath
a, Co
lombo
03.
011-
2208
888
011-
2375
517
inquir
ies@
aban
sfina
nce.l
k M
r. Anu
ra Fe
rnan
do (C
OO)
HO
2 Ku
rune
gala
Bran
ch
No. 1
93/A
, Colo
mbo R
oad,
Kuru
nega
la.
037-
3877
888/
037-
3616
655/
01
1307
5252
/037
3976
161
037-
2222
611
kuru
nega
la@ab
ansfi
nanc
e.lk
Mr. S
alind
a Hera
th KG
3
Damb
ulla
Bran
ch
Sujat
ha B
uildin
g, Ku
rune
gala
Junc
tion,
Damb
ulla
066-
2285
004/
066-
2285
006
066-
2285
000
damb
ulla@
aban
sfina
nce.l
k M
r. M J
Jaya
thilak
e DB
4
Badu
lla
Bran
ch
No. 5
, Low
er Kin
g Stre
et, B
adull
a 05
5-35
5773
0/05
5-22
2818
0/05
5-30
5375
7 05
5-22
2210
1 ba
dulla
@ab
ansfi
nanc
e.lk
Mr. H
arend
ra Ku
mara
BD
5
Anur
adha
pura
Bran
ch
No 34
8/A,
348/
B, M
aithr
ipala
Sena
naya
ka M
w,
025-
2220
679/
025-
2220
680 /
An
urad
hapu
ra 02
5-22
2068
1/02
5-22
2068
3 02
5-22
3455
7 an
urad
hapu
ra@ab
ansfi
nanc
e.lk
Mr. S
unil K
ahaw
atta
AP
6
Galle
Br
anch
No
. 02,
Malw
atta R
oad,
Kaluw
ella,
Galle
09
1-39
0772
0/09
1-22
3588
8/
091-
5621
948/
091-
5621
748
091-
2227
122
galle
@ab
ansfi
nanc
e.lk
Mr. R
anjith
Kalya
nand
a GL
7
Gamp
aha
Bran
ch
No. 1
18, C
olomb
o Roa
d, G
ampa
ha
033-
3438
602/
033-
3555
450
033-
2234
970
gamp
aha@
aban
sfina
nce.l
k M
r. Anu
shan
ga M
udan
naya
ke
GM
8
Jaffn
a Br
anch
No
221,
Powe
r Hou
se R
oad,
Jaffn
a 02
1-32
0768
6 02
1-22
1702
2 jaf
fna@
aban
sfina
nce.l
k M
r. Thu
shya
nthan
CH
9
Rathn
apur
a Br
anch
No
176,
Main
Stre
et, R
athna
pura
045-
2221
226
045-
2226
873
ratna
pura@
aban
sfina
nce.l
k M
r. Suje
ewa K
umara
RT
10
Ka
ndy
Bran
ch
No. 2
6, Hi
ll Stre
et, Ka
ndy
081-
3827
710/
081-
3842
720/
08
1-22
2074
4/08
1220
4488
/081
2220
745
081-
2205
675
kand
y@ab
ansfi
nanc
e.lk
Mr. S
aman
tha G
unaw
ardan
e KD
11
Ka
duru
wela
Custo
mer C
entre
No
.16, O
ppos
ite Po
lice S
tation
, Kad
uruw
ela
066-
3062
444/
027-
3900
995
027-
2223
323
kadu
ruwe
la@ab
ansfi
nanc
e.lk
Mr. N
uwan
wan
asing
he
KW
12
Em
bilipi
tiya
Custo
mer C
entre
No
.125/
A, D
hank
otuwa
Uluh
ala
047-
3220
400/
047-
3220
401
047-
2262
261
embil
ipitiy
a@ab
ansfi
nanc
e.lk
Mr. R
U P
Rupa
singh
e EB
New
Town
Roa
d, Em
bilipi
tiya
13
Am
para
Custo
mer C
entre
No
. 19,
D.S.
Sen
anay
aka V
eediy
a, Am
para
063-
2224
747
063-
2223
141
ampa
ra@ab
ansfi
nanc
e.lk
Mr. H
D P
Kuma
ra AM
14
Ba
ttica
loa
Custo
mer C
entre
No
.395,
Trinc
o Roa
d, Ba
ttica
loa
065-
3063
336
065-
2229
799
batti
caloa
@ab
ansfi
nanc
e.lk
Mr. R
Ras
aling
am
BT
15
Putta
lam
Custo
mer C
entre
No
. 138
, Kur
uneg
ala R
oad,
Putta
lam
032-
3295
105
032-
2267
667
puttl
am@
aban
sfina
nce.l
k M
r. Sara
th W
ickram
asing
he
PT
16
M
atara
Custo
mer C
entre
No
.402/
A, G
alle R
oad,
Pabu
rana,M
atara
041-
2228
570 /
041-
2228
571
041-
2238
440
matar
a@ab
ansfi
nanc
e.lk
Mr. J
G C
hintha
ka
MT
17
Th
issam
ahara
ma
Custo
mer C
entre
No
.18, P
ahala
Veed
iya Ti
ssam
ahara
ma
047-
3220
240/
047-
3220
241
047-
2237
937
thiss
amah
arama
@ab
ansfi
nanc
e.lk
Mr. D
T M
De S
ilva
TS
18
Tri
ncom
alee
Custo
mer C
entre
No
.36/C
,Sum
ethag
ama,
Stag
e ii,
026-
3207
334/
026-
3207
333
026-
2054
849
trinc
o@ab
ansfi
nanc
e.lk
Mr. R
Jero
me
TR
Ka
ndy R
oad,
Trinc
omale
e
19
Vavu
niya
Custo
mer C
entre
No
.24,S
econ
d Cro
ss S
treet,
Vaun
iya
024-
2228
222/
024-
3200
222
024-
2228
222
vavu
niya@
aban
sfina
nce.l
k M
r. T S
rines
a VY
20
Ka
dawa
tha
KIOSK
No
. 172
/12/
E, Ka
ndy R
oad,
Kada
watha
01
1-29
2681
1 01
1-29
2681
1 ka
dawa
tha@
aban
sfina
nce.l
k M
r. Uran
tha Pe
rera
KS
21
Ja
-ela
KIOSK
No
17. N
egam
bo R
oad,
Ja- e
la 01
1-31
4433
8 01
1-22
4022
8 jae
la@ab
ansfi
nanc
e.lk
Mr. U
rantha
Perer
a KS
22
M
oratu
wa
KIOSK
No
. 486
, Raw
athaw
attha
, Mor
atuwa
. 01
1-30
5220
0 01
1-26
4917
7 mo
ratuw
a@ab
ansfi
nanc
e.lk
Mr. U
rantha
Perer
a KS
23
Pil
iyand
ala
KIOSK
No
. 28,
Saran
apala
Mw,
Piliy
anda
la.
011-
3034
200
011-
2609
310
piliya
ndala
@ab
ansfi
nanc
e.lk
Mr. U
rantha
Pere
ra KS

Over
view
Man
agem
ent D
iscu
ssio
n an
d An
alys
isCo
rpor
ate
Stew
ards
hip
Fina
ncia
l Inf
orm
atio
nSu
pple
men
tary
Inf
orm
atio
n
Abans Finance PLC | Annual Report 2017/18 | 132
BRANCH NETWORK [Contd.]
Head Office / BranchColombo
BranchKurunegalaDambullaBadullaAnuradhapuraGalleGampahaJaffnaRathnapuraKandy
Customer CentreKaduruwelaEmbilipitiyaAmparaBatticaloaPuttalamMataraThissamaharamaTrincomaleeVavuniya
KIOSKKadawathaJa-elaMoratuwaPiliyandala
Ove
Ovever
irv
irv
ivirvi
rvewewewewee
Ma
Man
Man
MMMag
eeag
egegm
enm
enm
enm
enm
et DDt Dt Dtt
scciscscscsus
susuuu
ion
anAAAA
d A
dAn
alnal
nii
ysiiss
Corrr
Coropo
rpo
rpo
rpo
roat
eat
eat
eteStStS
ewa
ewa
war
dsrds
iphip
hip
hip
hip
hip
Fin
can
can
cialial
ial
ial
ialI
nInInIfo
rat
mat
mat
ma
ion
ion
iSu
puppl
epl
emen
men
tar
tary
y In
fIn
fnfor
mor
mrmat
iat
itononon
AAbAAbbans Fiinan nccnceee PLC CC | AnAnnun alll RRRRRepepoort t 20201717/1/18 | 11323222
BBBBRRRAAAANNNCCCCHHH NNNEEEETTTWWWWWOORRRRKKKK [[[CoCoContn ddd.].].]
Head Office / BrrranchCoCoololombbboo
BranchKuKurruneu galgaga aDaDaamambulbu laaaBaBaadullaaAnAnnun radhaphh uraaGaalG leGaampahhhaaaJaffnaRaathnapurpuu aKaKandy
Customer CentreeKKaduruwelwew aEmmbE ilipitiiyaAmAmparaBaatBa ticaloooaPuPuutu talamMaMaataraThThissamahmamaa arammaaTrTrincomalma eeeVaVaavuniyaa
KIOSKKadK awathhahthJa-elaMoorM atuwawwwaPilPiliyai nddalal

Over
view
Man
agem
ent D
iscu
ssio
n an
d An
alys
isCo
rpor
ate
Stew
ards
hip
Fina
ncia
l Inf
orm
atio
nSu
pple
men
tary
Inf
orm
atio
n
Abans Finance PLC | Annual Report 2017/18 | 133
GLOSSARY OF TERMS
A
Accounting Policies
The specific principles, bases, conventions, rules and practices adopted by an entity in preparing and Presenting Financial Statements.
Accrual Basis
Recognition of the effects of transactions and other events when they occur without waiting for receipt or payment of cash or its equivalents.
Amortization
The systematic allocation of the depreciable amount of an intangible asset over its useful life.
Available for Sale (AFS)
AFS are those non-derivative financial assets that are designed as available for sale or are not classified as loans and receivable, held –to-maturity investment or financial assets at fair value through profit or loss.
C
Capital Adequacy
The percentage of risk-adjusted assets supported by capital as defined under the framework of risk based capital standards developed by the Bank for International Settlement (BIS) and as modified to suit local requirements by the Central Bank of Sri Lanka.
Capital Reserves
Capital Reserves consist of revaluation reserves arising from revaluation of properties owned by the Company and Reserve Fund set aside for specific purposes defined under the Business Finance Act No.42 of 2011 which is not available for distribution.
Cash Equivalents
Short-term highly liquid investments those are readily convertible to known amounts of cash and which subject to an insignificant risk of changes in value.
Collective Impairment
Impairment is measured on a collective basis for homogeneous groups of lending facilities that are not considered as individually significant. Contingencies
A condition or situation existing at the balance sheet date where the outcome will be confirmed only by the occurrence or non-occurrence of one or more future events.
Commitments
Credit facilities approved but not yet utilized by the clients as at the Balance Sheet Date.
Corporate Governance
The Process by which corporate entities are governed. It is concerned with the way in which power is exercised over the management and direction of entity, the supervision of executive actions and accountability to owners and others.
Credit Risk
Credit risk or default risk is most simply defined as the potential that a borrower or counterparty will fail to meet its obligations in accordance with agreed terms and conditions.
D
Dealing Securities
These are marketable securities acquired and held with the intention to resale over a short period of time.
Deferred Tax
Sum set aside in the financial statements for taxation that may become payable in a financial year other than the current financial year.
Depreciation
The systematic allocation of the depreciable amount of an asset over its useful life.
Derecognition
Removal of a previously recognized financial assets or financial liability from an entity’s statement of financial position.
E
Earnings per Share (EPS)
Profit attributable to ordinary shareholders, divided by the number of ordinary shares in issue.
Effective Interest Rate (EIR)
Rate that exactly discounts estimated future cash payments or receipts through the expected life of the financial asset or liability. Effective Tax Rate
Provision for taxation expressed as a percentage of Profit Before Tax.
Events after Reporting Date
Transactions that are not recognized as assets or liabilities in the statement of financial position, but which give rise to the contingencies and commitments.
F
Fair Value
Fair value is the amount for which an asset could be exchanged or a liability settled, between knowledgeable, willing parties in an arm’s length transaction.
Finance Lease
A contract where by a lessor conveys to the lessee the right to use asset for rent over an agreed period of time which is sufficient to amortize the capital outlay of the lessor. The lessor retains ownership of asset but transfers substantially all the risks and rewards of ownership to the lessee.
Financial Assets
Any asset that is cash, equity instrument of another entity, a contractual right to receive cash or contractual right to receive another financial asset from another entity.
Financial Instruments
Any contract that gives rise to a financial assets of one entity and financial liability or equity instrument of another entity.

Over
view
Man
agem
ent D
iscu
ssio
n an
d An
alys
isCo
rpor
ate
Stew
ards
hip
Fina
ncia
l Inf
orm
atio
nSu
pple
men
tary
Inf
orm
atio
n
Abans Finance PLC | Annual Report 2017/18 | 134
GLOSSARY OF TERMS [Contd.]
Financial Liabilities
A contractual obligation to deliver cash or other financial asset to another entity or to exchange financial assets or financial liabilities with another entity under conditions that are potentially unfavourable to the entity.
H
Held for Trading
Debt and equity investments that are purchased with the intent of selling them within a short period of time.
Held To Maturity Investment
A non derivative financial asset with fixed or determinable payments and fixed maturity that an entity has the positive intention and ability to hold to maturity.
Hire purchase
A contract between hirer and financier where the hirer takes on hire a particular article from the financier, with the option to purchase the article at the conclusion of the agreed rental payments.
I
Impairment
This occurs when recoverable amount of an asset is less than the carrying amount.
Individual Impairment
Impairment is measured on an individual basis for non-homoge-neous groups of lending facilities that are considered as individually significant.
Intangible Asset
An identifiable non-monetary asset without physical substance held for use in production/supply of goods/services or for rental to others or for administrative purposes.
Interest Bearing Liabilities
Liabilities on which the Company is paying interest.
Interest Margin
Net interest income as a percentage of average interest earning assets.
Interest Rate Risk
The risk that the fair value or future cash flows of a financial instruments will fluctuate because of changes in market interest rates.
Investment Securities
Securities acquired and held for yield or capital growth purposes and are usually held to maturity.
Interest Spread
This represents the difference between the average interest rate earned and the average interest rate paid on funds.
Interest in Suspense
Interest suspended on Non-Performing Loans, Lease, hire purchase and advances (as per previous accounting standards)
K
Key Management Personnel
Key Management Personnel are those persons having authority and responsibility for planning, directing and controlling the activities of the entity, directly or indirectly, including any Director (whether Executive or otherwise) of that entity.
L
Liquid Assets
Assets that are held in cash or in a form that can be converted to cash readily, such as deposits with other banks and bills of exchange and Treasury Bills.
Liquidity Risk
The risk that an entity will encounter difficulty in meeting obligations associated with financial liabilities.
M
Market Capitalization
Number of ordinary shares in issues multiplied by the market value of a share as at the year end. Materiality
The relative significance of a transaction or an event, the omission or misstatement of which could influence the economic decisions of users of Financial Statements. Market Risk
This refers to the possibility of loss arising from changes in the value of a financial instrument as a result of changes in market variables such as interest rates, exchange rates, equity prices and commodity prices.
N
Net-Interest Income (NII)
The difference between what a Company earn on assets such as loans and securities and what it pays on liabilities such as deposits refinance funds and other borrowings.
Non-Performing Loans (NPL)
All loans classified as Non-Performing when a payment of capital and/or interest is in arrears for 6 months or more.
NPL Ratio (Gross)
Total Non-Performing Advances as a percentage of total advances portfolio (Net of interest in suspense).
NPL Ratio (Net)
Total Non-Performing Advances as a percentage of total advances portfolio (Net of interest in suspense and Loan loss provision).
O
Operational Risk
This refers to the risk of loss resulting from inadequate or failed internal processes, people and systems, or from external events.
P
Past Due
A financial asset is past due when a counterparty has failed to make a payment when contractually due.

Over
view
Man
agem
ent D
iscu
ssio
n an
d An
alys
isCo
rpor
ate
Stew
ards
hip
Fina
ncia
l Inf
orm
atio
nSu
pple
men
tary
Inf
orm
atio
n
Abans Finance PLC | Annual Report 2017/18 | 135
GLOSSARY OF TERMS [Contd.]
Price Earnings Ratio
A valuation ratio of a company’s current share price to it’s per share earnings. It can be calculated by dividing the market Value per share by Earnings per share.
Probability of Default (PD)
An internal estimate for each borrower grade of the likelihood that an obligor will default on an obligation.
Prudence
Inclusion of a degree of caution in the exercise of judgment needed in making the estimates required under conditions of uncertainty, such that assets or income are not overstated and liabilities or expenses are not understand.
R
Return on Average Assets (ROA)
Net income expressed as a percentage of average total assets, used along with ROE, as a measure of profitability and as a basis of intra-industry performance comparison.
Revenue Reserve
Reserves set aside for future distribution and investment.
Return on Equity (ROE)
Net income, less preferred share dividends if any, expressed as a percentage of average ordinary shareholders’ equity.
Related Parties
Parties where one party has ability to control the other party or exercise significant influence over the other party in making financial and operating decisions, directly or indirectly.
Related Party Transactions
A transfer of resources, services, obligations between related parties, regardless of whether a price is charged or not.
Repurchase Agreement
Contract to sell and subsequently repurchase securities at a specific date and price. Risk Weighted Assets
On Balance Sheet Assets and the credit equivalent of off Balance Sheet Assets multiplied by the relevant risk weighting factors as specified by Central Bank of Sri Lanka.
Risk Adjusted Asset
Used the calculation of risk based capital ratio. The face amount of lower risk assets is discounted using risk weighted factor in order to reflect a comparable risk per-rupee among all type of asset.
S
Segmental Analysis
Analysis of financial information by segments of an enterprise specifically the different industries and the different geographical areas in which it operates.
Shareholders’ Funds
Total of issued and fully paid share capital and capital and revenue reserves.
Statutory Reserve Fund
A capital reserve created as per the provisions of theFinance Business Act No. 42 of 2011.
T
Tier 1 Capital
Core Capital representing permanent Shareholders’ equity and reserve created or increased by appropriation of retained earnings or other surpluses.
Tier 2 Capital
Tier 2 Capital or Supplementary Capital represents total value of Re-valuation reserves,General provisions and subordinated Debt.
Transaction Costs
They are incremental costs that are directly attributable to the acquisition, issue or disposal of a financial asset or financial liability. An incremental cost is one that would not have been incurred if the entity had not acquired, issued or disposed of the financial instrument.
V
Value Added
Value of wealth created by providing financial and other related services less the cost of providing such services.
Y
Yield
Rate of return on an investment in percentage terms, taking in to account annual income and any changes in capital value.

Over
view
Man
agem
ent D
iscu
ssio
n an
d An
alys
isCo
rpor
ate
Stew
ards
hip
Fina
ncia
l Inf
orm
atio
nSu
pple
men
tary
Inf
orm
atio
n
Abans Finance PLC | Annual Report 2017/18 | 136
NOTICE OF MEETING
NOTICE IS HEREBY GIVEN that the TWELFTH ANNUAL GENERAL MEETING of ABANS FINANCE PLC will be held on 21 September 2018 at 09.30 a.m. at the Organization of Professional Associations of Sri Lanka, No. 275/75, Prof. Stanley Wijesundara Mawatha, Colombo 07 for the following purposes:
1. To receive and adopt the Report of the Directors, the Audited Financial Statements of the Company for the year ended 31 March 2018 and the Report of the Auditors thereon.
2. To re-elect Mr. Rusi Pestonjee, a Director of the Company who retires by rotation in conformity with section A.8 of the Code of Best Practice on Corporate Governance 2013, as recommended by the Directors.
3. To re-appoint Messrs. Ernst & Young, Chartered Accountants as the Auditors of the Company for the ensuing year and to authorize the Directors to determine their remuneration.
4. To inform of the non-compliance with the Minimum Public Holding Requirement and the adopted/proposed remedial action.
BY ORDER OF THE BOARD
Sgd.Varners International (Private) LimitedCompany Secretaries of Abans Finance PLC,Level 14, West Tower,World Trade Center,Echelon Square,Colombo 01.
10 August 2018
Notes;
1. A member unable to attend the above meeting is entitled to appoint a proxy, who need not be a member, to attend and vote in his/her place and Form of Proxy is attached to this report for this purpose.
2. The completed Form of Proxy should be deposited at the office of the Secretaries at Level 14, West Tower, World Trade Center, Echelon Square, Colombo 1, not less than 48 hours before the time fixed for the meeting.
3. A Form of Attendance is included in this report. Shareholders are requested to complete it and hand it over when attending meeting.
4. For reasons of security, it is essential that you bring with you, your National Identity Card/ Passport.

CORPORATE INFORMATION
NAME OF THE COMPANY
Abans Finance PLC
LEGAL FORM
A Public Limited Liability Company Incorporated in Sri Lanka on 8 April 2005 under the Companies Act No. 17 of 1982. Re-regis-tered on 15 June 2009 in terms of the Companies Act No. 7 of 2007. A Finance Company licensed by the Monetary Board of the Central Bank of Sri Lanka in terms of The Finance Business Act No. 42 of 2011. A Registered Finance Leasing Establishment under the Finance Leasing Act No. 56 of 2000. An approved Credit Agency under the Mortgage Act No. 6 of 1949 and the Trust Receipts Ordinance No. 12 of 1947.
REGISTRATION NO. – PB 1015 PQ
STOCK EXCHANGE LISTING
The ordinary shares of the Company are listed on theColombo Stocks Exchange of Sri Lanka.
REGISTERED OFFICE
No. 498, Galle Road, Colombo 03
HEAD OFFICE
No. 456, R.A.De Mel Mawatha, Colombo 3. Tel. 011- 2208888E-mail : [email protected] M/s Ernst & YoungChartered Accountants,201, De Saram Place,P.O.Box 101, Colombo10
INTERNAL AUDITORS Chief Internal AuditorAbans Group of Companies498, Galle Road,Colombo 03
SECRETARIES & LAWYERS
Varners International (Pvt) Ltd.,Level 14, World Trade Centre Building,Colombo 01
BANKERS
Bank of Ceylon Seylan Bank People’s Bank Commercial Bank Pan Asia Bank CorporationUnion Bank Sampath BankHatton National Bank
VAT REGISTRATION NO.
134012439-7000
BOARD OF DIRECTORS
Mr. R. PestonjeeChairman
Mr. K. B. WanigasekaraManaging Director (Retired w.e.f. 27 September 2017)
Mr. R.A. NanayakkaraManaging Derector/ Chief Executive Officer(Appointed w.e.f. 27 September 2017)
Mr. V. K. ChoksySenior DirectorIndependent Non-Executive Director
Mr. Ajith S. RatnayakeIndependent Non-Executive Director
Mr. M. P. ParekhNon-Executive Director
Mr. C.H.A.W. Wickramasuriya (Alternate to Mr. M. P. Parekh)Non-Executive Director